separation of pegylated proteins by size exclusion...
TRANSCRIPT

Separation of Pegylated Proteins by Size Exclusion Chromatography
Melissa Bebb
Department of Chemical Engineering
Introduction
Recombinant proteins are attractive therapeutic agents under active development by the pharmaceutical industry. These proteins can be used to treat diabetes, hemophilia, and cancer. One significant disadvantage of using therapeutic proteins is their short-half life when introduced into the body. Other disadvantages include low solubility and rapid clearance from the body2. This results in a need for using repeated doses with relatively high dosage levels, which not only increases the cost of the therapy it also increases the likelihood of undesirable side effects.
Recent clinical studies have shown that pegylated proteins are a potentially attractive approach to overcoming many of these disadvantages. Pegylated proteins are formed from the chemical attachment of a polyethylene glycol (PEG) chain to the native protein, typically using the amino groups on the amino acid lysine. Once attached, this PEG chain greatly increases the effective size of the protein, protecting the product from adverse biological interactions that occur in the body, such as degradation and rapid clearance2. As a result, the drug is retained longer in the body, significantly reducing both the frequency and the size of the required dose. One of the challenges associated with the production of pegylated proteins is the purification of these molecules. When PEG is reacted with the native protein, not all of the protein becomes pegylated and the entire amount of PEG is not utilized. Proteins with multiple PEG chains are also formed. Thus, the product solution contains a mixture of various sized proteins, both pegylated and un-pegylated. In most applications, this mixture needs to be purified before the pegylated product can be used as a therapeutic agent. This can be an expensive step in the production of pegylated products, increasing the final cost of the product and reducing the potential cost-savings associated with the smaller dosage requirements.
The objective of this project is to examine the use of size exclusion chromatography (SEC) for the purification of pegylated proteins. Size exclusion is a type of chromatography in which the sample is separated primarily by size. A column is tightly packed with a porous material, typically a bed of small porous particles. When the sample is injected into the column, the smaller species can diffuse in and out of the pores while the larger ones can not; therefore, the larger species pass through the column much more rapidly than the smaller ones. In the case of pegylated proteins, the multiply-pegylated proteins will be eluted first, with the unreacted protein and PEG being more extensively retained within the column.

Methodology Chemicals and Reagents: mPEG succinimidyl propionate (mPEG-SPA) was purchased from Nektar Therapeutics (San Carlos, CA). α-lactalbumin, ovalbumin, and bovine serum albumin (BSA) were purchased from Sigma-Aldrich Company (St. Louis, MO). The AKTA Explorer 100, the chromatography columns, and the SEC resins were manufactured by GE Healthcare (Piscataway, NJ). Buffer Preparation: Phosphate buffer solutions of different ionic strength (total salt) were prepared according to the information in Table 1. The solutions were stirred on a magnetic stirrer at room temperature. The pH of the solutions was measured using a Thermo Orion 420A+ pH meter. 0.2 M NaOH and/or 0.2 M HCl was added to adjust the pH to 7.0 ± 0.01. The conductivity was also measured using a Thermo Orion 105A+ Basic Conductivity meter. The solutions were filtered using a 0.2 µm pore size filter to remove particulates, and they were then stored in a closed container at room temperature. Table 1. Composition of Different Phosphate Buffers
Phosphate Concentration
NaCl Concentration
Distilled Water
Sodium Phosphate Monobasic
Sodium Phosphate
Dibasic
Sodium Chloride
50 mM 0.15 M 3 L 8.36 g 23.89 g 26.30 g 62.3 mM 0.19 M 1 L 3.45 g 9.97 g 11.10 g 10 mM - 1L 0.68995 g 1.31354 g -
Protein Pegylation: Pegylation was performed with a 5:1 molar ratio of mPEG.SPA to α-lactalbumin. Various concentrations of PEG were completely dissolved in 10 mM PBS buffer (pH = 7.0). The α-lactalbumin was then added and the solution was gently stirred on a magnetic stirrer for approximately 18 hours at room temperature to attain nearly complete reaction of the mPEG and the protein. The solution was then diluted with approximately of 62.3 mM PBS buffer yielding a final solution of protein and PEG in 50 mM PBS buffer. Size Exclusion Chromatography: Size Exclusion Chromatography was performed using the AKTA Explorer 100, along with Unicorn Software (Version 5.01). A schematic diagram of the AKTA Explorer is shown in Figure 1.

Figure 1: AKTA Explorer 100 with labeled components
The AKTA Explorer 100 uses a UV detector to evaluate the concentration of various components in the outlet from the column. In this study, the sample absorbance was evaluated at a wavelength of 214 nm, which is the absorbance associated with the peptide bonds in all proteins. The data were analyzed using the Unicorn Software available on the AKTA Explorer. The column used in this study was a Superdex 200-10/30 which has a mean pore size of 34 µm. The column was prepared by first flushing with 2x column volumes of distilled water to remove ethanol and then again with 2x column volumes of running buffer to equilibrate the column. The key variables in the study were the effects of extra tubing, flow rate, sample injection volume, and the ionic strength of the running buffer.
Results:
Effect of By-passing Flow Directional Valve Figure 2 shows a typical size exclusion chromatograph of the output from the Superdex-200-10/300 column used for the separation of α-lactalbumin pegylated with a 5 kD polyethylene glycol. The chromatograph was obtained at a flow rate of 0.30 ml/min with absorbance readings taken at 214 nm. The red line represents the UV absorbance for a trial which utilized the flow directional valve built into the AKTA Explorer system, while the blue line represents the UV absorbance for a run that by-passed this valve. The first peak to exit the column at a retention volume of approximately 12.04 mL on the blue line and 12.56 on the red line mL corresponds to the most heavily pegylated component (most probably the 4-PEG molecule) since this large complex is almost fully excluded from the pore space in the resin. The subsequent peaks correspond to α−lactalbumin molecules with 3, 2, and 1 PEG groups followed by the unmodified α-lactalbumin. The final peak at retention volumes of 21.26 mL (red line) and 20.30 mL (blue line) corresponds to NHS, a side product of the pegylation reaction. The unreacted PEG is not visible in the SEC output because polyethylene glycol has no significant UV absorbance, which was the method of detection used for this experiment. The overall degree of separation between the different pegylated species in the chromatogram that utilized the flow directional valve was poor, although the unpegylated (native) α-lactalbumin was well-separated from the various pegylated compounds. One possible cause for the poor separation seen in the red line of Figure 2 is peak spreading associated with the complex injection system used in the AKTA Explorer. The conventional mode of operation has the sample pass from the Injection valve (V1 in Figure 1) directly to the Flow Directional Valve (V7) and then the Column Selection Valve (V2) before it is injected onto the column. In addition, output from the column goes through a separate Column Selection Valve (V3) and then the Flow Directional Valve (V7) before entering the UV detector. This creates a significantly longer flow path, which could cause spreading (dispersion) of the peaks and thus reduce the overall resolution of the separation. In order to determine if this long flow path has a significant effect on the resolution of the pegylated proteins, an experiment was performed in which the V7 valve was by-passed completely, with the sample injected into V1 through V2 and then directly onto the column. Similarly, the column output was taken from V3 directly to the UV detector. The chromatogram for the trials that used the flow directional valve shows significantly less

resolution between the peaks than the run without the flow-directional valve. The improvement in resolution was particularly noticeable among the peaks for the pegylated molecules. In addition, the retention volumes for the different components in the trial that by-passed the flow directional valve are slightly smaller than those in the experiment in which the flow directional valve was utilized (Table 2), reflecting the small amount of additional volume in the extra tubing and valving associated with the flow-directional valve system. Table 2. Effect of injection system on retention volume in SEC
Retention Volume Peak Molecule With Flow
Valve (ml) Without Flow
Valve (ml) 1 4-PEG 12.56 12.04 2 3-PEG 13.34 12.55 3 2-PEG 14.32 13.52 4 1-PEG 15.77 14.91 5 Unreacted α-lactalbumin - 17.40 6 NHS 21.26 20.30

Superdex3004:10_UV2_214nm Superdex5kdalac001:10_UV2_214nm
0
100
200
300
400
500
600mAU
10.0 12.0 14.0 16.0 18.0 20.0 22.0 ml
12.04
12.65
13.52
14.91
17.40
20.30
12.86
13.34
14.32
15.77 21.26
Figure 2: Size exclusion chromatograph for 100 µl injection of 5kd α-lactalbumin sample into New Superdex-200-
10/300 column. UV absorbance measured at 214 nm. Red line represents flow path which utilized Flow Directional Valve. Blue line represents flow path which did not. Flow rate is 0.30 ml/min.
Effect of Varying Injection Volume: Another approach that can be used to increase the resolution of the SEC system is to reduce the size of the sample injection. Larger sample volumes clearly require more time to enter (and thus exit) the system, thereby increasing the overlap between adjacent peaks. On the other hand, the use of very small sample volumes substantially reduces the capability of using SEC to achieve significant amounts of purified pegylated proteins, which is one of the ultimate goals of this research effort. In order to explore the effect of sample injection volume on protein resolution, experiments were performed using 5 kD pegylated α-lactalbumin. The sample used the flow path that by-passed the flow directional valve mentioned in the previous section. The flow rate was again fixed at 0.30 ml/min and the UV absorbance was measured at 214 nm. Figure 3 shows a chromatogram comparing the results for injection volumes of 100 µl (red line) and 500 µl (blue line). As expected, the retention volumes were very similar in both runs; however the run with

the smaller injection volume clearly gave somewhat better peak resolution. This is particularly evident in the 1st peaks in both chromatographs. With an injection volume of 500 µl, the first peak is barely noticeable and resembles a shoulder on the larger second peak, while this peak is clear and distinct for the output using a 100 µl injection volume.
Superdex5kdalac001:10_UV2_214nm Superdex5kdalac500001:10_UV2_214nm
0
200
400
600
800
1000
1200
1400
mAU
12.0 14.0 16.0 18.0 20.0 ml
12.01
12.75
13.60
14.97
17.44
20.21
11.98
12.59
13.46
14.85
17.34
20.24
Figure 3: Size exclusion chromatograph for injection of 5kd α-lactalbumin sample into New Superdex-200-10/300 column by-passing flow directional valve. Red line represents an injection volume of 100µl. Blue line represents an injection volume of 500 µl. Flow rate is 0.30 ml/min.
Effect of Varying Flow Rate: Another variable used to explore the effectiveness of size exclusion chromatography under various conditions was the eluent flow rate. Results were compared for experiments performed using flow rates of 0.30 ml/min and 0.50 ml/min with a 100 µl sample of 5 kD pegylated α-lactalbumin. The flow path of the sample excluded the flow directional valve to improve the overall resolution. Figure 4 shows the resulting chromatograms. The red line represents the output at a flow rate of 0.30 ml/min and the blue line shows results at 0.50 ml/min. Retention

volumes are similar in both trials, indicating that the different size components were able to effectively access the pore volume even at the higher flow rate. Although the differences are relatively small, the peaks obtained at a flow rate of 0.30 ml/min do show somewhat better resolution, which is likely due to the greater amount of dispersion that occurs at the higher flow rate. The peak resolution can be quantified in terms of the sample retention volume or time (t1) and the peak half width (σ1) as:
R = t1 − t2
σ1 + σ 2
where the subscripts 1 and 2 refer to the peaks that exit at times t1 and t2, respectively (with t1 > t2). The peak half width can be evaluated by measuring the width of the peak (the difference in time between the front and back portions of the peak) at one-half the height of the maximum in the absorbance for that peak. Several attempts were made to calculate the peak resolution, but it was extremely difficult to evaluate the peak half-width for the partially over-lapped peaks. For example, although the location of the rising portion of the first peak was relatively easy to identify in the chromatographs in Figure 4, the location of the descending portion of that peak (at one-half the maximum in the absorbance) was completely obscured by the larger second peak. Accurate evaluation of the peak half-widths would thus require a fairly complex deconvolution of the chromatographs into a series of overlapping Gaussian peaks. The software for performing this type of analysis was not available on the AKTA Explorer, and there was insufficient time to develop / implement the necessary software using another system.

Superdex5kdalac001:10_UV2_214nm Superdex07093001:10_UV2_214nm
0
100
200
300
400
500
mAU
10.0 12.0 14.0 16.0 18.0 20.0 ml
11.97
12.54
13.41
14.80
17.30
20.19
11.98
12.59
13.46
14.85
16.12
17.34
20.24
Figure 4: Size exclusion chromatograph for injection of a 5kd α-lactalbumin sample into New Superdex-200-10/300
column by-passing flow directional valve. Red line represents a flow rate of 0.30 ml/min. Blue line represents a flow rate of 0.50 ml/min. Injection volume is 100 µl.
Effect of Varying Buffer Ionic Strength Previous studies by Pujar and Zydney clearly demonstrated that the retention volume in size exclusion chromatography can also be a function of the solution ionic strength of the running buffer due to the effects of the electrical double layer on protein partitioning into the pores of the SEC resin 3. The electrical double layer refers to the region of the solution immediately adjacent to the protein that is occupied by a higher concentration of the counterions, e.g., the positively-charged sodium ions in a NaCl solution in the region near a negatively-charged protein. The protein must bring this electrical double layer into the pores of the resin, thus it tends to act as a larger molecule under conditions where the double layer is relatively thick. Experiments were performed using 5 kD pegylated α-lactalbumin sample using different ionic strength solutions for both the running buffer and for the sample preparation (Table 3).
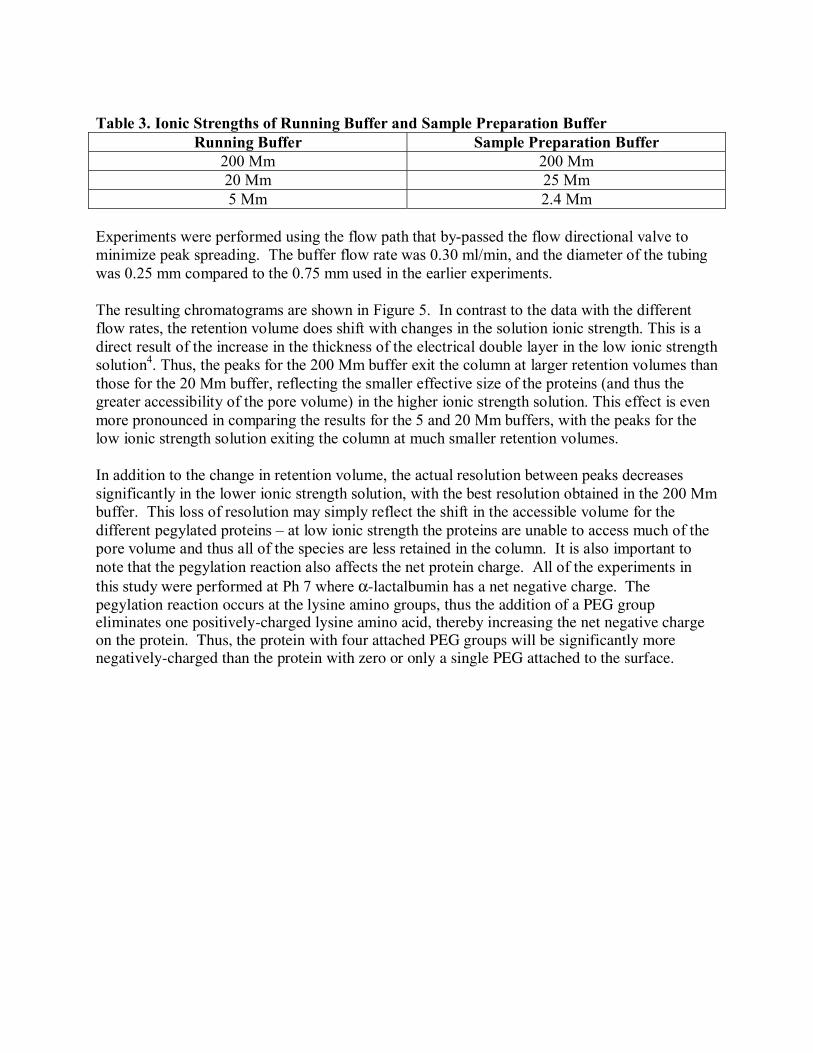
Table 3. Ionic Strengths of Running Buffer and Sample Preparation Buffer
Running Buffer Sample Preparation Buffer 200 Mm 200 Mm 20 Mm 25 Mm 5 Mm 2.4 Mm
Experiments were performed using the flow path that by-passed the flow directional valve to minimize peak spreading. The buffer flow rate was 0.30 ml/min, and the diameter of the tubing was 0.25 mm compared to the 0.75 mm used in the earlier experiments. The resulting chromatograms are shown in Figure 5. In contrast to the data with the different flow rates, the retention volume does shift with changes in the solution ionic strength. This is a direct result of the increase in the thickness of the electrical double layer in the low ionic strength solution4. Thus, the peaks for the 200 Mm buffer exit the column at larger retention volumes than those for the 20 Mm buffer, reflecting the smaller effective size of the proteins (and thus the greater accessibility of the pore volume) in the higher ionic strength solution. This effect is even more pronounced in comparing the results for the 5 and 20 Mm buffers, with the peaks for the low ionic strength solution exiting the column at much smaller retention volumes. In addition to the change in retention volume, the actual resolution between peaks decreases significantly in the lower ionic strength solution, with the best resolution obtained in the 200 Mm buffer. This loss of resolution may simply reflect the shift in the accessible volume for the different pegylated proteins – at low ionic strength the proteins are unable to access much of the pore volume and thus all of the species are less retained in the column. It is also important to note that the pegylation reaction also affects the net protein charge. All of the experiments in this study were performed at Ph 7 where α-lactalbumin has a net negative charge. The pegylation reaction occurs at the lysine amino groups, thus the addition of a PEG group eliminates one positively-charged lysine amino acid, thereby increasing the net negative charge on the protein. Thus, the protein with four attached PEG groups will be significantly more negatively-charged than the protein with zero or only a single PEG attached to the surface.

New5mM001:10_UV2_214nm New20mM001:10_UV2_214nm New200mM001:10_UV2_214nm
0
200
400
600
800
1000
mAU
10.0 12.0 14.0 16.0 18.0 20.0 ml
11.85
12.41
13.32
14.68
15.96
17.18
20.03
12.25
13.05
14.29
16.51
19.67
11.38
12.82
14.30
15.93
18.14
Figure 5: Size exclusion chromatogram for injection of 5kd α-lactalbumin sample into New Superdex-200-10/300 column by-passing flow directional valve. Red line represents a buffer ionic strength of 5 Mm, blue line represents an ionic strength of 20 Mm, and green line represents an ionic strength of 200 Mm. Flow rate is 0.30 ml/min
Discussion:
The overall goal of this research effort was to explore the variables that determine the effectiveness of size exclusion chromatography for the separation of pegylated proteins. The data clearly demonstrate that it is possible to achieve a significant separation between the pegylated and native protein, with some separation possible between the different pegylated species based on the difference in size associated with the different number of attached PEG groups. Complete (baseline) resolution between the different pegylated species was not possible under the conditions examined in this study, although small volumes of the purified components could be collected near the center of the various peaks. These samples will be used in future studies to determine important physical characteristics of the different pegylated products.
Several factors were identified as having a significant effect on the separation of the pegylated proteins and the overall peak resolution. In particular, a significant improvement in

resolution was obtained by by-passing the Flow Directional Valve to reduce the overall tubing length and minimize dispersion of the samples. In addition, the use of smaller injection volumes gave better resolution since this minimized the spreading associated with the injection time / volume of the sample. Further improvements in resolution might be obtained by using even smaller injection volumes, although this would also reduce the throughput of the system making it difficult to purify sufficient product for subsequent analysis / application. The use of a lower flow rate also gave better resolution, which is likely due to a reduction in dispersion that occurs at high flow rates.
Protein retention in the SEC column was also a strong function of the solution ionic strength. The use of low ionic strength caused a significant reduction in the retention volume consistent with the increasing in the effective size of the protein associated with the greater thickness of the electrical double layer at low ionic strength. This shift in retention volume could potentially be used to enhance the separation between the charged proteins and the unreacted polyethylene glycol which is electrically neutral and should thus be unaffected by the change in solution ionic strength. However, the resolution between the different pegylated proteins was much better in the high ionic strength solutions. This may simply be a result of the better accessibility of the pore volume in the higher ionic strength buffer —the use of a SEC resin with larger pore size might allow the proteins to diffuse in and out of the pores more effectively even at low ionic strength.
Although our results have provided useful insights into the variables that affect the separation of pegylated proteins using size exclusion chromatography, we were unable to find conditions that gave clear separation between the different pegylated products. other parameters that should be studied include the effects of column length and resin pore size. The resolution typically improves as the column length increases since the greater residence time in the column provides further opportunity for separation. The resin pore size needs to be “matched” to the size of the species that are being separated. A resin with very small pores would exclude all of the species while a very large pore size resin would allow all of the species to enter the pore, leading to very poor resolution in both of these extremes. An ideal resin would have pores that are sufficiently large so that the smaller species have easy access to almost the entire pore volume while excluding most of the larger components. As demonstrated in this study, it should be possible to use the solution ionic strength to “fine-tune” the separation characteristics by shifting the effective size of the charged proteins up or down based on the thickness of the electrical double layer.
It would also be useful to try to use the experimental results obtained in this study, in combination with experiments employing different resins / columns, to develop a mathematical model for the separation of pegylated proteins by size exclusion chromatography. This type of model could then be used to optimize the performance characteristics to obtain the best possible resolution between the key species of interest. This would greatly facilitate the design and development of cost-effective systems for the purification of pegylated proteins, thereby reducing the cost of producing these biomolecules for new therapeutic applications in the treatment of disease.

References
1. Bailon, Pascal & Berthold, Wolfgang (1998). Polyethylene glycol-conjugated pharmaceutical proteins. Pharmaceutical Science & Technology Today, 1, 352-356. 2. Harris, J. M., & Chess, R. B. (2003). Effect of Pegylation of Pharmaceuticals. Nature Reviews – Drug Discovery, 2, 214-221. 3. Pujar, N. S., & Zydney, A. L. (1998). Electrostatic effects of protein partitioning in size- exclusion chromatography and membrane ultrafiltration. Journal of Chromatography A, 796, 229-238. 4. Zeman, L. J., & Zydney, A. L. (1996). Microfiltration and Ultrafiltration: Principles and Applications. New York: Marcel Dekker.