sept preliminary assessment of tropical cyclone larry · issue 83 sept 2006 figure 1. tropical...
TRANSCRIPT

issue 83 Sept 2006
Figure 1. Tropical Cyclone Larry track (Bureau of Meteorology, 2006).
Preliminary assessment of Tropical Cyclone Larry �
Preliminary assessment of Tropical Cyclone LarryFor a ‘midget’ cyclone, Larry packed a nasty punch Adrian Hitchman, Bob Cechet, Mark Edwards, Geoff Boughton (TimberEd Services, Perth, Western Australia), Mary Milne, Damian Mullaly, Medhavy Thankappan
Severe Tropical Cyclone Larry crossed the far north Queensland coast near Etty Bay around 7 a.m. on 20 March, 2006. It then tracked west–northwest and passed directly over the town of Innisfail (figure 1). Within 48 hours, teams from Geoscience Australia were on the ground to begin a program of assessing building and crop damage. This continued over three weeks and the initial analysis of data collected is presented below.
At landfall, the eye of Tropical Cyclone Larry extended about 20 to 25 kilometres from Mirriwinni in the north to Mourilyan Harbour in the south. A vessel sheltering in the South Johnstone River to the east of Innisfail recorded winds gusting to 225 km/h while gusts as high as 294 km/h were recorded near the peaks of the Bellenden Ker mountain range (1450 metres) and 187 km/h at the Ravenshoe wind farm (about 75 kilometres from the coast) as the weakening cyclone moved inland.
The fast-moving tropical depression travelled westward, weakening throughout the day. By 10 p.m. it had passed to the south of Croydon in Queensland’s Gulf country where it continued to bring heavy rain and severe flooding.
Cyclone descriptionTropical Cyclone Larry was classified as a ‘midget’ cyclone because of the limited range of its destructive winds. Furthermore, coastal communities were not exposed to cyclonic winds and airborne debris for long periods as the cyclone moved relatively quickly at landfall. Low tides at the time also ensured there was no significant storm surge.
Since the 1870s, 22 cyclones have impacted the Innisfail region causing damage from severe wind, storm surge, estuarine flooding or a combination of these hazards (Callaghan 2004). Tropical Cyclone Larry impacted the coast at both high lateral speed and at low tide, causing only wind-related damage. From analysis of impacts to simple structures (such as road signs), preliminary estimates of maximum wind gust speeds at a height of 10 metres are in the order of 55–65 m/s (~200–235 km/h) compared to 50–55 m/s (~180–200 km/h) reached in Tropical Cyclone Winifred, which hit the region in February 1986 (Reardon et al 1986). Further analysis of the data will be required before final wind speeds are determined.

issue 83 Sept 2006
Figure 2. Geographical Information System image displaying the building damage overlain on an aerial photograph for the beachside community of Kurrimine Beach (30 km SSE of Innisfail).
Preliminary assessment of Tropical Cyclone Larry �
Impact on critical infrastructureElectricity transmission was cut to the north and southwest of Innisfail. Severe damage to pole-mounted electrical distribution and communications networks was widespread. Power disruption affected other essential utilities such as the hospital, water supply and water treatment works which needed emergency generators. Road and rail access to the region was disrupted for several days by flooding.
Impact on buildingsSevere winds caused by Tropical Cyclone Larry resulted in significant damage to buildings. All townships in the Innisfail region were severely affected.
Table 1. Damage Index: relationship between physical damage and damage costing where the repair cost is expressed as a proportion of the value of the property.
Damage Index (physical) Damage Index (cost) %
1 Negligible 02 Missile to cladding/window 203 Loss of half roof sheeting 504 Loss of all roofing 705 Loss of roof structure 906 Loss of half of outer walls 1007 Loss of all walls 1008 Loss of half floor 1009 Loss of all floor 100
10 Collapse of floor supporting piers 100
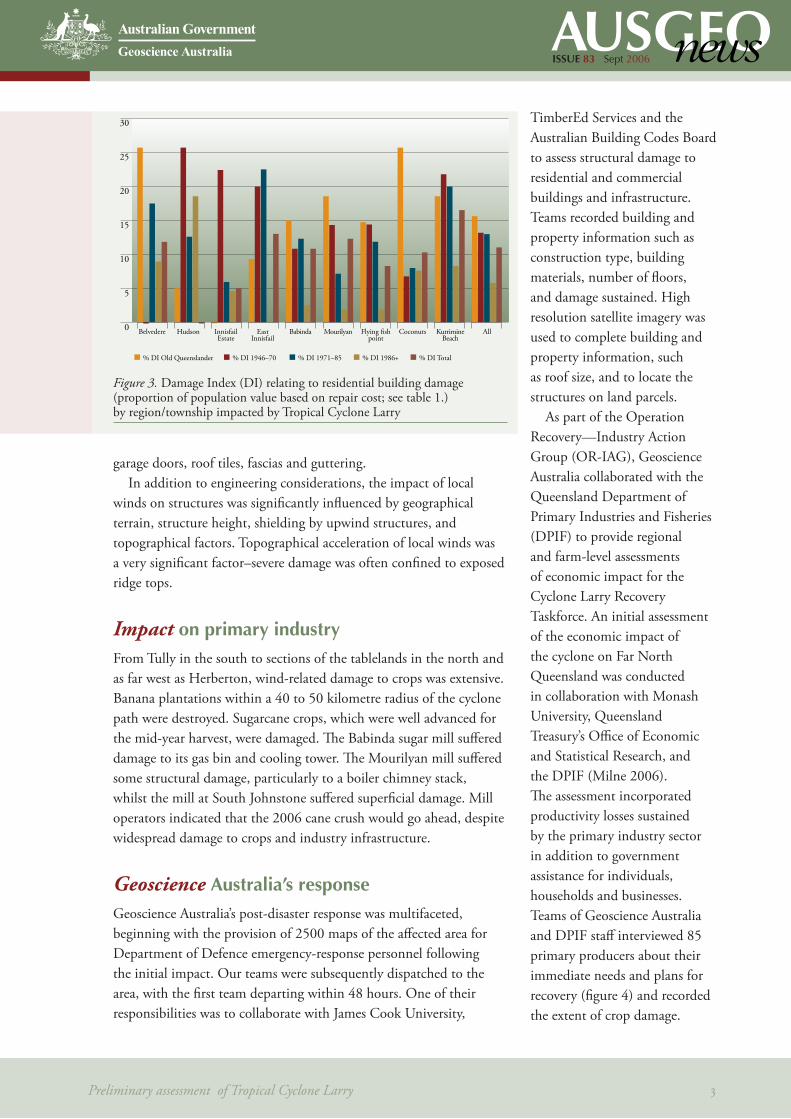
The assessed damage index, which expresses the repair cost as a proportion of the value of rebuilding damaged residential structures (table 1), was calculated for the population of buildings within a number of Innisfail suburbs and nearby townships. Figure 2 shows an example of the spatial analysis conducted for the community of Kurrimine Beach (30 kilometres south–southeast of Innisfail). Figure 3 displays the results as a population percentage (e.g. 25% indicates a damage level equal to 25% of the value of the structures in the local population).
Among residential properties, older homes (pre-1986) tended to suffer the greatest wind damage because of their vulnerable locations (e.g. on ridge tops), building regulations which required limited cyclone-resistance measures at the time of construction, and their lower resilience as a result of aging processes (corrosion, rot, insect attack).
Structures built after Tropical Cyclone Winifred withstood Tropical Cyclone Larry better. This may be because of the revised building standards introduced for domestic construction in the early 1980s and a better understanding of prevention measures following an analysis of the damage inflicted in 1986 by Cyclone Winifred.
Damage to newer homes tended to be comparatively minor and was mostly limited to
issue 83 Sept 2006
30
25
20
15
10
5
0 Belvedere
% DI Old Queenslander % DI 1946–70 % DI 1971–85 % DI 1986+ % DI Total
Hudson Innisfail Estate
EastInnisfail
Babinda Mourilyan Flying fish point
Coconuts Kurrimine Beach
All
Figure 3. Damage Index (DI) relating to residential building damage (proportion of population value based on repair cost; see table 1.) by region/township impacted by Tropical Cyclone Larry
Preliminary assessment of Tropical Cyclone Larry �
garage doors, roof tiles, fascias and guttering.In addition to engineering considerations, the impact of local
winds on structures was significantly influenced by geographical terrain, structure height, shielding by upwind structures, and topographical factors. Topographical acceleration of local winds was a very significant factor–severe damage was often confined to exposed ridge tops.
Impact on primary industryFrom Tully in the south to sections of the tablelands in the north and as far west as Herberton, wind-related damage to crops was extensive. Banana plantations within a 40 to 50 kilometre radius of the cyclone path were destroyed. Sugarcane crops, which were well advanced for the mid-year harvest, were damaged. The Babinda sugar mill suffered damage to its gas bin and cooling tower. The Mourilyan mill suffered some structural damage, particularly to a boiler chimney stack, whilst the mill at South Johnstone suffered superficial damage. Mill operators indicated that the 2006 cane crush would go ahead, despite widespread damage to crops and industry infrastructure.
Geoscience Australia’s responseGeoscience Australia’s post-disaster response was multifaceted, beginning with the provision of 2500 maps of the affected area for Department of Defence emergency-response personnel following the initial impact. Our teams were subsequently dispatched to the area, with the first team departing within 48 hours. One of their responsibilities was to collaborate with James Cook University,
TimberEd Services and the Australian Building Codes Board to assess structural damage to residential and commercial buildings and infrastructure. Teams recorded building and property information such as construction type, building materials, number of floors, and damage sustained. High resolution satellite imagery was used to complete building and property information, such as roof size, and to locate the structures on land parcels.
As part of the Operation Recovery—Industry Action Group (OR-IAG), Geoscience Australia collaborated with the Queensland Department of Primary Industries and Fisheries (DPIF) to provide regional and farm-level assessments of economic impact for the Cyclone Larry Recovery Taskforce. An initial assessment of the economic impact of the cyclone on Far North Queensland was conducted in collaboration with Monash University, Queensland Treasury’s Office of Economic and Statistical Research, and the DPIF (Milne 2006). The assessment incorporated productivity losses sustained by the primary industry sector in addition to government assistance for individuals, households and businesses. Teams of Geoscience Australia and DPIF staff interviewed 85 primary producers about their immediate needs and plans for recovery (figure 4) and recorded the extent of crop damage.

issue 83 Sept 2006
Figure 4. Expected number of years until full crop production is resumed (Milne, 2006).
Figure 5. Impact of Tropical Cyclone Larry on selected industries’ output: government assistance scenario (% deviation from forecast) (Mullaly and Wittwer 2006).
Preliminary assessment of Tropical Cyclone Larry �
How will the collected data be used?The collected structural damage information will be useful in a number of ways. It will contribute to a better understanding of extreme cyclonic wind gusts and provide engineers with highly detailed data on the vulnerability of houses and other structures to severe wind. When combined with information from similar events and other sources, the data collected will provide a clearer picture of severe-wind risk for Australian communities. This information will help Australian communities in preparing for future cyclone events and reduce their potential impact.
In addition to the findings of the primary producer survey, which were provided to the Cyclone Larry Recovery Taskforce, Geoscience Australia used field survey data to assess the extent of damage to
agricultural areas and validate post-disaster remote sensing imagery (Thankappan 2006). The data collected with the assistance of DPIF have provided detailed estimates of direct economic losses to the agricultural sector. This will be used to assess the long-term impact on the regional economy and provide information to assist policy decisions for recovery (figure 5).
Results and additional informationPreliminary results from the Tropical Cyclone Larry post-impact surveys, including a review of the meteorological information, can be found in the report from the Cyclone Larry Forum (Cyclone Larry Forum Report 2006). The Bureau of Meteorology has prepared a meteorological report detailing the maximum wind zones associated with Cyclone Larry (Callaghan and Otto 2006). The Cyclone Testing Station at James Cook University has issued a report detailing the damage to buildings from Cyclone Larry (Boughton et al 2006). A whole-of-government report on Larry’s impact (due December 2006) is being coordinated by the Bureau of Meteorology for the Queensland Tropical Cyclone Coordination Committee. Geoscience Australia will continue to post updates of our analysis of the impact through our website (Geoscience Australia 2006).

issue 83 Sept 2006
References
Boughton G et al. 2006. Effects of Cyclone Larry on buildings, James Cook University Cyclone Testing Station, Technical Report No. 51Bureau of Meteorology. 2006. Tropical cyclone Larry. www.bom.gov.au/weather/qld/cyclone/tc_larry/Callaghan J. 2004. Tropical cyclone impacts along the Australian east coast from November to April (1858 to 2004). Bureau of Meteorology, Brisbane Regional Office, australiasevereweather.com/cyclones/impacts-eastcoast.pdfCallaghan, J. and P. Otto 2006. The maximum wind zones associated with Tropical Cyclone Larry at landfall, Bureau of Meteorology (in press)Cyclone Larry Forum Report. 2006. Townsville campus, James Cook University, 7 April 2006, www.rainforest-crc.jcu.edu.au/latestNews/ForumReport.pdf
Geoscience Australia. 2006, www.ga.gov.au/urban/projects/ramp/tc_larry.jspMilne M. 2006. Findings from primary producer post-disaster recovery surveys. Report for the Operation Recovery—Industry Action Group.Mullaly D.J & Wittwer G. 2006, Modelling the economic impacts of Tropical Cyclone Larry in Far North Queensland. Report for the Operation Recovery—Industry Action Group.Reardon GF, Walker GR & Jancauskas ED. 1986. Effects of Cyclone Winifred on buildings. Technical report no. 27, James Cook University Cyclone Testing Station.Thankappan M. 2006. Crop damage assessment using a GIS and remote sensing approach. Report for the Operation Recovery—Industry Action Group.
More informationphone Bob Cechet on +61 2 6249 9246email [email protected]
Related websites/articlesAusGeo News 81 Beating the big blows link www.ga.gov.au
events International earth science Week celebrations
International Earth Science Week 2006, to be celebrated from 8 to 14 October, will provide an opportunity for everyone involved in the earth sciences to share the significance of their work with the broader community.
This year’s theme of ‘Citizen’s Science’ aims to encourage everyone, adults and children alike, to participate and learn about the contribution of the earth sciences to the wellbeing of our society and environment.
Geoscience Australia has been the national coordinator of Earth Science Week events in Australia since 1999 and continues to promote the week and encourage participation by scientific and cultural communities across the country.
The 2006 Earth Science Week poster has been distributed nationally and the national Earth Science Week website includes information on activities in each state and territory as well as ideas for themed events and activities. Geoscience Australia also encourages organisations to share details of their Earth Science Week activities with the rest of Australia by posting their event information.
The 2006 Earth Science Week poster depicts a sparse rocky terrane which highlights several areas of current geoscience research. Topographic and 3D mapping support the search for new mineral resources while mapping of the seabed provides clues for the future discovery of petroleum. Other features include the melting ice as a gentle reminder of the climate change challenge and working scientists represent the diversity of careers within the geosciences.
More information phone Jeanette Holland on
+61 2 6249 9731 email [email protected]
Related websitesGeoscienceAustralia Special eventswww.ga.gov.au/about/event/index.jsp
link
Preliminary assessment of Tropical Cyclone Larry �