september 2013. table of contents section 1: company overview section 2: credit scoring & loan...
TRANSCRIPT

Investor PresentationSeptember 2013
TABLE OF CONTENTS
SECTION 1: COMPANY OVERVIEW SECTION 2: CREDIT SCORING & LOAN SERVICING SECTION 3: FINANCIALS SECTION 4: SECURITIZATIONS SECTION 5: LEGAL & REGULATORY UPDATE
2
We Bring People and Cars Together.

SECTION 1: COMPANY OVERVIEW
3
We Bring People and Cars Together.

4
Company Overview DriveTime Automotive Group, Inc. (“DriveTime”) is the leading used vehicle retailer
in the United States solely focused on the sale and financing of quality vehicles to the subprime market. Its sister company, DT Acceptance Corp. (“DTAC”), funds and services all loans originated by DriveTime.
Over the past 20 years, DriveTime has developed and operated an integrated business model that provides its customers with a comprehensive end-to-end solution for their automotive needs, including the sale, financing and maintenance of vehicles.
DriveTime is privately held (Ernie C. Garcia II, Chairman, owns 98.3% and Raymond C. Fidel, CEO, owns the remaining 1.7%), but is an SEC registrant due to its $250M Sr. Secured Notes issuance
DriveTime has 104 branded dealerships and 18 reconditioning facilities in 47 geographic areas. For the last twelve months ended June 30, 2013 DriveTime has:
Sold 63,011 vehicles Generated Revenue of $1.3 billion Generated Adjusted EBITDA of $149 million Generated Adjusted S-Corp Net Income of $46.5 million Managed a retail loan portfolio of $1.8 billion
* Adds back $11.1m of unrecognized Deferred Income on 6/30/13 Balance Sheet as a result of unbundling service contracts at point of sale. Piloting in 4 states starting December 2012.
We Bring People and Cars Together.
*
4

5
5
Company History
2001 2002
1992:Founded as Ugly Duckling Corporation
2001:Implemented 1st generation credit grading system
1998:Began monoline wrapped securitization program
2005:Issued $80M senior unsecured notes (later upsized to $136M)
2002:Taken privateDeveloped and implemented new strategic focusChanged name to DriveTime
1996:Took company publicRaised $160M in IPO and secondary7 dealerships in Arizona, $54mm in sales
2006:Revenues top $1BLoan portfolio in excess of $1B
2005
1992 1996
1998
2008/2009: Closed 26 stores &
decreased originations 29%
2009:First unwrapped securitization Drive Care 36mo/36k mile warranty
2010:Payments removed from storesCentralized collectionsIssued $200M Sr. Secured NotesFour warehouse lenders totaling $575M
2010
2006 2008 2009
2011
2011:Sr Notes registered with SEC7th generation credit grading systemWells Fargo warehouse/inventory lending facilities
2012
2012:$1.7B Loan PortfolioLaunched GO Financial
2013
2013:Issued $50M Sr. Secured notes tack-on104 Dealerships
We Bring People and Cars Together.

Expanding Coast-to-Coast Footprint
In recent years, the DriveTime brand has evolved from a traditional buy-here, pay-here dealership model to a comprehensive retail experience
The Company’s dealerships are retail focused and facilitate the sale of vehicles through dealerships with a customer centric focus
Entered seven new states since March 31, 2010 (dark green states)
6
Dealerships (104 Total) Reconditioning Centers (18 Total)
St. Louis
Las Vegas (3)
Phoenix (7)
NashvilleLas Vegas (2)
Los Angeles (4)
Tucson
Phoenix (5)
Albuquerque (3)
Dallas (8)
Austin (2)
San Antonio (4)Tampa (5)
Orlando (6)
Jacksonville (3)
Memphis(2)
Nashville(2)
Charlotte (5)
Norfolk (3)
Greenville
Greensboro (2)
Oklahoma City(2)
Denver (2)
Richmond (3)
Indianapolis(2)
Raleigh
Birmingham (2)
Mobile
Chattanooga
Knoxville
ColumbiaCharleston
FayettevilleTulsa
Temple
Jackson
Houston (3)
AugustaAtlanta (5)
Cincinnati (2)
Savannah
Pensacola
Little Rock (1)
Montgomery
McAllen
Tallahassee
Huntsville Myrtle Beach
Miami (2)
St. Louis (1)
Columbus (1)
Dealerships located in 47 metropolitan areas in 19 states
– All Company owned
Fort Meyers
We Bring People and Cars Together.
Columbus
Collection Centers (2 Total)

7
Nation’s Largest Subprime Vehicle Retailer
(1) Source: Automotive News.(2) As a % of total 2012 used vehicles sold by franchised and independent
dealerships and private sales (40.5 million). (Source – CNW)
Top Used Vehicle RetailersNew and Used Car Sales
Source: CNW.
2002 2003 2004 2005 2006 2007 2008 2009 2010 2011 2012 -
10 20 30 40 50 60 70 80
20 19 20 19 19 19 19 17 16 16 16
52 51 50 45 44 43 39 36 38 38 38
Franchised Independent
Deal
ersh
ips (
in th
ousa
nds)
2012
rank Company
2012No of used
vehicles sold(1)
2012 market share(2)
1 CarMax (KMX) 408,080 1.0%
2 AutoNation (AN) 180,973 0.4%
3Penske Automotive (PAG)
145,580 0.4%
4Sonic Automotive (SAH)
105,615 0.3%
5Group 1 Automotive (GPI)
85,366 0.2%
6Van Tuyl Group (private)
81,385 0.2%
7 Hendrick Automotive 60,174 0.2%
8DriveTime Automotive
59,930 0.2%
We Bring People and Cars Together.

8
Percentage of U.S. population with a FICO score under 620 is approximately 24.5%
Originations for customers within the subprime used vehicle market averaged $32.6 billion per annum over the last 6 years
Sub Prime Vehicle Finance
Subprime Auto Loan Originations Subprime Population
Subprime population 24.5%
Prime & Nonprime population 75.5%
Source: CNW. Subprime defined as borrowers with FICO scores below 620 for originations data.Source: Equifax - FICO Distribution for borrowers with FICO scores below 620 as of
April 2013.
We Bring People and Cars Together.

9
DriveTime’s Customer BaseSubprime customers generally have:
- Poor or limited credit histories
- Significant charge-offs
- Prior bankruptcies
- Modest incomes
Tax refunds result in high seasonality of our subprime business- Higher downs = Higher Q1 sales
- Delinquencies and charge-offs drop as customer has more disposable cash
- Majority of profits made in first half of year
- Inventory levels highest at year end in preparation for Q1 sales volumes- Tax returns were delayed in 2013, shifting
more vehicle sales into March and April
Source: DriveTime originations last 12 months ended 3/31/2013 Source: DriveTime sales and charge-offs for 2010-2012
DriveTime Customers Subprime Seasonality
We Bring People and Cars Together.

Fully Integrated Business Model
10
After Sale Support
Loan Servicing
Underwriting and Finance
Marketing
Vehicle Sales
Vehicle Reconditioning
and Distribution
Vehicle Acquisition
Acquired primarily from used vehicle auctions (including online auctions)Centralized vehicle selection strategy takes into account retail value, age, and costs of buying, reconditioning, and delivering the vehicle for resale, along with buyer affordability and desirabilityPurchased 78,190 vehicles from over 250 auctions nationwide during 2012
Subsequent to acquisition, vehicles are transported to one of DriveTime’s 18 regional reconditioning facilitiesDriveTime reconditions the vehicles and perform a rigorous multi-point inspection for safety and operabilityReconditioned vehicles are distributed to dealerships based on real-time projected inventory turn times and levels
DriveTime employs proprietary inventory management and pricing systems which are integrated with and into its credit scoring system to facilitate the optimum vehicle for its customers' needsNo-haggle vehicle pricing is displayed on each vehicle's sticker - prices are determined centrally for all dealerships and all regions
Utilize targeted television, radio and online advertising
Over $28 million in marketing spend in 2012 with over 260,000 TV commercials and 11,000+ radio spots
Centralized proprietary credit scoring system determines a customer’s credit grade and the corresponding minimum down payment and maximum installment payment
Monitor the performance of our portfolio and close rates on a real-time basis
DriveTime performs all of its own servicing functions, from collections through the resale of repossessed vehiclesAll collections conducted through DriveTime’s centralized facilities in Arizona, Texas and Barbados Customers can make cash payments through an electronic payment network at over 4,000 Wal-Mart stores and more than 17,000 other locations nationwide - payments can also be made online, by check, money order, bill-pay and ACH
DriveCare® 36 month/36,000 mile limited warranty/service contract covers major mechanical and other electronic components of the engine block, the transmission, climate control and drive axles
We Bring People and Cars Together.

104 DriveTime Dealerships – All Company Owned
Typical Dealership
Units sold per month 55
Vehicle inventory 74
Sales financing 100% of sales
Staffing 10 – 15 retail and ops employees
Dealership building size 5,000 sf
Leasehold improvements & equipment
$595K
Typical lease term 5 years, with option for 5 to 15
years
Note: Information is based on the twelve months ended June 30, 2013.
Knoxville
Nashville
11

18 Reconditioning Facilities
Blue Mound, Dallas, TX
Centralized Decision Making
-Auction buy direction (year, make, mileage)
-Distribution to recon centers and stores
-Vehicle retail pricing
35 Full-Time buyers attending 250 auctions annually and purchasing over 84K vehicles
-Avg. vehicle base cost is $8,000
-Avg. reconditioning $1,500
-Avg. odometer 84K miles
-Avg. model year 2007
Total of +665,000 sq. feet of building space with maximum capability of reconditioning 2,290 vehicles per week
-Multi-point inspection on all vehicles
-Ability to recondition all makes and models
NOTE: Information presented is for LTM ended 6/30/13.
We Bring People and Cars Together.12

Recent Operational Enhancements
13
Collections
InternetProduct / Channel Expansion
Retail Experience
Fully centralized collection system with call centers in Arizona, Texas and Barbados
– Flexibility to close underperforming dealerships without disrupting collections
Customers can make cash payments through electronic payment network at over 4,000 Wal-Mart stores and more than 17,000 other locations nationwide
Beginning in 2012, all vehicles are equipped with anti-theft GPS devices
– 6.6 million visits per year
Launched in December 2011, GO provides subprime auto financing to third-party auto dealerships to provide incremental profitability
In Q4 2012, DriveTime began offering the DriveCare® limited warranty as a separately priced service contract in dealerships in Tennessee, Virginia and Ohio (expanded to Los Angeles in 2013)
Launched in January 2013, Carvana is a new sales channel that enables customers to buy cars, from click to delivery, 100% over the internet
Evolution to a more client-centric focused brand, promoting DriveTime as a courteous, transparent, respectful and trustworthy business
Opened 21 new retail-focused dealerships over the past two years
Existing dealerships have been remodeled with a spacious contemporary design, unique signage and flooring, and modern furniture and color patterns
After purchasing a vehicle, MyDriveTime.com allows customers to set up ACH payments, make one time payments and view account balances
Extensive investment in DriveTime.com and mobile applications, which provide customers comprehensive information about inventory, the credit application process, and scheduling dealership visits
– Over 57% of sales generated by customers who complete application prior to vising a dealership
We Bring People and Cars Together.

SECTION 2: CREDIT SCORING & LOAN SERVICING
14
We Bring People and Cars Together.
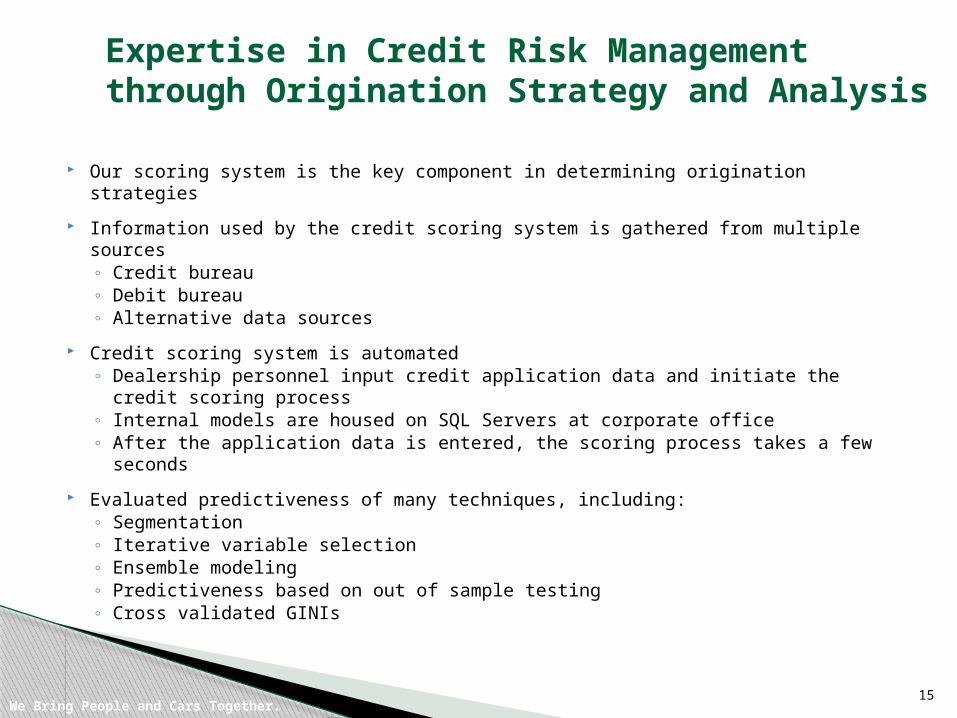
Our scoring system is the key component in determining origination strategies
Information used by the credit scoring system is gathered from multiple sources◦ Credit bureau ◦ Debit bureau ◦ Alternative data sources
Credit scoring system is automated ◦ Dealership personnel input credit application data and initiate the credit
scoring process◦ Internal models are housed on SQL Servers at corporate office◦ After the application data is entered, the scoring process takes a few seconds
Evaluated predictiveness of many techniques, including: ◦ Segmentation◦ Iterative variable selection◦ Ensemble modeling◦ Predictiveness based on out of sample testing◦ Cross validated GINIs
15
Expertise in Credit Risk Management through Origination Strategy and Analysis
15
We Bring People and Cars Together.

We segment the sub-prime market into eight credit grades using our proprietary credit scoring models
Note: Based on loans originated 7.1.2012 – 6.30.2013
GradeAvg Age
Avg Combined Income
Avg FICO
No FICO
Home Owner
Avg Time At Job
Avg Time At Address
Avg Time In CB
Percent of Originations
A+ 47 3,829$ 558 6.0% 42.6% 7.17 8.81 7.11 8.6%A 43 3,382$ 542 10.2% 27.8% 6.03 6.96 6.39 16.2%B 39 3,086$ 531 16.4% 16.5% 4.61 5.30 5.55 36.1%C 35 2,921$ 518 22.7% 9.4% 3.39 3.95 4.61 32.3%C- 33 2,918$ 506 23.4% 5.6% 2.97 3.12 4.13 4.8%D+ 33 2,899$ 499 19.5% 4.6% 2.78 2.85 3.99 1.5%D 32 3,024$ 488 15.8% 5.3% 2.69 2.54 3.90 0.3%D- 34 2,933$ 488 24.0% 7.3% 3.94 3.09 3.54 0.2%Wtd Avg 39 3,133$ 530 16.9% 17.5% 4.55 5.28 5.41 100.0%
Our Customer Demographics
16

17We Bring People and Cars Together.

18
Portfolio Performance
(1) Delinquencies are presented on a Sunday-to-Sunday basis, which reflects delinquencies as of the nearest Sunday to period end. Sunday is used to eliminate any impact of the day of the week on delinquencies since delinquencies tend to be higher mid-week.
We Bring People and Cars Together.
‣ Loan servicing disruptions tied to proposed sale in 2012 resulted in increased delinquencies
‣ Closed two front end collection centers, hiring freeze in other centerso At peak, the front end understaffed by 100 collectors (37%)
‣ Back end collections experienced all-time best roll rates o As a result, a lower percentage of delinquent loans have charged off
‣ Post termination of sale transaction we have taken steps to increase staffing to targeted levels
‣ Delinquency levels have been steadily normalizing through first 6 months of 2013Portfolio Delinquencies 31-90 Days (1) Charge-Offs by Year (% Avg. Portfolio)
0%
2%
4%
6%
8%
10%
12%
14%
16%
430 bps
270 bps

Late Stage Roll and Charge-Off Rates at All-Time Lows
We Bring People and Cars Together.
19

Static Pool – Unit “If Ever” Days Past Due
20We Bring People and Cars Together.
Ever01 Ever15 Ever30 Ever60 EverCO2008 93.6% 55.2% 32.3% 18.7% 20.5%2009 88.6% 47.9% 24.9% 12.2% 14.8%2010 88.9% 55.5% 31.0% 15.0% 14.8%2011 91.7% 58.4% 37.3% 20.3% 17.4%2012 90.2% 65.5% 45.3% 25.0% 18.6%

21
DriveTime Payment Channels
*Other payment methods include Western Union Quick Collect, Trustee Checks, etc.
Fully removed in store payments in Q4 2010.
DriveTime accepts an average volume of 220k payments across all payment channels per month.
DriveTime ranks as the number one payee at Wal-Mart through the CheckFree Pay network.
Currently using text to send payment reminders to customers. Adding the option to make payments using text in September 2013.
21

22
Auction Vehicle Recovery Values
• DriveTime recovery values tend to be less volatile than the market averages• More of a built in floor on the lower priced used DriveTime vehicle (6 – 8
yrs. old) vs. more volatility in the newer makes/models (1-5 yrs. old) • DriveTime portfolio turns over every 24 months on average vs. other
prime/near prime lenders whose portfolio’s do not turn over as quickly

SECTION 3: FINANCIALS
23
We Bring People and Cars Together.

History of Profitability Through Credit Cycles
Proven ability to manage through all credit cycles
$1,0
59
$946
$1,0
26
$1,1
21
$1,2
24
$1,2
92
$13.1
$11.3 $12.0 $12.7 $12.7 $13.5
$0
$2
$4
$6
$8
$10
$12
$14
$16
$0
$300
$600
$900
$1,200
$1,500
2008 2009 2010 2011 2012 LTM6/30/13Revenue Per Store
55,4
15
49,5
00
52,4
98
56,1
09
59,9
30
63,0
11593
629 648 648 659 650
0
100
200
300
400
500
600
700
0
20,000
40,000
60,000
80,000
2008 2009 2010 2011 2012 LTM6/30/13Vehicles Per Store
Revenue Adjusted EBITDA($ Millions) ($ Millions)
($ Millions)
$1
$53 $7
1 $89
$62
$48
$0
$20
$40
$60
$80
$100
2008 2009 2010 2011 2012 LTM 6/30/13
$105
$160
$149
$198
$180
$160
0
40
80
120
160
200
2008 2009 2010 2011 2012 LTM 6/30/13
($ Millions)
Vehicles Sold Long Term Capital
24
$266
$293 $4
19
$458
$468
$499
$250
$139
$198 $1
98
$198 $2
54
-2575
175275375475575675775
2008 2009 2010 2011 2012 6/30/2012Equity Long Term Debt
*$50M add-on to Sr. Notes in May, 2013
$432$516
$753
$665$656$617

$1,3
75
$1,3
40
$1,4
08
$1,4
95
$1,6
35
$1,8
27
-$100
$100
$300
$500
$700
$900
$1,100
$1,300
$1,500
$1,700
2008 2009 2010 2011 2012 6/30/2013
Operational MetricsDealerships (1) Originations
Finance Receivables
($ Millions)
($ Millions)
Cost of Funds
Closed dealerships in 2008 & 2009 in response to reduced access to funding
(1) Operating Expenses exclude store closure costs (2008 & 2009), legal settlements (2009), CFPB & SCUSA deal costs (2012), and non cash compensation expense (all years).
($ Millions)
94
79 81 88 91 97
18.0% 19.2% 18.4% 18.7% 18.6% 18.7%
0.0%
5.0%
10.0%
15.0%
20.0%
25.0%
0
50
100
150
2008 2009 2010 2011 2012 LTM6/30/13
Avg Dealerships Op Exp % Revenue
$789
$686
$747
$829
$917
$957
$8.4 $8.7$9.2 $9.4
$10.1 $9.9
4
5
6
7
8
9
10
11
$0
$200
$400
$600
$800
$1,000
$1,200
2008 2009 2010 2011 2012 LTM 6/30/13
Originations Per Store
$1,1
53
$1,0
48
$1,1
41
$1,1
00
$1,2
63
$1,3
96
8.4%
10.6%
9.2%
6.6%5.7% 5.3%
0.0%
2.0%
4.0%
6.0%
8.0%
10.0%
12.0%
$0
$500
$1,000
$1,500
$2,000
$2,500
2008 2009 2010 2011 2012 LTM 6/30/13Amt Borrowed Wt. Avg. COF
25
26
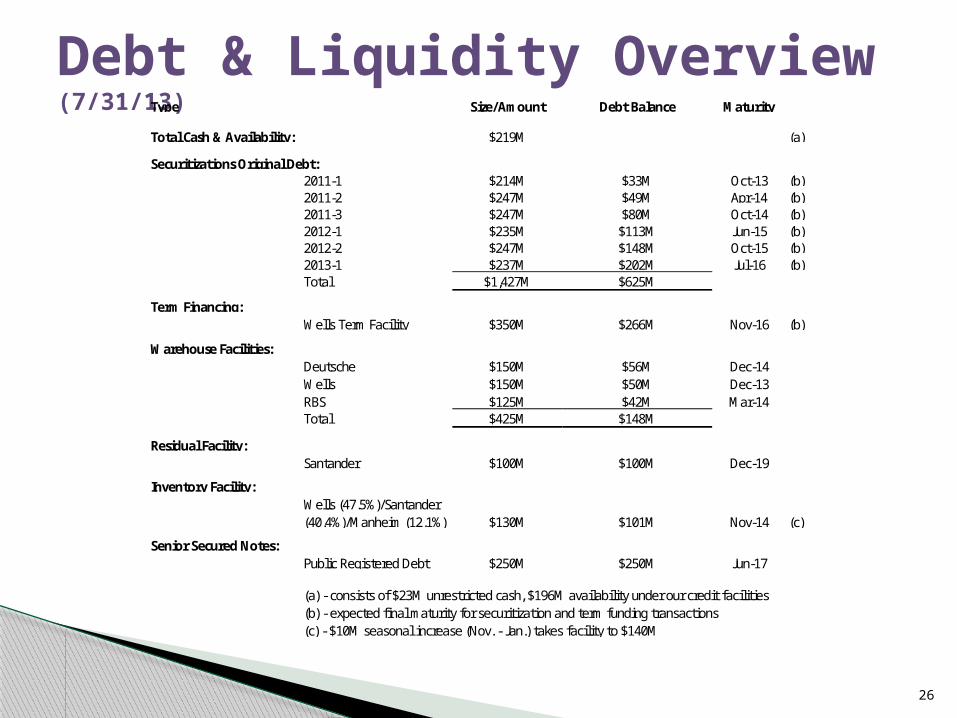
Debt & Liquidity Overview (7/31/13)Type Size/Amount Debt Balance Maturity
$219M (a)
2011-1 $214M $33M Oct-13 (b)2011-2 $247M $49M Apr-14 (b)2011-3 $247M $80M Oct-14 (b)2012-1 $235M $113M Jun-15 (b)2012-2 $247M $148M Oct-15 (b)2013-1 $237M $202M Jul-16 (b)Total $1,427M $625M
Term Financing:Wells Term Facility $350M $266M Nov-16 (b)
Warehouse Facilities:Deutsche $150M $56M Dec-14Wells $150M $50M Dec-13RBS $125M $42M Mar-14Total $425M $148M
Santander $100M $100M Dec-19
Wells (47.5%)/Santander (40.4%)/Manheim (12.1%) $130M $101M Nov-14 (c)
Public Registered Debt $250M $250M Jun-17
(a) - consists of $23M unrestricted cash, $196M availability under our credit facilities(b) - expected final maturity for securitization and term funding transactions(c) - $10M seasonal increase (Nov. - Jan.) takes facility to $140M
Total Cash & Availability:
Securitizations Original Debt:
Residual Facility:
Inventory Facility:
Senior Secured Notes:

SECTION 4: SECURITIZATIONS
27
We Bring People and Cars Together.

28
Issued 46 securitizations dating back to 1996◦ $5.8B in bonds◦ $7.8B in contract principal
Six currently active securitizations◦ Current debt outstanding $625M ($1.4B at issuance)◦ Securitizations are rated by S&P and DBRS
Added Kroll Bond Rating Agency in 2013 Serviced by DT Acceptance Corporation (DT Credit Company)
◦ Loan servicing centers in Mesa, Arizona & Dallas, Texas◦ Wells Fargo is back-up servicer
All contract receivables originated by DriveTime dealerships◦ All company owned ◦ No receivables purchased from third parties
DriveTime Securitization Program Overview
28

29
Recent Securitization Information2007A 2009-1 2010-1 2011-1 2011-2 2011-3 2012-1 2012-2 2013-1
Total Debt Issued $320M $193M $228M $214M $247M $247M $235M $247M $237MDuration Weighted Coupon 5.56% 5.30% 3.60% 3.00% 2.88% 3.92% 3.50% 2.81% 2.66%Pool Cutoff Date 05/31/07 11/01/09 08/31/10 01/31/11 04/30/11 10/31/11 03/31/12 06/30/12 05/31/13Close Date 06/15/07 12/17/09 09/23/10 02/10/11 05/31/11 11/10/11 04/24/12 07/26/12 06/19/13Original Pool Count 30,218 27,259 27,031 26,117 26,564 25,821 21,902 20,895 19,723Original Principal Balance $435M $381M $381M $371M $373M $369M $326M $319M $315MOriginal Pool Balance $418M $290M $300M $280M $300M $300M $300M $300M $300MAvg. Original Contract Balance $14,396 $13,986 $14,077 $14,220 $14,045 $14,295 $14,875 $15,274 $15,953Avg. Contract Balance @ Close $13,823 $10,645 $11,099 $10,721 $11,293 $11,618 $13,698 $14,358 $15,210Avg. Payment $418 $410 $413 $413 $409 $407 $413 $419 $415Weighted Avg. APR 20.3% 20.7% 21.1% 21.3% 21.2% 20.7% 20.6% 20.4% 19.9%Weighted Avg. Original Term 52 53 54 55 54 56 57 58 63Weighted Avg. Remaining Term 50 41 41 42 44 45 51 53 58Weighted Avg. Seasoning 3 12 13 12 10 11 6 5 5Weighted Avg. LTV 1.75 1.81 1.76 1.73 1.72 1.66 1.60 1.59 1.60Weighted Avg. Non-Zero CB Score 511.6 521.4 516.1 518.8 517.8 524.0 526.9 529.5 534.0Avg. Age of Vehicle 2003 2004 2004 2005 2005 2005 2005 2005 2006Avg. Mileage 58,530 64,618 66,064 67,347 69,813 75,303 80,279 82,500 82,772Avg. Base Cost of Car $7,144 $6,823 $6,809 $7,067 $6,846 $7,065 $7,459 $7,619 $8,103Avg. Total Cost of Car $8,343 $8,022 $8,180 $8,434 $8,328 $8,770 $9,391 $9,709 $10,160Grade Mix at Close (% principal)A/B 53.8% 66.5% 64.4% 63.5% 56.8% 63.0% 63.4% 63.3% 65.0%C & Below 46.2% 33.5% 35.6% 36.5% 43.2% 37.0% 36.6% 36.7% 35.0%Grade Mix 6/30/13 or Clean-Up CallA/B 68.9% 80.3% 63.4% 63.1% 55.1% 62.7% 63.8% 63.8% 64.9%C & Below 31.1% 19.7% 36.6% 36.9% 44.9% 37.3% 36.2% 36.2% 35.1%

30
Recent Securitization Information (Cont’d.) 2007A 2009-1 2010-1 2011-1 2011-2 2011-3 2012-1 2012-2 2013-1
Delinquency at CloseAvg Days Delinquent -5.0 -6.7 -4.2 -4.5 -5.1 -3.7 -6.6 -7.0 -8.9% Delinquent - Current 83.9% 84.4% 70.3% 69.3% 79.6% 67.8% 86.0% 83.3% 88.7%% Delinquent - 1-30 14.6% 15.5% 29.7% 30.7% 20.4% 32.2% 14.0% 16.7% 11.3%% Delinquent - 31+ 1.5% 0.1% 0.0% 0.0% 0.0% 0.0% 0.0% 0.0% 0.0%Delinquency 6/30/13 or Clean-Up CallAvg Days Delinquent 6.0 11.1 8.7 7.4 7.5 5.8 6.1 5.5 -6.3% Delinquent - Current 54.5% 45.0% 46.1% 48.4% 48.4% 51.0% 50.9% 51.9% 73.0%% Delinquent - 0-10 14.5% 17.2% 18.8% 18.2% 18.4% 18.3% 18.1% 18.6% 17.2%% Delinquent - 11-20 12.5% 7.8% 6.9% 6.7% 6.5% 6.7% 7.1% 6.5% 5.4%% Delinquent - 21-30 4.9% 8.9% 8.7% 8.0% 8.3% 7.9% 8.0% 7.9% 3.6%% Delinquent - 1-30 31.9% 34.0% 34.3% 32.9% 33.2% 32.9% 33.2% 33.0% 26.2%% Delinquent - 31+ 13.6% 20.6% 19.6% 18.7% 18.3% 16.0% 15.8% 15.0% 0.7%Initial Capital Structure
Class A's 72.0% 42.8% 42.5% 42.5% 49.6% 49.6% 40.4% 47.8% 37.2% Class B NA 5.7% 7.8% 8.5% 8.1% 8.1% 10.5% 8.5% 11.8% Class C NA 15.7% 12.3% 15.2% 6.5% 6.5% 6.7% 6.7% 12.0% Class D NA Retained 13.5% 10.3% 18.1% 18.1% 20.9% 19.4% 18.0%
Initial Overcollateralization 28.0% 35.8% 24.0% 23.5% 17.7% 17.7% 21.7% 17.6% 21.0%Reserve Account as a % of Original Pool 2.5% 1.0% 1.5% 1.5% 1.5% 1.5% 1.5% 1.5% 1.5%Current Capital Structure (6/30/13)
Class A 's NA NA NA 0.0% 0.0% 0.0% 0.0% 23.1% 28.6% Class B NA NA NA 0.0% 0.0% 5.7% 19.8% 13.4% 13.1% Class C NA NA NA 8.1% 0.0% 19.0% 13.1% 10.5% 13.3% Class D NA NA NA 59.1% 77.5% 52.9% 41.2% 30.6% 20.0%
Current Overcollateralization NA NA NA 32.8% 22.5% 22.5% 26.0% 22.5% 25.0%Target Overcollateralization NA NA NA 32.8% 22.5% 22.5% 26.0% 22.5% 25.0%Reserve Account as a % of Remaining NA NA NA 12.8% 9.1% 5.6% 4.0% 3.0% 2.2%Life to Date Net Charge-Offs 30.9% 16.9% 19.0% 18.3% 21.6% 19.1% 18.3% 14.6% 0.4%Remaining Pool Factor NA NA NA 17.4% 21.2% 34.2% 50.6% 63.5% 90.0%

Portfolio Performance (6/30/13)
Cumulative Net Losses by Securitization
31

SECTION 5:LEGAL & REGULATORY UPDATE
32
We Bring People and Cars Together.
Legal and Regulatory Update On March 4, 2013, Credit Acceptance Corporation (“CACC”) filed a patent infringement complaint against
DTAG, DTAC and GO in federal court in California
– CACC also filed a similar infringement lawsuit against WestLake simultaneously
– CACC alleges infringement of its U.S. Patent No. 6,950,897, entitled “System and Method for Providing Financing”
– The complaint seeks injunctive relief as well as awards of damages and attorneys' fees
– The complaint is not specific about what DriveTime is doing that infringes their patent
– At this time, DriveTime does not believe it is infringing upon CACC’s patent and will vigorously defend against these claims
– DriveTime successfully moved the case to the Federal Court in Arizona
On April 12, 2012, the Consumer Financial Protection Bureau (the “CFPB”) delivered a Civil Investigative Demand to DTAG requesting that DTAG produce certain documents and information and answer questions relating to certain components of the business of DTAG and its affiliates
– The CFPB has not alleged a violation by DTAG of any law and DTAG is cooperating with the CFPB's requests for information
– DriveTime has provided the documents and information initially requested by the CFPB
– DriveTime has also received limited requests to clarify and supplement certain information provided to the CFPB, and make three employees available for interviews
- DriveTime has provided the additional information within the agreed upon timeline, and the interviews have been conducted
33We Bring People and Cars Together.

34
DisclaimerThese materials were prepared solely for the person to whom it is transmitted, is provided for informational and discussion purposes only, and is not, and may not be relied on in any manner as legal, tax or investment advice or as an offer to sell or a solicitation of an offer to buy securities. The materials are the sole property of DriveTime. We do not guarantee or represent the accuracy of the information provided. These materials may include forecasts or other “forward looking statements.” Statements that are not based on current or historical fact, including statements about DriveTime’s beliefs or expectations are forward looking statements. Any such forward looking statements speak only as of the date they are made and reflect the current projections, expectations or beliefs of DriveTime based on information currently available to the Company. Forward looking statements involve inherent risk and uncertainties and future forecasts, events and actual results may be materially different because of risks, factors, changes and/or uncertainties, some of which we cannot predict or quantify. We have no obligation to update or revise these materials. In accepting these materials, you have agreed that they contain trade secrets and/or highly confidential information and that you will hold the information contained or referred to in confidence. Except as may be required by law, you cannot distribute these materials or the information in these materials to any other person without our written consent other than within your organization on a need to know basis and to your professional advisors.
We Bring People and Cars Together.