september 2020 building a better tomorrow
TRANSCRIPT

Building abetter tomorrowThis report provides transparency on the most relevant Environmental, Social and Governance (ESG) topics for our business.
September 2020

Table of contentsPAGE
3 IntroductionPAGE
4 Our core valuesPAGE
5 Message from the CEO on sustainabilityPAGE
7 EnvironmentalPAGE
18 Key Environmental metricsPAGE
23 SocialPAGE
33 Key social metricsPAGE
35 GovernancePAGE
40 Key governance metricsPAGE
42 Governance dashboard
2 ESG Report - September 2020

In a transitioning world, many things change. Global population growth, climate change, increased life expectancy and wealth have put pressure on our natural resources providing us with food, feed, fuel and general well-being. Now, more than ever we need to find viable ways to provide for our changing needs and those of future generations. That’s where we come in. We are the circular solution.
With our roots dating back to 1882, we never stopped refining our original beliefs that made us into a global market leader. We connect economic and ecological value to be truly sustainable.
Circular by natureToday, we serve the agri-food industry and reduce food waste by collecting and repurpos-ing animal-based co-products and other natural materials that would otherwise be discarded. We convert these into unique and valuable ingredients that fit market demands. This way we connect global supply and demand and contribute to a circular economy. We are part of the solution.
To strengthen our promise for a better tomorrow, we work tirelessly creating product applications for health, nutrients and bioenergy
while optimizing our services to the food chain. It’s this innovative focus that helps close loops and with it, support the needs of our changing world. History has proven that circular or closed loop systems are critical as we work towards long-term sustainable solutions. This is also the driving force behind our commitment and objectives as set out in our Corporate Social Responsibility program. The ESG Report you’re currently reading highlights our performance categorized under Environmental, Social and Governance.
Our purpose is to repurposeDo you want to know more about our commitment to Corporate Social Responsibili-ties and sustainability? Visit our CSR website or follow us on social media to see how we grew our foundational roots into today’s purpose: to repurpose.
EUROPE51 locationsNORTH AMERICA
135+ locations
AUSTRALIA1 location
ASIA13 locations
SOUTH AMERICA3 locations
Global headquarters in Irving, Texas, USA
Global presence
Solutions that sustain life
3 Click here to go to TABLE OF CONTENTSESG Report - September 2020

Our core valuesThe path to added valueOur core values support our vision, shape our culture, and reflect what we value as an organization. Our commitment to safer food and feed, better communities and workplaces, and cleaner air and water, tie in firmly with our core values and beliefs. These values are the foundational elements that drive all our activities, setting our path as we develop and produce sustainable solutions for a world in transition. Read our Company’s and Supplier Codes of Conduct here
Creating value with our core valuesOur core values lay the foundation for driving progress on our fourmain business pillars:
We are authentic and straightforward in reporting our goals, results and practices.
TRANSPARENCY
We operate with knowledge, passion and determination.
ENTREPRENEURSHIP
We are honest, open, ethical and fair. People trust us to adhere to our word.
INTEGRITY
Our new business pillars are designed to help navigate our customers and suppliers to our producing
brands. This will not change our Feed, Food and Fuel financial reporting segments with the SEC.
HEALTH
SERVICESBIOENERGY
NUTRIENTS
Our health pillar spans medical, pharma- and nutraceutical market propositions. It covers segments ranging from sports applications to beauty and bio-engineering.
Nutrients covers our market presence in segments that offer solutions that provide food and feed for humans, animals, plants and soil. It represents our combined market proposi tions in markets segments: Food, Savory & Meat,Pet Food, Aquafeed, Compound Feed and Fertilizer.
Split into Manufacturing and Energy, our bioenergy pillar encompasses the market segments biofuels and a broad range of various technical market segments.
Our services pillar covers all our collection, logistical and other service-oriented solutions to unburden market segments ranging from food to agri markets in specific segments as restaurants, retail, and (food) producers like slaughter houses. This also includes the collection of manure and deadstock.
4 Click here to go to TABLE OF CONTENTSESG Report - September 2020

Darling Ingredients remains committed to our vision of creating sustainable ingredients to feed and fuel a growing population…and to do so by repurposing bio-nutrients from the world’s food waste streams. Protecting the planet and the life it sustains for future generations has been part of our DNA since our founding. Sustainability and CSR are central to our business and purpose, not a sideline.
From the beginning of our long history, Darling has played a vital role in carbon emissions avoidance and critical water management. Simply put, our company’s purpose is to globally repurpose organic waste into sustainable products that improve our quality of life while minimizing our impact on the planet. What we produce is important, but so is how we produce it. We have focused our efforts on three areas that define the approach we take to addressing our environmental, social and governance (ESG) responsibilities and form the three pillars of our sustainability framework:
Cleaner air and water – combatting climate change and protecting the planet begins with stewardship--sustaining, reducing and conserving our natural resources;
Safer food and feed – producing safe ingredients is central to the company’s value proposition, making us profitable and the partner of choice to the agri-food industry to repurpose food waste;
Better workplaces and communities – keeping our workplaces and communities safe and healthy for employees and neighbors is critical to providing a rewarding environment for all people.
In 2020 we completed a company-wide water risk assessment and a detailed avoided GHG emissions study of our rendering operations through a Lifecycle Analysis (LCA). This work will help us develop a strategic roadmap for setting mid- and long-term goals meaningful to our business.
As we entered 2020 with the world facing a pandemic, our values did not change. We have raised the bar and set a standard to reduce water and energy intensity 5% by 2025 from our new baseline year of 2020. Darling’s dedicated men and women found themselves once again committed to working beyond the level of compliance. As a critical and essential service to the world’s food supply, it was important for Darling to provide a safe work environment and remain dedicated to our customers and suppliers. Our performance shows that navigating through these challenging times is second nature to our business model and family culture.
Darling’s family culture recognizes and embraces the similarities and differences in everyone, and we are committed to diversity and inclusion within our workforce, workplace andcommunities we serve.
To strengthen our promise for a better tomorrow, we work tirelessly creating product applications for health, nutrients and bioenergy while optimizing our services to the food chain. It’s this innovative spirit that led us to refresh our corporate focus to evolve and unify our corporate messaging. We add smart sustainability as the key to solutions that sustain life. I am proud of the role we play in feeding and fueling a growing population while reducing environ-mental impacts. We will continue to grow our business in a sustainable way – by bringing long-term value to all stakeholders.
Message from the Chief Executive Officer
Our purpose is to repurpose
Randall C. StueweChairman of the Board and Chief Executive Officer
5 Click here to go to TABLE OF CONTENTSESG Report - September 2020

Our commitment to build a better tomorrow for all our stakeholders is still designed around our original beliefs we embarked with in 1882: We connect economic with ecological value to make a difference. We do this wherever we can,
and where it contributes and matters most.
These intentions are also reflected on another level by the Sustainable Development Goals (SDGs) as set out by the United Nations: A universal call to action to end poverty, protect the planet and improve the lives and prospects of everyone, everywhere. That’s why we design and align our CSR objectives to specific SDGs, hand-picked for maximum contribution.
We’ve selected nine SDGs where we believe we have the greatest opportunity to contribute.Our CSR focus areas reflect our commitments and activities to these nine goals and we’ve established dedicated Expert Teams to manage progress in these areas and drive accountability.
Read more about the Sustainable Development Goals we support by visiting our website
Safer Food & FeedDelivering circular ingredients and solutions for the agri-food industry.
Better Communities & WorkplacesContributing to an economically and socially prosperous society.
Cleaner Air & WaterRespecting and utilizing natural resources to positively contribute to tackling today’s climate challenges.
Focus and commitmentwhere it matters most
6 Click here to go to TABLE OF CONTENTSESG Report - September 2020

Water is the most critical resource issue of our lifetime and our children’s lifetime.
Environmental GovernanceSocial
7 Click here to go to TABLE OF CONTENTSESG Report - September 2020
Clean air and water are vital to human and ecosystem health. They are also essential for economic prosperity. We are committed to minimizing our environmental footprint by implementing best practices and leading technologies to continuously evaluate ways of reducing our energy and water consumption and our greenhouse gas (GHG) emissions.
We are making strategic investments that contribute to the paradigm shift in the world’s long-term energy balance by producing renewable energy through repurposed animal fats, organic residuals, and the oil and grease we collect from restaurants. Our rendering business also generates more water than we withdraw – a net water positive impact - which we reuse within our processes, use for irrigation of crops or return to local watersheds.
Our environmental commitments are outlined in our Global Environment, Health & Safety Policy, which applies to employees in all locations, including our contractors. In order to manage our environmental programs in a comprehensive, systematic and documented manner, we utilize environmental management systems (EMS). These management systems help us implement our environmental policy and programs across all regions of operation. 95% of our European Rendering & Specialties operations are certified under the ISO 14001 standards.All other global locations have an EMS and/or alignment with ISO 14001. Click here for our ISO 14001 Alignment Position Paper for our North American locations, and here for a list of our certified locations.
CleanerAir & Water
Sustainabilityin action
Environmental GovernanceSocial
8 Click here to go to TABLE OF CONTENTSESG Report - September 2020 Click here to go to TABLE OF CONTENTS

In addition to our EMS which helps us manage key environmental compliance tasks, we have several established protocols for assessing Environment, Health and Safety compliance performance, including:
Self inspections conducted by individual facilities on a quarterly basis;
Periodic internal compliance assistance visits;
Compliance assessments as needed from third party consultants.
All Darling operational employees receive a combination of computer-based and hands on Environment, Health and Safety (EH&S) training upon hiring, and annually thereafter as it relates to their position and scope of responsibilities.
Our Global Sustainability Committee oversees our sustainability performance, including setting of performance targets, monitoring performance against targets, reporting on performance to the Board, and approving our annual ESG Reports for public release. Committee members are all senior level employees representing a range of business functions. In addition, sustainability metrics have been incorporated into executive level strategic, operational, and personal goals. The global environmental affairs leadership team updates the Board annually and provides a quarterly report covering certain EH&S metrics across all operations.
Environmental GovernanceSocial
9 Click here to go to TABLE OF CONTENTSESG Report - September 2020 Click here to go to TABLE OF CONTENTS

Throughout 2019 we focused on improving our baseline data so that we can be confident in our data collection processes across our global sites, and the quality of that data. We expanded the scope of our GHG emissions calculations in 2019 to be more representative of our impacts, including emissions from business travel, emissions from the upstream extraction, processing and transportation of consumed electricity and fuels (fuel- and energy-related activities), and employee commuting (Scope 3).
Our greatest opportunity to reduce our carbon footprint still lies with our direct GHG emissions, emissions that come from sources owned or controlled by Darling and are released onsite or from our fleet (Scope 1). Our comprehensive carbon footprint is provided in the Key Environmental Metrics Table and we continue to report to the CDP on our climate and water impacts.
Energy &emissionsreduction
Environmental GovernanceSocial
10 Click here to go to TABLE OF CONTENTSESG Report - September 2020 Click here to go to TABLE OF CONTENTS

Retrofitting LED lighting in six plants in 2019 alone, and 21 U.S. plants in total over the past five years saving approximately
75% in plant lighting energy costs.
Installing capacitor banks at our Grapeland, TX; Winesburg, OH; and Russellville, KY locations, which improve our electrical efficiency by 20%.Replacing the plant process condenser at our Russellville plant,
an invest ment of over $500,000
but with significant potential to reduce onsite energy use.
In 2019, we invested in several initiativesto reduce our consumption of energy, and the associated GHG emissions. A sample of those initiatives in the U.S. include:
Investing over $1M in electrical upgrades at our Boise, ID plant, and electrical rebuilds to improve efficiency at four more locations:- Denver, CO- Jackson, MS
- Lexington, NE- Newark, NJ
Upgrading boiler controls
and burners in eight locations, including: - Bastrop, TX- Hampton, FL
- Jackson, MS- Kansas City, KS
- Newark, NJ- Russellville, KY
- Tacoma, WA- Wahoo, NE
In each case the boiler efficiencies were upgraded from low 70’s to high 70’s, or in somecases, low 80’s. In addition, many of the replacement burners included lower polluting burners and flue gas recirculation that lowered emissions and increased fuel burning efficiency.
We understand that an additional key to energy conservation is having trained professionals. Each year, Darling’s Engineering Department offers a Boiler School and a CentrifugeTraining Course in North America which trained 47 and 25 operators, respectively in 2019,to equip operators with the tools and insights to properly manage and maintain thissophisticated equipment.
Environmental GovernanceSocial
11 Click here to go to TABLE OF CONTENTSESG Report - September 2020

In 2019, we conducted a feasibility analysis around what a meaningful energy use reduction target would be for Darling. Our Sustainability Committee established a target to reduce our Colla-gen/Gelatin business line’s energy intensity per unit of production and our Rendering & Specialities business lines’ per unit of raw material processed by 5% within 5 years, from our new baseline year of 2020. Several activities have been identified to help us work towards this goal and we will continue to look for innovative technologies that help us reduce energy use and associated GHG emissions.
We are excited about our new goals and look forward to establishing initiatives to drive progress on these goals.
Water and energyconservation expenditure2015-2019 (U.S.)
$ 30.14 $ 1.67
$ 0.77
Fuel56%
x 1.0
00.0
00
x 1.0
00.0
00
Electric19%
Water25%
Fuel68%
Electric32%
Total $ 53.60 Total $ 2.44
Water0%
$ 10.14$ 13.32
Energy target (set in 2020):
5% less energy consumption per unit processed by 2025Arriving at our TargetsOne of the primary steps in our sustainability process has been the creation of a baseline for key performance indicators (KPIs) to be used in the decision making process for potential reduction targets. Even though much of this data collection is still in its infancy our Global Sustainability Committee was committed to setting short term goals while at the same time being conscious of not overreaching. The result of the committee’s analysis are the 5% reduction targets in the time frame of 2020-2025. As we move forward these targets will be assessed annually for adjustment as needed and the committee will be initiating its efforts to develop more long term reduction opportunities.
“Invested in multiple heat recovery projects at European sites in 2019: Burgum (The Netherlands), Harlingen (The Nether-lands), Son (The Netherlands), Gent (Belgium), Denderleeuw (Belgium) and Osetnica (Poland), saving a total of almost 1,500 household equivalents of natural gas consumption.”
“Saving 15% of the entire yearly thermal energy consumption at our Sonac Usnice production facility in Poland, by initiating the installment of a high pressure condensate return system.”
“Increasing the renewable electricity production volume at our Ecoson Denderleeuw, Belgium bio-digester facility from 1,600 household equivalents in 2018 to 4,000 household equivalents in 2019, implying a 150% increase.”
“Increasing the boilers efficiency to a high 80% at our Sonac Burgum, The Netherlands facility by installing economizers at the steam boilers for waste heat recovery by means of boiler feed water preheating”.
Environmental GovernanceSocial
12 Click here to go to TABLE OF CONTENTSESG Report - September 2020

When thinking about potential climate impacts on our business, the primary impact is an opportunity. A key element of our business strategy is contributing to the development and expansion of low emission goods and services through a 50/50 joint venture called Diamond Green Diesel. Diamond Alternative Energy LLC, a subsidiary of Valero Energy Corporation, partnered with us in 2011 to build a renewable diesel refinery near the Valero St. Charles Refinery in Norco, LA., to process recycled animal fat, used cooking oil, and other feedstocks into renewable green diesel. For us this represented a significant move into the mass scale production of renewable green diesel.
Transportation fuels produced from biomass feedstocks can reduce GHG emissions by up to 85% compared to fossil fuel, increase energy independence and bring jobs and investment to the USA. The plant is now capable of annually converting approximately 2.3 billion pounds of waste fats and oils into more than 275 million gallons of low carbon, renewable “green” diesel. The product is compatible with petroleum-based diesel fuel as a drop-in additive and can be shipped directly into the pipeline, via rail or ocean carrier. Importantly, the fuel has a carbon lifecycle low enough to meet the most stringent low-carbon fuel standards.
Recognizing this opportunity for positive impact,
Darling set an ambitious goal to increase the amount ofrenewable green diesel that we generate through theDiamond Green Diesel Joint Venture by 150% by 2022. In addition, all North American operations have been directed to burn the highest level of blended biofuels permitted by our fleet equipment and regional seasonality in 2020.
Diamond Green Diesel IIExpansion project visualized
Our 50/50 joint venture, Diamond Green Diesel, is not included in our ESG metrics except to report on renewable diesel production at the entity level.
Diamond Green Diesel produced 275 million gallons of renewable diesel in 2019, avoiding 2.4 million MT CO2e. Renewable diesel reduces GHG emissions by up to 85% compared to traditional fossil fuels.Bioenergy production
Environmental GovernanceSocial
13 Click here to go to TABLE OF CONTENTSESG Report - September 2020

2017
2018
2019
27515
47.4 5.321,521
Energy balanceEnergy & EmissionsWe are making strategic investments that contribute to the paradigm shift in the world’s long-term energy balance by producing renewable energy through repurposed animal fats, organic residuals, and the oil and grease we collect from restaurants.(MGal)
Renewableenergy production
(MGal)
(GWh) (MNm3) (MT x 1,000)
Renewable Diesel
Biodiesel
Ecoson Renewable Electricity
Ecoson Renewable Gas
Finished ProductUsed for Biofuel
2019 Production275 mln gallons Renewable Diesel
85% CO2 reductionversus conven-tional diesel
= Heavy-duty truck71,000x around the world
= approximately450,000 cars removed from the road
2.4 million MT CO2is avoided orreduced
View data in table
Environmental GovernanceSocial
14 Click here to go to TABLE OF CONTENTSESG Report - September 2020

Bioenergy production target: 150% more renewable diesel producedby 2022 from 2019 baseline year
Environmental GovernanceSocial
15 Click here to go to TABLE OF CONTENTSESG Report - September 2020 Click here to go to TABLE OF CONTENTS

Good water quality is essential throughout the meat value chain to ensure food safety and quality. In our role of processing food industry by-products, we remove water from our raw materials and discharge that water back to the environment. As a result, our water discharges are greater than our water withdrawal values. All our water discharges are done under all applicable regulatory frameworks.
In many instances we can recycle water within our processing systems. Recycled water use within our facilities is important to minimizing our freshwater usage and will become increasingly important given the impacts of climate change on water availability and quality.
Water withdrawal and discharge
Water target (set in 2020): 5% less water withdrawal per unit processed by 2025Arriving at our TargetsOne of the primary steps in our sustainability process has been the creation of a baseline for key performance indicators (KPIs) to be used in the decision making process for potential reduction targets. Even though much of this data collection is still in its infancy our Global Sustainability Committee was committed to setting short term goals while at the same time being conscious of not overreaching. The result of the committee’s analysis are the 5% reduction targets in the time frame of 2020-2025. As we move forward these targets will be assessed annually for adjustment as needed and the committee will be initiating its efforts to develop more long term reduction opportunities.
Environmental GovernanceSocial
16 Click here to go to TABLE OF CONTENTSESG Report - September 2020 Click here to go to TABLE OF CONTENTS

This figure outlines the rendering process and illustrates how nothing is wasted. From the collected raw material all the fat and protein is recovered and sold as ingredients for feed, food, fuel, and fertilizer. The water removed from the raw material is captured, treated, and either reused in the process which can include evaporation of the water, used for crop irrigation, or discharged to municipalities or surface water. There are no wastes generated which require disposal.
Raw Materials
Receivingand Sizing
ContinuousCooker
Separator
Press
protein mealStorage/Sale
SettlingTank
fat Storage/Sale
Centrifuge
Condenser
Recovered
water for Repurposing
Fat/Protein
Water Vapor
Protein
Solids
Solids
Fat
Fat
In 2020, we embarked on an effort to analyze all of our operations for potential water risks, and identify activities that withdraw and consume water in locations with High (40–80 percent) or Extremely High (>80 percent) Baseline Water Stress as classified by the World Resources Institute’s (WRI) Water Risk Atlas tool, Aqueduct.
Our Global Sustainability Committee established targets to reduce our water intensity by 5% by 2025, from our new baseline year of 2020 in both our Collagen/Gelatin business line and our Rendering & Specialities lines of business.
We look forward to monitoring, and reporting on our progress, towards our new environmental goals.
Turning wastewater into a valuable resource“Wastewater is the most common by-product generated at our company’s processing facilities, and our Rousselot facility in Gerona (Spain) is no exception. The wastewater from the Gerona plant is generated through processes that are specific to this location, and the wastewater produced has its own unique properties. Having an abundance of ammonium and phosphate, we have implemented an innovative method to turn this difficult-to-treat wastewater into a sustainable resource for fertilizers. The process makes use of nutrients present in the wastewater, and the three parallel batch reactors can produce five tons of struvite (a slow release fertilizer) per day.”
Operations Manager - Rousselot Gerona
The Rendering process:
Avoiding GHG & Replenishing water
Gerona, Spain
Environmental GovernanceSocial
17 Click here to go to TABLE OF CONTENTSESG Report - September 2020

TOPIC KEY PERFORMANCE INDICATOR GRI STANDARD SASB STANDARD PERFORMANCE
ENERGY & EMISSIONS 2017 2018 2019
ENERGY CONSUMPTION
Total Amount of Direct Energy Consumed (Excluding Fleet Vehicles) (GJ)
GRI 302-1 FB-AG-130a.1 22,852,842 26,791,197 26,414,722
Total Amount of Indirect Energy Consumed (GJ) GRI 302-2 FB-AG-130a.1 3,413,376 3,344,678 3,384,771
Percentage of energy consumed (excluding fleet vehicles) that was supplied from grid electricity (%)
GRI 302-1 FB-AG-130a.1 11.7% 11.7% 11.4%
Percentage of energy consumed (excluding fleet vehicles) that is renewable energy (%)
GRI 302-1 FB-AG-130a.1 5.3% 7.5% 7.0%
Total Fleet Fuel Consumed – Non-Renewable (GJ) GRI 302-2 FB-AG-110a.3 112,993 1,614,811 1,834,291
Rendering & Specialties Energy Intensity Per Unit of Raw Material (GJ/100lb) GRI 302-3 0.119 0.132 0.129
Collagen/Gelatin Energy Intensity Per Unit of Production (GJ/100lb) GRI 302-3 3.582 4.285 4.157
GREENHOUSE GAS (GHG) EMISSIONS
Scope 1 GHG Emissions (tCO2e/year)1 GRI 305-1 FB-AG-110a.1 1,311,270 1,424,018 1,433,089
Scope 2 GHG Emissions – Market Based (tCO2e/year)2 GRI 305-2 446,114 401,690 413,432
Scope 2 GHG Emissions – Location Based (tCO2e/year)2 GRI 305-2 404,065 364,823 365,486
Scope 3 GHG Emissions – (tCO2e/year)3 GRI 305-3 24,405 18,584 28,404
Rendering & Specialties GHG Emissions Intensity (tCO2e/MT raw material)4 GRI 305-4 0.171 0.173 0.172
Collagen/Gelatin GHG Emissions Intensity (tCO2e/MT finished product) GRI 305-4 5.157 5.608 5.531
2019 Darling’s Total Carbon Footprint = 1,826,979 tCO2e (tons of carbon dioxide equivalent)Total Carbon Footprint includes Scope 1, Scope 2 (location based) + Scope 3 emissions.This term is very general and does not always compare between companies.
Environmental GovernanceSocial
18 Click here to go to TABLE OF CONTENTSESG Report - September 2020

TOPIC KEY PERFORMANCE INDICATOR GRI STANDARD SASB STANDARD PERFORMANCE
ENERGY & EMISSIONS 2017 2018 2019
RENEWABLEENERGY PRODUCTION
Renewable Diesel (MGal) 161 163 275
Renewable Diesel (1000m3) 610 616 1,040
Biodiesel (MGal) 15 14 15
Biodiesel (1000m3) 59 54 55
Ecoson Renewable Electricity (GWh) 36.2 36.1 47.4
Ecoson Renewable Gas (MNm3) 5.04 4.96 5.32
Finished Product Used for Bioenergy (MT)5 1,047,050 1,126,146 1,521,171
The renewable diesel production includes the total Diamond Green Diesel 50/50 joint venture entity level production amount.
Environmental GovernanceSocial
19 Click here to go to TABLE OF CONTENTSESG Report - September 2020

TOPIC KEY PERFORMANCE INDICATOR GRI STANDARD SASB STANDARD PERFORMANCE
WATER 2017 2018 2019
WATERWITHDRAWAL
Total Water Withdrawal from All Sources (MGal)
GRI 303-3 FB-MP-140a.1
8,815 9,006 9,389
Total Water Purchased from Third Parties (MGal) 1,380
Total Fresh Surface Water (MGal) 3,962
Total Groundwater (MGal) 4,047
Total Water Withdrawal: Business Others (MGal) 55 69 70
Total Water Withdrawal: Rendering & Specialties (MGal) 1,760 1,846 1,955
Total Water Withdrawal: Collagen/Gelatin (MGal) 7,000 7,090 7,363
Total Water Withdrawal from All Sources (1000m3) 33,369 34,090 35,541
Total Water Purchased from Third Parties (1000m3) 5,226
Total Fresh Surface Water (1000m3) 14,996
Total Groundwater (1000m3) 15,319
Total Water Withdrawal: Business Others (1000m3) 208 262 267
Total Water Withdrawal: Rendering & Specialties (1000m3) 6,661 6,988 7,401
Total Water Withdrawal: Collagen/Gelatin (1000m3) 26,500 26,840 27,874
Rendering & Specialties Water Intensity (Gal/lb raw material) 0.079 0.081 0.085
Collagen/Gelatin Water Intensity (Gal/lb finished product) 9.546 10.082 10.271
Global Water Intensity (Gal/lb raw material) 0.376 0.374 0.384
Environmental GovernanceSocial
20 Click here to go to TABLE OF CONTENTSESG Report - September 2020

TOPIC KEY PERFORMANCE INDICATOR GRI STANDARD SASB STANDARD PERFORMANCE
WATER 2017 2018 2019
WATER STRESSANALYSIS6
% of Water Withdrawn from Areas with Water Stress
GRI 303-3 FB-AG-140a.1
8.8%
Withdrawal from Areas with Water Stress: Fresh Surface Water (MGal)
400
Withdrawal from Areas with Water Stress: Groundwater (MGal) 169
Withdrawal from Areas with Water Stress: Water Purchased from Third Parties (MGal)
255
Withdrawal from Areas with Water Stress: Fresh Surface Water (1000m3)
1,514
Withdrawal from Areas with Water Stress: Groundwater (1000m3) 640
Withdrawal from Areas with Water Stress: Water Purchased from Third Parties (1000m3)
965
WATERCONTRIBUTION7
Total Water Contributed from Raw Materials (MGal) 1,490 1,569 1,611
Total Water Contributed from Rendering & Specialties (MGal) 1,420 1,499 1,539
Total Water Contributed from Collagen/Gelatin (MGal) 70 70 72
Total Water Contributed from Raw Materials (1000m3) 5,640 5,940 6,098
Total Water Contributed from Rendering & Specialties (1000m3) 5,376 5,675 5,827
Total Water Contributed from Collagen/Gelatin (1000m3) 265 265 271
Environmental GovernanceSocial
21 Click here to go to TABLE OF CONTENTSESG Report - September 2020

TOPIC KEY PERFORMANCE INDICATOR GRI STANDARD SASB STANDARD PERFORMANCE
WATER 2017 2018 2019
WATER DISCHARGE8
Total Water Discharged (MGal)
GRI 303-4
10,305 10,575 11,000
Total Rendering & Specialties Water Discharged (MGal) 3,180 3,345 3,494
Total Collagen/Gelatin Water Discharged (MGal) 7,070 7,160 7,435
Total Water Discharged (1000m3) 39,009 40,030 41,639
Total Rendering & Specialties Water Discharged (1000m3) 12,037 12,663 13,227
Total Collagen/Gelatin Water Discharged (1000m3) 26,764 27,105 28,145
RESTATEMENTS OF DATAIt is important to note that we restated a few environmental data points this year based on new and improved ways of measuring and collecting data throughout the global business. Some numbers were also adjusted slightly to improve the consistency with how data is rounded.
BOOKMARKS: ENVIRONMENTAL PERFORMANCE 1. Our scope includes the following GHGs: CO2, CH4, N20 and HFCs. We use emission factors from the US
Environmental Protection Agency and the International Energy Agency, global warming potential (GWP) factors from the Intergovernmental Panel on Climate Change (IPCC) Fifth Assessment Report (2014), and methodolo-gies outlined in the Greenhouse Gas Protocol: A Corporate Accounting and Reporting Standard.
2. A location-based method reflects the average emissions intensity of grids on which energy consumption occurs (using mostly grid-average emission factors). A market-based method reflects emissions from electricity that companies have purposefully chosen.
3. Our Scope 3 GHG Emissions calculations for 2019 only include 3 upstream categories at this time: business travel, emissions from the upstream extraction which includes processing and transportation of consumed electricity and fuels (fuel- and energy-related activities), and employee commuting. For 2018, Scope 3 emissions include only fuel- and energy-related activities and employee commuting. For 2017, Scope 3 emissions include only fuel-and energy-related activities.
4. Raw materials (animal by-products, bakery residuals, and used cooking oil’s) GHG emissions included in the intensity ratio include direct (Scope 1) and indirect (Scope 2) emissions and include the following gases: CO2, CH4, N20 and HFCs.
5. Materials being transformed into renewable energy include our own animal fats, animal meals and used cooking oils.
6. Water Stress Analysis using Aqueduct Water Risk Atlas
7. Water contribution refers to the water that we remove and collect from our raw material. This water is captured, treated, and either reused in the process which can include evaporation of the water, used for crop irrigation, or discharged in municipalities or surface water. All of these require varying levels of treatment prior to discharge and meet required regulations.
8 We estimate water discharge as being equal to water withdrawals (freshwater) plus water contribution (removed from raw materials). Water consumption is not factored into this estimate.
Environmental GovernanceSocial
22 Click here to go to TABLE OF CONTENTSESG Report - September 2020

Education is a key driver for safe products and socioeconomic mobility
Environmental Social Governance
23 Click here to go to TABLE OF CONTENTSESG Report - September 2020

Safer Food & Feed
Better Communities& Workplaces
SocialperformanceWe are committed to providing a safe and healthy workplace for our employees, and safe food and feed for our customers. The foundations for our product safety and quality are built on strict policies and the highest standards. This is one of the ways in which our commitment to continuous improvement is safeguarded.
We are also keenly aware that our people are fundamental to the ongoing success of our business. We are committed to building a culture and working environment that is inclusive and respectful for all, and where our employees can do their best work and feel valued for their contributions.
Finally, we also give back by investing in the environmental, health, educational and cultural goals of the communities where we operate. Together, with our employees and local community partners, we identify areas of greatest need where we can lend our support and leave a positive impact on our environment. We pride ourselves in being a great place to work and a great neighbor in our global communities. Visit our CSR website for more information.
Environmental Social Governance
24 Click here to go to TABLE OF CONTENTSESG Report - September 2020

Health & safetyAlong with our environmental commitments, our health and safety obligations are outlined in our Global Environment, Health & Safety Policy. Accountability for our health and safety (H&S) performance rests at the highest level of the organization, as it is managed by our operational senior Executive Vice Presidents, who report directly to the Chairman and Chief Executive Officer.
We prioritize regular Health, Safety and Environment training for employees during their onboarding, and annually thereafter as it relates to their position and scope of responsibilities. Our Life Saving Rules program also aims to keep safety awareness and education top of mind for our global employees. Safety target
5% continuous improvement over last 5-year average
Environmental Social Governance
25 Click here to go to TABLE OF CONTENTSESG Report - September 2020 Click here to go to TABLE OF CONTENTS

Darling’s International division developed the Life Saving Rules program in 2015, a set of 8 rules that identify Health & Safety risks in our workplace, outline control measures to mitigate that risk, and outline best practices to ensure everyone is protected. Due to the positive feedback and outcomes associated with this program in Europe, our North American locations implemented the same program in 2019. Employees at each location were trained on all 8 Life Saving Rules, and any new employee onboarding into Darling is also trained. Ongoing education related to the life saving rules happens monthly, conducted by each location’s supervisor.
Work with a valid work permit
Obtain authorization before overriding or
disabbling safety critical equipment
No drugs and alcohol.Only smoke in
designated areas
Never enter a confined space without authorization
Protect yourself against a fall when working at height
Be aware of powered
vehicles
Only work on isolated equipment
(apply LOTOTO)
Do not walk under a crane or suspended load
Keep it safe, respect our Life Saving Rules
Environmental Social Governance
26 Click here to go to TABLE OF CONTENTSESG Report - September 2020

We set continual improvement targets for key H&S metrics - Total Recordable Injury Rate (TRIR), Lost Time Accident Rate (LTAR), Lost Days Rate (LDR), and Fleet Rate (FR) – by applying a 5% improvement over the last 5-year average. Performance on these KPIs is tied directly to executive strategic, operational, and personal objectives, which demonstrates how seriously we take our commitments in this area.
We were pleased to see a reduction in our TRIR and LTAR from 2018-2019 which we believe is due in part to an increased focus on our Life Saving Rules program.
Environmental Social Governance
27 Click here to go to TABLE OF CONTENTSESG Report - September 2020

Our response to the COVID-19 pandemicWhile this pandemic started in 2020, we feel it is important to share how we responded to protect the health and safety of our employees. Their well-being is our top priority. We were designated to be an essential service business, and as such, acted quickly and mobilized safety protocols across our global operations to protect our employees, serve our customers, and ensure business continuity.
We are extremely appreciative of the consistent efforts of all of our employees to continue to come to work, enabling us to operate effectively in support of the global food chain. We also continued to work to get food to the people who need it most in our local communities. We donated to Food for the Soul, an organization that is fighting childhood hunger, with both cash donations and gift cards for food to keep our local restaurant industry thriving and providing jobs. Darling also made donations to the Irving School Foundation, the Family Resource and Youth Service Center Coordinators in Falmouth, KY and the Ronald McDonald House, all of which are focused in feeding children and their families in this time of heightened social isolation.
All Darling U.S. employees are provided access to a 24/7 free and confidential Employee Assistance Program (EAP) through Lincoln Employee Connect Program. We also provide free virtual visits with a doctor or therapist 24/7/365 through Blue Cross and Blue Shield of Texas.
Examples of the protocols implemented, include: • Created a global communications strategy and launched a new app called
Darling Connect to keep employees updated
• Implemented additional hygiene measures, face covering and social distancing protocols
• Initiated remote work strategy for employees not essential to factory operations
• Restricted domestic and international travel for business-essential purposes and implemented virtual meeting protocols
• Limited visitors to all of our facilities to essential personnel only
• Followed detailed guidelines for facility access pertaining to third party vendors, contractors, outside haulers
• Increased frequency and intensity of disinfecting in all high-touch areas
• Implemented increased disinfecting procedures for production facilities, offices and company fleet
• Implemented staggered shifts, lunches and breaks in our factory operations where applicable
• Established protocols in the event of a confirmed COVID-19 diagnosis or contact with confirmed positive
• Published weekly updates following city, state, and/or county guidelines as applicable
• Introduced premium pay where appropriate to recognize the tremendous efforts our hourly workforce made to come to work each day as essential workers; and showed flexibility by accomodating employees with unique or challenging circumstances at home
Environmental Social Governance
28 Click here to go to TABLE OF CONTENTSESG Report - September 2020

I believe the Darling Leadership Academy is a great recent addition to the Company! “I enjoyed the opportunity to hear from experts across all departments giving their insights and expectations for the future of Darling and how we could best meet them as new leaders. They shared management tools and industry guidance to help us be successful. This training program reflects how much Darling cares about its employees succeeding, and this makes the difference between this being a career verses a job.”
Anjanette HernandezNorth American Railroad Fleet Manager
Anjanette Hernandez
Employee training & developmentWe recognize that our employees value development opportunities on the job, and through access to ongoing internal and external training opportunities. We want our people to see Darling as a great place to learn and grow, and we emphasize internal promotion where possible. To facilitate this ongoing growth and development, we’ve put several initiatives in place:
Leadership training for emerging leaders: Through the Darling Leadership Academy (new in 2018), Darling University, and Darling Involve International Leadership Training, we provide multi day, immersive leadership training to help equip and further develop employee skills and expertise in order to lead our business effectively in the future.
Goal setting and personal development:All management employees work closely with their supervisors each year to set annual personal objectives, formulate development plans, and receive feedback on their performance through regular performance reviews.
Environmental Social Governance
29 Click here to go to TABLE OF CONTENTSESG Report - September 2020
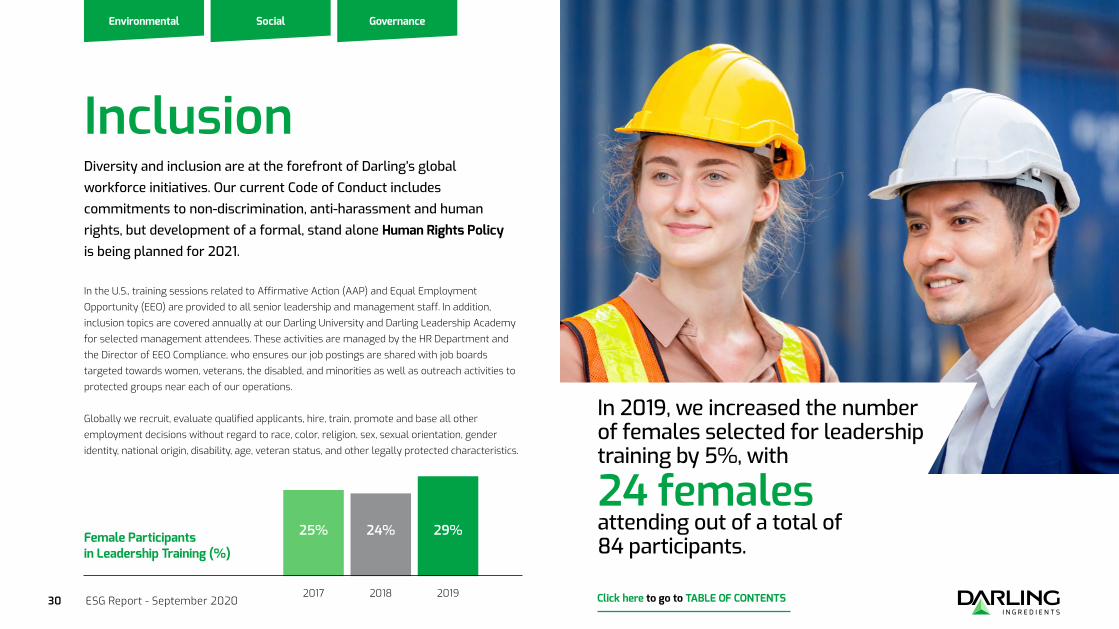
Diversity and inclusion are at the forefront of Darling’s global workforce initiatives. Our current Code of Conduct includes commitments to non-discrimination, anti-harassment and human rights, but development of a formal, stand alone Human Rights Policy is being planned for 2021.
In the U.S., training sessions related to Affirmative Action (AAP) and Equal Employment Opportunity (EEO) are provided to all senior leadership and management staff. In addition, inclusion topics are covered annually at our Darling University and Darling Leadership Academy for selected management attendees. These activities are managed by the HR Department and the Director of EEO Compliance, who ensures our job postings are shared with job boards targeted towards women, veterans, the disabled, and minorities as well as outreach activities to protected groups near each of our operations.
Globally we recruit, evaluate qualified applicants, hire, train, promote and base all other employment decisions without regard to race, color, religion, sex, sexual orientation, gender identity, national origin, disability, age, veteran status, and other legally protected characteristics.
Inclusion
In 2019, we increased the number of females selected for leadership training by 5%, with
24 females attending out of a total of 84 participants.Female Participants
in Leadership Training (%)
25% 24% 29%
2017 2018 2019
Environmental Social Governance
30 Click here to go to TABLE OF CONTENTSESG Report - September 2020

At Darling Ingredients, product safety and quality are fundamental to creating sustainable pharmaceutical, food, feed and fuel ingredients and are supported by our three core values: integrity, transparency and entrepreneurship.
Management’s commitment to product safety and quality is demonstrated by our ongoing investment in our people, programs, and infrastructure. All locations train employees at least annually on product safety using training modules available on internal platforms that are accessible to individual employees. Such training is mandatory, and the modules are developed from the food safety procedures laid down in prerequisite programs to Hazard Analysis Risk Based Preventive Controls (HARPC) for the U.S., and Hazard Analysis Critical Control Point (HACCP) plans for our international business units. Prerequisite programs for HARPC are Current Good Manufacturing Practices (CGMPs) and for HACCP are Good Manufacturing Practices (GMPs).
Each production site is also required to have a business continuity plan and a recall plan. These were recently updated to include pandemics as well as extreme weather events including
fires, and floods. Facilities are required to test their emergency response plan by conducting at least one mock recall exercise each year, and facilities undergo regular inspections by customers, authorities third-party certification bodies and internal audit.
Risk assessments to identify hazards to be controlled are an essential part of HARPC/HACCP plans and required in the U.S. under the Food Safety Modernization Act, and in the international sites by the National authorities. Each Darling facility has one or more HARPC/HACCP plan with one or more preventive control/critical control point validated to control or prevent hazards identified in the hazard analysis/risk assessment as needing to be controlled or prevented. Such risk-based hazard analyses are science and experience based and are reviewed on an annual basis or at every change in the process.
Monitoring of product safety performance is documented as specified by our written CGMPs/GMPs and verified by third party certifications, as well as customer, authority and internal audits.
Product safety & quality
Environmental Social Governance
31 Click here to go to TABLE OF CONTENTSESG Report - September 2020

As a global company that manufactures ingredients and products for a broad range of markets that expand from Health, Nutrients, Bioenergy and services; we have the responsibility to ensure consistent, high-quality, and above all, safe products.
All customer complaints are investigated, and the root cause is determined with corrective and preventive actions taken. The same applies if there is a non-conformity found during a third party or internal audit. Corrective/preventive actions are documented on corresponding forms and discussed during management reviews.
Our product and service quality and safety standards are tested, and validated, regularly through a robust cadence of internal and external audits. These audits provide important check and balances that give customers confidence in consistent product quality and internal policies and procedures. In 2019, 1,055 total audits were conducted across our global business with the following breakdown:
• 16% conducted as part of third party certification audits,
• 23% conducted through regulatory inspections,
• 16% conducted as part of customer audits, and
• 45% through our internal audit process.
We are not able to receive any third party certifications until any deficiencies found during the certification audit are corrected and the modified action accepted by the certifying body.
Incident investigation and corrective action
Environmental Social Governance
32 Click here to go to TABLE OF CONTENTSESG Report - September 2020

TOPIC KEY PERFORMANCE INDICATOR GRI STANDARD SASB STANDARD PERFORMANCE
DIVERSITY & INCLUSION 2017 2018 2019
Gender Diversity Females in NA Workforce (%)
GRI 102-811.43 12.01 12.44
Males in NA Workforce (%) 88.57 87.99 87.56
EMPLOYEE TRAINING & DEVELOPMENTPerformance Reviews & Feedback
Employees receiving regular performance and career development reviews (%)
GRI 404-3 100 100 100
Leadership Development1
Leadership Development Training (total hours) GRI 404-2 1,984 2,664 3,008
Leadership Development Training (total participants) GRI 404-2 52 88 84
Female Participants in Leadership Training (%) GRI 404-2 25 24 29
Turnover Voluntary Turnover (%)2 GRI 401-1 18.2 19.9 17.7
Key social metrics
BOOKMARKS: SOCIAL PERFORMANCE 1. Leadership development training initiatives include annual enrollment for Darling University,
Darling Leadership Academy and Darling Involve International Leadership Training.
2. This data is only collected in the U.S.A.
Environmental Social Governance
33 Click here to go to TABLE OF CONTENTSESG Report - September 2020

RESTATEMENTS OF DATAIt is important to note that we restated a few social data points this year based on new and improved ways of measuring and collecting data throughout the global business.
BOOKMARKS: SOCIAL PERFORMANCE 3. Systems include Darling’s Injury and Illness Prevention Program for North America, and our
Safety Management System at all our international sites which includes contracted employees.
4. Annual H&S goals are calculated by taking the most recent 5-year average per goal and reducing it by 5%. All plant employees are required to participate in annual H&S training.
5. TRIR is only recorded in North America. Performance includes all Full Time (FT) and Part Time (PT) employees.
6. Fleet Rate (FR) calculation is # of on-road accidents per 100,000 miles.
7. In 2018, all U.S.-based Darling Ingredients sites were audited at minimum to the FSC36 scheme. A selection of sites were upgraded and audited to the GFSI benchmarked FSC34 standard. The feed-producing locations outside the U.S. are audited at GMP+ standard, a certificate that is required to allow supply to feed producers in Europe. All food-producing companies of Darling Ingredients have certificates for the GFSI accredited systems FSSC22000, IFS or BRC. We must re-certify each year through rigorous audits.
TOPIC KEY PERFORMANCE INDICATOR GRI STANDARD SASB STANDARD PERFORMANCE
EMPLOYEE HEALTH & SAFETY 2017 2018 2019
H&S Management SystemWorkers covered by an occupational health and safety management system3 (%)
GRI 403-8 100% 100% 100%
Total Recordable Injury Rate (TRIR)
TRIR Annual Goal4
GRI 403-9 FB-AG-320a.1
6.5 6.4 6.4
TRIR Performance - NA only5 6.6 6.7 5.9
Lost Time Accident Rate(LTAR)
LTAR Annual Goal 2.1 2.0 2.0
LTAR Performance 1.5 1.7 1.4
Lost Days Rate (LDR)LDR Annual Goal 54 48 46
LDR Performance 40 44 45
Fleet Rate (FR)FR Annual Goal .08 .08 .07
FR Performance6 .07 .06 .11
FOOD/ FEED SAFETY
Food/ Feed Safety
Locations carrying highest attainable level of food/ feed certifications for the standards on which they operate (%)7 GRI 416-1
35% 41% 40%
Compliance rates derived from customer complaints 99.21% 99.44% 99.15%
Environmental Social Governance
34 Click here to go to TABLE OF CONTENTSESG Report - September 2020

Equal opportunities and balanced leadership arethe basis for sustainable business models
Environmental Social Governance
35 Click here to go to TABLE OF CONTENTSESG Report - September 2020

Environmental Social Governance
36 Click here to go to TABLE OF CONTENTSESG Report - September 2020
Our corporate governance is anchored at the board level through vigilant and proactive oversight of financial, compliance and reputatio-nal risks, including environmental, social, and governance (ESG) risks. Darling’s CEO and Executive Leadership Team, reporting to the Board of Directors, are responsible for the day-to-day conduct of the Company’s business, including ESG aspects.
Since our founding in 1882, we have attracted and built a strong, qualified board of directors who have expertise relevant to our business, are diverse in background, and have strong ethics and integrity. The appointment of a fourth woman as a Director in 2018 not only brought unique and strategic insights related to sustainable agricultural solutions to our board, but it increased our diversity to 36% female, which is notable for our industry.
Key corporate governance policies and practices are available on our Governance website. These are reviewed and updated regularly to maintain best practice and adapt to the changing needs of the business.
Governanceperformance - actingwith integrity

Environmental Social Governance
37 Click here to go to TABLE OF CONTENTSESG Report - September 2020
Business integrity, ethics, and compliance have been part of the foundation of Darling’s success and ongoing growth. We strive to conduct our business in accordance with applicable laws and regulations of the relevant jurisdictions we operate in. Our Code of Business Conduct emphasis our values and defines our expectations for ethical behavior of our employees, officers and non-employee directors.
The reinforcement of our Code is provided through on-line training to all Darling employees.In addition to our Code training, Darling provides training on other laws and regulations such as anti-corruption and anti-money laundering. Darling promotes ethical behavior and maintains an open-door approach that encourages employees to talk to supervisors, managers, their human resources business partner, the confidential hotline, or the Chief Compliance Officer when in doubt about the best course of action in any situation. We do not tolerate any form of retaliation for filing a complaint in good faith, or for providing information for an investigation.
We adopted a Supplier Code of Conduct in 2020 which outlines our expectations of suppliers and sets minimum standards in the areas of ethical behavior, environmental, health and safety practices, and labor and human rights standards. We expect to engage with our supply partners with a broad communications strategy throughout 2020 and 2021.
Ethics

Environmental Social Governance
38 Click here to go to TABLE OF CONTENTSESG Report - September 2020
The Board recognizes the importance of maintaining the trust and confidence of our various stakeholders. To more effectively prevent, detect, and respond to information security threats, our company has a dedicated Director of Global Cybersecurity whose IT Compliance Team is responsible for leading enterprise-wide security strategy, policy, standards, architecture and processes. The Board receives regular reports from the Chief Administrative Officer and Chief Information Officer on, among other things, our company’s cyber risks and threats, the status of projects to strength our information security systems, assessments of our company’s cybersecurity program and the emerging threats in this area.
Our attention to cybersecurity starts with our policies and practices governing enterprise-wide security controls. Our employees are regularly trained, and policies and procedures are assessed regularly by our internal auditors as well as third-party consultants. Incidents are handled by established procedures as spelled out in the Computer Incident Response Plan. Global Cybersecurity undergoes annual reviews by both external and internal audit teams and the results of these audits are reported to the Board.
Cybersecurity oversightDarling Ingredients has formally adopted the National Institute of Standards and Technology (NIST) Cybersecurity Framework (CSF) to plan, structure, test, and measure our cybersecurity controls and we actively participate in cybersecurity policy engagements with governments, industry consortia, and academia to ensure we stay abreast of emerging developments and maintain best-in-breed cybersecurity practices.
We actively foster security-minded behavior and a culture of security with our employees, suppliers, and customers. As part of that culture, all employees who access computers are required to attend annual Cybersecurity Computer-Based Training (CBT). Employees are required to annually acknowledge receipt of Darling’s Information Security Policy for End Users and are regularly “phished” to reinforce their understanding and awareness of phishing scams. The Global Cybersecurity team posts regular security-related articles on Darling Connect, the app that we use to share information and updates with employees on ESG topics.
In 2019 we had no leaks,thefts or losses of customer data

Environmental Social Governance
39 Click here to go to TABLE OF CONTENTSESG Report - September 2020
Privacy and data security are one of our primary concerns and any personal data that customers, suppliers or employees provide, is handled with the utmost care.
Darling Ingredients observes a strict duty of confidentiality about the use of personal informa-tion and adheres to a set of data privacy principles documented in our Privacy Policy, which is reviewed and updated regularly for compliance with relevant laws and regulations. We have taken appropriate technical and organizational security measures in order to help ensure the security, integrity and privacy of all personal information collected, and to protect personal data against loss, misuse, alteration and/or destruction.
Darling Ingredients does not sell personal information to third parties.
Employees are encouraged to reach out to the Chief Compliance Officer directly whenever they have questions and customers are encouraged to contact us with any questions about our Privacy Policy at: [email protected].
Customer privacy

Key governance metrics:TOPIC KEY PERFORMANCE INDICATOR GRI STANDARD SASB STANDARD PERFORMANCE
GOVERNANCE 2017 2018 2019
CompensationSay on Pay (% votes cast in favor of advisory vote to approve executive compensation)
GRI 102-36 98.6 97.1 97.7
Board Election Frequency Annual Election of Directors Yes Yes Yes
Board LeadershipIndependent Chair No No No
Independent Lead Director Yes Yes Yes
Board Composition - Tenure Average tenure of members of the Board of Directors (Years) 5.1 5.0 5.0
Board Composition - Independence Independent Directors (%) 80 82 82
Board Skills
Directors with risk expertise1 (%) 100 100 100
Directors with financial expertise (%) 50 55 55
Directors with directly relevant industry expertise (%) 40 45 45
Gender Diversity in Governance Bodies
Women in Officer Roles2 (%) GRI 405-1 15 14 14
Women on the Board (%) GRI 405-1 30 36 36
Environmental Social Governance
40 Click here to go to TABLE OF CONTENTSESG Report - September 2020

BOOKMARKS: GOVERNANCE PERFORMANCE 1. Each of our directors has extensive risk management experience having held senior executive
positions in their respective industries.
2. Officer roles include Executive Vice President (EVP), Senior Vice President (SVP) and Vice President (VP) level. The total number of officer roles increased from 26 in 2017, 28 in 2018 and 31 in 2019.
3. We have different toll-free hotlines available in each country of operation.
TOPIC KEY PERFORMANCE INDICATOR GRI STANDARD SASB STANDARD PERFORMANCE
COMPLIANCE 2017 2018 2019
Compliance Significant fines or monetary sanctions GRI 419-1 0 0 0
CYBERSECURITY 2017 2018 2019
Data breaches Identified leaks, thefts, or losses of customer data (#) GRI 418-1 0 0 0
ETHICS & ANTI-CORRUPTION 2017 2018 2019
EthicsEmployees with access to 24/7 confidential, independent hotline for reporting concerns or asking questions about the Code and respective policies (%)3
GRI 102-17 100 100 100
Environmental Social Governance
41 Click here to go to TABLE OF CONTENTSESG Report - September 2020

Founded
1882Chicago, Illinois
Net Sales 2019 (USD)
$3,363,905,000
Locations in
17Countries
Global Employees
10,100As of December 29, 2019
Gender Diversity Workforce, as of YE2019 (North America)
Ethnic Diversityas of YE2019 (U.S. only)
66%14%
17%
12%88%North America
135+ locations
Europe
51 locations
South America
3 locations
Asia
13 locations
Australia
1 location
White
Black
Hispanic
Asian
American Indian
Native Hawaiian
Two or More
Male Female
Darling Ingredients
At a Glance
Environmental Social Governance
42 Click here to go to TABLE OF CONTENTSESG Report - September 2020
You can learn more about what we do, and how we do it, in our 2019 Annual Report and on our website. If you have any questions about our sustainability policies and practices, please contact: [email protected].
The futureof our planet and that of our children’s depends onour ability to find viable ways to providefor our population’s changing needs