september 2021 quarterly webinar - uploads-ssl.webflow.com
TRANSCRIPT

September 2021 Quarterly Webinar
2021
FOR WHOLESALE INVESTORS ONLY. The views expressed here are part of a wider portfolio investment strategy and should not be considered in isolation.
Own the world’s best businesses.
People Philosophy & Process
PortfolioConstruction
Performance

This document has been prepared by Claremont Funds Management Pty Ltd (Investment Manager) (ACN 649 280 142, ABN 38 649 280 142, CAR No. 001289207), as investment manager for the Claremont Global Fund (ARSN 166 708 792) and Claremont Global Fund (Hedged) (ARSN 166 708 407), which are together referred to as the ‘Funds’. Equity Trustees Limited (ACN 004 031 298, AFSL 240957) (“Equity Trustees”) is the Responsible Entity of the Funds. For further information on the Funds please refer to each Fund’s PDS which is available at www.claremontglobal.com.au. This document may contain general advice. Any general advice provided has been prepared without taking into account your objectives, financial situation or needs. Before acting on the advice, you should consider the appropriateness of the advice with regard to your objectives, financial situation and needs. Past performance is not a reliable indicator of future performance. Future performance and return of capital is not guaranteed.
This document may contain statements, opinions, projections, forecasts and other material (forward-looking statements), based on various assumptions. Those assumptions may or may not prove to be correct. The Investment Manager and its advisers (including all of their respective directors, consultants and/or employees, related bodies corporate and the directors, shareholders, managers, employees or agents of them) (Parties) do not make any representation as to the accuracy or likelihood of fulfilment of the forward-looking statements or any of the assumptions upon which they are based. Actual results, performance or achievements may vary materially from any projections and forward-looking statements and the assumptions on which those statements are based. Readers are cautioned not to place undue reliance on forward-looking statements and the Parties assume no obligation to update that information. The Parties give no warranty, representation or guarantee as to the accuracy, completeness or reliability of the information contained in this report. The Parties do not accept, except to the extent permitted by law, responsibility for any loss, claim, damages, costs or expenses arising out of, or in connection with, the information contained in this report. Any recipient of this document should independently satisfy themselves as to the accuracy of all information contained in this report. All figures in AUD unless otherwise stated. Claremont Funds Management Pty Ltd is a wholly owned subsidiary of E&P Financial Group Limited (ABN 54 609 913 457), a signatory to the United Nations Principles for Responsible Investment (UNPRI).
Disclaimer

People
People

4
Investor Portfolio
FOR WHOLESALE INVESTORS ONLY
Industry experience Firm experience Previous firm(s)
Bob Desmond CFAHead of Claremont Global, Portfolio Manager
27 years 9 years Fleming Martin, Seilern, Insync
Adam Chandler Portfolio Manager
20 years 6 years UBS
Andrew Coultas CA (SA) Investment Analyst
12 years 4 years Foord, Sanlam
Chris Hernandez Investment Analyst
11 years 10 years Canaccord
Luke Davrain, CFA Investment Analyst
5 years 5 years N/A
Investment team experience

Philosophy & Process
Philosophy & Process

10 – 15 holdingsConcentrated portfolio
+$1.2bnFUM
8-12% p.a. over 5-7 yearsTarget absolute return
Focus on capitalpreservation
Predictableoutcomes
Repeatable process
Strategy overview
6
Investor Portfolio
FOR WHOLESALE INVESTORS ONLY
Source: Claremont Global

7
Investor Portfolio
FOR WHOLESALE INVESTORS ONLY
Business Quality
High returns on invested capital built on durable foundations. Organic sales growth > GDP
Capital Structure Quality
Conservatively financed, on and off-balance sheet
Management Quality
Strengthen competitive moat; allocate capital sensibly
Value
20%1 or more discount to fair value
1: Ideally, we want to buy at 20% or more discount to assessed fair value. However, the investment manager will consider portfolio inclusion where the incoming company is either at a fair value/price discount to the holding being sold down, the portfolio as a whole or, which improves the overall risk profile of the portfolio.
Investment criteria
Source: Claremont Global

8
Investor Portfolio
FOR WHOLESALE INVESTORS ONLY
Regulation Businesses exposed to changes in government regulation or policy.
Cyclicality Businesses highly exposed to the economic cycle. “Fair weather businesses”.
Competitive intensity Businesses with many competitors and low barriers to entry. Fluid, unstable industry structures.
Narrowness Businesses overly reliant on one product, customer or supplier. “One legged stools”.
What we don’t want
Source: Claremont Global

9
Investor Portfolio
FOR WHOLESALE INVESTORS ONLY
Dominant market positionsBusinesses with strong to dominant positions in industries with stable competitive structures.
Low cost-to-value ratioDelivering more value to customers than extracted in price. High customer retention rates.
CultureBusiness that have meaning and purpose. High employee retention rates.
Earnings power Pricing power and attractive organic growth.
BreadthServe many different end markets with many products or services.
What we do want
Source: Claremont Global

10
Investor Portfolio
FOR WHOLESALE INVESTORS ONLY1. Return on total invested capital – average over 10 years.2. Return on net operating assets excluding goodwill – average over 10 years. 3. Average annual growth over five years.
A focused screening process
QUANTITATIVE FILTERS QUALITATIVE FILTERS
# of companies
70,000
11,500
2,280
2,000
740
~250
Global universe
SizeMarket cap >US$3bn
ProfitabilityROIC1 >8%
RONOA2 >15%
LeverageNet debt to EBITDA <2.5x
GrowthTotal assets <10% p.a.3Issued shares <5% p.a.3
Industry exclusions
Company meetings
Industry contacts and trade publications
Peers of stocks we own
Businesses we have gotten to know and
admire over time
Company publications
PORTFOLIO15 Stocks
APPROVED35 Stocks
FOCUS LIST80 Stocks
Source: Claremont Global

11
Investor Portfolio
FOR WHOLESALE INVESTORS ONLY
10-15
Approved List ~ 35
Discovery
~ Portfolio holdings
Portfolio candidates, due diligence completed
Quality businesses with some reservations
Quality improvement required
Watch List ~ 80
Structured, tiered, disciplined – one in, one out
Research ProcessResearch Focus List
Source: Claremont Global

12
Investor Portfolio
FOR WHOLESALE INVESTORS ONLY
Approved list*(2-3 months) Detailed 50-page report
Detailed financial model
Annual reports
Valuation
Competitor analysis
*Highlights minimum time spent on idea, inclusion onto Approved list requires both PMs to agree and no more than one analyst to reject
Stock discovery(1-2 weeks) Short-form report
Annual reports
Call transcripts
Company call
Initial expert calls
IR/management calls
Capital allocation history
Expertcalls
Proxies
Driving ideas to approved list
Source: Claremont Global

13
Investor Portfolio
FOR WHOLESALE INVESTORS ONLY
100
199
76
3
75
1
67
102
264
91
0
123
1
74
142
284
140
0
93
0 2
Company calls Earnings calls Conferencetranscripts
Conference Expert calls Brokermeeting
Companymeeting
2018 2019 2020 2021
We speak directly to companies, industry experts, current and former employees
2018 2019 20202021
(YTD)Company calls 100 102 142 48
Earnings calls 199 264 284 147
Conference transcripts 76 91 140 82
Conference 3 0 0 0
Expert calls 75 123 93 30
Broker meetings 1 1 0 0
Company meetings 67 74 2 1
Total 521 655 661 308
Average per day 1.43 1.79 1.81 1.82
As at June 2021
Due Diligence Activity Conducted By Team 2018 -2020
We do our own work
Source: Claremont Global

14
Investor Portfolio
FOR WHOLESALE INVESTORS ONLY
Money made through both growth in intrinsic value and closing of valuation discount
Risk aversion remains at the heart of our strategy
Cash returns on invested capital > cost of capital
Earnings growth with a margin of safety preserves against permanent impairment
Hypothetical Example
Owning wealth-creating businesses at a valuation discount
Time-Years
$140
$100
$70
t 0 t + 1 t + 2 t + 3 t + 4 t + 5
Intrinsic value 10% p.a. growth rate
20%1 discountMarket prices15% p.a. rate of return
Earnings growth + value discipline
Source: Claremont Global
1: Ideally, we want to buy at 20% or more discount to assessed fair value. However, the investment manager will consider portfolio inclusion where the incoming company is either at a fair value/price discount to the holding being sold down, the portfolio as a whole or, which improves the overall risk profile of the portfolio.
15
Investor Portfolio
FOR WHOLESALE INVESTORS ONLY
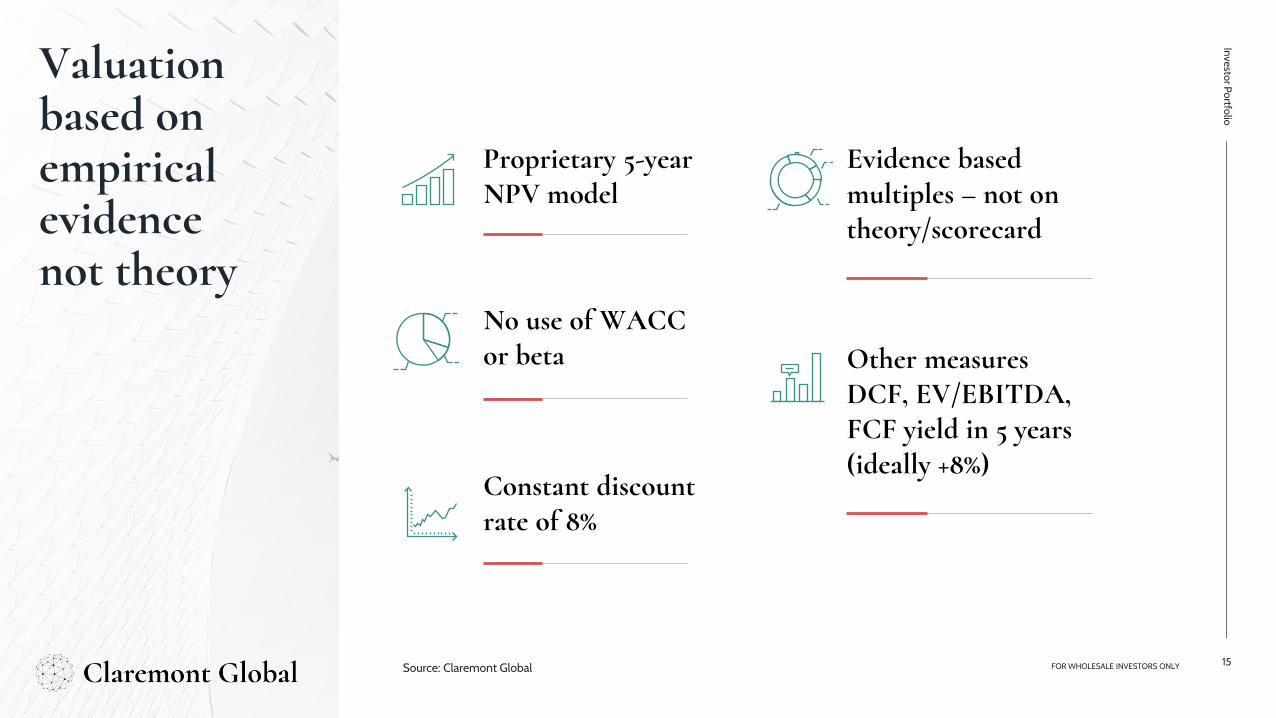
Evidence based multiples – not on theory/scorecard
Other measures DCF, EV/EBITDA, FCF yield in 5 years (ideally +8%)
Proprietary 5-year NPV model
Constant discount rate of 8%
No use of WACC or beta
Valuation based on empirical evidence not theory
Source: Claremont Global

16
Investor Portfolio
FOR WHOLESALE INVESTORS ONLY
Engagement with stakeholders is a core foundation of our investment & risk management process
Engagement
• Talk to management, past and former employees
• Preference for management teams with a strong commitment to their customers, employees and communities
Proxy Voting
• Vote proxies for each and every resolution where we have authority to do so
Investor Collaboration
• Where goals and priorities align, we also engage investors through industry memberships
Our approach to sustainable investing
Engagement
Proxy VotingInvestor
Collaboration
Source: Claremont Global

17
Investor Portfolio
FOR WHOLESALE INVESTORS ONLY
Morningstar® Sustainability Rating for Funds provides a snapshot of how well ESG risk is managed at a fund level relative to its peer group
5/5 Sustainability Rating Morningstar
Rated in Top 1% of global core managers for Morningstar Sustainalytics1
1. As at September 2021
High ESG sustainability rating
Source: Morningstar Sustainalytics

Portfolio Construction
Portfolio Construction

19
Investor Portfolio
FOR WHOLESALE INVESTORS ONLY
Exposure management Driven by bottom-up idea generation25% “soft” limits on industry/sector exposure
Portfolio concentration 10 -15 high conviction ideas
Position sizing Max. weighting 10% at market or cost Highest weightings in the portfolio are highest conviction positions
Liquidity As a guide, soft limit of 10 days to exit at approx. 25% of average daily volume
Currency No active currency management apart from hedged unit trust (98-102%)
A high conviction portfolio with well-defined limits
Source: Claremont Global

20
Investor Portfolio
FOR WHOLESALE INVESTORS ONLY
Buy decision Sell decision
Ideally 20% discount to value / risk considerations / portfolio balance If thesis disproved exit immediately “if we did not own stock, would we buy today?”
If a relative trade – 20% differential, lower than average portfolio discount Avoid status quo bias – we know we will make mistakes
Initial weight 3 - 4% Trim as discount narrows
Add to position as thesis proved out Typically exit at +20% premium to value
Max position 10% Smallest position ~3%
For purchase, both PMs to agree For sale, only one PM required
Decision-making framework
Source: Claremont Global

Fund Metrics & Performance
Performance

22
Investor Portfolio
FOR WHOLESALE INVESTORS ONLY
Organic revenue growth EPS growth rate (five-year forward CAGR)
Source: Bloomberg, S&P 500 Ex-Financials. | Note: S&P 500 Ex-Financials growth rate includes M&A Source: Bloomberg, S&P 500 Ex-Financials
Organic growth drives returns
Source: Claremont Global as at August 2021
2%
4%
6%
8%
10%
12%
14%
16%
Feb-
18
Apr
-18
Jun-
18
Aug
-18
Oct
-18
Dec
-18
Feb-
19
Apr
-19
Jun-
19
Aug
-19
Oct
-19
Dec
-19
Feb-
20
Apr
-20
Jun-
20
Aug
-20
Oct
-20
Dec
-20
Feb-
21
Apr
-21
Jun-
21
Aug
-21
Portfolio EPS growth
2.0%
3.0%
4.0%
5.0%
6.0%
7.0%
8.0%
9.0%
10.0%
2%
3%
4%
5%
6%
7%
8%
9%
10%
Feb-
18
Apr
-18
Jun-
18
Aug
-18
Oct
-18
Dec
-18
Feb-
19
Apr
-19
Jun-
19
Aug
-19
Oct
-19
Dec
-19
Feb-
20
Apr
-20
Jun-
20
Aug
-20
Oct
-20
Dec
-20
Feb-
21
Apr
-21
Jun-
21
Aug
-21
Portfolio 5YR AVG organic growth
Current market 5YR AVG sales growth (incl. M&A growth)

23
Investor Portfolio
FOR WHOLESALE INVESTORS ONLY
Gross margin EBIT margin
Source: Bloomberg, S&P 500 Ex-Financials, Claremont Global, as at August 2021 Source: Bloomberg, S&P 500 Ex-Financials, Claremont Global, as at August 2021
Record margins highlight competitive advantage
30.0%
35.0%
40.0%
45.0%
50.0%
55.0%
60.0%
30%
35%
40%
45%
50%
55%
60%
Feb-
18
Apr
-18
Jun-
18
Aug
-18
Oct
-18
Dec
-18
Feb-
19
Apr
-19
Jun-
19
Aug
-19
Oct
-19
Dec
-19
Feb-
20
Apr
-20
Jun-
20
Aug
-20
Oct
-20
Dec
-20
Feb-
21
Apr
-21
Jun-
21
Aug
-21
Portfolio 5YR AVG gross margin Current market 5YR AVG gross margin
10.0%
15.0%
20.0%
25.0%
30.0%
10%
12%
14%
16%
18%
20%
22%
24%
26%
28%
30%
Feb-
18
Apr
-18
Jun-
18
Aug
-18
Oct
-18
Dec
-18
Feb-
19
Apr
-19
Jun-
19
Aug
-19
Oct
-19
Dec
-19
Feb-
20
Apr
-20
Jun-
20
Aug
-20
Oct
-20
Dec
-20
Feb-
21
Apr
-21
Jun-
21
Aug
-21
Portfolio 5YR AVG EBIT margin Current market 5YR AVG EBIT margin

24
Investor Portfolio
FOR WHOLESALE INVESTORS ONLY
Financial leverage (current net debt/EBITDA) Return on invested capital
Note: Current market net debt/EBITDA at end of January 2020)
Source: Bloomberg, S&P 500 Ex-Financials
Strong balance sheets and quality protect capital
Source: Claremont Global, as at August 2021
0.0%
5.0%
10.0%
15.0%
20.0%
25.0%
0%
5%
10%
15%
20%
25%
Feb-
18
Apr
-18
Jun-
18
Aug
-18
Oct
-18
Dec
-18
Feb-
19
Apr
-19
Jun-
19
Aug
-19
Oct
-19
Dec
-19
Feb-
20
Apr
-20
Jun-
20
Aug
-20
Oct
-20
Dec
-20
Feb-
21
Apr
-21
Jun-
21
Aug
-21
Portfolio 5YR AVG ROIC Current market 5YR AVG ROIC
0.0
0.2
0.4
0.6
0.8
1.0
1.2
1.4
1.6
1.8
2.0
0.0x
0.2x
0.4x
0.6x
0.8x
1.0x
1.2x
1.4x
1.6x
1.8x
2.0x
Feb-
18
Apr
-18
Jun-
18
Aug
-18
Oct
-18
Dec
-18
Feb-
19
Apr
-19
Jun-
19
Aug
-19
Oct
-19
Dec
-19
Feb-
20
Apr
-20
Jun-
20
Aug
-20
Oct
-20
Dec
-20
Feb-
21
Apr
-21
Jun-
21
Aug
-21
Portfolio net debt / EBITDA Current market net debt/ EBITDA

25
Investor Portfolio
FOR WHOLESALE INVESTORS ONLY
Sector weighting Source of revenue
30%
19%16%
15%
12%
8%
Consumer Information Technology Business ServicesFinancial Services Healthcare Cash
60%
6%
20%
14%
US Americas EMEA + UK Asia Pacific
Portfolio exposure
Source: Claremont Global, as at July 2021

26
Investor Portfolio
FOR WHOLESALE INVESTORS ONLY
Financial Services Technology Business Services Consumer Healthcare
A focused portfolio of great companies for the long term
Source: Claremont Global, as at July 2021

2727
Investor Portfolio
27
Investor Portfolio
FOR WHOLESALE INVESTORS ONLY
7.5%Organic growth
24.8%EBIT margin
17.6%ROIC
0.5xNet debt / EBITDA
14.9%EPS growth
28.6xPENTM
3.1%Discount to value
Key portfolio metrics
Source: Claremont Global, as at September 2021

28
Investor Portfolio
FOR WHOLESALE INVESTORS ONLY
MDA/SMA Unit Trust Unit Trust (Hedged)
Inception 20/5/11 18/2/14 18/2/14
FUM $900mn $66mn $163mn
Fund return p.a. 19.5%* 16.4% 14.9%
Excess return p.a.+ 5.5%* 3.0% 3.5%
Objectives Target^
Absolute return 8% – 12% p.a.
Excess return (alpha) 2% – 4% p.a.
^net return over 5 -7 years
Strategy breakdown
Source: Claremont Global, as at 31 July 2021

29
Investor Portfolio
FOR WHOLESALE INVESTORS ONLY
Three Year Rolling Returns (net of fees)
A track record of consistent return
Claremont Global Fund - Unhedged
Source: Claremont Global, as at 31 July 2021
12.7% 12.7%
9.0% 9.2% 9.5%10.6% 12.8%
14.1%16.2%
12.5%
15.7%16.7% 16.7%
17.4%
20.2% 20.3%17.9%
21.5%
19.3%
14.0% 13.6%14.7%15.4% 16.2%
17.4% 17.1%
14.3%15.9%16.1%
15.3%16.2%
19.0%20.3%
19.4%20.5%
22.4%
Rol
ling
36m
ths
Aug
-18
Sep-
18
Oct
-18
Nov
-18
Dec
-18
Jan-
19
Feb-
19
Mar
-19
Apr
-19
May
-19
Jun-
19
Jul-1
9
Aug
-19
Sep-
19
Oct
-19
Nov
-19
Dec
-19
Jan-
20
Feb-
20
Mar
-20
Apr
-20
May
-20
Jun-
20
Jul-2
0
Aug
-20
Sep-
20
Oct
-20
Nov
-20
Dec
-20
Jan-
21
Feb-
21
Mar
-21
Apr
-21
May
-21
Jun-
21
Jul-2
1
Benchmark Excess return Rolling 36mths

30
Investor Portfolio
FOR WHOLESALE INVESTORS ONLY
Year-to-June 2021 performance has been relatively strong across the whole portfolio
Consistent returns across portfolio
Source: Claremont Global, as at 30 June 2021

31
Investor Portfolio
FOR WHOLESALE INVESTORS ONLY
Performance to 31 July 2021
Since Inception
(p.a.)5 years (p.a.) 3 years (p.a.) 2 years (p.a.) 1 year (p.a.) 6 months 3 months 1 month
Portfolio return (AUD) 19.5% 19.1% 23.9% 20.3% 39.7% 32.0% 14.1% 7.3%MSCI AC World Accum Index ex-Aust (AUD) 13.9% 14.7% 14.2% 15.9% 30.0% 18.7% 8.9% 2.9%Excess Return 5.5% 4.4% 9.6% 4.5% 9.8% 13.3% 5.2% 4.4%
*Performance figures are before fees. Inception 20 May 2011. Numbers may not sum due to rounding. Note that the performance of the model may not be exactly replicated in each individual portfolio due to management and administration fees and slight difference in portfolio weightings between individual accounts. Past performance should not be taken as an indicator of future performance.
International Focus Portfolio* *Gross of fees
Performance to 31 July 2021Since
Inception (p.a.)
5 years (p.a.) 3 years (p.a.) 2 years (p.a.) 1 year (p.a.) 6 months 3 months 1 month
Portfolio return (AUD) 16.4% 17.6% 22.3% 18.9% 38.0% 31.1% 13.8% 7.2%MSCI AC World Accum Index ex-Aust (AUD) 13.4% 14.7% 14.2% 15.9% 30.0% 18.7% 8.9% 2.9%Excess Return 3.0% 2.9% 8.1% 3.0% 8.1% 12.5% 4.8% 4.3%Performance is net of investment management fees. Inception date is 18th February 2014. Numbers may not sum due to rounding. Since inception return is annualised and assumes reinvestment of distributions. Past performance should not be taken as an indication of future performance.
Claremont Global Fund - Unhedged
A track record of excess return
Source: Claremont Global, as at 31 July 2021

32
Investor Portfolio
FOR WHOLESALE INVESTORS ONLY
Performance to 31 July 2021Since
Inception (p.a.)
5 years (p.a.) 3 years (p.a.) 2 years (p.a.) 1 year (p.a.) 6 months 3 months 1 month
Portfolio return (AUD) 14.9% 16.2% 20.4% 20.2% 40.5% 25.6% 8.2.% 4.9%
MSCI AC World Accum Index ex-Aust (AUD) 11.4% 13.3% 12.2% 16.9% 31.4% 14.3% 4.0% 0.7%
Excess Return 3.5% 2.9% 8.3% 3.3% 9.1% 11.3% 4.2% 4.2%
Performance is net of investment management fees. Inception date is 18th February 2014. Numbers may not sum due to rounding. Since inception return is annualised and assumes reinvestment of distributions. Past performance should not be taken as an indication of future performance.
Claremont Global Fund - Hedged *Gross of fees
A track record of excess return
Source: Claremont Global, as at 31 July 2021

33
Investor Portfolio
FOR WHOLESALE INVESTORS ONLY
Claremont Global Fund (Unhedged)*
*Three years to end of August 2021
International Fund Portfolio
Standard Deviation 13.5%
Realised Beta 1.05
Tracking Error 5.6%
Active Share ~93%
Upside Capture Ratio 1.23
Downside Capture Ratio 0.78
High active share with downside protection
Source: Claremont Global

34
Investor Portfolio
FOR WHOLESALE INVESTORS ONLY
Focused portfolio of 10-15 high quality names
Strong track record with downside protection
Scale to fund research and client service
Boutique culture – aligned incentives, stable team
Parent support – admin, compliance, shared services
Investment in mid-cap global leaders, without compromising liquidity
Key competitive advantages
Source: Claremont Global
FUM capacity $7-10B. Room for growth.
Strong relationships with tenured clients