september 6 th 2012 introduction to mirror of america
TRANSCRIPT

September 6th 2012
Introduction to Mirror of America


Break through technology.
First in Class.
Page | 3

AGENDA
The Big Picture
The pitch: MOA Metaverse
The vision and experience: Mirror of America
Page | 4

Big Data
Big Information
Big Knowledge
Page | 5
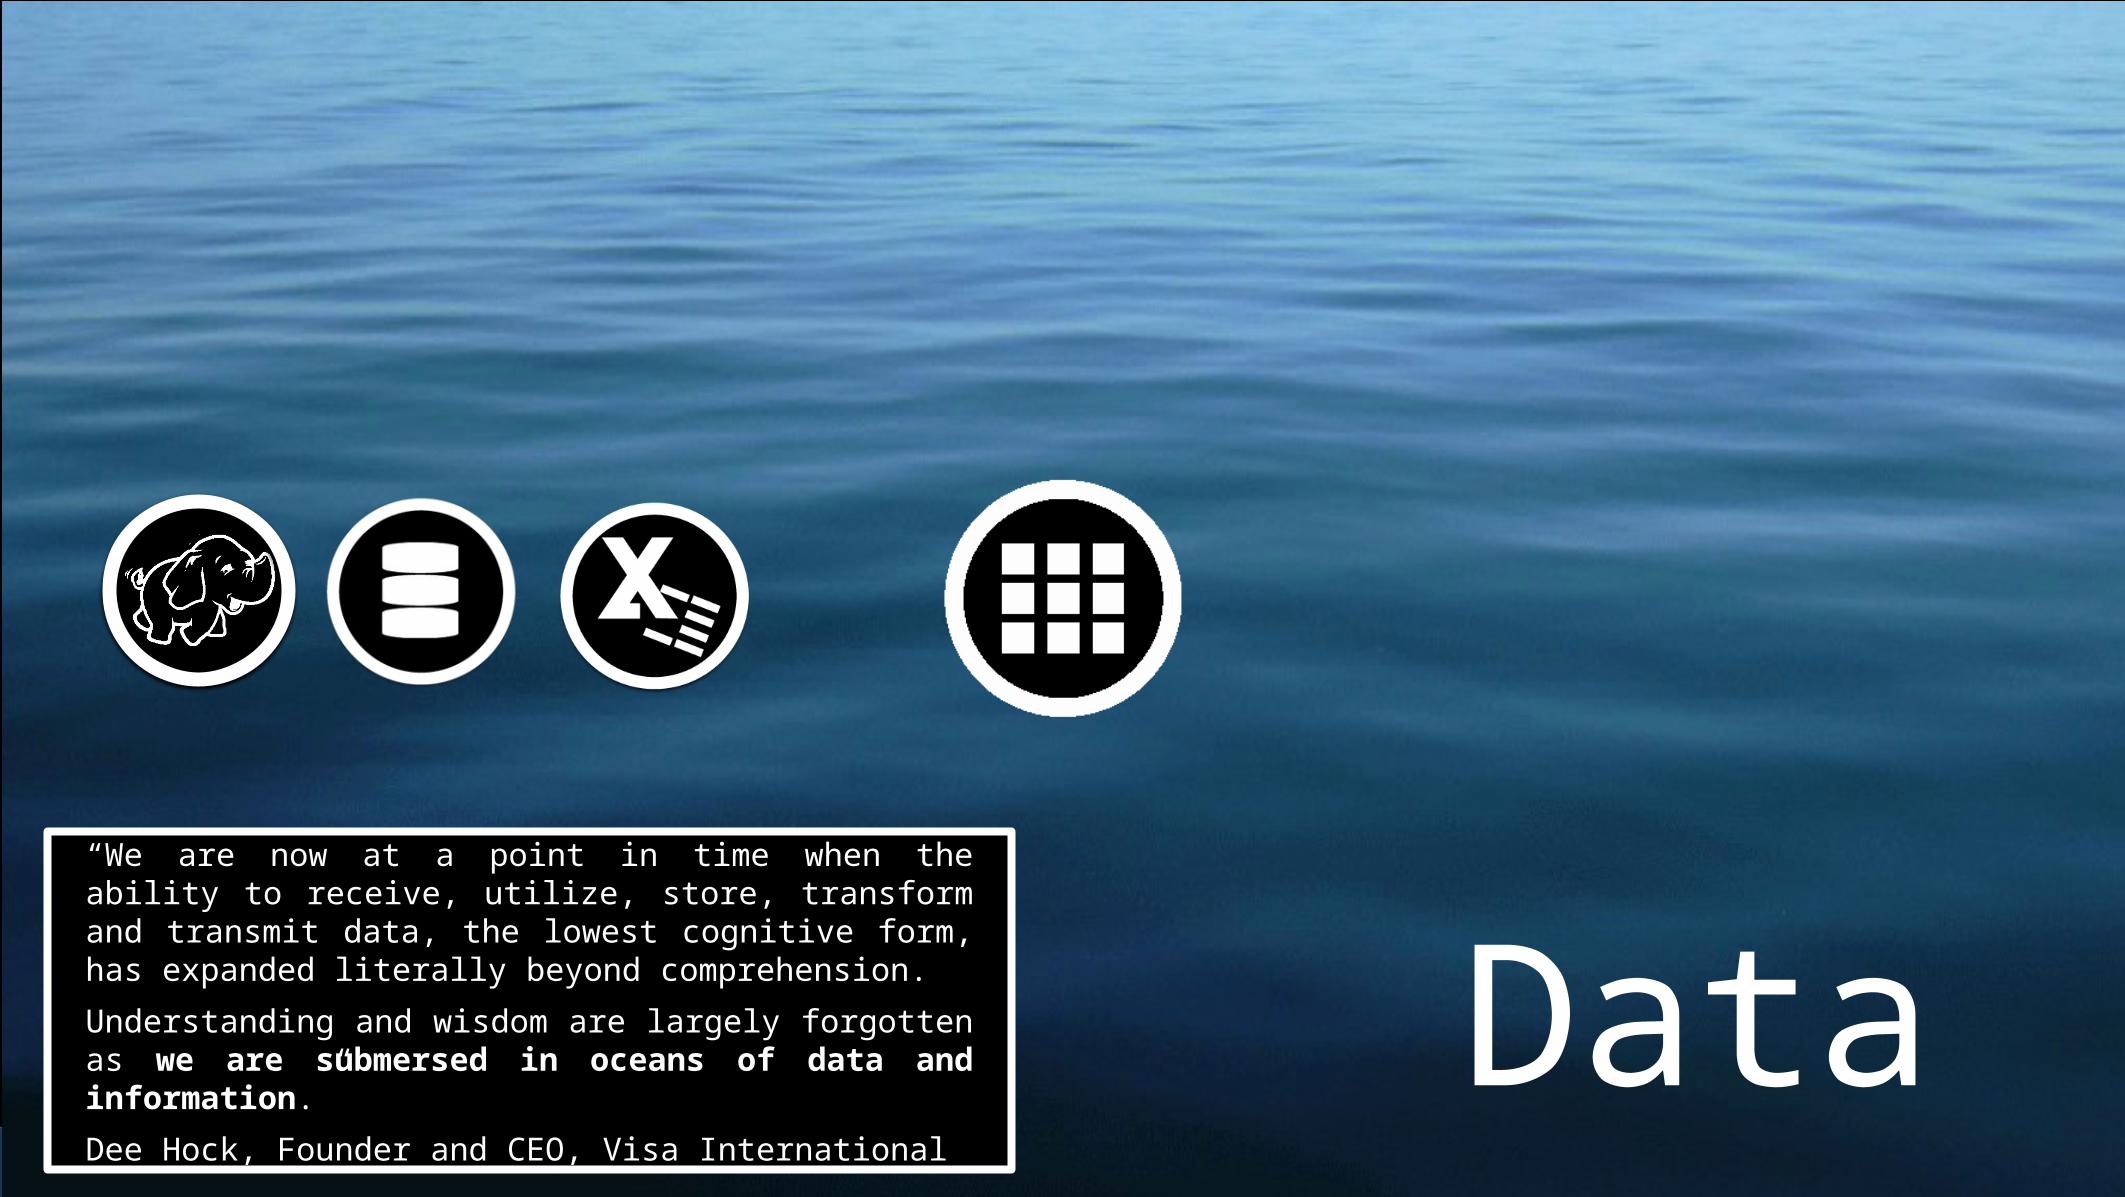
“We are now at a point in time when the ability to receive, utilize, store, transform and transmit data, the lowest cognitive form, has expanded literally beyond comprehension.
Understanding and wisdom are largely forgotten as we are submersed in oceans of data and information.”
Dee Hock, Founder and CEO, Visa International
Data

A cable to connect a laptop…
Page | 7

One out of five products ever produced by humanity have been produced in the last ten years of human history.
The unthinkable complexity of our current global human enterprise is predicated on an information technology revolution that powers increasing coordination within the even vaster and unimaginable lattice of minds, machines and models that span and manage our global economic systems.
The Economist
Models

Big Data “HDMI mini cable”
Page | 9
“About 36,400,000 results (0.25 seconds)”

"Modern computers can process basic information much faster than any human brain. However, computers have yet to match the brain's remarkable ability to perceive and recognize patterns and make judgments.“
Gordon Fraser, Manager, CERN
Views

Big Information
Page | 11
“About 36,400,000
results (0.25conds)”

Big Problem
Page | 12

ViewsModels
Data

Big Knowledge
Page | 14

Product
Page | 15

Place
Page | 16

People
Page | 17

Happiness
Page | 18

Page | 19
Application Space Time Lens Objects Relations Attributes

Page | 20

The MOA Pitch
Page | 21

What the Retailer knows…
Monday and Tuesday are slow.$1M in revenue on $14K a month.Volume is key but barrier with big
ticket.
Page | 22

MOA METAVERSE
Page | 23

2012
Page | 24

Know thy Business
Page | 25

Agile Real-Time Intelligence
Page | 26

How many people visited MOA last month?
Page | 27
What percentage made it to the third level?
What is your revenue vs. price sq. ft. at MOA?
How many products are there in your store?
What are the correlation clusters?Are products positioned in optimal location?
How many people are here now?
Is performance driven by MOA or my team?
What percent are browsers vs. buyers?
How can brick and mortar reclaim market share?

Page | 28

HDMI Mini
Page | 29

One (not 36 million) results.All the dataAll the modelsAll the views
Positioned in larger model spacePosition on floorRelations between productsAnalytic position
Create new view – NO PROGRAMMING
Page | 30

Page | 31

Page | 32

Page | 33

Page | 34

Page | 35

An interactive, multi-user, data analytics oriented “Mall of America Metaverse.”
• Initial Target Audience is MOA Key retailers
• Explore, define and demonstrate “The Possible”
• Generate Revenue with MOA SAAS offering.
Go live in Q4 2012
The Pitch
Page | 36

Page | 37

Page | 38

Page | 39
A second import adds a model that shows relations for high correlation in branch/ATM revenue.
Here corporate trade finance is compared to shipping stats.
Enter a subset of data and export space to Google Earth..
Zoom in to click on specific vessels in real-time.
Start with a Quantum4D data fed persistent domain model.
A third import let’s you add mobile and point of sales trends.
Map results in geographic space.
• Connect workspaces to Google Earth
• Compare trends across different time and geographic scales
• See patterns that might otherwise be lost in static snapshots.

Multi-user, dynamic (historical to real-time) flow of revenue and customers.
MOA/Q4D has dedicated DB for each client. Adds benchmarks and demographic data
Page | 40

Where is everyone?Where are the problems?
Multiple MOA use cases…
Page | 41
• Security• Cleaning• Lounge
management

Foundation for new frontier.
Page | 42

MIRROR OF AMERICA
Page | 43

2013
Page | 44

Unique Experience: Know thy Self
Page | 45

Page | 46

Page | 47

Unique Insight: Know thy Community
Page | 48

Page | 49

• Blogs• Fan sites• Content interaction• Content navigation• Content organization• Social media• Location data • Multiform factor• Media types• Decision pathways • Massively multi-user
Virtual Self and Community Themes
Page | 50

• Mobile Phone• iPad• Video displays• Interactive Walls
• Tony Romas’ touch table• RFID• Sensors
• Holographic displays• Multi-user Haptic interfaces• Bridging the big picture with the world around me
Physical Space and Form Factors
Page | 51
• Text page• Tags• Video feeds• Swarm media• Ratings• Co-presence• Anonymous interest
clusters

Space Time Lens Objects Relations Attributes

Model• Create easy to navigate models of
complex systems.
• Quick access to sophisticated results, from correlations to risk models.
Manage• Integrate multiple data feeds, databases
and spreadsheet sources.
• Organize data in a way that is meaningful to you and experts.
Explore• Unfold networks, trends, and anomalies
hidden in data.
• Uncover unknown unknowns.
Monitor• Define triggering events in all or any of
your analytical spaces.
• Get an alert and direct access to significant event spaces.
Analyze• Visually analyze multiple variables in a
three dimensional space.
• Apply and visualize statistical analysis and create scenarios on the fly.
Report• Easily generate a variety of output; from a
static chart to a dynamic animation.
• Publish findings online as portals to make
data and insights easily accessible.
Faster access to deeper insights through an interface optimized for digital media (not paper).
Collaborative visual interactive knowledge empowers most daily activities.
Page | 53

Navigate/Share insights• Super-user client
(Java)• Cloud/data center
schemas• Solid product ready for
market
Super-User | quick install; like iTunes for knowledge
Page | 54
Build universes of insight.• Drag, drop, map &
animate views• Pivot (reuse) entities
and data• Fuse data from multiple
sources

Web Foundation | Fast prototype to publish – no programming.
Page | 55
Publish universes of insightDrag, drop, map & publish
Persistent position in larger model
Ad hoc interlinking of models

US Total Overview
Feature Highlights• Create & display data aggregations• Compare 3+ variables in one view.• Animation reveals trends
Federated Data• Internal (ATM + Public Data)• Federal Reserve (examples)
• Coincidence Economic Index• Employment• Non-Farm Payrolls
56

California County Comps
57
Feature Highlights• Rotate 3D chart rooms• Drill down from higher scales• On demand insights
Federated Data• Internal (ATM + Public Data)• Federal Reserve (examples)
• Demographic profiles• Income profiles• Share of market

Statewide ATM Monitoring
• Feature Highlights• Different View Configurations• Dashboard Building • Federated Data• Internal (ATM + data)• Local demographics data
58
Export to display and
animate in Google Earth