september quarter earnings fiscal 2017 · september quarter earnings fiscal 2017 ... sep q fiscal...
TRANSCRIPT

SEPTEMBER QUARTER EARNINGS FY2017
SEPTEMBER QUARTER EARNINGS FISCAL 2017 October 24, 2017
TD Ameritrade Holding Corporation (Nasdaq: AMTD). Brokerage services provided by TD Ameritrade, Inc., member FINRA/SIPC, and TD Ameritrade Clearing, Inc., member FINRA/SIPC, subsidiaries of TD Ameritrade Holding Corp. TD Ameritrade is a trademark jointly owned by TD Ameritrade IP Company, Inc. and The Toronto-Dominion Bank. © 2017 TD Ameritrade IP Company, Inc. All rights reserved. Used with permission.

SEPTEMBER QUARTER EARNINGS FY2017 2
Safe Harbor This document contains forward-looking statements within the meaning of the federal securities laws. We intend these forward-looking statements to be covered by the safe harbor provisions of the federal securities laws. In particular, any projections regarding our future revenues, expenses, earnings, capital expenditures, effective tax rates, client trading activity, accounts, stock price or any projections or expectations regarding the acquisition of Scottrade Financial Services, Inc., as well as the assumptions on which such expectations are based, are forward-looking statements. These statements reflect only our current expectations and are not guarantees of future performance or results. These statements involve risks, uncertainties and assumptions that could cause actual results or performance to differ materially from those contained in the forward-looking statements. These risks, uncertainties and assumptions include, but are not limited to: general economic and political conditions and other securities industry risks, fluctuations in interest rates, stock market fluctuations and changes in client trading activity, credit risk with clients and counterparties, increased competition, systems failures, delays and capacity constraints, network security risks, liquidity risks, new laws and regulations affecting our business, regulatory and legal matters, difficulties and delays in integrating the Scottrade business or fully realizing cost savings and other benefits from the acquisition; business disruption following the Scottrade acquisition, changes in asset quality and credit risk, the inability to sustain revenue and earnings growth, changes in interest rates and capital markets, inflation, customer borrowing, repayment, investment and deposit practices, customer disintermediation, the introduction, withdrawal, success and timing of business initiatives, competitive conditions, disruptions due to Scottrade integration-related uncertainty or other factors making it more difficult to maintain relationships with employees, customers, other business partners or governmental entities, the inability to realize synergies or to implement integration plans and other consequences associated with mergers, acquisitions and uncertainties and other risk factors described in our latest Annual Report on Form 10-K, filed with the SEC on Nov. 18, 2016, in our Quarterly Reports on Form 10-Q filed thereafter and in our other filings with the SEC. These forward-looking statements speak only as of the date on which the statements were made. We undertake no obligation to update or revise publicly any forward-looking statements, whether as a result of new information, future events or otherwise, except to the extent required by the federal securities laws.

SEPTEMBER QUARTER EARNINGS FY2017 3
Use of Non-GAAP Financial Measures The Company utilized the non-GAAP calculation of net income and earnings per share (EPS) excluding amortization of intangible assets and acquisition-related expenses, as an additional measure to aid in understanding and analyzing the Company's financial results. Specifically, the Company believes that the non-GAAP measure provides useful information by excluding certain items that may not be indicative of the Company's core operating results and business outlook. The Company believes this non-GAAP measure will allow for a better evaluation of the operating performance of the business and facilitate a meaningful comparison of the Company's results in the current period to those in the prior periods and future periods. Reference to this non-GAAP measure should not be considered as a substitute for results that are presented in a manner consistent with GAAP. This non-GAAP measure is provided to enhance investors' overall understanding of the Company's financial performance.
*Certain totals may not foot due to rounding. **Changes based on rounding numbers to the nearest $ millions. ***See Appendix for footnotes descriptions.

SEPTEMBER QUARTER EARNINGS FY2017 4
Chief Executive Officer
TIM HOCKEY

SEPTEMBER QUARTER EARNINGS FY2017 5
OVERVIEW
Strong quarter and closing deal caps record year
Core operating metrics at record levels
Strong organic growth momentum entering fiscal 2018
Investors engaged, despite low market volatility
Accelerated technology throughput
Scottrade acquisition closed, integration underway
Fiscal 2018 strategic plans, financial outlook set

SEPTEMBER QUARTER EARNINGS FY2017 6
$156B
11% YOY
32% YOY
$1.1T
$0.39
$983M NET REVENUES
$19.9B NET NEW CLIENT ASSETS(2)
19% YOY
19% YOY
529K
45% YOY
CLIENT ASSETS
31% YOY
INTEREST RATE SENSITIVE ASSETS(5)
32% YOY
$224B INVESTMENT BALANCES(4)
FEE-BASED
Strong results
SEP Q Fiscal 2017
ANNUALIZED GROWTH RATE(3)
9%
EPS
AVERAGE CLIENT TRADES PER DAY
NON-GAAP DILUTED EPS(1)
$0.49 29% YOY
NOTE: Scottrade acquisition closed 9/18/17
SEPTEMBER QUARTER EARNINGS FY2017 7
$156B
4% YOY
33% YOY
$1.1T
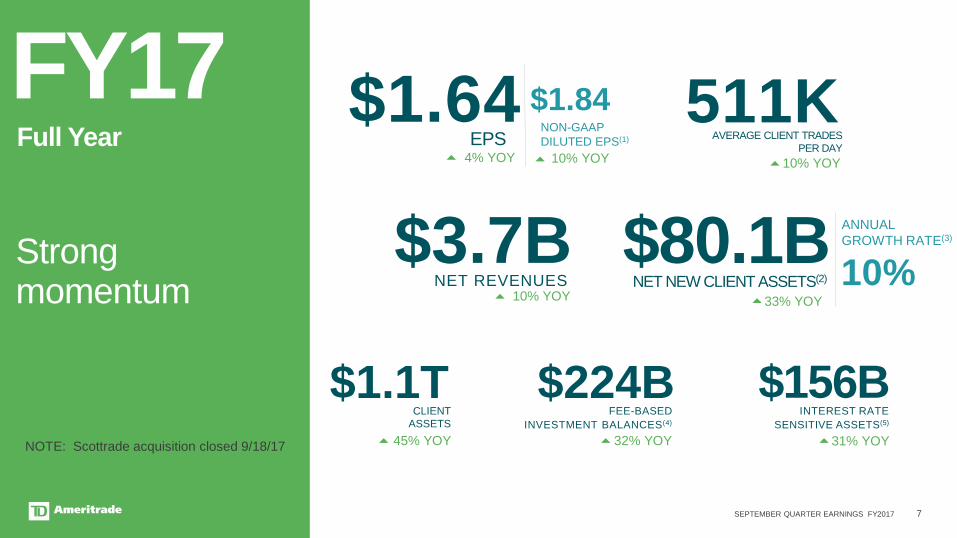
$1.64
$3.7B NET REVENUES
$80.1B NET NEW CLIENT ASSETS(2)
10% YOY
10% YOY
511K
45% YOY 32% YOY
$224B
Strong momentum
FY17 Full Year
ANNUAL GROWTH RATE(3)
10%
EPS
AVERAGE CLIENT TRADES PER DAY
NOTE: Scottrade acquisition closed 9/18/17
NON-GAAP DILUTED EPS(1)
$1.84 10% YOY
CLIENT ASSETS
INTEREST RATE SENSITIVE ASSETS(5) INVESTMENT BALANCES(4)
FEE-BASED
31% YOY

SEPTEMBER QUARTER EARNINGS FY2017 8
Net New Client Assets ($B)(2)
$15 $19 $19
$22 $20
$0
$5
$10
$15
$20
$25
Sep Q '16 Dec Q '16 Mar Q '17 Jun Q '17 Sep Q '178% 10% 10% 10% 9% Growth
Rate(3)
ASSET GATHERING
FY17 NNA up 33% year over year ~20%/80% Retail/Institutional split
Retail • Record net advocate scores
• Branches focused on building relationships
Institutional • NNA up 50% year over year, record year
• Strong momentum from all sources
FY18 $80B-$100B NNA Expanded physical footprint
Record year – double-digit growth
$80 $50 $53 $63 $60
$80 $100
$0
$30
$60
$90
$120
$150
FY13 FY14 FY15 FY16 FY17 FY18
10% 10% 10% 9% 10% Growth Rate 7-9%
Net New Client Assets ($B) Outlook Range($B)(6)

SEPTEMBER QUARTER EARNINGS FY2017 9
TRADING
Investors engaged FY17
DARTS(7) up 10% year over year
• October month-to-date 644K
Derivatives(8) at 42% of DARTS – options DARTS up 9% year over year
Mobile adoption continues:
• Sep Q – Record DARTS 121K; Record 23% of DARTS
• Fiscal ’17 – Record DARTS 112K; Record 22% of DARTS
FY18 640K-700K DARTS
444
487 517 510
529
350
400
450
500
550
Sep Q '16 Dec Q '16 Mar Q '17 Jun Q '17 Sep Q '17
Avg. Client Trades Per Day (K)
640
374 427
462 463 511
700
275
375
475
575
675
775
FY13 FY14 FY15 FY16 FY17 FY18
Avg. Client Trades per Day (K) Outlook Range(K)(6)
CAGR: 8%

SEPTEMBER QUARTER EARNINGS FY2017 10
SCOTTRADE ACQUISITION
Integration Update
Strategic and cultural fit
Scottrade-legacy metrics strong
Clearing conversion targeted for Mar Q
Superior client experience remains top priority
Integration underway
SEPTEMBER QUARTER EARNINGS FY2017 11
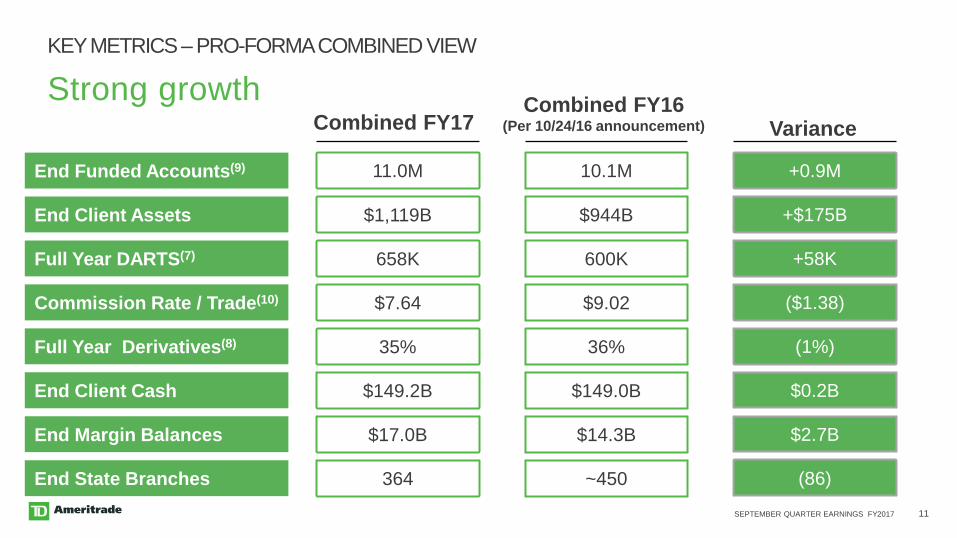
End Client Assets
End Funded Accounts(9)
Full Year DARTS(7)
Commission Rate / Trade(10)
End Client Cash
End Margin Balances
Full Year Derivatives(8)
11.0M 10.1M
$1,119B $944B
658K 600K
$7.64 $9.02
35% 36%
$149.2B $149.0B
$17.0B $14.3B
End State Branches 364 ~450
+0.9M
+$175B
+58K
($1.38)
(1%)
$0.2B
$2.7B
(86)
Variance Combined FY17 Combined FY16
(Per 10/24/16 announcement)
KEY METRICS – PRO-FORMA COMBINED VIEW
Strong growth

SEPTEMBER QUARTER EARNINGS FY2017 12
BRANCH FOOTPRINT PLAN – 364
Qualitative and quantitative data analysis
259 Scottrade-legacy branches retained
87% of clients will be within 25 miles of a branch
Post-Clearing Conversion Footprint

SEPTEMBER QUARTER EARNINGS FY2017 13
Institutional Veo One enhancements, integrations Enhanced automation
DELIVERING TO CLIENTS
Essential Portfolios launch Alexa Virtual Assistant Skill Veo One launch Earnings Analysis tool for
thinkorswim
Lower pricing Model Market Center for RIAs Goal Planning in branches Automated Account Opening
and Money Movement for RIAs
Updated Mobile Option Chains and Trade Ticket Veo One enhancements Improved Deposits & Transfers Personalized Performance Videos 401(k) Rollover Comparison Tool for reps Automation for RIA end-client service
Q1 Q2 Q3
Throughput 3X Fiscal ‘16
Q4 Retail Chatbot on Facebook Messenger TD Ameritrade Network
ETF Market Center enhanced

SEPTEMBER QUARTER EARNINGS FY2017 14
Chief Financial Officer
Steve Boyle
SEPTEMBER QUARTER EARNINGS FY2017 15
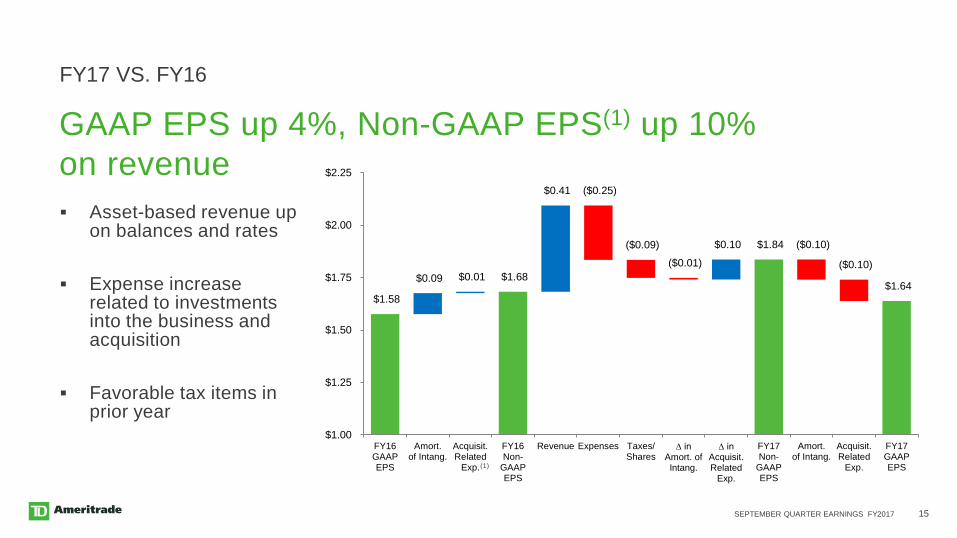
FY17 VS. FY16
GAAP EPS up 4%, Non-GAAP EPS(1) up 10% on revenue Asset-based revenue up
on balances and rates Expense increase
related to investments into the business and acquisition
Favorable tax items in prior year
$1.58
$0.09 $0.01 $1.68
$0.41 ($0.25)
($0.09)
($0.01)
$0.10 $1.84 ($0.10)
($0.10)
$1.64
$1.00
$1.25
$1.50
$1.75
$2.00
$2.25
FY16GAAPEPS
Amort.of Intang.
Acquisit.Related
Exp.
FY16Non-
GAAPEPS
Revenue Expenses Taxes/Shares
∆ in Amort. of Intang.
∆ in Acquisit. Related
Exp.
FY17Non-
GAAPEPS
Amort.of Intang.
Acquisit.Related
Exp.
FY17GAAPEPS(1)

SEPTEMBER QUARTER EARNINGS FY2017 16
BANK DEPOSIT ACCOUNT (BDA) FEES(11)
Revenue up 20% year over year
$1,520
$804 $820 $839 $926
$1,107
$1,650
$600$800
$1,000$1,200$1,400$1,600$1,800
FY13 FY14 FY15 FY16 FY17 FY18
$121
$68 $73 $76
$84 $94
$126
1.17%
1.11% 1.09% 1.09%
1.16%
1.25%
1.00%
1.10%
1.20%
1.30%
1.40%
$50
$70
$90
$110
$130
FY13 FY14 FY15 FY16 FY17 FY18
Avg. Bal. Rate
Balance($B) and Rate
Revenue($M)
FY17
Net rate increased for three consecutive quarters, ending with 1.26% in the Sep Q
Balances grew 12% despite strong net buying
$28B balances from Scottrade in Sep
Float/fixed mix 26%/74% as of Sep
FY18
Continued revenue growth due to balances, rates and planned extensions
1.30%
Outlook Range(6) Net Revenue
Outlook Range Outlook Range
CAGR: 8%

SEPTEMBER QUARTER EARNINGS FY2017 17
$33
$16 $19 $20
$23 $25
$37
2.92%
3.09% 3.03%
2.59%
2.69% 3.00%
2.55%
2.75%
2.95%
3.15%
3.35%
3.55%
$10
$15
$20
$25
$30
$35
$40
FY13 FY14 FY15 FY16 FY17 FY18
NET INTEREST REVENUE
Strong balance and net rate growth $990
$469 $581 $622 $595
$690
$1,185
$300
$600
$900
$1,200
FY13 FY14 FY15 FY16 FY17 FY18
Balance($B) and Rate
Revenue($M)
FY17
Interest earning assets(12) benefiting from rising interest rates
Segregated cash and corporate cash revenue up $51M year over year
Margin revenue up $46M year over year
Stock lending essentially flat year over year
FY18
Continued balance and rate growth
Outlook Range(6) Net Revenue
Avg. Bal. Rate Outlook Range Outlook Range
3.20%
CAGR: 10%

SEPTEMBER QUARTER EARNINGS FY2017 18
$490
$250
$309 $334
$374
$423
$550
$0
$100
$200
$300
$400
$500
$600
FY13 FY14 FY15 FY16 FY17 FY18
Avg. Bal. ($B) $113 $137 $156 $161 $185
INVESTMENT PRODUCT FEES
Consistent strong growth
(13)
FY17
New offerings providing momentum
• Essential Portfolios
• Model market center
Advised average balances (Essential+Selective+AdvisorDirect) up 16% year over year
FY18
Continued balance growth
New offerings – ETF Market Center
Revenue($M)
$220-$230
Outlook Range(6) Net Revenue
CAGR: 14%

SEPTEMBER QUARTER EARNINGS FY2017 19
$73 $75 $80 $90
$120
$17 $19 $22
$25
$32
$5 $6 $6
$4
$4
$96 $100 $108
$119
$156
$0
$20
$40
$60
$80
$100
$120
$140
$160
$180
Sep '13 Sep '14 Sep '15 Sep '16 Sep '17
(15)
INTEREST RATE SENSITIVE ASSETS(5)
Ending client cash as % of client
assets 13.4% Consolidated duration of 1.9 years,
targeting 2.2 years by Mar ‘18 after planned extensions completed
Benefit of next +25bps increase in
interest rates = $0.07-$0.12(14)
Immediate benefit with Fed Funds increases
Benefit over time with Yield Curve due to re-pricing of laddered investment portfolio
Float $32
BDA(11) Interest Earning Assets(12) Money Market Mutual Funds
Ending Balances($B)
Fixed $88
Float $16
Fixed $57
Float $18
Fixed $57
Float $21
Fixed $59
Float $29
Fixed $61
Managing overall duration

SEPTEMBER QUARTER EARNINGS FY2017 20
$2,062
$51
$82 $3 ($6) $12
$56 $22 $2,282
$2,000
$2,050
$2,100
$2,150
$2,200
$2,250
$2,300
FY2016 TechnologyInitiatives
Acquisit.Related
Exp.
ScottradeIntangibles
Advert. SalesIncentives
Employ.Related
Other FY2017
FY16 to FY17 Comparison
Acquisition-related expenses driving ~40% of increase
Sales incentive due to record NNA
Investing in technology
Acquisition-related(1) expenses increase of $82M
TOTAL EXPENSES(16)

SEPTEMBER QUARTER EARNINGS FY2017 21
SCOTTRADE EXPENSE SYNERGIES / OPPORTUNITIES
Accretion expected to exceed original plans Interest rates and business performance exceeding expectations
Expense synergies – FY18 likely better than original assumptions
FY18 synergies ~40%
Clearing conversion impacts synergy realization
Focused on maintaining high client service levels
Achieve target run rate in 2019
Opportunities unchanged – net benefits FY19-on
Assets per account
Trades per account
Derivatives(8) % of DARTS

SEPTEMBER QUARTER EARNINGS FY2017 22
1.25%-1.30%
$1.50-$2.00
$4.6B-$5.2B NET REVENUES
AVERAGE CLIENT TRADES PER DAY 640K-700K
BANK DEPOSITS NET RATE
Outlook(6) ranges
FY18 Full Year
NON-GAAP DILUTED EPS(1)
$2.10-$2.50 EPS
$3.2B-$3.3B OPERATING EXPENSES
ACQUISITION-RELATED EXPENSES(1)
$320M-$410M
• $80B-$100B NNA; 7%-9% • 0-10% MARKET GROWTH • FLAT TO INCREASING
RATE ENVIRONMENT
EXPENSE SYNERGIES $175M-$225M

SEPTEMBER QUARTER EARNINGS FY2017 23
Chief Executive Officer
TIM HOCKEY

SEPTEMBER QUARTER EARNINGS FY2017 24
LOOKING AHEAD
Scottrade integration
Create a superior client experience
Accelerating and diversifying revenue growth
Investing in employee development
Technology efficiency and throughput to drive client experience
Ongoing innovation
Fiscal 2018 Roadmap

SEPTEMBER QUARTER EARNINGS FY2017 25
Appendix

SEPTEMBER QUARTER EARNINGS FY2017 26
SENSITIVITY
Estimated annual impact to EPS
3K average client trades per day = $0.01
$3.9B fee-based assets(13) = $0.01
$0.5B spread-based assets(17) = $0.01
Next +25bps interest rate increase = +$0.07-$0.12(14)

SEPTEMBER QUARTER EARNINGS FY2017 27
FY16-to-FY17 Comparison Technology Initiatives
Acquisit. Related
Exp.
Scottrade Intangibles Advert. Sales
Incentives Employ. Related Other Incr /
(Decr)
Employee compensation and benefits $22 $35 $12 $56 ($2) $ 123 Clearing and execution costs $13 $ 13 Communications ($6) $ (6) Occupancy and equipment costs $8 $2 $ 10 Depreciation and amortization $9 $1 $ 10 Amortization of acquired intangible assets $3 ($10) $ (7) Professional services $12 $44 $26 $ 82 Advertising ($6) $ (6) Other operating $2 ($20) $ (18)
Total other expense $1 $18 $ 19 Total expenses $51 $82 $3 ($6) $12 $56 $22 $ 220
TOTAL EXPENSE(16) SUPPORTING SCHEDULE – FULL YEAR
(1)

SEPTEMBER QUARTER EARNINGS FY2017 28
$558 $2
$46 $3 $1 $3 $13
$19 $645
$500 $525 $550 $575 $600 $625 $650 $675
Jun Q '17 TechnologyInitiatives
Acquisit.Related
Exp.
ScottradeIntangibles
Advert. SalesIncentives
Employ.Related
Other Sep Q '17
$559 $14
$55 $3 $3 $22 ($11)
$645
$500 $525 $550 $575 $600 $625 $650 $675
Sep Q '16 TechnologyInitiatives
Acquisit.Related
Exp.
ScottradeIntangibles
SalesIncentives
Employ.Related
Other Sep Q '17
Quarter Comparisons TOTAL EXPENSES(16)
(1)
Jun Q '17 to Sep Q '17
(1)
Sep Q '16 to Sep Q '17

SEPTEMBER QUARTER EARNINGS FY2017 29
Year-Over-Year Comparison Technology Initiatives
Acquisit. Related
Exp.
Scottrade Intangibles Advert. Sales
Incentives Employ. Related Other Incr /
(Decr)
Employee compensation and benefits $3 $35 $3 $22 $ 63 Clearing and execution costs $3 $ 3 Communications ($5) $ (5) Occupancy and equipment costs $6 $ 6 Depreciation and amortization $2 $2 $ 4 Amortization of acquired intangible assets $3 ($1) $ 2 Professional services $3 $19 $3 $ 25 Advertising $ - Other operating $1 ($23) $ (22)
Total other expense $10 $ 10 Total expenses $14 $55 $3 $0 $3 $22 ($11) $ 86
Sequential Comparison Technology Initiatives
Acquisit. Related
Exp.
Scottrade Intangibles Advert. Sales
Incentives Employ. Related Other Incr /
(Decr)
Employee compensation and benefits $35 $3 $13 $ 51 Clearing and execution costs ($1) $ (1) Communications ($1) $ (1) Occupancy and equipment costs $5 $ 5 Depreciation and amortization $1 $2 $ 3 Amortization of acquired intangible assets $3 $ 3 Professional services $1 $11 $3 $ 15 Advertising $1 $ 1 Other operating $1 $8 $ 9
Total other expense ($1) $3 $ 2 Total expenses $2 $46 $3 $1 $3 $13 $19 $ 87
TOTAL EXPENSE(16) SUPPORTING SCHEDULE - QUARTERS
(1)
(1)
SEPTEMBER QUARTER EARNINGS FY2017 30
1.30
2.16
2.22 2.11
2.30
2.33
2.36
1.94 1.97
2.19
2.64
2.14
2.25 2.47
2.63 2.77
1.25
1.50
1.75
2.00
2.25
2.50
2.75
3.00
Sep Q '16 Dec Q '16 Mar Q '17 Jun Q '17 Sep Q '17 Dec Q '17 Mar Q '18 Jun Q '18 Sep Q '18
Forwards GI Low GI Base
1.18
1.98
2.05
1.96
2.14
2.19
2.23
2.26
1.79 1.84
2.04
2.48
2.00 2.08
2.28
2.48 2.64
1.00
1.25
1.50
1.75
2.00
2.25
2.50
2.75
Sep Q '16 Dec Q '16 Mar Q '17 Jun Q '17 Sep Q '17 Dec Q '17 Mar Q '18 Jun Q '18 Sep Q '18
Forwards GI Low GI Base
1.01
1.45 1.62 1.62
1.88
1.96
2.02 2.08
1.55 1.62
1.72 2.04
1.74
1.73
1.97
2.31
2.54
0.750.951.151.351.551.751.952.152.352.552.75
Sep Q '16 Dec Q '16 Mar Q '17 Jun Q '17 Sep Q '17 Dec Q '17 Mar Q '18 Jun Q '18 Sep Q '18
Forwards GI Low GI Base
0.50 0.75
1.00
1.25
1.50
1.75 1.75
1.25 1.25 1.25
1.50 1.25
1.50
2.00
0.40
0.60
0.80
1.00
1.20
1.40
1.60
1.80
2.00
2.20
Sep Q '16 Dec Q '16 Mar Q '17 Jun Q '17 Sep Q '17 Dec Q '17 Mar Q '18 Jun Q '18 Sep Q '18
Forwards GI Low GI Base
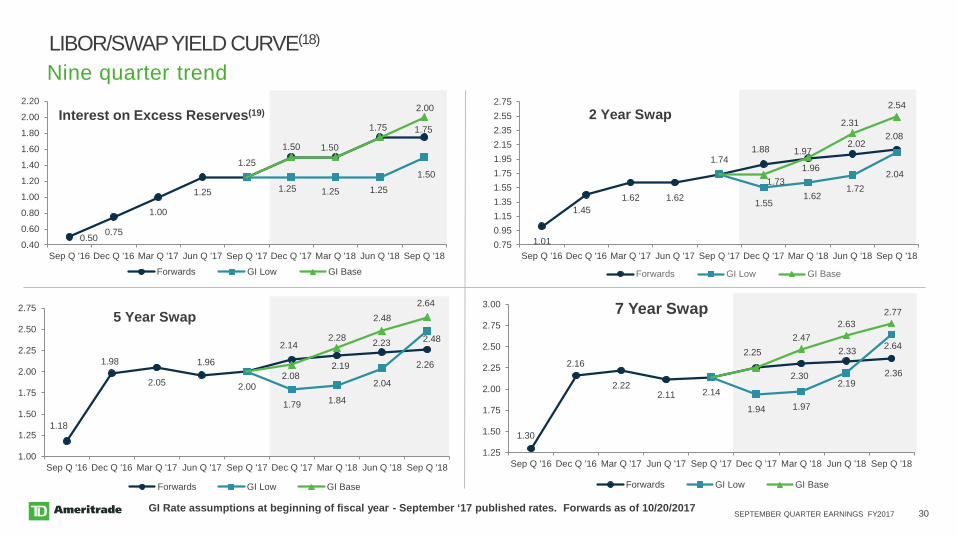
Interest on Excess Reserves(19)
LIBOR/SWAP YIELD CURVE(18)
2 Year Swap
5 Year Swap 7 Year Swap
GI Rate assumptions at beginning of fiscal year - September ‘17 published rates. Forwards as of 10/20/2017
Nine quarter trend

SEPTEMBER QUARTER EARNINGS FY2017 31
APPENDIX…FOOTNOTES
1. See attached reconciliation of non-GAAP financial measures.
2. Net new assets (NNA) consist of total client asset inflows, less total client asset outflows, excluding activity from business combinations. Client asset inflows include interest and dividend payments and exclude changes in client assets due to market fluctuations. Net new assets are measured based on the market value of the assets as of the date of the inflows and outflows.
3. NNA growth rate is annualized net new assets as a % of client assets as of the beginning of the period.
4. Market fee-based investment balances plus money market mutual funds. Ending balances as of Sep. 30, 2017.
5. Interest rate sensitive assets consist of spread-based assets and money market mutual funds. Ending balances as of Sep. 30, 2017.
6. FY17 forecast per 10/24/17 outlook statement.
7. Total revenue trades divided by the number of trading days in the period. This metric is also known as average client trades per day.
8. Derivatives include options, futures and foreign exchange trades.
9. Funded accounts is all open client accounts with a total liquidation value greater than zero.
10. FY17 is for Sep Q. FY16 is full year.
11. Revenues generated from the Insured Deposit Account agreement and a sweep program that is offered to eligible clients of the Company whereby clients' un-invested cash is swept to third party institutions participating in the program.
12. Consist of client margin balances, segregated cash, deposits paid on securities borrowing and other cash and interest-earning investment balances.
13. Market fee-based plus money market mutual fund revenue.
14. Impact on spread-based and money market mutual fund revenues and interest on debt in the next twelve months following an interest rate increase. Assumes fed funds increase results in a parallel shift to the LIBOR/SWAP yield curve. Sensitivity is valid for next +25bps of moves. Model updated as of Sep. 30, 2017.
SEPTEMBER QUARTER EARNINGS FY2017 32
APPENDIX…FOOTNOTES
15. Ending balances as of Sep. 30, 2017 consisted of $17.0B in client margin balances, $10.5B in segregated cash, and $4.1B in other balances.
16. Includes operating expenses and other expense.
17. Client and brokerage-related asset balances, including client margin balances, segregated cash, insured deposit account balances, deposits paid on securities borrowing and other cash and interest-earning investment balances.
18. Source: Bloomberg end of period rates.
19. IOER rate forecast assumes a 67% probability weighted assumption of the fed funds future market as of 10/20/17.

SEPTEMBER QUARTER EARNINGS FY2017 33
Reconciliation of Non-GAAP Financial Measures

SEPTEMBER QUARTER EARNINGS FY2017 34
TD AMERITRADE HOLDING CORPORATIONRECONCILIATION OF NON-GAAP FINANCIAL MEASURES
Dollars in millions, except per share amounts(Unaudited)
Amount Diluted EPS Amount Diluted EPS Amount Diluted EPS Amount Diluted EPS Amount Diluted EPSNet income and diluted EPS - GAAP 211$ 0.39$ 231$ 0.44$ 185$ 0.35$ 872$ 1.64$ 842$ 1.58$ 1.50$ 2.00$ Non-GAAP adjustments:
Amortization of acquired intangible assets 22 0.04 19 0.04 20 0.04 79 0.15 86 0.16 0.25 0.25 Acquisition-related expenses 61 0.11 15 0.03 6 0.01 88 0.17 6 0.01 0.72 0.56 Income tax effect of above adjustments (31) (0.05) (13) (0.03) (10) (0.02) (63) (0.12) (35) (0.07) (0.37) (0.31)
Non-GAAP net income and non-GAAP diluted EPS 263$ 0.49$ 252$ 0.48$ 201$ 0.38$ 976$ 1.84$ 899$ 1.68$ 2.10$ 2.50$
Note: The term "GAAP" in the following explanations refers to generally accepted accounting principles in the United States.
* Represents the range of the Non-GAAP Diluted EPS included within the October 24, 2017 Outlook Statement.
(1)
Sept. 30, 2017 Sept. 30, 2016 Sept. 30, 2017June 30, 2017
Fiscal Year Ended
Fiscal Year EndingQuarter Ended
Non-GAAP Net Income and Non-GAAP Diluted EPS (1)Sept. 30, 2016 Sept. 30, 2018*
Non-GAAP net income and non-GAAP diluted earnings per share (EPS) are non-GAAP financial measures as defined by SEC Regulation G. We define non-GAAP net income as net income adjusted to remove the after-tax effect of amortization of acquired intangible assets and acquisition-related expenses. We consider non-GAAP net income and non-GAAP diluted EPS as important measures of our financial performance because they exclude certain items that may not be indicative of our core operating results and business outlook and will allow for a better evaluation of the operating performance of the business and facilitate a meaningful comparison of our results in the current period to those in prior and future periods. Amortization of acquired intangible assets is excluded because management does not believe it is indicative of our underlying business performance. Acquisition-related expenses are excluded as these costs are directly related to our acquisition of Scottrade Financial Services, Inc. and are not representative of the costs of running the Company’s on-going business. Non-GAAP net income and non-GAAP diluted EPS should be considered in addition to, rather than as a substitute for, GAAP net income and diluted EPS.
Diluted EPS Range

SEPTEMBER QUARTER EARNINGS FY2017
SEPTEMBER QUARTER EARNINGS FISCAL 2017 October 24, 2017
TD Ameritrade Holding Corporation (Nasdaq: AMTD). Brokerage services provided by TD Ameritrade, Inc., member FINRA/SIPC, and TD Ameritrade Clearing, Inc., member FINRA/SIPC, subsidiaries of TD Ameritrade Holding Corp. TD Ameritrade is a trademark jointly owned by TD Ameritrade IP Company, Inc. and The Toronto-Dominion Bank. © 2017 TD Ameritrade IP Company, Inc. All rights reserved. Used with permission.