septic tank effluent denitrification with …septic tank effluent denitrification with...
TRANSCRIPT
Proceedings of the 1998 Conference on Hazardous Waste Research348
SEPTIC TANK EFFLUENT DENITRIFICATIONWITH SULFUR/LIMESTONE PROCESSES
J. Shan and T.C. Zhang
Department of Civil Engineering, University of Nebraska-Lincoln, Omaha Campus, Omaha,NE 68182-0178; Phone: (402) 554-3784, Fax: (402) 554-3288
Septic tanks are the second largest source of groundwater nitrate contamination in Nebraska. In thisstudy, the feasibility of coupling a conventional lateral field with a sulfur/limestone layer to treat nitrate in septictank effluent was investigated using column reactors to simulate the septic tank soil adsorption system. Theeffects of different hydraulic loading rates, nitrogen loading rates, the depth of sulfur/limestone layers, and theratio of sulfur/limestone to gravel on reactors� performance were investigated. The profiles of ammonium, nitrite,nitrate, sulfate, calcium, and other parameters along the depth of the reactors were measured. Significantnitrification was observed in the sand layer. Significant denitrification, sulfate production, and hardnessproduction were observed in the sulfur/limestone layer. The results showed the sulfur/limestone method wasvery effective in denitrification, while the high concentration of sulfate and hardness and the existence of sulfidein effluent might be limiting factors in its application.
INTRODUCTION
Nitrate contamination in groundwater has become an increasingly serious problem in the U.S.,
especially in agriculture-oriented states such as Nebraska. Septic tank systems are the most
common form of on-site wastewater management systems. However, a septic tank system usually
fails to treat nitrate and other contaminants, which makes septic tank systems the second largest
source of nitrate contamination in groundwater. In Nebraska, approximately 30% of wastewater is
treated by septic tank systems. According to the Nebraska Department of Environmental Quality
(NDEQ), about 40% of these septic systems are contaminating groundwater with nitrate and other
contaminants. Thus, it�s imperative to remove nitrate from septic tank system effluent.
One of the most efficient methods to treat nitrate is the biological denitrification process,
including both heterotrophic and autotrophic denitrification. Heterotrophic biological denitrification
is effective in nitrate removal as long as there is sufficient external organic carbon to support het-
erotrophic bacteria for growth. However, in septic tank systems, external organic carbon, such as
BOD or COD, is usually degraded very efficiently in the conventional lateral field, and nitrification
also occurs very efficiently at the same time in the lateral field. Therefore, there is not enough
external organic carbon source to facilitate heterotrophic denitrification occurring, leaving nitrate to
leach through the septic tank systems.
In the past, researchers tried several alternatives to provide external carbon sources to facili-
tate the efficient occurance heterotrophic denitrification. The �peat� system utilized a layer of
sphagnum peat moss below the weeping tile bed (Brooks et al., 1984). The �Ruuk� system (Laak,
1981) mixed gray water with treated black water to provide an external carbon source. The
ABSTRACT
Key words: septic tank, nitrate, denitrification, sulfur/limestone method, groundwater
Proceedings of the 1998 Conference on Hazardous Waste Research 349
recirculating sand filter system (Piluk and Hao, 1989) returned a portion of the treated wastewater
to the soil adsorption system. However, these methods only achieved partial nitrogen removal (40-
90%).
The objectives of this study are (1) to investigate the feasibility of coupling a sulfur/limestone
autotrophic denitrification (SLAD) layer with a conventional lateral field to treat nitrate in septic tank
effluent; and (2) to evaluate effects of different operational conditions and parameters on the reac-
tors� performance.
The SLAD process utilizes autotrophic denitrificans (Thiobacillus denitrificans, and
Thiomicrospira denitrificans) to reduce nitrate to nitrogen gas. These denitrificans can use
inorganic carbon compounds (i.e., CO2, HCO
3-) as their carbon source, nitrate as the electron
acceptor, and elemental sulfur as the electron donor. The stoichiometric equation of sulfur-based
autotrophic denitrificans is as follows (Batchelor and Lawrence, 1978a, 1978b):
Since hydrogen ions are produced in this reaction, limestone needs to be introduced to provide
alkalinity to maintain a neutral pH environment for the system.
In a septic tank system, the lateral field (the soil absorption system or the drain field) is the key
component for nitrate removal. To improve nitrate removal efficiencies, a layer of sulfur/limestone
(S/L) was introduced underneath the sand layer. COD removal and nitrification take place in the
sand layer, as in the conventional lateral field. After nitrification, the nitrate produced will enter the
SLAD layer, where denitrification takes place.
MATERIAL AND METHODS
System
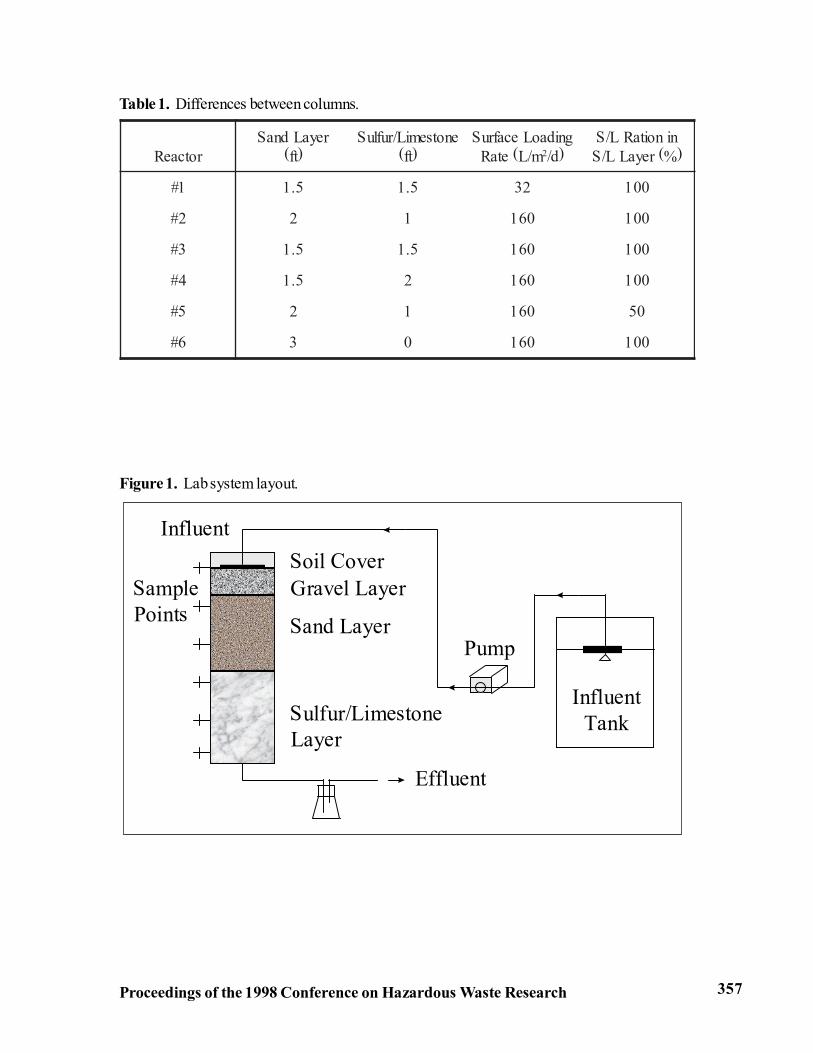
Four packed-bed columns, 8 in. in diameter and 4 ft. in height, were built to simulate the
lateral field (Figure 1). Each column was filled, from bottom to top, with 2 in. of soil, different
heights of S/L, different heights of sand, 6 in. of gravel, and 4 in. of top soil. Different heights of S/L
layers and sand layers were designed to study the optimal depth of each layer (Table 1).
The S/L layers in columns #2, #3, and #4 were completely filled with S/L. After five months
of operation, column #3 was refilled with S/L (50% v/v) and gravel (50% v/v) mixture. This was
designed to reduce the system capital cost because sulfur stone ($16/ton) is more expensive than
gravel. Column #4 was refilled with pure sand as a control column. In this paper, we call them
columns #5 and #6, respectively. The ratio of sulfur to limestone was 3:1 (volume : volume) in all
the S/L layers.
The hydraulic loading rate of column #1 was the EPA standard for the septic tank system. To
study the clogging effects, the hydraulic loading rates of other columns were five times larger than
the EPA standard to speed up the system deterioration (Table 1).
55 20 50 38 4 25 4 55 642 3 2 4 2 5 7 2 42S CO NO H O NH N C H NO SO H+ + + + → + + +− + − + (1)
Proceedings of the 1998 Conference on Hazardous Waste Research350
The feed solution (raw wastewater) used in this study was the effluent from a primary sedimen-
tation tank in a local wastewater treatment plant. Raw wastewater was pumped into the top of the
gravel layer of each column, i.e., beneath the top soil cover, and then dripped down. To prevent air
from penetrating into the column through the end of discharge ports, a triangle bottle was used to
prevent oxygen from penetrating into the columns.
The pump used in this study was a Cole-Parmer MasterFlex pump. To simulate the influent
loading peaks of a real septic tank system, a digital timer was used so that the pump ran only during
the following time periods: 4:00 a.m. - 4:30 a.m., 7:00 a.m. -7:30 a.m., 10 a.m. � 11 a.m., 4:00
p.m. - 4:30 p.m., 7:00 p.m. - 7:30 p.m., and 10 p.m. � 11 p.m. (total running time: 4 hr. per day).
The peak loading at 10 a.m. and 10 p.m. was used to simulate the morning and evening peak of
water usage.
Sampling methods
Influent samples were taken from the raw water tank. Effluent samples were collected directly
from the bottom of the columns. Sampling points were set every half-foot along the columns. Dry
paper towels were put into the sampling points and taken out after 1 - 2 hours. Water in the paper
towel was then squeezed out and filtered through a 0.45 µm filter membrane for analysis. Control
tests showed no significant interference in analytical results was introduced by using paper towels as
the sampling media.
When testing the columns, 2 - 4 sets of samples were taken in each column. The median
values are presented in this paper. Average data are not used because the influent of each set might
vary. However, the similarity among all the data sets of each column suggests the validity of data.
Analytical methods
A Dionex 500 IC/HPLC, equipped with an AS12A anion column or a CS14A cation column
and a CD20 conductivity detector, was used to analyze NO2-, NO
3-, NH
4+, SO
42-, and Ca2+ of all
the samples. Alkalinity, S2-, COD, and pH were analyzed for influent and effluent samples. Alkalin-
ity and S2- were analyzed by the Standard Method (APHA et al., 1992). COD was analyzed by
the HACH method (HACH, 1992). pH was measured using a Jenco pH electrode.
RESULTS AND DISCUSSION
COD and nitrogen removal
The influent COD was about 300 mg/L, and all effluent CODs were lower than 30 mg/L after
one week of operation. The influent nitrogen was 30 - 50 mg/L as total nitrogen (TN). During the
first month, there were times when the NO3- and NO
2- concentrations in effluent were high (5 mg N/
L and 0.7 mg N/L, respectively). After that, the effluent NO2- remained lower than the detection
limit (0.1 mg N /L); the effluent NO3- never exceeded 1 mg N/L; and the effluent NH
4+ was always
Proceedings of the 1998 Conference on Hazardous Waste Research 351
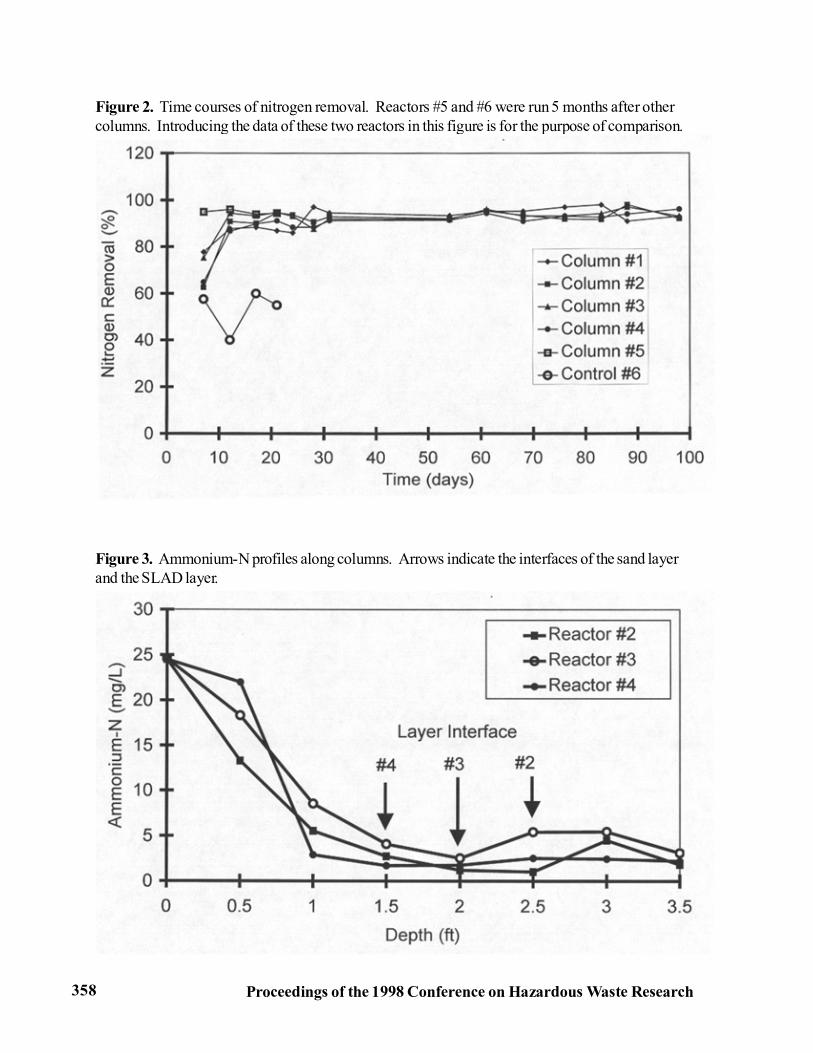
lower than 4 mg N /L. The total nitrogen removal efficiency was > 90%. The control column only
achieved about 50% nitrate removal, with the effluent nitrate concentrations of 15 - 20 mg/L (Figure
2).
Nitrification and denitrification
Nitrification is the process in which NH4+ is oxidized to NO
3-. NO
2- is an intermediate of the
reaction. As shown in Figures 3 to 5, as wastewater flowed down the sand layers of the columns,
NH4+ concentrations gradually decreased, while NO
3- concentrations increased, suggesting that
nitrification occurred in the sand layer. However, NH4+ concentrations could not be reduced to
zero. They remained at about 2-3 mg N/L, and even increased a little bit in S/L layers. This may
be caused by the anaerobic environment, or by the biological metabolism of denitrificans in the S/L
layer.
Figure 4 shows two nitrite peaks along the columns. The first peak is due to nitrification, while
the second is due to denitrification. Figures 4 and 5 indicate that significant denitrification did occur
in the S/L layer. However, one should note that, in Figure 5, the nitrate concentration always
reached its peaks before the interface of the sand layer and S/L layer, indicating that heterotrophic
denitrification might also occur near the end of the sand layer.
To study the effects of initial NH4+ concentrations on the performance of the columns, different
NH4+ concentration was introduced by spiking NH
4Cl in the raw wastewater. Figure 6 shows that
when the initial NH4+ concentration was low, the sand layer could oxidize most of the NH
4+. But
when the sand layer could not oxidize all of the ammonium, the NH4+ concentration would not
decrease in the S/L layer. This suggests that no nitrification took place in the S/L layer, which might
have been caused by the anaerobic environment in the S/L layer. When the spiked NH4+ concen-
tration increased to 20 mg N/L, and the corresponding total nitrogen in the raw wastewater was
approximately 70 - 80 mg TN/L, the effluent NH4+ reached 2.0, 7.5, and 10.5 mg N/L in columns
#2, #3, and #4, respectively. This suggests that when the initial total nitrogen is about 70 to 80 mg/
L, column #4 with 1-foot of sand layer cannot guarantee the accomplishment of nitrification, while
column #2 can still perform very well due to the longer sand layers. Since TN of 80 mg/L is a
typical concentration in septic tank effluent, at least two feet of the sand layer is required in the soil
adsorption system.
Fed with all the initial NH4+ concentrations, column #2, which had only one foot of S/L layer,
reached almost total denitrification. After reaching steady state, the highest NO2- concentration in
the effluent of column #2 remained much lower than 1 mg/L, usually lower than the detection limit.
These results suggested that 1 foot of S/L layer is enough for the initial TN concentration as high as
80 mg TN/L, while the sand layer must have a length of 2 feet to complete nitrification. The stan-
dard depth of the lateral field is 2 - 4 feet. Therefore, introduction of a S/L layer underneath the
Proceedings of the 1998 Conference on Hazardous Waste Research352
sand layer will not significantly increase the depth of the septic tank system, and thus, will not
increase the construction capital cost significantly.
Column #5, which had 50% gravel in the S/L layer, also achieved a low effluent NO3- concen-
tration. Since the sulfur/limestone in column #5 was taken from column #3, it already had biomass
on it. Therefore, after only one week, the effluent NO3- concentration became 0.1 mg N/L and
remained at this level. Other experiments conducted in the authors� research group showed that
mixing S/L with up to 67% of gravel could achieve denitrification well (Flere and Zhang, 1998).
Thus the sulfur limestone dosage can be greatly reduced to further lower the cost.
Sulfate/sulfide production
In all S/L columns, sulfate production was observed in the first half-foot of the S/L layer
(Figure 7), where nitrate removal was also significant. Effluent sulfate ranged from 300 to 400 mg/L
except for column #1, which will be discussed later. There was no significant difference in sulfate
production among the different columns. No sulfate production was observed in the control
column.
In most of the columns, as shown in Figure 7, there was a decrease of sulfate in the deeper
part of the S/L layer. Since sulfide production was observed in all of the columns, it was believed
that sulfate was reduced into sulfide in the S/L layer by sulfate-reducing bacteria, which utilized the
organic carbon released by the endogenous respiration of autotrophic bacteria. Only the effluent
sulfide was measured due to the limitation of large quantities of the sample volume. The effluent
sulfide ranged from 1.5 to 10 mg/L. There was no significant difference in sulfide production among
the different columns. No sulfide production was observed in the control column.
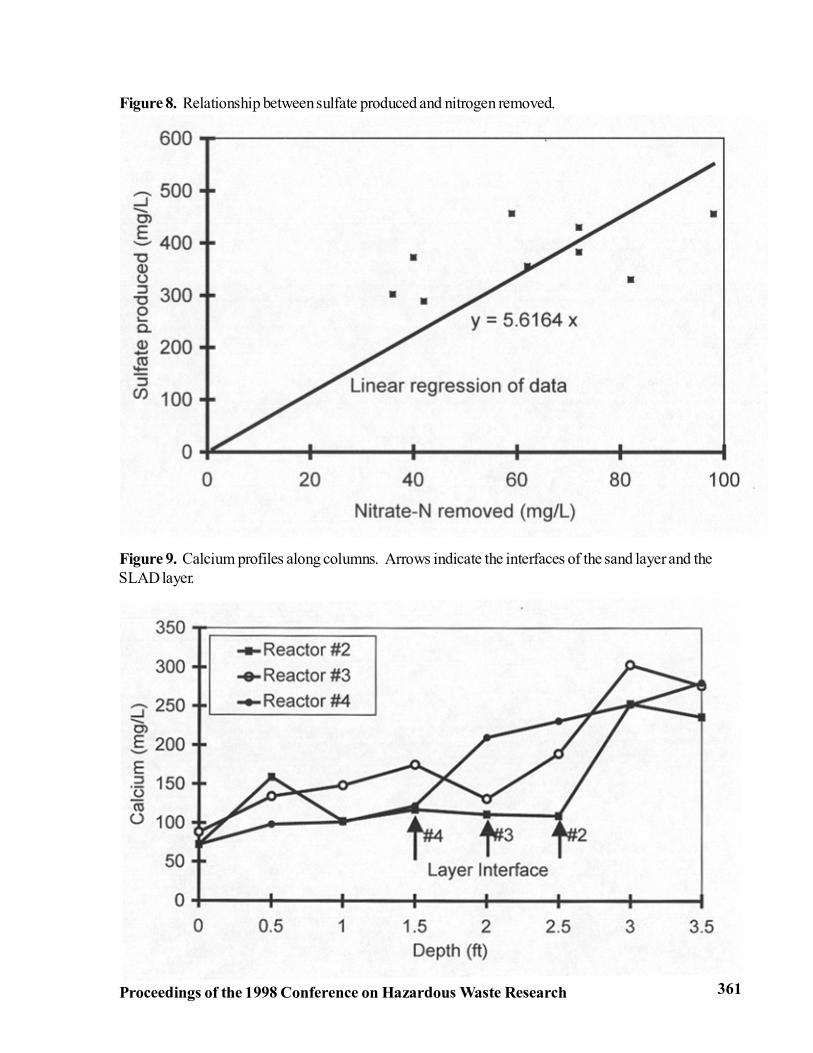
The stoichiometric equation indicates that to reduce every 1 mg of nitrate-N, 7.5 mg of SO42-
will be produced. In this study, it was found that the ratio of sulfate produced to nitrogen removed
ranges from 4.0 to 9.3, with an average of 6.45 (Fig. 8). Considering that sulfide produced might
be from sulfate reduction, and assuming that 10 mg/L sulfide was produced in each column, the
average ratio of sulfate produced to nitrogen removed becomes 6.98, which is very close to the
theoretical value. This suggests that all sulfate produced in columns #2, #3, and #4 (but not includ-
ing #1) was due to autotrophic denitrification.
There was no difference in sulfate production between columns #2 and #5. Column #2 had a
100% S/L layer, while column #5 had a layer of 50% gravel plus 50% S/L. This is reasonable
because the nitrogen-loading rates in both columns were the same, and the removal efficiencies
were the same. Thus, the sulfate production should be the same according to the stoichiometric
equation.
Proceedings of the 1998 Conference on Hazardous Waste Research 353
Calcium production
The calcium increase was observed in all S/L columns (Figure 9), especially in the first half-
foot of the S/L layer, where sulfate production was also significant. The calcium came from lime-
stone, which was used to neutralize the hydrogen ions produced in the autotrophic denitrification
process. During this reaction, calcium ions are released, increasing the hardness. The effluent
hardness ranged from 400 to 600 mg CaCO3/L. No calcium production was observed in the
control column.
Based on equation (1) and equation (2),
1 mg N removed will consume 4.57 mg CaCO3 alkalinity. This is equal to 1.82 mg Ca or 4.57 mg
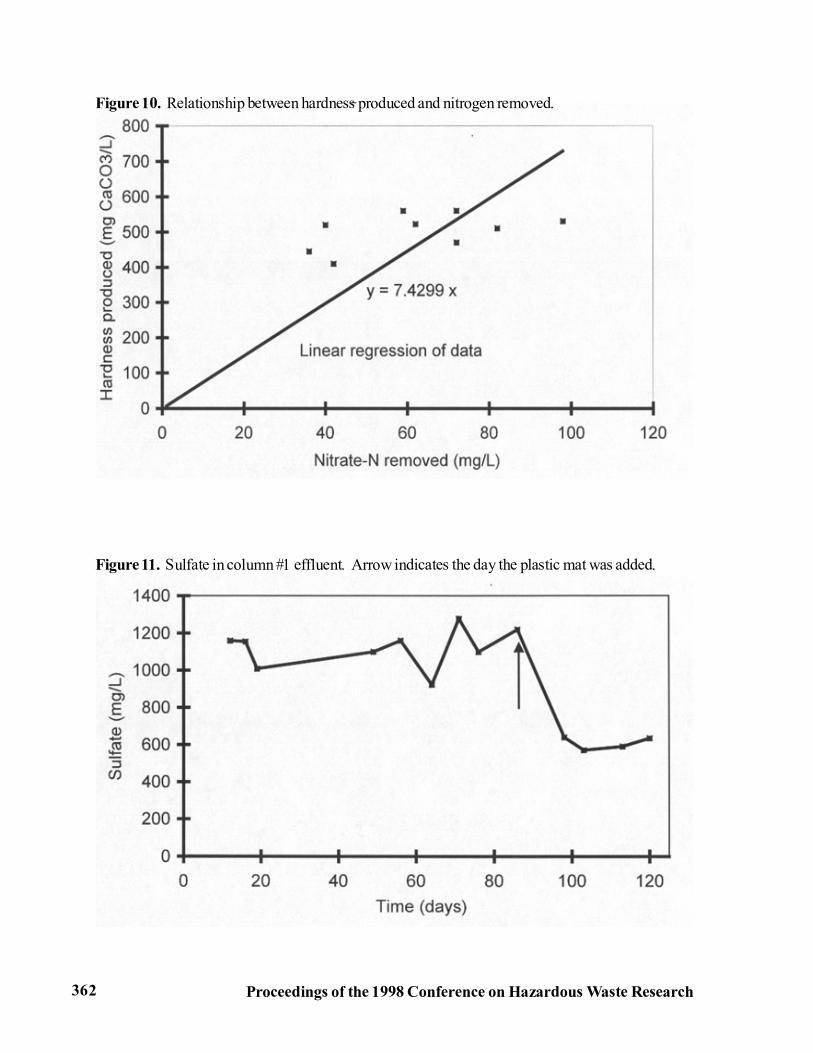
CaCO3 hardness. However, the lab data shown in Figure 10 suggests that the ratio of hardness
produced to nitrogen removed ranges from 8.0 to 10.3, with an average of 9.50.
Analysis of the system effluent indicated the effluent alkalinity was exclusively made up of
bicarbonate and the pH in the SLAD column was between 6 and 8. Thus, what actually happened
in the S/L layer should be equation (1) and equation (3):
The ratio of hardness production to nitrogen removed, based on equations (1) and (3), is 9.14. The
average ratio (9.50) obtained in this study is very close to this value, indicating the calcium produced
(hardness increase) is majorly due to autotrophic denitrification.
Influence of soil cover
Column #1 had the lowest hydraulic loading rate and the lowest nitrogen removal efficiency.
But in the first few months, the effluent sulfate was always higher than 1000 mg/L. This cannot be
explained by equation (1). It should be noted that an insufficient COD loading rate was applied to
column #1, and therefore, oxygen was not used up in the sand layer and could penetrate into the S/
L layer creating an aerobic environment. Therefore, the presence of sulfur-utilizing but non-denitri-
fying bacteria such as Thiobacillus thiooxidans became possible. Thiobacillus thiooxidans is an
autotrophic acidophilic bacterium that can reduce elemental sulfur and sulfides into sulfates and
sulfuric acid under strict aerobic conditions (S0 + 1.5 O2 + H
2O → H
2SO
4 and S2- + 2O
2 + 2H+ →
H2SO
4) on the basis of the sulfur-oxidizing enzyme and sulfite-oxidizing enzyme systems (Suzuki et.
al., 1992). The microorganisms can oxidize elemental sulfur at acidic pH or at neutral pH, but favor
an acidic pH which allows them to reproduce quickly. However, they can only survive under
aerobic conditions. This is why in columns #2, #3, and #4, sulfate was not produced at as high of
rates as in column #1, since columns #2 to #4 were under anaerobic conditions.
CaCO H O Ca HCO OH3 22
3+ → + ++ − − (3)
CaCO H Ca H CO32
2 32+ → ++ + (2)
Proceedings of the 1998 Conference on Hazardous Waste Research354
It was found that the EPA standard for soil cover is 1 to 5 feet, while the soil cover used in
column #1 was only 4 inches. To eliminate the effects of T. thiooxidans on the SLAD process, a
plastic mat was used over the soil cover to prevent air from getting into column #1. After one week,
the effluent sulfate dropped to 600 mg/L (Figure 11), indicating oxygen penetration was the cause of
the extremely high sulfate production. We can expect that oxygen penetration into the S/L layer will
not happen in the field because the soil cover will be much thicker than on the columns used in this
study.
pH, alkalinity and sulfur/limestone ratio
The effluent pH was stable, ranging from 6.4 to 7.6. The alkalinity in influent and effluent were
300 - 400 mg CaCO3/L in all S/L columns. This obviously is due to the presence of limestone.
The ratio of sulfur/limestone used in this study was 3:1 (v/v), based on a previous study (Zhang
and Lampe, 1997). Liu (1992) used a 1:1 ratio, but she also observed that most of the denitrificans
grew on the surface of sulfur stones. She suggested that increasing the portion of sulfur improved
the system performance. Previous study in the authors� group showed no difference in nitrate
removal between SLAD systems with different S/L ratios (1:1, 2:1, 3:1, 4:1, and 5:1). Van der
Hoek et al. (1992a and 1992b) observed that the consumption ratio of sulfur and limestone was
1:2, and there was no difference in nitrogen removal efficiency among three kinds of ratios (1:2, 1:1,
2:1).
Assume an operational duration of 30 years, and the loading rate, according to the EPA
standard, is 32 L/m2/d. Thus, 350,000 L wastewater will be pumped into one square meter of the
SLAD system. Assuming an influent nitrogen concentration of 40 mg N/L, the SLAD system will
remove 14 kg nitrate-N in 30 years. According to the stoichiometric equations (1) and (3), 2.5 kg
sulfur and 9.14 kg limestone will be consumed to remove 1 kg nitrogen. Therefore, 35 kg sulfur
and 128 kg limestone are needed. The specific gravity of CaCO3 is 1.6, and that of S is 1.13. So
the volume of sulfur is 40 liter and limestone 80 liter, which is a 1:2 ratio.
According to this study, a 0.3 m S/L layer is enough for most of the systems. Based on a 30
years of consumption, a 0.5 m S/L layer is recommended. This is 500 L/m2. Using a safety factor
of 2, about 250 liters of S/L is needed every square meter. Another 250 liters can be filled with
gravel. This is a mixture of 50% gravel and 50% 1:2 S/L. which could achieve denitrification
successfully, as proved by column #5 results.
CONCLUSIONS
(1) The SLAD system, combined with the soil absorption system, can remove nitrate from
septic tank effluent effectively. It is a low-cost, low-maintenance system that can be easily used in
small community wastewater treatment facilities. (2) Nitrification occurs mainly in the sand layer.
Denitrification happens in the S/L layer. The depth of these two layers should be greater than 2 feet
Proceedings of the 1998 Conference on Hazardous Waste Research 355
and 1 foot, respectively. (3) High concentrations of sulfate and hardness, and a certain amount of
sulfide, are produced in the process. This may become a concern. However, since the effluent was
discharged into groundwater, hardness and sulfate should not be a serious problem. (4) The soil
cover is very important in preventing air from entering the S/L layer. (5) The appropriate S/L layer
can consist of 50% gravel, 16% sulfur, and 34% limestone. This calculation is based on a 30-year
operational period.
ACKNOWLEDGEMENTS
This work was funded by the Nebraska Department of Environmental Quality (NDEQ).
REFERENCESAPHA, AWWA, and WEF, 1992. Standard Methods for the Examination of Water and
Wastewater, 18th Ed. American Public Health Association, American Water WorksAssociation, and Water Environment Federation, Washington, D.C.
Batchelor, B., and A.W. Lawrence, 1978a. Autotrophic denitrification using elemental sulfur, J.WPCF, 50(8), 1986-2001.
Batchelor, B., and A.W. Lawrence, 1978b. A kinetic model for autotrophic denitrification usingelemental sulfur, Water Research, 12, 1075-1084.
Brooks, J.L., C.A. Rock, and R.A. Struchtemeyer, 1984. Use of peat for on-site wastewatertreatment: II. Field studies. J. Environ. Qual., 13:524-529.
Flere, J.M., and T.C. Zhang, 1998. Sulfur-limestone autotrophic denitrification for treatment ofnitrate-contaminated water: fixed-bed column experiments, manuscript accepted by J. Env.Engrg. (ASCE).
HACH, 1992. Hach Water Analysis Handbook, 2nd Ed. Hach Company, Loveland, Corolado.
Laak, R., 1981. Denitrification of blackwater with graywater. ASCE J Environ. Eng. Div.,58:581-590.
Liu, L.H., 1992. A study on nitrate removal from groundwater served as drinking water by au-totrophic denitrification. Doctoral dissertation (in Chinese), Dept. Environ. Engi., TsinghuaUniversity, Beijing, China.
Piluk, R.J., and O.J. Hao, 1989. Evaluation of on-site waste disposal system for nitrogen reduc-tion. ASCE J Environ. Eng. Div., 115:725-740.
Schippers, J.C., J.C. Kruithof, F.G. Mulder, and J.W. van Lieshout, 1987. Removal of nitrates byslow sulfur limestone filtration, Aqua, 5,274-280.
Suzuki, I., C.W. Chan, and T.L. Takeuchi, 1992. Oxidation of elemental sulfur to sulfite byThiobacillus thiooxidan cells. Applied and Environ. Microbiology, 58:3767-3769.
van der Hoek, J.P., W.A.M. Hijinen, van C.A. Bennekom, and B.J Mijnarends, 1992a. Optimiza-tion of the sulfur-limestone filtration process for nitrate removal from groundwater. J.Water SRT-Aqua. 41:209-218.
Proceedings of the 1998 Conference on Hazardous Waste Research356
van der Hoek, J.P., J.W.N.M. Kappelhof, and W.A.M. Hijinen, 1992b. Biological nitrate removalfrom groundwater by sulfur/limestone denitrification. J. Chemical Tech. Biotech. 54:197-200.
Zhang, T.C., and D.G. Lampe, 1997. Sulfur-limestone autotrophic denitrification for remediation ofnitrate-contaminated surface water: batch experiments. Submitted to Wat. Res.
Proceedings of the 1998 Conference on Hazardous Waste Research 357
rotcaeRreyaLdnaS
)tf(enotsemiL/rufluS
)tf(gnidaoLecafruS
m/L(etaR 2 )d/ninoitaRL/S)%(reyaLL/S
1# 5.1 5.1 23 001
2# 2 1 061 001
3# 5.1 5.1 061 001
4# 5.1 2 061 001
5# 2 1 061 05
6# 3 0 061 001
Table 1. Differences between columns.
Effluent
Influent
Soil Cover
Sand Layer
Sulfur/Limestone Layer
Gravel Layer
Pump
InfluentTank
SamplePoints
Figure 1. Lab system layout.
Proceedings of the 1998 Conference on Hazardous Waste Research358
Figure 2. Time courses of nitrogen removal. Reactors #5 and #6 were run 5 months after othercolumns. Introducing the data of these two reactors in this figure is for the purpose of comparison.
Figure 3. Ammonium-N profiles along columns. Arrows indicate the interfaces of the sand layerand the SLAD layer.

Proceedings of the 1998 Conference on Hazardous Waste Research 359
Figure 4. Nitrite-N profiles along columns. Arrows indicate the interfaces of the sand layer andthe SLAD layer.
Figure 5. Nitrate-N profiles along columns. Arrows indicate the interfaces of the sand layer andthe SLAD layer.

Proceedings of the 1998 Conference on Hazardous Waste Research360
Figure 6. Effect of initial ammonium-N concentrations (ammonium-N in the raw water plus NH4Cl
spiked) on ammonium-N profiles. The interface of the sand layer and the SLAD layer is at 1.5 ft(Reactor #4).
Figure 7. Sulfate profiles along columns. Arrows indicate the interfaces of the sand layer and theSLAD layer.
Proceedings of the 1998 Conference on Hazardous Waste Research 361
Figure 8. Relationship between sulfate produced and nitrogen removed.
Figure 9. Calcium profiles along columns. Arrows indicate the interfaces of the sand layer and theSLAD layer.
Proceedings of the 1998 Conference on Hazardous Waste Research362
Figure 10. Relationship between hardness produced and nitrogen removed.
Figure 11. Sulfate in column #1 effluent. Arrow indicates the day the plastic mat was added.