sequence alignment techniques
DESCRIPTION
Sequence Alignment Techniques. In this presentation……. Part 1 – Searching for Sequence Similarity Part 2 – Multiple Sequence Alignment. Part 1. Searching for Sequence Similarity. Sequence similarity searches. - PowerPoint PPT PresentationTRANSCRIPT

Sequence Sequence Alignment Alignment TechniquesTechniques

In this presentation……
Part 1 – Searching for Sequence Similarity
Part 2 – Multiple Sequence Alignment

Part
1
Searching Searching for for
Sequence Sequence SimilaritySimilarity

Sequence similarity searches
• Sequence similarity searches of database enable us to extract sequences that are similar to a query sequence
• Information about these extracted sequences can be used to predict the structure or function of the query sequence
• Prediction using similarity is a powerful and ubiquitous idea in bioinformatics. The underlying reason for this is molecular evolution
Sequence alignment
• Any pair of DNA sequence will show some degree of similarity
• Sequence alignment is the first step in quantifying this in order to distinguish between chance similarity and real biological relationships
• Alignments show the differences between sequences and changes (mutations), insertions or deletions (indels or gaps) and can be interpreted in evolutionary terms
Alignment algorithms
• Dynamic programming algorithms can calculate the best alignment of two sequences
• Well-known variants are– the Smith-Waterman algorithm (local alignments)
– the Needleman-Wunsch algorithm (global alignments)
• Local alignments are useful when sequences are not related over their full lengths, e.g., proteins sharing only certain domains or DNA sequences related only in exons

Alignment scores and gap penalties
• A simple alignment score measures the number or proportion of identically matching residues
• Gap penalties are subtracted from such scores to ensure that alignment algorithms produce biologically sensible alignments without many gaps
• Gap penalties may be constant (independent of the length of the gap), proportional (proportional to the length of the gap) or affine (containing gap opening and gap extension contributions)
• Gap penalties can be varied according to the desired application

Similarity and homology
• Similarity may exist between any sequences• Sequences are homologous only if they
have evolved from a common ancestor• Homologous sequences often have similar
biological functions (orthologs), but the mechanism of gene duplication allows homologous sequences to evolve different functions (paralogs)
Similarity search in databases
• Sequences similar to a query can be found in a database by aligning it to each database sequence in turn and returning the highest scoring (most similar) sequences
• This can be achieved by dynamic programming algorithms but in practice faster approximate methods are often used

Statistical scores• The p value of a similarity score is the probability of
obtaining a score at least as high in a chance similarity between two unrelated sequences of similar composition
• Low p values indicate significance matches that are likely to have real biological significance
• The related E value is the expected frequency of chance occurrences scoring at least as high as the identified similarity
• A low p value for a similarity between two sequences can translate into a high E value for a search of a large database

Sensitivity and specificity
• These measures quantify the success of a database search strategy
• Sensitivity measures the proportion of real biological sequence relationships in the database that were detected as hits in the search
• Specificity is the proportion of the hits corresponding to real biological relationships
• Changing E and p value thresholds results in a trade-off between these complementary measures of success

Maximizing amino acid identities
• Protein sequences can be aligned to maximize amino acid identities, but this will not reveal distant evolutionary relationships

Evolution
• Protein-coding sequences evolve slowly compared with most other parts of the genome, because of the need to maintain protein structure and function
• An exception to this is the fast evolution that might occur in the redundant copy of a recently duplicated gene

Allowed changes
• Changes in protein sequences during evolution tend to involve substitutions between amino acids with similar properties because these tend to maintain the structural stability of the protein

Substitution score matrices
• These matrices give scores for all possible amino acid substitutions during evolution
• Higher scores indicate more likely substitutions• Example matrices are BLOSUM62 and PAM250• PAM stands for Accepted Point Mutations, and in
this case, the evolutionary distance of the matrix is 250 amino acid changes per 100 residues
• Dynamic programming algorithms for sequence alignment can operate using scores from these matrices

Significance of score matrices
• Substitution score matrices allow detection of distant evolutionary relationships between protein sequences
• It is possible to detect much more distant relationships by comparing protein sequences than by comparing nucleic acid sequences

Part of the sequence of human Huntington’s disease protein (Huntingtin) showing low complexity regions (underlined) associated with compositional bias towards glutamine (Q) and proline (P)
MATLEKLMKA FESLKSFQQQ QQQQQQQQQQ QQQQQQQQQQ PPPPPPPPPP PQLPQPPPQA QPLLPQPQPP PPPPPPPPGP AVAEEPLHRP KKELSATKKD RVNHCLTICE NIVAQSVRNS PEFQKLLGIA MELFLLCSDD AESDVRMVAD ECLNKVIKAL MSDNLPRLQL ELYKEIKKNG APRSLRAALW RFAELAHLVR PQKCRPYLVN LLPCLTRTSK RPEESVQETL AAAVPKIMAS
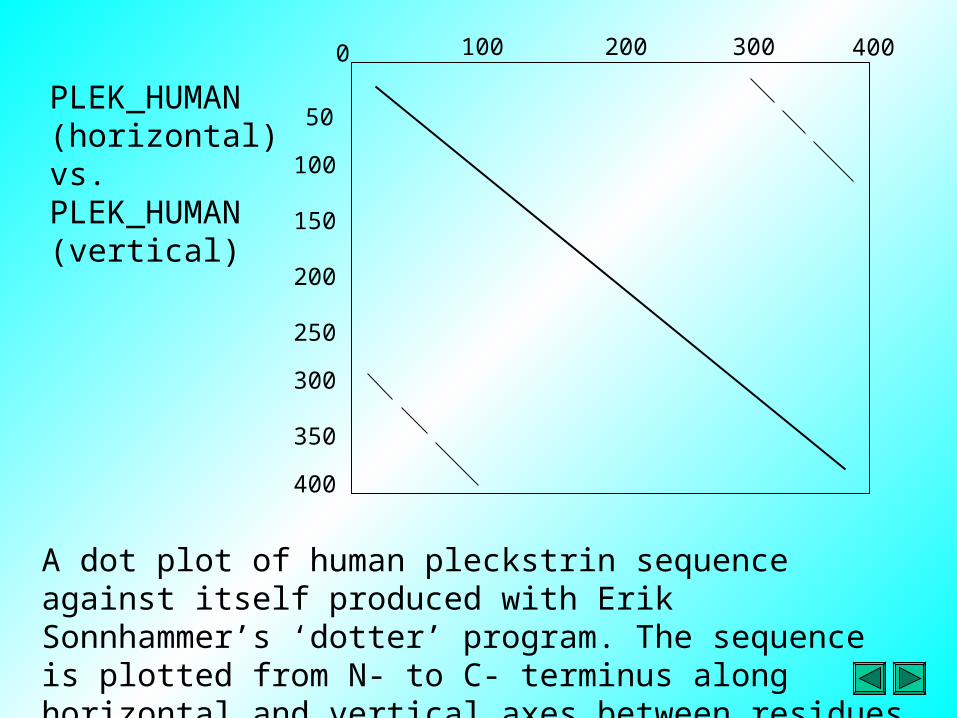
A dot plot of human pleckstrin sequence against itself produced with Erik Sonnhammer’s ‘dotter’ program. The sequence is plotted from N- to C- terminus along horizontal and vertical axes between residues 1 and approximately 350.
0 400100 200 300
400
100
200
300
350
50
150
250
PLEK_HUMAN (horizontal) vs. PLEK_HUMAN (vertical)
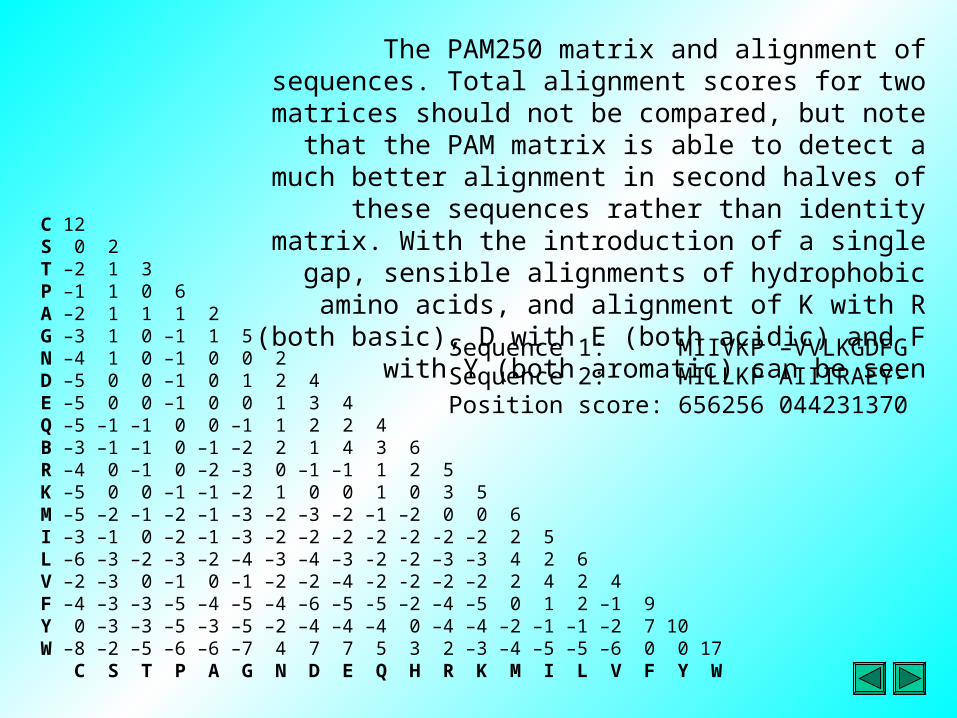
The PAM250 matrix and alignment of sequences. Total alignment scores for two matrices should not be compared, but
note that the PAM matrix is able to detect a much better alignment in second halves of these sequences rather than
identity matrix. With the introduction of a single gap, sensible alignments of hydrophobic amino acids, and alignment of K
with R (both basic), D with E (both acidic) and F with Y (both aromatic) can be seen
C 12S 0 2T –2 1 3P –1 1 0 6A –2 1 1 1 2G –3 1 0 –1 1 5N –4 1 0 –1 0 0 2D –5 0 0 –1 0 1 2 4E –5 0 0 –1 0 0 1 3 4Q –5 –1 –1 0 0 –1 1 2 2 4B –3 –1 –1 0 –1 –2 2 1 4 3 6R –4 0 –1 0 –2 –3 0 –1 –1 1 2 5K –5 0 0 –1 –1 –2 1 0 0 1 0 3 5M –5 –2 –1 –2 –1 –3 –2 –3 –2 –1 –2 0 0 6I –3 –1 0 –2 –1 –3 –2 –2 –2 -2 -2 -2 –2 2 5L –6 –3 –2 –3 –2 –4 –3 –4 –3 -2 -2 –3 –3 4 2 6V –2 –3 0 –1 0 –1 –2 –2 –4 -2 -2 –2 –2 2 4 2 4F –4 –3 –3 –5 –4 –5 –4 –6 –5 -5 –2 –4 –5 0 1 2 –1 9Y 0 –3 –3 –5 –3 –5 –2 –4 –4 –4 0 –4 –4 –2 –1 –1 –2 7 10W –8 –2 –5 –6 –6 –7 4 7 7 5 3 2 –3 –4 –5 –5 –6 0 0 17 C S T P A G N D E Q H R K M I L V F Y W
Sequence 1: MIIVKP –VVLKGDFGSequence 2: MILLKP AIIIRAEY-Position score: 656256 044231370

Figure 3. Display of the DNA unit. DNA can be described at several levels of detail. At the most detailed level, DNA can be characterized by the 5' and 3' termini at both external and internal positions; at the most abstract level, the substrate DNA can be one of 16 common structures. The goal is to provide methods for specifying the properties of DNA in as many ways as is natural for a scientist.

Figure 7. An initial experimental environment. The temperature is 37 degrees Celsius and the pH value is 7.4. No DNA polymerase I activity is possible
Part
2
Multiple Multiple Sequence Sequence AlignmentAlignment
Non specific sequence similarity
• Certain types of sequence similarity are less likely to be indicative of an evolutionary relationship than others are
• Examples of this are similarity between regions of low compositional complexity, short period repeats and protein sequences coding for generic structures like coiled coils

Similarity search filters
• Regions of the non specific sequence types can degrade the results of similarity searches and are often filtered out of query sequences prior to searching
• The programs SEG and DUST can be used to detect and filter low complexity sequences, XNU can filter short period repeats and COILS can detect the presence of potential coiled coil structures

Database types for searches
• Database and query sequences can be protein or nucleic acid sequences and different query strategies are required for different types and combinations
• In general, searches are more sensitive using strategies where protein-coding nucleic acid database and/or query sequences are first translated to protein sequences

Iterative database searches
• PSI-BLAST is an iterative search method that improves on the detection rate of BLAST and FASTA
• Each iteration discovers intermediate sequences that are used in a sequence profile to discover more distant relatives of the query sequence in subsequent iterations
• Potential problems with PSI-BLAST are associated with the potential for unrelated sequences to pollute the iterative search, and difficulties associated with the domain structure of proteins
• PSI-BLAST often detects up to twice as many evolutionary relationships as BLAST

Multiple sequence alignment
• Multiple alignment illustrates relationships between two or more sequences
• When the sequences involved are diverse, the conserved residues are often key residues associated with maintenance of structural stability or biological function
• Multiple alignments can reveal many clues about protein structure and functions
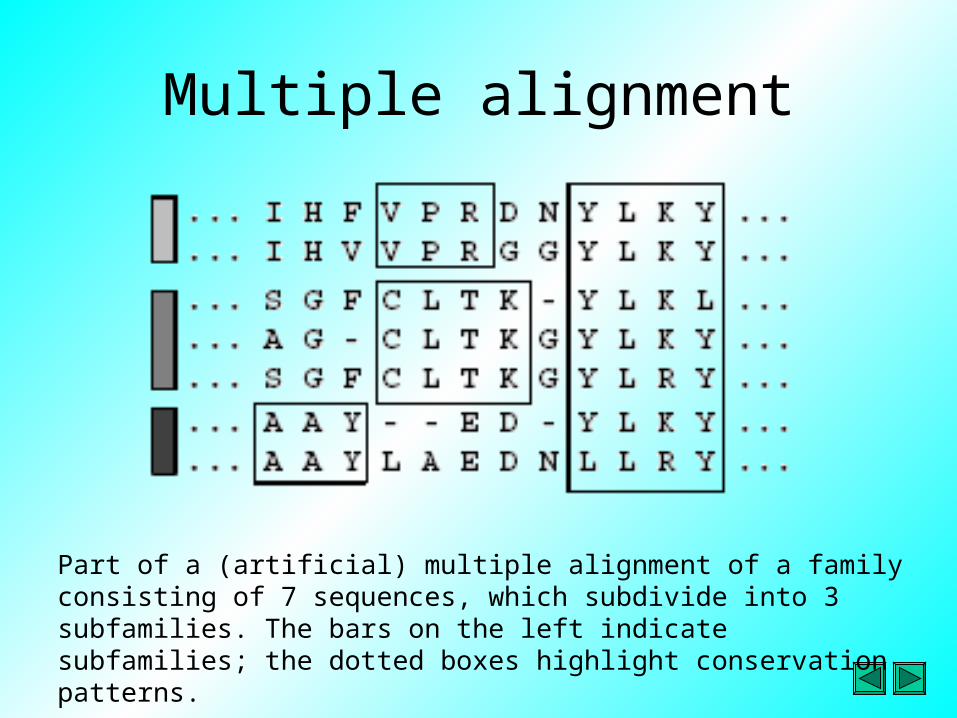
Multiple alignment
Part of a (artificial) multiple alignment of a family consisting of 7 sequences, which subdivide into 3 subfamilies. The bars on the left indicate subfamilies; the dotted boxes highlight conservation patterns.

Progressive sequence alignment
• Most commonly used software uses the method of progressive alignment
• This is a fast method, but frozen-in errors mean that it does not always work perfectly
• Biological knowledge can provide information about likely alignments, and where automatically produced alignments turn out to be imperfect, software for manual alignment editing is required
Protein families
• Assigning sequences to protein families is a very valuable way of predicting protein family (consensus sequences, conserved residues, residue patterns, sequence profiles, etc.)
• Many ways have been developed to represent protein family information and these have been stored in secondary protein family databases
Consensus sequences
• These condenses the information from a multiple alignment into single sequence
• Their main shortcoming is the inability to represent any probabilistic information apart from the most common residue at a particular position
• Derivation of consensus sequence illustrates that any protein family representation is subject to bias if the set of sequences from which it was derived is biased
PRINTS and BLOCKS• These represent protein families of multiply aligned
ungapped segments (motifs) derived from the most highly conserved regions of sequences
• By representing more of the sequence, they have the potential to be more sensitive than short PROSITE patterns
• The ability to match in only a subset of the motifs associated with a particular family means that they have the ability to detect splice variants and sequence fragments and to represent subfamilies
• WWW-based search engines for the databases are available

Protein domain families
• Many proteins are built up from domains in a modular architecture
• The study of protein families is best pursued as a study of protein domain families
• Prodom is a database of protein domain sequences created by automatic means from the protein sequence databases

Resources for domain families
• Pfam and SMART can be used for protein domain family analysis
• The integrated resource Interpro unites PROSITE, PRINTS, Pfam, Prodom and SMART

Visualization of similarities
• Dot plots are a very good way to visualize sequence similarity and find repeats
