sequence stratigraphic architecture of mut basin …etd.lib.metu.edu.tr/upload/1259480/index.pdf ·...
TRANSCRIPT

SEQUENCE STRATIGRAPHIC ARCHITECTURE OF MUT BASIN
ALONG RAMP TO REEFAL MARGIN TRANSITION
AND ITS DIAGENETIC IMPRINT
A THESIS SUBMITTED TO
THE GRADUATE SCHOOL OF NATURAL AND APPLIED SCIENCES
OF
THE MIDDLE EAST TECHNICAL UNIVERSITY
BY
H. ARMAĞAN DERMAN
IN PARTIAL FULLFILMENT OF THE REQUIREMENTS FOR THE DEGRE OF
MASTER OF SCIENCE
IN
THE DEPARTMENT OF GEOLOGICAL ENGINEERING
DECEMBER 2003
Approval of the Graduate School of Natural and Applied Sciences
Prof. Dr. Canan ÖZGEN
Director
I certify that this thesis satisfies all the requirements as a thesis for the
degree of Master of Science.
Prof. Dr. Asuman TÜRKMENOĞLU
Head of Department
This is to certify that we have read this thesis and that in our opinion it is
fully adequate, in scope and quality, as a thesis for the degree of Master of
Science.
Prof. Dr. Teoman NORMAN
Supervisor
Examining Committee Members
Prof. Dr. Teoman NORMAN
Prof. Dr. Asuman TÜRKMENOĞLU
Prof. Dr. Baki VAROL
Assoc. Prof. Dr. Sevinç ÖZKAN ALTINER
Assoc. Prof. Dr. Bora ROJAY
ABSTRACT
SEQUENCE STRATIGRAPHIC ARCHITECTURE OF MUT BASINALONG RAMP TO REEFAL MARGIN TRANSITION
AND ITS DIAGENETIC IMPRINT
Derman, H. Armağan
M.S., Department of Geological Engineering
Supervisor: Prof.Dr. Teoman NORMAN
December 2003, 81 pages
The whole Mediterranean was a site of carbonate deposition during
Miocene. Unlike other Miocene basins in the Mediteranean, the importance of
Mut Basin lies in its tectonically undisturbed nature that provides excellent
exposures to study sequence stratigraphic architecture and carbonate sedi-
mentology.
Opening of Mut Basin began during Oligocene; carbonate deposition
started during Early Miocene. The pre-Miocene rocks are characterized by
(from bottom to top), 1. ophiolites and Mesozoic limestones, 2. Eocene lacus-
trine limestones, 3. Burdigalian fluvial sandstones and conglomerates. The
carbonate deposition began in Miocene, settling on the preexisting topogra-
phy. Carbonates have been deposited in a ramp setting, where several
sequences formed. The ramp was partly subaerially exposed during Early
Miocene due to relative sea level fall; however, no significant lowstand
deposits were developed. The subsequent sea level rise caused transgres-
sive deposits to overlie this ramp sequence. The patch reefs on this ramp
exhibit a keep-up type depositional setting. As the transgression continued,
the basin topography controlled the type of depositional setting. Hence, a
iii
transition from ramp to reefal margin type setting occurred. In landward direc-
tion the topographically low areas became back reef lagoonal part of this
reefal margin. A mature reefal environment formed during highstand times,
which is characterized by a rich coral fauna / algal flora in the basinward side.
Some of the patch reefs of the ramp transformed into pinnacle reefs.
Diagenetic alterations are mostly related to duration and degree of sea level
fall, and therefore related to sequence boundaries.
The Miocene carbonates in the study area consist of six sequences
which may be used for correlation with other Miocene carbonates of the
Mediterranean region.
Keywords: Sequence Stratigraphy, Carbonate, Mut Basin, Reef, Diagenesis,
Miocene
iv

ÖZ
RAMPADAN RESİFAL BASEN KENARINA GEÇİŞTE MUT BASENİNİN SEKANS STRATİGRAFİK ÇATISI
VE DİAJENETİK İZLERİ
Derman, H. Armağan
Yüksek Lisans, Jeoloji Mühendisliği Bölümü
Tez Yöneticisi: Prof. Dr. Teoman Norman
Aralık 2003, 81 Sayfa
Miyosen'de bütün Akdeniz karbonat çökeliminin olduğu bir havzaydı.
Mut baseni, diğer Akdeniz basenlerinden farklı olarak, tektonizmadan etkilen-
memiş olmasıyla önemli bir yere sahiptir. Bu durum, sekans stratigrafisi ve
karbonat sedimantolojisi çalışmak için uygun bir ortam sağlamıştır.
Mut baseninde karbonat çökelimi erken Miyosen'de başlamıştır.
Miyosen öncesi kayaçlar, alttan üste doğru: 1) ofiyolitler ve Mesozoyik kireç-
taşları, 2) Gölsel kireçtaşları, 3) Nehir çökelleri ile temsil edilmektedir.
Karbonat çökelimi Miyosen başında mevcut topografyada başlamış ve ram-
pada devam etmiştir. Rampa üzerinde birkaç üçüncü derece sekans
çökelmiştir. Ramp erken Miyosen'de deniz seviyesinin düşmesinden ötürü
yüzeye çıkmış, ancak bu sırada belirgin bir "lowstand" çökelimi gerçek-
leşmemiştir. Bunu izleyen deniz seviyesi yükselimi yeni transgresif çökellerin
ramp çökellerini üzerlemesine neden olmuştur. Ramp üzerindeki yama resi-
fleri "keep up" tipinde depolanma yapısı göstermistir. Transgresyon devam
ettikce, basen topografyası depolanmanın yapısını kontrol etmistir. Bunun
sonucu olarak rampten bariyer resifine geçiş söz konusu olmuştur. Kara
tarafında çukur yerlerde karbonat çökelen lagünler oluşmuştur. Deniz
v
seviyesinin en yüksek olduğu zamanlarda özellikle mercan faunası / alg flo-
rası ile zengin olgun bir resifal ortam vardır. Basen tarafında ise yama resifleri
kule resifine dönüşmüştür. Diyajenetik değişimler, çoklukla deniz seviyesi
düşüşünün süresi ve derecesine bağlıdır, bu nedenle istif sınırları ile ilişkilidir.
Çalışma alanında altı farklı sekans ayırtlanmıştır. Bunlar Akdeniz'deki
diger sekanslar ile korele edilebilirler.
Anahtar Kelimeler: Sekans Stratigrafi, Karbonat, Mut Baseni, Resif, Diajenez,
Miyosen
vi

To My Parents
vii

ACKNOWLEDGMENTS
I am grateful to Prof. Dr. Teoman NORMAN for his guidance through-
out this research. I thank Assoc. Prof. Dr. Ahmet Sami DERMAN, who
inspired my interest in sedimentology, particularly in connection with carbon-
ate sequence stratigraphy. I would also like to thank Assoc. Prof. Dr. Sevinç
ÖZKAN ALTINER, who dated my samples. Many thanks to Mr. Feyyaz
RUZGAR, for his tolerance during the study. Thanks go to my mother for tol-
erating another geologist in the family, and to my sisters, for their support.
Finally, I would like to thank Kağan ATASOY for his support and motivation
during the study.
viii
TABLE OF CONTENTS
ABSTRACT.....................................................................................................iii
ÖZ...................................................................................................................v
ACKNOWLEDGMENTS...............................................................................viii
TABLE OF CONTENTS.................................................................................ix
LIST OF FIGURES........................................................................................xi
LIST OF SYMBOLS.....................................................................................xvi
CHAPTERS
1. INTRODUCTION....................................................................................1
1.1 Purpose and Scope.......................................................................1
1.2 Location of the study area............................................................2
1.3 Methods of study............................................................................2
1.4 Sequence Concept (Conceptual Framework).............................3
1.5 Previous Studies...........................................................................8
2. STRATIGRAPHY OF MUT BASIN.......................................................10
2.1 Regional Geology.........................................................................10
2.2 Statigraphy of the study area.......................................................13
3. SEQUENCE STRATIGRAPHIC ARCHITECTURE OF THE STUDY
AREA....................................................................................................22
3.1 Değirmenönü Section...................................................................22
3.2 Toskaba Hill Section.....................................................................25
3.3 Saytepe Section...........................................................................30
3.4 Çömelek Section..........................................................................33
3.5 Dereköy Section...........................................................................37
4. DIAGENETIC IMPRINT OF SEQUENCES..........................................40
5. CORRELATION OF SECTIONS.........................................................49
6. DISCUSSION......................................................................................61
ix
6.1 Definition of the sequences in the study area..............................61
6.2 Sea level oscillations....................................................................65
6.3 Evolution of the sequences in the study area..............................65
6.4 Recognition of abrasion surfaces in sequences..........................66
7. CONCLUSION......................................................................................68
7.1 Stratal relationships......................................................................68
7.2 Facies associations......................................................................69
7.3 Diagenetic Imprint........................................................................70
REFERENCES..............................................................................................71
APPENDIX
GLOSSARY OF TERMS..........................................................................77
x
LIST OF FIGURES
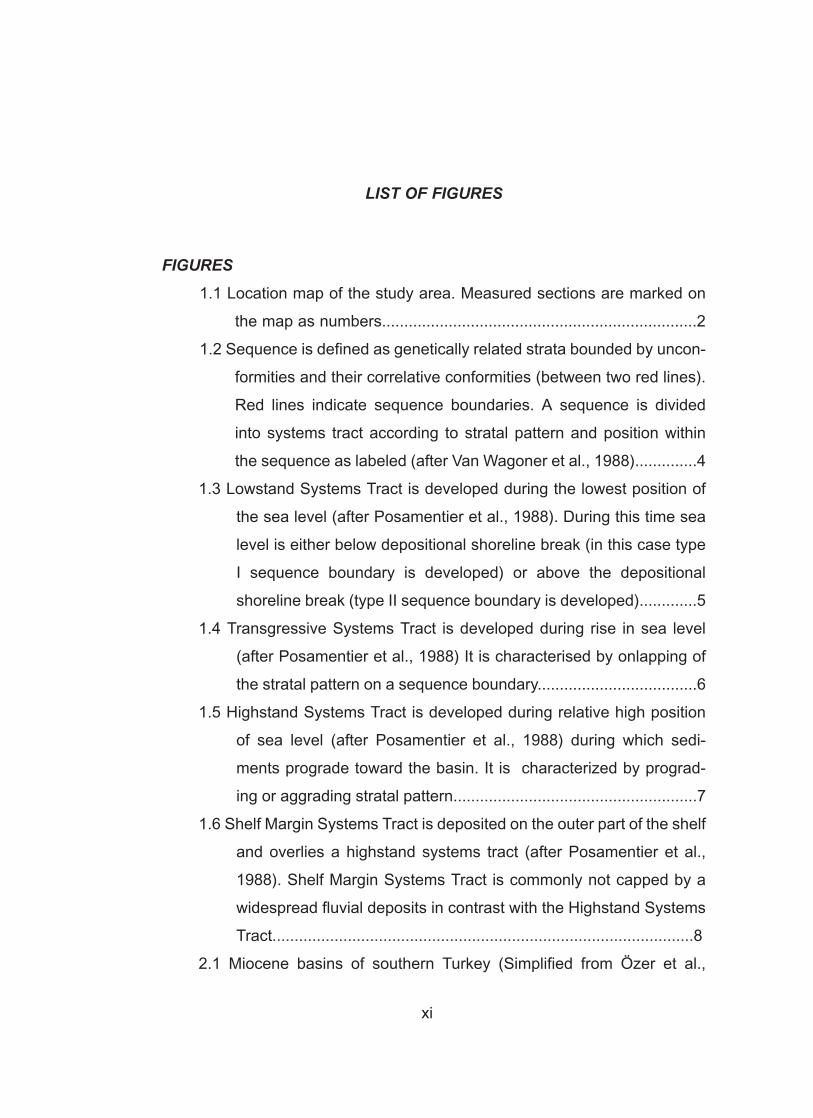
FIGURES1.1 Location map of the study area. Measured sections are marked on
the map as numbers.......................................................................2
1.2 Sequence is defined as genetically related strata bounded by uncon-
formities and their correlative conformities (between two red lines).
Red lines indicate sequence boundaries. A sequence is divided
into systems tract according to stratal pattern and position within
the sequence as labeled (after Van Wagoner et al., 1988)..............4
1.3 Lowstand Systems Tract is developed during the lowest position of
the sea level (after Posamentier et al., 1988). During this time sea
level is either below depositional shoreline break (in this case type
I sequence boundary is developed) or above the depositional
shoreline break (type II sequence boundary is developed).............5
1.4 Transgressive Systems Tract is developed during rise in sea level
(after Posamentier et al., 1988) It is characterised by onlapping of
the stratal pattern on a sequence boundary....................................6
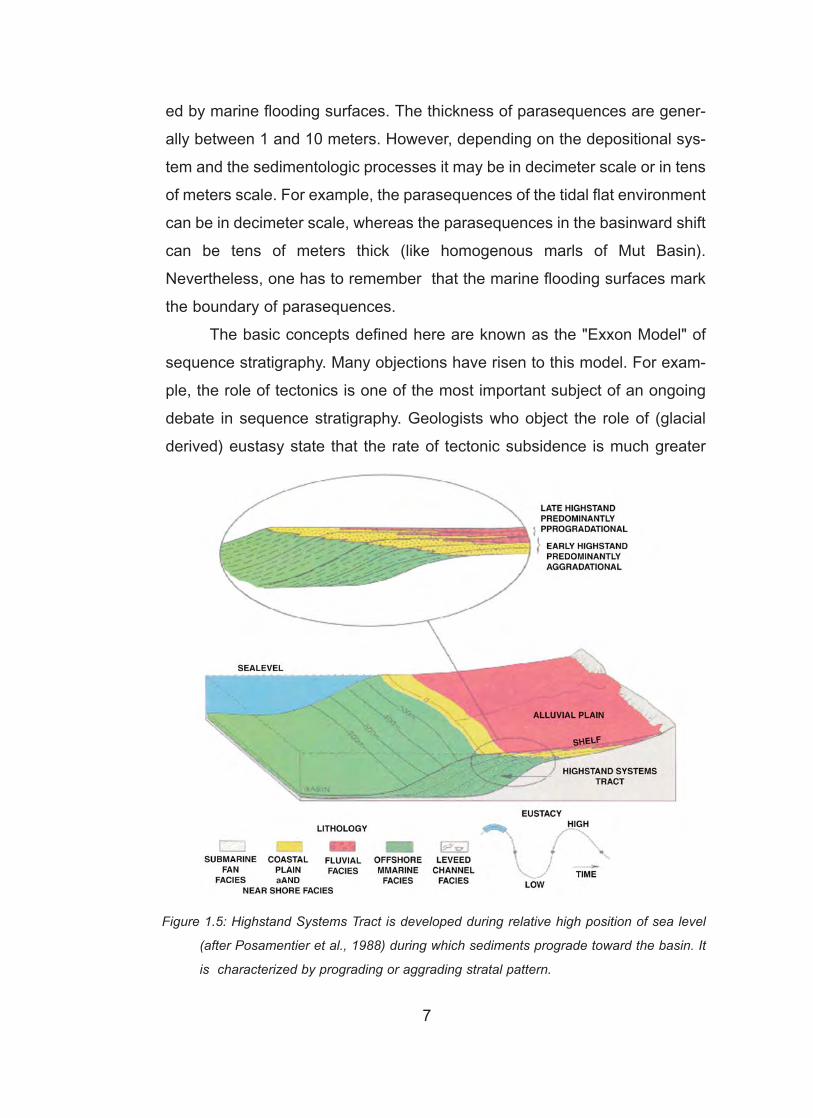
1.5 Highstand Systems Tract is developed during relative high position
of sea level (after Posamentier et al., 1988) during which sedi-
ments prograde toward the basin. It is characterized by prograd-
ing or aggrading stratal pattern.......................................................7
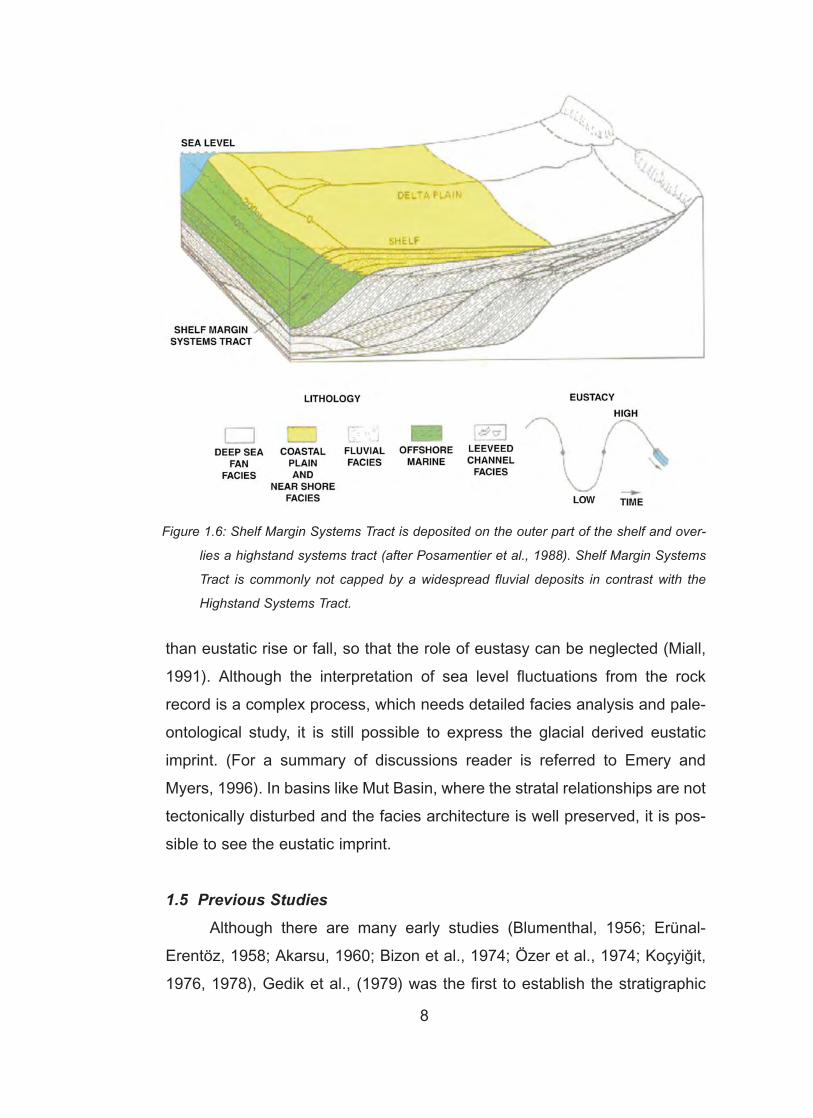
1.6 Shelf Margin Systems Tract is deposited on the outer part of the shelf
and overlies a highstand systems tract (after Posamentier et al.,
1988). Shelf Margin Systems Tract is commonly not capped by a
widespread fluvial deposits in contrast with the Highstand Systems
Tract...............................................................................................8
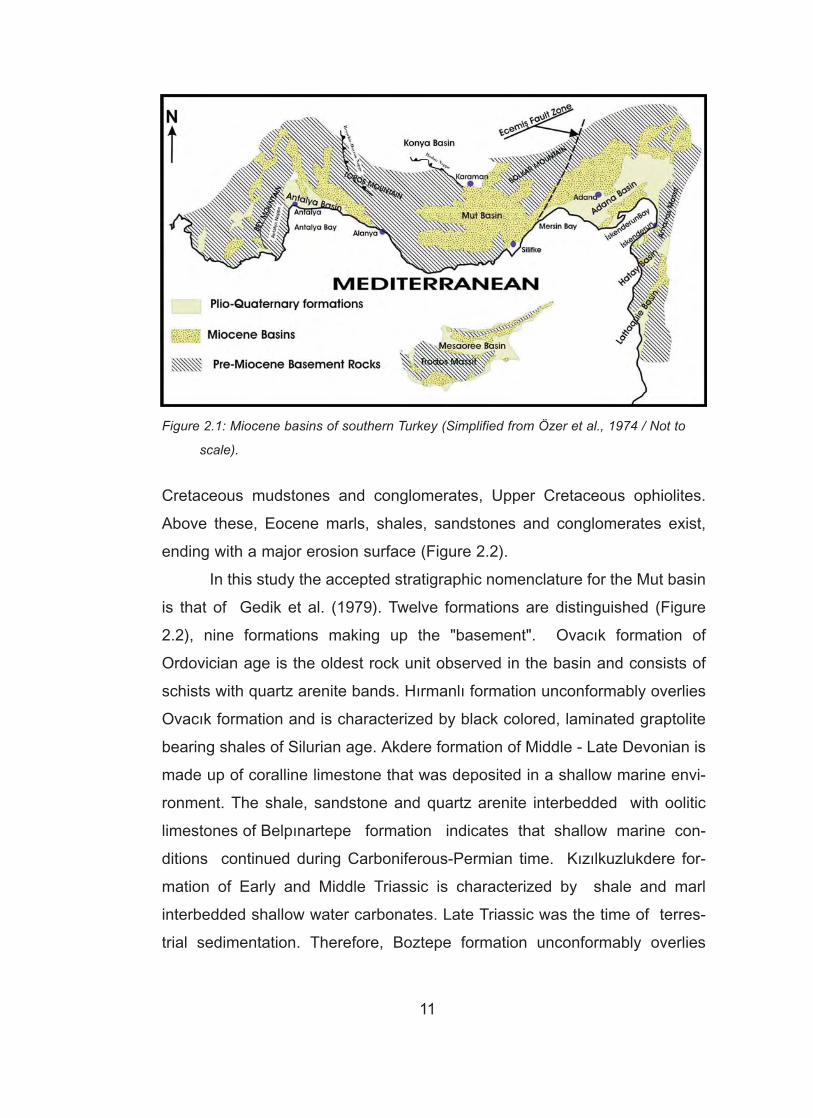
2.1 Miocene basins of southern Turkey (Simplified from Özer et al.,
xi
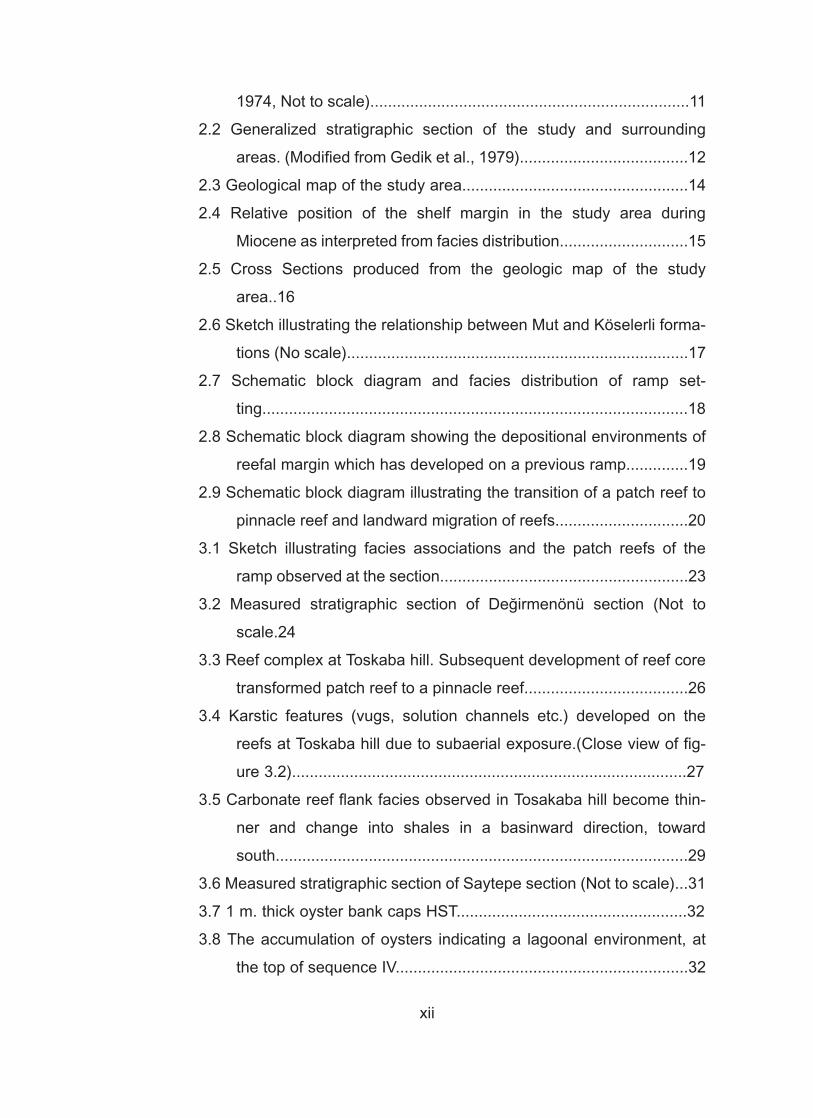
1974, Not to scale)........................................................................11
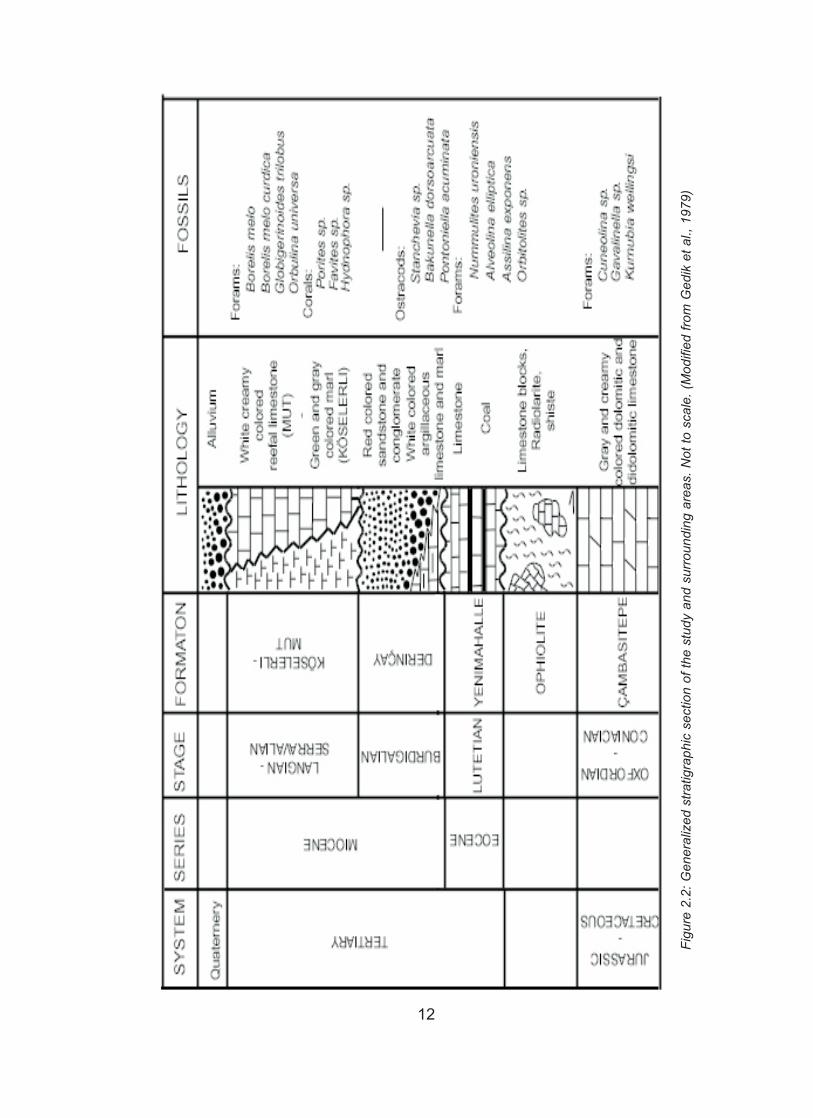
2.2 Generalized stratigraphic section of the study and surrounding
areas. (Modified from Gedik et al., 1979)......................................12
2.3 Geological map of the study area...................................................14
2.4 Relative position of the shelf margin in the study area during
Miocene as interpreted from facies distribution.............................15
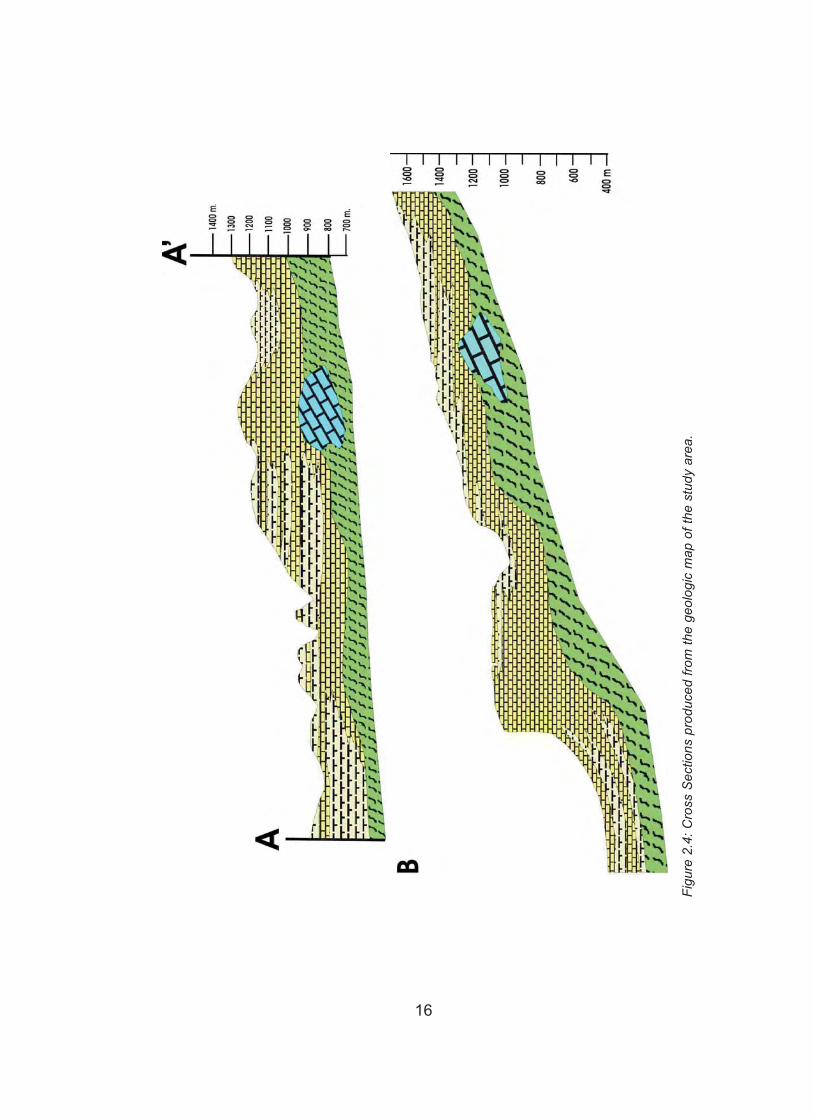
2.5 Cross Sections produced from the geologic map of the study
area..16
2.6 Sketch illustrating the relationship between Mut and Köselerli forma-
tions (No scale).............................................................................17
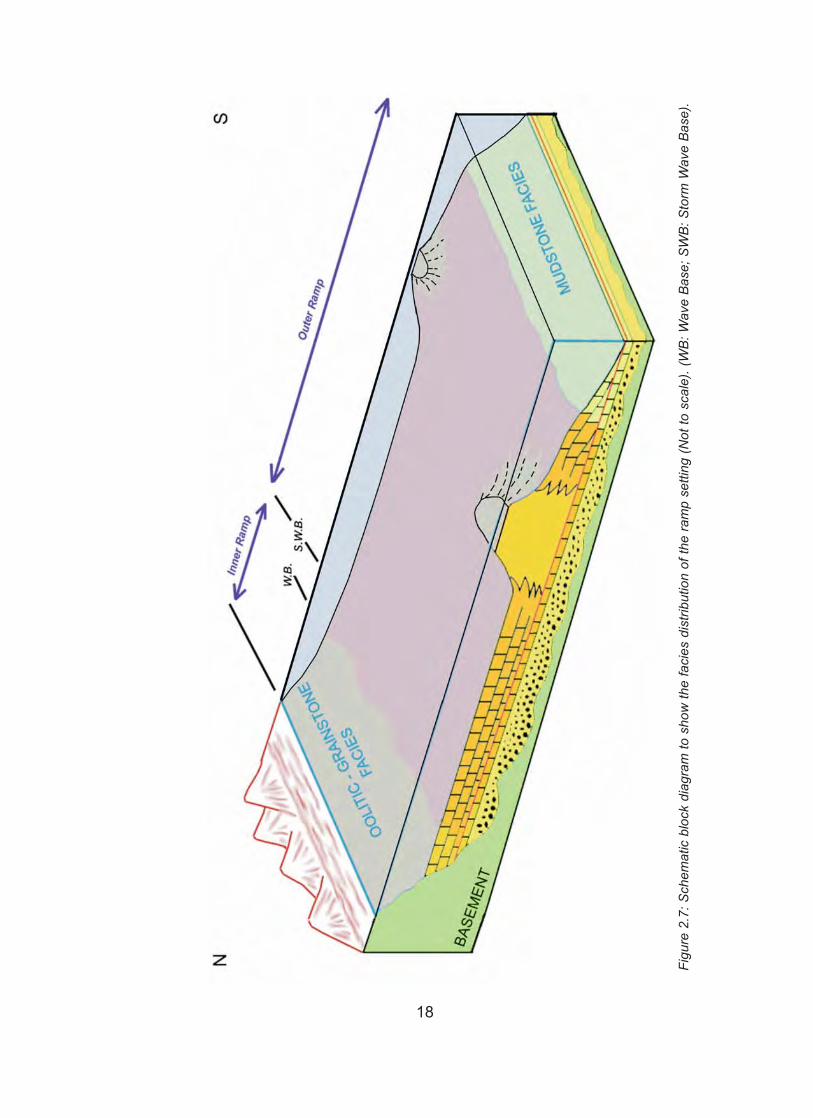
2.7 Schematic block diagram and facies distribution of ramp set-
ting................................................................................................18
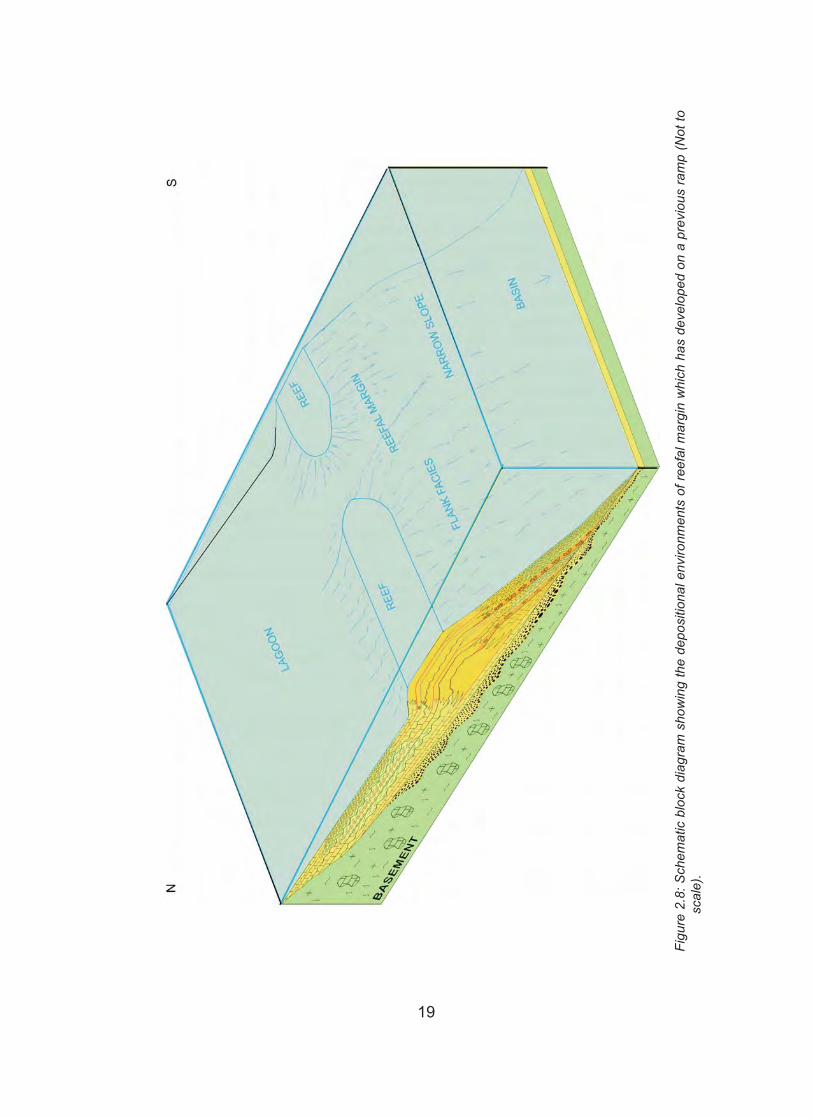
2.8 Schematic block diagram showing the depositional environments of
reefal margin which has developed on a previous ramp..............19
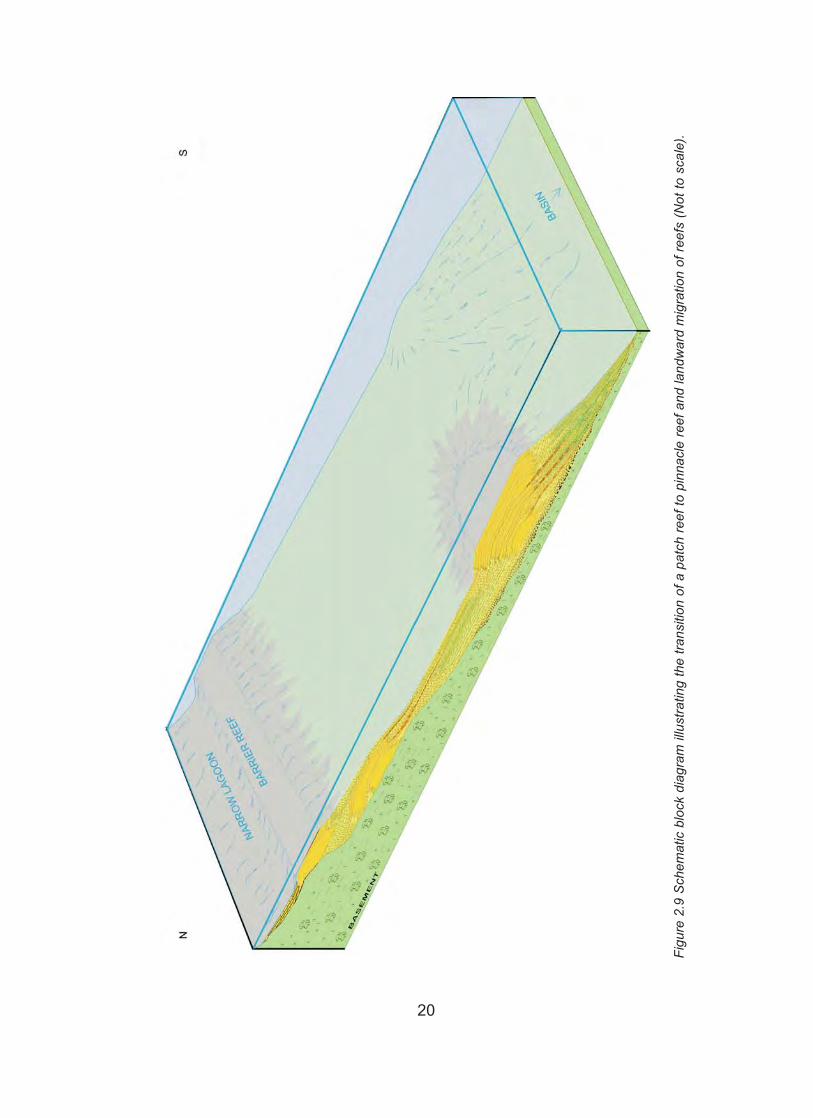
2.9 Schematic block diagram illustrating the transition of a patch reef to
pinnacle reef and landward migration of reefs..............................20
3.1 Sketch illustrating facies associations and the patch reefs of the
ramp observed at the section........................................................23
3.2 Measured stratigraphic section of Değirmenönü section (Not to
scale.24
3.3 Reef complex at Toskaba hill. Subsequent development of reef core
transformed patch reef to a pinnacle reef.....................................26
3.4 Karstic features (vugs, solution channels etc.) developed on the
reefs at Toskaba hill due to subaerial exposure.(Close view of fig-
ure 3.2).........................................................................................27
3.5 Carbonate reef flank facies observed in Tosakaba hill become thin-
ner and change into shales in a basinward direction, toward
south.............................................................................................29
3.6 Measured stratigraphic section of Saytepe section (Not to scale)...31
3.7 1 m. thick oyster bank caps HST....................................................32
3.8 The accumulation of oysters indicating a lagoonal environment, at
the top of sequence IV..................................................................32
xii

3.9 Measured stratigraphic section of Çömelek section (Not to scale)..34
3.10 The top of HST is capped by floatstone facies. The red to pink color
indicates iron impregnation, which is related to subaerial expo-
sure..............................................................................................35
3.11 Unconformity surface marks the boundary between two sequences.
Çömelek section, above clayey lime mudstone in Figure 3.9 (Pencil
15 cm.)..........................................................................................36
3.12 Red to pink color is dominant below the unconformity surface, sug-
gesting effects of subaerial exposure...........................................36
3.13 Measured stratigraphic section of Dereköy section (Not to scale..38
4.1 On the ramp sequence (sequence I) little porosity is present. Present
pore spaces are filled by calcite cement. There are some leaching.
This may be due to low porosity and permeability. Sample number
43 (Plane light x2.5)......................................................................42
4.2 On sequence II extensive leaching developed. This is possible either
in phreatic zone when water is undersaturated with respect to cal-
cite and/or in vadoze zone. Sample number 10 (Plane light,
x2.5).............................................................................................42
4.3 Iron oxide filled micropores are common along some surfaces.
(Plane light, x2.4)..........................................................................43
4.4 Especially in reefal facies facies specific (composition sensitive) dia-
genesis is common. Since corals are made of generally aragonite,
it is the first mineral to dissolve.....................................................44
4.5 Large caves developed due to subaerial exposure in sequence VI.
Due to high cliffs, it was not possible to make detailed analysis.
Photo is taken from westen slope of Sosun Dere looking east......45
4.6 At Çömelek section, sequence boundary is marked by the develop-
ment of karstic feature and red clay with some caliche.................45
4.7 At Çömelek section, there is coarse siliciclastic material indicating
that there was some input from the land areas. Red color indicates
oxidizing which is evidence of subaerial exposure........................46
4.8 At the Çömelek section, just below the sequence boundary, exten-
xiii
sive dolomitization and red iron staining present. Dolomitization
may be developed due to iron rich meteoric water. Sample number
24 (Plane light, x2.5).....................................................................47
4.9 At the same location, dolomite rhombs indicate that dolomitization
was a late diagenetic event. Note that dolomite rhomb is growing
on calcite crystal postdating early fresh water diagenesis. Sample
number 25. (Cross polars, x10)....................................................47
5.1 Along Sosun Dere exposures can be traced from Toskaba Hill to
reefal margin in the south of Çömelek, which allowed correlation of
sequences. Picture is taken from the west of Toskaba Hill looking
toward NE.....................................................................................50
5.2 Erosional features are used to define sequence boundaries along
the reefal margin. Picture is taken from about 2 km south of
Çömelek village, looking E............................................................51
5.3 Along the reefal margin, onlapping relations are also used to define
sequence boundaries. Note truncation of beds. Picture is taken
from the eastern slope of Sosun Dere looking toward NW............51
5.4 Debris flows are used in both defining lowstand sequences and cor-
relating sequences within the study area. Picture is taken from
eastern slope of Sosun Dere. Bottle is about 15 cm long..............52
5.5 Relation of sequences are best observed along the reefal margin in
the southeast of Çömelek village along Sosun Dere. Red lines indi-
cate sequence boundaries, green line indicate top of basement
and yellow arrows indicate truncated beds. A refers to Figure
5.11...............................................................................................53
5.6 Correlation of a) Saytepe and Değirmenönü sections b) Çömelek,
Saytepe and Dereköy sections.....................................................54
5.7 Top of the sequence II (showed with a red line) is exposed in Sosun
Dere. Picture is taken from Sosun Dere looking toward west........55
5.8 Oyster bed that can be used as a key level is used to tie sequence
boundary from Saytepe section to Çömelek section.....................55
5.9 Top of the Sequence III is marked with a prograding and basinward
xiv
sloping beds at the top of shale sediments. Photo is taken from
western slope of Sosun Dere looking east....................................57
5.10 Megabreccia bed marks the lowstand systems tract which is
deposited when sea level drops below shelf margin and bottom of
which shows sequence boundary.................................................57
5.11 Photograph showing the erosional truncation of the upper boundary
of sequence V. Above red line prograding beds of next sequence
are seen........................................................................................58
5.12 Siliciclastic sediments also mark the lowstand sediments in the
basinal areas, indicating that sediment bypassed the shelf during
lowstand time................................................................................59
5.13 Thin section of the carbonate shows that land driven material (chert
in this case) is present, indicating sea level drop and siliciclastic
bypass..........................................................................................59
5.14 A schematic diagram showing correlation of sections. Figures refer
to sequences identified in the study area. Vertical black lines on the
sketch cross section show the approximate positions of the 4 mea-
sured sections..............................................................................60
6.1 Sequence V onlaps to the basement near Comelek looking toward
NE................................................................................................64
6.2 Sketch illustrating the evolution of six sequence differentiated in the
study area. Early stage (a-c) represents the transition from ramp
setting to reefal margin setting; late stage (d-f) represents mature
barrier reef environment..............................................................67
xv
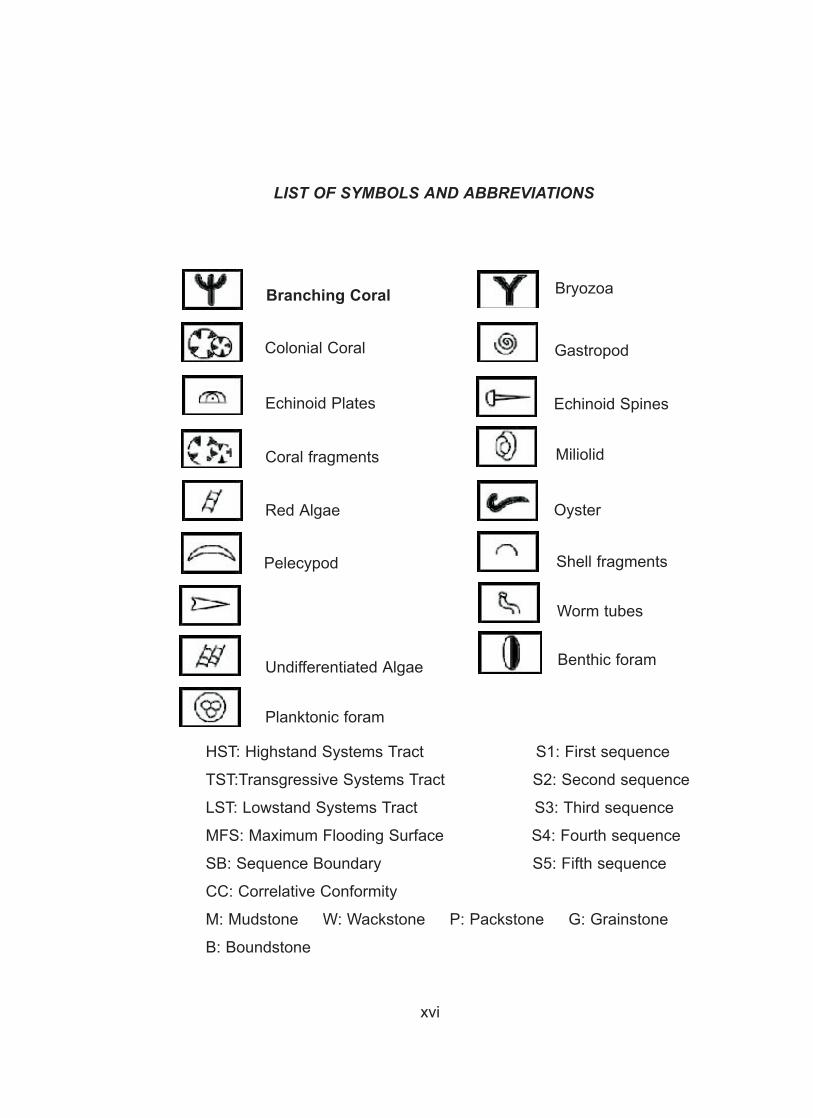
LIST OF SYMBOLS AND ABBREVIATIONS
HST: Highstand Systems Tract S1: First sequence
TST:Transgressive Systems Tract S2: Second sequence
LST: Lowstand Systems Tract S3: Third sequence
MFS: Maximum Flooding Surface S4: Fourth sequence
SB: Sequence Boundary S5: Fifth sequence
CC: Correlative Conformity
M: Mudstone W: Wackstone P: Packstone G: Grainstone
B: Boundstone
BryozoaBranching Coral
Colonial Coral Gastropod
Echinoid Plates Echinoid Spines
Coral fragments Miliolid
Red Algae Oyster
Pelecypod Shell fragments
Worm tubes
Undifferentiated Algae Benthic foram
Planktonic foram
xvi

CHAPTER 1
INTRODUCTION
1.1 Purpose and ScopeRecent advances in stratigraphy and development of sequence strati-
graphic concept enabled geologists to study sedimentary packages in more
detail. Detailed studies have shown that development of each package is
linked to interplay between sea level changes, subsidence and sediment sup-
ply (Van Wagoner et al, 1988). Early studies considered all these packages
as one single carbonate unit and mapped them accordingly. The early mod-
els about Miocene carbonates of the Mediterranean region are mostly based
on the studies in Western Mediterranean region; there are few papers about
carbonates of Eastern Mediterranean (Esteban, 1996). Since there is a grow-
ing interest on the sea level changes and sequence stratigraphy of the
region, new studies are needed, especially on the sequence stratigraphy of
Miocene of Eastern Mediterranean region. These studies will shed light on
the evolution of the Mediterranean during Miocene time. The aim of this study
is to construct a Miocene sequence stratigraphic framework of the Mut Basin,
which will contribute the understanding of the evolution and correlation of
events throughout Mediterranean region during this epoch. Excellent 3D
exposures of Mut basin's Miocene rocks allow sequences to be clearly
defined, differentiated and mapped. This study will lead us to understand:
- Stratal relationships,
- Facies associations in a parasequence set scale (where possible),
- The diagenetic imprint of sequences.
1
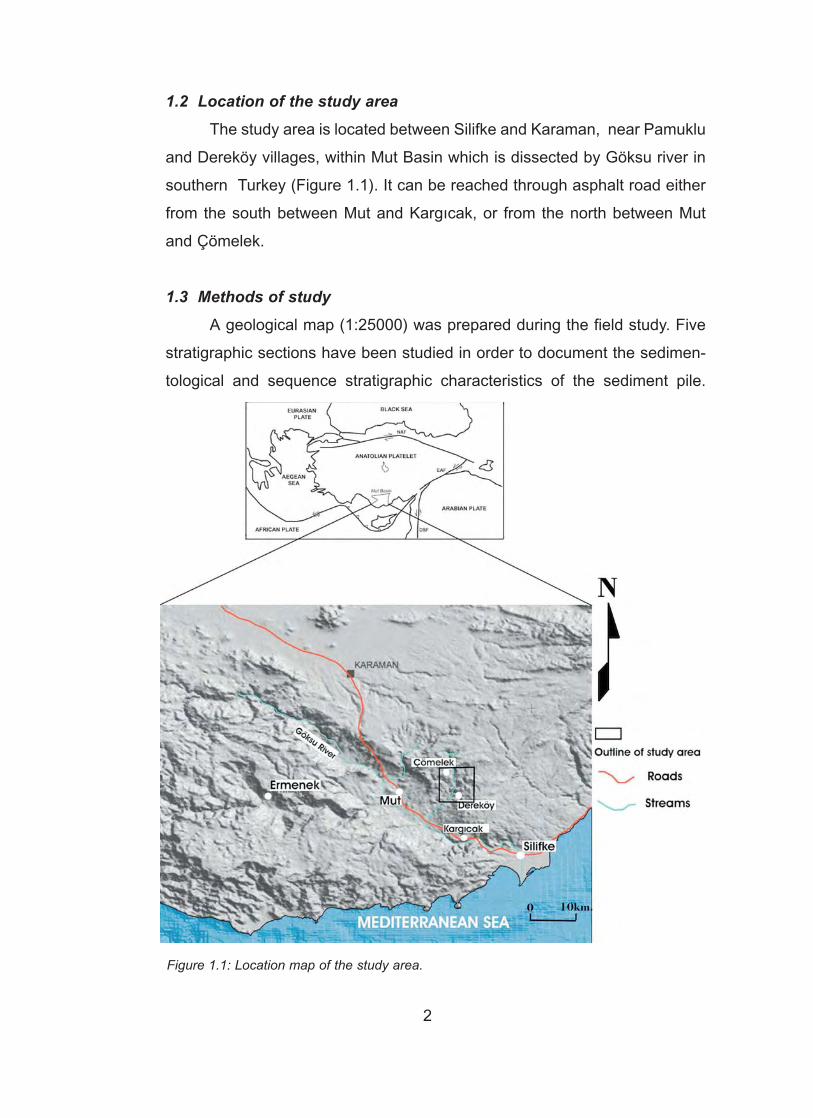
1.2 Location of the study areaThe study area is located between Silifke and Karaman, near Pamuklu
and Dereköy villages, within Mut Basin which is dissected by Göksu river in
southern Turkey (Figure 1.1). It can be reached through asphalt road either
from the south between Mut and Kargıcak, or from the north between Mut
and Çömelek.
1.3 Methods of studyA geological map (1:25000) was prepared during the field study. Five
stratigraphic sections have been studied in order to document the sedimen-
tological and sequence stratigraphic characteristics of the sediment pile.
2
Figure 1.1: Location map of the study area.
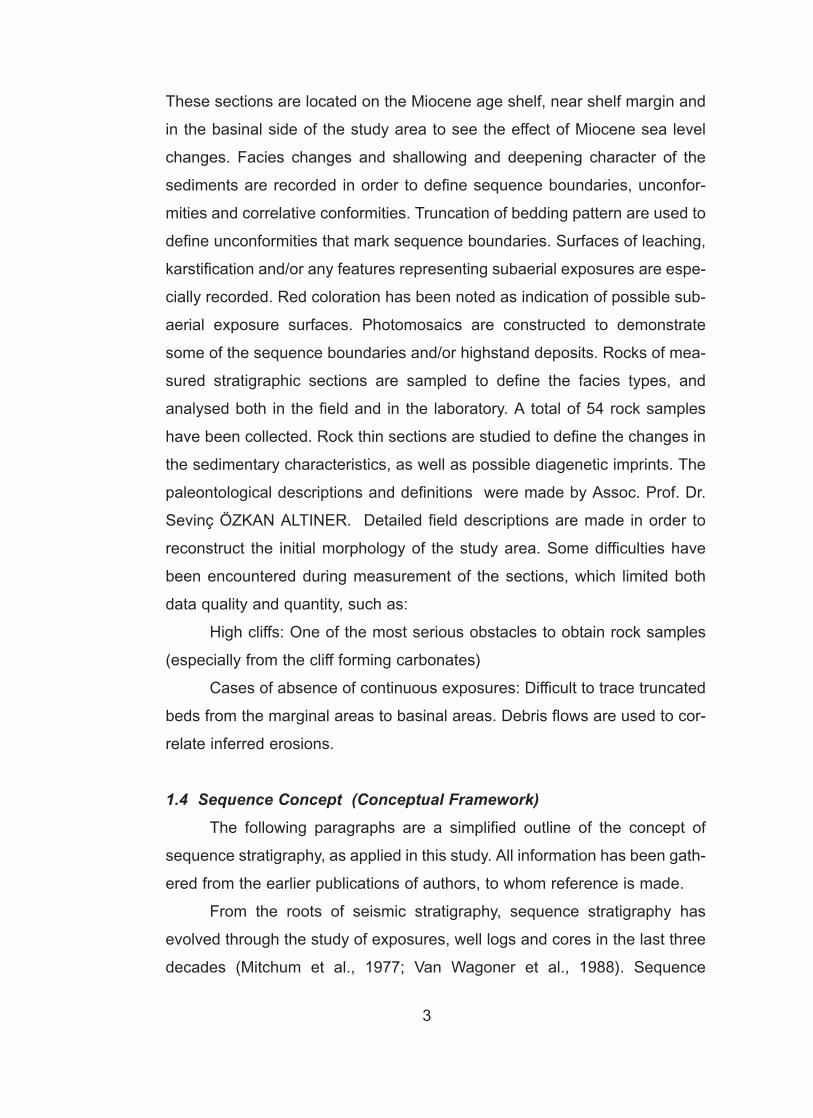
These sections are located on the Miocene age shelf, near shelf margin and
in the basinal side of the study area to see the effect of Miocene sea level
changes. Facies changes and shallowing and deepening character of the
sediments are recorded in order to define sequence boundaries, unconfor-
mities and correlative conformities. Truncation of bedding pattern are used to
define unconformities that mark sequence boundaries. Surfaces of leaching,
karstification and/or any features representing subaerial exposures are espe-
cially recorded. Red coloration has been noted as indication of possible sub-
aerial exposure surfaces. Photomosaics are constructed to demonstrate
some of the sequence boundaries and/or highstand deposits. Rocks of mea-
sured stratigraphic sections are sampled to define the facies types, and
analysed both in the field and in the laboratory. A total of 54 rock samples
have been collected. Rock thin sections are studied to define the changes in
the sedimentary characteristics, as well as possible diagenetic imprints. The
paleontological descriptions and definitions were made by Assoc. Prof. Dr.
Sevinç ÖZKAN ALTINER. Detailed field descriptions are made in order to
reconstruct the initial morphology of the study area. Some difficulties have
been encountered during measurement of the sections, which limited both
data quality and quantity, such as:
High cliffs: One of the most serious obstacles to obtain rock samples
(especially from the cliff forming carbonates)
Cases of absence of continuous exposures: Difficult to trace truncated
beds from the marginal areas to basinal areas. Debris flows are used to cor-
relate inferred erosions.
1.4 Sequence Concept (Conceptual Framework)The following paragraphs are a simplified outline of the concept of
sequence stratigraphy, as applied in this study. All information has been gath-
ered from the earlier publications of authors, to whom reference is made.
From the roots of seismic stratigraphy, sequence stratigraphy has
evolved through the study of exposures, well logs and cores in the last three
decades (Mitchum et al., 1977; Van Wagoner et al., 1988). Sequence
3
Stratigraphy is used as a tool to reconstruct the facies relationships in a
chronostratigraphic framework. This framework provided new insights to
reconstruct the paleoenvironment. The interplay between eustasy, subsi-
dence and sediment supply generates genetically related rock packages
bounded by unconformities on the shelf and correlative conformities in the
basin. These packages are referred to as sequences. They may form from
10.000 years to 100 million years time intervals. The rock packages that form
10.000 to 100.000 years interval are referred to as cycles, 100.000 to
1.000.000 years interval as parasequences, 1.000.000 to 10.000.000 years
interval as sequences and 10.000.000 to 100.000.000 years interval as
megasuqences (Mitchum et al, 1977).
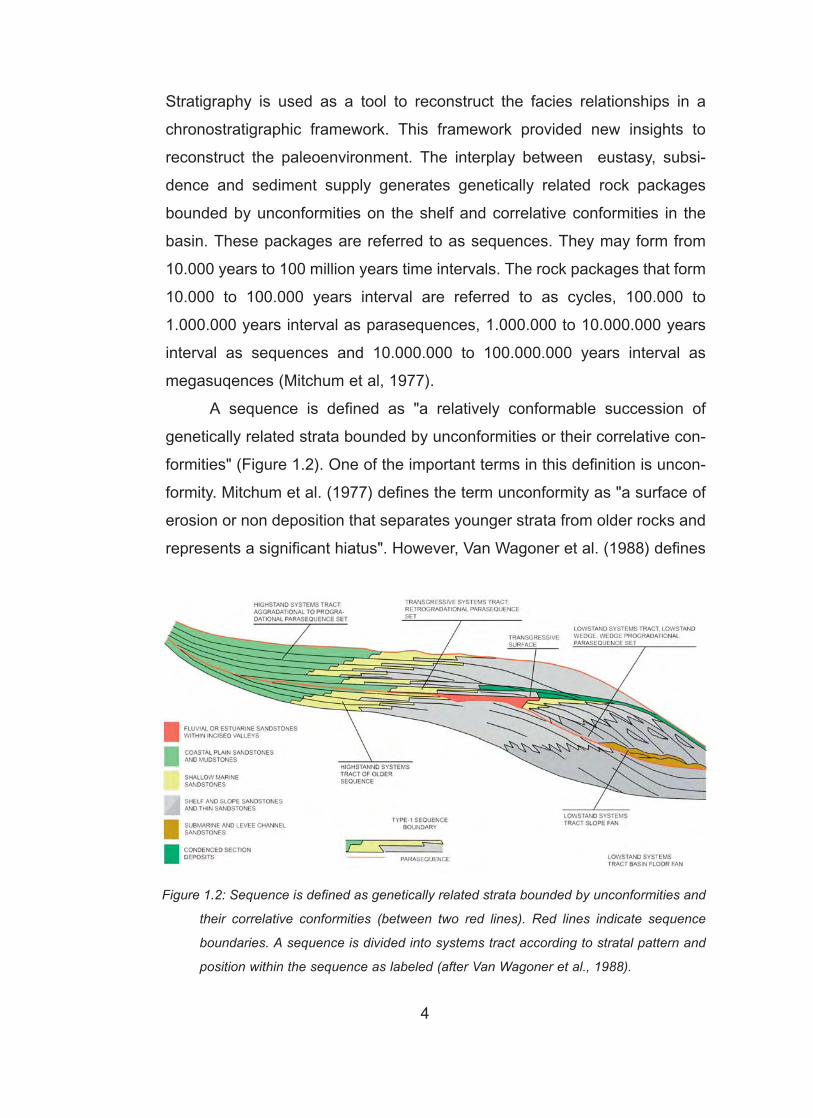
A sequence is defined as "a relatively conformable succession of
genetically related strata bounded by unconformities or their correlative con-
formities" (Figure 1.2). One of the important terms in this definition is uncon-
formity. Mitchum et al. (1977) defines the term unconformity as "a surface of
erosion or non deposition that separates younger strata from older rocks and
represents a significant hiatus". However, Van Wagoner et al. (1988) defines
4
Figure 1.2: Sequence is defined as genetically related strata bounded by unconformities and
their correlative conformities (between two red lines). Red lines indicate sequence
boundaries. A sequence is divided into systems tract according to stratal pattern and
position within the sequence as labeled (after Van Wagoner et al., 1988).
unconformity as "a surface separating younger from older strata along which
there is evidence of subaerial erosional truncation or subaerial exposure with
a significant hiatus indicated". So, the later definition restricts the term uncon-
formity to subaerially exposed surfaces. The basin equivalent of this surface
is defined as correlative conformity. The imprint of unconformities, which are
supposed to occur due to sea level falls, can be recognized at basin margins:
Incised valleys (which indicate siliciclastic input), change in diagenetic tex-
ture, basinward shift of facies, etc (Van Wagoner et al., 1988).
Sequences are divided into systems tracts, defined as "a linkage of
contemporaneous depositional systems" (Fisher and McGowan, 1967).
There are four types of systems tracts (Figure 1.2) which are defined accord-
ing to their position in a sequence and the type of bounding surfaces (Van
Wagoner et al., 1988): Highstand Systems Tract (HST), Transgressive
Systems Tracts (TST), Lowstand Systems Tract and Shelf Margin Systems
5
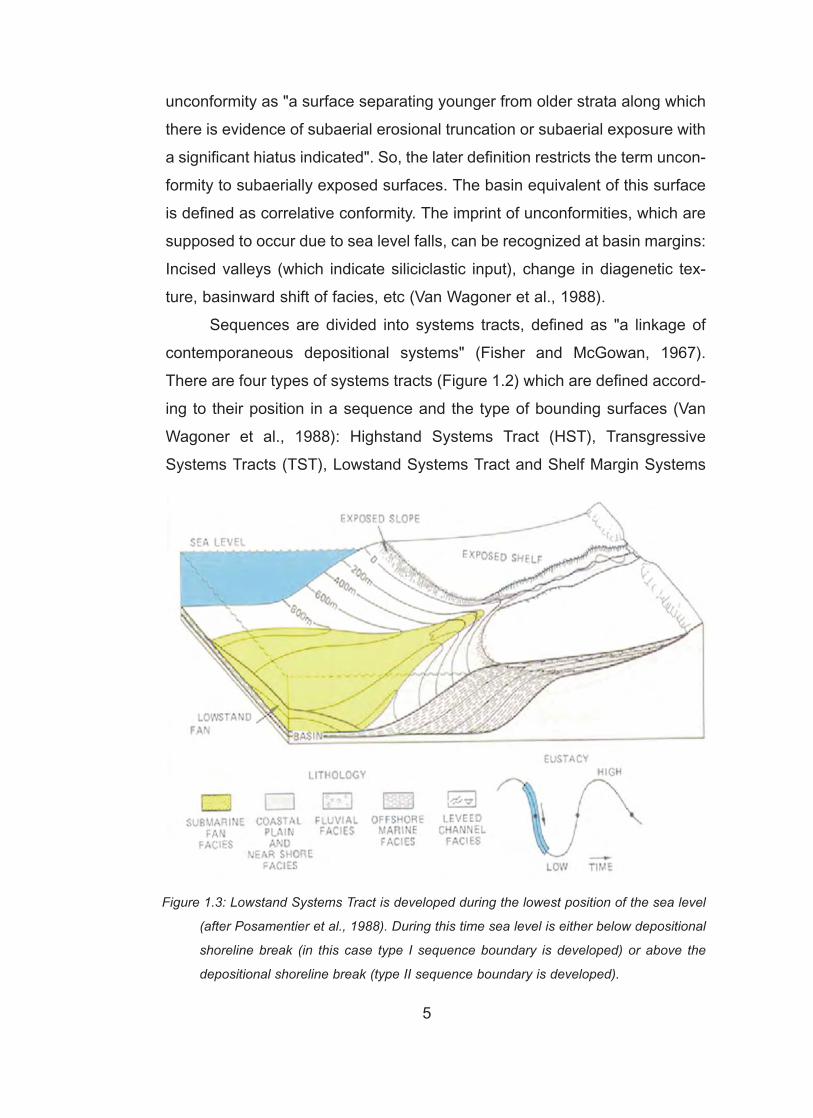
Figure 1.3: Lowstand Systems Tract is developed during the lowest position of the sea level
(after Posamentier et al., 1988). During this time sea level is either below depositional
shoreline break (in this case type I sequence boundary is developed) or above the
depositional shoreline break (type II sequence boundary is developed).
Tract (SMST).
Lowstand Systems Tract is the lowermost systems tract which lies
directly on a type 1 sequence boundary (Figures 1.2 and 1.3). It is developed
when relative sea level is the lowest (Figure 1.3). Transgressive Systems
Tract is the second systems tract overlying and following lowstand systems
tract. It is developed during relative rise in sea level that is characterized by
onlapping stratal termination patterns and one or more retrogradational
parasequence sets (Figure 1.2 and 1.4). Highstand Systems Tract is the
uppermost systems tract which is characterized by aggradational and/or
progradational stratal pattern and progradational and/or aggradational
parasequence sets (Figure 1.2 and 1.5). The Shelf Margin Systems Tract is
a regressive stratigraphic unit characterized by decreasingly progradational,
followed by an aggradational, parasequence stacking pattern. It overlies the
highstand systems tract and is deposited on the outer part of the shelf (Figure
1.6).
Each systems tracts is divided into parasequences, which are bound-
6
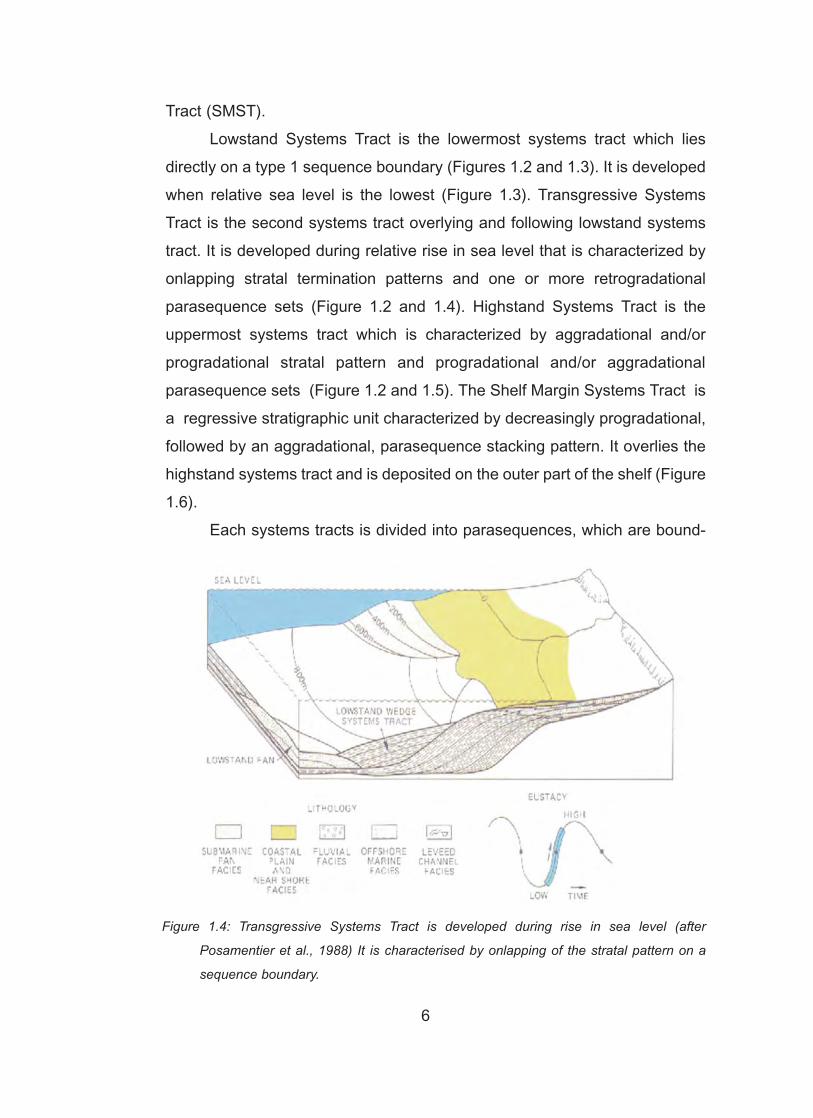
Figure 1.4: Transgressive Systems Tract is developed during rise in sea level (after
Posamentier et al., 1988) It is characterised by onlapping of the stratal pattern on a
sequence boundary.
ed by marine flooding surfaces. The thickness of parasequences are gener-
ally between 1 and 10 meters. However, depending on the depositional sys-
tem and the sedimentologic processes it may be in decimeter scale or in tens
of meters scale. For example, the parasequences of the tidal flat environment
can be in decimeter scale, whereas the parasequences in the basinward shift
can be tens of meters thick (like homogenous marls of Mut Basin).
Nevertheless, one has to remember that the marine flooding surfaces mark
the boundary of parasequences.
The basic concepts defined here are known as the "Exxon Model" of
sequence stratigraphy. Many objections have risen to this model. For exam-
ple, the role of tectonics is one of the most important subject of an ongoing
debate in sequence stratigraphy. Geologists who object the role of (glacial
derived) eustasy state that the rate of tectonic subsidence is much greater
7
Figure 1.5: Highstand Systems Tract is developed during relative high position of sea level
(after Posamentier et al., 1988) during which sediments prograde toward the basin. It
is characterized by prograding or aggrading stratal pattern.
than eustatic rise or fall, so that the role of eustasy can be neglected (Miall,
1991). Although the interpretation of sea level fluctuations from the rock
record is a complex process, which needs detailed facies analysis and pale-
ontological study, it is still possible to express the glacial derived eustatic
imprint. (For a summary of discussions reader is referred to Emery and
Myers, 1996). In basins like Mut Basin, where the stratal relationships are not
tectonically disturbed and the facies architecture is well preserved, it is pos-
sible to see the eustatic imprint.
1.5 Previous StudiesAlthough there are many early studies (Blumenthal, 1956; Erünal-
Erentöz, 1958; Akarsu, 1960; Bizon et al., 1974; Özer et al., 1974; Koçyiğit,
1976, 1978), Gedik et al., (1979) was the first to establish the stratigraphic
8
Figure 1.6: Shelf Margin Systems Tract is deposited on the outer part of the shelf and over-
lies a highstand systems tract (after Posamentier et al., 1988). Shelf Margin Systems
Tract is commonly not capped by a widespread fluvial deposits in contrast with the
Highstand Systems Tract.

framework of the Mut Basin. Later studies followed Gedik et. al. (1979)'s
stratigraphic nomenclature.
Biju-Duval et al. (1977), Demirtaşlı et al (1983), Dercourt et al. (1986),
Dewey et al. (1973, 1989), Esteban (1996), Gökçen (1984), Görür et al
(1995), Lemoine (1978), Pampal (1986), Rehault et al (1984), Robertson et
al (1996), Tanar (1989), Tanar and Gökçen (1990) and Ziegler (1988) review
the geology of Mediteranean region.
Şafak (1997) studied the ostracod fauna of the Late Miocene-Pliocene
sequence of Karaman region. She states that similar fauna exist in the
Neogene formations of Adana and Antalya basins; also, it can be correlated
with the fauna of Tunusia, Algeria and Greek islands.
Bassant (1999) studied the Burdigalian carbonate - siliciclastic sedi-
mentary systems of Mut Basin from a sequence stratigraphic perspective.
However, his interpretation is different from the concept of Exxon type
sequence stratigraphy. He uses cycle boundaries rather than sequence
boundaries in order to differentiate rock packages. A cycle boundary is
"placed at the turn around from progradation to retrogradation, which occurs
within, or at the top of lowstand systems tract, whereas the sequence bound-
ary is placed at the base of the lowstand."
Atabey et al. (2000) proposed a new lithostratigraphic framework for
the Miocene Mut Basin. However, for Miocene he followed Gedik et al.
(1979)'s nomenclature. Hence, in this study nomenclature of Gedik et al
(1979) is used.
Most recent study is that of Jonsons (2001), who examined and mod-
eled carbonate deposits on the Ermenek shelf and used it as an analog
model for the carbonate reservoir in south China sea.
9
CHAPTER 2
STRATIGRAPHY OF MUT BASIN
2.1 Regional GeologyMut Basin is one of the Miocene basins of southern Turkey (Figure 2.1).
It is surrounded from the south by Alanya massif, from the north Bolkar moun-
tain, from the west Alanya and Bozkır nappes. In the east it is separated from
the Adana Basin by the Ecemiş fault zone. In the Late Oligocene to Early
Miocene the Mut, Adana and Antalya basins formed (Kelling et al., 1995a). In
the Mut Basin, Kelling et al. (1995b), suggest an Early Oligocene phase of
crustal extension, probably associated with orogenic collapse. Mut Basin was
a site of carbonate deposition like adjacent Adana and Antalya basins
(Bassant, 1999). In Serravalian, Eurasia-Arabia collision started (Bassant,
1999) which represents the start of the present Neotectonic regime (Şengör
et al., 1985). At this time southern Turkey is uplifted by epeirogenic process-
es to its present elevation of 1-2 km. above sea level. Marine regression
across the southern Turkey started from the Late Serravalian onwards,
with deposition of Tortonian evaporites in the west and in the south (Yetiş et
al., 1995). As opposed to tectonic deformation of Adana and Antalya
basins, Mut basin was uplifted without any major deformation. Its initial basin
geometry is still preserved, which allowed examination of undisturbed stratal
relationships of sediments. The precise basin dynamics are currently the sub-
ject of discussion in the literature (Bassant, 1999).
In this study, pre-Miocene rocks are referred to as "basement", which
consists of Paleozoic shales, limestones and quartzites, Lower - Middle
Triassic conglomerates, Jurassic - Cretaceous dolomitized limestones, Upper
10
Cretaceous mudstones and conglomerates, Upper Cretaceous ophiolites.
Above these, Eocene marls, shales, sandstones and conglomerates exist,
ending with a major erosion surface (Figure 2.2).
In this study the accepted stratigraphic nomenclature for the Mut basin
is that of Gedik et al. (1979). Twelve formations are distinguished (Figure
2.2), nine formations making up the "basement". Ovacık formation of
Ordovician age is the oldest rock unit observed in the basin and consists of
schists with quartz arenite bands. Hırmanlı formation unconformably overlies
Ovacık formation and is characterized by black colored, laminated graptolite
bearing shales of Silurian age. Akdere formation of Middle - Late Devonian is
made up of coralline limestone that was deposited in a shallow marine envi-
ronment. The shale, sandstone and quartz arenite interbedded with oolitic
limestones of Belpınartepe formation indicates that shallow marine con-
ditions continued during Carboniferous-Permian time. Kızılkuzlukdere for-
mation of Early and Middle Triassic is characterized by shale and marl
interbedded shallow water carbonates. Late Triassic was the time of terres-
trial sedimentation. Therefore, Boztepe formation unconformably overlies
11
Figure 2.1: Miocene basins of southern Turkey (Simplified from Özer et al., 1974 / Not to
scale).
12
Figu
re 2
.2: G
ener
aliz
ed s
tratig
raph
ic s
ectio
n of
the
stud
y an
d su
rroun
ding
are
as. N
ot to
sca
le. (
Mod
ified
from
Ged
ik e
t al.,
197
9)

Kızılkuzlukdere formation. A new transgression began in Late Jurassic and
continued until Early Cretaceous, which resulted in the deposition of carbon-
ates of Çambaşıtepe formation (Gedik et al., 1979). Late Cretaceous was the
time of extensive ophiolite obduction in most of the Anatolia as a result of the
closure of Neotethyan Oceans (Şengör and Yılmaz, 1981). This ophiolitic
melange forms the basement of Eocene and Miocene rocks in the region.
Ophiolitic melange is characterized by limestone blocks of Permian-
Cretaceous age, peridotites, gabbro, pillow lavas and tuffs.
After the emplacement of ophiolitic melange in the region, the area was
uplifted and remained as a subaerial continent until subsidence and Eocene
transgression. Following the transgression turbiditic sediments were deposit-
ed near Ermenek. Yenimahalle formation represents these turbidites, com-
prising interbedded shales, sandstones and conglomerates. This Eocene
sediments mark the end of "basement" succession. Oligocene is the time of
erosion which produced the irregular topography. Derinçay formation of Late
Burdigalian unconformably overlies Eocene Yenimahalle formation. Derinçay
formation consists of fluvial conglomerates, sandstones and lacustrine lime-
stones.
A new transgression after Burdigalian, resulted in the deposition of Mut
and Köselerli formations. Mut formation is deposited in a shallow marine set-
ting along marginal areas, while Köselerli formation was being deposited in
slope and basinal setting. Gedik et al. (1979) mapped Mut formation as a sin-
gle unit. This study indicates that it is made up of several carbonate pack-
ages, most of which are separated by erosional unconformity surfaces. These
will be described and discussed in the following chapter.
2.2 Statigraphy and structure of the study areaIn the study area only three units exist (Figure 2.3); the "Basement",
the Mut formation and the Köselerli formation. The "Basement" rocks here
consist of limestones of Jurassic-Cretaceous age and ophiolitic melange
(peridotite, gabbro, pillow lava and tuff). The relations between these two rock
groups are not very clear in the study area. In the surrounding areas, howev-
13

Figure 2.3: Geological map of the study area.
14

Figure 2-4:Relative position of the shelf margin inthe study area during Miocene.
15
Figu
re 2
.4: C
ross
Sec
tions
pro
duce
d fro
m th
e ge
olog
ic m
ap o
f the
stu
dy a
rea.
16
er, large blocks of limestones of various ages are present within the ophiolitic
melange.
Gedik et al., (1979) are defined, described and published Mut formation,
although Sezer (1970) first used the name "Mut limestone limestone" as a
lithostratigraphic unit. Since it is widely accepted as Mut formation, it will be
used as is in this study. According to Gedik et al., (1979), Mut formation con-
sists dominantly of limestone containing occasionally sandstone and con-
glomerate beds. Limestones are white, cream coloured, medium hard, con-
tains abundant algae, foraminifers, echinoids, lamellibranchia, gastropods,
corals as fossils. They interpreted that it was deposited as a reefal complex.
Mut formation unconformably overlies Paleozoic and Mesozoic formations. In
Göksu valley however, it grades downward into Derinçay formation. It grades
laterally and vertically into Köselerli formation. Thickness of the Mut formation
varies from 150 metres to 1100 metres. Defined benthic and planctonic fossil
groups yield Langhian-Serravalian age (Gedik et al., 1979; Tanar, 1989).
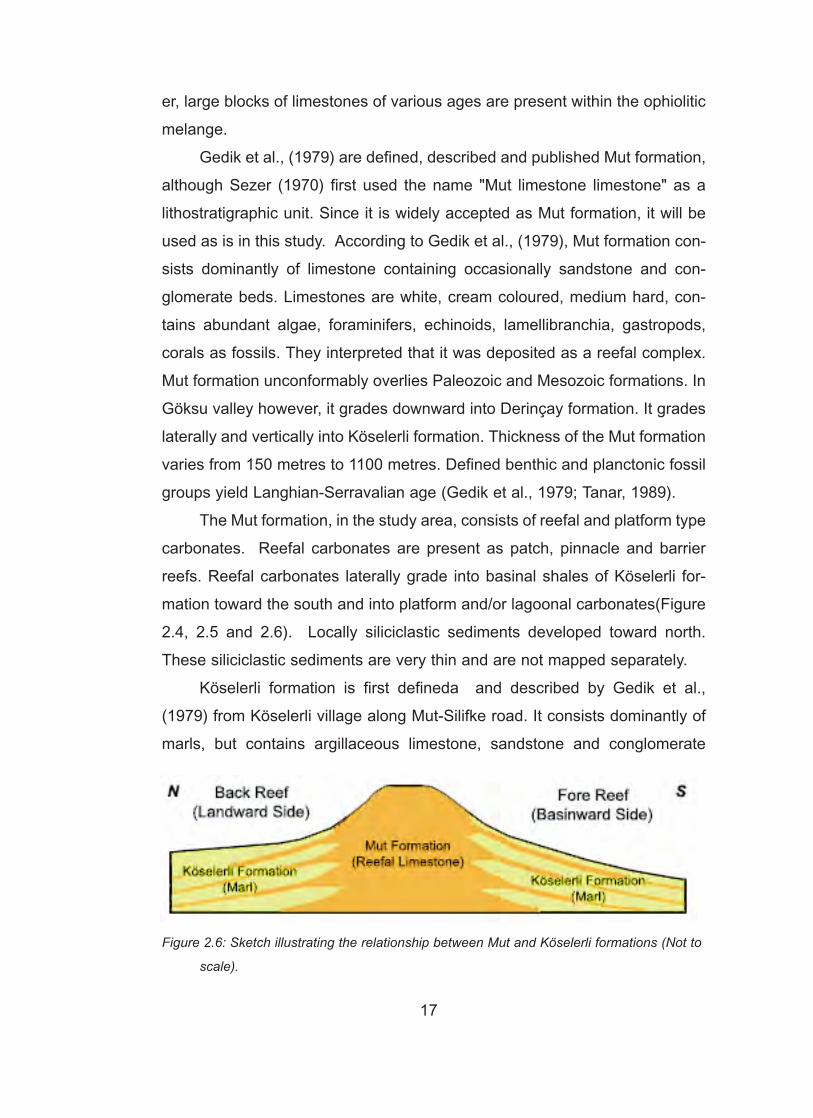
The Mut formation, in the study area, consists of reefal and platform type
carbonates. Reefal carbonates are present as patch, pinnacle and barrier
reefs. Reefal carbonates laterally grade into basinal shales of Köselerli for-
mation toward the south and into platform and/or lagoonal carbonates(Figure
2.4, 2.5 and 2.6). Locally siliciclastic sediments developed toward north.
These siliciclastic sediments are very thin and are not mapped separately.
Köselerli formation is first defineda and described by Gedik et al.,
(1979) from Köselerli village along Mut-Silifke road. It consists dominantly of
marls, but contains argillaceous limestone, sandstone and conglomerate
Figure 2.6: Sketch illustrating the relationship between Mut and Köselerli formations (Not to
scale).
17
Figu
re 2
.7: S
chem
atic
blo
ck d
iagr
am to
sho
w th
e fa
cies
dis
tribu
tion
of th
e ra
mp
setti
ng (N
ot to
sca
le).
(WB:
Wav
e Ba
se; S
WB:
Sto
rm W
ave
Base
).
18
Figu
re 2
.8: S
chem
atic
blo
ck d
iagr
am s
how
ing
the
depo
sitio
nal e
nviro
nmen
ts o
f ree
fal m
argi
n w
hich
has
dev
elop
ed o
n a
prev
ious
ram
p (N
ot to
scal
e).
19
Figu
re 2
.9 S
chem
atic
blo
ck d
iagr
am il
lust
ratin
g th
e tra
nsiti
on o
f a p
atch
reef
to p
inna
cle
reef
and
land
war
d m
igra
tion
of re
efs
(Not
to s
cale
).
20
interbeds. Marls are gray- green coloured, soft and brittle. It has been inter-
preted as the basinal equivalent of Mut formation, therefore it grades lateral-
ly and vertically into Mut formation. It shows local unconformable relation
where directly overlies the basement. Thickness varies from 150 to 1100
metres. Benthic and planctonic forams yield Langhian-Serravalian age (Gedik
et al., 1979; Tanar, 1989), but Late Burdigalian age also reported from Silifke
area (Gökten, 1976).
Köselerli formation, in the study area, consists of marls and shales and
forms basinal equivalents of the Mut formation. Within the Köselerli forma-
tion, large volumes of carbonate debris flow sediments are present, possibly
derived from the reefs developed along the margin of the basin.
The petrographic analyses indicate that the microfacies of limestones of
Mut formation change from boundstone to mudstone depending on the ener-
gy of the environment. Carbonate grains are composed of skeletal particles,
intraclasts and lithoclasts. Fragments of foraminifera, coral, bryozoa, echi-
noids and algae, which are typical fauna of reef environment, constitute the
skeletal particles. The detailed facies description is given in chapter 3.
Stratigraphic relations give important clues about the paleogeography of
Mut Basin. The depositional trend of Mut formation progrades from south to north.
This indicates that hinterland was at the north of the basin and the southern part is
flooded earlier. With the development of reefal margin the lagoon was developed
in north of the basin. Continuous transgression resulted with the deepening of
southern parts. Hence, the transformation of shallow marine setting to deep marine
setting occurred. The horizontal beds of Mut formation terminate against base-
ment, indicating irregularity of the paleotopography. Figures 2.6, 2.7 and 2.8 rep-
resent suggested models for the depositional environment of the study area.
Mut Basin was not tectonically active during Miocene (Bassant, 1999).
Therefore the geological structure in the study area is essentially horizontal to
sub-horizontal with dips ranging from 0o to 8o. However, minor faults do exist
in the basin; these occur as NW-SE oriented strike slip faults (Demir, 1997).
The general structure of the study area is shown in the cross sections (Figure
2.4) based on the geological map (Figure 2.3)
21
CHAPTER 3
SEQUENCE STRATIGRAPHIC ARCHITECTURE OF THE STUDY AREA
In order to define field relations of the rock bodies with the pre-existing
topography of the basin and stratal geometries within the sedimentary pile,
four stratigraphic sections have been measured (Figure 2.3) and one section
is studied, with estimated thicknesses, owing to inaccessibility of the out-
crops. Each section represents different part of the basin and related facies
types. These sections are:
1. Değirmenönü section, mostly includes stratigraphically lower part
of the Mut formation, representing early phase of deposition,
2. Toskaba Hill section, corresponds to the stratigraphically upper
part of the formation, representing sediments deposited after the
initial phase of the transgression,
3. Saytepe section corresponds to relatively deeper marine sedi
ments between two thick carbonate accumulations,
4. Çömelek section shows carbonate sediments, interpreted as repre
senting the shallow part of the system, which is very sensitive to
the changes in water depth,
5. Dereköy section includes mostly marly sediments with thick car
bonate interlayers, interpreted as representing slope and/or base
of slope areas.
3.1 Değirmenönü SectionDescriptionThis section is located 2 km southwest of Değirmenönü village (Figure
2.3). Section is composed of limestones and marls. Details are given in Figure
22

InterpretationGray coloured quartz sandstone overlying red to pink sandstone and
conglomerates represent the initial marine flooding surface (transgressive
surface). After this initial marine flooding packstone/wackestone type carbon-
ate deposition prevails. Overlying marl indicates a deepening and drowning of
the carbonate. This carbonate/marl cycle is repeated three times, ending with
a thick (5-6 m) marl level, which represents the maximum flooding time. The
bedsets below maximum flooding surface exhibit parasequences of TST,
each of which shows a shallowing upward trend. The bedsets above maxi-
mum flooding surface represent parasequences of HST. While marl and pack-
stone indicates early highstand, the following grainstone and boundstone is
indicative of late highstand conditions.
The continuous flooding and progressive deepening does not allow
skeletal grains to accumulate. Deposition of mud free facies depend on the
water depth and energy of the environment. When water depth increases,
energy level effective on the sediments drops considerably and muddy facies
dominates (Wilson, 1975). Hence, the facies below MFS indicate that during
transgressive times the whole area is characterized by muddy facies. On the
other hand, during highstand times the areas above wave base is character-
ized by high energy facies. The areas under wave base is characterized by
packstone - wackestone facies. Mudstone is the characteristic facies of the
outer ramp. However, there are lenticular limestone bodies which represent
23
Figure 3.1: Sketch illustrating facies associations and the patch reefs of the ramp observed
at the section (No scale).
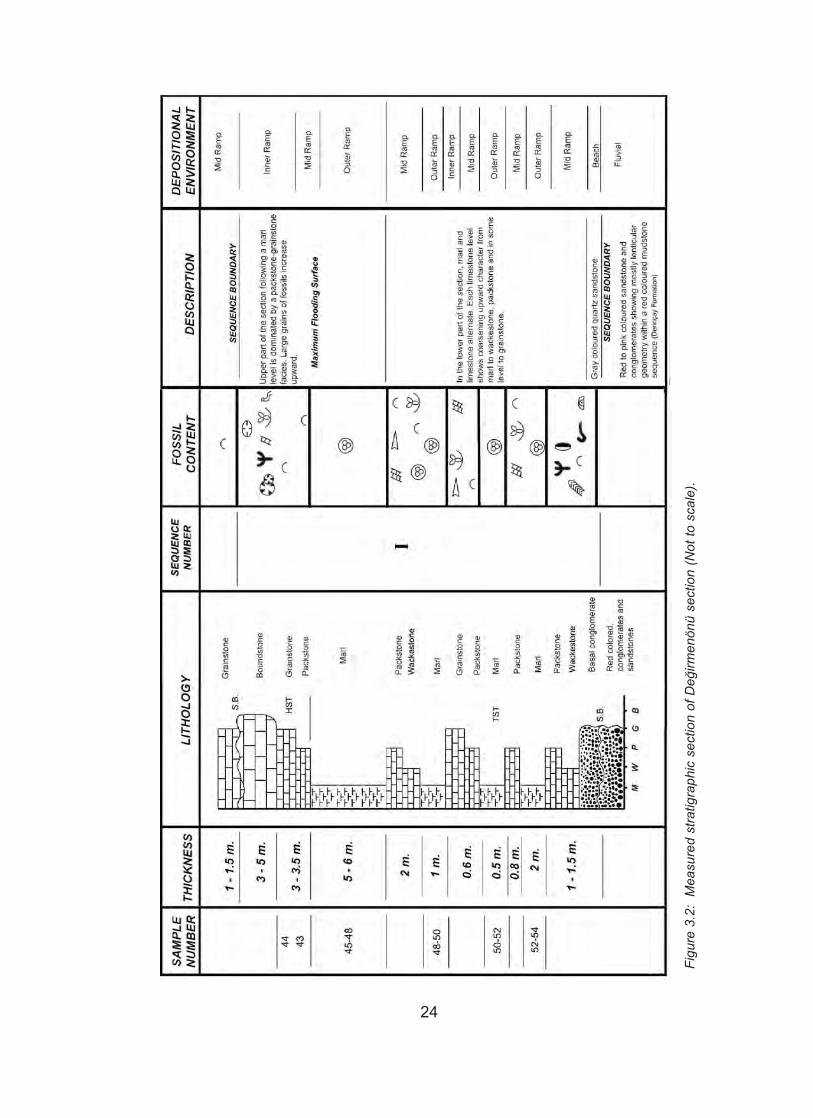
Figu
re 3
.2:
Mea
sure
d st
ratig
raph
ic s
ectio
n of
Değ
irmen
önü
sect
ion
(Not
to s
cale
).
24
the patch reefs on the ramp as boundstone (Figures 3.1 and 3.2).
3.2 Toskaba Hill SectionDescriptionToskaba hill is located in the north of Dereköy and east of Pamuklu vil-
lages (Figure 2-3). It is made up of massive limestone at the center and bed-
ded carbonates at the flanks, forming a dome shaped morphology (Figure
3.3). Due to high cliff face, the following descriptions are based on observa-
tions on a section along a N-S direction.
The carbonates at Toskaba hill is about 300 m thick. The carbonates rest
on the "basement" rocks with an unconformity. Lower part of the carbonates
is dominated by coarse carbonate breccia, onlapping northwards on the steep
slope of the "basement" rocks. Approximately 300 m. thick massive carbon-
ate overlies the breccia bed. Toward north, shallow water carbonates with rub-
bles from the reefal carbonates are seen. Away from Toskaba hill, in all direc-
tions, grain size gets progressively finer. Toward the south, they grade into
marl in a short distance (~1 km.). This horizontal depositional trend continues
upward as long as carbonate deposition continued. At the top of the hill, car-
bonates are massive at the center of the dome shaped morphology (Figure
3.3). The massive part here is dominantly made up of coral/algal facies and
laterally grades into very thick bedded carbonates of grainstone-packstone
character and finally into marls and carbonate wackestone-packstone facies
at the southern flanks of the Toskaba hill.
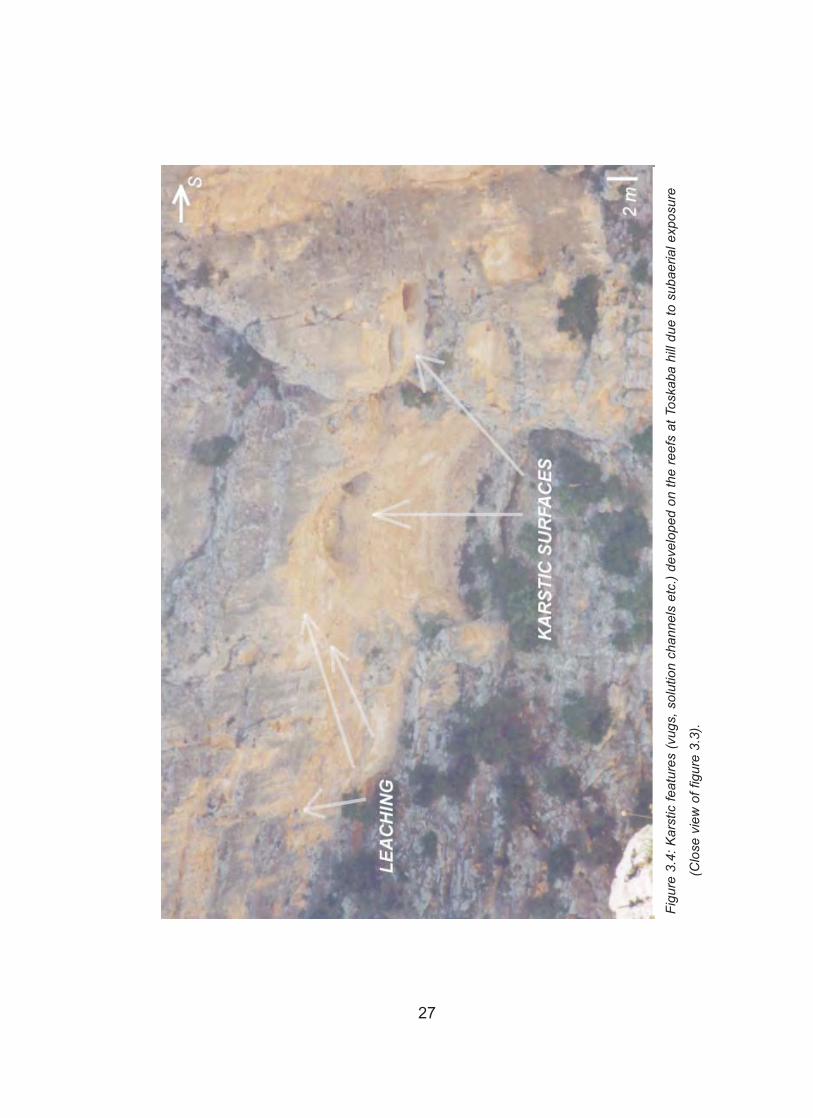
Within the massive carbonate at Toskaba hill, there are several levels of
karstified surfaces marked by large cavities (Figure 3.4). These surfaces sep-
arate thick and massive accumulation of carbonates and can be correlated
with more pronounced surfaces where subaerial exposures are marked with
erosional truncations in the north. Away from the Toskaba hill toward south,
these thick carbonate levels are separated by marl levels and thin out toward
the south (Figure 3.5). In the south marl dominates. Further south, it becomes
difficult to distinguish carbonate levels from the marls, as they become con-
25

Figu
re 3
.3: R
eef c
ompl
ex a
t Tos
kaba
hill.
Sub
sequ
ent d
evel
opm
ent o
f ree
f cor
e tra
nsfo
rmed
pat
ch re
ef to
a p
inna
cle
reef
.
26
Figu
re 3
.4: K
arst
ic fe
atur
es (v
ugs,
sol
utio
n ch
anne
ls e
tc.)
deve
lope
d on
the
reef
s at
Tos
kaba
hill
due
to s
ubae
rial e
xpos
ure
(Clo
se v
iew
of f
igur
e 3.
3).
27
formity surfaces.
InterpretationStratigraphic and facies relations stated above indicate that carbonate
deposition started as reefal carbonate at the edge of a paleoslope. These
reefal carbonates grade into fine grained sediments (mainly marl) toward
south and grade into shallow water carbonates (mainly rudstone, grainstone
and packstone) toward the lagoon in north.
Deposition of carbonate began on a surface with a rubble of angular car-
bonate grains indicating slope scree on an irregular surface of the "base-
ment". Although there are patch reefs at outer ramp, carbonates did not form
a continous reefal margin. Hence they were deposited in an area without a
reefal margin. The patch reefs at the outer ramp keep pace with sea level rise.
The base of Toskaba hill represents one of these patch reefs. Other patch
reefs can be observed near Karacaoğlan hill (2 km to the east) and Karacakız
hill which is located outside the study area. Karstified and leached surfaces
indicate occasional termination of deposition possibly with subaerial exposure
(Esteban and Klappa, 1983). Introduction of meteoric water causes leaching
and karstification on the exposed surface of the carbonate. Dolomitization,
siliciclastic input on the unconformity surface and correlation of unconformity
surfaces from Çömelek area to the Toskaba hill indicate that karstic surfaces
in the Toskaba hill are not recent features. So this surface is representing the
first time gap and unconformity within the thick carbonate at Toskaba hill sec-
tion. The leaching and karstification do not continue into basinal marl and fine
grained sediments. This relation also suggest that although carbonate depo-
sition terminated during subaerial exposure, deposition of carbonate renewed
on the same location when sea level rose again. Deposition kept up with the
sea level rise until the next fall. The accumulation of carbonate at the same
location transformed this patch reef to a pinnacle reef.
By using the leaching surfaces and correlating of sequence boundaries
at the north, five sequences are differentiated at this massive carbonate body,
28
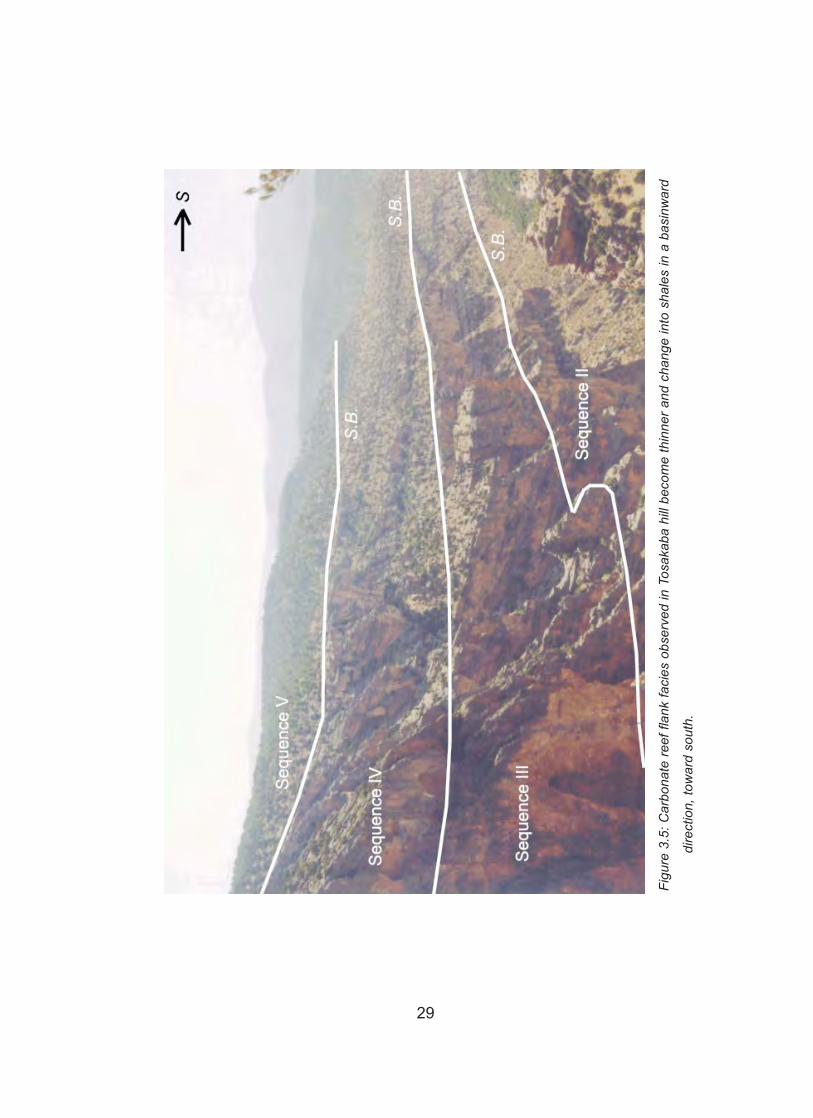
Figu
re 3
.5: C
arbo
nate
reef
flan
k fa
cies
obs
erve
d in
Tos
akab
a hi
ll be
com
e th
inne
r and
cha
nge
into
sha
les
in a
bas
inw
ard
dire
ctio
n, to
war
d so
uth.
29
four of them shown in Figure 3.5.
3.3 Saytepe Section DescriptionThis section is located between Toskaba and Saytepe hills, along the
eastern slope of Sosun Dere valley (Figure 2.3). Detailed description of this
section is given on Figure 3.6.
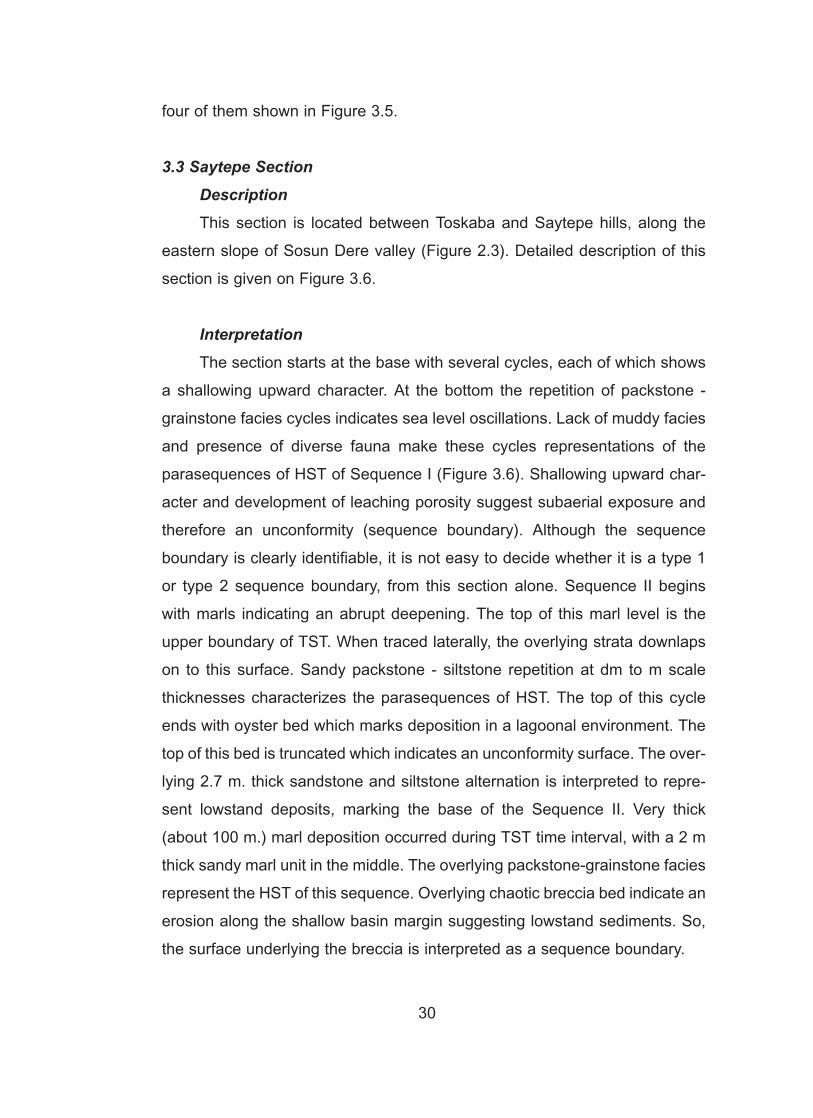
InterpretationThe section starts at the base with several cycles, each of which shows
a shallowing upward character. At the bottom the repetition of packstone -
grainstone facies cycles indicates sea level oscillations. Lack of muddy facies
and presence of diverse fauna make these cycles representations of the
parasequences of HST of Sequence I (Figure 3.6). Shallowing upward char-
acter and development of leaching porosity suggest subaerial exposure and
therefore an unconformity (sequence boundary). Although the sequence
boundary is clearly identifiable, it is not easy to decide whether it is a type 1
or type 2 sequence boundary, from this section alone. Sequence II begins
with marls indicating an abrupt deepening. The top of this marl level is the
upper boundary of TST. When traced laterally, the overlying strata downlaps
on to this surface. Sandy packstone - siltstone repetition at dm to m scale
thicknesses characterizes the parasequences of HST. The top of this cycle
ends with oyster bed which marks deposition in a lagoonal environment. The
top of this bed is truncated which indicates an unconformity surface. The over-
lying 2.7 m. thick sandstone and siltstone alternation is interpreted to repre-
sent lowstand deposits, marking the base of the Sequence II. Very thick
(about 100 m.) marl deposition occurred during TST time interval, with a 2 m
thick sandy marl unit in the middle. The overlying packstone-grainstone facies
represent the HST of this sequence. Overlying chaotic breccia bed indicate an
erosion along the shallow basin margin suggesting lowstand sediments. So,
the surface underlying the breccia is interpreted as a sequence boundary.
30
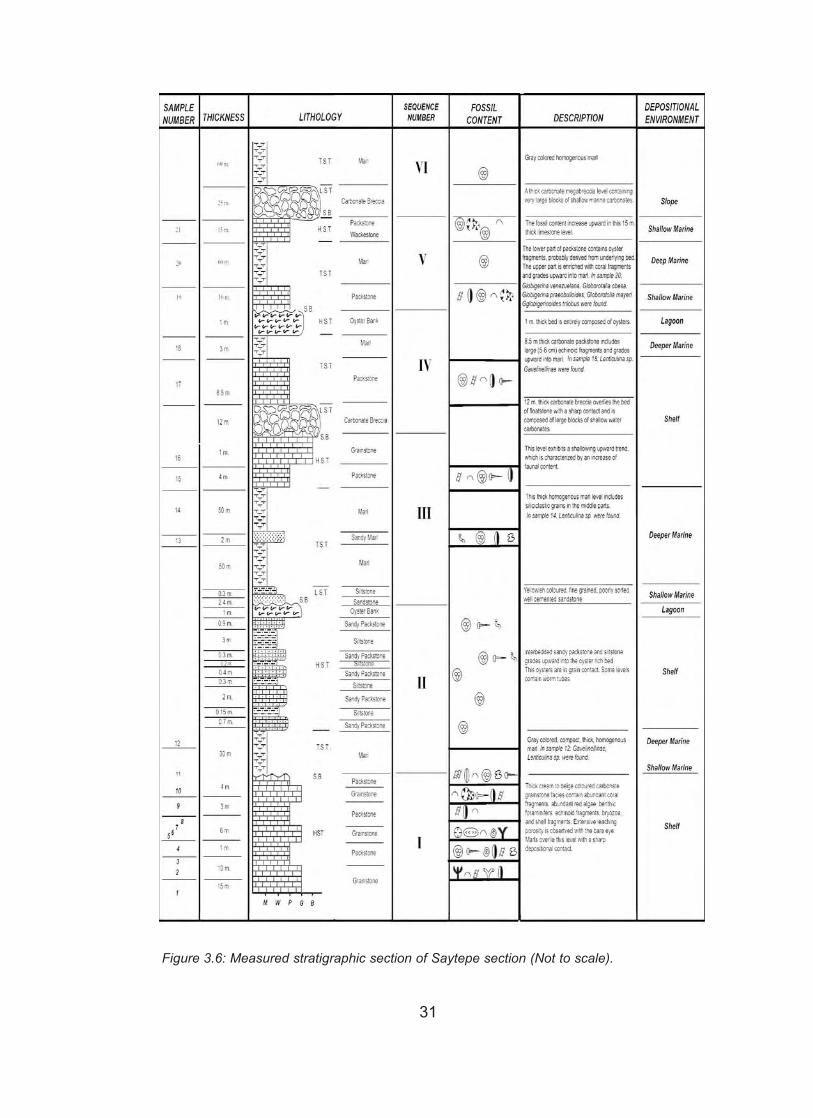
Figure 3.6: Measured stratigraphic section of Saytepe section (Not to scale).
31
32
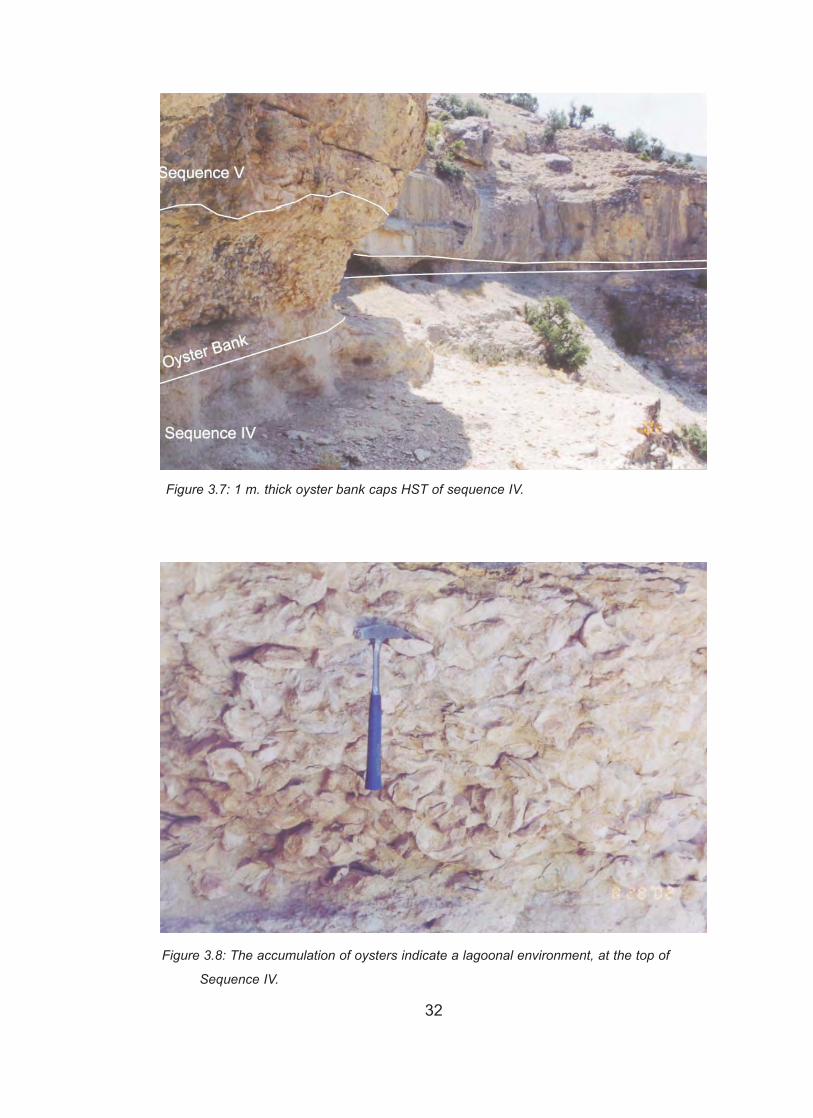
Figure 3.8: The accumulation of oysters indicate a lagoonal environment, at the top of
Sequence IV.
Figure 3.7: 1 m. thick oyster bank caps HST of sequence IV.
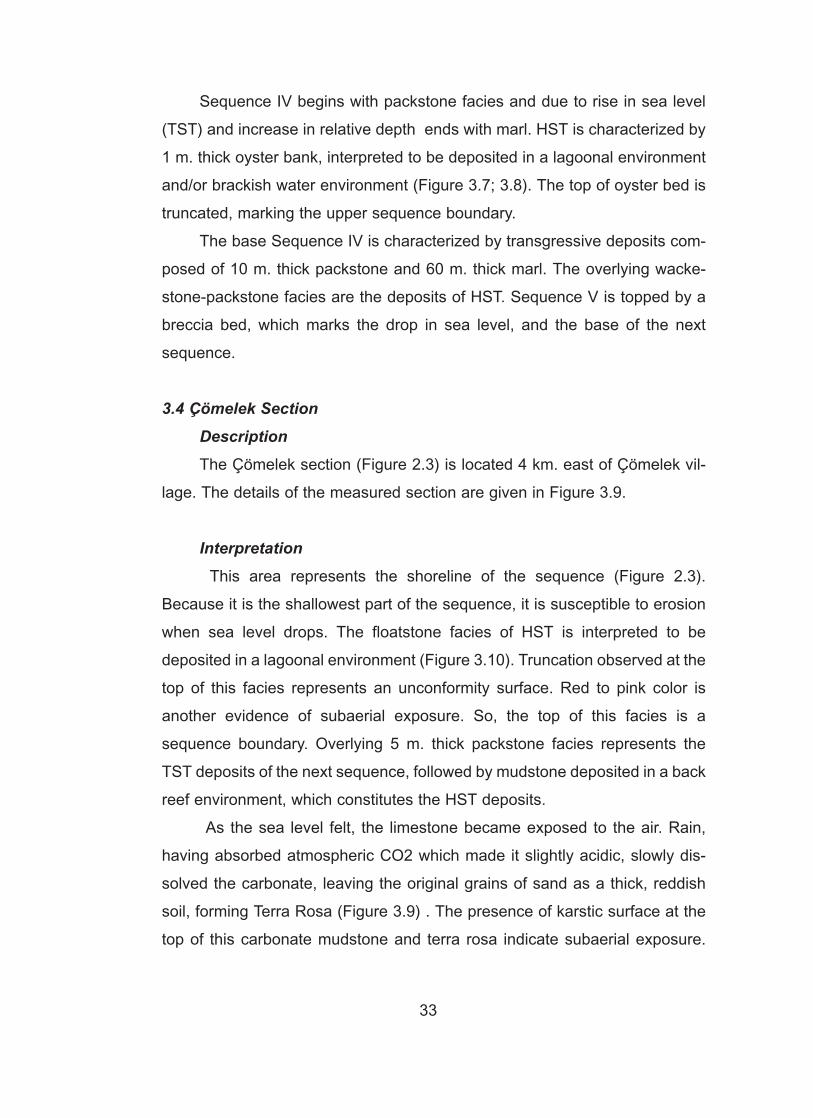
Sequence IV begins with packstone facies and due to rise in sea level
(TST) and increase in relative depth ends with marl. HST is characterized by
1 m. thick oyster bank, interpreted to be deposited in a lagoonal environment
and/or brackish water environment (Figure 3.7; 3.8). The top of oyster bed is
truncated, marking the upper sequence boundary.
The base Sequence IV is characterized by transgressive deposits com-
posed of 10 m. thick packstone and 60 m. thick marl. The overlying wacke-
stone-packstone facies are the deposits of HST. Sequence V is topped by a
breccia bed, which marks the drop in sea level, and the base of the next
sequence.
3.4 Çömelek SectionDescriptionThe Çömelek section (Figure 2.3) is located 4 km. east of Çömelek vil-
lage. The details of the measured section are given in Figure 3.9.
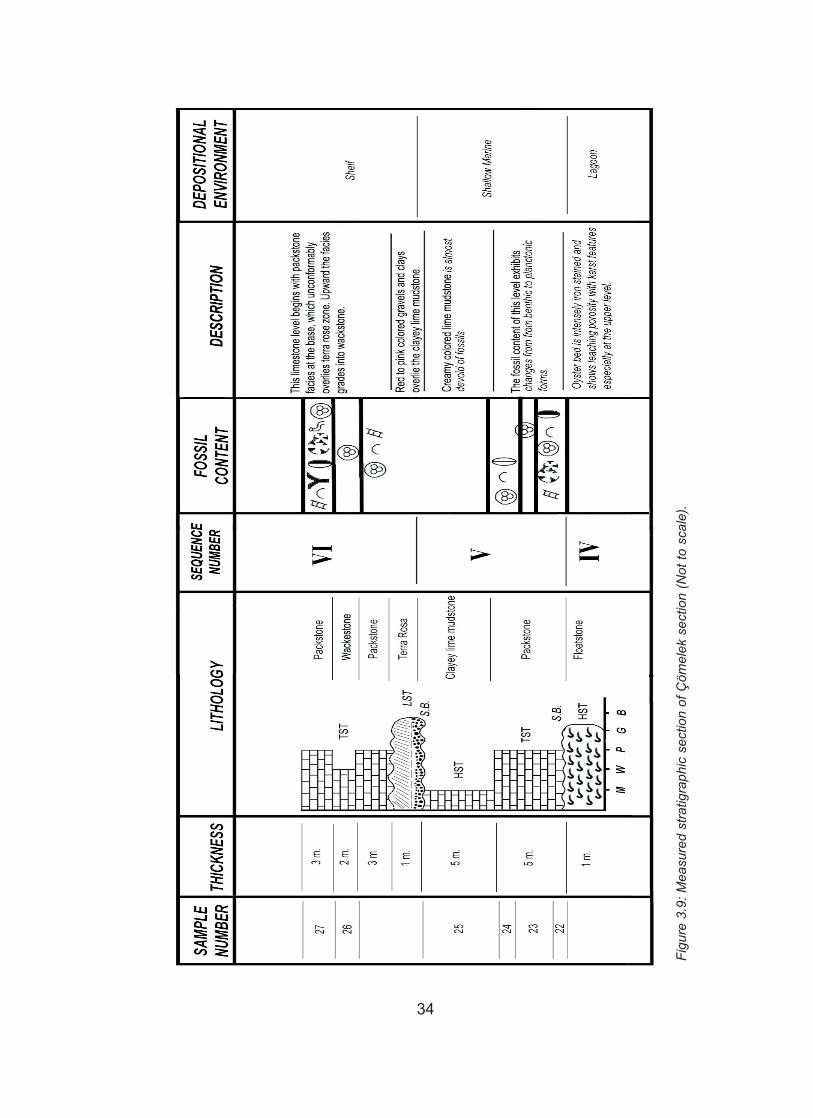
InterpretationThis area represents the shoreline of the sequence (Figure 2.3).
Because it is the shallowest part of the sequence, it is susceptible to erosion
when sea level drops. The floatstone facies of HST is interpreted to be
deposited in a lagoonal environment (Figure 3.10). Truncation observed at the
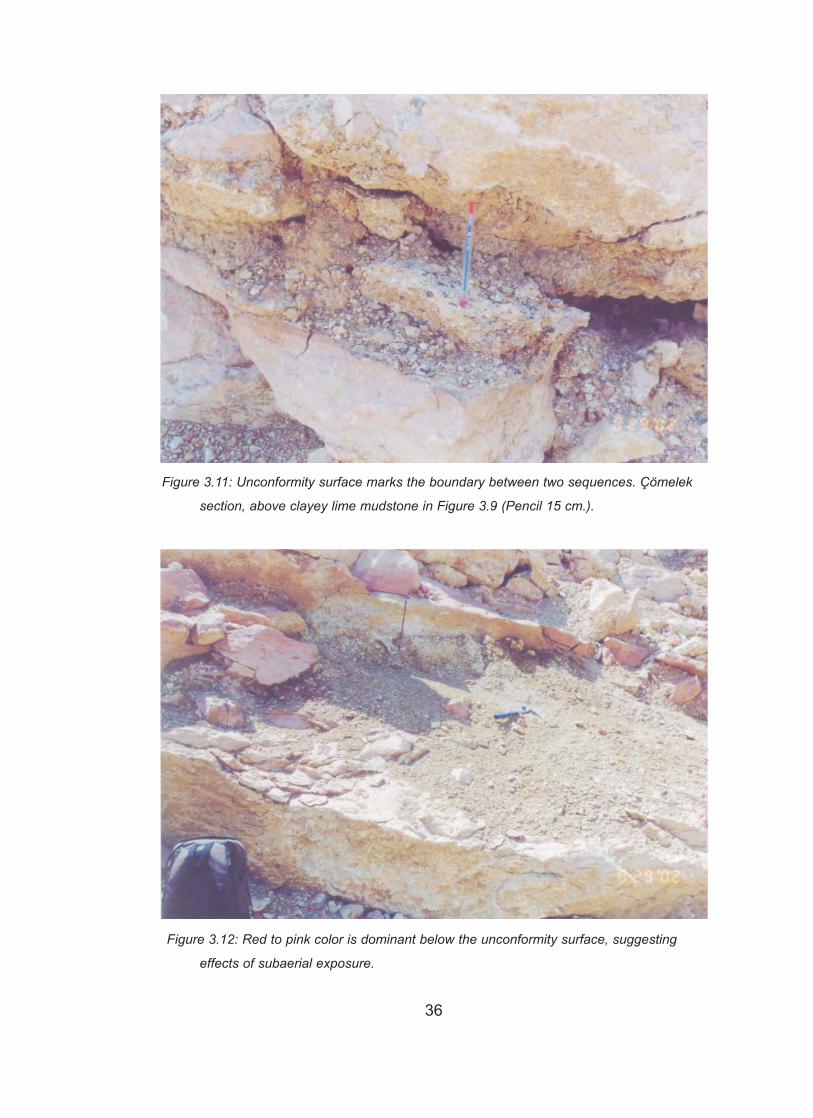
top of this facies represents an unconformity surface. Red to pink color is
another evidence of subaerial exposure. So, the top of this facies is a
sequence boundary. Overlying 5 m. thick packstone facies represents the
TST deposits of the next sequence, followed by mudstone deposited in a back
reef environment, which constitutes the HST deposits.
As the sea level felt, the limestone became exposed to the air. Rain,
having absorbed atmospheric CO2 which made it slightly acidic, slowly dis-
solved the carbonate, leaving the original grains of sand as a thick, reddish
soil, forming Terra Rosa (Figure 3.9) . The presence of karstic surface at the
top of this carbonate mudstone and terra rosa indicate subaerial exposure.
33
Figu
re 3
.9: M
easu
red
stra
tigra
phic
sec
tion
of Ç
ömel
ek s
ectio
n (N
ot to
sca
le).
34
35
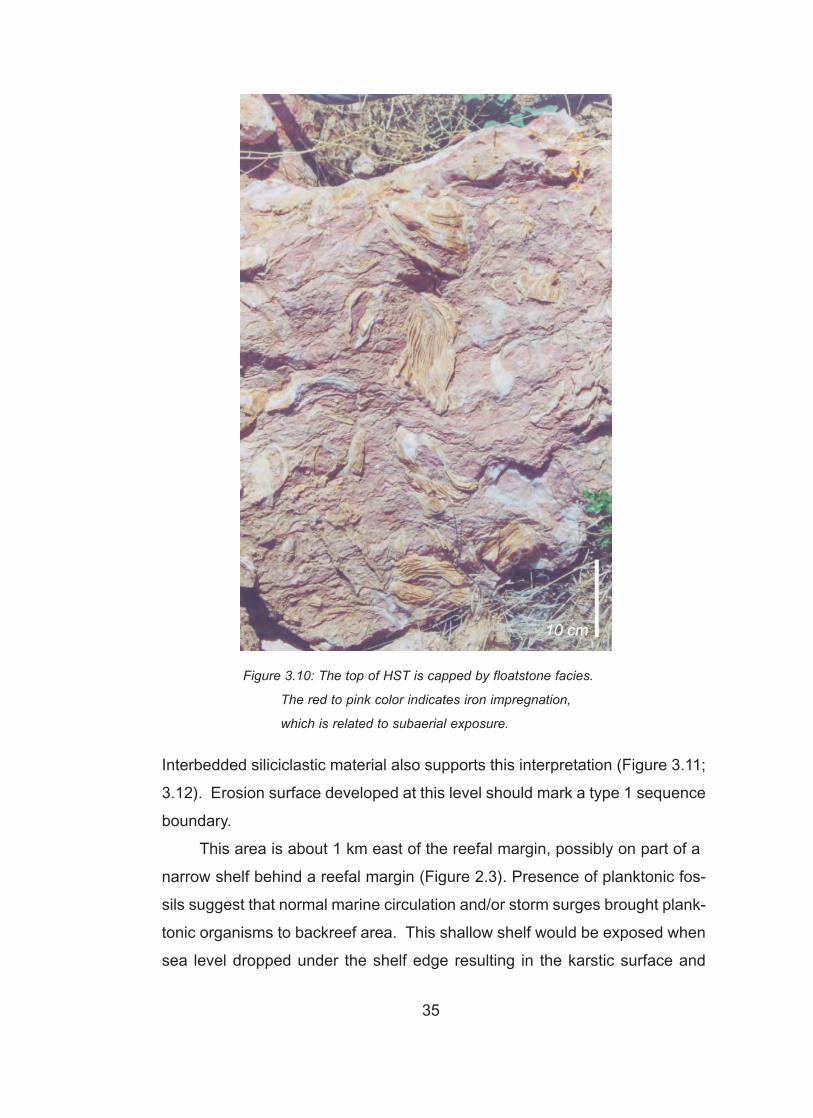
Interbedded siliciclastic material also supports this interpretation (Figure 3.11;
3.12). Erosion surface developed at this level should mark a type 1 sequence
boundary.
This area is about 1 km east of the reefal margin, possibly on part of a
narrow shelf behind a reefal margin (Figure 2.3). Presence of planktonic fos-
sils suggest that normal marine circulation and/or storm surges brought plank-
tonic organisms to backreef area. This shallow shelf would be exposed when
sea level dropped under the shelf edge resulting in the karstic surface and
Figure 3.10: The top of HST is capped by floatstone facies.
The red to pink color indicates iron impregnation,
which is related to subaerial exposure.
36
Figure 3.11: Unconformity surface marks the boundary between two sequences. Çömelek
section, above clayey lime mudstone in Figure 3.9 (Pencil 15 cm.).
Figure 3.12: Red to pink color is dominant below the unconformity surface, suggesting
effects of subaerial exposure.
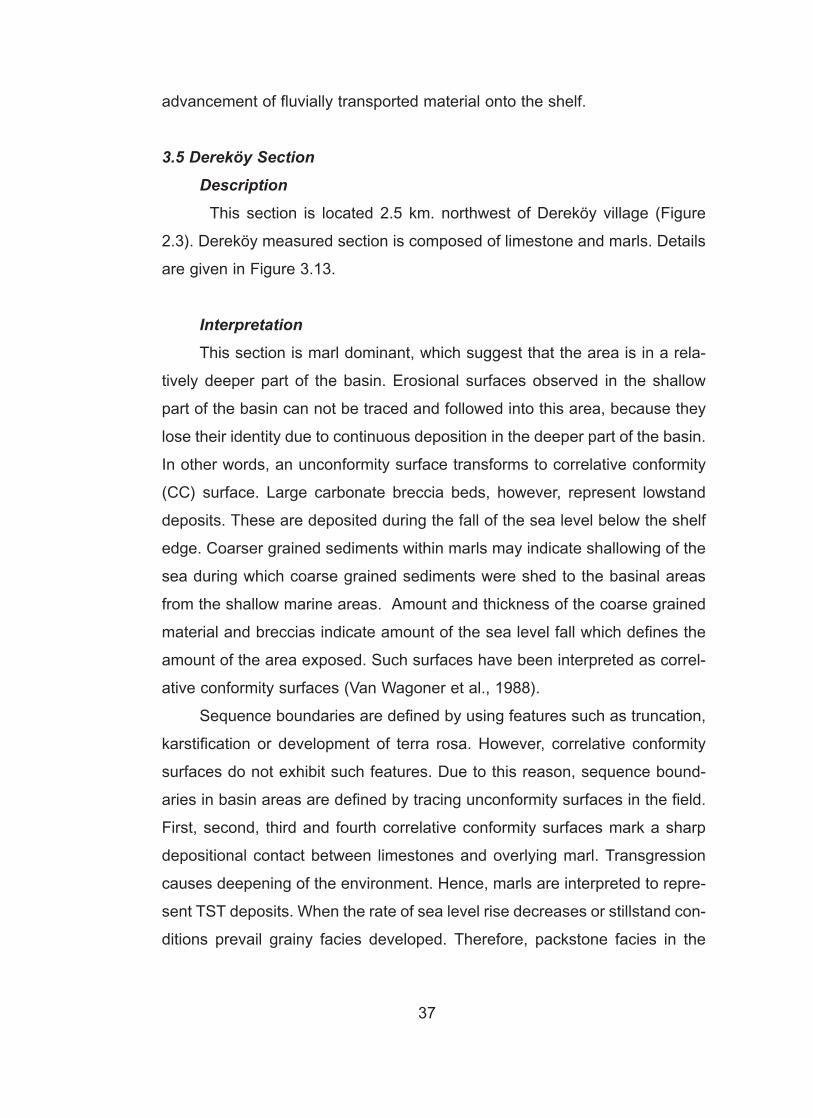
advancement of fluvially transported material onto the shelf.
3.5 Dereköy SectionDescription
This section is located 2.5 km. northwest of Dereköy village (Figure
2.3). Dereköy measured section is composed of limestone and marls. Details
are given in Figure 3.13.
InterpretationThis section is marl dominant, which suggest that the area is in a rela-
tively deeper part of the basin. Erosional surfaces observed in the shallow
part of the basin can not be traced and followed into this area, because they
lose their identity due to continuous deposition in the deeper part of the basin.
In other words, an unconformity surface transforms to correlative conformity
(CC) surface. Large carbonate breccia beds, however, represent lowstand
deposits. These are deposited during the fall of the sea level below the shelf
edge. Coarser grained sediments within marls may indicate shallowing of the
sea during which coarse grained sediments were shed to the basinal areas
from the shallow marine areas. Amount and thickness of the coarse grained
material and breccias indicate amount of the sea level fall which defines the
amount of the area exposed. Such surfaces have been interpreted as correl-
ative conformity surfaces (Van Wagoner et al., 1988).
Sequence boundaries are defined by using features such as truncation,
karstification or development of terra rosa. However, correlative conformity
surfaces do not exhibit such features. Due to this reason, sequence bound-
aries in basin areas are defined by tracing unconformity surfaces in the field.
First, second, third and fourth correlative conformity surfaces mark a sharp
depositional contact between limestones and overlying marl. Transgression
causes deepening of the environment. Hence, marls are interpreted to repre-
sent TST deposits. When the rate of sea level rise decreases or stillstand con-
ditions prevail grainy facies developed. Therefore, packstone facies in the
37
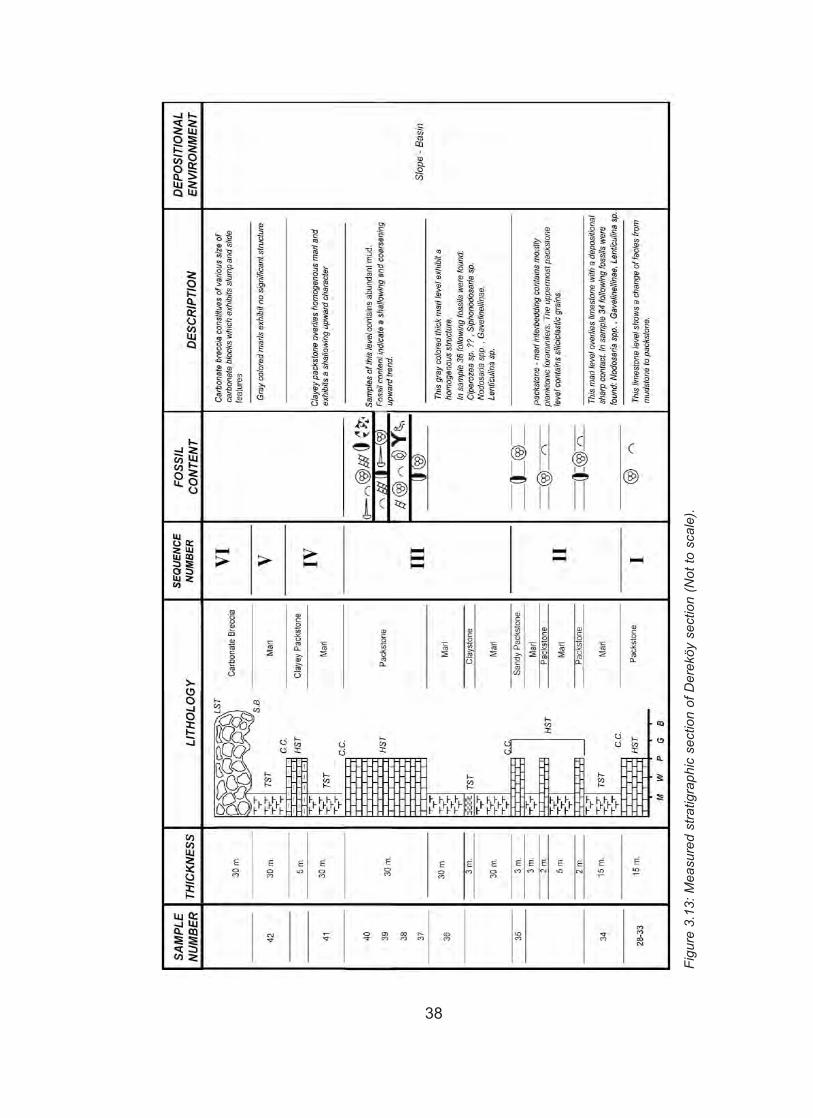
38
Figu
re 3
.13:
Mea
sure
d st
ratig
raph
ic s
ectio
n of
Der
eköy
sec
tion
(Not
to s
cale
).
section is interpreted as HST Deposits. As mentioned above Dereköy section
represent basinal area. Hence, lowstand deposits does not exist in the sec-
tion, except Sequence VI. The 30 m. marl level at the top of this section has
a truncated surface at the top. This truncation is related with the sea level fall
which produced the following 30 m. thick carbonate breccia level.
39
CHAPTER 4
DIAGENETIC IMPRINT OF SEQUENCES
Carbonate sediments are more susceptible to diagenesis than most sil-
icate minerals (Boggs, 1995). There are relatively few studies about the rela-
tionship between sequence stratigraphy and diagenesis of siliciclastic
deposits, compared with carbonates (Ketzer, 2002).
The diagenesis of carbonate sediment is controlled by the original
facies, mineralogy, climate, sea level change and burial history (Moss and
Tucker, 1996). As the carbonates are deposited, precipitated, buried, eroded,
exposed and reburied, they interact with water of marine, meteoric and deep
subsurface origin. Each of these fluids affects the sediments or rock in a spe-
cial way and leaves a unique diagenetic signature (James and Choquette,
1990). If carbonate sediments are exposed subaerially to percolating mete-
oric water two reactions occur:
a. Water controlled meteoric diagenesis that is driven by the reaction
between the carbonates (regardless of composition) and meteoric water
of differing temperature and/or amount of dissolved CO2 which causes
formation of caves and other karst features, local development of spe-
lean carbonates and calcrete development (James and Choquette,
1990),
b. Material controlled diagenesis that is driven by the reaction between
mineralogy of differing solubilities and meteoric water results in the
transformation of aragonite and high magnesium calcite to low magne-
sium calcite (James and Choquette, 1990).
As carbonate sediments undergo progressive burial and are subjected
40
to increasing temperature and pressure during and after lithification, they go
through a variety of modification. These include; 1) mechanical and chemical
compaction during which porosities may be sharply reduced; 2) cementation
by carbonate, sulphate and silica minerals; 3) conversion of metastable forms
of CaCO3 to low Mg calcite; 4) decomposition as well as bio and thermo-
chemical transformation of organic matter.
A generalized diagenetic scheme for the Miocene carbonates of Mut
basin is based on the study of thin sections and field observations which con-
centrated on macro scale features like karst dissolution, infiltration of iron rich
clays and fluids, and input of siliciclastics, indicating fresh water input to the
basin.
Thin sections study point to two major groups:
1. No evidence of solution or precipitation in deep water facies.
2. Fresh water diagenesis and/or leaching features.
The first group of carbonates has been interpreted as being deposited in
deepwater, while the second group is generally interpreted as being deposit-
ed in a shallow water environment (Bebout et al., 1979)
Each sequence in the study area shows different signs of diagenesis. In
Sequence I of ramp setting, along the Mut-Karaman road, show only calcite
cement of equant type. There are syntaxial overgrowths. All pore spaces in
the upper part of the sequence I is dominated by calcite cement. The crystal
size increase toward pore center. There is little leaching porosity observed in
thin section (Figure 4.1), but on the surface, extensive leaching porosity can
be seen. It is not certain whether it is a recent development or a result of the
sample size from which thin section is made.
On Sequence II, leaching porosity is evident. Large grains are leached
(Figure 4.2) and some of the grains are neomorphosed. However, the argilla-
ceous structure of packstone facies in this sequence did not allow water to
easily penetrate. Hence, such porosity is formed in grainstone facies.
On Sequence III syntaxial overgrowth is common, especially, in the
shallow water facies. In the relatively deeper water facies, only little effect of
41

42
Figure 4.1: On the ramp sequence (Sequence I) little porosity is present. Present pore spaces
are filled by calcite cement. There are some leaching. This may be due to low porosi-
ty and permeability. Sample number 43 (Plane light x2.5).
Figure 4.2: On Sequence II extensive leaching developed. This is possible either in phreatic
zone when water is undersaturated with respect to calcite and/or in vadoze zone.
Sample number 10 (Plane light, x2.5).
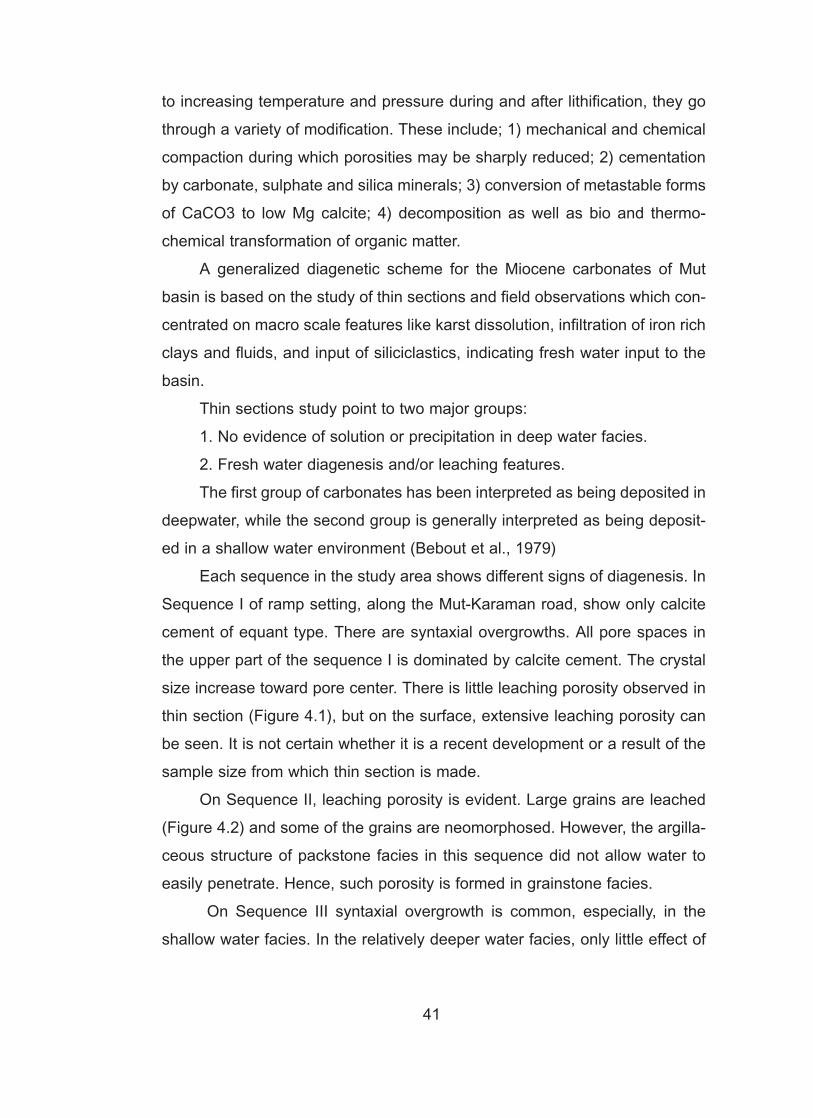
the diagenetic changes are observed. Locally micropore spaces are filled with
iron oxide staining (Figure 4.3) which may indicate that water during subaeri-
al exposure was rich in iron that can be attributable to humid climate.
Mineralogically selective dissolution is common in the shallow marine lime-
stone especially red algae, and some bivalve shell fragments are selectively
dissolved and porosity was created.
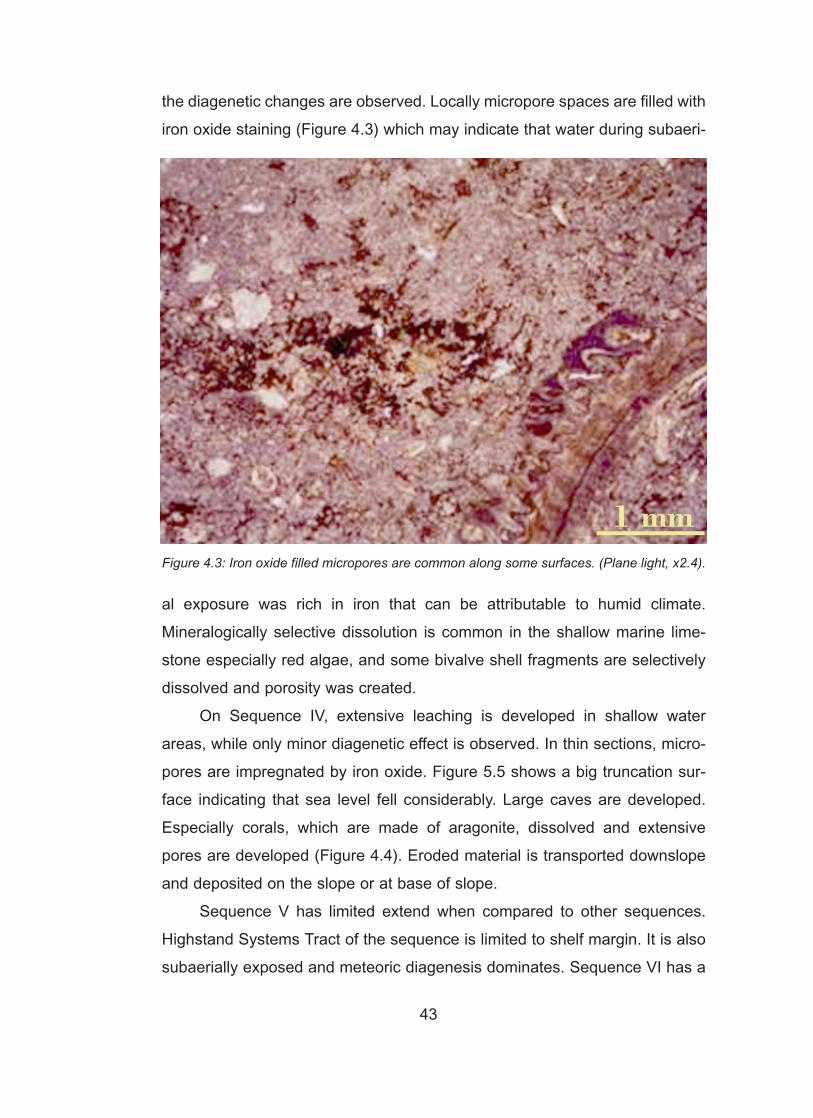
On Sequence IV, extensive leaching is developed in shallow water
areas, while only minor diagenetic effect is observed. In thin sections, micro-
pores are impregnated by iron oxide. Figure 5.5 shows a big truncation sur-
face indicating that sea level fell considerably. Large caves are developed.
Especially corals, which are made of aragonite, dissolved and extensive
pores are developed (Figure 4.4). Eroded material is transported downslope
and deposited on the slope or at base of slope.
Sequence V has limited extend when compared to other sequences.
Highstand Systems Tract of the sequence is limited to shelf margin. It is also
subaerially exposed and meteoric diagenesis dominates. Sequence VI has a
43
Figure 4.3: Iron oxide filled micropores are common along some surfaces. (Plane light, x2.4).
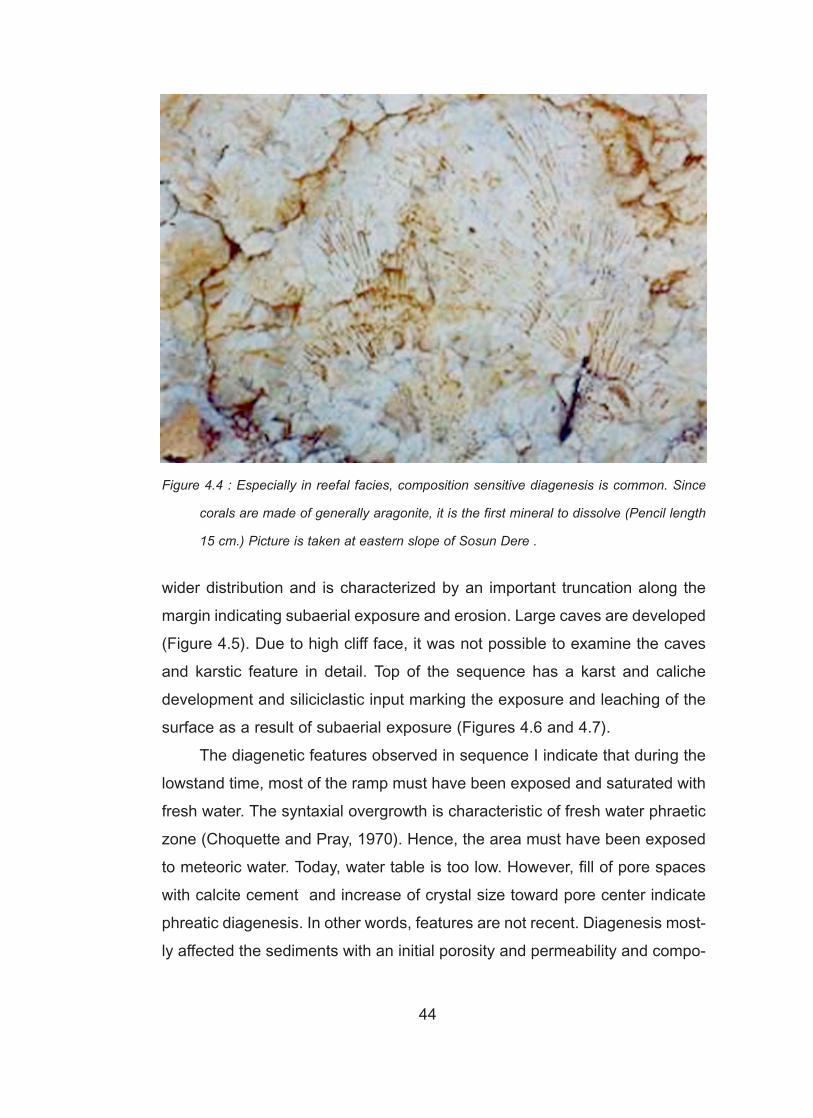
wider distribution and is characterized by an important truncation along the
margin indicating subaerial exposure and erosion. Large caves are developed
(Figure 4.5). Due to high cliff face, it was not possible to examine the caves
and karstic feature in detail. Top of the sequence has a karst and caliche
development and siliciclastic input marking the exposure and leaching of the
surface as a result of subaerial exposure (Figures 4.6 and 4.7).
The diagenetic features observed in sequence I indicate that during the
lowstand time, most of the ramp must have been exposed and saturated with
fresh water. The syntaxial overgrowth is characteristic of fresh water phraetic
zone (Choquette and Pray, 1970). Hence, the area must have been exposed
to meteoric water. Today, water table is too low. However, fill of pore spaces
with calcite cement and increase of crystal size toward pore center indicate
phreatic diagenesis. In other words, features are not recent. Diagenesis most-
ly affected the sediments with an initial porosity and permeability and compo-
44
Figure 4.4 : Especially in reefal facies, composition sensitive diagenesis is common. Since
corals are made of generally aragonite, it is the first mineral to dissolve (Pencil length
15 cm.) Picture is taken at eastern slope of Sosun Dere .
45
Figure 4.5: Large caves developed due to subaerial exposure in sequence VI. Due to high
cliffs, it was not possible to make detailed analysis. Photo is taken from westen slope
of Sosun Dere looking east.
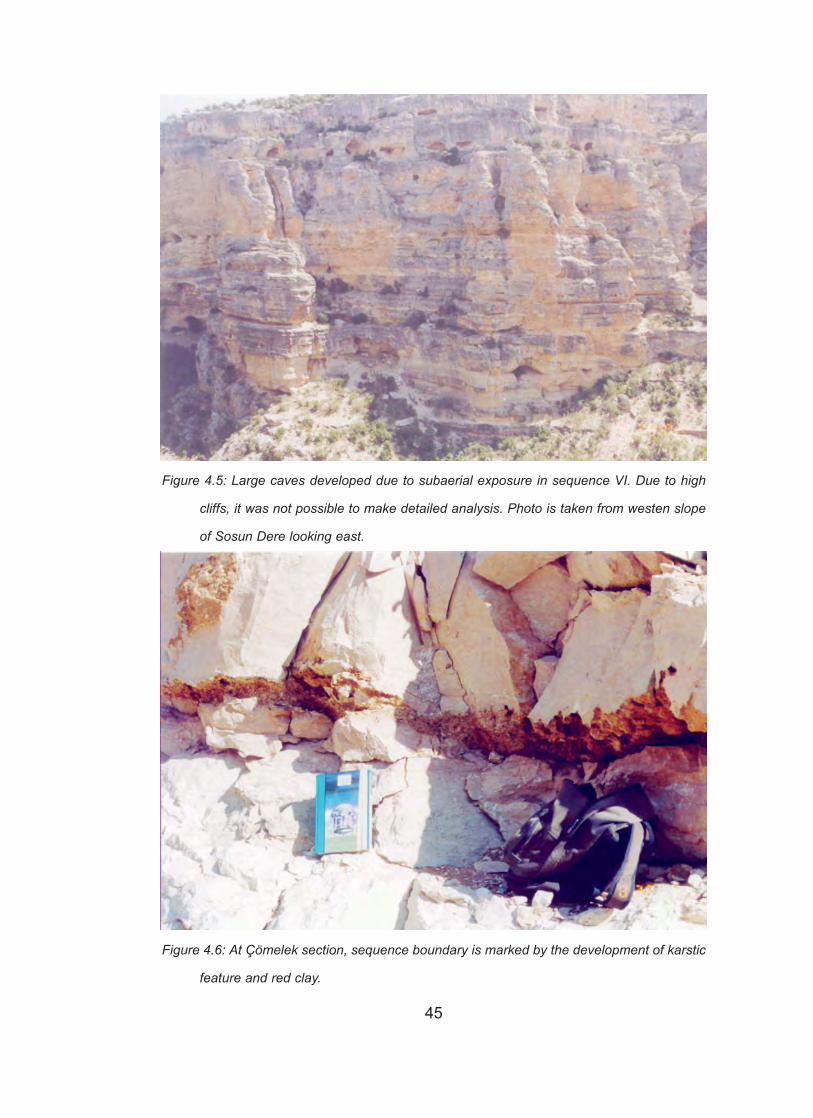
Figure 4.6: At Çömelek section, sequence boundary is marked by the development of karstic
feature and red clay.

sition of grains which are made up of aragonite and high magnesium calcite
that are more susceptible to dissolution when subjected to meteoric water.
Deep marine deposition allowed Sequence II to be cemented with
micritic calcite cement. On Sequence III iron oxide staining indicates circula-
tion of meteoric water rich in iron oxide. On sequences IV, V and VI the devel-
opment of large caves show that the shelf areas were exposed and meteoric
diagenesis dominated.
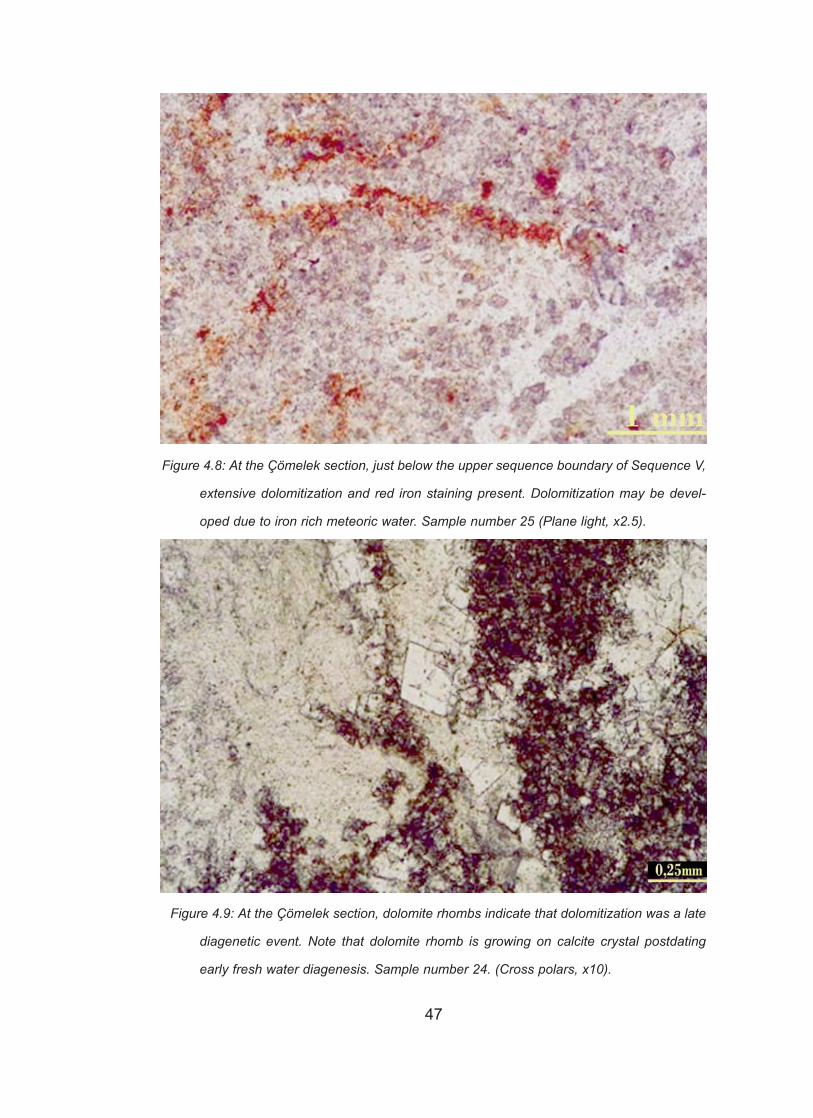
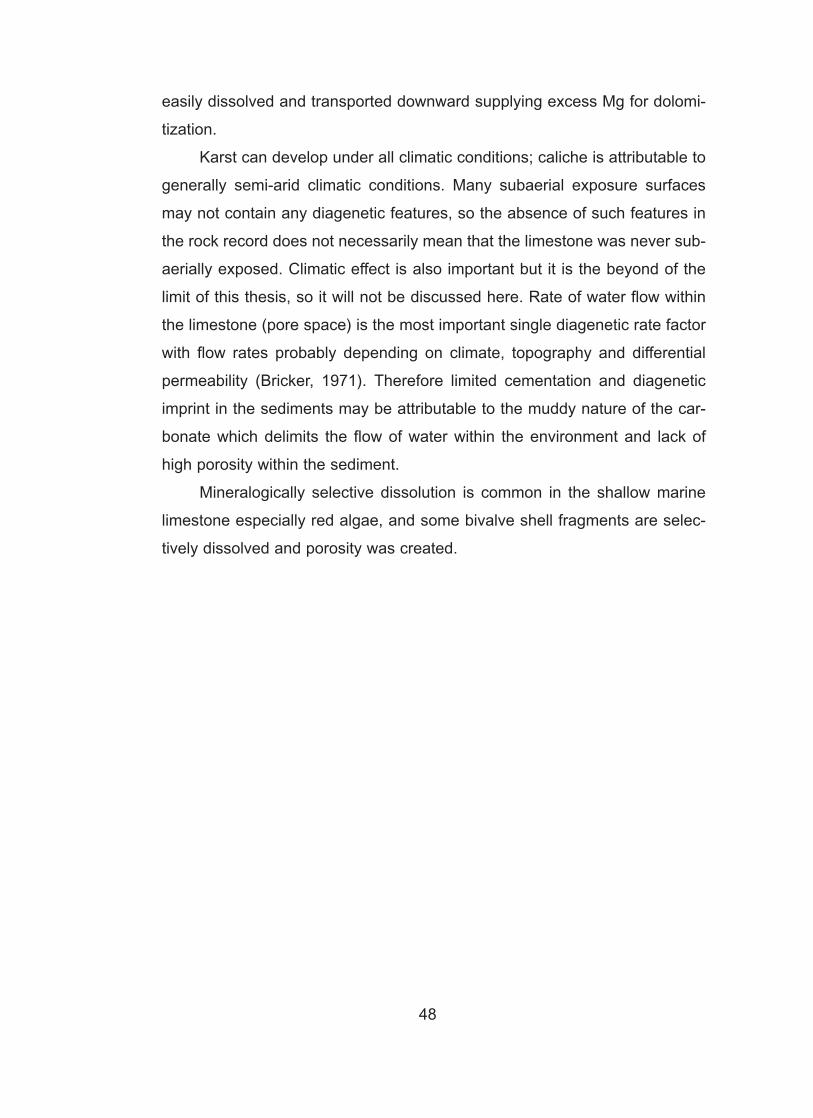
Just below and around the karstic surface extensive dolomitization
developed (Figure 4.8). This dolomitization postdates early diagenesis and
therefore is interpreted as late diagenetic event (Figure 4.9). There may be
other dolomitized levels around sequence boundaries especially where ero-
sion occurs, suggesting a considerable sea level fall. This falling event must
have controlled the input of fresh water into the diagenetic environment. In the
upper part of the meteoric zone, aragonite and high magnesium calcite are
46
Figure 4.7: At Çömelek section, there is coarse siliciclastic material indicating that there was
some input from the land areas. Red to pink color indicates oxidizing which is evidence
of subaerial exposure.
47
Figure 4.8: At the Çömelek section, just below the upper sequence boundary of Sequence V,
extensive dolomitization and red iron staining present. Dolomitization may be devel-
oped due to iron rich meteoric water. Sample number 25 (Plane light, x2.5).
Figure 4.9: At the Çömelek section, dolomite rhombs indicate that dolomitization was a late
diagenetic event. Note that dolomite rhomb is growing on calcite crystal postdating
early fresh water diagenesis. Sample number 24. (Cross polars, x10).
easily dissolved and transported downward supplying excess Mg for dolomi-
tization.
Karst can develop under all climatic conditions; caliche is attributable to
generally semi-arid climatic conditions. Many subaerial exposure surfaces
may not contain any diagenetic features, so the absence of such features in
the rock record does not necessarily mean that the limestone was never sub-
aerially exposed. Climatic effect is also important but it is the beyond of the
limit of this thesis, so it will not be discussed here. Rate of water flow within
the limestone (pore space) is the most important single diagenetic rate factor
with flow rates probably depending on climate, topography and differential
permeability (Bricker, 1971). Therefore limited cementation and diagenetic
imprint in the sediments may be attributable to the muddy nature of the car-
bonate which delimits the flow of water within the environment and lack of
high porosity within the sediment.
Mineralogically selective dissolution is common in the shallow marine
limestone especially red algae, and some bivalve shell fragments are selec-
tively dissolved and porosity was created.
48

CHAPTER 5
CORRELATION OF SECTIONS
Measured sections within the study area and surface exposures have
been correlated with each other in order to construct the sequence strati-
graphic framework of the Miocene carbonate sediments in the area. In corre-
lating the sequences, field observations, thin section studies and tracing of
beds along surface exposures are used (Figure 5.1). Erosional unconformi-
ties are very clear as indicated by removal of sediments along the margin
(Figure 5.2) and by onlapping relations of the beds (Figure 5.3). Top of each
shallowing upward cycle, as well as an erosion surface, is interpreted to rep-
resent a sequence boundary and marked as an "unconformity surface" on the
marginal areas. Shallowing upward cycles, debris flows (Figure 5.4) and sud-
den deepening have been used to define correlatable surfaces to define
sequence boundaries and systems tract in the slope or basinal areas. Such
surfaces are then followed along the exposure faces to tie them to the mea-
sured sections. All sections are tied in a N-S direction. Studies are concen-
trated on two areas:
1- Relatively deeper water areas, where the effect of sea level fall can
be distinguished by microfacies analysis (through thin section studies) or
observation of large scale features like development of megabreccia beds
and siliciclastic interbeds, as observed between Aracasivrisi Hill and Kaşbağı
Hill (Figure 2.3). Development of megabreccias and siliciclastic material are
the product of sea level fall that causes siliclastic material bypass the shelf
and be deposited in the basinal areas (Handford and Loucks, 1993). The
material may be so fine grained that they can only be defined by studying thin
sections. Saytepe and Dereköy sections are located in relatively deeper
49

marine areas (Figure 2.3).
2- Shallow water and/or lagoon, where effect of sea level changes is
more pronounced and is reflected by the facies types developed. Stratal
geometries can be best observed in areas from shore to shelf margin.
Especially shelf margin erosional features can be used for defining sequence
boundaries. Çömelek section is located near paleoshoreline, representing
shallow marine setting (Figure 2.3).Lowest sequence in the study area is
recognised as a transgressive conglomeratic bed over Mesozoic carbonates
forming the basement. This first sequence is exposed north of Dereköy vil-
lage; lithologic details are not recorded due to difficulty in reaching the cliff
face. Lateral extension of this sequence is exposed at the base of Sosun
Dere. There is no shelf margin or break in slope developed during Sequence
I. Highstand Systems Tract of Sequence I is overlain by Transgressive
Systems Tract of Sequence II (Figure 5.5). This sequence boundary is
50
Figure 5.1: Along Sosun Dere bedsets can be traced from Toskaba Hill to reefal margin in
the south of Çömelek, which allowed correlation of sequences. Picture is taken from
the west of Toskaba Hill looking toward NE.
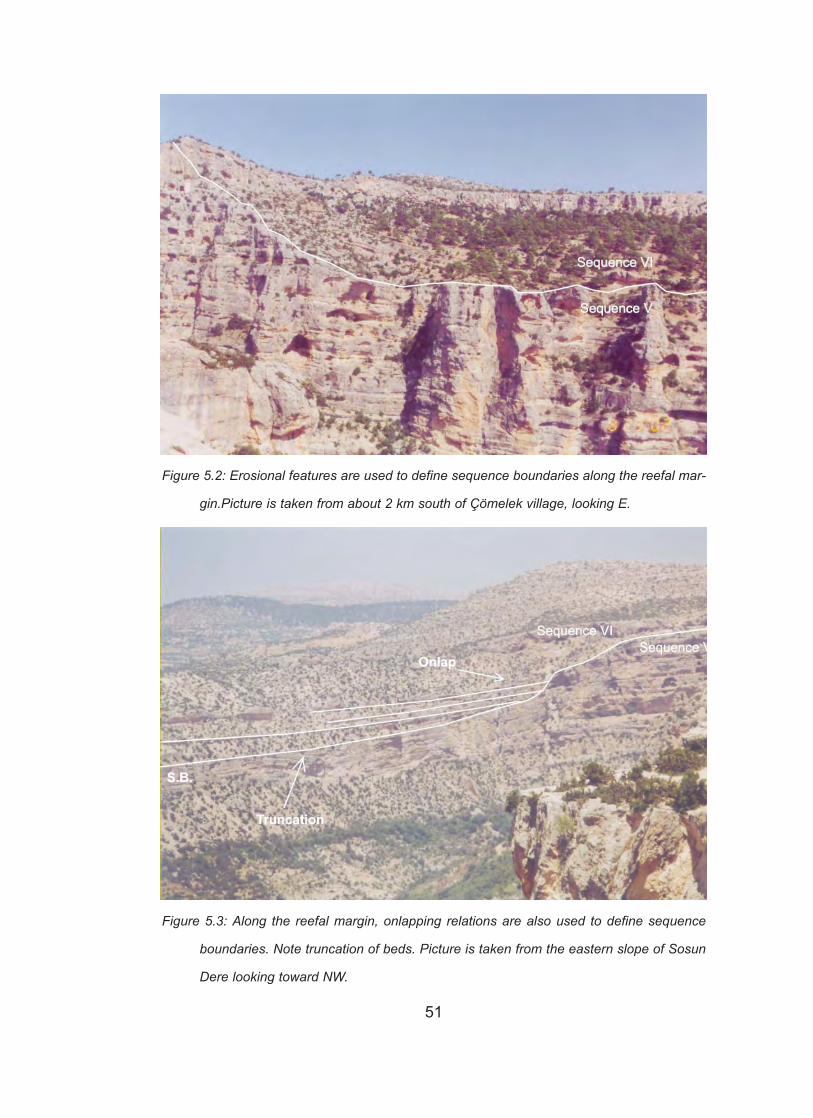
51
Figure 5.2: Erosional features are used to define sequence boundaries along the reefal mar-
gin.Picture is taken from about 2 km south of Çömelek village, looking E.
Figure 5.3: Along the reefal margin, onlapping relations are also used to define sequence
boundaries. Note truncation of beds. Picture is taken from the eastern slope of Sosun
Dere looking toward NW.
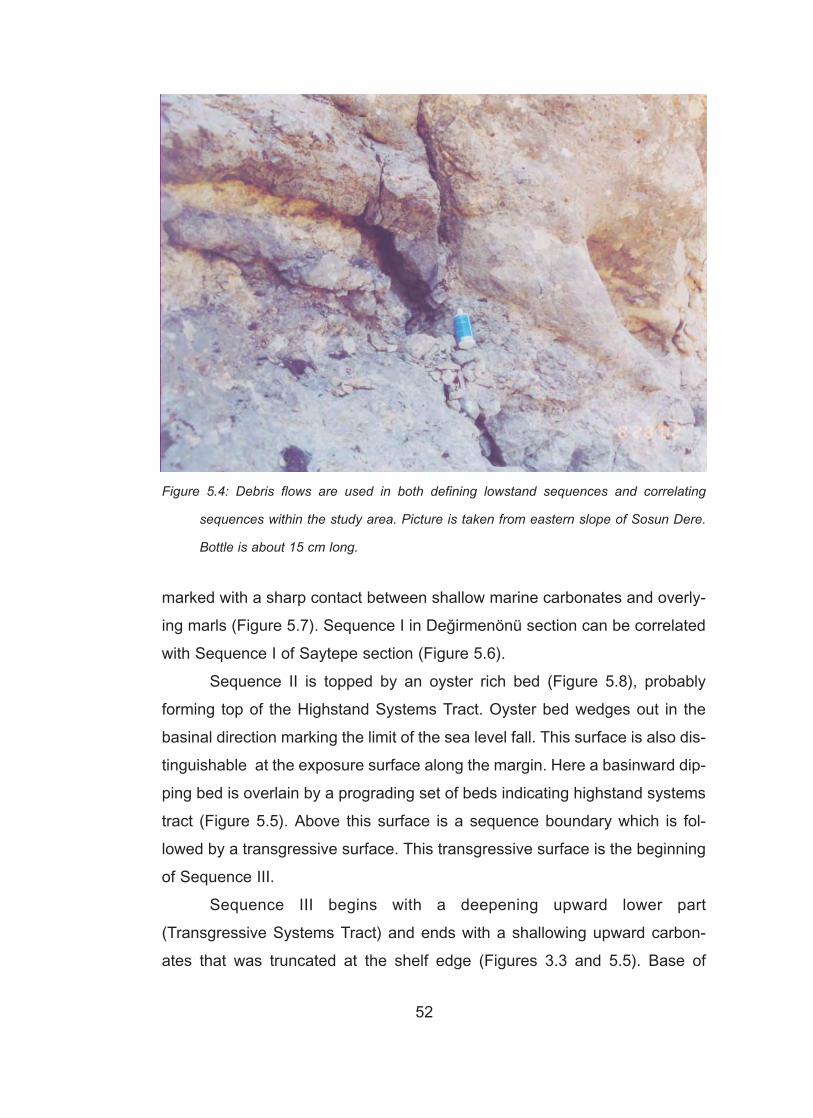
marked with a sharp contact between shallow marine carbonates and overly-
ing marls (Figure 5.7). Sequence I in Değirmenönü section can be correlated
with Sequence I of Saytepe section (Figure 5.6).
Sequence II is topped by an oyster rich bed (Figure 5.8), probably
forming top of the Highstand Systems Tract. Oyster bed wedges out in the
basinal direction marking the limit of the sea level fall. This surface is also dis-
tinguishable at the exposure surface along the margin. Here a basinward dip-
ping bed is overlain by a prograding set of beds indicating highstand systems
tract (Figure 5.5). Above this surface is a sequence boundary which is fol-
lowed by a transgressive surface. This transgressive surface is the beginning
of Sequence III.
Sequence III begins with a deepening upward lower part
(Transgressive Systems Tract) and ends with a shallowing upward carbon-
ates that was truncated at the shelf edge (Figures 3.3 and 5.5). Base of
52
Figure 5.4: Debris flows are used in both defining lowstand sequences and correlating
sequences within the study area. Picture is taken from eastern slope of Sosun Dere.
Bottle is about 15 cm long.

53
Figu
re 5
.5: R
elat
ion
of s
eque
nces
are
bes
t obs
erve
d al
ong
the
reef
al m
argi
n in
the
sout
heas
t of Ç
ömel
ek v
illage
alo
ng S
osun
Der
e. R
ed li
nes
indi
cate
sequ
ence
bou
ndar
ies,
gre
en li
ne in
dica
te to
p of
bas
emen
t and
yel
low
arro
ws
indi
cate
trun
cate
d be
ds o
r onl
appi
ng b
eds.
A re
fers
to F
igur
e 5.
11.

54
ab
Figu
re 5
.6: C
orre
latio
n of
a) S
ayte
pe a
nd D
eğirm
enön
ü se
ctio
ns, b
) Çöm
elek
, Say
tepe
and
Der
eköy
sec
tions
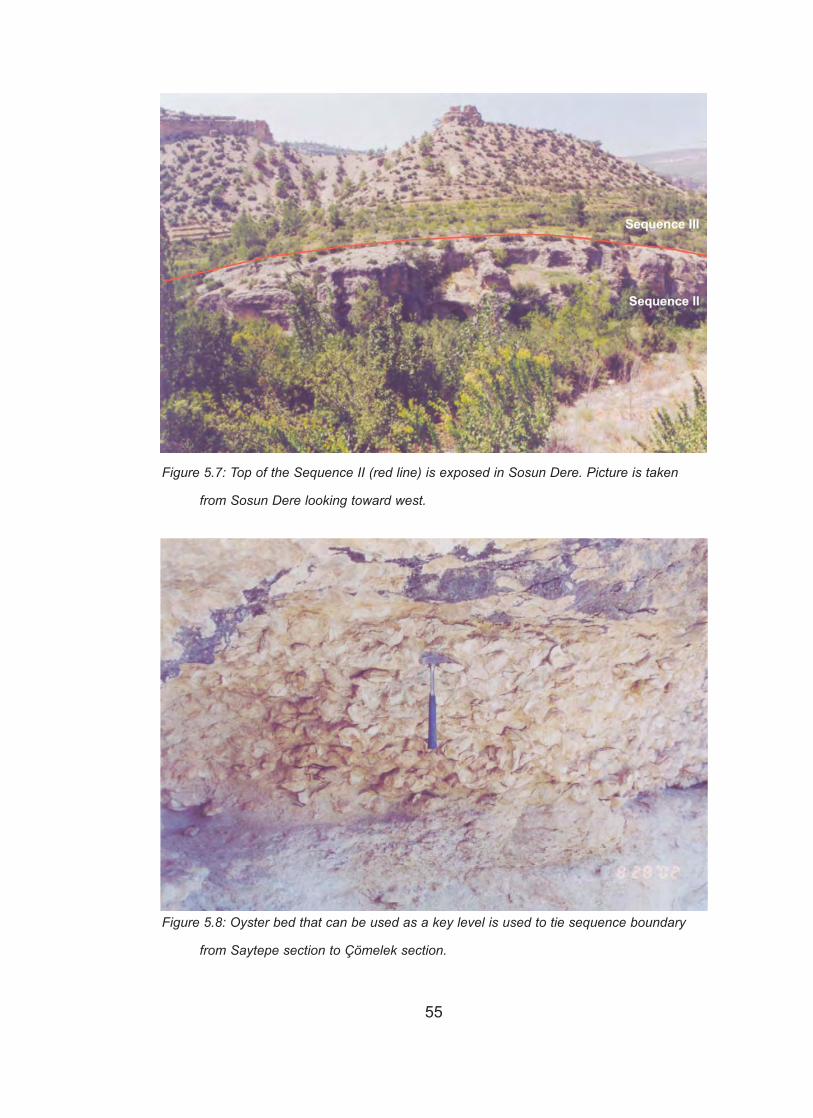
55
Figure 5.7: Top of the Sequence II (red line) is exposed in Sosun Dere. Picture is taken
from Sosun Dere looking toward west.
Figure 5.8: Oyster bed that can be used as a key level is used to tie sequence boundary
from Saytepe section to Çömelek section.
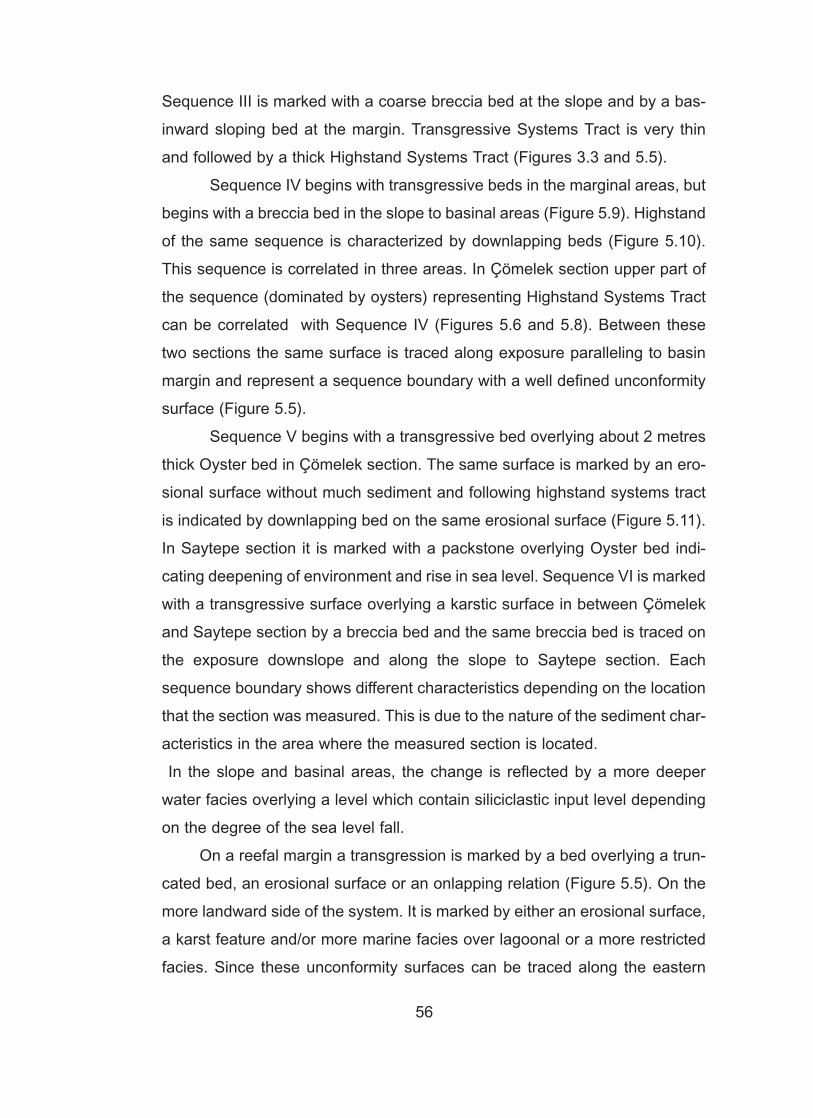
Sequence III is marked with a coarse breccia bed at the slope and by a bas-
inward sloping bed at the margin. Transgressive Systems Tract is very thin
and followed by a thick Highstand Systems Tract (Figures 3.3 and 5.5).
Sequence IV begins with transgressive beds in the marginal areas, but
begins with a breccia bed in the slope to basinal areas (Figure 5.9). Highstand
of the same sequence is characterized by downlapping beds (Figure 5.10).
This sequence is correlated in three areas. In Çömelek section upper part of
the sequence (dominated by oysters) representing Highstand Systems Tract
can be correlated with Sequence IV (Figures 5.6 and 5.8). Between these
two sections the same surface is traced along exposure paralleling to basin
margin and represent a sequence boundary with a well defined unconformity
surface (Figure 5.5).
Sequence V begins with a transgressive bed overlying about 2 metres
thick Oyster bed in Çömelek section. The same surface is marked by an ero-
sional surface without much sediment and following highstand systems tract
is indicated by downlapping bed on the same erosional surface (Figure 5.11).
In Saytepe section it is marked with a packstone overlying Oyster bed indi-
cating deepening of environment and rise in sea level. Sequence VI is marked
with a transgressive surface overlying a karstic surface in between Çömelek
and Saytepe section by a breccia bed and the same breccia bed is traced on
the exposure downslope and along the slope to Saytepe section. Each
sequence boundary shows different characteristics depending on the location
that the section was measured. This is due to the nature of the sediment char-
acteristics in the area where the measured section is located.
In the slope and basinal areas, the change is reflected by a more deeper
water facies overlying a level which contain siliciclastic input level depending
on the degree of the sea level fall.
On a reefal margin a transgression is marked by a bed overlying a trun-
cated bed, an erosional surface or an onlapping relation (Figure 5.5). On the
more landward side of the system. It is marked by either an erosional surface,
a karst feature and/or more marine facies over lagoonal or a more restricted
facies. Since these unconformity surfaces can be traced along the eastern
56
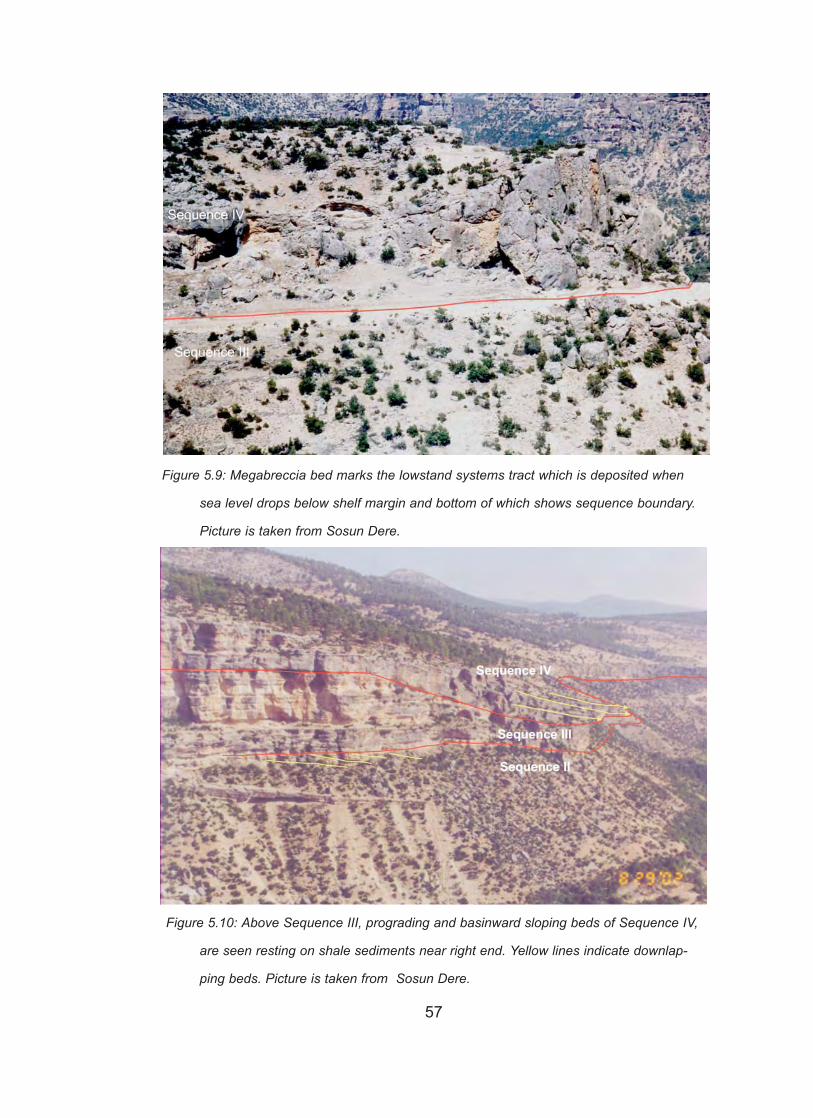
57
Figure 5.10: Above Sequence III, prograding and basinward sloping beds of Sequence IV,
are seen resting on shale sediments near right end. Yellow lines indicate downlap-
ping beds. Picture is taken from Sosun Dere.
Figure 5.9: Megabreccia bed marks the lowstand systems tract which is deposited when
sea level drops below shelf margin and bottom of which shows sequence boundary.
Picture is taken from Sosun Dere.
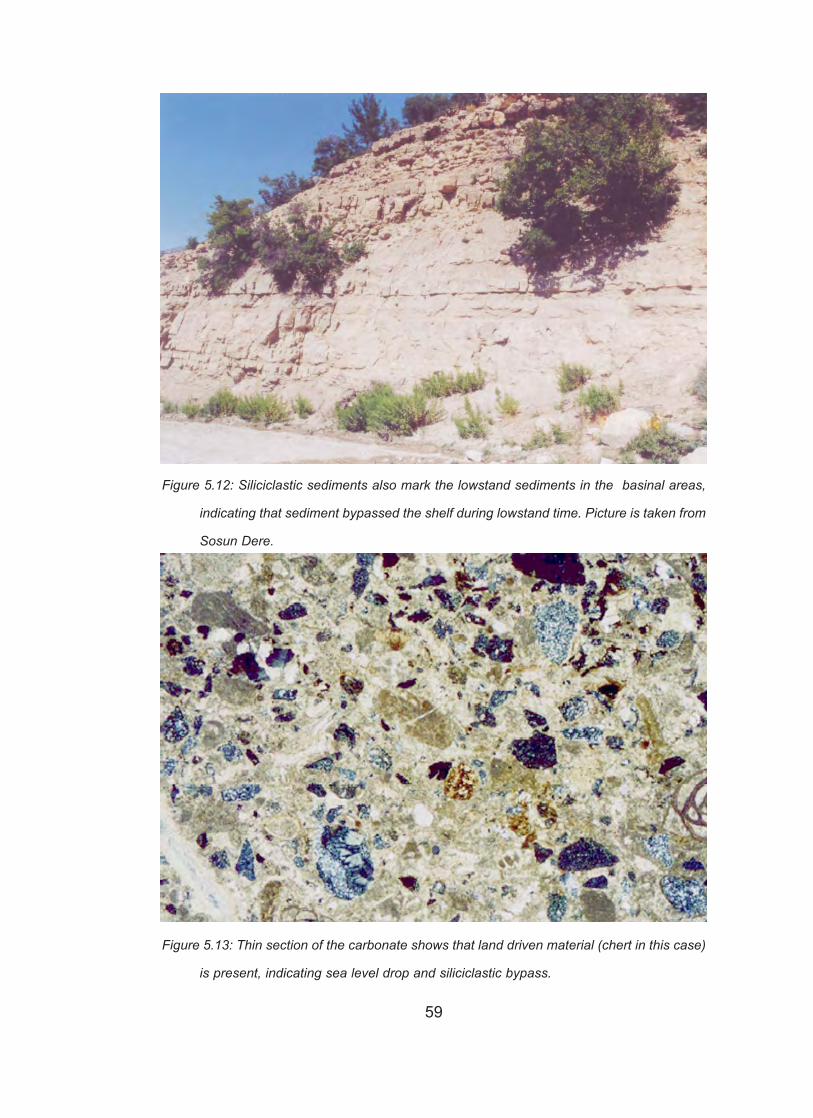
59
Figure 5.12: Siliciclastic sediments also mark the lowstand sediments in the basinal areas,
indicating that sediment bypassed the shelf during lowstand time. Picture is taken from
Sosun Dere.
Figure 5.13: Thin section of the carbonate shows that land driven material (chert in this case)
is present, indicating sea level drop and siliciclastic bypass.
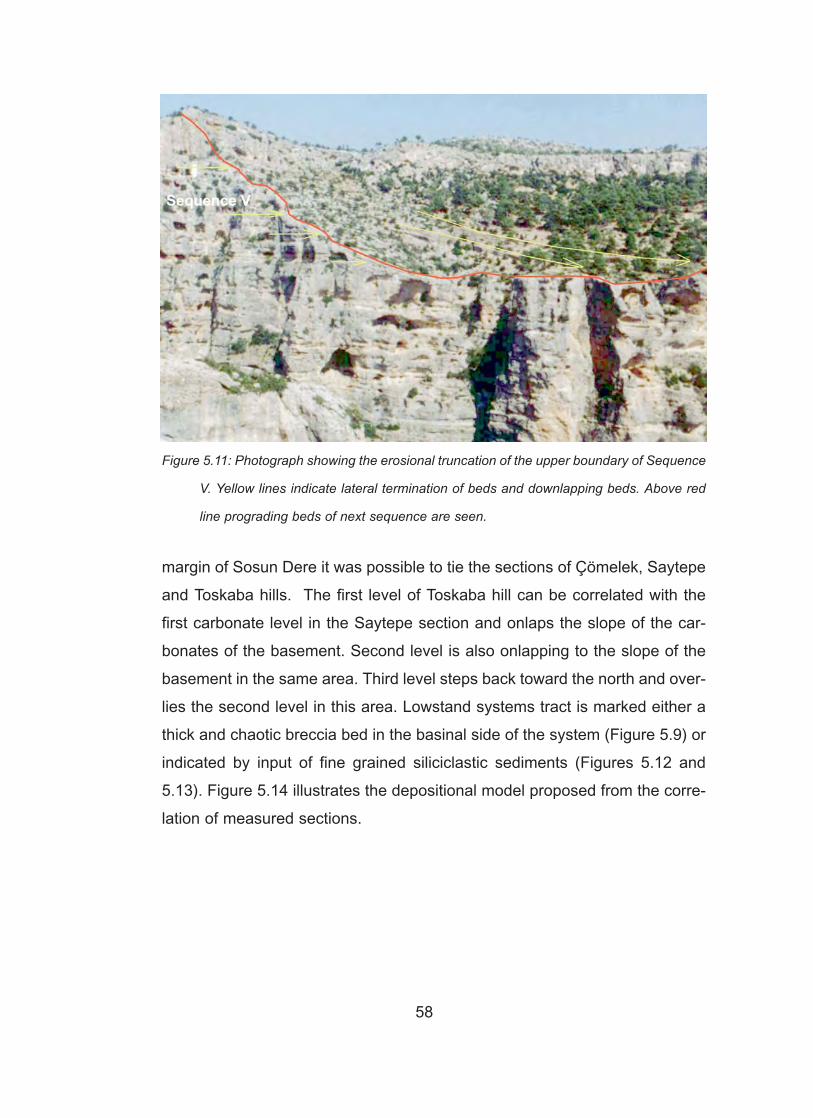
margin of Sosun Dere it was possible to tie the sections of Çömelek, Saytepe
and Toskaba hills. The first level of Toskaba hill can be correlated with the
first carbonate level in the Saytepe section and onlaps the slope of the car-
bonates of the basement. Second level is also onlapping to the slope of the
basement in the same area. Third level steps back toward the north and over-
lies the second level in this area. Lowstand systems tract is marked either a
thick and chaotic breccia bed in the basinal side of the system (Figure 5.9) or
indicated by input of fine grained siliciclastic sediments (Figures 5.12 and
5.13). Figure 5.14 illustrates the depositional model proposed from the corre-
lation of measured sections.
58
Figure 5.11: Photograph showing the erosional truncation of the upper boundary of Sequence
V. Yellow lines indicate lateral termination of beds and downlapping beds. Above red
line prograding beds of next sequence are seen.
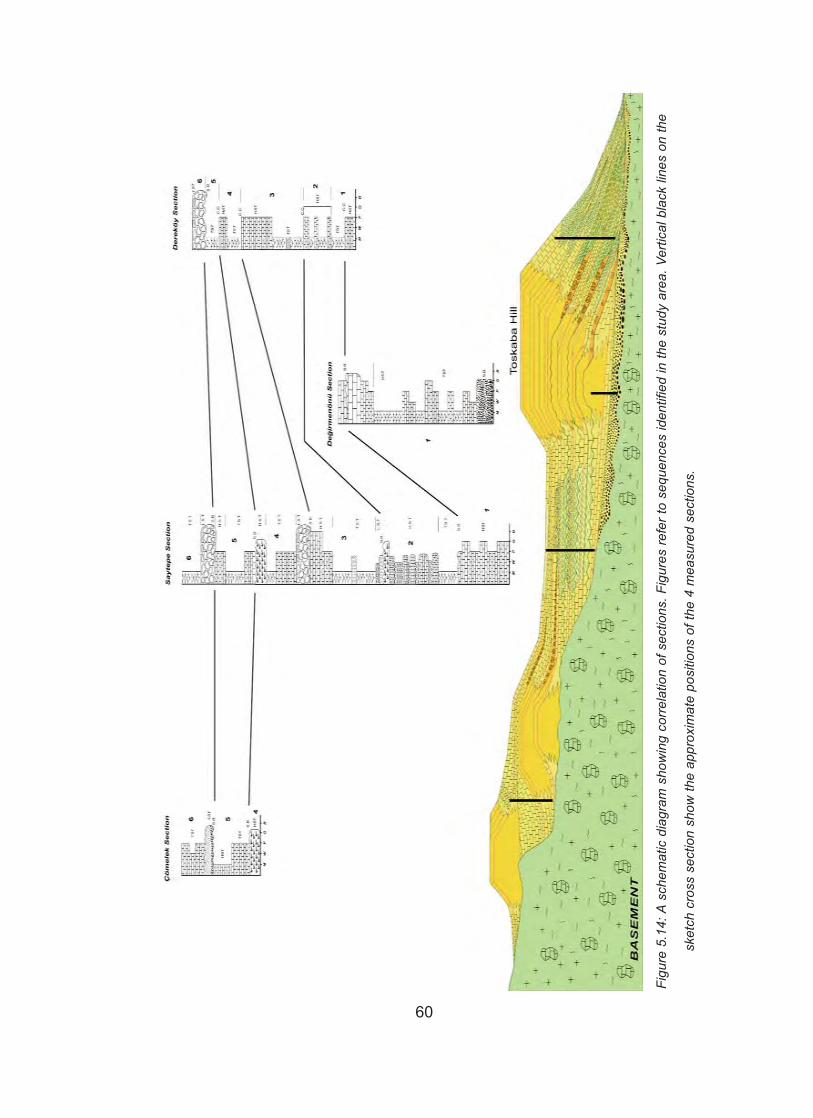
60
Figu
re 5
.14:
A s
chem
atic
dia
gram
sho
win
g co
rrela
tion
of s
ectio
ns. F
igur
es re
fer t
o se
quen
ces
iden
tifie
d in
the
stud
y ar
ea. V
ertic
al b
lack
line
s on
the
sket
ch c
ross
sec
tion
show
the
appr
oxim
ate
posi
tions
of t
he 4
mea
sure
d se
ctio
ns.
CHAPTER 6
DISCUSSION
6.1 Definition of the sequences in the study areaSequence I has been identified as a ramp sequence, mainly because of
the lack of distinct break in the slope and development of reefal margin
(Figure 6.1). This type of carbonate sequence may develop either in areas
where conditions are not suitable for reef building organism or in areas where
paleotopography is controlled by subsidence that is flexural and gradients are
slight over large areas (Burchette and Wright, 1992). I favor the second alter-
native for the development of ramp since reef building organism (coral and
algae) are abundantly present in the area. Progradation indicating a sea level
drop is not observed. This may be due to the low lying slope angle which is
the characteristic feature of the ramp. On ramp when sea level drops no
progradation is observed due to the absence of the reefal margin, but shift of
facies occur instead (Burchette and Wright, 1992). The stratal relationships of
the first sequence do not exhibit any downlap surface. Thus, it must be
deposited on a ramp setting, because the ramp geometry does not allow sig-
nificant downlapping beds as in platform carbonates (Handford and Loucks,
1993).
Sequence II advances landward and laps on the "basement" rocks
(Figure 5.5). Dominance of marls and absence of shallow water carbonates
along the basement in the east of Çömelek indicate either a steep slope or
increase in accomodation space. The existence of a steep topography seems
to be valid since onlapping relations of beds make such interpretation more
realistic. On Toskaba Hill the development of shallow water carbonates and
61
gradation into marls in a short distance (~1 km) also suggest that the area
around Toskaba Hill was shallow enough to allow shallow water carbonate
production. These data suggest that irregular topography controlled the car-
bonate facies types during sea level rise. When sea level began to drop, shal-
low water carbonates began deposition and advanced toward basin due to
loss of accomodation space in the east of Çömelek. Toskaba Hill area, how-
ever, must have subaerially exposed and leaching developed (Figure 3.4).
Sequence III is marked by a sea level rise as indicated by onlapping
relation of the strata of the new sequence and the basement (Figure 5.5). This
time, however, shallow water carbonate deposition dominates the marginal
areas. This has two implications. The first implication is that the area
remained shallow water areas to allow carbonate deposition (Sarg, 1988),
hence growth of coral and algae to form reefal facies. The second implication
is that carbonate deposition must have kept up with the sea level rise (Sarg,
1988). If carbonate production had not kept up with sea level rise, carbonate
deposition would have been drowned and more pelagic facies would have
been dominated. The similarity of facies between the area southeast of
Çömelek (Figure 5.5) and Toskaba Hill area (Figure 3.3) indicates that both
areas were dominated by shallow water carbonate deposition and bathyme-
try were similar. In Toskaba hill area carbonate deposition must have recov-
ered sea level rise. During early stage, features in the east of Çömelek village
indicate that following sea level drop have caused shallow water areas to sub-
aerially exposed and eroded. This erosion can be explained in two ways: First
an earthquake might have trigerred the collapse of the margin. In this case,
the erosion would have been much more extensive than the area limited to
the southeast of Çömelek. No erosional feature or surface is observed in the
Toskaba Hill. This rule out the possible cause of collapse. Second, sea level
drop and progradation of facies basinward may cause overloading shallow
water facies over marly facies and collapse occur. This type of collapse are
much common in carbonate depositional areas which controlled by sea level
fluctuations (Handford and Loucks, 1993). If we consider sea level was 5
62

metres above the uppermost bed (approximate depositional depth for the car-
bonates) and since each truncated bed is about 4-6 metres, sea level must
have dropped more than 30 metres. Of course this is an approximation of the
value but gives a figure to understand the scale. Since an erosional surface
is developed and the sea level dropped below the shelf margin, this sequence
boundary must represent type I sequence boundary.
Sequence IV seems to be a single carbonate sand bed (3-4 m. thick)
and follows and rests on the underlying erosional surface (Figure 5.5). The
thickness of the sequence compared with underlying sequence suggests that
accomodation was limited. During transgressive phase flooding of the ero-
sional surface must have created a shallow and high energy environment.
Therefore, shallow water sands have been deposited. Gently inclined beds
indicate original paleotopographic control of depositional surface. Otherwise
underlying and overlying beds would have been deformed and inclined. All
these relation indicate that erosional topography controlled the deposition.
Downlapping relations of the beds limited to the southern part of the same
margin indicate that sea level dropped and remained stationary for a certain
period of time. Constant rate of accomodation must have resulted in the
progradation of carbonate in a narrow zone. Another alternative explanation
is that an erosional event could have removed some sediments and amount
of erosion is much higher in the landward direction than in seaward direction.
The oyster bed in this sequence may represent lagoonal deposits that indi-
cated migration or shift of facies basinward indicating a drop in sea level. This
relation also indicates that sea level dropped below shelf edge and type I
unconformity surface developed.
Sequence V advanced further landward than Sequence IV. This is indi-
cated by the onlapping beds of sequence V on both sequence IV and the
basement (Figure 5.5 and Figure 6.1). This relation indicates that during
transgressive phase much accomodation was created and carbonate produc-
tion kept up with sea level rise.
Absence of progradation in the upper part of the sequence can be
63
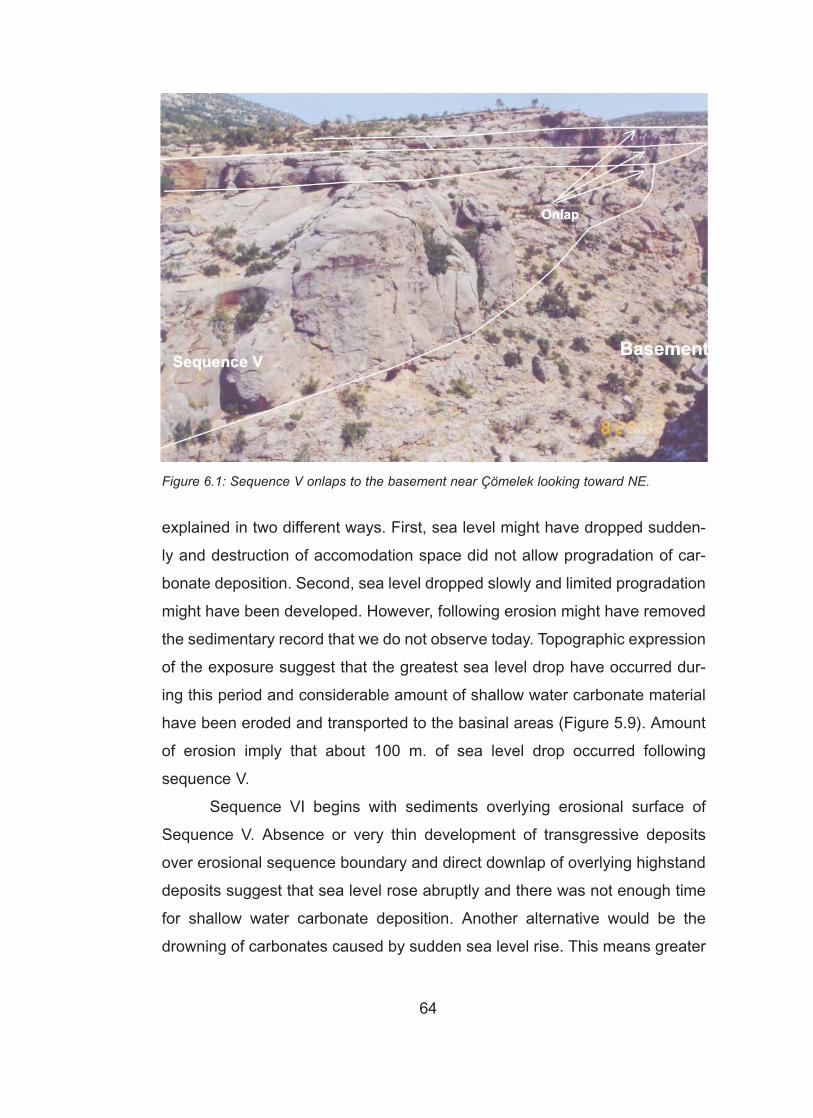
explained in two different ways. First, sea level might have dropped sudden-
ly and destruction of accomodation space did not allow progradation of car-
bonate deposition. Second, sea level dropped slowly and limited progradation
might have been developed. However, following erosion might have removed
the sedimentary record that we do not observe today. Topographic expression
of the exposure suggest that the greatest sea level drop have occurred dur-
ing this period and considerable amount of shallow water carbonate material
have been eroded and transported to the basinal areas (Figure 5.9). Amount
of erosion imply that about 100 m. of sea level drop occurred following
sequence V.
Sequence VI begins with sediments overlying erosional surface of
Sequence V. Absence or very thin development of transgressive deposits
over erosional sequence boundary and direct downlap of overlying highstand
deposits suggest that sea level rose abruptly and there was not enough time
for shallow water carbonate deposition. Another alternative would be the
drowning of carbonates caused by sudden sea level rise. This means greater
64
Figure 6.1: Sequence V onlaps to the basement near Çömelek looking toward NE.
accomodation space is created during the early phase of sequence VI.
Following highstand created limited highstand deposits in these marginal
areas. These highstand deposits are developed on the irregular topography
of previous sequence.
6.2 Sea level oscillationsFrom the surface expression and the relations of the bedding within the
sequences indicate that a number of sequences were developed (Figure 6.2).
The stratigraphic significance of relative sea level change is that many are
tied to eustatic events and so are predictable within a basin of deposition
(Kendal and Schlager, 1981).
Most accurate measure of changes in sea level is the type of sediments,
geometry and the diagenesis of the carbonate shelves and platforms. This is
because carbonates frequently occur at or very near sea level and are usual-
ly less compacted than siliciclastics. Falls are accompanied by platform wide
fresh water diagenesis. During relative sea level rises marine diagenesis is
common in the subtidal portions of the shoaling upward carbonates, and fresh
water diagenesis and dolomitization and sulfate deposition is common in the
intertidal and supratidal portions (Kendala and Schlager, 1981).
Different thickness of deposits indicate that relative sea level falls and
rises occurred at different magnitudes during Miocene. The existence of bar-
rier reefs show that their deposition occurred on a platform type setting. In
sequence stratigraphic concept lowstand is the time interval when vast
amounts of siliciclastic material enter the depositional system. However, in the
study area even in lowstand facies no major siliciclastic input is observed. The
existence of minor siliciclastic input must be related to a sudden influx, which
is related to small scale seasonal changes. The major fluvial system must be
behind a barrier (a hill, a topographic high etc.) which prevented it from enter-
ing the Mediteranean Sea at this location.
65
6.3 Evolution of the sequences in the study areaDifferent models can be proposed to explain the evolution of
sequences. First, carbonate depositional environment in the study area
began as a ramp and then transformed to a barrier reef. Second, barrier reef
existed from the beginning of deposition and it migrated landward with con-
tinuous transgression. The laterally discontinuous reefs of Sequence I make
the first model more realistic. The discontinuity of reefs and their random dis-
tribution indicate that they were deposited as patch reefs. With continuous
transgression some of these patch reefs have been drawn, but some other
kept up with the sea level rise and converted into pinnacle reefs. The forma-
tion of barrier reef began with the deposition of Sequence II. The deposition
occurred on marginal highs. Figure 6.2 is a schematic illustration showing
evolution of sequences discussed in this study.
6.4 Recognition of abrasion surfaces in sequencesDiagenetic features identified within the study area are closely linked to
the sequence boundaries. Red colored clay, leaching porosity and dolomiti-
zation are related to subaerial exposure. However, questions remain regard-
ing whether carbonate platforms generally are exposed to subaerial condi-
tions sufficiently long to develop karst topography prior to sea level. The
amount of fall might be an important control together with climate, because it
controls the development of fresh water input.
Biostratigraphic control has an important role in sequence stratigraphy.
Unexpected low sample quality affected the control on sequence differentia-
tion. Nevertheless, the sequences differentiated in the study area must be
third order sequences, since they all occurred during Miocene.
66
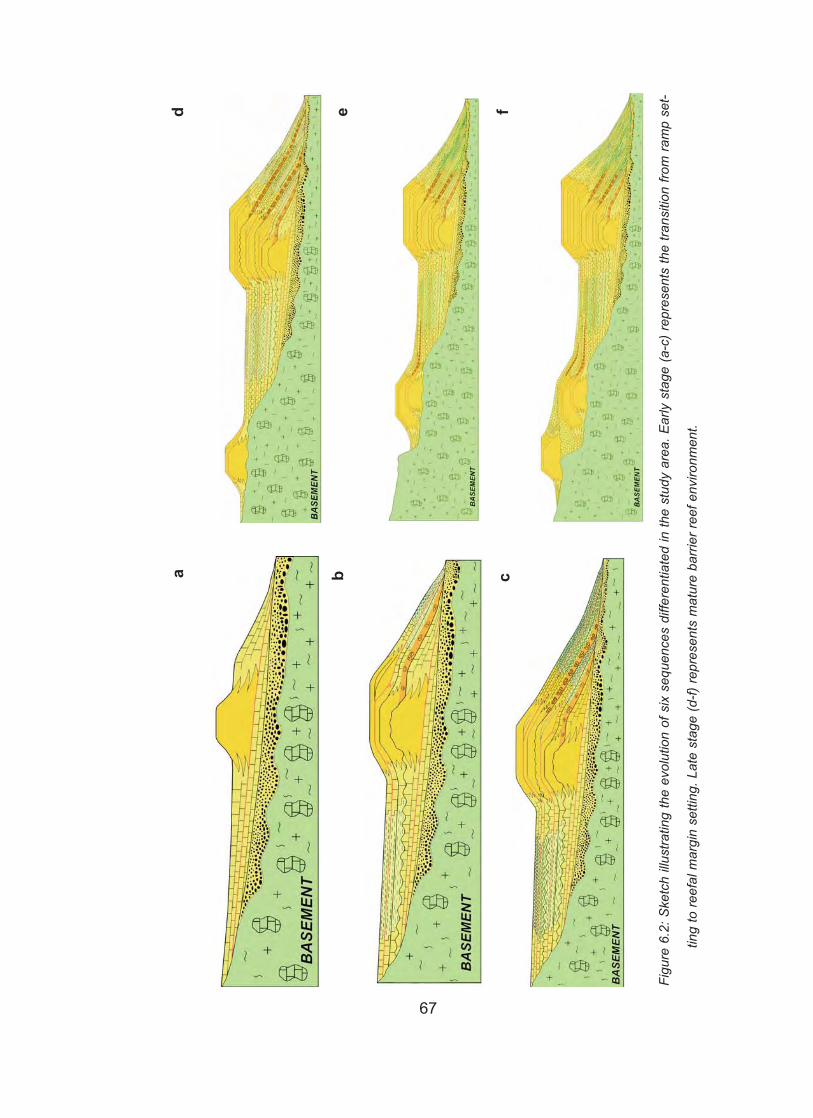
67
Figu
re 6
.2: S
ketc
h illu
stra
ting
the
evol
utio
n of
six
seq
uenc
es d
iffer
entia
ted
in th
e st
udy
area
. Ear
ly s
tage
(a-c
) rep
rese
nts
the
trans
ition
from
ram
p se
t-
ting
to re
efal
mar
gin
setti
ng. L
ate
stag
e (d
-f) re
pres
ents
mat
ure
barri
er re
ef e
nviro
nmen
t.
d
cba
fe
CHAPTER 7
CONCLUSION
7.1 Stratal RelationshipsClean vertical outcrops exposed along a river valley (Sosun Dere)
almost perpendicular to the general trend of reef-platform orientation in the
study area allowed observation and study of features related to the carbonate
depositional system. By identifying different facies types (reefs, forereef and
platform), Mut Formation was divided into sequences, bounded by unconfor-
mity surfaces in the marginal areas, while conformable in the basinal areas
where lithology changes laterally from limestone to marl. Onlapping relations,
offlapping surfaces and truncation of carbonates along the margin of a car-
bonate platform suggest that sea level changes have played an important role
in the development of the stratal packages. These packages have been orga-
nized into six sequences, mainly the result of change in sea level.
Progradation/Aggradation ratio is different in each sequence due to the
frequency of sea level falls or rises. The stratal relationships in the study area
showed that the models proposed for siliciclastic depositional environments
are not always valid for carbonate depositonal environments. Especially if the
transgression is not long enough to form onlapping muddy facies the
Transgressive Systems Tract deposits can occur as a thin bed which can be
interpreted as the early highstand strata (as sequence IV, shown in Figure
5.5)
It is observed that Mut formation, which has been interpreted as a sin-
gle carbonate body, includes important clues about the evolution of the basin.
The stratal relationships of sequences in the study area show that carbonate
68
deposition began on a ramp setting with patch reefs. Then the patch reef at
Toskaba Hill transformed to a pinnacle reef. Later in the development of the
basin, when the sea reached a higher level,a laterally continuous reefal mar-
gin developed.
7.2 Facies associationsIn Mut Basin the paleotopography controlled the facies distribution and
stratal relationships in several ways: First, reefal carbonate deposition is con-
trolled by topographic highs, while the depressions in the landward side
formed the lagoon of this carbonate environment. Second, the highs prevent-
ed siliciclastic material directly empty into the basin, so carbonate deposition
was able to develop along the margin. Third, local highs controlled the depo-
sition of local patch of pinnacle reefs. Fourth, since an irregular topography
existed before the transgression, onlapping relations were developed as the
basin has been filled. Fifth, irregular topography reflects any changes of sea
level more than basinal areas as it controlls the deposition of the carbonates
which is very sensitive to change in depth. Finally paleotopography controls
the depth of the depositional environment which in turn controls the type of
carbonate facies developed.
In the study area, parasequence set scale facies associations exhibit
shallowing upward character. Such cycles can be best observed on shelf
rather than slope and basin. This is related to the location of carbonate depo-
sition. The shallowing upward cycles can also be differentiated in basinal or
slope setting. In these deep marine (low energy) environments fauna content
is a useful tool to determine such cycles. In cycles where homogenous facies
are seen, increasing or decreasing fauna content is used as a criteria to
define shallowing upward sequences. It is also observed that each systems
tracts exhibits different facies associations. Thickness and facies change
does not stay same. This might be related with internal and external factors
controlling carbonate deposition, such as water depth, basin subsidence etc.
Each shallow water facies of Highstand Systems Tract are overlain by
69

open marine marl indicating that surface of exposure is flooded suddenly, so
that no shallow marine facies were developed. Dominance of marl and shale
in the basinal areas and some siliciclastic material observed in the marl sup-
port the idea that a siliciclastic source existed somewhere around the basin
and a barrier protected the basin from siliciclastic input.
7.3 Diagenetic ImprintThe diagenetic change showed that it is possible to use diagenetic tex-
ture to define sequence boundaries. Especially, phreatic diagenetic zone can
be used to interpret sea level oscillations. Fresh water diagenesis, dolomiti-
zation and some karst development took place when sea level dropped below
shelf edge. The degree of leaching and karst surfaces are related to the
degree of sea level fall and/or duration of lowstand time.
70
REFERENCES
Akarsu, İ., 1960, Mut Bölgesinin Jeolojisi. Maden Tetkik Arama Enstitüsü
Dergisi, No. 54, p. 36-45.
Atabey, E., Atabey, N., Hakyemez, A., İslamoğlu, Y., Sözeri, Ş., Özçelik, N.,
Saraç, G.,Ünay, E. and Babayiit, S., 2000, Mut-Karaman arası miyosen
havzasının litosratigrafisi ve sedimantolojisi (Orta Toroslar), Maden
Tetkik ve Arama Dergisi, No: 122, 72 p.
Bassant, P., 1999, the high resolution stratigraphic architecture and evolution
of the Burdigalian carbonate-siliciclastic sedimentary systems of the Mut
Basin, Turkey, Ph. D. Thesis, Institut de Geologie et Paleontologie de
l'Universite de Fribourg (Suisse), 277 p.
Bebout, D., Davies, G., Moore, C. H., Scholle, P. S. and Wardlaw, N. C., 1979,
Geology of Carbonate Porosity, AAPG Education Course Note Series
#11, 250 p.
Biju-Duval, B., Dercourt, J., and Le Pichon, X., 1977, From the Tethys ocean
to the Mediterranean seas ; a plate tectonic model of the western Alpine
system : International symposium structure and history of the
Mediterranean Basins, Split 1976 ; In Editions Technip, Paris, 1977, p.
142-164.
Bizon, G., Biju-Duval, B., Letouzey, J., Monod, O., Poisson, A., Özer, B. and
Öztümer, E. 1974, Nouvelles précisions stratigraphiques concernant les
bassins tertiaires du sud de la Turquie (Antalya, Mut, Adana). Revue de
l'Institut Français du Pétrole, 29: p. 305-325.
Blumenthal, M., 1956, Karaman-Konya havzası güneybatısında Toros kenar
silsileleri ve şist-radyolarit formasyonunun stratigrafi meselesi, Maden
Tetkik Arama Enstitüsü Dergisi, No. 40
71
Boggs, S. Jr., 1995, Principles of Sedimentology and Stratigraphy, Prentice-
Hall Inc., New Jersey, 774 p.
Bricker, O. F., 1971, Carbonate cements: John Hopkins Press, Baltimore,
Md., 376 p.
Burchette, T. P. and Wright, V. P., 1992, Carbonate ramp depositional sys-
tems. In: B. W. Sellwood (ed.) Ramps and reefs. Sedimentay Geology,
79: 3-57.
Choquette, P.W. and Pray, L. C., 1970, Geologic nomenclature and classifi-
cation of porosity in sedimentary carbonates, American Association of
Petroleum Geologists Bulletin, v. 54, p. 207-250.
Demir, N. E., 1997, Mut doğu yöresi Miyosen yaştaki kayaçların stratigrafisi,
Yüksek Mühendislik Tezi, Hacettepe Üniversitesi, 92 p.
Demirtaşlı, E., Turhan, N., Bilgin, A.Z. and Selim, M, 1983, Geology of te
Bolkar mountains, Geology of the Taurus Belt proceedings (Eds. Tekeli,
O. and Göncüoğlu, M.C.), Ankara, p. 125-141
Dercourt, J., Ricou, L.P., Kazmin, V.G., Le Pichon, X., Knipper, A.L.,
Grandjacquet, C., Sbortshhikov, I.M., Geyssant, J., Lepvrier, C.,
Perchersky, D.H., Boulin, J., Sibuet, J.C., Savostin, L.A., Sorokhtin, O.,
Westphal, M., Bazhrnov, M.L., Lauer, J.P. and Biju-Duval, B., 1986,
Geological evolution of the Tethys belt from the Atlantic to the Pamirs
since the Lias, Tectonophysics, v. 123, p. 241-315.
Dewey J. F., Pitman, W. C., Ryan, W., and Bonnin B. F. Jr., 1973, Plate tec-
tonics and the evolution of Alpine system. Bulletin of the Geological
Society of America, 84, p. 3137-3180.
Dewey, J.F., Helman, M.L., Turco, E., Hutton, D.H.W. and Knott, S.D., 1989,
Kinematics of the Western Mediterranean, (Eds. Coward, M.P., Dietrich,
D. and Park., R.D.), Alpine Tectonics, Blackwell Science
Publications,London, Geological Society of London Special Publication
45, p. 265-283.
Emery, D. and Myers, K., 1996, Sequence Stratigraphy, Blackwell Science
Ltd., Oxford, 297 p.
72
Erünal-Erentöz, L., 1958, Mollusques du Neogene des bassing de Karaman,
Adana et Hatay (Turquie), MTA Bulletin, Serie C, No:4, 232 p.
Esteban, M., 1996. An overview of Miocene reef from Mediterranean areas:
general trends and facies models. In: Models for carbonate stratigraphy
from Miocene reef complexes of mediterranean regions (Eds E.K.
Franseen, M. Esteban, W.C. Ward and J.M. Rouchy), SEPM Concept in
sedimentology and paleontology, SEPM (Society for Sedimentary
Geology), Tulsa, Ok., v. 5, pp. 5-53.
Esteban, M. and Klappa, C. F., 1983, Subaerial Exposure Environment; in:
Carbonate Depositional Environments (eds. P. A. Scholle, D. G. Bebout,
C. H. Moore), AAPG Memoir 33, Oklahoma, p. 2-54.
Fischer, W.L. and McGowan, J.H., 1967, Depositional systems in the Wilcox
group of Texas and their relationship to occurrence of oil and gas: Gulf
coast association of geological societies, Transactions, v. 17, p. 213-
248.
Gedik, A., Birgili, Ş., Yılmaz, H. and Yoldaş, R., 1979, Mut-Ermenek-Silifke
yöresinin jeolojisi ve petrol olanakları, Türkiye Jeoloji Kurumu Bülteni, v.
22, p. 7-26.
Gökçen, N., 1984, Neomonoceratina helvetica Superzone and
Carinocythereis Datumplane in Neogene sequences of Turkey, Newsl.
Statigr, Berlin-Stuttgart, v. 13 (2), p. 94-103.
Gökten, E., 1976, Silifke yöresinin temel kaya birimleri ve Miyosen
Stratigrafisi, Türkiye Jeoloji Kurumu Bülteni, 19, 2, s. 117-126.
Görür, N., Sakınç, M., Barka, A., Akkök, R. and Ersoy, S., 1995, Miocene to
Pliocene paleogeographic evolution of Turkey and its surroundings,
Journal of Human Evolution, v. 28, p. 309-324.
Handford, C.R. and Loucks, R.G., 1993, Carbonate depositional sequences
and systems tracts - Responses of carbonate platforms to relative sea
level changes : in R.G. Loucks and J.F. Sarg (eds.) Carbonate
Sequence Stratigraphy, Recent Developments and applications, AAPG
Memoir 57, p. 3-41.
73
James, N. P. and Choquette, P. W., 1990, Limestones - introduction : In I. A.
McIlreath and D. W. Morrow (eds.) Diagenesis, Geoscience Canada,
Reprint Series 4, 13-34.
Jonsons, X., 2001, Architecture and Seismic Expression of Miocene
Carbonate Barrier-Lagoon systems: Ermenek platform, Turkey and
Zhujiang platform, South China Sea, Ph.D. Thesis, University of Miami,
187 p.
Kendall, G. St. G. and Schlager , W., 1981, Carbonates and relative changes
in sea level. In: M. B. Cita and W. B. F. Ryan (eds.) carbonate platforms
of the passive-type continental margins, present and past. Marine
Geology, 44, 181-212.
Kelling, G., Gokcen, N.S. and Safak, U. (1995a), Factors influencing genesis
and evolution Neogene Basins, southern Turkey (abstract), In: Second
International Symposium on the Geology of the Eastern Mediterranean
Region, 1995, Program and Abstracts, Jerusalem, Israel.
Kelling, G., Safak, and Gökçen, N.S., (1995b), Mid Cenozoic evolution of the
Mut Basin, South Turkey, and its regional significance (abstract), In:
International Earth Sciences Colloquium on the Agean Region, 1995,
Program and Abstracts, İzmir, Turkey
Ketzer, J.M.M., 2002, Diagenesis and Sequence Stratigraphy,
Comprehensive Summaries of Uppsala. Dissertations from the Faculty
of Science and technology, no. 762, University of Uppsala, Uppsala, 30
p.
Koçyiğit, A., 1976, Karaman-Ermenek (Konya) bölgesinde ofiyolitli melanj ve
diğer oluşuklar, Bulletin of Turkish Geological Society, v. 2, no. 19, p.
103-116.
Koçyiğit, A. 1978, Sarıkaya-Üçbaş (Karaman) yöresinin jeolojisi, Bulletin of
Turkish Geological Society, No. 21, v. 1, p. 77-86.
Lemoine, M., 1978, The peri-Tyrrhenian system : Corso-sardinian Block,
Apeninnes and Padana Basin, Calabro-Sicilian Arc, in Lemoine, M., ed.,
Geological Atlas of Alpine Europe and Adjoining Areas : Amsterdam,
74
elseiver Science Publications Company, p. 227-311.
Miall, A. D., 1991, Stratigraphic sequences and their chronostratigraphic cor-
relation, Journal of Sedimentary Petrology, v. 61, p. 497-505
Mitchum,R, M., Vail, P. R. Jr. and Thompson, S.; 1977; Seismic Stratigraphy
and Global Changes of Sea Level, Part 2: The Depositional Sequence
as a Basic Unit for Stratigraphic Analysis, in Seismic Stratigraphy - appli-
cations to hydrocarbon exploration (ed. By C. E. Payton), AAPG Memoir
26; Michigan, 53-62.
Moss, S. J. and Tucker, M. E., 1996, Dolomitization associated with trans-
gressive surfaces - a mid Cretaceous example, Sedimentary Geology, v.
107, p. 11-20.
Özer, B., Biju-Duval, B., Courrier, P., and Letouzey, J., 1974, Antalya-Mut-
Adana havzasının jeolojisi, Proceedings of Second Petroleum Congress
of Turkey, Turkish Association of Petroleum Geologists, Ankara. p. 57-
84.
Pampal, S., 1986, Çimenkuyu - Güçler (Karaman) yöresinin jeolojisi: Gazi
Üniversitesi Mühendislik-Mimarlık Fakültesi Dergisi, Ankara.
Rehault, J.P., Boillot, G. and Mauffret, A., 1984, The western Mediterranean
Basin geological evolution, Marine Geology, v. 55, p. 447-478
Robertson, A.H.F., Dixon, J.E., Brown, S., Collins, S., Pickett, E., Sharp, I. and
Ustaömer, T., 1996, Alternative tectonic models for the Late Paleozoic-
Early Tertiary development of Tethys in the eastern Mediterranean
region, in: Paleomagnetism and tectonics of the Mediterranean region
(Ed. By A. Morris and D.H. Tarling) Geological Society, London, Special
Publications, 105, p. 239-263
Sarg, J. F., 1988, Carbonate Sequence Stratigraphy. In: C. K. Wilgus, B. S.
Hastings, C. G. St. C Kendal, H. W. Posamentier, C. A. Ross and J. C.
Van Wagoner (eds.) Sea Level Changes: An Integrated Approach.
SEPM Special Publication 42,155-181.
Sezer, S., 1970, The Miocene stratigraphy of Mut Region, southern Turkey
(Doktora Tezi), Birkbeck College London University.
75

Şafak, Ü., 1997, Karaman Yöresi Üst Miyosen - Pliyosen İstifinin Ostrakod
Faunası ve Ortamsal Yorumu, MTA Dergisi No: 119, Ankara, p. 89-102.
Şengör, A.M.C., Yılmaz, Y.; 1981, Tethyan evolution of Turkey: A plate tec-
tonic approach, Tectonophysics, v. 75, p. 181-241.
Şengör, A.M.C., Görür, N. and Şaroğlu, F., 1985, Strike-slip faulting and basin
related formation in zones of tectonic escape, SEPM, Special
Publications, v. 37, p. 227-440.
Tanar, U., 1989, Mut havzası tersiyer istifinin stratigrafik ve mikropaleontolojik
(Ostrakod ve Foraminifer) incelemesi; Ph.D. Thesis, Çukurova
University, Adana, 199 p.
Tanar, U. and Gökçen, N., 1990, Mut-Ermenek Tersiyer istifinin stratigrafisi ve
mikropaleontolojisi, M.T.A. Dergisi, v. 110, p. 175-180.
Vail, P. R., Audemard, F., Bowman, S. A., Eisner, P. N. and Perez-Cruz, C.,
1993, The stratigraphic signature of tectonics, eustacy and sedimentol-
ogy-an overview. In: Einsele et al. (eds), cycles and events in stratigra-
phy, Springer-Verlag, Berlin-Heidelberg, 617-659.
Van Wagoner, J.C., Posamentier, H.W., Mitchum, R.M., Vail, P.R., Sarg, J.F.,
Loutit, T.S. and Hardenbol, J.; 1988; An overview of the fundamentals of
sequence stratigraphy and key definitions; in Sea-Level changes: An
Integrated Approach (ed. By C.K. Wilgus, B.S. Hastings, C.G. St. C.
Kendall, H.W. Posamentier, C.A. Ross & J.C. Van Wagoner); Society of
Economic Paleontologists and Mineralogists Special Publication No: 42,
Tulsa, p. 39-45.
Wilson, J. L., 1975, Carbonate sequences in Geologic History:New York,
Springer-Verlag, 471 p.
Yetiş, C., Kelling, G., Gökçen, S.L. and Baroz, F., (1995), A revised strati-
graphic framework for Late Cenozoic sequences in the northeastern
Mediterranean region., Geol Rundsch, v. 84, 794-812.
Ziegler, P.A., 1988, Evolution of the Arctic-North Atlantic and the Western
Tethys, AAPG Memoir 43, 198 p.
76
APPENDIX
GLOSSARY OF TERMS
Aggradational geometry: occur when the rate of deposition is equal to
rate of accomodation (Van Wagoner et al., 1988).
Catch Up deposition : Catch up carbonate system display a relatively
slow rate of accumulation . This response may result from the maintenance
of water conditions throughout most of the highstand that are not conducive
to rapid carbonate production. A catch up carbonate is characterized at the
platform margins by extensive, early submarine cementation, and it may con-
tain abundant mud rich parasequences.
Downlap : A base discordant relaton in which initially inclined strata ter-
minate downdip against an initially horizontal or inclined surface (Mitchum,
1977).
Downlap Surafce/Maximum Flooding Surface (mfs) : is a marine
flooding surface onto which the toes of prograding clinoforms in the overlying
highstand systems tract downlap. This surface marks the change from a ret-
rogradational to an aggradational parasequence set and is the surface of
maximum flooding (Van Wagoner et al., 1988).
Keep Up carbonate systems : Keep up carbonate systems display a
relatively rapid rate of accumulation and is able to keep up with relative rises
in sea level. A keep up carbonate is characterized at the platform margin by
relatively small amounts of early submarine cement and is generally domi-
nated by grain rich, mud poor parasequences. The keep up carbonate sys-
tems display a mounded/oblique geometry at the platform/bank margin and in
places on the platform.
77
Onlap : A base discordant relation in which initially horizontal strata ter-
minate progressively agaist an initially inclined surface, or in which initially
inclined strata terminate progressively updip against a surface of greater ini-
tial inclination (Mitchum, 1977)
Parasequence : is a relatively conformable succession of genetically
related beds or bedsets bounded by marine flooding surfaces and their cor-
relative surfaces (Van Wagoner, 1985).
Parasequence set : is a succession of genetically related parase-
quences which form a disitinctive stacking pattern that is bounded, in many
cases, by major flooding surfaces and their correlative surfaces (Van
Wagoner, 1985).
Patch Reef : Isolated more or less circular area of organic frame con-
structed buildups. In modern seas patch reefs are mainly on shelves and rise
into wave base and close to sea level (Wilson, 1975).
Pinnacle Reef : Conical or steep sided upward tapering mound or reef
(Wilson, 1975).
Progradational geometry: occur when the rate of deposition exceeds
the rate of accumulation (Van Wagoner et al.,1988).
Ramp : Huge carbonate bodies built away from positive areas and down
gentle regional paleoslopes. No striking break in slope exists, and facies pat-
tern are apt to be wide and irregular belts with the highest energy zone rela-
tively close to the shore (Wilson, 1975).
Retrogradational geometry: occur when the rate of accumulation
exceeds the rate of deposition (Van Wagoner et al., 1988).
Toplap : Termination of strata against an overlying surface mainly as a
result of nondeposition (sedimentary bypassing) with perhaps only minor ero-
sion. Each unit of strata laps out in a landward direction at the top of the unit,
but the succesive terminations lie progressively seaward (Mitchum, 1977).
Transgressive Surface : The top of the lowstand wedge, coincident
with the top of the lowstand systems tract, is a marine flooding surface called
the transgressive surface (Van Wagoner et al., 1988).
Type 1 sequence boundary : is characterized by subaerial exposure
78

and concurrent subaerial erosion associated with stream rejuvenation, a bas-
inward shift of facies, a downward shift in coastal onlap, and onlap of overly-
ing strata (Van Wagoner et al., 1988).
Type 2 sequence boundary: is marked by subaerial exposure and a
downward shift in coastal onlap landward of the depositional shoreline break
; however, it lacks both subaerial erosion associated with stream rejuvenation
and a basinward shift in facies.
79