sequential preference questions factors influencing ... · sequential preference questions ....
TRANSCRIPT

Sequential Preference Questions Factors Influencing Completion Rates Using An Online Panel
Jordan J. Louviere Professor, School of Marketing
Co-Director, Centre for the Study of Choice Faculty of Business
University of Technology, Sydney
Richard T. Carson Professor, Department of Economics University of California, San Diego
Leonie Burgess
Senior Research Fellow, Department of Mathematical Science Centre for the Study of Choice
Faculty of Science University of Technology, Sydney
Deborah Street
Professor, Department of Mathematical Sciences Co-Director, Centre for the Study of Choice
Faculty of Science University of Technology, Sydney
A. A. J. Marley
Adjunct Professor, Department of Psychology University of Victoria, British Columbia
Draft July 2011
*The authors gratefully acknowledge the funding provided by ARC Discovery Grant DP034343632. We also would like to thank Michael McGee and Steve Cook of Future and Simple Pty., Ltd, and Ben White of SurveyEngine Pty., Ltd. for their assistance in the design and implementation of the web-based experiments that underlie this research.
1
Sequential Preference Questions Factors Influencing Completion Rates Using An Online Panel
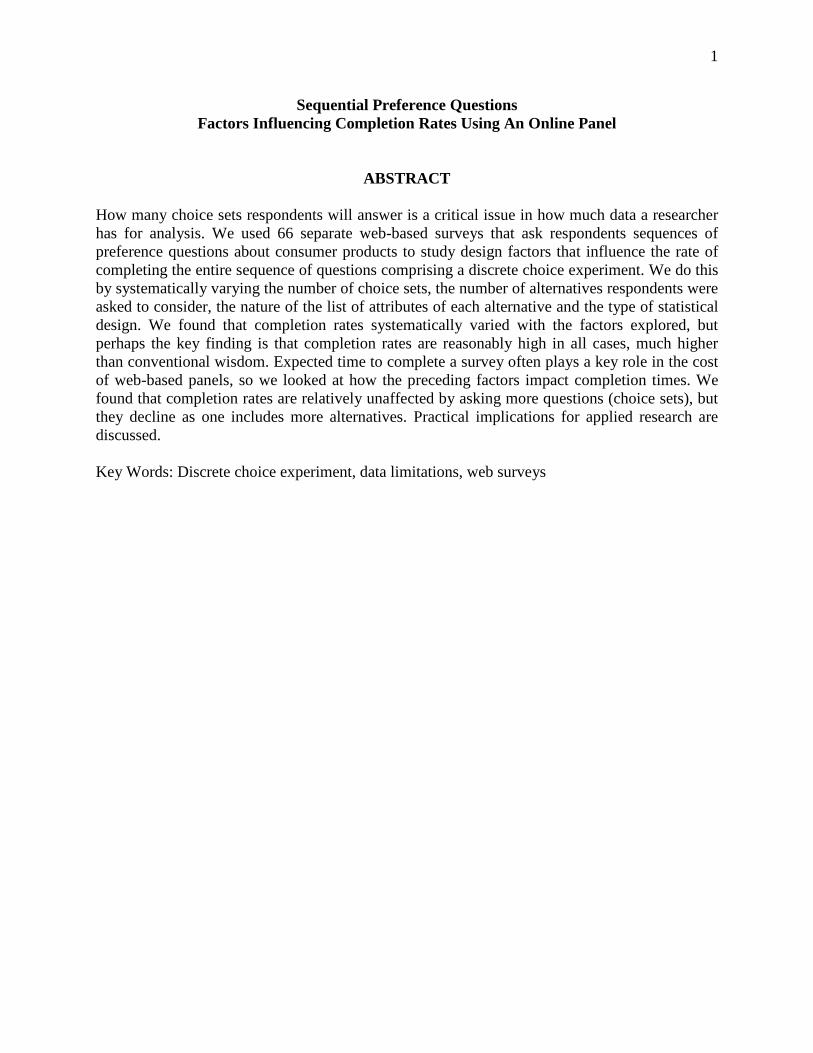
ABSTRACT How many choice sets respondents will answer is a critical issue in how much data a researcher has for analysis. We used 66 separate web-based surveys that ask respondents sequences of preference questions about consumer products to study design factors that influence the rate of completing the entire sequence of questions comprising a discrete choice experiment. We do this by systematically varying the number of choice sets, the number of alternatives respondents were asked to consider, the nature of the list of attributes of each alternative and the type of statistical design. We found that completion rates systematically varied with the factors explored, but perhaps the key finding is that completion rates are reasonably high in all cases, much higher than conventional wisdom. Expected time to complete a survey often plays a key role in the cost of web-based panels, so we looked at how the preceding factors impact completion times. We found that completion rates are relatively unaffected by asking more questions (choice sets), but they decline as one includes more alternatives. Practical implications for applied research are discussed. Key Words: Discrete choice experiment, data limitations, web surveys
2
1 Introduction
Discrete choice experiments (DCEs) involve sequences of preference questions in which
respondents choose from repeated sets of alternative choices. DCEs are widely used in marketing
and several other fields, such as environmental economics, health policy, and transportation
planning.1
We designed, implemented and analyzed 66 separate DCEs using samples from an opt-in
online web panel. Consequently, our results should be considered specific to this form of survey
administration. Opt-in web panels now are widely used in marketing and other fields due to the
high penetration of internet connections in many countries, the large size of many panels that
makes it possible to select the demographics of interest for a survey, reduced time needed to
Many published papers contain statements about “task complexity”, “cognitive
burden” and the like, and one hears strongly expressed opinions about “too many choice sets” at
major conferences. Thus, there are widespread beliefs and much “folk wisdom” that claims that
as the number of choice questions in DCEs or the number of alternatives per choice set and/or
their attributes increases, data quality rapidly deteriorates and more respondents fail to complete
the entire set of questions. Despite such widely held beliefs, there is surprisingly little available
research that actually bears on the claims. The purpose of this paper is to address this gap by
systematically examining the influence on DCE completion rates and completion times of four
key factors that are associated with task complexity and/or cognitive burden: 1) the number of
alternatives in each choice set, 2) the number of attributes that describe the alternatives, 3) the
number of distinct levels of each attribute, and 4) the efficiency of the underlying statistical
design that generates the alternatives and choice sets. These four factors determine the extent to
which a topic can be studied using data collected in a DCE.
1 Louviere, Hensher and Swait (2000) provide overviews of current practices in modeling sequences of choice questions with an emphasis on marketing and transportation applications. Hanley, Wright and Adamowicz (1998) focus on environmental applications while Viney, Lancsar and Louviere (2002) focus on health applications.
3
collect data, ability to show respondents visual material, and increasing cost and decreasing
response rates associated with other modes of survey administration. Online surveys are a good
way to ask a sequence of choice questions due to the ease with which different respondents can
be randomly assigned to different treatments in the form of different choice sets.
As far as we are aware, this is the first paper to look at completion rates and completion
times as they relate to changes in the features of sets of choice questions for web-based surveys.
An previous review by Carson et al. (1994) noted that the number of sequential choice questions
typically asked was in the range of 4 to 8, but they reported no empirical studies dealing with the
impact of numbers of attributes, numbers of choice options and/or numbers of choice sets
(scenarios) on completion rates or data quality. Since that review a few researchers have looked
at completion rates associated with sets of choice questions in mail and in-person surveys
(Brazell and Louviere, 1996; Johnson and Orme, 1996; Hensher, Stopher and Louviere, 2001;
Carlsson and Martinsson, 2008).2 A small but growing number of papers (e.g., Carlsson and
Martinsson, 2008; DeShazo and Fermo, 2002; Hensher, 2006; Swait and Adamowicz, 2001) also
look at how data quality is influenced by features of the set of choice questions that respondents
are asked by focusing on how estimates of preference parameters are influenced by these
features.3
2 Johnson and Orme (1996) were perhaps the first to provide evidence suggesting respondents would complete more choice sets than commonly expected by many researchers by summarizing several studies using computer-assisted in-person surveys in marketing. Brazell and Louviere (1996) reported a negative effect on completion rates using a drop-off mail survey due to the numbers of choice sets, but the negative effect occurred only beyond 32 choice sets. Hensher, Stopher and Louviere (2001) used a mail survey on air travel and reported an almost constant 30% response rate for several treatments ranging 6 to 32 choice sets, with a weak suggestion of item non-response in surveys with more choice sets. Carlsson and Martinsson (2006) used separate mail surveys to study issues related to reliability of electricity supplies and reported a 39% response rate for a version with 12 choice sets and 33% for a version with 24 choice sets. More generally, Bogen’s (1996) review of the literature suggests that the length of the questionnaire (especially beyond a few pages) seems to influences responses rates in mail surveys, but less than many researchers seem to think, as her evidence regarding length of telephone and in-person surveys was mixed.
Although we look at a simple measure of data quality towards the end of this paper,
our primary focus is at a more basic level, namely how do characteristics of sequences of choice
3 See Keller and Staelin (1987) for an early effort at looking at the issue of task complexity in the context of preference questions and data quality.
4
questions influence the number of respondents who drop out by not answering the full set of
questions?4 It may well be that asking someone to answer more choice questions induces various
response effects (desirable or undesirable), but the more basic question to such conclusions is if
participants will complete the task(s) that they are asked to do. If, in fact, they will answer a
relatively large number of choice questions, the range of models that can be effectively estimated
increases considerably.5
Our DCEs use equivalent random samples from a large opt-in internet panel. This makes
them fundamentally different from the two main traditional survey administration modes (in-
person and mail) long used to administer sequences of choice questions. For in-person surveys
(sometimes computer-assisted) the presence of the interviewer helps ensure respondents answer
all of the choice questions. In mail surveys potential respondents can observe the number of
choice questions; because such choice questions often appear one-two to a page, apparent survey
length increases rapidly with the number of these questions. In web-based surveys no interviewer
is present to help ensure completion, but respondents also cannot easily determine the actual
length of the survey at the outset. Payment for completing surveys in opt-in internet panels
provides an incentive to complete the survey that often is not associated with other forms of
survey administration. Additionally, membership in online panels may be associated with factors
that predispose members to answer surveys, but we are unaware of research on such issues.
Internet survey use is increasing for academic and commercial purposes (e.g., Couper,
2000; Dillman, 2000); currently there is substantial research on their specific properties (e.g.,
4 It can be argued that completing/not completing a set of choice scenarios is the critical factor due to the availability of fairly well-developed statistical techniques for modeling response behavior that allow for differences in the variability of response errors and various types of strategic and satisficing behavior as respondents proceed through the set of choice questions. 5 There is a clear tension between collecting a small amount of preference data from a large number of respondents or a large amount of preference data from a small number of respondents.
5
Smyth, et al., 2006), and their properties compared with more traditional modes of survey
administration (e.g., Kaplowitz, Hadlock and Levine, 2004; Fricker, et al., 2005; Chang and
Krosnick, 2009). The opt-in nature of internet panels like the one we use in this paper is likely to
impact completion rates because managers of good opt-in internet panels devote substantial
resources to recruiting large samples and collect substantial amounts of background data on
panel members. If selection bias is involved, it is likely to be associated with panel members
being more inclined to answer surveys. Forecasting from such panels involve several issues, such
as weighting (Taylor et al., 2001), that do not concern us in this paper as we randomly assign
respondents to statistically equivalent subsamples drawn from a larger sample chosen to be
representative of the general population to test our hypotheses.6
Our research focuses on what is commonly termed “the DCE approach” to eliciting
preference information (e.g., Louviere, Hensher and Swait, 2000), but other terms are used for
the same approach, such as “choice based-conjoint” and “choice modeling”. Several other
preference elicitation methods, such as sequences of paired comparisons or category rating tasks,
are sufficiently similar that our results should be broadly applicable to them.
The completion rates that are
the focus of our research are only one of several criteria that should be used when considering
the use of opt-in web panels.
2 Research Approach
We administered 66 separate DCEs to separate but statistically equivalent samples to which
potential respondents were randomly assigned. The 66 choice experiments vary by the number of
6 Strictly speaking, any claim of representativeness cannot extend beyond demographic variables used to construct the sample. There is active debate in the survey sampling community on the importance of selection bias in opt-in panels for particular purposes. This issue is routinely ignored in much applied work, and is beyond the scope of this paper because our results assume opt-in web panels are used. The completion rates we focus on is only one criterion that should be used in considering the use of opt-in web panels.

6
choice sets respondents received (16 or 32), the number of alternatives in each choice set (3, 4 or
5), the number of attributes used to describe each alternative (6, 8, 10 or 12), the number of
attribute levels (2 or 4) for some attributes, and the type of statistical design used to construct the
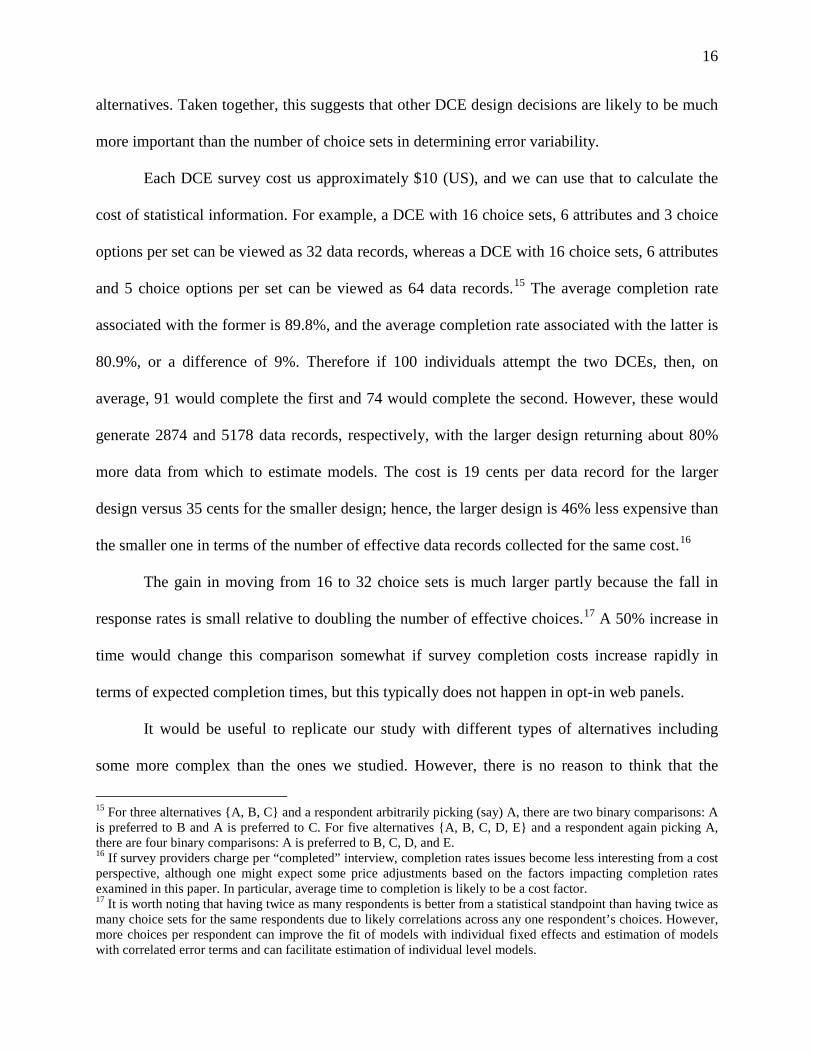
choice sets. Table 1 lists the features of the 33 experiments conducted for two product categories
(delivered pizzas and cross-country flights) for a total of 66 experiments. Hereafter we refer to
them as the study factors: product, number of choice sets, number of alternatives, number of
attributes, number of attribute levels, and type of statistical design. The first column indicates the
11 different conditions that categorize each experiment; the second column identified how each
condition is defined by the design. For example, the first design is a 23x43, indicating that there
are 3 attributes with 2 levels and 3 attributes with 4 levels. The third column contains the number
of attributes implied by the design, which repeats the information about the design. The fourth (3
alternatives), sixth (4 alternatives), and eighth (5 alternatives) columns list the number of choice
sets associated with different designs for a given number of alternatives.
Columns labeled “Design” indicate which of two experimental design approaches were
used. “SB” is a Street and Burgess (2007) design, and Kuhfeld is a Kuhfeld (2005) design
available as a SAS macro. Both are commonly used design approaches that require researchers to
make several assumptions, with statistical efficiency levels associated with the assumptions. We
conject that the most important difference between these two design approaches is the nature of
the alternatives respondents “see” in the choice sets. That is, the main difference in the SB and
Kuhfeld designs in terms of what respondents “see” is that each attribute level differs across all
alternatives in each choice set of an SB Design. The latter can be true for many, but not all,
Kuhfeld designed choice sets. If each choice set shows all the different attribute levels, it makes
it easier for respondents to choose alternatives based on the attributes/levels that matter most to
7
them; similarly, if all the levels of minor attributes are shown in each choice set, this also may
simplify choices. Whether and how attributes covary also may determine how well choice sets
approximate what respondents “see” in real markets and how interesting the choices are to them.
Kuhfeld alternatives generally should have more correlated attribute levels than SB designs.
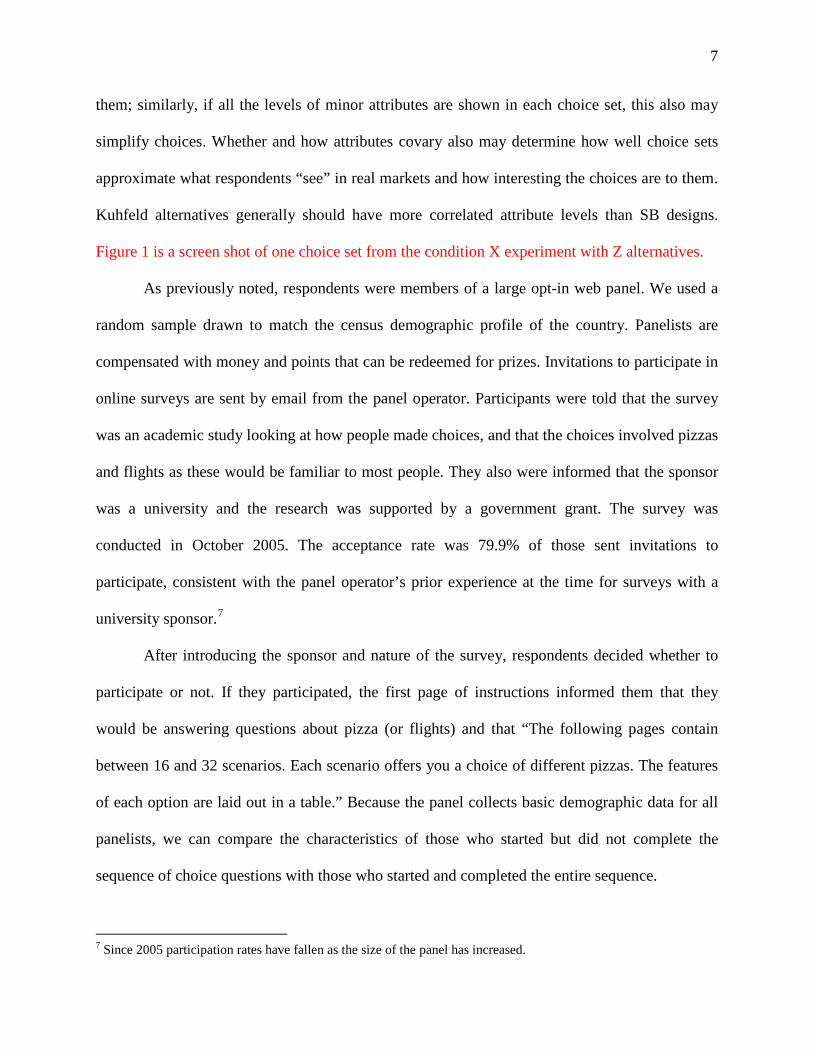
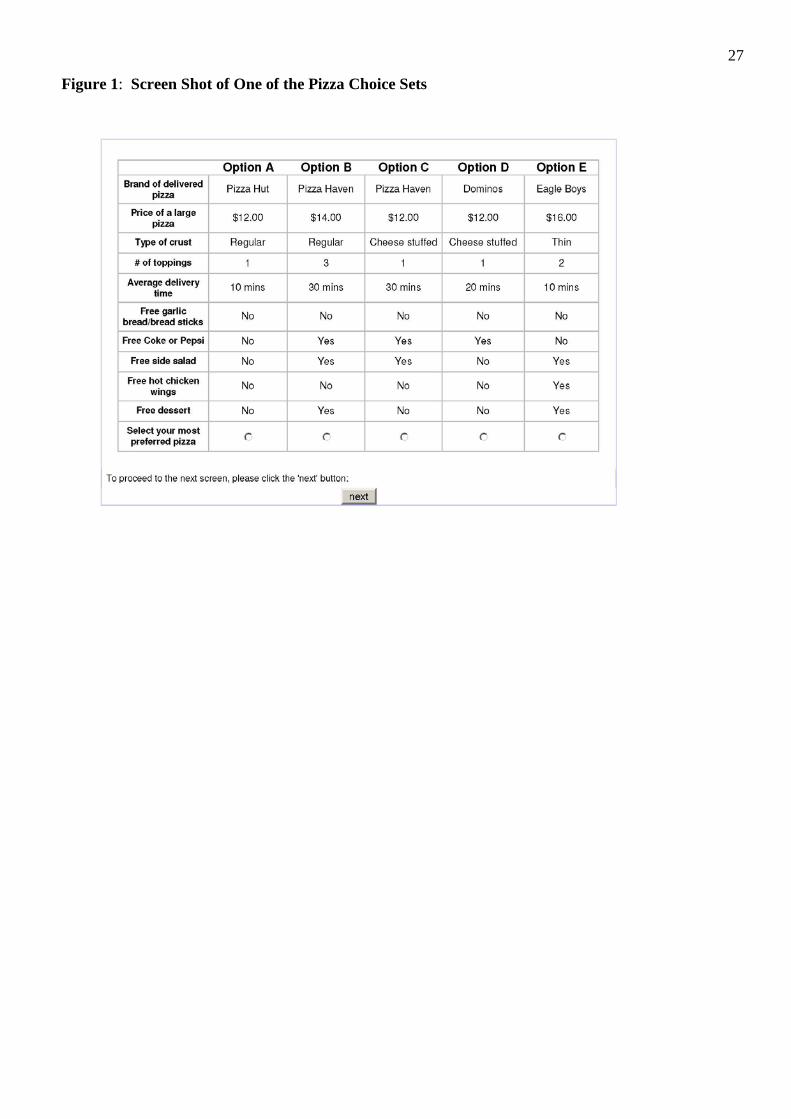
Figure 1 is a screen shot of one choice set from the condition X experiment with Z alternatives.
As previously noted, respondents were members of a large opt-in web panel. We used a
random sample drawn to match the census demographic profile of the country. Panelists are
compensated with money and points that can be redeemed for prizes. Invitations to participate in
online surveys are sent by email from the panel operator. Participants were told that the survey
was an academic study looking at how people made choices, and that the choices involved pizzas
and flights as these would be familiar to most people. They also were informed that the sponsor
was a university and the research was supported by a government grant. The survey was
conducted in October 2005. The acceptance rate was 79.9% of those sent invitations to
participate, consistent with the panel operator’s prior experience at the time for surveys with a
university sponsor.7
After introducing the sponsor and nature of the survey, respondents decided whether to
participate or not. If they participated, the first page of instructions informed them that they
would be answering questions about pizza (or flights) and that “The following pages contain
between 16 and 32 scenarios. Each scenario offers you a choice of different pizzas. The features
of each option are laid out in a table.” Because the panel collects basic demographic data for all
panelists, we can compare the characteristics of those who started but did not complete the
sequence of choice questions with those who started and completed the entire sequence.
7 Since 2005 participation rates have fallen as the size of the panel has increased.
8
Tables 2a and 2b list attributes and associated levels for each of the 11 conditions for
pizzas and flights, respectively. Three four-level attributes appeared in all conditions: a) chain
name, price and number of toppings for pizza, and b) carrier name, fare and total travel time
(cross-country flights) for flights. As Tables 2a and 2b indicate, the other attributes were varied
at two or four levels. In some conditions, some four-level attributes were varied over only two of
their levels and, when this occurred, the two extreme levels were used. Figure 1 shows a
screenshot of one pizza choice set featuring five alternatives.
Task size and complexity (see Table 1) varied from a) 16 choice sets described by six
attributes and three choice options per set (conditions 1, 2 and 9; with 3 choice options) to b) 32
choice sets described by 12 attributes and 5 choice options per set (conditions 7, 8 and 11; with 5
choice options). Remaining conditions represent intermediate levels of complexity. Conditions 1
to 8 used optimally efficient designs for conditional multinomial logit models constructed using
Street and Burgess (2007) deigns. Conditions 9, 10 and 11 represent designs constructed using
the SAS macros %MktEx, %MktLab and %ChoiceEff described in Kuhfeld (2005). Designs in
conditions 9, 10 and 11 differ in statistical efficiency, given the same assumptions, and the
differences are nested under the number of choice options.
3 Results
We present two types of results: 1) we analyze the influence of the study factors on completion
rates; and 2) we analyze the effects of the study factors on median completion times.8
Both types
of results are discussed in turn.
8 We also investigated how well demographic variables could predict completion rates using an unconditional logit model (results available from the authors on request). We examined a large set of demographic variables and found that the resulting model had low explanatory power (pseudo R-square of .02), and only a few parameters (married, no children, live in apartment/condo, and high income categories) were significant at the .10 level or better.
9
Completion Rates by Study Factors
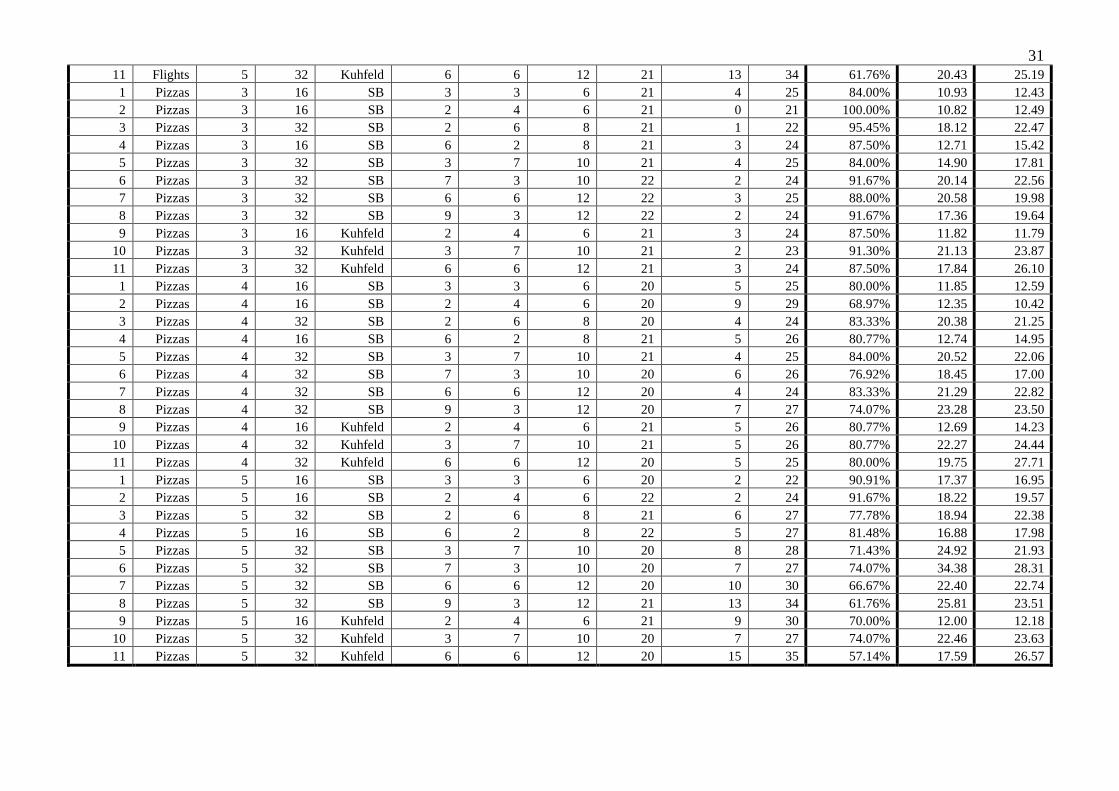
Completion rates ranged from 57.14% to 100% across the different treatments for those
who started the survey; the overall completion rate was 77.7%.9 These results are in Appendix
Table A1. Appendix Table A2 shows that across the 11 master design conditions in Table 1,
average completion rates for those who accepted the invitation to participate ranged from 72.9%
to 88.1%. A 2 x 11 contingency table has a chi-square statistic of 25.51 with p=.004. The average
completion rate for the 33 treatments (N=904) for flights was lower (76.9%) than the comparable
set of treatments (N=854) for pizzas (81.2%); the difference was significant at p=.027 on a two-
sided t-test. Completion rates for treatments using 32 choice sets were lower (77.3%; N=1142)
than for 16 choice sets (82.0%; N=617), and the difference was significant at p=.021 using a
two-sided t-test.10
Now we consider alternatives and attributes. Completion rates differed by the number of
alternatives respondents chose among; the rates were 86.6% for three alternatives, 76.3% for four
alternatives, and 71.7% for five alternatives; the 3 x 2 contingency table had a χ2 statistic of
38.29 (p < .001). Completion rates also differed by the number of attributes; the rates were
82.5% for 6 attributes, 80.6% for 8 attributes, 76.3% for 10 attributes and 73.4% for 12
attributes. The 4 x 2 contingency table has a χ2 statistic of 13.78 (p = .003). We could not find a
consistent significant direction for the effects of numbers of attribute levels.
9 Treating those who did not accept the invitation to participate as non-completers, average completion rates ranged from 45% to 78%, with an overall average completion rate of 66%. An individual’s decision to participate or not participate in the survey was independent of the characteristics of the set of choice questions in the treatment to which they were randomly assigned and would have received had they elected to participate. Thus, we only consider the set of individuals who started the questionnaire. An alternative approach would have been to randomly assign treatments after accepting the invitation to participate. This would have reduced the key source of variability in the number of subjects assigned to each treatment but at the expense of having less control over random assignment to treatments due to temporal patterns that can occur in the number of subjects who decide to accept. 10 Our study design confounds the number of choice sets and numbers of attributes such that larger choice sets tend to have more attributes, typical of empirical practice. To sort out these effects, one must use a multivariate approach, such as that shown in Table 3.

10
Comparing SB statistical designs with Kuhfeld designs shows a 79.2% completion rate
for the former and a 74.2% completion rate for the later. The χ2 statistic for the 2 x 2 contingent
table is 5.15 (p=.023). A more detailed analysis by number of choice alternatives suggests that
completion rates for Kuhfeld designs generally are lower than SB designs; however, the fall in
completion rates as the number of choice alternatives increases is less steep for Kuhfeld designs.
Table 3 contains logistic regression results for a dependent variable indicating completing
the DCE considering all the factors.11
Turning to numbers of choice sets (16 or 32), the parameter estimate is moderately large
in magnitude but does not come approach statistical significance after controlling for other study
design factors. This is perhaps the most surprising finding given the widely held beliefs and
opinions expressed in papers and at conferences that response rates fall rapidly with the number
of choice sets.
Flights is an indicator variable for that product rather than
pizzas; results indicate higher completion rates for pizzas than flights. We suspect that product-
or issue-specific response rates are common; hence, differences in response rates may be due to
ease of answering choice questions or differential interest in the products, but this has not yet
been systematically investigated.
Regarding the number of attributes, one must control for the number of choice sets as the
study design is not balanced for both factors. We created two indicator variables (CS16 for 16
choice sets and CS32 for 32 choice sets) and interacted them with the number of attributes. This
allows the effect for the number of attributes to differ for 16 choice sets (the number of attributes
generally is smaller in magnitude and range) and 32 choice sets. Increasing the number of
11 One could directly control for respondent covariates in the analyses, but random assignment to treatments implies such controls are unnecessary other than to potentially increase power, which is not a problem in our study. Further, almost all available covariates were insignificant. A more complex model interacting respondent covariates with treatment indicators is technically possible but the relatively small differences in completion rates across treatments suggests that few will be significant, which was our experience.
11
attributes decreases completion rates for both choice set sizes substantially. The impact is larger
in for 16 choice sets but to some extent this may be an artifact of differences between the
distributions of the number of attributes for the two choice set sizes examined.
The overall results from our study suggest that increasing complexity of choice sets either
in terms of numbers of options or numbers of alternatives decreases completion rates. The results
for flights and pizzas also are consistent with this notion because choosing among flight options
often involves complicated tradeoffs but choosing between pizza options generally is easier. Our
results are less clear on how complexity relates to experimental designs used to construct the
particular choice sets shown to respondents, and we think this deserves further study.
We used an indicator variable (SBDesign) for a Street and Burgess design rather than a
Kuhfeld SAS design for the multivariate analysis. Our result suggests that a SBDesigns had
higher response rates than Kuhfeld SAS designs, and this effect is significant.
Analysis of Completion Times
Mean/median completion times for DCE conditions to which respondents were randomly
assigned are in Appendix Table A1. We focus on median completion times (MEDTIME) by
treatment as mean completion times are highly correlated (r=.84). MEDTIME varies from just
under 11 minutes to just over 34 minutes across conditions. Mean times average about 1 minute
longer (20.51 minutes for the mean and 11.49 minutes for the median); but in some conditions
the median was larger than the mean. The mean also had a slightly higher standard deviation.
Analysis of the means yields similar results to that for MEDTIME.
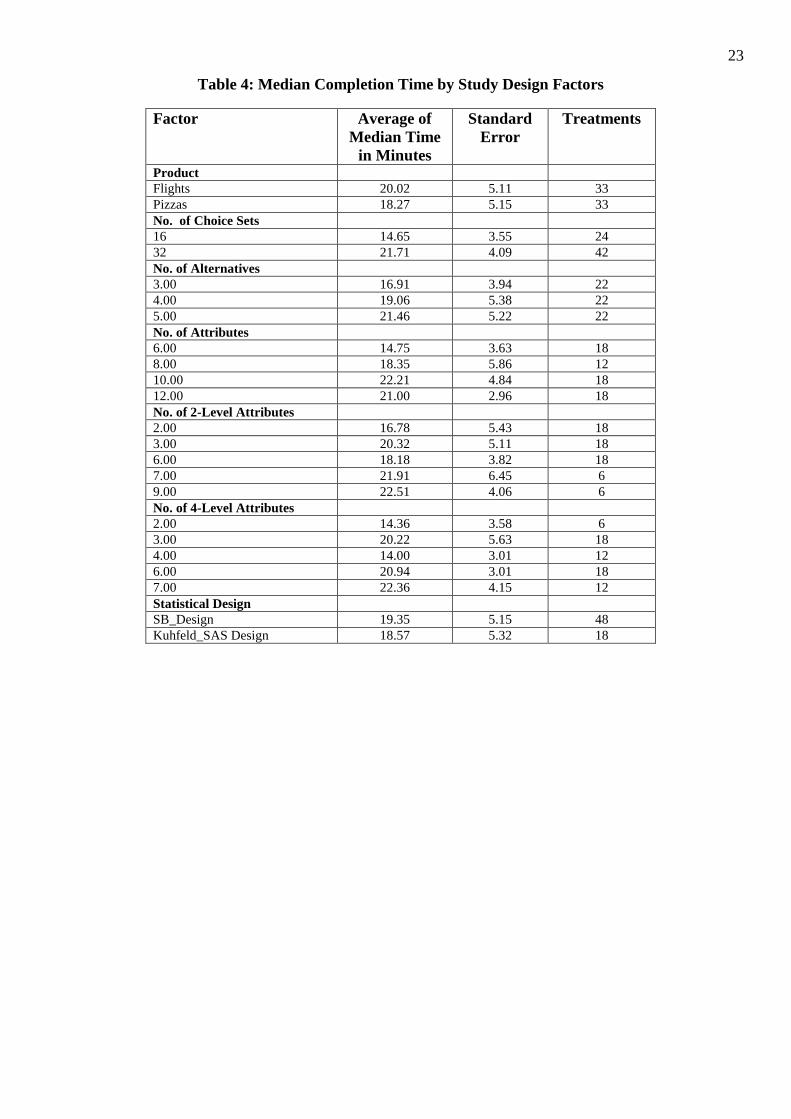
Table 4 summarizes results for the study factors. Going down the rows of Table 4, it is
easy to see that DCEs for flights take longer than pizzas, but the difference is small and not
12
significant at conventional levels. DCEs for 32 choice sets takes significantly longer (p < .001
using a two-sided t-test) than those for 16 choice sets, but not twice as long. Due to the short
introductory section, it should be the case that 32 choice sets would not take twice as long as the
16 choice sets. Yet, 32 choice sets took only about 50% longer on average than 16 choice sets,
suggesting that respondents probably respond more quickly as they proceed through the choice
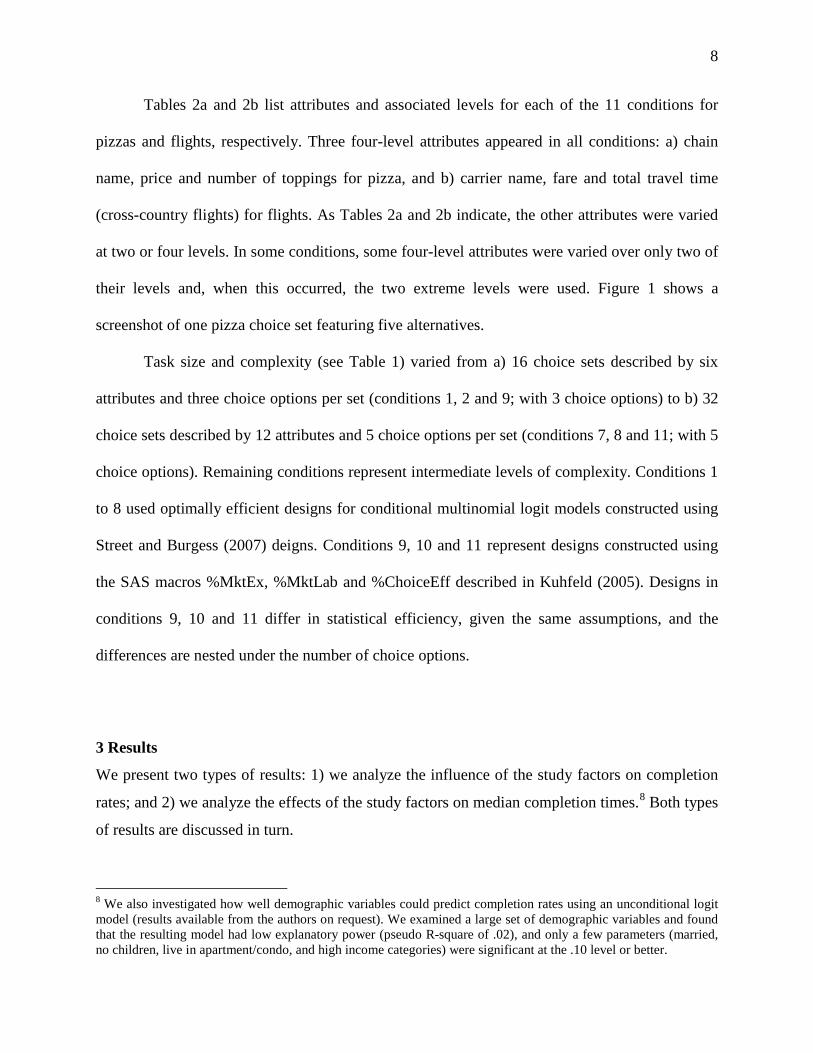
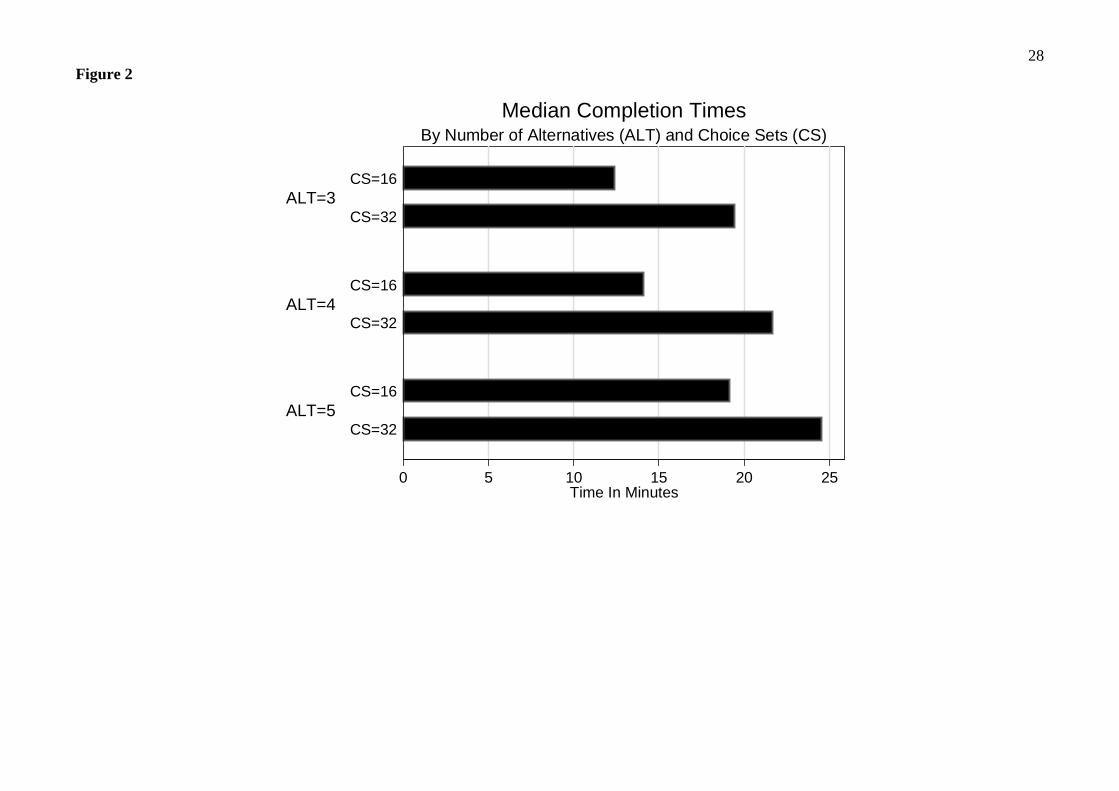
sets. Increasing the number of alternatives increases the average median completion time (p=.012
for an ANOVA with alternatives as a three level factor). Figure 2 gives median completion times
for different alternative and choice set combinations.12
The results are less straightforward for the number of attributes. MEDTIME increases as
the number of attributes increases from 6 to 8 (p=.047). Differences past 8 are not significant,
and one sees a slight down turn for 12 attributes. Results for numbers of attribute levels requires
one to control for numbers of attributes and numbers of choice sets. We found no significant
effects for numbers of attribute levels, so we do not pursue this issue further.
The difference between 16 and 32 choice
sets is larger than the difference between different numbers of alternatives, and the increase from
3 to 4 alternatives is smaller than that from 4 to 5.
Average median completion time for conditions involving SB Designs took just over half
a minute longer than Kuhfeld designs, but this difference is not significant.
Table 5 displays the results of a regression analysis using MEDTIME as the dependent
variable. DCEs for flights had an average median completion time almost two minutes longer
than pizza DCEs, and the difference is significant (p=.040) with controls for other covariates.
Using 32 choice sets increases median completion times a little over 7 minutes, which is highly
significant (p < .001). Moving from 3 to 4 alternatives increases MEDTIME a little over 2
12 This graph uses only the SBDesign data because it is balanced with respect to the number of alternatives and the alternative levels; hence, it gives a clean comparison of the two characteristics.

13
minutes (p=.007), while moving from 3 to 5 alternatives increases MEDTIME over four and half
minutes. Neither numbers of alternatives nor types of designs were significant predictors.13
4 A Simple Look At Data Quality
We do not intend to engage in a comparative modeling exercise, but a natural question to
ask is whether the quality of choice responses obtained in the DCEs decreases systematically and
rapidly with respect to the factors varied across the 66 DCEs. We address this by focusing on the
six extreme conditions, namely 16 choice sets, 6 attributes and 3, 4 or 5 choice options per set
versus 32 choice sets, 12 attributes and 3, 4 or 5 choice options per set. We estimated conditional
logit models for each of these six extreme conditions and calculated the residuals for each model
in each condition. We analyze the squared residuals via an analysis of variance (Table 6), which
indicates a very large effect is associated with the number of choice options (F2,1168=628.2); there
is a smaller, marginally significant effect associated with the number of choice sets/number of
attributes (F1,1168=3.2), and there is a small, but significant interaction between the number of
choice options and the number of choice sets/number of attributes (F2,1168=3.1).14
We also compare the average squared residuals for 16 and 32 choice sets with t-tests for
the 3, 4 and 5 alternative conditions. The results (Table 7) indicate that for 3 and 4 alternatives
differences in average squared residuals for 16 and 32 choice sets are small and insignificant. For
5 alternatives, the average squared residual is significantly smaller for 32 choices sets than for 16
choice sets. In all three cases this result is opposite to what one should obtain if data quality was
rapidly declining with numbers of choice sets. There are significant differences (p < .001)
13 An analysis using mean completion times, which averages a little over a minute longer and is a bit noisier, gave similar results to the median analysis. 14 The conditional logit model estimates “scaled” parameters, and scale seems to differ across treatments. So, one should not directly compare estimated parameters for different models. Calculations that use estimated parameters like marginal willingness to pay for an attribute may cancel out scale factor often differences, allowing one to compare such statistics across models. We focus on the squared residuals as that is where we expect most of the differences between conditions to manifest itself.
14
between 3, 4 and 5 alternatives that are large; their magnitudes overshadow differences between
16 and 32 choice sets.
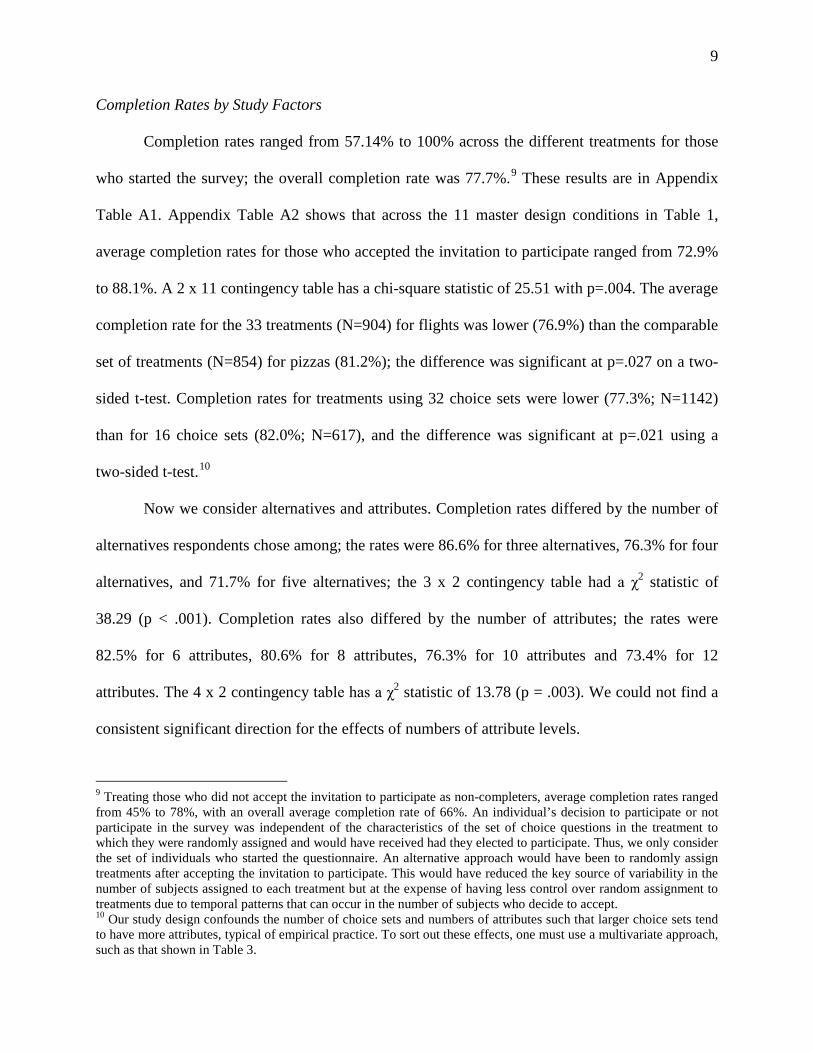
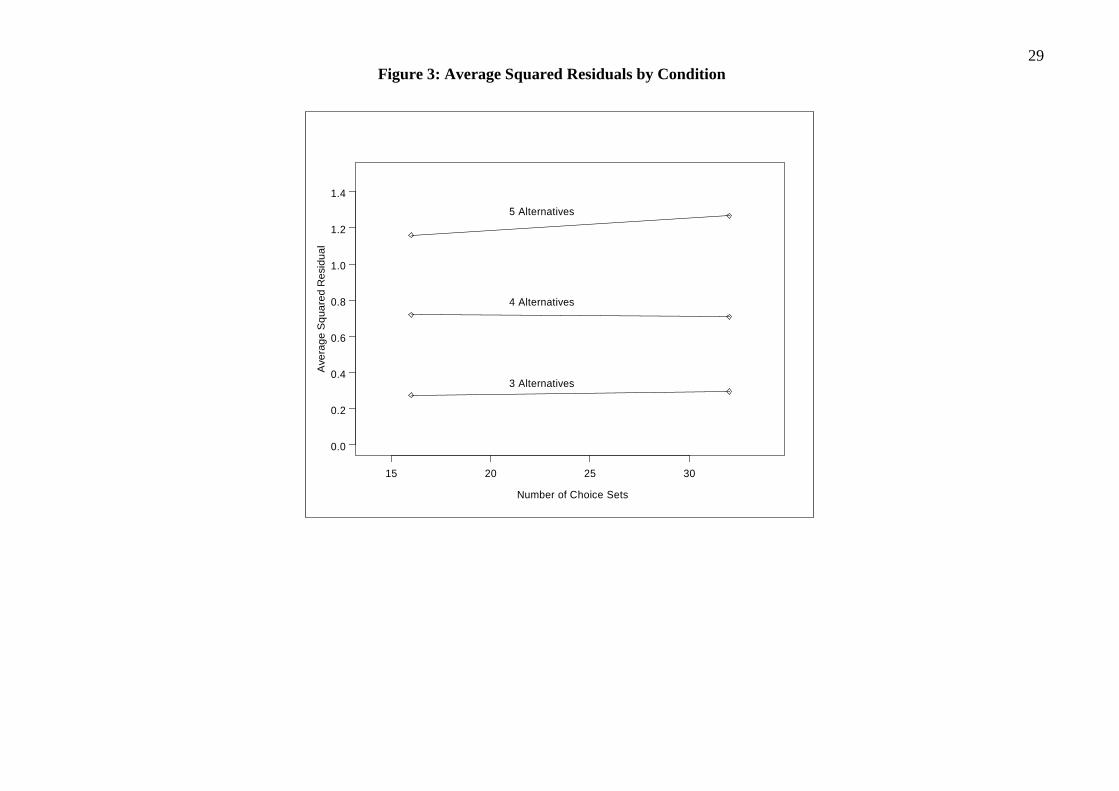
Figure 3 shows error variability increases approximately linearly in numbers of choice
alternatives per set, but decreases slightly with more choice sets or attributes. In turn, this
suggests that adding more choice sets is not deleterious to data quality, but error variance
increases quite markedly with the number of options that participants are asked to process.
5 Discussion
Our most useful finding for empirical researchers probably is simply that completion
rates for DCE surveys remain relatively high even when numbers of choice sets are larger than in
typical applications. We found most of the study factors significantly impacted completion rates
and completion times, but none of the effects was large. In particular, completion rates for the
differences in 16 and 32 choice sets fell less than 5%, while the time needed to complete 32
choice sets was only 50% larger than for 16 sets.
The impact of the number of alternatives offered in each choice set was much larger, with
a fall of 10% between three and four alternatives, and a fall of an additional 5% between four
and five alternatives. The number of effective choices in a DCE equals the number of implied
paired comparisons in a DCE (Chapman and Staelin, 1982; Horsky and Rao 1984). This number
increases rapidly with the number of alternatives presented in choice sets. The fall in completion
rates with increasing numbers of alternatives would be troubling if those who fail to complete are
systematically different than those who do. Our analysis of completer/non-completer
demographic differences suggests few differences, but our sample size, although large (N=1759),
may be too small to find subtle differences given that the non-completion rise is not that large.
15
The number of attributes negatively impacted completion rates, which fell 9% as the
attributes increased from 6 to 12. A multivariate analysis that controlled for the confound with
choice set size suggested that the fall is larger between 6 to 8 than between 8 to 10 attributes.
More attributes allow tradeoffs between more complex (and often realistic) programs to be
examined, so these results should be useful for applied researchers who want to understand the
tradeoff between numbers of attributes and completion rates. The effect of numbers of attributes
on completion times were small and statistically insignificant, suggesting that our respondents
could process up to 12 attributes per alternative without spending substantially more time or that
they ignored some attributes as the number of attributes increased (See, e.g., Hensher, Rose and
Greene, 2005). Clearly, this issue deserves further study, as does the influence of commonly used
statistical design strategies on completion rates.
In contrast, while the number of alternatives had a large impact on completion times, we
found no real effects for numbers of attribute levels. The latter results are not surprising as the
number of levels of an attribute in a DCE is not directly relevant for answering any particular
DCE question. Thus, this finding should be particularly relevant to researchers who want to trace
out potentially non-linear responses to changes in attribute levels.
One should be concerned about increasing the number of choice sets if it reduces data
quality. We used a very simple approach to show that this did not happen. That is, for three or
four alternatives we found no relationship between error variability and the number of choice
sets. We found a drop in the average error variability for five alternatives and 32 choices sets
relative to 16 choice sets. However, it is worth noting that the error variability for 5 alternatives
was more than four times larger than that for 3 alternatives, and it was 60% larger than for 4
16
alternatives. Taken together, this suggests that other DCE design decisions are likely to be much
more important than the number of choice sets in determining error variability.
Each DCE survey cost us approximately $10 (US), and we can use that to calculate the
cost of statistical information. For example, a DCE with 16 choice sets, 6 attributes and 3 choice
options per set can be viewed as 32 data records, whereas a DCE with 16 choice sets, 6 attributes
and 5 choice options per set can be viewed as 64 data records.15 The average completion rate
associated with the former is 89.8%, and the average completion rate associated with the latter is
80.9%, or a difference of 9%. Therefore if 100 individuals attempt the two DCEs, then, on
average, 91 would complete the first and 74 would complete the second. However, these would
generate 2874 and 5178 data records, respectively, with the larger design returning about 80%
more data from which to estimate models. The cost is 19 cents per data record for the larger
design versus 35 cents for the smaller design; hence, the larger design is 46% less expensive than
the smaller one in terms of the number of effective data records collected for the same cost.16
The gain in moving from 16 to 32 choice sets is much larger partly because the fall in
response rates is small relative to doubling the number of effective choices.
17
It would be useful to replicate our study with different types of alternatives including
some more complex than the ones we studied. However, there is no reason to think that the
A 50% increase in
time would change this comparison somewhat if survey completion costs increase rapidly in
terms of expected completion times, but this typically does not happen in opt-in web panels.
15 For three alternatives {A, B, C} and a respondent arbitrarily picking (say) A, there are two binary comparisons: A is preferred to B and A is preferred to C. For five alternatives {A, B, C, D, E} and a respondent again picking A, there are four binary comparisons: A is preferred to B, C, D, and E. 16 If survey providers charge per “completed” interview, completion rates issues become less interesting from a cost perspective, although one might expect some price adjustments based on the factors impacting completion rates examined in this paper. In particular, average time to completion is likely to be a cost factor. 17 It is worth noting that having twice as many respondents is better from a statistical standpoint than having twice as many choice sets for the same respondents due to likely correlations across any one respondent’s choices. However, more choices per respondent can improve the fit of models with individual fixed effects and estimation of models with correlated error terms and can facilitate estimation of individual level models.

17
general pattern of results will differ. Administering DCEs via web surveys to opt-in panels is
attractive to choice modelers because the technology can randomly assign respondents to
(potentially many) distinct versions of a questionnaire. Our results suggest that the amount of
information that can be collected from respondents via this mode of survey administration is
larger than most researchers believe. Our results also suggest that tradeoffs with respect to the
features of DCEs are smaller than commonly believed with respect to number of choice sets.
18
References
Bogen, K. (1996), “The Effect of Questionnaire Length on Response Rates: A Review of the Literature,” in Proceedings of the Section on Survey Research Methodology, pp. 1020-1025. Alexandria, VA: American Statistical Association.
Brazell, J.D. and J.J. Louviere (1996), “Length Effects in Conjoint Choice Experiments and
Surveys: An Explanation Based on Cumulative Cognitive Burden,” Working paper, Department of Marketing, University of Sydney.
Carlsson, F. and P. Martinsson (2008), “How Much Is Too Much: An Investigation of the Effect
of the Number of Choice Set, Starting Point, the Choice of Bid Vector in Choice Experiments,” Environmental and Resource Economics, 40, 165-176.
Carson, R.T., J.J. Louviere, D.A. Anderson, P. Arabie, D.S. Bunch, D. Hensher, R.M. Johnson,
W.F. Kuhfeld, D. Steinberg, J. Swait, H. Timmermans and J. B. Wiley (2004), "Experimental Analysis of Choice," Marketing Letters, 5, 351-367.
Chang, L. and J. Krosnick (2009), “National Surveys Via Rdd Telephone Interviewing Versus the
Internet Comparing Sample Representativeness and Response Quality,” Public Opinion Quarterly, 73: 641-678.
Chapman, R.G. and R. Staelin (1982), “Exploiting Rank Ordered Choice Data Within the Stochastic
Utility Model,” Journal of Marketing Research, 19, 288-301. Couper, M.P. (2000), "Web Surveys: A Review of Issues and Approaches," Public Opinion
Quarterly, 64: 464–94. DeShazo, J.R. and G. Fermo (2002), “Designing Choice Sets for Stated Preference Methods: The
Effect of Complexity on Choice Consistency,” Journal of Environmental Economics and Management, 44, 123-147.
Dillman, D.A. (2000), “Navigating the Rapids of Change: Some Observations on Survey
Methodology in the Early Twenty-First Century,” Public Opinion Quarterly, 66, 473-494.
Fricker, S., M. Galesic, R. Tourangeau and T. Yan (2005), “An Experimental Comparison of
Web and Telephone Surveys,” Public Opinion Quarterly, 69, 370-392. Hanley, N., R.E. Wright, and V. Adamowicz (1998), “Using Choice Experiments to Value the
Environment,” Environmental and Resource Economics, 11, 413-428. Hensher, D.A. (2006), "How Do Respondents Process Stated Choice Experiments?: Attribute
Consideration Under Varying Information Load," Journal of Applied Econometrics, 21, 861-878.
19
Hensher, D.A., J. Rose, and W.H. Greene (2005), “The Implication on Willingness to Pay of Respondents Ignoring Specific Attributes,” Transportation, 32: 203-222.
Hensher, D.A., P.R. Stopher and J.J. Louviere (2001), “An Exploratory Analysis of the Effects
of Numbers of Choice Sets in Designed Choice Experiments: An Airline Choice Application,” Journal of Air Transport Management, 7, 373-379.
Horsky and Rao (1984) Management Science Johnson, R.M. and B.K. Orme (1996), “How Many Questions Should You Ask In Choice-Based
Conjoint Studies?,” paper presented at the American Marketing Association Advanced Research Techniques Forum, Beaver Creek, CO.
Kaplowitz, M.D., T.D. Hadlock and R. Levine (2004), “A Comparison Between Web and Mail
Survey Response Rates,” Public Opinion Quarterly, 68, 94-101. Keller, K.L. and R. Staelin (1987), "Effects of Quality and Quantity of Information on Decision
Effectiveness," Journal of Consumer Research, 14, 200-213. Kuhfeld, W. F. (2005) Marketing Research Methods in SAS: Experimental Design, Choices,
Conjoint and Graphical Techniques (http:// support.sas.com/ techsup/ tnote/ tnote_stat.html).
Kuhfeld, W. F., R.D. Tobias and M. Garratt (1994), “Efficient Experimental Design With
Marketing Research Applications,” Journal of Marketing Research, 31, 545-557. Louviere, J.J., D. Hensher and J. Swait (2000), Stated Choice Methods: Analysis and
Application. New York: Cambridge University Press. Smyth, J.D., D.A. Dillman, L.M. Christian and M.J. Stern (2006), “Comparing Check-All and
Forced-Choice Question Formats in Web Surveys,” Public Opinion Quarterly, 70, 66-77. Street, D.J. and L. Burgess (2007), The Construction of Optimal Stated Choice Experiments.
New York: John Wiley. Swait, J. and V. Adamowicz (2001), “The Influence of Task Complexity on Consumer Choice:
A Latent Class Model of Decision Strategy Switching,” Journal of Consumer Research, 28, 135-148.
Taylor, H., J. Bremer, C. Overmeyer, J.W. Siegel and G. Terhanian (2001), “The Record of Internet-Based Opinion Polls in Predicting the Results of 72 Races in the November 2000 US Elections,” International Journal of Market Research, 43,127-36.
Viney, R., E. Lanscar and J. Louviere (2002), “Discrete Choice Experiments to Measure Consumer Preferences for Health and Healthcare,” Expert Review of Pharmaco-economics and Outcomes Research, 2, 319-326.
20
Table 1: 33 Experimental Conditions in the Study
Conditio
n #
Design
# of
Attributes
3 Alternative
s
Design
4 Alternative
s
Design
5 Alternative
s
Design
# choice sets
# choice sets
# choice sets
1 23x43 6 16 SB 16 SB 16 SB 2 22x44 6 16 SB 16 SB 16 SB 3 22x46 8 32 SB 32 SB 32 SB 4 26x42 8 16 SB 16 SB 16 SB 5 23x47 10 32 SB 32 SB 32 SB 6 27x43 10 32 SB 32 SB 32 SB 7 26x46 12 32 SB 32 SB 32 SB 8 29x43 12 32 SB 32 SB 32 SB 9 22 x 44 6 16 Kuhfel
d 32 Kuhfel
d 32 Kuhfel
d 10 23 x 47 10 16 Kuhfel
d 32 Kuhfel
d 32 Kuhfel
d 11 26 x 46 12 16 Kuhfel
d 32 Kuhfel
d 32 Kuhfel
d

21
Table 2: List of Attributes/Levels in the Experiments
a. Cross-Country Flights Flight Attributes Level1 Level 2 Level 3 Level 4 Airline* Qantas Virgin Blue JetStar Oz Jet Round-trip air fare (exc tax) $350 $450 $550 $650 Total travel time (Hours) 4 5 6 7 Food** None Free hot
meal Free snack Food can be
purchased Audio/video entertainment** Not available Free $3 $6 Wait in baggage claim for bags** 10 mins 20 mins 30 mins 40 mins Number of stops 0 1 % time flight departs on time 100% 80% Wine/beer $6 each Both free Juice/water/soft drinks Not available All free Frequent flyer club No Yes Typical wait to check-in 5 mins 20 mins **In some conditions treated as 2-level attributes by using the two extreme levels (i.e., levels 1 and 4)
b. Delivered Pizzas
Pizza Attributes Level1 Level 2 Level 3 Level 4 Brand of delivered pizza* Pizza Hut Dominos Eagle Boys Pizza Haven Price of a large pizza $12.00 $14.00 $16.00 $18.00 Number of toppings 1 2 3 4 Type of crust** Regular Thick Cheese
stuffed Thin
Average delivery time** 10 minutes 20 minutes 30 minutes 40 minutes 1Likely range in delivery time** 10% 20% 30% 40% How often pizza arrives hot (times/10)** 10/10 8/10 6/10 4/10 Free garlic bread/bread sticks No Yes Free Coke or Pepsi No Yes Free side salad No Yes Free hot chicken wings No Yes Free dessert No Yes **In some conditions treated as 2-level attributes by using the two extreme levels (i.e., levels 1 and 4) 1Expressed in range of minutes not percentages (e.g., if delivery time = 20 minutes and range = (40%, the participant would have seen “average delivery time = 20 minutes” and “likely range in that time = 12 minutes to 28 minutes”.

22
Table 3: Logistic Regression of Completion Rates on Study Factors Parameter Estimate Robust
Standard Error p-Value
Constant 4.7297 .8236 0.000 Flights -.2719 .1172 0.020 CS32 -.3763 .9702 0.698
Alternatives -.4367 .0720 0.000 Attributes*CS16 -.2337 .1151 0.042 Attributes*CS32 -.1325 .0530 0.012
SBDesign .2598 .1230 0.046 Model LL
LR Test (covariates) -900.95
(χ2=61.88; df=6) Observations 1759
23
Table 4: Median Completion Time by Study Design Factors
Factor Average of Median Time
in Minutes
Standard Error
Treatments
Product Flights 20.02 5.11 33 Pizzas 18.27 5.15 33 No. of Choice Sets 16 14.65 3.55 24 32 21.71 4.09 42 No. of Alternatives 3.00 16.91 3.94 22 4.00 19.06 5.38 22 5.00 21.46 5.22 22 No. of Attributes 6.00 14.75 3.63 18 8.00 18.35 5.86 12 10.00 22.21 4.84 18 12.00 21.00 2.96 18 No. of 2-Level Attributes 2.00 16.78 5.43 18 3.00 20.32 5.11 18 6.00 18.18 3.82 18 7.00 21.91 6.45 6 9.00 22.51 4.06 6 No. of 4-Level Attributes 2.00 14.36 3.58 6 3.00 20.22 5.63 18 4.00 14.00 3.01 12 6.00 20.94 3.01 18 7.00 22.36 4.15 12 Statistical Design SB_Design 19.35 5.15 48 Kuhfeld_SAS Design 18.57 5.32 18

24
Table 5: Regression of Median Completion Time on Study Factors
Parameter Estimate Robust Standard Error
p-Value
Constant 11.5493 .7072 0.000 Flights 1.7481 .8319 0.040 ChS32 7.0584 .7707 0.000
Alternatives=4 2.1480 .7690 0.007 Alternatives=5 4.5534 1.0442 0.000
R2 .599 Observations 66

25
Table 6: ANOVA Results for Model Squared Residuals
Source
Type III Sum of Squares df Mean Square F P(F)
Corrected Model 1721.900a 5 344.380 295.268 .000 Intercept 5448.266 1 5448.266 4671.285 .000
16 versus 32 choice sets 3.766 1 3.766 3.229 .072
3,4,5 options per set 1465.485 2 732.743 628.246 .000 16vs32 x 3,4,5 options 7.157 2 3.578 3.068 .047
Error 13597.089 11658 1.166 Total 23090.890 11664
Corrected Total 15318.989 11663 aR2 = 0.112

26
Table 7: t-Tests for Difference in Model Squared Residualsa
# Alternatives
Average Squared Residual 16 Sets
Average Squared
Residuals 32 Sets t-statistic P-value
3 options 0.275 0.296 -0.88 .38 4 options 0.720 0.709 0.35 .73 5 options 1.160 1.267 -3.11 .00
aNumber of observations by row [(3200, 1600), (2560, 1280), (2016, 1008)]
27
Figure 1: Screen Shot of One of the Pizza Choice Sets
28 Figure 2
0 5 10 15 20 25Time In Minutes
ALT=5
ALT=4
ALT=3
CS=32
CS=16
CS=32
CS=16
CS=32
CS=16
By Number of Alternatives (ALT) and Choice Sets (CS)Median Completion Times
29 Figure 3: Average Squared Residuals by Condition
Number of Choice Sets
Ave
rage
Squ
ared
Res
idua
l
15 20 25 30
0.0
0.2
0.4
0.6
0.8
1.0
1.2
1.4
5 Alternatives
4 Alternatives
3 Alternatives
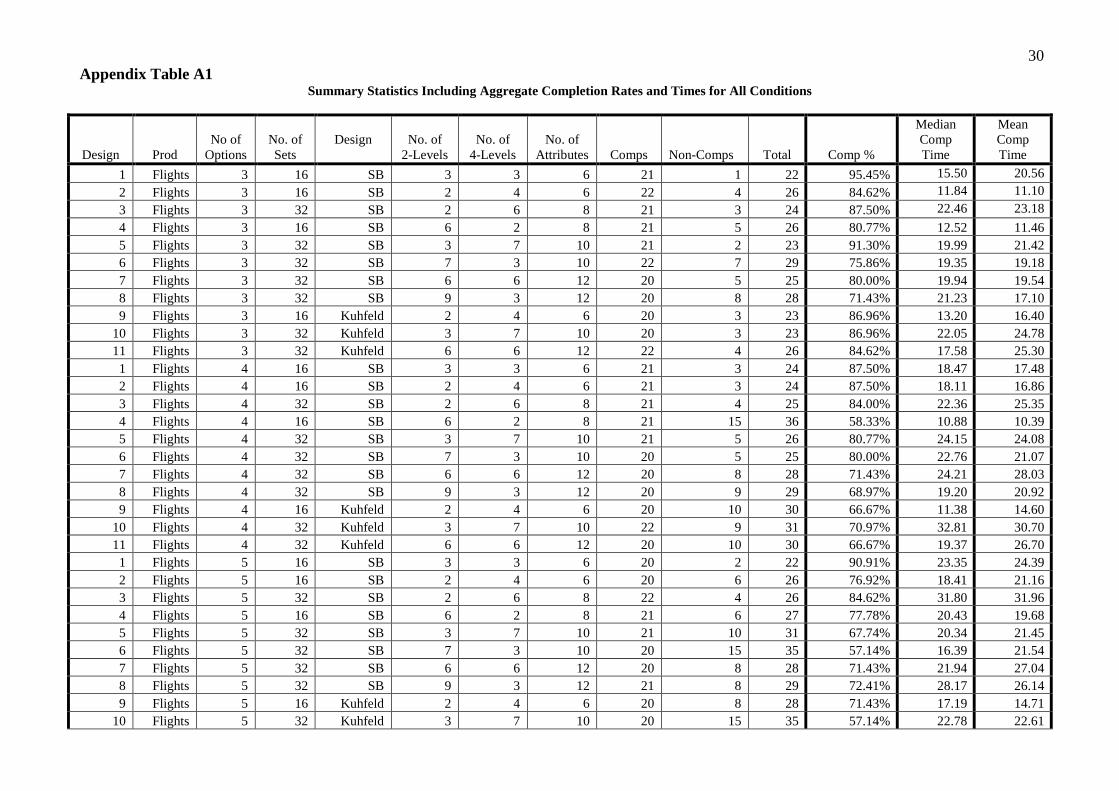
30 Appendix Table A1
Summary Statistics Including Aggregate Completion Rates and Times for All Conditions
Design Prod No of
Options No. of Sets
Design
No. of 2-Levels
No. of 4-Levels
No. of Attributes Comps Non-Comps Total
Comp %
Median Comp Time
Mean Comp Time
1 Flights 3 16 SB 3 3 6 21 1 22 95.45% 15.50 20.56 2 Flights 3 16 SB 2 4 6 22 4 26 84.62% 11.84 11.10 3 Flights 3 32 SB 2 6 8 21 3 24 87.50% 22.46 23.18 4 Flights 3 16 SB 6 2 8 21 5 26 80.77% 12.52 11.46 5 Flights 3 32 SB 3 7 10 21 2 23 91.30% 19.99 21.42 6 Flights 3 32 SB 7 3 10 22 7 29 75.86% 19.35 19.18 7 Flights 3 32 SB 6 6 12 20 5 25 80.00% 19.94 19.54 8 Flights 3 32 SB 9 3 12 20 8 28 71.43% 21.23 17.10 9 Flights 3 16 Kuhfeld 2 4 6 20 3 23 86.96% 13.20 16.40
10 Flights 3 32 Kuhfeld 3 7 10 20 3 23 86.96% 22.05 24.78 11 Flights 3 32 Kuhfeld 6 6 12 22 4 26 84.62% 17.58 25.30 1 Flights 4 16 SB 3 3 6 21 3 24 87.50% 18.47 17.48 2 Flights 4 16 SB 2 4 6 21 3 24 87.50% 18.11 16.86 3 Flights 4 32 SB 2 6 8 21 4 25 84.00% 22.36 25.35 4 Flights 4 16 SB 6 2 8 21 15 36 58.33% 10.88 10.39 5 Flights 4 32 SB 3 7 10 21 5 26 80.77% 24.15 24.08 6 Flights 4 32 SB 7 3 10 20 5 25 80.00% 22.76 21.07 7 Flights 4 32 SB 6 6 12 20 8 28 71.43% 24.21 28.03 8 Flights 4 32 SB 9 3 12 20 9 29 68.97% 19.20 20.92 9 Flights 4 16 Kuhfeld 2 4 6 20 10 30 66.67% 11.38 14.60
10 Flights 4 32 Kuhfeld 3 7 10 22 9 31 70.97% 32.81 30.70 11 Flights 4 32 Kuhfeld 6 6 12 20 10 30 66.67% 19.37 26.70 1 Flights 5 16 SB 3 3 6 20 2 22 90.91% 23.35 24.39 2 Flights 5 16 SB 2 4 6 20 6 26 76.92% 18.41 21.16 3 Flights 5 32 SB 2 6 8 22 4 26 84.62% 31.80 31.96 4 Flights 5 16 SB 6 2 8 21 6 27 77.78% 20.43 19.68 5 Flights 5 32 SB 3 7 10 21 10 31 67.74% 20.34 21.45 6 Flights 5 32 SB 7 3 10 20 15 35 57.14% 16.39 21.54 7 Flights 5 32 SB 6 6 12 20 8 28 71.43% 21.94 27.04 8 Flights 5 32 SB 9 3 12 21 8 29 72.41% 28.17 26.14 9 Flights 5 16 Kuhfeld 2 4 6 20 8 28 71.43% 17.19 14.71
10 Flights 5 32 Kuhfeld 3 7 10 20 15 35 57.14% 22.78 22.61
31 11 Flights 5 32 Kuhfeld 6 6 12 21 13 34 61.76% 20.43 25.19 1 Pizzas 3 16 SB 3 3 6 21 4 25 84.00% 10.93 12.43 2 Pizzas 3 16 SB 2 4 6 21 0 21 100.00% 10.82 12.49 3 Pizzas 3 32 SB 2 6 8 21 1 22 95.45% 18.12 22.47 4 Pizzas 3 16 SB 6 2 8 21 3 24 87.50% 12.71 15.42 5 Pizzas 3 32 SB 3 7 10 21 4 25 84.00% 14.90 17.81 6 Pizzas 3 32 SB 7 3 10 22 2 24 91.67% 20.14 22.56 7 Pizzas 3 32 SB 6 6 12 22 3 25 88.00% 20.58 19.98 8 Pizzas 3 32 SB 9 3 12 22 2 24 91.67% 17.36 19.64 9 Pizzas 3 16 Kuhfeld 2 4 6 21 3 24 87.50% 11.82 11.79
10 Pizzas 3 32 Kuhfeld 3 7 10 21 2 23 91.30% 21.13 23.87 11 Pizzas 3 32 Kuhfeld 6 6 12 21 3 24 87.50% 17.84 26.10 1 Pizzas 4 16 SB 3 3 6 20 5 25 80.00% 11.85 12.59 2 Pizzas 4 16 SB 2 4 6 20 9 29 68.97% 12.35 10.42 3 Pizzas 4 32 SB 2 6 8 20 4 24 83.33% 20.38 21.25 4 Pizzas 4 16 SB 6 2 8 21 5 26 80.77% 12.74 14.95 5 Pizzas 4 32 SB 3 7 10 21 4 25 84.00% 20.52 22.06 6 Pizzas 4 32 SB 7 3 10 20 6 26 76.92% 18.45 17.00 7 Pizzas 4 32 SB 6 6 12 20 4 24 83.33% 21.29 22.82 8 Pizzas 4 32 SB 9 3 12 20 7 27 74.07% 23.28 23.50 9 Pizzas 4 16 Kuhfeld 2 4 6 21 5 26 80.77% 12.69 14.23
10 Pizzas 4 32 Kuhfeld 3 7 10 21 5 26 80.77% 22.27 24.44 11 Pizzas 4 32 Kuhfeld 6 6 12 20 5 25 80.00% 19.75 27.71 1 Pizzas 5 16 SB 3 3 6 20 2 22 90.91% 17.37 16.95 2 Pizzas 5 16 SB 2 4 6 22 2 24 91.67% 18.22 19.57 3 Pizzas 5 32 SB 2 6 8 21 6 27 77.78% 18.94 22.38 4 Pizzas 5 16 SB 6 2 8 22 5 27 81.48% 16.88 17.98 5 Pizzas 5 32 SB 3 7 10 20 8 28 71.43% 24.92 21.93 6 Pizzas 5 32 SB 7 3 10 20 7 27 74.07% 34.38 28.31 7 Pizzas 5 32 SB 6 6 12 20 10 30 66.67% 22.40 22.74 8 Pizzas 5 32 SB 9 3 12 21 13 34 61.76% 25.81 23.51 9 Pizzas 5 16 Kuhfeld 2 4 6 21 9 30 70.00% 12.00 12.18
10 Pizzas 5 32 Kuhfeld 3 7 10 20 7 27 74.07% 22.46 23.63 11 Pizzas 5 32 Kuhfeld 6 6 12 20 15 35 57.14% 17.59 26.57
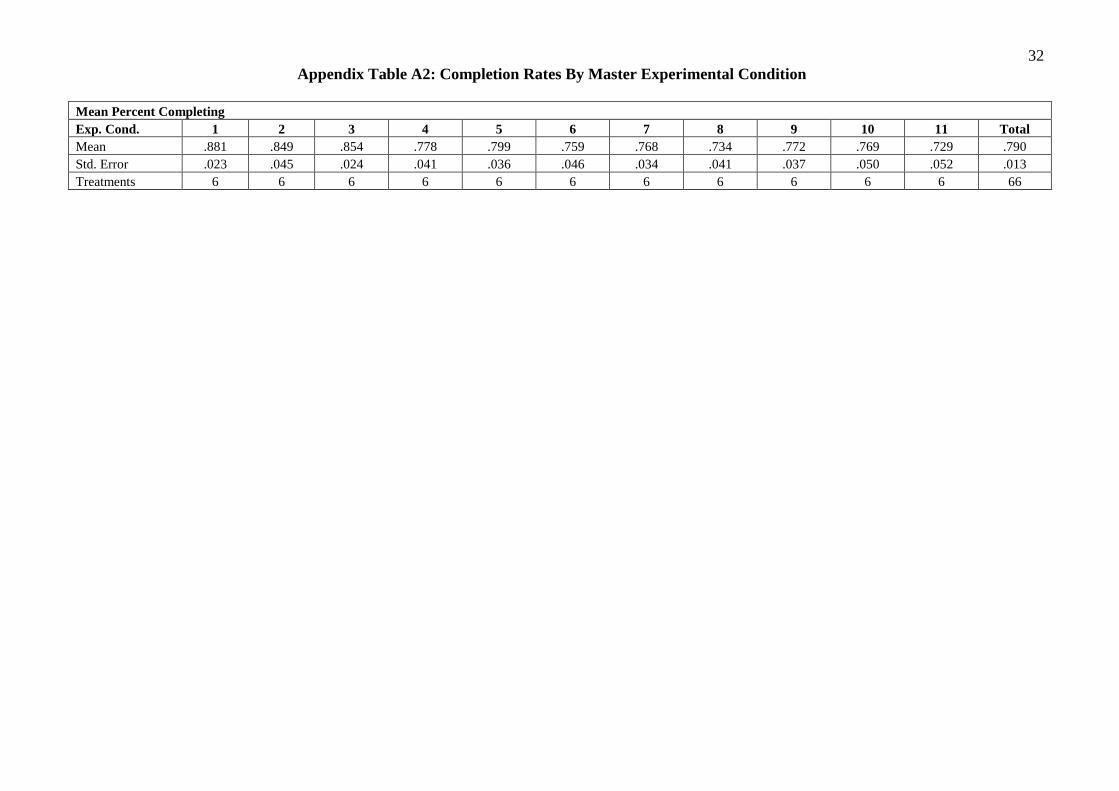
32 Appendix Table A2: Completion Rates By Master Experimental Condition
Mean Percent Completing Exp. Cond. 1 2 3 4 5 6 7 8 9 10 11 Total Mean .881 .849 .854 .778 .799 .759 .768 .734 .772 .769 .729 .790 Std. Error .023 .045 .024 .041 .036 .046 .034 .041 .037 .050 .052 .013 Treatments 6 6 6 6 6 6 6 6 6 6 6 66

33