sera phase ix release investigation report st505/9, …...with the airborne warning and control...
TRANSCRIPT

•
•
•
UNITED STATES AIR FORCE ELMENDORF AIR FORCE BASE, ALASKA
ENVIRONMENTAL RESTORATION PROGRAM
SERA PHASE IX RELEASE INVESTIGATION REPORT ST505/9, AWACS HANGAR UST AFID Nos. 306, 307, AND 308 FINAL
FEBRUARY 2002

SERA PHASE IX ST505/9 RELEASE INVESTIGATION REPORT FINAL
• CONTENTS
ACRONYMS .............................................................................................................. iii EXECUTIVE SUMMARY ......................................................................................... E-1
1.0 INTRODUCTION ......................................................................................•.... 1-1
1.1 Report Outline ............................................. : ................................................ 1-1 1.2 SERA Phase IX ............................................. , .............................................. 1-3 1.3 ADEC Regulatory Requirements .................................................................. 1-3 1.4 ADEC Underground Storage Tank Regulations ............................................ 1-3 1.5 Regional Geology ......................................................................................... 1-5 1.6 Site Background ........................................................................................... 1-6
1.6.1 Previous Investigations ..................................................................... 1-7 1.6.2 Exceedances of Cleanup Levels ....................................................... 1-7
1.7 Objectives of SERA IX Investigation ............................................................. 1-8 2.0 FIELD METHODS .......................................................................................... 2-1
2.1 Initial Activities .............................................................................................. 2-1 2.2 Borings ......................................................................................................... 2-1 2.3 Sampling Procedures ................................................................................... 2-2
2.3.1 Soil Sampling ................................................................................... 2-2 2.3.2 Field Quality Control Samples .......................................................... 2-4
• 2.4 Field Sample Identification ........................................................................... 2-4 2.5 Sample Packaging and Shipping .................................................................. 2-5 2.6 Field and Sample Custody Documentation ................................................... 2-6 2.7 Investigation-Derived Waste Management ................................................... 2-8 2.8 Field Equipment Calibration ......................................................................... 2-8 2.9 Survey .......................................................................................................... 2-9 2.10 Data Interpretation ...................................................................................... ;2-9
2.10.1 Field Screening Data '" ..................................................................... 2-9 2.10.2 Comparison to ADEC Soil Cleanup Levels - Method One ................ 2-9 2.10.3 Comparison to ADEC Soil Cleanup Levels - Method Two ................ 2-9
3.0 RESULTS .........................................................................................•............ 3-1 3.1 2001 SERA IX Field Program ....................................................................... 3-1
3.1.1 Soil Boring Installation ...................................................................... 3-1 3.2 Discussion of Findings ............................................................•.................... 3-1
3.2.1 Soil Findings ..................................................................................... 3-1
4.0 CONCLUSiONS ........................................................................................... 3-10 4.1 Summary ..................................................... : ................................................ 4-1
5.0 REFERENCES .............................................................................................. 5-1
• 09000· 268·400 February 2002
SERA PHASE IX ST505/9 RELEASE INVESTIGATION REPORT FINAL
A
APPENDICES
ANALYTICAL RESULTS AND FIGURES FOR PREVIOUS INVESTIGATION • B SERA PHASE IX BORING EXPLORATION LOGS
C ADEC MATRIX SCORE SHEETS
D SERA PHASE IX DATA ASSESSMENT REPORT
LIST OF TABLES
Table 2-1. Sample Analytical Summary for ST505/9 .......................................................... 2-3 Table 3-1. Soil Analytical Results: Site 505/9, SERA IX Release Investigation, 2001 ......... 3-5
LIST OF FIGURES
Figure 1-1. ST505/9 Site Location Map ............................................................................. 1-2 Figure 1-2. Regional Groundwater Flow Patterns .............................................................. 1-4 Figure 3-1. Site Layout and Boring Locations .................................................................... 3-2 Figure 3-2. Detail of Soil Boring Locations ......................................................................... 3-3 •
• 09000·-268·400 ii February 2002

•
•
•
SERA PHASE IX ST505/9 RELEASE INVESTIGATION REPORT FINAL
MC
ADEC
AFID
AGE
ASTM
AWACS
bgs
BTEX
C
CERCLA
CSRP
DRMO
DRO
EAFB
EPH-D
EPA
ESF
EV
F
FFA
GRO
HOPE
HHS
lOW
JP-4
LNAPL
jig/kg
mg/kg
mgIL
mL
09000·268-400
ACRONYMS
Alaska Administrative Code
Alaska Department of Environmental Conservation
Air Force Identification Number
Air-to-Ground Equipment
American Society for Testing and Materials
Airborne Warning and Control Squadron
Below ground surface
Benzene, toluene, ethylbenzene, and total xylenes
Centigrade
Comprehensive Environmental Response, Compensation, and Liability Act
Contaminated Sites Remediation Program
Defense Reutilization and Marketing Organization
Diesel range organics
Elmendorf Air Force Base
extractable petroleum hydrocarbons-diesel
U.S. Environmental Protection Agency
Environmental Staging Facility
Electron volt
Fahrenheit
Federal Facility Agreement
Gasoline range organics
High-density polyethylene
Heated Headspace
Investigation-derived waste
Jet propulsion fuel number 4
Light nonaqueous-phase liquids
Micrograms per kilogram
Milligrams per kilogram
Milligrams per liter
Milliliter
iii F ebruari 2002
..... _--- ----------------

SERA PHASE IX ST505/9 RELEASE INVESTIGATION REPORT FINAL
ACRONYMS (Continued) • MNA Monitored natural attenuation
mogas Motor vehicle gasoline
MRL Method reporting limit
MS Matrix spike
MSO Matrix spike duplicate
MS/MSO Matrix spike/matrix spike duplicate
OU5 Operable Unit 5
PAHs Polycyclic aromatic hydrocarbons
PIO Photoionization detector
POL Petroleum, oil, and lubricants
mglkg Parts per million
PVC Polyvinyl chloride
QA Quality assurance
QC Quality control
RI Release Investigation • RRO Residual range organics
SERA State-Elmendorf Environmental Restoration Agreement
SSHP Site-Specific Safety and Health Plan
TOC Total organic carbon
TPH-G total petroleum hydrocarbons-gasoline
USACE U.S. Army Corps of Engineers
USAF U.S. Air Force
USCS Unified Soil Classification System
UST Underground storage tank
VOA Volatile organic analysis
VOC Volatile organic compound
• 09000· 268400 iv February 2002

•
•
SERA PHASE IX ST505/9 RELEASE INVESTIGATION REPORT FINAL
EXECUTIVE SUMMARY
The accompanying report presents findings of the State-Elmendorf Environmental Restoration Agreement (SERA) Phase IX Release Investigation (RI) at ST505/9 on Elmendorf Air Force Base (EAFB). Building 14410 (formerly Building 42-300) is associated with the Airborne Warning and Control Squadron (AWACS) Hangar and is situated near the aircraft hardstands north of the East-West Runway. The site is a former fueling station for air-to-ground equipment.
The fueling station was on the south side of the building and included three 2,500-gallon, single-walled underground storage tanks (USTs) (Air Force Identification Numbers 306, 307 and 308') and an associated fuel dispenser island approximately 15 feet to the west. Tank 419 stored diesel, Tank 420 stored motor vehicle gasoline (mogas), and Tank 424 stored jet propulsion fuel number 4 (JP-4). The site remained active for approximately 10 years. The tanks, associated piping, and dispensers were removed in May 1994. During tank removal, no leaks from the tanks were observed, and the tanks appeared to be in good condition, with uniform surface corrosion. Field screening and soil analytical results showed that hydrocarbon concentrations in soils from the excavation were very low or non-detect. The tank excavation was backfilled with stockpiled soils and approximately 25 yards of clean soil.
Analytical results from soil samples collected from the dispenser island indicated the presence of contamination from petroleum, oil, and lubricant (POL) products.
The goal of the 2001 field program at ST505/9 has been to gather additional data that would address data gaps identified by EAFB and allow for evaluation of the potential for site closure. There were two major objectives of the SERA IX investigation at this site:
• Delineate the extent of soil contamination in the vertical and lateral directions in the vicinity of the dispenser island.
• Fill the following specific analytical data gaps: 1) no polycyclic aromatic hydrocarbon (PAH) data for soil had been collected to date at this site; and 2) previous non-detect benzene results were obtained at method recording limits that are in excess of the Alaska Department of Environmental Conservation Method Two migration-to-groundwater soil cleanup level of 0.02 milligrams per kilogram (mg/kg) and therefore did not allow for determination of whether the Method Two benzene cleanup level has been exceeded.
Major findings of the SERA IX investigation included the following:
• 1 Also referred to as Storage Tank Management Plan (STMP) Nos. 419, 420, and 424.
09000-268--400 ES-1 F obruary 2002

SERA PHASE IX ST505/9 RELEASE INVESTIGATION REPORT FINAL
• Soil analytical data indicate that no soil samples collected from the tank
excavation, dispenser island, or downgradient of these two potential source areas
exceed the most stringent Method I, Level A, soil cleanup standards for diesel range organics, residual range organics, or gasoline range organics.
• Soil samples did not exceed Method II cleanup standards for PAHs.
Based on the results of the SERA IX RI and the UST Site Assessment, and the fact that the
site falls into the OU5 model area, this site is recommended for closure.
09000··268-400 ES-2 February 2002
•
•
•

•
•
•
SERA PHASE IX ST505/9 RELEASE INVESTIGATION REPORT FINAL
1.0 INTRODUCTION
This report presents the findings of the State-Elmendorf Environmental Restoration
Agreement (SERA) Phase IX Release Investigation (RI) at ST505/9 Airborne Warning and Control Squadron (AWACS) Hangar, on Elmendorf Air Force Base (EAFB: see Figure 1-1). SERA is a cooperative agreement signed in October 1992 between the U.S. Air Force (USAF) and Alaska Department of Environmental Conservation (ADEC).
SERA addresses EAFB's solid waste; underground storage tank (UST); and petroleum, oil, and lubricant (POL) spill program areas, and does not include sites already addressed in EAFB's Federal Facility Agreement (FFA). FFA sites are subject to the Comprehensive Environmental Response, Compensation, and Liability Act (CERCLA).
SERA requires EAFB to perform any necessary assessment, monitoring, remediation, and closure of solid waste, UST, and POL spill sites identified under SERA, as well as new sites identified subsequent to the issuance of SERA. For all sites in SERA Phase IX, it has been established through previous environmental investigations that a discharge or release has occurred from a known source of contamination (e.g., leaking UST or surface spill).
The goal of the 2001 field program at ST505/9, which was investigated previously during the UST Site Assessment, is to gather additional data that will address data gaps identified by EAFB and allow for evaluation of the potential for site closure.
1.1 Report Outline
This report is divided into the following sections:
o
o
Section 1.0 introduces the report and describes the SERA program, the regional setting, applicable ADEC regulatory requirements, site background, previous investigations, and site objectives.
Section 2.0 summarizes field methods employed in the RI. This section also discusses methods and standards used in data interpretation.
o Section 3.0 describes 2001 fieldwork and discusses all findings to date for the site.
o Section 4.0 provides conclusions of the RI, identifies any remaining data gaps, and provides disposition recommendations for the site.
o Section 5.0 is a list of documents cited in this report .
09000··268--400 1-1 February 2002

fiLE: f3605/A-D DRAWN: SSR
cisCo , :5500 ZIP: 47/01
DATE: , 0/23/01 CHECK: J.D.
lIunlclpallty of Anchorolle
FIGURE 1-1
ST505/9 SITE
LOCATION MAP
1-2
o .5 1 ; i
SCALE IN !AILES
3 CES/CEVR SERA PHASE IX
ELMENDORF" AF"B, ALASKA
ENSR PROJECT #9000-268

SERA PHASE IX ST505/9 RELEASE INVESTIGATION REPORT FINAL
• Analytical results and figures for the previous investigation are presented in Appendix A.
•
•
Boring exploration logs for SERA IX are in Appendix B. Appendix C contains the completed ADEC Matrix Score Sheet for the UST investigation. The SERA IX data assessment report for ST505/9 includes a discussion of data quality and chromatogram interpretations and is provided in Appendix D.
1.2 SERA Phase IX
The approach to SERA fieldwork was based on whether or not a site is located within the groundwater modeled area (Operable Unit 5 [OU5] Model Area) of the EAFB outwash plain (Figure 1-2). Because groundwater quality in the model area is being monitored actively under the terms used to establish OU5, SERA sites within the model area typically do not address dissolved-phase contamination. ST505/9 is within the model area, and therefore the investigation did not focus on the presence of dissolved-phase contaminants in groundwater.
1.3 ADEC Regulatory Requirements
State of Alaska regulations pertinent to the SERA IX RI for ST505/9 include the site characterization/RI and corrective action requirements of Title 18 of the Alaska Administrative Code (MC), Sections 75 and 78 .
1.4 ADEC Underground Storage Tank Regulations
For UST sites with a confirmed release of petroleum product, an RI must be performed in accordance with 18 MC 78.234. ST505/9 is subject to the RI requirements of 18 MC 78 (UST Regulations), including the soil cleanup levels published in 18 MC 75 and commonly known as the Contaminated Sites Remediation Program (CSRP).
The RI regulations require that after initial release abatement is complete, an RI is conducted to characterize the release and the actual or potential threat to human health and safety, and to the environment. If applicable to the site, the RI must include the following (with the applicability to the SERA program also noted):
• Soil samples must be taken to adequately characterize the horizontal and vertical distribution of the release in the soil and to identify soil properties that are likely to influence the type and rate of migration. The UST Site Assessment and the SERA IX investigation were conducted at the site to satisfy this requirement.
1-3 February 2002

SOURCE: Boundaries of Elmendorf End Morain.. and Regional Ground .. ai'er now Patterns Sauth of Elmendorf Woraln. Intarpl'llted From: 1.) C//I/EL 1991 1_", DrGft. "'" Clocial CooIoIIII "nd strali.grIJp.t/ oj 1'r1rl l/ic""""""" A SVnt""*' oj "'" lIJidrogodogV; l'!:u"""""'*. 2.) 1999 " .... val J/opm oj Gn>und_ Sam.pling Activit"" .. ~ JIonitoring a._ JreU Mo.int..na.'n.I:* Progm:m.. Ma.n:h 2000 3.) CeoIogV; JlG1' oj lloa AftC"""",, B-8 SJf Quadro.,.... Mo .. d::a. Yehle. Schmoll tt'hd DobnwoJnv. IMpI.. oj In1fl'f"im'. U .. S. c.ological ~ Opon-F;}.o 11>opm 91-148.
D rJ]]
o ~
ADVANCE OUlWASH DEPOSITS
APPROXIWATE LOCAnON Of ELlIENQORf END MORAINE
WAIN OUlWASH PLAIN
SHIP CREEK AUUVIUI/
_ •• _ OUTWASH PLAN t.lOOEL AREA
\ GENERAL GROUNDWATER now OIREClION
BOUNDARY or OUTWASH PLAIN MODEL ARIUI·-.....I Municipality af Anchoroge
FILE: RGfP / A-D
C/SC: 1 :5500
DATE:
DRAWN: SSR
ZIP: 47/01
CHECK: J.D.
FIGURE 1-2,
REGIONAL GROUNDWATER
F"LOW PATTERNS
1-4
o .5
SCALE IN MILES
3 CES/CEVR SERA PHASE IX
ELMENDORF" AF"B, ALASKA ENSR PROJECT 000-268
•
•
•
SERA PHASE IX ST505/9 RELEASE INVESTIGATION REPORT FINAL
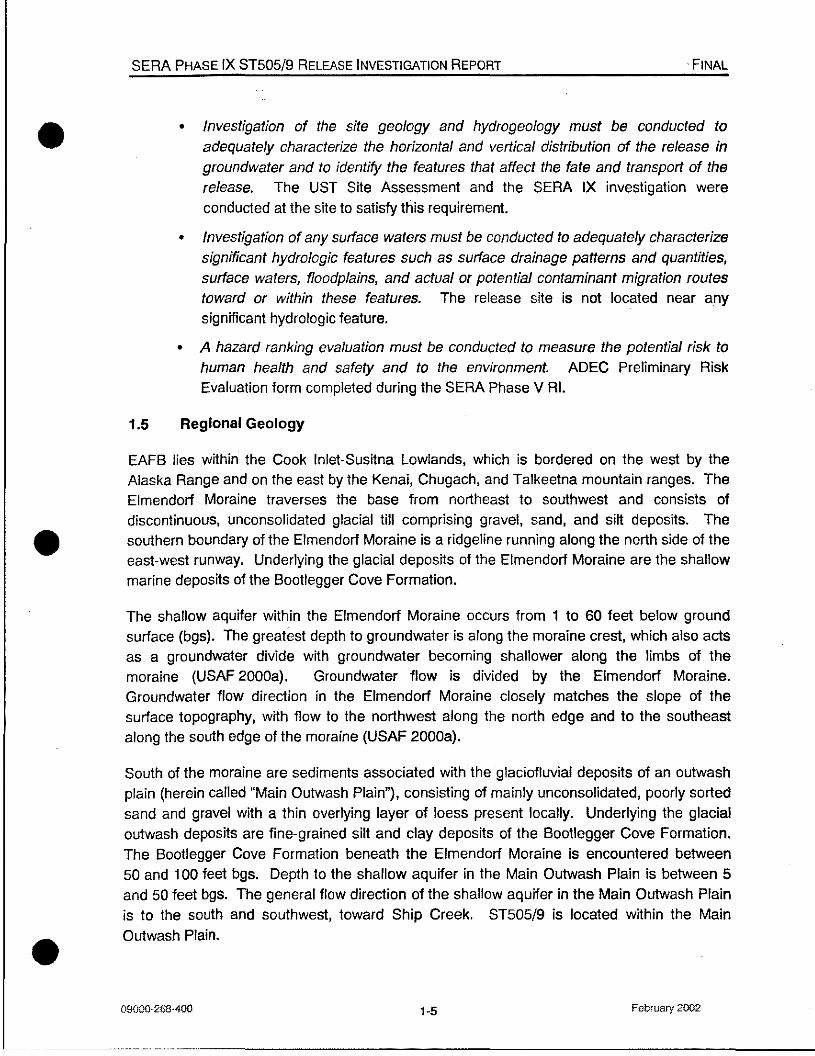
• Investigation of the site geology and hydrogeology must be conducted to adequately characterize the horizontal and vertical distribution of the release in groundwater and to identify the features that affect the fate and transport of the release. The UST Site Assessment and the SERA IX investigation were conducted at the site to satisfy this requirement.
• Investigation of any surface waters must be conducted to adequately characterize significant hydrologic features such as surface drainage patterns and quantities, surface waters, floodplains, and actual or potential contaminant migration routes toward or within these features. The release site is not located near any significant hydrologic feature.
• A hazard ranking evaluation must be conducted to measure the potential risk to human health and safety and to the environment. ADEC Preliminary Risk Evaluation form completed during the SERA Phase V RI.
1.5 Regional Geology
EAFB lies within the Cook Inlet-Susitna Lowlands, which is bordered on the west by the Alaska Range and on the east by the Kenai, Chugach, and Talkeetna mountain ranges. The Elmendorf Moraine traverses the base from northeast to southwest and consists of discontinuous, unconsolidated glacial till comprising gravel, sand, and silt deposits. The southern boundary of the Elmendorf Moraine is a ridgeline running along the north side of the east-west runway. Underlying the glacial deposits of the Elmendorf Moraine are the shallow marine deposits of the Bootlegger Cove Formation.
The shallow aquifer within the Elmendorf Moraine occurs from 1 to 60 feet below ground surface (bgs). The greatest depth to groundwater is along the moraine crest, which also acts as a groundwater divide with groundwater becoming shallower along the limbs of the moraine (USAF 2000a). Groundwater flow is divided by the Elmendorf Moraine. Groundwater flow direction in the Elmendorf Moraine closely matches the slope of the surface topography, with flow to the northwest along the north edge and to the southeast along the south edge ofthe moraine (USAF 2000a).
South of the moraine are sediments associated with the glaciofluvial deposits of an outwash plain (herein called "Main Outwash Plain"), consisting of mainly unconsolidated, poorly sorted sand and gravel with a thin overlying layer of loess present locally. Underlying the glacial outwash deposits are fine-grained silt and clay deposits of the Bootlegger Cove Formation. The Bootlegger Cove Formation beneath the Elmendorf Moraine is encountered between 50 and 100 feet bgs. Depth to the shallow aquifer in the Main Outwash Plain is between 5 and 50 feet bgs. The general flow direction of the shallow aquifer in the Main Outwash Plain is to the south and southwest, toward Ship Creek. ST505/9 is located within the Main Outwash Plain .
1-5 Februari 2002

SERA PHASE IX ST505/9 RELEASE INVESTIGATION REPORT FINAL
South of the Main Outwash Plain is the Ship Creek Alluvium. The Ship Creek Alluvium is • comprised of unconsolidated, fine- to medium-grained sands, with lesser amounts of fine-grained gravel. The Bootlegger Cove Formation is believed to underlie the Ship Creek Alluvium, although the Bootlegger Cove Formation is exposed only in downstream locations (USAF 2000). Depth to the shallow aquifer in the Ship Creek Alluvium varies from zero to 10 feet bgs. The general flow direction of the shallow aquifer in the Ship Creek Alluvium closely matches that of Ship Creek.
North of the Elmendorf Moraine are advance outwash deposits consisting of stratified sand and pebble-and-cobble gravel. The Bootlegger Cove Formation underlies the advance outwash deposits and is exposed along the Knik Arm bluff. The thickness of the advance outwash deposit ranges from 5 to 42 feet along Knik Arm. Groundwater occurs in the advance outwash deposits above the Bootlegger Cove Formation.
Overall, the regional groundwater flow direction north of the moraine is to the northwest toward Knik Arm of Cook Inlet, while the regional groundwater flow direction south of the moraine is to the south and west toward Ship Creek (Figure 1-2). The local groundwater flow direction at the site is to the southwest toward Ship Creek.
1.6 Site Background
Building 14410 (formerly Building 42-300) is associated with the AWACS Hangar and is situated near the aircraft hardstands north of the East-West Runway. The site is a former fueling station for Air-to-Ground Equipment (AGE). The fueling station was located on the south side of the building and included three 2,500-gallon, single-walled USTs (Air Force Identification [AFID] Numbers 306, 307 and 308; also referred to as Storage Tank Management Plan [STMP] Nos. 419, 420, and 424) and an associated fuel dispenser island approximately 15 feet to the west. Tank 419 stored diesel, Tank 420 stored mogas, and Tank 424 stored JP-4. The site remained active for approximately 10 years. The tanks, associated piping, and dispensers were removed in May 1994. During tank removal, no leaks from the tanks were observed, and the tanks appeared to be in good condition, with uniform surface corrosion. The tank excavation was backfilled with stockpiled soils and approximately 25 yards of clean soils. Soil from the dispenser island area was not excavated (USAF 1994b). Previous investigation analytical results and figures are presented in Appendix A.
The depth to groundwater at ST505/9 is 21.9 feet to 22.5 feet bgs. Basewide groundwater monitoring indicates that this aquifer flows to the south-southwest in this area (USAF 1994b). An open drainage ditch and open drain gate were located directly south of the former tanks before the tank excavation. The nearest monitoring well included in the 1999 Groundwater Sampling Event is OU4W-04 located approximately 300 feet east-southeast. The nearest downgradient active well, Base Well 16, is approximately 3,750 feet southwest of the site .
1-6 February 2002
•
•
•
•
•
SERA PHASE IX ST505/9 RELEASE INVESTIGATION REPORT FINAl
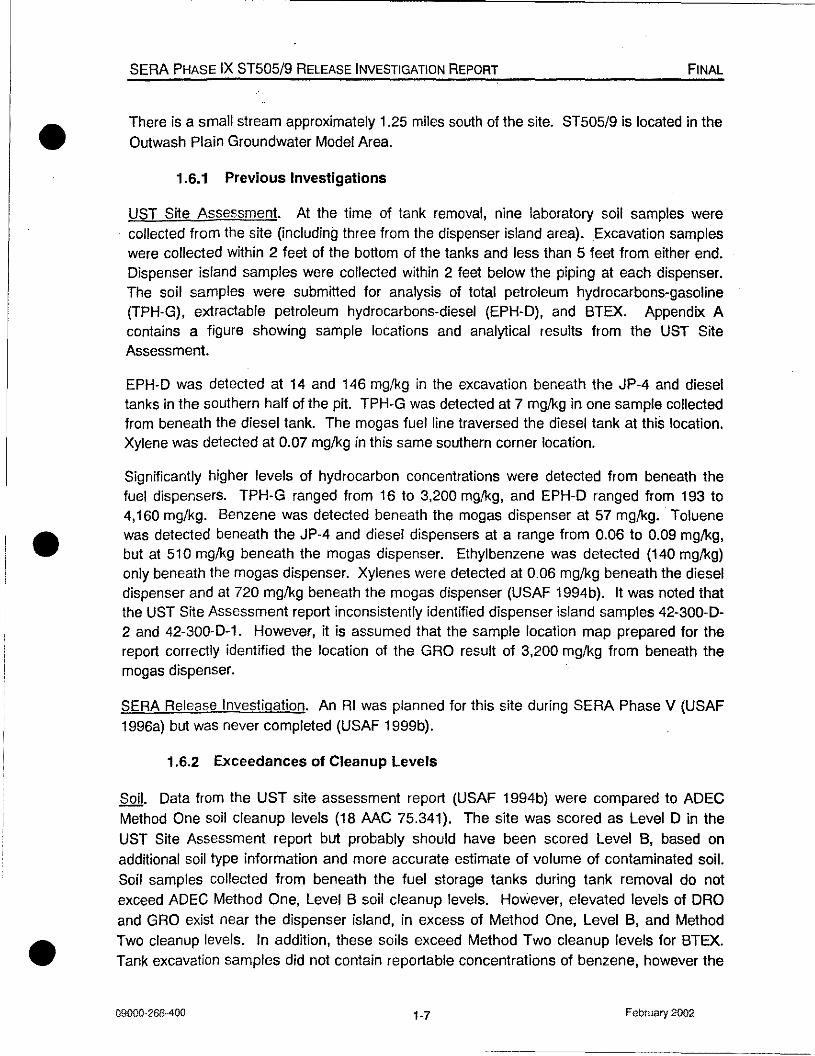
There is a small stream approximately 1.25 miles south of the site. ST505/9 is located in the Outwash Plain Groundwater Model Area.
1.6.1 Previous Investigations
UST Site Assessment. At the time of tank removal, nine laboratory soil samples were . collected from the site (including three from the dispenser island area). Excavation samples
were collected within 2 feet of the bottom of the tanks and less than 5 feet from either end. Dispenser island samples were collected within 2 feet below the piping at each dispenser. The soil samples were submitted for analysis of total petroleum hydrocarbons-gasoline (TPH-G), extractable petroleum hydrocarbons-diesel (EPH-D), and BTEX. Appendix A contains a figure showing sample locations and analytical results from the UST Site Assessment.
EPH-D was detected at 14 and 146 mglkg in the excavation beneath the JP-4 and diesel tanks in the southern half of the pit. TPH-G was detected at 7 mglkg in one sample collected from beneath the diesel tank. The mogas fuel line traversed the diesel tank at this location. Xylene was detected at 0.07 mglkg in this same southern corner location.
Significantly higher levels of hydrocarbon concentrations were detected from beneath the fuel dispensers. TPH-G ranged from 16 to 3,200 mglkg, and EPH-D ranged from 193 to 4,160 mglkg. Benzene was detected beneath the mogas dispenser at 57 mglkg. Toluene was detected beneath the JP-4 and diesel dispensers at a range from 0.06 to 0.09 mglkg, but at 510 mglkg beneath the mogas dispenser. Ethylbenzene was detected (140 mglkg) only beneath the mogas dispenser. Xylenes were detected at 0.06 mglkg beneath the diesel dispenser and at 720 mg/kg beneath the mogas dispenser (USAF 1994b). It was noted that the UST Site Assessment report inconsistently identified dispenser island samples 42-300-D-2 and 42-300-D-1. However, it is assumed that the sample location map prepared for the report correctly identified the location of the GRO result of 3,200 mg/kg from beneath the mogas dispenser.
SERA Release Investigation. An RI was planned for this site during SERA Phase V (USAF 1996a) but was never completed (USAF 1999b).
1.6.2 Exceedances of Cleanup Levels
Soil. Data from the UST site assessment report (USAF 1994b) were compared to ADEC Method One soil cleanup levels (18 MC 75.341). The site was scored as Level D in the UST Site Assessment report but probably should have been scored Level B, based on additional soil type information and more accurate estimate of volume of contaminated soil. Soil samples collected from beneath the fuel storage tanks during tank removal do not exceed ADEC Method One, Level B soil cleanup levels. However, elevated levels of DRO and GRO exist near the dispenser island, in excess of Method One, Level B, and Method Two cleanup levels. In addition, these soils exceed Method Two cleanup levels for BTEX . Tank excavation samples did not contain reportable concentrations of benzene, however the
09000··26BAOO 1-7 February 2002

8ERA PHASE IX 8T505/9 RELEASE INVESTIGATION REPORT FINAL
maximum reporting limit (MRL) of 0.05 mg/kg achieved at that time was greater than the current Method Two benzene cleanup level.
1.7 Objectives of SERA IX Investigation
Based on a review of general site plans and the results of the U8T site assessment, the objectives of the 8ERA IX investigation at 8T505/9 were to:
• Delineate the extent of soil contamination in the vertical and lateral directions in the vicinity of the dispenser island.
• Fill the following specific analytical data gaps: 1) no PAH data for soil has been collected to date at this site; and 2) previous non-detect benzene results were obtained at a MRL in excess of the Method Two migration-to-groundwater soil cleanup level of 0.02 mg/kg and therefore do not allow for determination of whether the Method Two benzene cleanup level has been exceeded.
1-8 February 2002
•
•
•

•
•
•
SERA PHASE IX ST505/9 RELEASE INVESTIGATION REPORT FINAl
2.0 FIELD METHODS
This section summarizes the field methods that were used in the 2001 SERA IX RI. The Work Plan (USAF 2001) was prepared following the guidelines of SERA, AOEC regulations in 18 MC 75 and 18 MC 78, and basewide pOlicies and procedures for fieldwork at EAFB as applicable to environmental compliance projects. Any deviations from the Work Plan and rationale behind sample locations are discussed in this section.
2.1 Initial Activities
The field program was designed to address data gaps identified during the UST Site Assessment. The primary data gap was whether contaminated soil above regulatory cleanup levels exist beneath the former dispenser island and associated piping. Utility clearances were obtained for the site before drilling was conducted, and the building custodian was contacted before work began on site.
Visual inspection of the site was not conducted before drilling activities because of security issues at the AWACS Hangar. Drilling locations were moved slightly from those proposed in the Work Plan because to avoid buried utilities.
2.2 Borings
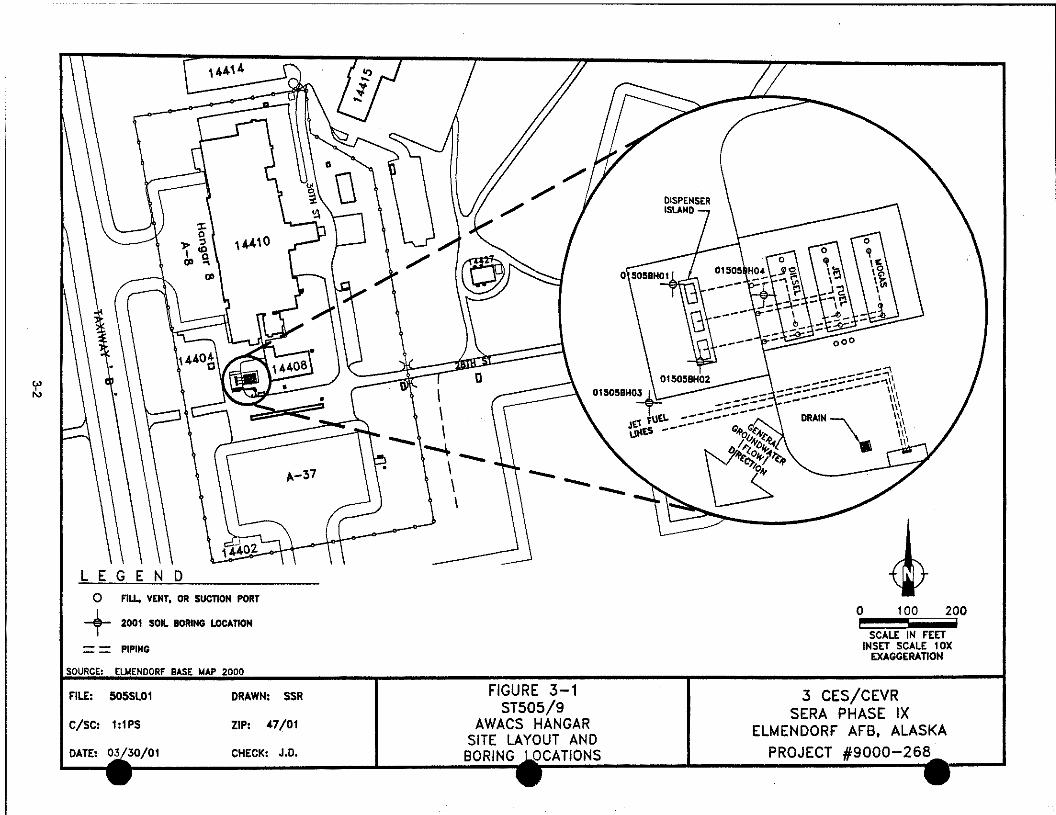
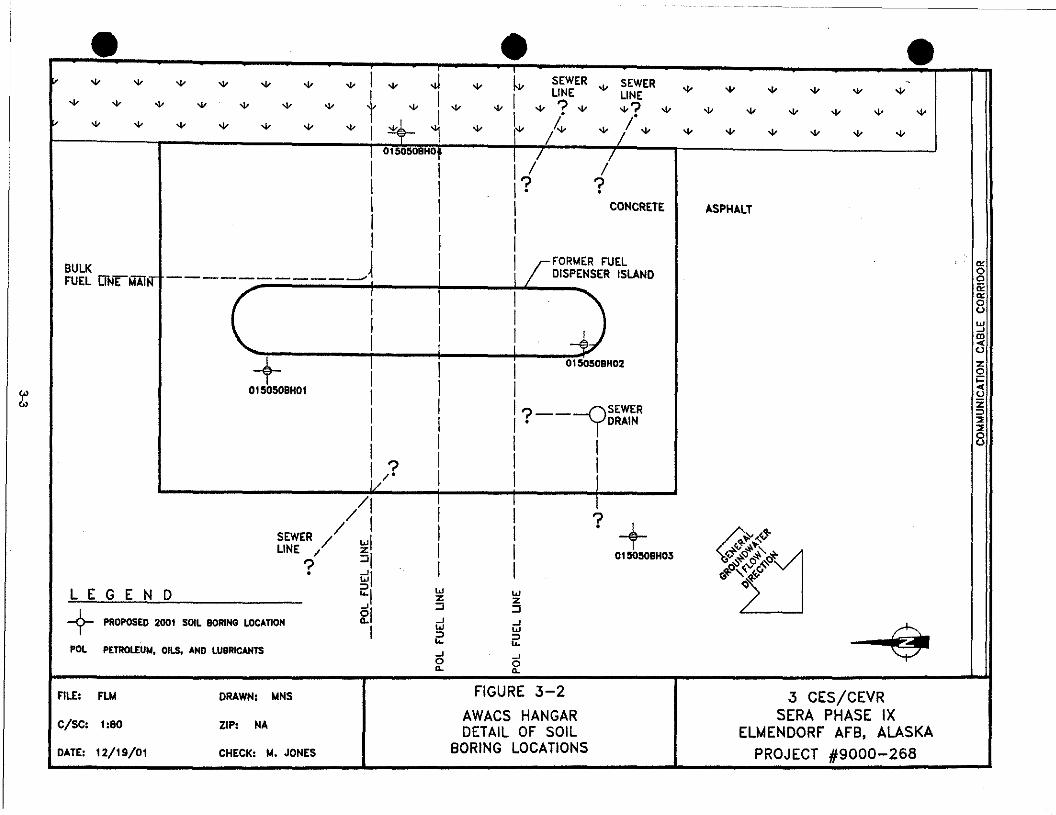
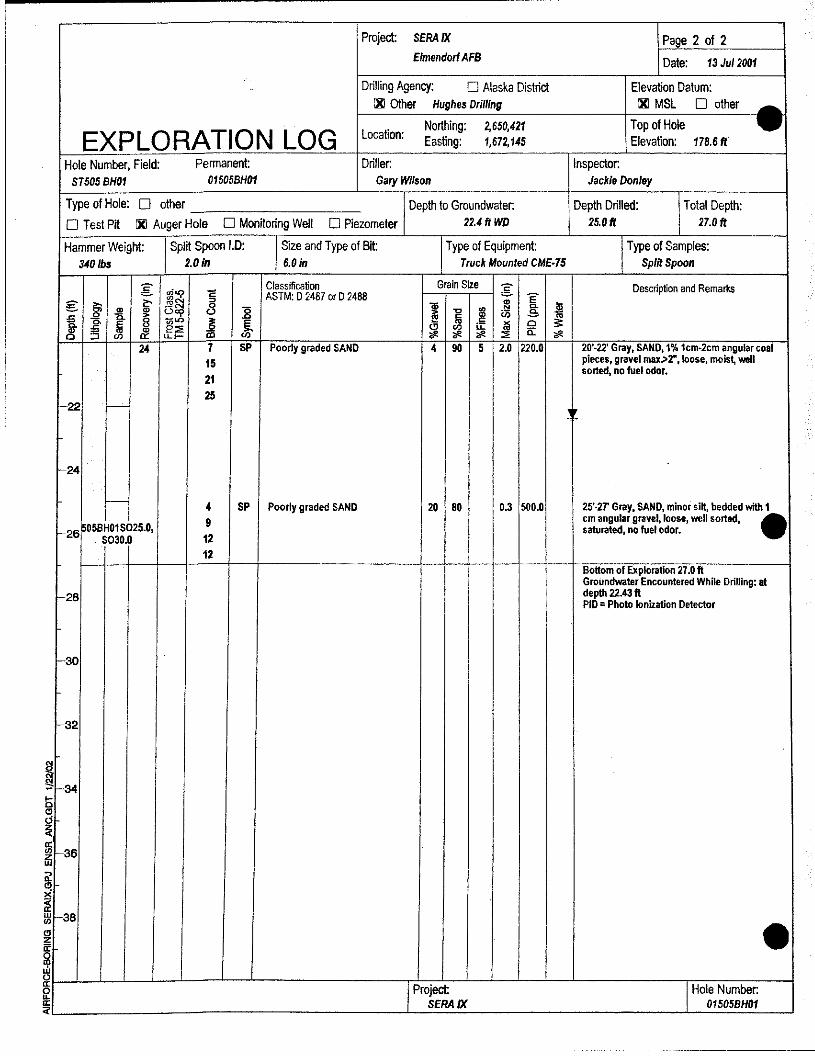
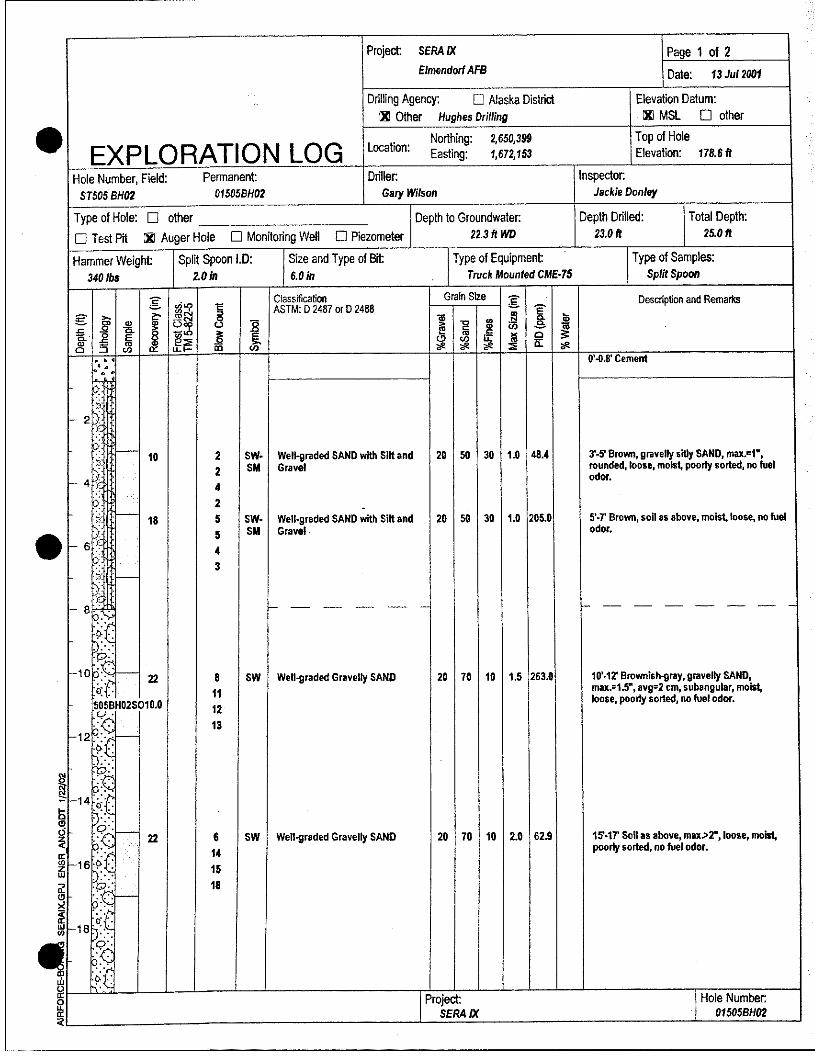
A total of four soil borings were advanced to groundwater during the 2001 investigation in the vicinity of the dispenser island. Two borings (01505BH01 and 01505BH02) were placed as close to the two former diesel and mogas dispensers as possible. The intent of 01505BH01 and 01505BH02 placement was to better characterize any past fuel releases from the dispenser island and piping, as documented during the UST removal. Borings 01505BH01 and 01505BH02 were placed within 4 feet of the dispensers that exhibited elevated concentrations of ORO (4,160 mg/kg) and GRO (3,200 mg/kg) during the UST removal. Boring 01505BH02 was located hydraulically downgradient of the former mogas dispenser. Boring 01505BH01 could not be placed hydraulically downgradient of the former diesel dispenser due to active underground POL fuel lines. Boring 01505BH01 was placed as close as possible to the diesel dispenser island.
The third soil boring, 01505BH03, was placed hydraulically downgradient of both the former dispenser island and the former UST. This location was selected to aid in verifying whether the contamination observed at the dispenser island should be attributed to the island itself, or whether the tanks were additional sources of contaminants.
The fourth soil boring, 01505BH04, was placed between the former dispenser island and the former diesel tank. This placement was selected because a soil sample collected during the UST site assessment from the southern end of the former diesel tank contained ORO at a
2-1 February 2002

SERA PHASE IX ST505/9 RELEASE INVESTIGATION REPORT FINAL
concentration of 146 mg/kg (USAF 1994). Boring 01505BH04 was placed within 5 feet of • this UST removal sample location.
All borings were grouted to 2 feet bgs with Volclay grout slurry. The surface completion of 01505BH01, 01505BH02, and 01505BH03 consisted of placing bentonite chips from 1 to 2 feet bgs and a cement patch from 1 foot bgs to original grade. Boring 01505BH04 was completed with 2 feet of bentonite chips at the ground surface.
Soil boring logs are presented in Appendix B. Groundwater was encountered during drilling between 21.9 feet and 22.5 feet bgs.
Field screening measurements were made and documented for each split-spoon sample collected: the field screening procedure is further described in Section 2.3.1. The soil borings were advanced using a truck-mounted, hollow-stem auger drill rig. Drilling fluids were not used during soil boring installation. The cuttings from the soil borings were placed in 55-gallon drums and disposed of as outlined in Section 2.8, Investigation-Derived Waste Management.
2.3 Sampling Procedures
All soil samples were collected with decontaminated tools (stainless steel spoons, bowls, and split-spoon samplers). Disposable gloves were worn and changed between sample collections. All samples were collected by a "Qualified Person" for environmental sampling, • as defined by ADEC under 18 MC 78.995. Only laboratory certified-clean sample containers were used.
2.3.1 Soil Sampling
Soil samples were collected from boreholes with a split-spoon sampler 2.5 inches in inner diameter, advanced ahead of the auger flights. In general, samples were collected at 5-foot intervals to groundwater. Borings were terminated at groundwater. All soil samples were field screened by using the heated headspace (HHS) method, as follows: A clean 250-milliliter (mL) or larger resealable plastic bag was partially filled (one-third to one-half) with soil immediately after the split-spoon sampler was opened. Headspace vapors were allowed to develop in the bag for at least 10 minutes but less than 1 hour. The container was agitated for 15 seconds at the beginning and end of the headspace development to assist volatilization. The container was maintained at a minimum temperature of approximately 40°F. The field screening instrument, a photo ionization detector (PID) was then sidepunched into the bag, to a point about one-half the headspace depth. Care was taken to avoid uptake of water or soil. The highest meter reading was recorded in the field logbook at the appropriate depth.
HHS samples were collected from all sample intervals. Typically, the following samples • were selected for laboratory analysis:
2-2 February .2002

•
•
•
SERA PHASE IX ST505/9 RELEASE INVESTIGATION REPORT FINAL
1) The sample at or just above the water table •
2) The sample with the highest HHS screening result. and
3) The sample where it appears, based on HHS screening, that the contamination ends.
Samples not chosen for laboratory analysis were placed with the soil cuttings awaiting final disposition. Table 2-1 summarizes sample analyses and laboratory methods.
Soil samples were placed in containers in the following order: 1) GRO/BTEX, 2) ORO/RRO, 3) PAHs, and 4) total organic carbon (TOC).
Samples collected for volatile organic analysis 010A) of GRO and BTEX were collecte~ directly from the sampling device by transferring approximately 25 to 40 mL of core sample into a preweighed. tared sample container, and then immediately field preserved with methanol. Percent moisture determinations for ORO samples were used for the corresponding GRO/BTEX samples. Samples collected for non-volatile organic analysis (e.g., ORO. RRO. PAHs, and TOC) were homogenized before placement in sample jars. Homogenization involved placing soil in a stainless steel bowl and mixing with a stainless steel spoon. All samples (excluding samples for soil classification) were immediately placed in a cooler with freeze packs and maintained at approximately 4°C.
Table 2-1. Sample Analytical Summary for ST505/9 •
Analyte Method Number of Samples·
Soil
Diesel Range Organics/Residual Range Organics AK1 02/AK1 03 12
Gasoline Range Organics/BTEX AK1 01/8021 B 12
Polycyclic Aromatic Hydrocarbons EPA Method 8270C 3
Total Organic Carbon EPA Method 9060 2
Note: 8Number of samples does not include quality assurance, quality control, or blank samples. Key: BTEX = Benzene, toluene, ethylbenzene, and total xylenes. EPA = U.S. Environmental Protection Aoencv .
09000-268-400 2-3 February 2002
SERA PHASE IX ST505/9 RELEASE INVESTIGATION REPORT FINAL
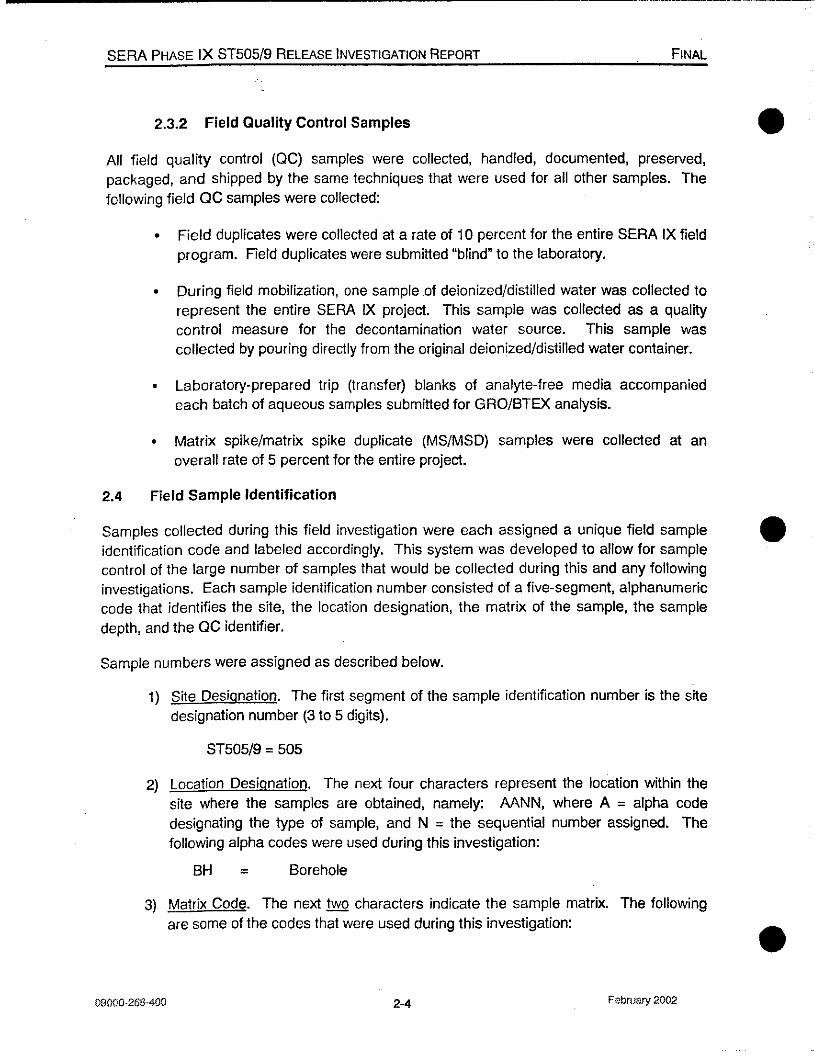
2.3.2 Field Quality Control Samples
All field quality control(QC) samples were collected, handled, documented, preserved, packaged, and shipped by the same techniques that were used for all other samples. The following field QC samples were collected:
• Field duplicates were collected at a rate of 10 percent for the entire SERA IX field program. Field duplicates were submitted "blind" to the laboratory.
• During field mobilization, one sample of deionized/distilled water was collected to represent the entire SERA IX project. This sample was collected as a quality control measure for the decontamination water source. This sample was collected by pouring directly from the original deionized/distilled water container.
• Laboratory-prepared trip (transfer) blanks of analyte-free media accompanied each batch of aqueous samples submitted for GRO/BTEX analysis.
• Matrix spike/matrix spike duplicate (MS/MSD) samples were collected at an overall rate of 5 percent for the entire project.
2.4 Field Sample Identification
•
Samples collected during this field investigation were each assigned a unique field sample • identification code and labeled accordingly. This system was developed to allow for sample control of the large number of samples that would be collected during this and any following investigations. Each sample identification number consisted of a five-segment, alphanumeric code that identifies the site, the location designation, the matrix of the sample, the sample depth, and the QC identifier.
Sample numbers were assigned as described below.
1) Site Designation. The first segment of the sample identification number is the site designation number (3 to 5 digits).
ST505/9 = 505
2) Location Designation. The next four characters represent the location within the site where the samples are obtained, namely: AANN, where A = alpha code designating the type of sample, and N = the sequential number assigned. The following alpha codes were used during this investigation:
BH = Borehole
3) Matrix Code. The next two characters indicate the sample matrix. The following are some of the codes that were used during this investigation:
09000-268.-400 2-4 February 2002
•

•
•
SERA PHASE IX ST505/9 RELEASE INVESTIGATION REPORT
SO
WQ
=
=
Soil
Water quality control matrix
FINAL
4) Sample Depth. For soil samples only, the next set of numerals indicate the depth below the surface to the top of the soil sample collection interval in feet and tenths of feet (e.g., 4.0 or 11.5; this part of the code is used only for soil samples). Field duplicate samples and trip blanks were given fictitious depths so that laboratory personnel were unaware of which primary sample was being duplicated, or whether the sample was a trip blank. .
5) Sample Type. The next set of characters represents the field sample type. The following are some of the codes that were used during this investigation:
EB# = Equipment blank
FD# = Field duplicate
N#
TB#
=
=
Normal environmental sample
Trip blank
The # symbol represents a numeral that was sequentially assigned by additional sample types collected from one location. Laboratory matrix spike (MS) and matrix spike duplicate (MSD) samples were identified together as MS/MSD
sample types.
For a soil sample collected from boring BH01 at site ST505, from 5 to 7.5 feet bgs, the
sample number would be: 50S8H01 SOS.ON1
The following information was included on each sample label for samples submitted for
laboratory analysis:
• Project site
• Project number
• Sample collector name or initials
• Date and time of collection
• Field sample identification codes
• Analyses requested
• Preservation
2.S Sample Packaging and Shipping
Plastic bubble wrap was used to line the bottom of shipping coolers. A thin layer of vermiculite was also placed at the bottom of the coolers to absorb condensation and liquids in the event of bottle breakage. The samples were placed in individual, resealable plastic
bags and wrapped in plastic bubble wrap before placement in the coolers. Samples were
• placed upright in coolers. Chemical ice (blue-ice) cold packs used for cooling preservation
2-5 February 2002

SERA PHASE IX ST505/9 RELEASE INVESTIGATION REPORT FINAL
were additionally placed and isolated in plastic bags. These cold packs were placed around • and on top of the samples to maintain the temperature goal of 4°C. A temperature blank consisting of at least 500 mL water in a high-density polyethylene (HDPE) bottle accompanied every cooler transporting project samples to the laboratory for chemical analysis.. Space between samples in the coolers was filled with packing material so that samples were protected and movement was limited.
Completed chain-of-custody records were placed inside a reseal able plastic bag and secured to the inside of coolers. Coolers were sealed with chain-of-custody tape on the front right and back left corners. Custody seals were Signed by the individual relinquishing the sample, and date and time were recorded. Additionally, the chain-of-custody tape number was recorded on the chain-of-custody record. Packaging tape was placed around the cooler, with a minimum of two full wraps. "This End Up" labels were placed on all four sides, and "Fragile" labels were placed on two sides.
When a transfer of samples occurred, the chain-of-custody record was completed with the name of the person relinquishing the samples, and the person receiving the samples signed and dated the form. Copies of any shipping documentation were retained for the project files.
Sample coolers were shipped by Alaska Airlines Goldstreak delivery to:
Sound Analytical Services, Inc. 4813 Pacific Hwy East Tacoma, WA 98424
2.6 Field and Sample Custody Documentation
Field documentation contains information pertinent to the field sampling program and the equipment preparation efforts. Field documentation was recorded in bound logbooks, and entries were made in indelible ink. Corrections to any documentation were made by drawing a single line through the incorrect entry and initialing the correction. No documentation pages were removed from any field logbooks.
Field documentation was maintained by the field team leader during field activities and transferred to the project files for a record of sampling.
Field and sample custody documentation consisted of the following:
•
• Field activity logbooks. These logbooks were assigned to the field team leader to summarize daily field activities and to document required field briefings (such as health and safety briefings); the field team's activities and observations; the identifiers of the locations of samples collected that day, any unusual occurrences affecting the overall project, weather conditions, etc.; equipment calibration; decontamination; health and safety monitoring (e.g., ambient air monIToring, •
2-6 February 2002
•
•
SERA PHASE IX ST505/9 RELEASE INVESTIGATION REPORT FINAL
•
explosive level monitoring, and other monitoring by field instruments); and subcontractor activities (including performance, downtime, etc.).
Boring log. The boring log (Appendix B) includes the following documentation: the name of the drilling subcontractor; drilling method; rig type and size; equipment diameter; boring number; blow counts; boring diameter; sampling depths; descriptions of lithology; well construction material and diameter; screen type, depth, and size; boring annulus completion material and depth of placement; water levels; well head completion and well security information; collection date; method of collection; heads pace screening results; and any other observation relevant to the investigation. Soil samples were classified by the Unified Soil Classification System (USCS) and were described as indicated in ASTM 0-2488, including color, texture, moisture content, grain texture, sedimentary features, staining, and odors noted during field activities.
• Electronic sample log. The sample log accounts for all samples collected and provides a basis for sample tracking.
• Chain-at-custody records. Chain-of-custody record forms were completed to document each sample sent for laboratory analysis. The chain-of-custody forms summarized sample information (project, sample location, date and time of sampling, sample identifier, and analyses required) and provided a complete record of sample custody, from the point of sampling'through receipt by the analytical laboratory. Samples not submitted to the laboratory were not included on the chain-of-custody forms and were managed in the same manner as the soil cuttings, as described in Section 2.7, Investigation-Derived Waste Management.
• Photography. For base security reasons, no photographs were permitted by EAFB military personnel to be taken around the AWACS Hangar.
• Decontamination Procedures
All field equipment coming in contact with potentially contaminated soil or used for sampling was decontaminated before and after use. Clean, chemical-resistant gloves were worn by persons decontaminating tools and equipment. Soil sampling tools, including split-spoon samplers, were cleaned by the following process:
1) scrub with a brush in a solution of Alconox or Liquinox and water,
2) rinse twice in clean water, and
3) rinse with deionized or distilled water.
Auger flights, rods, and bits were decontaminated by cleaning with high-pressure hot water at the beginning of the project, between boreholes, and before moving off site at the end of the field investigation.
• Specific decontamination procedures for various types of field equipment were as follows:
09000 .. 268-400 2-7 February 2002

SERA PHASE IX ST505/9 RELEASE INVESTIGATION REPORT FINAL
• Well sounders, steel tapes, and water quality probes were washed with a Uquinox and potable water solution, then rinsed with deionized water, and allowed to air dry.
• Personnel decontamination procedures followed the procedures presented in the Site-Specific Health and Safety Plan (SSHP), Appendix B of the Work Plan (USAF 2001).
2.7 Investigation-Derived Waste Management
Soil cuttings generated during this investigation were containerized in drums at the time of drilling. Investigation-derived waste (lOW) soil drums were labeled with permanent marker and labels to show the date and time of sampling, associated soil boring, contents, a drum identification number, and the EAFB point of contact. The containers of soil were transported to the Environmental Staging Facility (ESF) for storage until analytical data for the soil from the borings or wells were received.
Seven drums containing soil cuttings were generated during the SERA IX investigation. Analytical results indicate that no samples collected contain petroleum hydrocarbons above Method One Level A soil cleanup levels. All drums containing soil cuttings from 8T505/9 are considered clean (petroleum hydrocarbon contaminant concentrations are below Category A cleanup levels) and will be spread onto the ground in an area approved by the 3 CES/CEVR.
Water produced during decontamination was containerized in two 55-gallon drums. The containerized decontamination fluid will be processed through the on-site conditioning system at the ESF by the EAFB lOW management contractor. Details on how the conditioning system works are presented in the Basewide Environmental Staging Facility Operation and Maintenance Plan (USAF 1994). After conditioning, the system will discharge the water to the sanitary sewer system for treatment in the Anchorage wastewater treatment system.
Disposable protective clothing, disposable bailers, and other similar supplies were presumed to be nonhazardous and disposed of in dumpsters at EAFB.
2.8 Field Equipment Calibration
A PID with a minimum 10.2-eV (electron volt) lamp (Minirae) was used to field screen soil for volatile compounds. The PIO was calibrated each day before use and recalibrated during the day, as needed (e.g., if PIO drift was noted). The PIO was calibrated in accordance with the owner's manual using a 100-mg/kg (parts per million) isobutylene reference gas and clean ambient air as the zero reference gas. Other field instruments (e.g., Explosimeter) were maintained according to the manufacturer's recommended procedures. The date, time, and results of all calibrations were recorded in the field logbook.
2-8 February 2002
•
•
•

•
•
•
SERA PHASE IX ST505/9 RELEASE INVESTIGATION REPORT FINAL
2.9 Survey
Due to heightened security on EAFB, no preliminary survey data for this site is available. Once access is obtained by ENSR's surveying subcontractor, horizontal and vertical data will be obtained and included in the final report. All borings installed during this investigation will be surveyed by an Alaska-registered surveyor. All survey data established will be relative to the Municipality of Anchorage datum and the USAF identified benchmark (IT AN7) located at EAFB. The vertical datum for this survey will be based on the Alaska State Plan coordinates. The control is the same datum used for the SERA Phase I, II, IV, VII, and VIII investigations.
2.10 Data Interpretation
2.10.1 Field Screening Data
HHS/PID resu~s are considered qualitative data and were used in selecting samples for laboratory analysis and for evaluating whether contamination was present. HHS/PID values in combination with odor and elevated analytical results from associated samples were generally interpreted as positive indicators of petroleum hydrocarbons. Elevated HHS/PID values not accompanied by odor or positive results from laboratory analyses were considered potentially suspect and possibly attributable to interference from natural organic content, moisture, or equipment malfunction .
2.10.2 Comparison to ADEC Soil Cleanup levels - Method One
Soil petroleum hydrocarbon concentrations were initially compared to cleanup levels provided in 18 MC 75.340, Table A1, Method One (ADEC 2000b). Method One provides petroleum hydrocarbon soil cleanup levels based on a site-specific matrix score and can be used to estimate the cleanup action necessary at a site. For example, if Method One, Category A, soil cleanup levels are achieved before groundwater is encountered, the remedial goals for the site can be considered met (subject to ADEC concurrence).
The completed matrix score sheet, provided in Appendix C, indicates a total matrix score of 27 (Category B cleanup levels).
2.10.3 Comparison to ADEC Soil Cleanup levels - Method Two
Soil analytical results were also compared to the chemical-specific, risk-based Method Two soil cleanup .Ievels under 18 MC 75.340 (ADEC 2000b). Under Method Two, bulk petroleum hydrocarbon (e.g., GRO, DRO, and RRO) and chemical-specific (e.g., BTEX and PAH) cleanup levels are determined based on contaminant exposure pathways and the amount of precipitation the site receives. The applicable Method Two cleanup levels proposed for the ST505/9 site (less than 40 inches of precipitation per year) are the ingestion-based and migration-to-groundwater levels which are considered the most
09000··268··400 2-9 February 2002
SERA PHASE IX ST505/9 RELEASE INVESTIGATION REPORT FINAL
stringent of the Table 81 and Table 82 levels. These cleanup levels are provided for comparison purposes in the sample results table in Section 3.2.
2-10 February 2002
•
•
•

•
•
•
SERA PHASE IX ST505/9 RELEASE INVESTIGATION REPORT FINAL
3.0 RESULTS
3.1 2001 SERA IX Field Program
3.1.1 Soil Boring Installation
Three soil borings were installed at former pump islands, and one soil boring was installed at the former diesel UST excavation. No fuel odor was observed in any split-spoon samples collected from soil borings. Elevated HHS readings were, however, obtained from every boring. The highest HHS reading, 847 mg/kg, was obtained from the 5-to·7·foot bgs sample interval in 01505BH03.
Elevated HHS readings were obtained from 01505BH02 at 10 to 12 feet bgs (263 mg!kg), and from 01505BH01 at 15 to 17 feet bgs (210 mg!kg), 20 to 22 feet bgs (220 mg!kg), and 25 to 27 feet bgs (500 mg!kg). These elevated readings were unusual in that the PID exhibited a gradual rise over several minutes to achieve these readings.
All soil borings were abandoned at groundwater. Soils encountered throughout the site were generally sands and gravels.
Figure 3·1 and Figure 3-2 are site layout maps showing the locations of the soil borings .
3.2 Discussion of Findings
3.2.1 Soil Findings
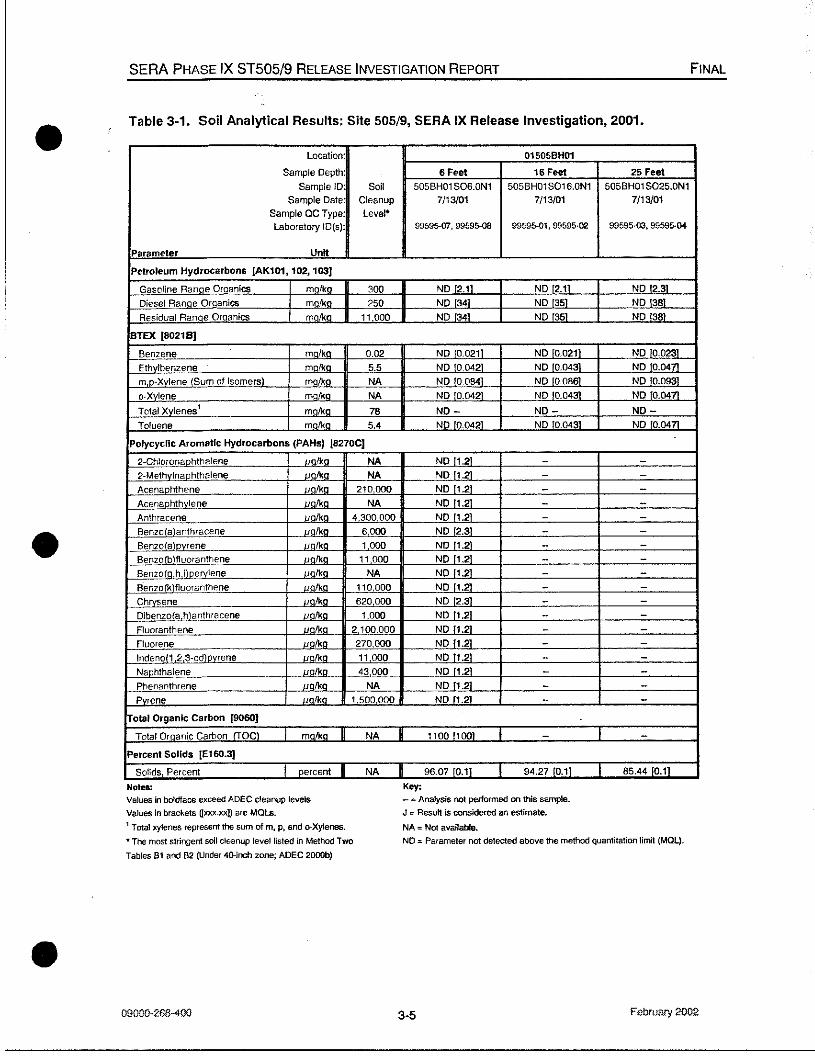
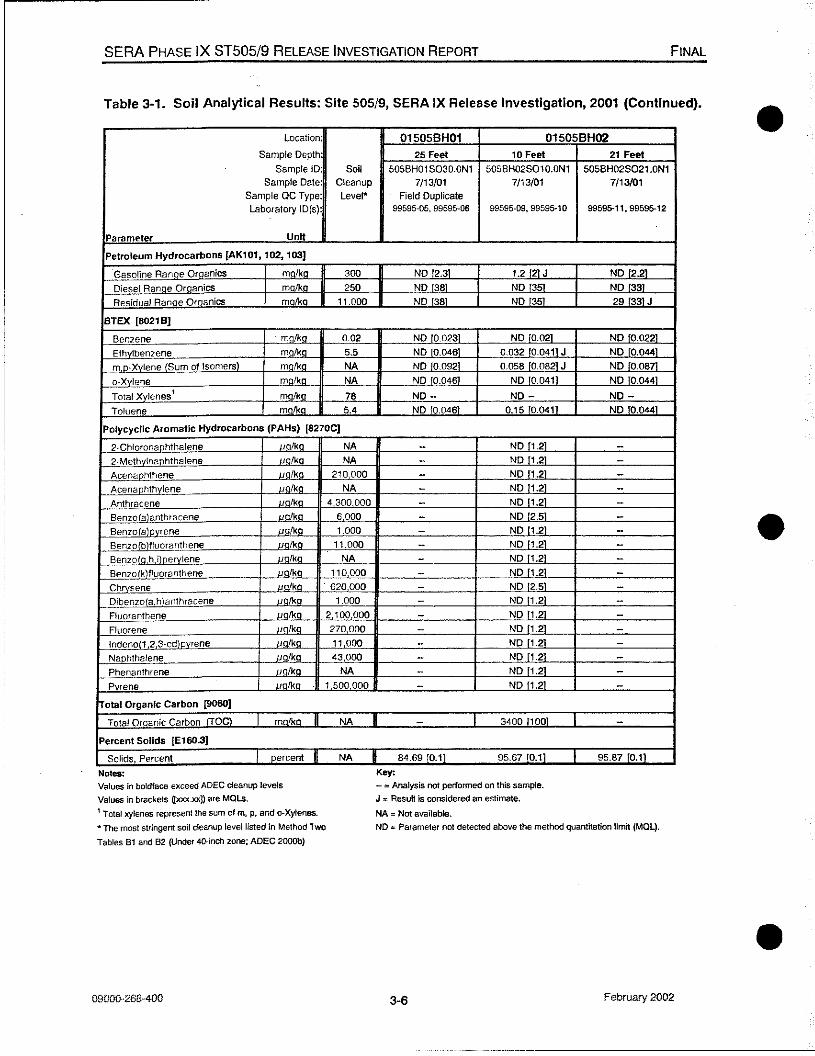
Twelve primary and one duplicate soil samples were collected and submitted for laboratory analysis from the soil borings installed at ST505/9. DRO and PAH analytes were not detected above their respective MRLs for any soil sample submitted for analysis. RRO was detected at a concentration of 29 mg!kg in one sample, below the most stringent Method One, Level A cleanup level of 2,000 mg!kg. For all other samples, reported RRO concentrations were below MRLs. GRO was detected in three soil samples collected from two borings. One soil sample collected from 01505BH02 at 10 feet bgs exhibited a GRO concentration of 1.2 mg!kg, below the most stringent Method One, Level A, cleanup level of 50 mg!kg. GRO was detected in two soil samples collected from 01505BH04 at 10 and 15 feet bgs at concentrations of 1.0 and 1.3 mg/kg respectively. These concentrations are well below the Method One, Level A cleanup level of 50 mg!kg .
09000-268-400 . 3·1 February 2002
LEGEND
o Flu., VENT. OR SUCTION PORT
+ 2001 SOIL BORING LOCAnON
PIPING
FILE: 505SLOI DRAWN: SSR
C/SC: l:lPS ZIP: 47/01
DATE: CHECK: J.D.
FIGURE 3-1 ST505/9
AWACS HANGAR SITE LAYOUT AND BORING
DRAIN~
o 100 200
SCALE IN FEET INSET SCALE lOX
EXAGGERATION
3 CES/CEVR SERA PHASE IX
ELMENDORF AFB. ALASKA
PROJECT #9000-2
!
• • '" I '" ,J
k- '" '" '" '" '" '" '" '" '" '" '" '" '" '" t ~ ~ '" '" l SEWER
LINE '" '" I",? '"
SEWER LINE
I'" /:v "'?
'" /", / I 015050BHOt
I I I I I I I I I I
BULK FUEL DNEWJif
~ I -------------' i
LEGEND
/ i I
~ :! + I I
015050BHOI I I I I I I I I I /? I 1/
i I I I w z ::J
-} PROPOSED 2001 SOIL BORING LOCATION ..J W
POL PETROlEUM. OILS. ANO LUBRICANlS
FILE: Fl.t.t
cisCo 1:80
DATE: 12/19/01
DRAWN: IANS
ZIP: NA
CHECK: IA. JONES
2 ..J o 0..
1/ I? I . I I I
/ ? •
CONCRETE
I r F"ORIAER F"UEL i / DISPENSER ISLAND
I I ! I I
01S050BH02
I ? __ -QSEWER I • T DRAIN
I I
I : I ~ I . + I 015050BH03
I w z ::J ..J W
2 ..J o 0..
FIGURE 3-2
AWACS HANGAR DETAIL OF SOIL
BORING LOCATIONS
• ASPHALT
3 CES/CEVR SERA PHASE IX
ELMENDORF AFB, ALASKA
PROJECT #9000-268
. '" g 0:;
'" 8 ~ ~ <> z
~ <> Z ::> ,. ,. 8

SERA PHASE IX ST505/9 RELEASE INVESTIGATION REPORT FINAL
BTEX analytes were not detected in any samples submitted for laboratory analysis from • 01505BH01 and 01505BH03. In the soil sample from the 10-foot interval in 01505BH02, ethylbenzene, toluene, and xylenes were detected at concentrations of 0.032 mglkg, 0.15 mg/kg, and 0.058 mglkg, respectively. None of these concentrations exceeds the Method Two migration-to-groundwater cleanup levels.
Xylenes and toluene were detected in the 10- and 15-foot bgs samples collected from 01505BH04, at concentrations ranging from 0.03 to 0.054 mglkg. These results are below the xylene Method Two cleanup level. Toluene was detected at range of 0.066 to 0.14 mglkg, also below the Method Two cleanup level.
Table 3-1 shows the SERA IX soil analytical results.
0!.~OOO··268··400 3-4 February 2002
•
•
•
•
•
SERA PHASE IX ST505/9 RELEASE INVESTIGATION REPORT
Table 3-1. Soil Analytical Results: Site 505/9, SERA IX Release Investigation, 2001 •
Location:
Sample Depth: Sample 10' Soil
Sample Date. Cleanup
Sample QC Type: Level'" Laboratory 10(s):
Parameter Unft
Petroleum Hydrocarbons IAK101, 102, 103]
Gasoline Ranoe Oraanics maiko 300
Diesel Range Oroanics maikO 250
Residual Ranqe Orqanics maiko 11000
BTEX [8021 B]
Benzene maiko 0.02
Ethvlbenzene maiko 5.5
m,p-Xylene (Sum of Isomersl maikO NA
a-Xvlene maikO NA
Total Xvlenes1 maiko 78
Toluene maiko 5.4
Polycyclic Aromatic Hydrocarbons (PAHs) 18270C]
2-Chloronaohthalene ualka
2-Methylnaohthalene Halko
Acenaphthene ualka Acenaohthvlene Halko
Anthracene Holka
Senzo(a)anthracene ualka Benzo(a)pvrene ualka
Benzolblfluoranthene uolko
Benzo (Q, h, i) pel)'lene Halko
S"enzolk)fluoranthene ualko
Chrvsene ualko
Dibenzo(a h)anthracene nnlka
F1uoranthene Halko
Fluorene ualko
!ndeno(1 23-cdlovrene Halko
Naphthalene Halko
Phenanthrene ualko
Pvrene nnlkn
otal Organic Carbon [9060]
Total OrQanic Carbon DCI I mnlko •
Percent Solids [E160.3]
Solids, Percent I nereent n Notes:
Values in boldface exceed ADEC cleanup levels
Values in brackets ([xxx.xx)) are MOts.
1 Total xylenes represent the sum of m, p, and o-Xylenes.
NA
NA
210000
NA
4300000
6000
1000
11,000
NA
110.000
620000
1000
2100000
270,000
11 000
43000
NA
1 500.000
NA
NA
• The most stringent soil cleanup level listed in Method Two
Tables 81 and 82 (Under 4(}-Jnch zone; AOEC 2000b)
01505BH01
6 Feet 16 Feet
5058HQ1 SOS.ON1 505BH01SQ16.0N1
7/13/01 7/13/01
99595-07,99595-08 99595-01, 99595-02
NO 12.11 NO 12.11
NO 1341 NO '351
NO 1341 NO 1351
NO 10.0211 NO 10.0211
NO 10.0421 NO 10.0431
NO 10.0841 NO 'O.08m
NO 10.0421 NO 10.0431
NO - NO
NO 10.0421 NO 10.0431
NO 11.21 -NO 11.21
NO 11.21
NO 11.21
NO 11.21
NO 12.31 -NO 11.21 -NO 11.21 -NO [1.21 -NO 11.21 -NO 12.31 -NO 11.21 -NO [1.21 -NO [1.21 -NO [1.21 -NO 11.21 -NO 11.21 -NO '1.21 -
I 110011001 I
I 96.07 10.11 I 94.27 10.11
Key: - '" Analysis not performed on this sample.
J '" Resutt is considered an estimate.
NA '" Not available •
25 Feet
505BH01 SD25.0N1
7113/01
99595-03, 99595-04
NO 12.31
NO 1381
NO '38'
NO 10.0231
NO 10.0471
NO fO.0931
NO 10.0471
NO -
NO 10.0471
-
-
----
-
---
I -
I 85.44 10.11
NO", Parameter not detected above the method quantitation limit (MOL).
FINAL
3-5 February 2002
SERA PHASE IX ST505/9 RELEASE INVESTIGATION REPORT FINAL
Table 3-1. Soil Analytical Results: Site 505/9, SERA IX Release Investigation, 2001 (Continued).
location:
Sample Depth Sample tD: Soil
Sample Date: Cleanup Sample QC Type: Lever Laboratory ID(s):
Parameter Unn
Petroleum Hydrocarbons [AK101, 102, 103]
Gasoline Rance Oraanics maiko 300
Diesel RanQe OrQaniCS maiko 250
Residual Ranoe Oroanics maiko 11.000
BTEX [8021 B]
Benzene malka 0.02
Ethylbenzene maiko 5.5
m,o-Xvlene (Sum of Isomers) malka NA
o·Xylene malka NA
Total Xylenes 1 malka 78
Toluene maiko 5.4
Polycyclic Aromatic Hydrocarbons (PAHs) [8270C]
2·Chloronaphthalene ualka= NA
2·Methvlnaohthalene ualka NA
Acenaohthene ualka 210000
Acenephthylene ualka NA
Anthracene ualka 4300000
Benzola)anthracene ualka 6000
Benzo(a)pyrene ualka 1.000
Benzo(blfluoranthene ualka 11 000
Benzolo.h.llDervlene ualka NA
Benzo (k)fluoranthene ualka '10,000
Chrv5ene ualka . 620000
Dibenzo(a hlanthracene ualka 1.000
Fluoranthene ualka 2100000
Fluorene ualka 270000
lndeno{1 23-cd)ovrene ualka 1'000
Naphthalene ualka 43000
Phenanthrene ualka NA
Pyrene ualka 1 500000
otal OrganiC Carbon [9060]
Total Oroanic Carbon (TOC) I maiko II Percent Solids (E160.3]
Solids Percent I pe"em H
Notes: Values in boldface exceed ADEC cleanup levels
Values in brackets «xxx.x:x]) are MOLs.
, Total xylenes represent the sum of m, p, and o-Xytenes.
"The most stringent soil cleanup level listed in Method Two
Tables 81 and B2 (Under 4Q.-inch zone; ADEC 2000b)
09000 .. 26B-400
NA
NA
01505BH01 01505BH02 25 Feet 10 Feet
505BH01 S030.0N1 505BH02S010.0N1
7113101 7113101
Field Duplicate 99595-05, 99595-06 99595·09,99595·10
NO 12.31 1.2 121 J NO 1381 NO 13<1
NO 1381 NO '351
NO 10.0231 NO 10.021
NO 10.0461 0.032 10.0411 J NO [0.0921 0.058 10.0821 J NO 10.0461 NO 10.0411
NO - NO-
NO 10.0461 0.1510.0411
- NO 11.21
- NO 11.21
- NO 11.21
- NO 11.21
- NO 11.21
- NO 12.51
NO 11.21
NO 11.21
- NO 11.21
NO 11.21
NO 12.51
- NO 11.21
NO 11.21
- NO 11.21
NO 11.21
-- NO 11.21
- NO IU~l
- NO 11.21
I I 3400 11001
I 84.69 10.11 95.67 10.11
Key. - '" Analysis not performed on this sample.
J "" Result is considered an estimate.
NA '" Not available.
21 Feet
505BH02S021.0N1
7113/01
9959&11,99595-12
NO 12.21
NO 1331
29 1331 J
NO 10.0221
NO 10.0441
NO 10.0871
NO 10.0441
NO-
NO 10.0441
---
-----
--
I
I 95.87 10.11
NO '" Parameter nol detected above the method quantitation limit (MOL).
3-6 February 2002
•
•
•

•
•
•
SERA PHASE IX ST505/9 RELEASE INVESTIGATION REPORT FINAL
Table 3-1. Soil Analytical Results: Site 505/9, SERA IX Release Investigation, 2001 (Continued) •
Location.
Sample Depth'
Sample 10: Soil Sample Date. Cleanup
Sample DC Type: Level*" Laboratory IO{s}'
Parameter Unn
Petroleum Hydrocarbons [AK101, 102, 103]
Gasoline Ranoe Oraanics maiko 300
Diesel Ranne Organics molko 250
Residual Aanoe Orqanics maiko 11.000
BTEX [8021 B)
Benzene maiko 0.02
Ethvlbenzene maiko 5.5
m.o-Xvlene (Sum of Isomers) moiko NA
Q-Xylene maiko NA
Total Xylenes' maiko 78
Toluene maiko 5.4
Polycyclic Aromatic Hydrocarbons (PAHs) (8270C)
2-Chloronaohthalene ualko 2-Methvlnaphthalene POlkg AcenaDhthene palko Acenaphth lene ualko Anthracene PQlkg Benzo(alanthracene "alko Benzo(a)ovrene "alko Benzo(b)fluoranthene uolkg Benzo{o.h,i)perylene polka Benzo k)fluoranthene ualka Chrvsene ualkg Dibenzo(a h)anthracene valko Fluoranthene palka Fluorene pglkg Indeno(1 23-cd)pYrene palko Naphthalene ualka Phenanthrene POlkg Pvrene palko
Total Organic Carbon (9060]
Total Oraanic Carbon !TOe) I maiko B Percent Solids {E160.3]
Solids, Percent I pe,cent I Notes: Values in boldface exceed ADEC cleanup levels
Values in brackets axxx,xxD are MOts.
1 Total xylenes represent the sum of m, p, and o-Xylenes.
NA
NA
210000
NA 4300 000
6000
1000
11,000
NA
110000
620000
1000
2100 000
270000
11000
43000
NA 1 500000
NA
NA
'* The most stringent soil cleanup level listed in Method Two
Tables 81 and B2 (Under 4O-inch zone; ADEC 2000b)
09000··268-400
01S05BH02 01505BH03
23 Feet 10 Feet
505BH02S023.0Nl 505BH03S010.0Nl
7/13/01 7/13/01
99595-13,99595-14 99595-15,99595-16
NO 12.21 ND 12.11
NO [36] NO [3S]
NO 1361 NO 13S]
NO 10.0221 NO 10.0211
NO 10.0451 NO 10.0431
NO [009] NO 10.086]
NO 100451 NO 10.0431
NO - NO-
NO 10.0451 NO 10.0431
- -- -- -- -- -- --- -- --- -- -
- -- -
-- -
I - I -
I 89.15 [0.1] I 95.55 [0.1]
Key; - '" Analysis not performed on this sample,
J '" Result is considered an estimate,
NA '" Not available,
3-7
23 Feet
S05BH03S023.0N1
7/13/01
99595-18,99595·19
NO [2.21
NO 1371
ND 1371
NO 10.0221
NO 10.0441
NO [0.0891
NO 10.0441
NO -NO 10.0441
---
-----
-------
I -
I 86.22 [0.1]
February 2002

SERA PHASE IX ST505/9 RELEASE INVESTIGATION REPORT FINAL
Table 3-1. Soil Analytical Results: Site 505/9, SERA IX Release Investigation, 2001 (Continued) .
Location:
Sample Depth
Sample 10 Soil Sample Date. Cleanup
Sample OC Type: Level* Laboratory 10(s):
Parameter Unn
Petroleum Hydrocarbons lAK101, 102, 103]
Gasoline Range Oroanics ma/ka 300
Diesel Ranoe OrQanics mn/ko 250
Residual Ranoe Oroanics ma/ka 11 000
BTEX [8021B)
Benzene ma/ka 0.02
Ethylbenzene ma/ko 5.5
m.o-Xvlene (Sum of Isomers) ma/ka NA
o-Xylene maiko NA
Total Xy!enes1 ma/ko 78
Toluene mo/ko 5.4
Polycyclic Aromatic Hydrocarbons (PAHs) (8270C]
2·Chloronaphthatene ua/ko
2-Methvlnaohthalene HO/kO
Acenaohthene ua/ka Acenaphthylene ua/ka
Anthracene Hn/kn
Benzo{a)anthracene uq/ka .
Benzo(a}pvrene ua/ka Benzo(b)fluoranthene Hn/kn
Benzofo.h.ooervlene ua/ka
Benzo (k)fluoranthene ua/ko
Chrvsene Hn/kn
Dibenzo(a hlanthracene ua/ko
F1uoranthene ua/ka
Fluorene ua/ka
lndeno(1 23-cdlovrene ua/ka Naphthalene ua/ka
Phenanthrene ua/ka
Pyrene ua/ka
otal Organic Carbon [9060]
Total Oroanle Carbon (TOe) I ma/ka I Percent Solids [E160.3]
Solids Percent I p",cent n Notes: Values in boldface exceed ADEC cleanup levels
Values in brackets ([xxx.x.x]) are MQLs.
1 Total xylenes represent the sum of m, p. and o-Xylenes.
NA NA
210000
NA
4300 000
Booo
1000
11 000
NA 110000
620000
1000
2100000
270000
11000
43000
NA 1 500000
NA
NA
,. The most stringent 5011 cleanup level listed in Method Two
Tables 81 and 82 (Under 4O-inch zone; ADEC 2000b)
09000 .. 268 .. 400
01505BH03 01505BH04
5 Feet 10 Feet
505BH03S05.0Nl 505BH04S010.0Nl
7/13/01 7/16101
9959&-20,99595-21, 99619-01,99619·02 99595R21
NO 121 1 121 J
NO 1331 NO 1341
NO 1331 NO '341
NO 10021 NO 10.021
NO 10.0411 NO 10.0411
NO 100811 0.03 10.0821 J
NO 10.0411 NO 10.0411
NO 0.03 -
NO '0.0411 0.OB6 10.0411
- --- -
--- -
- -- -- -- -
-
I I
I 9B.33 10.11 I 9B.n 10.11
Key. - '" Analysis not performed on this sample.
J ::: ResuH is considered an estimate.
NA == Not available.
3-8
15 Feet
505BH04S015.0Nl
7/16101
99619-03,99619.Q4
1.312.11J
NO '341
NO '34'
NO 10.0211
NO 10.0431
0.054 'O.OAAl J NO 10.0431
0.054
0.1410.0431
-
--
---
-
I
I 95.43 10.11
February 2002
•
•
•

•
•
•
SERA PHASE IX ST505/9 RELEASE INVESTIGATION REPORT FINAL
Table 3-1. Soil Analytical Results: Site 505/9, SERA IX Release Investigation, 2001 (Continued) •
Location
Sample Depth'
Sample 10:
Sample Date. Sample ac Type' Laboratory ID(5)
Parameter Unn
Petroleum Hydrocarbons [AK101, 102, 103]
Gasoline Ranoe Omanles maikO
Diesel Ranoe OrQanics malkg
Residual Renne Omanles mnlka
BTEX [8021 B]
Benzene mnlka
E1hvlbenzene mnlko
m,p-Xvlene (Sum of !some;) maikO
a-Xvlene malkg
Total Xylenes1 malkg
Toluene mnlka
Potycycllc Aromatic Hydrocarbons (PAHs) [827OC)
2·Ch!oronaohthalene Halk
2-Methv!nanhthalene Halkn
Acenanhthene ualka
Acenaohthv!ene ualka
Anthracene Hnlk
8enzo{a1anthracene ualkn
Benzofalnvrene ~ Benzofb1fluoranthene Hnlk
Benzo(Q,h,nne~lene Hnlkn
Benzolk)fluoranthene ualka
Chrvsene ualka
Dibenzofa,h)anthracene Hnlk
Fluoranthene unlkn
FluOfene ualka
Indenof1 ,2 ,3-cd) pyrene ualke
Naohthalene Hnlkn
Phenanthrene Hnlkn
Pyrene ualka
!Total Organic Carbon [9060)
Total Omanic Carbon ITI'"lN I malka I Percent Solids (E160.3]
Solids, Percent I a.<c.nt I Notes:
Values in boldface exceed ADEC cleanup levels
Values in brackets (IXlOC.xxD ate MOU.
1 Total xylenes represent the sum of m, p, and o-Xylenes.
* The most stringent soil cleanup level listed in Method Two
Tables 81 and B2 (under 4().inch zone; ADEC 2000b)
Soil
Cleanup
Level*
300
250
11.000
0.02
5.5
NA
NA
78
5.4
NA
NA
210,000
NA
4,300,000
6,000
1,000
11,000
NA
'10,000
620,000
1,000
2,100,000
270.000
11.000
43.000
NA
1 500 000
NA
NA
01S05BH04 Trip Blank
23 Feet -50s8H04S023.0N1 505BH03S015.0N1
7/16/01 7/13/01
Trip Blank 99619-05,99619-06 99595-17
NO [2.31 NO [2.31
NO f371 -NO f371 -
NO 10.0231 NO 10.0231
NO 10.0461 NO-").0471
NO [0.0931 NO 10.0941
NO 10.0481 NO 10.0471
NO- NO-
NO 10.04m NO 100471
NO 11.31 -NO fl.3f -NO 11.31 -NO 11.31 -NO 11.31 -NO 12.61 -NO fl.31 -NO 11.31 -NO 11.31 -NO fl.31 -NO 12.61 -NO 11.31 -NO 11.31 . NO 11.31 -NO 11.31 -NO 11.31 -NO fl.31 -NO fl.31 -
H - I -
g 86.56 10.11 I -Key:
- :: Analysis not performed on this sample.
J :: Result is considered an estimate.
NA :: Not available,
3-9 February 2002
SERA PHASE IX ST505/9 RELEASE INVESTIGATION REPORT FINAL
• This page is left intentionally blank.
•
• 3-10 February 2002

•
•
•
SERA PHASE IX ST505/9 RELEASE INVESTIGATION REPORT FINAL
4.0 CONCLUSIONS
4.1 Summary
Soil samples collected from beneath the fuel storage tanks during the UST removal action were determined not to exceed AOEC Method One. Category B soil cleanup levels. However. elevated levels of ORO and GRO were determined to exist near the dispenser island. in excess of Method One. level B. and Method Two cleanup levels. Tank excavation samples collected during the UST Site Assessment did not contain reportable concentrations of benzene. but the MRl achieved at that time was greater than the current Method Two
benzene cleanup level.
SERA IX analytical results indicate that no soil samples collected from either the tank excavation. dispenser island. or downgradient of these two potential source areas exceed the most stringent Method I. level A. soil cleanup standards for ORO. RRO. or GRO. SERA IX soil borings around the dispenser island were placed within 4 feet of locations where ORO and GRO had been detected previously. The SERA IX boring at the ORO UST was placed
within 5 feet of former ORO detection.
Additionally. no soil samples exceeded their respective Method II cleanup standards for PAH or BTEX constituents. BTEX MRls were achieved at or below the applicable Method Two cleanup standards. Since groundwater is being monitored in the OU5 model area.
groundwater is not addressed under this RI.
4-1 February 2002

SERA PHASE IX ST505/9 RELEASE INVESTIGATION REPORT FINAL
• This page intentionally left blank.
•
• 090110 .. 268-400 4-2 February 2002
•
•
•
SERA PHASE IX ST505/9 RELEASE INVESTIGATION REPORT FINAL
5.0 REFERENCES
Alaska Department of Environmental Conservation (ADEC). 2000a. Alaska Administrative Code (MC), Title 18, Section 78. Underground Storage Tanks. As amended
through August 27.
___ . 2000b. Alaska Administrative Code (MC), Title 18, Section 75. Oil and Other
Hazardous Substances Pollution Control. As amended through October 28.
___ " 1992. State-Elmendorf Environmental Restoration Agreement (SERA). October 1.
U.S. Air Force (USAF). 2000. 1999. Annual Report of Groundwater Sampling Activities, Basewide Monitoring and Well Maintenance Program. March.
___ . 1993. Basewide Environmental Staging Facility Operation and Maintenance Plan. Environmental Restoration Program, Elmendorf Air Force Base, Alaska. March.
___ . 1994b. UST Site Assessment, State of Alaska Underground Storage Tank Register Nos. 306, 307, and 308, Near Building 42-301 (ST505/9). Elmendorf AFB, Alaska
Draft. August 5 .
___ . 2001. SERA Phase IX Release Investigations Work Plan. June 2001.
U.S. Army Corps of Engineers (USACE). 1998. EM1110-1-4000 Monitoring Well Design, Installation, and Documentation at Hazardous, Toxic, and Radioactive Waste Sites.
November .
5-1 February 2002

SERA PHASE IX ST505/9 RELEASE INVESTIGATION REPORT FINAL
• This page intentionally left blank.
•
• 09000-268-400 5-2 February 2002

•
•
•
APPENDIX A
ANALYTICAL RESULTS AND FIGURES FOR PREVIOUS INVESTIGATIONS

- --- - ---- ------------------- -- ------------ - ------ -------------------lIIIII"!I! '
-=i-.~ ,
I11III .. - ~' & .. .. iIIII!I!Ift' iIlIL:l ~ ~ - 1., ' ' I ~' " '.""
TO BUILDING 42 42-301
EPH-O NO 1.,.2 EPH-G ND
EPH-O NO 8 ND ~ T NO r---- V EPH-G NO E NO
~ B NO
~~. X NO ~ T NO
MOGAS E ND X NO
42-300-T-2-1
EPH-O NO EPH-G NO t---- EPH-O 14 B NO r-- V EPH-G NO T NO
~ JET FUEL ~ 8 NO E ND T ND X , NO E ND X NO
-1
EPH-O NO I--r---EPH-G NO EPH-D .1.4!i, r" B NO ~ T ND DIESEL e-- EPH-G 7 B ND E NO T ND X NO E ND X 0,07
DI~;~~ER -1 EPH-D 4,160
~---~ EPH-D 193 EPH-G 16 t- -- EPH-G 3,200
8 ND ~ B 57 T 0,D9 T 510 E ND E 140 X 0.06 X 720
EPH-O NO EPH-G NO B NO T 0.06 'c NO
j X NO
NOTES: TITLE:
'~ SAMPLING LOCATIONS SAMPLES TAKEN AT 2FT BELOW T~ BOTTOMS OF
FIGURE 2 THE TANKS +. +. +. +.
TANK PIT SAMPLES TAKEN ON 17 MAY 1994 +. +. DISPENSER SAMPLES TAKEN ON 19 MAY 1994 +. +.
7'4 +. +. +. '" c. DESCRIPTION: UNDERGROUND STORAGE TANKS
I Jil) '\I \ SCALE 1" = 10FT
AFID NUMBERS 306, 307, & 308

•
• APPENDIX B
SERA PHASE IX BORING EXPLORATION LOGS
•

• EXPLORATION LOG Hole Number, Field:
ST505BH01
Pennanent 01505BHOI
Type of Hole: 0 other ______________ _
Project: SERA IX
Elmendorf AFS
Drilling Agency: 0 Alaska District ~ Other Hughes Drilling
Location: Northing: 2,650,421 Easting: 1,672,145
Driller: Gary Wilson
o Test Pit ~ Auger Hole 0 MonitOring Well 0 Piezometer Depth to Groundwater.
22.4 It WD
Hammer Weight Split Spoon 1.0: Size and Type of Bit: Type of Equipment: 340lbs 2.0 In 6.0 In Truck Mounted CME·75
;[ g >-
I I ~ .c a 1li '" 0 ::J U) , .. '; ..
-10 - 24
1-12~-.~.
~ " N
"'-14·. I-
8 " ~ .~.r- 22
II: •• !1 H 6 ~5~H01S016.0 w ._" ~ . ~ "f--
W~ •• 1 U)-18~
-..
.non ~~ ~::!: m i2::;; u..>-
E 5 u
j
6 11 13
3 8 6 9
4 11 10 12
7 8 8 15
Classification ASTM: 0 2487 or 0 2488
:8 ~
U)
Grain Size g 1 &i
E
I " !ll c. .e
~ ~ if 1;\ 0
~ >f1. >f1. ::;; c:: >f1.
SW- Wellilraded SAND with Si~ and 20 60 20 2.0 7.3 SM Gravel
SW Wellilraded SAND with Gravel 20 70 10 2.0 9.3
- -- -- -- -- -
SP- Poorly graded SAND with Sift 1 80 19 2.0 50.0 SM
- -
GW- Wellilraded Sandy GRAVEL with 70 20 10 2.0 210.0 GM Slit
----------
Page 1 of 2
Date: 13 Jul2001
Elevation Datum: ~ MSL 0 other
Top of Hole Elevation: 178.6 ft
Inspector. Jackie Donley
Depth Drilled: 25.0ft
Total Depth: 27.0 ft
Type of Samples: SpmSpoon
Description and Remarks
0'-0.8' Cement
3'-4.5' Brown, graveHy SANO,max>2"', avg.=1', rounded1loose, poorly sorted, dry. no fuel odor.
5'~T Brown, gravelly SAND, max>2", avg.=1"', loose, poorly sorted, no fuel odor.
I- -- ---- -- ---
10·~12' Gray. interbedded sand and silt, medium sand, gravel 1"·2" , well sorted. moist, no fuel odor. 11.5'-11.T Laminated sill bed.
I- -
15"1T Brown, sandy GRAVEL, graded gravel, fining upward, max>2", avg.=112 em, subangular ~ angular, medium to coarse sand,loose, poorly sorted, moist, no fuel odor. Gradual rise in PIO reading.
-------------
i~-L--~~---L---L----~--L-------------------~P~ro-'l&t~·--~-L--~--~~--------------<7IH~O~le~N-'u-m-'be--r.--~ <L-______________________________________ -L~S=E~RA~IX~ ______________________ ~~O~1=~~5B=H~0~1 __ _J
-------------------------------------~~~~~---~.~~
Project: SERA IX iPage 2 of 2 Elmendorf AFB Date: 13 Jul2001
Drilling Agency: o Alaska District Elevation Datum: iX1 Other Hughes Drilling iX1 MSl o other
EXPLORATION LOG location: Northing: 2,650,421 Top of Hole Easting: 1,672,145 Elevation: 178.6 It
Hole Number, Field: Permanent Driller. Inspector. ST505BH01 01505BH01 Gal}' Wilson Jacki. Donl.y
Type of Hole: 0 other Depth to Groundwater. Depth Drilled: Total Depth: o Testptt iX1 Auger Hole o Monitoring Well o Piezometer 22.4 ft WD 25.0 It 27.0 It
Hammer Weight: Split Spoon 1.0: Size and Type of Bit: Type of Equipment: Type of Samples: 340lbs 2.0 In 6.0 in Truck Mounted eME·75 Split Spoon
§:
I~! " Classification Grain S~e g: Description and Remarks
~. ~ "
ASTM: 0 2487 or 0 2488 '" E
i i i ~ ~ ... c. 2 ."
'" .eo fi '" i\j 0 s: c.!) '" a:: ... ... ... ::;; ... 24 7 Poo~y graded SAND 4 90 5 , 2.0 i220.0 2~'.22: Gr~!,_~~~~,~~~ !""'''''',;;j":'''i,
15 pIeCes, gravel max.>2", loose, mni
21 sorted, no fuel odor.
~2l! r--25
-24
- 4 SP Poo~ graded SAND 20 80 0.3 500.0 25'·2T Gray, SAND, minor 'ilt, bedded with 1
.n 9 em angular grayel, loo,e, well ,orted, -. -"0 12
saturated, no fuel odor.
12
' 27.~ :.'10 Drilling: at
~28 depth 22.43 It PID = Photo Ionization Detector
f-30
-32
~ -34
! ~ f-36
-36 • Project: I Hole Number.
SERA IX 01505BH01
•
... _-------------
EXPLORATION LOG Hole Number, Field:
ST505BH02
Permanent: 01505BH02
Project: SfRA IX
Elmendorf AFB
Drilling Agency: 0 Alaska District !Xl Other Hughes Drilling
L. Northing: 2,650,399
ocalion: Easting: 1,672,153
Driller. Gary Wilson
Type of Hole: 0 other _________ _ Depth to Groundwater. 22.3 ft WD o Test Pit !Xl Auger Hole 0 Monitoring Well 0 Piezometer
Hammer Weight: Split Spoon I.D: Size and Type of Bit: Type of Equipment: 340lbs 2.0 In 6.0 in Truck Mounted eMf·75
Grain Size e ~ -g III ! ~ J e! '" .5
~ 0
~ ~ .... a: ;fJ. ::;; ;fJ.
g >-.8' '8.. ~ i!l
;§: '""( 1: Classification
I JE~ ,3
ASTM: 0 2487 or 0 2488 ., ~::;: :8 1S.
~ E E
'" 12::;; >-<J} ........ m <J}
." •• . .
- 10 2 SW· Well-graded SAND with Sift and 20 50 30 1.0 48.4
2 SM Gravel
4 2 . 5 SW· Well-graded SAND with Sift and 20 50 30 1.0205.0
5 SM Gravel
4
3
- - - - --
8 SW Well-graded Gravelly SAND 20 70 10 1.5 263.0
11 12 13
6 SW Well-graded Gravelly SAND 20 70 10 2.0 62.9
14 15 18
Page 1 of 2
Date: 13 Ju/2001
Elevation Datum: . !Xl MSL 0 other
Top of Hole Elevation: 178.6 ft
Inspector: Jackie Donley
Depth Drilled: 23.0 ft
Total Depth: 25.0 ft
Type of Samples: Split Spoon
Description and Remarks
O',().8' Cement
3'~5' Brown, gravelly silly SAND. max.=1-, rounded, roose, moist, poorly sorted, no fuel odor.
5'-7 Brown, soil as above, moist, loose, no fuel odor.
-- -- - --
10'·12' Brownish-gray. gravelly SAND, max.=1.!1', avg=2 em, subangular, moist, loose, poorly sorted, no fuel odor.
15'·1T Soil as above, max>2"', loose, moist, poorly sorted, no fuel odor.
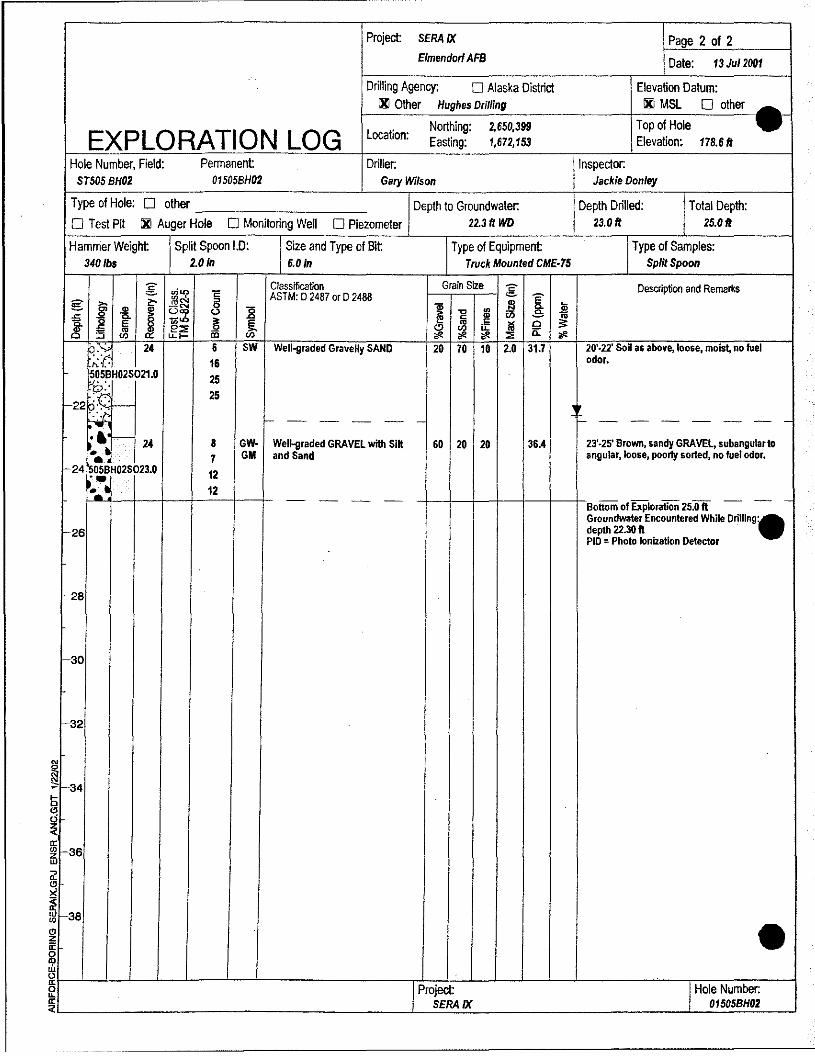
Project: SERA IX Page 2 of 2 Elmendorf AFB Date: 13 Ju12001
Drilling Agency: o Alaska District Elevation Datum: ~ Other Hughes Drilling ~ MSL o other._
FXI t.ORATION LOG location: Northing: 2,6S0,399 Top of Hole Easting: 1,672,153 Elevation: 17Uft
Hole Number, Field: Permanent Driller. Inspector. ST5()S BH02 0150SBH02 Gary Wilson Jackie Donley
Type of Hole: 0 other Depth to Groundwater: Depth Drilled: Total Depth: o Test Pit ~ Auger Hole o MonitOring We/I o Piezometer 22.3 ft WD 23.0 ft 2S.0ft
Hammer Weight Split Spoon 1.0: Size and Type of Bit Type of Equipment Type of Samples: 340lbs 2.0 In 6.0 in Truck Mounted CME·75 Split Spoon
.[
I~~ ~ Classification Grain Size g Description and Remarks
is ~ ASTM: 0 2487 or 0 2488
~ E
f I J. ~ ~ I
c. 2 ,5 .eo '" c. <!) l;! Cl 3: ., !? 0: 0 >f'. :::E >f'.
fJ 51 j Gravelly SAND 20 10 10 , 2.0 31.7 !~~~. SOil as above, loose, moist, no fuel
In 16
t~6 25
-22 25
~ I- - - - - - -- - - - - - -
;~:I 24 8 GW· Welli/raded GRAVEL with SiR 60 20 20 36.4 23'~25' Brown, sandy GRAVEL, subangularto . 7 GM and Sand angular,loose, poorly sorted, no fuel odor.
.n
·~:I 12 12
- - - - .=. - -
t ~;;" •• Drilling. -26 depth 22.30 II
PIO = Photo Ionization Detector
-28
1-30
1-32
~ ~34
~ -36
1-3e • I 'ro~~1X I Hole
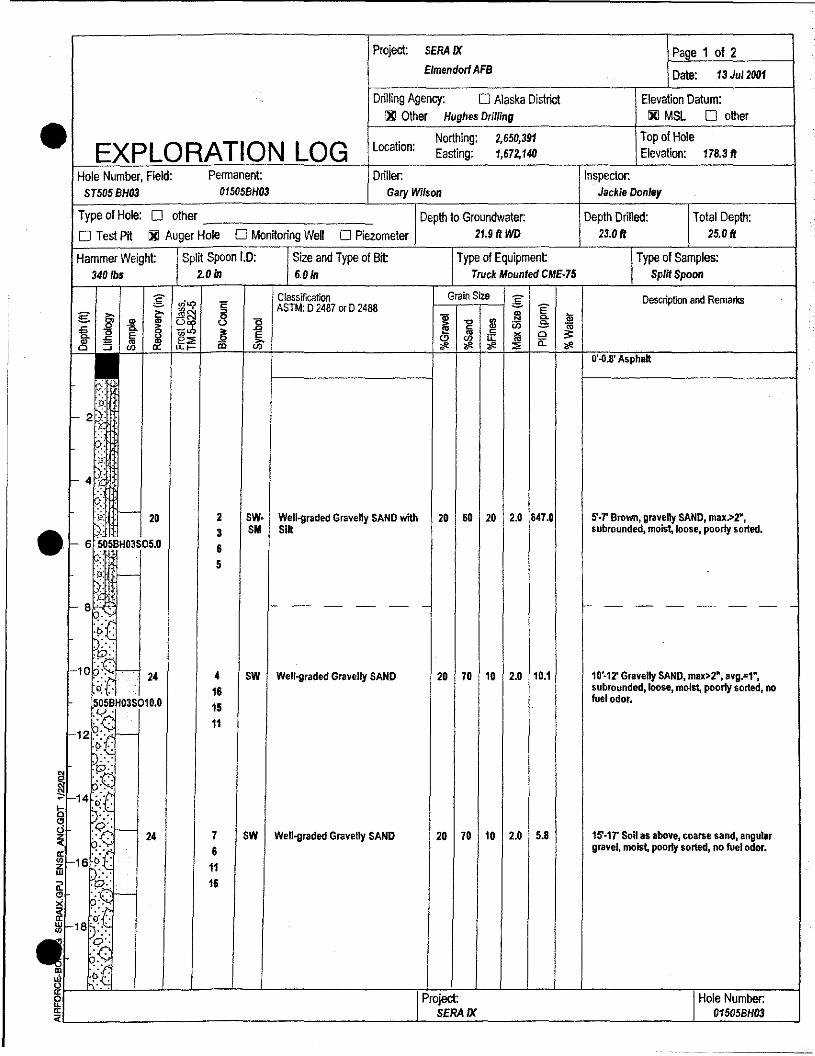
Hole Number, Field: STSOSBH03
Permanent 01S0SBH03
Type of Hole: 0 other ________ _
Project: SERA IX
Elmendorf AFB
Drilling Agency: 0 Alaska District IX1 Other Hughes Drilling
Northing: Easting: Location:
Driller. Gary Wilson
2,6S0,391 1,672,140
o Test PH IX1 Auger Hole 0 Monitoring Well 0 Piezometer Depth to Groundwater.
21.9 If WD
Hammer Weight: Split Spoon I.D: Size and Type of Bit Type of Equipment: 340 Ibs 2.0 in 6.0 In Truck Mounted CME·75
Page 1 of 2
Date: 13 Jul2001
Elevation Datum: IX1 MSL 0 other
Top of Hole Elevation: 178.3 If
Inspector. Jackie Donley
Depth Drilled: 23.0 If
Total Depth: 2S.0 If
Type of Samples: Split Spoon
Description and Remarks '2 • ::i~ Classification Grain Size ;§: _ = ~~ ~ ASTM: 0 2487 or 0 2488 E
i f~i~j~f~~~~~~~r~! ______________ ~+~~~'~i~~_~+~*!~~~~ __________ ~ r=-J 0'-0.8' Asphalt
.~:
-2. k: r.: t~
- 4~
~ r- 20
• I-- 66rj:5i·i~~H03SID5.0 :
24
,.
-- 24
2 3 6 5
4 16 15 11
7 6
11 16
SW· Well-graded Gravelly SAND with SM Slit
1------
SW Well-graded Gravelly SAND
SW Well-graded Gravelly SAND
20 60 20 2.0 1847.0
20 70 10 2.0 10.1
20 70 10 2.0 5.8
r;·r Brown, gravelly SAND, max>2", subrounded, moist, loose, poorly sorted.
1--------
10'·12' Gravelly SAND, max>2", avg.=I", subrounded,loose, moist, poorly sorted, no fuel odor.
15"·1T Soil as above, coarse sand, angular gravel, moist, poorty sorted, no fuel odor.
I Hole

Project: SERA IX Page 2 of 2 Elmendorf AFB Date: 13 Jul2001
Drilling Agency: o Alaska District Elevation Datum: lXIOther Hughes Drilling 1XI MSL o other
EXPLORATION LOG location: Northing: 2,650,391 Top of Hole -. Easting: 1,672,140 Elevation: 178.3 It
Hole Number, Field: Permanent Driller. Inspector. ST505BH03 01505BH03 Gary Wilson Jackie Donloy
Type of Hole: 0 other Depth to Groundwater: Depth Drilled: Total Depth:
o Test Pit 1XI Auger Hole o Monitoring Well o Piezometer 21.9 It WD 23.0 II 25.0 It
Hammer Weight: Split Spoon I.D: Size and Type of Bit Type of Equipment: Type of Samples: 340lho 2.0/n 6.0 in Truck Mounted eME-7S Split Spoon
:5
I! C
Classification Grain S~e g Description and Remarks
f ASTM: 0 2487 or 0 2488
.~ E
~ I J .. 1 "0 ~
c.
fii ~ '" .eo ~ <n l;j ~ '" '" '" ::;
9 S I I Gravelly SAND 20 70 10 2.0 I 13.2 ~~~~,~~I~~la!::., I ; poorly 23 26
~ 26 ~~ -""
N - 24 5 SW Well-graded Gravelly SAND 20 70 10 1.0 12.3 23'~25' Gravelly SAND, angular, max.=1·,
8 avg.=1J2 cm,loose, moderate sorting. •• saturated, no fuel odor .
is 10 12
~Ollom, I 25.0 ~hile Drilling: ~ 1-26 depth 21.90 II
PIO = Photo Ionization Detector '
-2S
-30
1-32
~ -34
~ 1-36
~ i -38
• IPro11~1X I Hole Number.
01S0SBH03
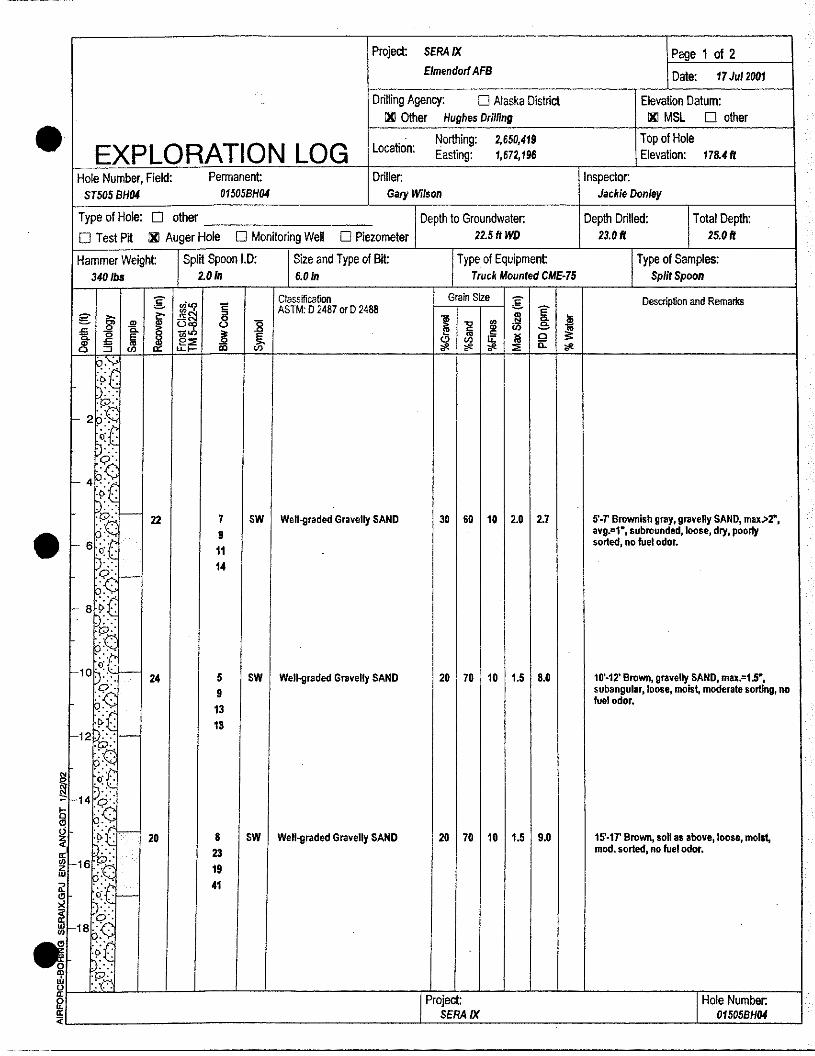
•
.
EXPLORATION LOG Hole Number, Field:
ST505 BH04
Pennanent 01505BH04
Project: SERA IX
Elmendorf AFS
Drilling Agency: 0 Alaska District :xl Other Hughes Drilling
Northing: 2,650,419 Location: Easting: 1,672,196
Driller. Gary Wilson
Type of Hole: 0 other ________ _ Depth to Groundwater. 22.S/t WD o Test PH IXI Auger Hole 0 Monitoring Well 0 Piezometer
Hammer Weight Split Spoon 1.0: Size and Type of 8ft: Type of Equipment: 340 Ills 2.0 In 6.0 In Truck Mounted CME·75
c 0,,/ i
Classification = ASTM: 0 2487 Of 0 2468 g >-
I ~gJ
:8 f ~ ';i:;i; u
~ E ~ E .. '" e::; $ a ::J '" u.t- oo
Grain Size ~
~ gj ~ Ii ~ -g .e. I!! '" if !i\ a C9 ~ * * ::; il: *
7 SW Well-graded Gravelly SAND 30 60 10 2.0 2.7
9 11
14
5 SW Well-graded Gravelly SAND 20 70 10 1.5 8.0
9 13
13
8 SW Well-graded Gravelly SAND 20 70 10 1.5 9.0
23 19
41
Page 1 01 2
Date: 17 Jul2001
Elevation Datum: :xl MSL 0 other
Top of Hole Elevation: 178.4 II
Inspector. Jackie Donley
Depth Drilled: 23.0 II
Total Depth: 25.0 II
Type of Samples: Split Spoon
Description and Remarks
ff~r Brownish gray, gravelly SAND, max.>2"'. avg.=1-, subrounded,loose, dry. poorly sorted, no fuel odor.
10'·12' Brown, gravelly SAND, max.=1E, subangula,. loose, moist, moderate sorting. no fuel odor.
i5'·iT Brown, soil as above,loose, moist, mod. sorted, no fuel odor.

Project: SERA I)( iPage20f2 Elmendoff AFB Date: 17 Ju12001
Drilling Agency: o Alaska District Elevation Datum: IX) Other Hughes Drilling !Xi MSL o other • EXPLORATION LOG Location:
Northing: 2,650,419 Top of Hole Easting: 1,672,196 Elevation: 178.4(1
Hole Number, Field: Permanent: Driller: Inspector: ST50SBH04 0IS0SBH04 Gal)! Wilson JacMe Donl.y
Type of Hole: 0 other Depth to Groundwater: Depth Drilled: Total Depth: o Test PH !Xi Auger Hole o Monitoring Well o Piezometer 22.snwo 23.0n 25.0 II
Hammer Weight Split Spoon 1.0: Size and Type of BH: Type of Equipment: Type of Samples: 3401bs 2.0 In 6.0 In Truck Mounted CME·75 Split Spoon
:?
I~I 1:
Classification Grain Size g Description and Remarks g :;- is ASTM: D 2487 or D 2488
.!!! E
! :8 1 m 0. I u " So
! ~ !\i ~ '" ~ E (!) '" 1il 0 iii l!i 1f!. 1f!. 1f!. ::;; a: 1f!.
W 2 10 SW .. j Gravelly SAND 20 70 10 1.0 4.0 20··22" So~1 aSn:~~~'nr:::x.'1·, avg.04 cm,
22 loose, moist, no I\r
~t3 30
;~ 32
;: )~.: r- 24 7 SW Well-graded Gravelly SAND 20 70 10 1.0 0.8 23'·25' Soil as above, saturated, no fuel odor.
~:¢ 11 -" ..
~( 13 17
~~::::~r I '5.~ ~hile Drilling: •
f-26 depth 22.45 ft PIO :: Photo Ionization Detector
-28
f-30
-32
~ f-34
; -36
i
~ f-38 • Project: Hole Number.
SERA IX 01S05BH04
•
• APPENDIXC
ADEC MATRIX SCORE SHEETS
•
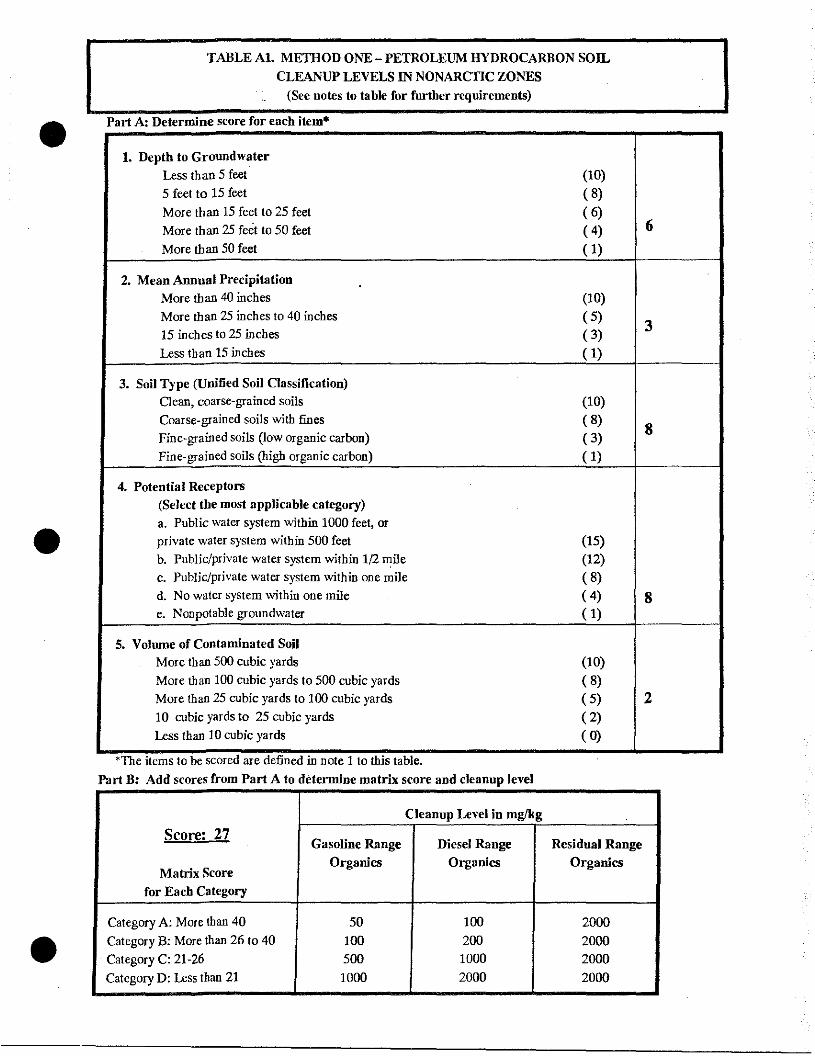
•
•
•
TABLE AI. METIIOD ONE - PETROLEUM HYDROCARBON SOIL
CLEANUP LEVELS 1N NONARCTIC ZONES
(See notes to table for further requirements)
Part A: Determine score for each item·
1. Depth to Gronndwater
Less th an 5 feet (10)
5 feet to 15 feet ( 8) More than 15 feet to 25 feet ( 6) More than 25 feet to 50 feet ( 4)
More than 50 feet ( 1)
2. Mean Armual Precipitation
More than 40 inches (10) More than 25 inches to 40 inches ( 5) 15 inches to 25 inches ( 3) Less than 15 inches ( 1)
3. Soil Type (Unified Soil Classification) Clean, coarse-grained soils (10) Coarse-grained soils with fines ( 8) Fine-grained soils (low organic carbon) ( 3) Fine-grained soils (high organic carbon) ( 1)
4. Potential Receptors (Select the most applicable category)
a. Public water system within 1000 feet, or
private water system within 500 feet (15) b. Public/private water system within 1/2 mile (12) c. Public/private water system within one mile ( 8) d. No water system within one mile ( 4) e. Non potable groundwater (1)
5. Volume of Contaminated Soil More than 500 cubic yards (10)
More than 100 cubic yards to 500 cubic yards ( 8) More than 25 cubic yards to 100 cubic yards ( 5)
10 cubic yards to 25 cubic yards ( 2) Less than 10 cubic yards ( 0)
* The Jlems to be scored are defined ill note 1 to thlS table. .
Part B: Add scores from Part A to determine matrix score and cleanup level
C1eannp Level in mglkg
Score: 27 Gasoline Range Diesel Range Residual Range
Matrix Score Organics Organics Organics
for Each Category
Category A: More than 40 50 100 2000 Category B: More than 26 to 40 100 200 2000 Category C: 21-26 500 1000 2000
Category D: Less than 21 1000 2000 2000
6
3
8
8
2

I
I I I I I I I r I r r I J
r
I -
I I
Tanks AFIDt's 306, 307, 308KATRIX SCORE SHEET
1. Depth to Subsurface Water < 5 feet ( 10) 5 - 15 feet ( 8) 15 - 25 feet ( 6) 25 - 50 feet ( 4) > 50 feet ( 1)
2. Mean Annual Precipitation > 40 inches (10) 25 - 40 inches ( 5) 15 - 25 inches ( 3) < 15 inches ( 1)
3. Soil Type (Unified Soil Classification) Clean, coarse-grained soils (10) Coarse-grained soils with fines ( 8) Fine-grained soils (low ~C) ( 3) Fine-grained soils (high ~C) ( 1)
4. Potential Receptors Public Well within 1000 feet, or Private Welles) within 500 feet (15) Municipal/priv well w/i 1/2 mi (12) Municipal/priv well w/i 1 mile ( 8) No known well. within 1/2 mile ( 6) No known well within 1 mile ( 4) Non-potable groundwater ( 1)
5. Volume of Contaminated Soil > 500 cubic yards (10) 100 - 500 cubic yards ( 8) 25 - 100 cubic yards ( 5) >De Minimis - 25 cubic yards ( 2) De Minimis ( 0)
Cleanup Level in mg/kg
Diesel Gasoline/Unknown Matrix Score TOTAL
i diesel gasoline = 20 , LEVEL D range range
;oet. hydro. pet. hydro. Benzene
Level : --A >40 100 50 0.1 Level B 27-40 200 100 0.5 Level C 21-26 1000 500 0.5
XXLevel D <20 2000 1000 0".5
r
6
f
3
3
8
0
u
(
1\
BTEX
10 15 50
100

•
• APPENDIX D
SERA PHASE IX DATA ASSESSMENT REPORT
•
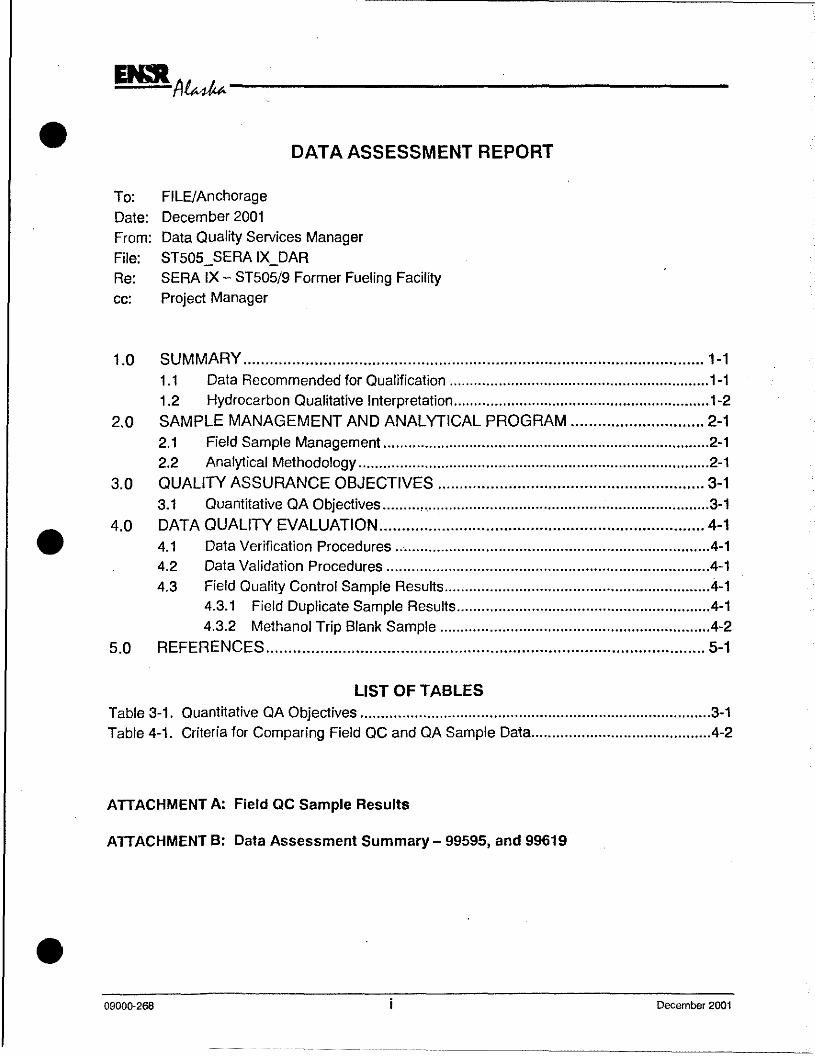
•
•
•
BCRA~-----------------------------
DATA ASSESSMENT REPORT
To: FILE/Anchorage Date: December 2001 From: Data Quality Services Manager File: ST505_SERA IX_DAR Re: SERA IX - ST505/9 Former Fueling Facility cc: Project Manager
1.0 SUMMARy ........................................................................................................ 1-1 1.1 Data Recommended for Qualification ............................................................... 1-1 1.2 Hydrocarbon Qualitative Interpretation ..........................................•................... 1-2
2.0 SAMPLE MANAGEMENT AND ANALYTICAL PROGRAM .............................. 2-1 2.1 Field Sample Management ............................................................................... 2-1 2.2 Analytical Methodology ..................................................................................... 2-1
3.0 QUALITY ASSURANCE OBJECTIVES .........................................................•.. 3-1 3.1 Quantitative QA Objectives .........•... , ................................................................. 3-1
4.0 DATA QUALITY EVALUATION ......................................................................... 4-1 4.1 Data Verification Procedures ........................................................................... .4-1 4.2 Data Validation Procedures ............................................................................. .4-1 4.3 Field Quality Control Sample Results ...............................................•............... .4-1
4.3.1 Field Duplicate Sample Results ............................................................ .4-1 4.3.2 Methanol Trip Blank Sample ................................................................ .4-2
5.0 REFERENCES .................................................................................................. 5-1
LIST OF TABLES Table 3-1. Quantitative QA Objectives " .................................................................................. 3-1 Table 4-1. Criteria for Comparing Field QC and QA Sample Data .......................................... .4-2
ATTACHMENT A: Field QC Sample Results
ATTACHMENT B: Data Assessment Summary - 99595, and 99619
09000-268 December 2001
BCRA~------------------------------
• LIST OF ACRONYMS
ADEC Alaska Department of Environmental Conservation
BTEX Benzene, toluene, ethylbenzene, and total xylenes
C Celsius
DAR Data Assessment Report
ORO Diesel range organic
EDF Electronic deliverable format
EDFIT Electronic Data Format Import Tool
EDMS Environmental Data Management System
ENSR ENSR Corporation
EPA U.S. Environmental Protection Agency
FlO Flame ionization detector
GRO Gasoline range organiC
lCS laboratory control sample
lCSD laboratory control sample duplicate • lGN laboratory group number
MECl Method-established control limits
MQl Method quantitation limit
MS Matrix spike
MSD Matrix spike duplicate
NA Not applicable
NO Non-detected
QA Quality assurance
QAO Quality assurance objective
QAPP Quality Assurance Project Plan
QC Quality control
RPO Relative percent difference
SAS Sound Analytical Services, Inc.
USAEO-AK U.S. Army Engineer District-Alaska
• 09000·268 ii December 2001

•
•
•
BCRA~--~-------------------------1.0 SUMMARY
This Data Assessment Report (DAR) has been prepared for 2001 data collection activities supporting SERA IX Release Investigations at Elmendorf Air Force Base (EAFB), Alaska. Sampling was conducted at the Former Fueling Facility, EAFB, identified as Site 505{9 (ST505{9). Project samples included soil samples collected July 13 and July 16, 2001.
A Quality Assurance Project Plan (QAPP) was submitted (ENSR 2000) prior to data collection activities to outline the analytical program, data quality assurance (QA) objectives, quality control (QC) procedures, and level of effort for data quality assessment.
The objective of this DAR is to determine, through assessment of the data quality assessment samples, as to whether the QA objectives (i.e., goals) outlined in the QAPP were met.
ENSR data management services performed data validation procedures on the analytical results for a systematic and independent verification of method compliance and data quality. As a result of the data validation procedures, validation data qualifier codes are appended to the analytical data when applicable, to describe the bias or any limitations in use of the data. Validation efforts have been documented in the Data Assessment Summaries in Attachment B.
Overall the precision and accuracy of measurement were considered acceptable based upon the evaluation of data quality assessment sample results (field duplicate samples (Attachment A), laboratory control samples, and matrix spike samples) included into the project sampling and analysis scheme. The data quality assessment samples were considered to have met the project QA objectives for accuracy and precision. In summary:
• The data are considered valid as qualified and acceptable for use.
• The completeness objective goal of 95 percent is considered met for the site.
1.1 Data Recommended for Qualification
As a result of data validation procedures, validation data qualifier codes (flags) are appended to the analytical data to help describe the limitations in use of the data.
Data which are recommended to be flagged "J" for target compounds reported between the method detection limit (MOL) and the method quantitation limit (MQl), and are considered estimated values include:
• GRO sample 505BH02S010.0N1 (99595-09) result at 1.2 mg{Kg.
• RRO sample 505BH02S021.0N1 (99595-12) result at 29 mg{Kg.
• BTEX sample 505BH02S010.0N1 (99595-09) results for ethyl benzene at 0.032 mg{Kg, and m,p-xylene at 0.058 mg{Kg .
• GRO sample 505BH04S01 0.ON1 (99619-01) result at 1.0 mg{Kg.
09000·268 1-1 December 2001

~A~--~--------------------------• GRO sample 505BH04S015.0N1 (99619-03) result at 1.3 mg/Kg.
• BTEX sample 505BH04S01 0.ON1 (99619-01) result for m,p-xylene at 0.03 mg/Kg.
• BTEX sample 505BH04S015.0N1 (99619-03) result for m,p-xylene at 0.054 mg/Kg.
These results should be viewed with caution for the possibility of false-positive identification and estimated quantitative value results. BETX target analytes detected were confirmed by secondcolumn chromatography analysis, which enhances a determination of a qualitative presence. Petroleum hydrocarbon gas chromatography analysis (GRO, ORO, RRO), however, has a large possibility in false-positive identifications at values between the MOL and the Mal from inherent identifications made solely on chemical retention time in the analytical system.
1.2 Hydrocarbon Qualitative Interpretation
Gas chromatography traces obtained from the ORO/RRO analysis were reviewed to facilitate hydrocarbon interpretations and define the specific hydrocarbon range of contamination present. Project soil samples were reported as non-detected at the reporting limit.
09000·268 1-2 December 2001
•
•
•

•
•
•
BCRA~~~----~------------~-----
2.0 SAMPLE MANAGEMENT AND ANALYTICAL PROGRAM
2.1 Field Sample Management
Primary project samples collected were analyzed by Sound Analytical Services, Inc. (SAS) located in Tacoma, Washington. At the request of USAED-AK, QA referee samples identified in the QAPP, were not collected.
Samples received at the laboratory were organized as "batches" of samples and are referred to as laboratory group numbers (LGNs). LGNs included batch-specific QC elements to assess the precision and accuracy of analysis.
Laboratory QC samples - consisting of laboratory control samples (LCS), laboratory control sample duplicates (LCSD), matrix spike (MS) samples, and matrix spike duplicate (MSD) samples - were incorporated into the analytical scheme to assess data quality.
Field QC samples were collected during the sampling activities to evaluate field sample handling, transportation, analytical procedures, and total field and analytical variability. The field QC samples consisted of a field duplicate sample, and a trip blank sample for volatiles analysiS. Field QC samples were submitted to SAS as "blind" samples to mask their identity and were analyzed as project samples.
2.2 Analytical Methodology
Analysis methods are defined by U.S. Environmental Protection Agency (EPA) SW-846 (1994, 1996), and Alaska Department of Environmental Conservation (ADEC; 1999) methodology.
09000-268
• Analysis of samples for petroleum hydrocarbons were performed by gas chromatography {GC)technique with flame ionization detectur (FlO). Methodology is defined by State of Alaska (ADEC 1999) as "Method for the Determination of Gasoline Range Organics" (GRO: AK101), "Method for the Determination of Diesel Range Organics" (ORO: AK102), and "Method for the Determination of Residual Range Organics" (RRO: AK103).
• Volatile aromatic compounds benzene, toluene, ethylbenzene, and xylenes (collectively known as the BTEX compounds) were analyzed by applying SW-846 Method 8021 B (EPA 1996) to GRO analysis utilizing in-series photoionization detection before GRO FlO analysis. BTEX compounds reported by SW-846 Method 8021 B were confirmed with second column chromatography in analysis. BTEX soil samples were collected in the field by the high concentration soil method described in EPA SW-846 Method 5035. A representative soil sample (minimum 25 grams) was placed in a pre-weighed jar with a septum-sealed screw-cap. A 25-milliliter volume of methanol (provided in a glass-sealed container) was immediately added to
2-1 December 2001
BCRA~--~--------------------------the sample to maintain hydrocarbon integrity and minimize analyte volatilization prior •
09000-268
to analysis.
• Polycyclic aromatic hydrocarbons (PAHs) were assessed by EPA SW-846 (1996) Method 8270G. The gas chromatography/mass spectrometry (GG/MS) instrument was operated with an ion trap (IT) detector to increase the sensitivity of the method
for PAH target analytes.
• The general chemistry parameter of total organic carbon (TOG) was assessed by
EPA SW-826 Method 9060.
2-2 December 2001
•
•
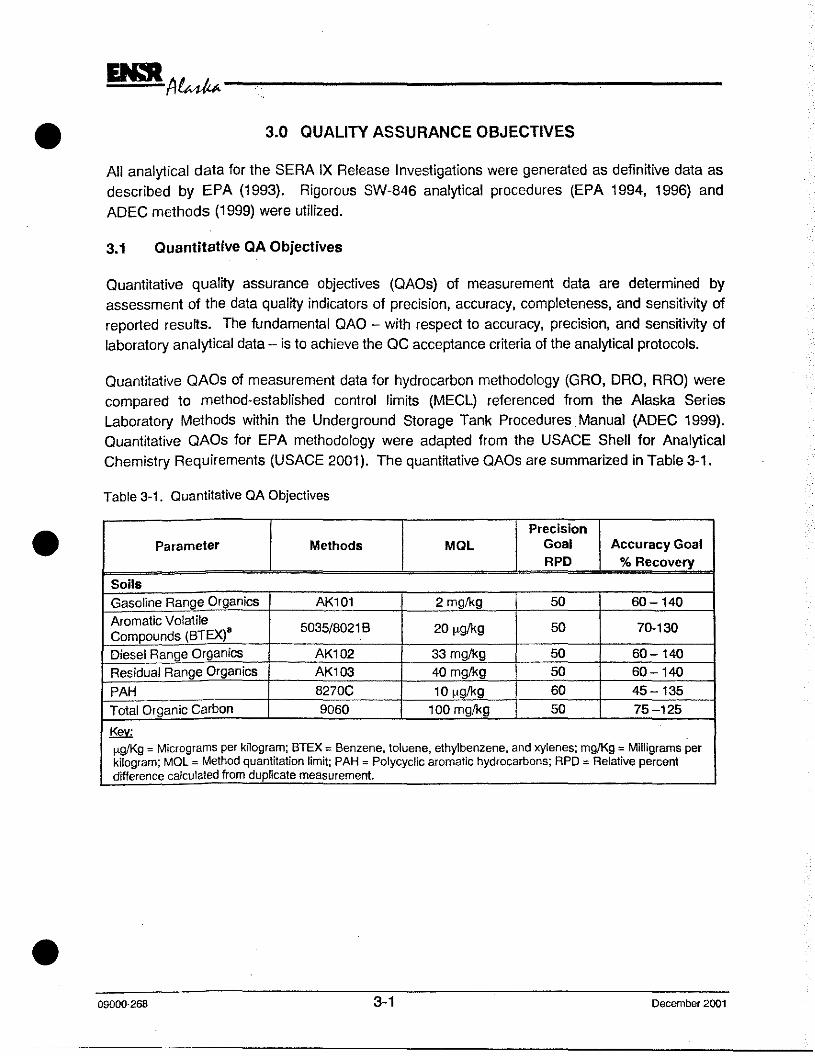
•
•
•
~A~--------------------~-------3.0 QUALITY ASSURANCE OBJECTIVES
All analytical data for the SERA IX Release Investigations were generated as definitive data as described by EPA (1993). Rigorous SW-846 analytical procedures (EPA 1994, 1996) and AOEC methods (1999) were utilized.
3.1 Quantitative QA Objectives
Quantitative quality assurance objectives (QAOs) of measurement data are determined by assessment of the data quality indicators of precision, accuracy, completeness, and sensitivity of reported results. The fundamental QAO - with respect to accuracy, precision, and sensitivity of laboratory analytical data - is to achieve the QC acceptance criteria of the analytical protocols.
Quantitative QAOs of measurement data for hydrocarbon methodology (GRO, ORO, RRO) were compared to method-established control limits (MECL) referenced from the Alaska Series Laboratory Methods within the Underground Storage Tank Procedures Manual (AOEC 1999). Quantitative QAOs for EPA methodology were adapted from the USACE Shell for Analytical Chemistry Requirements (USACE 2001). The quantitative QAOs are summarized in Table 3-1.
Table 3-1. Quantitative QA Objectives
Precision Parameter Methods MOL Goal Accuracy Goal
RPD % Recovery
Soils
Gasoline Range Organics AK101 2 mg!kg 50 60-140
Aromatic Volatile 5035/8021B 2OIlg!kg 50 70-130
Compounds (BTEXla
Diesel Range Organics AK102 33 mg!kg 50 60-140
Residual Range Organics AK103 40 mg!kg 50 60-140
PAH 8270C 10 Ilg!kg 60 45-135
Total Organic Carbon 9060 100 mg!kg 50 75-125
Key: i.lg/Kg = Micrograms per kilogram; BTEX = Benzene. toluene, ethylbenzene, and xylenes; mg/Kg = Milligrams per kilogram; MOL = Method quantitation limit; PAH = Polycyclic aromatic hydrocarbons; RPD = Relative percent difference calculated from duplicate measurement.
09000·268 3-1 December 2001
~------------------------------~
~A~~~-------------------------4.0 DATA QUALITY EVALUATION
Project investigative samples for ST505/9 were received and analyzed by SAS under the LGNs identified as 99595, and 99619. Data assessment summaries for each LGN are presented in
Attachment B.
4.1 Data Verification Procedures
Data verification procedures were performed on each LGN to ensure the competency of the data reported and electronic data archived in the Environmental Data Management System (EDMS). A complete cross-check of laboratory identification numbers with field identification numbers was performed to ensure that analyses had been performed as specified in the chainof-custody documentation. Missing information regarding samples was noted and resolved with
laboratory personnel.
SAS supplied the analytical results in the U.S. Army Corps of Engineers North Pacific Division Electronic Deliverable Format (EDF) Version 1.2a for inclusion in the ED MS. ENSR data quality
management services used Microsoft® Access 98 and Excel 98 to extract data from the verified final EDF for generation of tabulated sampling results. Additional data verification procedures were performed by ENSR comparing the tabulated sampling result tables to the hardcopy analytical report.
4.2 Data Validation Procedures
ENSR data quality management services performed limited data assessment procedures for a systematic and independent verification to determine method compliance and assess data quality. Data assessment was performed from the laboratory-provided sample result sheets and summary QC sheets, and was aided with the data software tools EDFIT (ENSR 2001) and Datastream ™ (Arsenault & Associates 1997) for the additional generation of QC results summary reports (Attachment A).
4.3 Field Quality Control Sample Results
Field QC samples were collected during the sampling activities to evaluate field sample handling, transportation, analytical procedures, and analytical variability. The field QC samples consisted of field duplicate samples and a trip-transfer blank sample for volatile analysis.
4.3.1 Field Duplicate Sample Results
Field duplicate samples were collected and analyzed at the primary laboratory to evaluate both the sample matrix variability and variability in sampling and analytical procedures. Field duplicate samples were submitted as "blind" samples to mask their identity and were analyzed as primary samples.
09000~268 4-1 December 2001
•
•
•

~A~-----------------------------• Field duplicate samples included:
•
•
• 505BH01 S030.0N1 (99595-05) was submitted as a soil "blind" field duplicate of
primary sample 505BH01 S025.0N1 (99595-03).
Field duplicate sample results are presented in Attachment A.
Field duplicate samples were compared to the USAGE (1997) criteria for the comparability of field duplicate results summarized in Table 4-1.
Table 4-1. Criteria for Comparing Field QC and QA Sample Data
Matrix Parameter Disagreement Maior Disagreement
Water and Soil GRO, DRO, Arbitrary (suggest> 3·times Arbitrary (suggest> 5-times RRO difference) difference)
Soil BTEX Arbitrary (suggest> 5-times Arbitrary (suggest> 10-times difference) difference)
Water BTEX,PAH > 2·times difference > 3-times difference
Soil PAH > 4-times difference > 5-times difference
Water BTEX > 2-times difference > 3-times difference
Water and Soil All > 5-times difference when > 10-times difference when one one resuij is less than resuij is less than detection limit detection limit
Water and Soil All > 3-times difference when > 5-times difference when one one resuij is less than result is less than reporting limit reporting limit
Project samples met the USAGE comparability criteria.
4.3.2 Methanol Trip Blank Sample
A methanol trip (transfer) blank sample was included with the volatiles analysis analytical scheme to evaluate potential field- and/or laboratory-introduced contamination from sample handling, transportation, and storage of samples.
• Methanol trip blank sample 505BH03S015.0N1 (99595-17) reported BTEX target analytes by SW-8021 B as non-detected (NO) at the method quantitation limit (Mal).
GRO by AK1 01 was reported as NO at the MOL.
The absence of target analytes indicates that sample handling and transportation procedures were considered acceptable and did not contribute any contamination effect to data collection
activities.
09000-268 4-2 December 2001

~A~--~-------------------------5.0 REFERENCES
Alaska Department Environmental Conservation (ADEC). 1999. Underground Storage Tanks Procedures Manual - Guidance for Remediation of Petroleum-Contaminated Soil ~and Water and Standard Operating Procedures. March 1.
Arsenault & Associates, Inc. 1997. Datastream. Version 1.2. September.
ENSR International (ENSR). 2000. Sampling and Analysis Plan, Part Two: Quality Assurance Project Plan for Release Investigations SERA IX Elmendorf Air Force Base, Alaska. June.
___ . 2001. Electronic Data Format Import Tool (EDFIT). Version 3.0. October
U.s. Army Corps of Engineers (USACE). 1990. Chemical Data Quality Management for Hazardous Waste Remedial Activities.
___ . 1997. Chemical Quality Assurance for HTRW Projects. Engineer Manual, EM 200-1-6. October.
___ . 2001. ·'Shell for Analytical Chemistry Requirements," Appendix I, EM200-1-3, February.
U.s. Environmental Protection Agency (EPA). 1996. SW-846 Test Methods for Evaluating Solid Waste Final Update III, December.
___ . 1993. Data Quality Objective Process for Superfund. Office of Solid Waste and Emergency Response (OSWER), EPA540-R-93-071, September.
1994. USEPA Contract Laboratory Program National Functional Guidelines for OrganiC Data Review. Office of Emergency and Remedial Response. EPA 540/R-94/012. February.
___ . 1996. SW-846 Test Methods for Evaluating Solid Waste. Final Update III, December.
09000·268 5-1 December 2001
•
•
•

•
•
•
~A~-'~--------------------------
ATTACHMENT A
Field QC Sample Results
The U.S. Army Corps of Engineers (USACE) North Pacific Division Electronic Deliverable Format (EDF) Version 1.2a was supplied as ASCII text files containing comma-delimited fields.
The EDF was compiled in Microsoft Access® and extracted by Microsoft EXCEl® 8.0 for generation of tabulated analytical results. A description of the column headings and USACE
valid value codes are provided as:
Field_ID
lab_ID
Analysis
Basis
Parameter
Result
Units
NO
NC
Dilfac
09000·268
Field sample identification number.
laboratory sample identification number.
Analysis Method Designation I Extraction Method Designation.
D = Dry, W = Wet, N = Not Filtered, F = Field-Filtered.
Target analyte, target compound.
Analysis result.
Units of measure.
Not detected at the method quantitation limit (Mal).
Not calculated, duplicate results reported as ND.
Dilution factor of analysis.
December 2001

• FIELD DUPLICATE SAMPLE SUMMARY
Primary Sample oupncate Sample laboratory
Field 10: 505BH01S025.0N1 505BH01S030.0N1 Sound Analytical Services, Inc •• Tacoma, WA
Lab 10: 99595-03 99595-03
Duplicate Pair Results
Parameter Basis Primary (RUDUQil) Duplicate (RUDUDiQ unn. RPO Comment
AK101 I METHOD Gasoline Range Organics 0 NO (2.3/1.2/1) ND(2.3/1.2/1) mglkg NC NO
AK102 I METHOD Diesel Range Organics 0 NO(38/19/1) ND(38/19/1) mglkg NC NO
AK103 I METHOD Residual Range Organics 0 NO (38/20/1) ND(38/20/1) mglkg NC NO
SW8021B I SW5030B Benzene 0 NO (0.0231 0.0093/1) NO (0.0231 0.0092/1) mglkg NC NO
Ethylbenzene 0 NO (0.047/0.0093/1) NO (0.0461 0.009211) mglkg NC NO
m,p-Xylene (Sum of Isomers) 0 ND (0.093/0.019/1) NO (0.0921 0.01811) mglkg NC NO
o-Xylene 0 NO (0.047 I 0.0093/1) NO (0.046/0.0092/1) mglkg NC NO
Toluene 0 NO (0.047/0.0093/1) NO (0.046/0.0092/1) mglkg NC NO
•
• RL = repor1ing limit, Dl = declion limit. Oil = dilution Facler, RPD = relative percent difference.
Attachment A • Page 1 of 1

BCRA~--~-------------------------
• ATIACHMENTB
Data Assessment Summary
•
• 09000-268 Oecember 2001
•
•
•
Data Assessment Summary
Lab Report #: 99595 Laboratory:
Location SERA IX Release Investigations COC#:
1.1 Sample Receipt and Integrity
Twenty-one soil samples were received at SAS on 7/18/01 for analysis.
SAS
EOOOOll
The temperature of the temperature blank representative of project sample temperatures within the cooler received at the laboratory were recorded as:
• 99595 @ 2.8 °C.
1.2 Corrective Actions
• None
1.3 Data Recommended for Qualification
Sample results reported below the MOL has been recommended to be flagged "J" and be considered an estimated values for:
October 2001
• GRO sample 505BH02S010.0Nl (99595-09) result at 1.2 mg/Kg .
•
•
RRO sample 505BH02S021.0Nl (99595-12) result at 29 mg/Kg.
BTEX sample 505BH02S010.0Nl (99595-09) results for ethylbenzene at 0.032 mg/Kg, and m,p-xylene at 0.058 mg/Kg .
Page 1

Lab Report I:
Location
Data Assessment Summary
99595 Laboratory:
SERA IX Release Investigations COCI:
SAS
E000011
1.4 Diesel Range Organics / Residual Range Organics Analysis
RRO sample results reported below the method quantitalion limit (MOL or reporting limn), and
above the method detection limit (MOL) have been recommended to be flagged "J" and be
considered an estimated values in samples:
• RRO sample 505BH02S021.0Nl (99595-12) result at 29 mg/Kg.
Holding Times: Analytical holding times were mel in sample arwlysis.
Method Blanks: ORO and RRO meillod blank resutis were reported as non-detecled at the reporting limiJ (MOL) of 33 mg/Kg.
Laboratory Control Samples: ORO ana/yto recovery in LCS analysis were compared to tile method-established control limit (MECL) of 75 to 125 percent and 20 percent RPD in measurement. RRO analyte recovery in LCS analysis were compared to the LECL of 60 to 120 percent and 20 percent RPD in measurement.
Lab_ID Analyte % Rec % Rec
RPD Notes LCS LCSD
SDS0359 DRO 99 105 5.9
SDS0359 RRO 93.5 96.7 3.4 .
Matrix Spike i Matrix Spike Duplicates: ORO ana/yle recovery in MS and MSD analysis were compared to the MECL of 75 to 125 percent recovery end 30 percent RPD in measurement RRO analyte recovery in MS and MSD analysis were compared to the MECL of 50 to t50 percent recovery end-50 percent RPD in measurement.
Malrix spike sample was performed on site-specific sample 505BH03S010.0Nl (99595-16).
Lab_ID Field_ID Analyte % Ree % Ree RPD Notes
MS MSD
99595-16 505BH03S010.0N1 DRO 109 1112 2.7
99595-16 505BH03S010.0N1 RRO 104 108 3.8
Matrix Duplicates: DRO and RRO results in matrix duplicate (MD) analysis were reported for an relative assessment of sample homogeneity.
Lab ID Field ID Analyte Resutt Result RPD Notes
99595-04 505BHOI S025.0Nl DRO ND ND NC
99595-04 505BH01S025.0Nl RRO ND ND NC
Surrogate Compoui1ds: ORO surrogate compound (o-terphenyl) and RRO surrogate compound (n-triacantane-d62) recovery in analysis were compared to the MEeL of 50 to 150 percent. Surrogate compounds in project samples met the LECL in recovery.
October 2001 Page 2 99595_DAS.doc
•
•
•
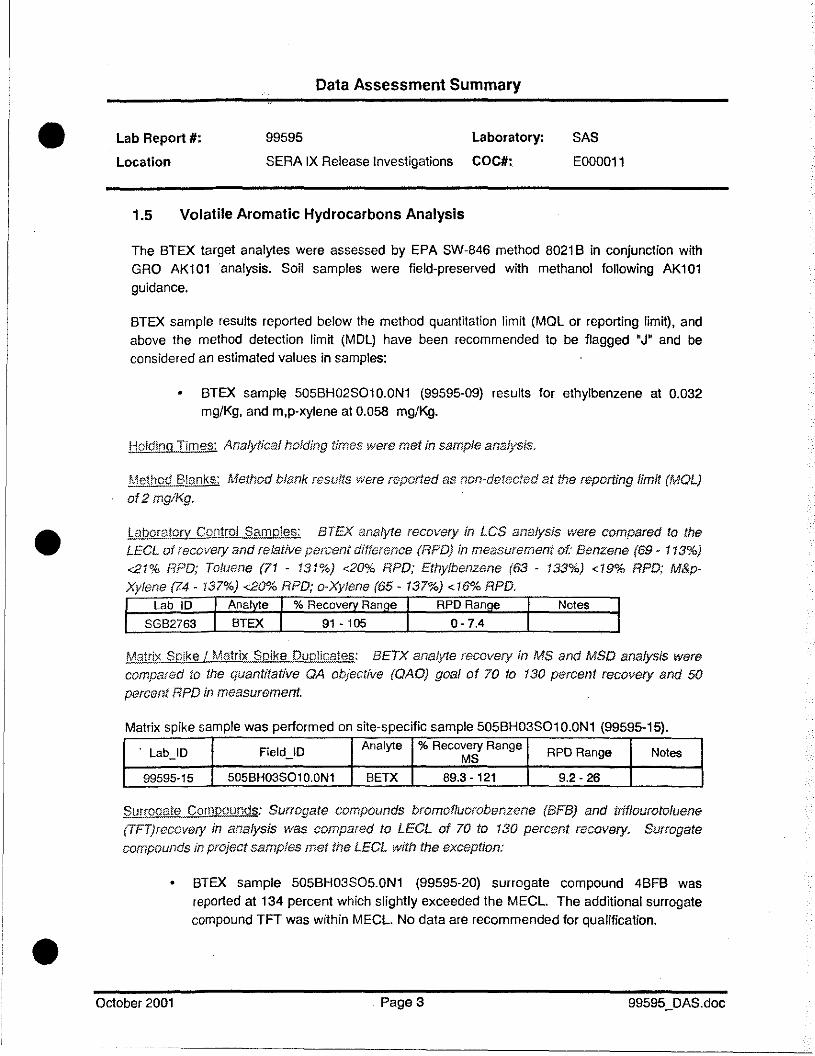
•
•
•
Data Assessment Summary
Lab Report #: 99595 Laboratory:
Location SERA IX Release Investigations COC#:
1.5 Volatile Aromatic Hydrocarbons Analysis
SAS
EOOOO11
The BTEX target analytes were assessed by EPA SW-846 method 8021 B in conjunction with GRO AK1 01 analysis. Soil samples were field-preserved with methanol following AK101
guidance.
BTEX sample results reported below the method quantitation limit (MOL or reporting limit), and above the method detection limit (MOL) have been recommended to be flagged .. J" and be considered an estimated values in samples:
• BTEX sample 505BH02S010.0N1 (99595-09) results for ethylbenzene at 0.032 mg/Kg, and m,p-xylene at 0.058 mg/Kg.
Holdinq Times: Analytical holding times were met in sample analysis.
Methcd _Rlanks: Method blank results were reported as non-detected et the reporting limit (MOL)
of2 mO/Kg.
j.abora!Ory Control Samples: BTEX analyte recovery in LCS analysis were compared to the LECL of recovery and relative percent difference (RPD) in measurement at· Benzene (69 - 113%) <21% RPD; Toluene (71 - 131%) <20% RPD; Ethylbenzene (63 - 133%) <19% RPD; M&pXylene (74 - 137%) <20% RPD; a-Xylene (65 - 137%) <16% RPD.
Lab 10 Anal e % Recave Ran e RPO Ran e Notes
8GB2763 91 - 105 0 - 7.4
Matrix Spike! Matrix Spike Duplicates: BETX analyle recovery in MS and MSO analysis were compared to the quantitative OA objective (OAO) goal of 70 to 130 percent recovery and 50 percent RPD in measurement:
Matrix spike sample was performed on site-specific sample 505BH03S010.0N1 (99595-15).
. Lab_IO Field_ID Analyte % Recovery Range RPO Range Notes MS
99595-15 505BH03S010.0N1 BETX 89.3 - 121 9.2 - 26
Surrogate CQmpounds: Surrogate compounds bromofluorobenzene (BFB) and Idtlourotoluene (TFT)recovery in analysis was compared to LEeL of 70 to 130 percent recovery. Surrogate compounds in project samples met the LEeL with the exception:
• BTEX sample 505BH03S05.0N1 (99595-20) surrogate compound 4BFB was reported at 134 percent which slightly exceeded the MECL The additional surrogate compound TFT was within MECL No data are recommended for qualification .
October 2001 Page 3 99595_0AS.doc
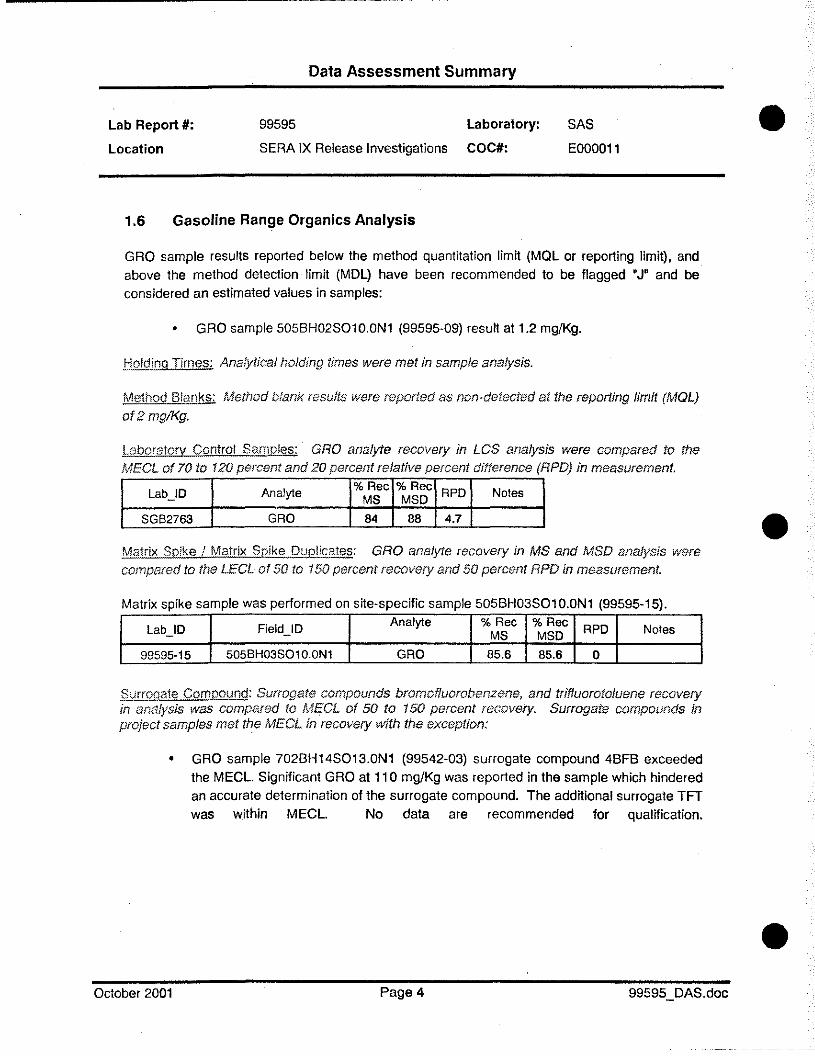
Data Assessment Summary
Lab Report #: 99595 Laboratory:
Location SERA IX Release Investigations COC#:
1.6 Gasoline Range Organics Analysis
SAS
E000011
GRO sample results reported below the method quantitation limit (MOL or reporting limit). and above the method detection limit (MDL) have been recommended to be flagged "J" and be
considered an estimated values in samples:
• GRO sample 505BH02S01 O.ON1 (99595-09) resun at 1.2 mg/Kg.
jjoldino Times: Analytical holding times were met in sample analysis.
Method Blanks: Method blank results were reported a$ non-detected at the reporting limit (MOL)
of2mglKg.
Laboratory Control Samp!es:' GRO analyte recovery in LCS analysis were compared to the lvlECL of 70 to 120 percent and 20 percent relative oereen! difference (RPD) in measurement.
Lab_tO Analyte %Rec % Ree RPO Notes
MS MSO
SGB2763 GRO 84 88 4.7
Matrix Spike! Matrix Spike Duplicates: GRO analyte recovery in MS and MSD analysis were compared to the LEet of 50 to 150 percent recovery and 50 percent RPD in measurement.
Matrix spike sample was performed on site-specific sample 505BH03S010.0N1 (99595-15).
Lab_IO Field_ID Analyte % Ree % Rec
RPD Notes MS MSD
99595-15 505BH03S010.0N1 GRO 85.6 85.6 0
SU..ITpqate Compound: Surrogate compounds bromofluorobenzene. and trifluorotoluene recovery in amJiysis was compared 10 MECL of 50 to 150 percent recovery. Surrogate compounds in project samples met the MECL in recovery with the exception:
• GRO sample 702BH14S013.0N1 (99542-03) surrogate compound 4BFB exceeded
the MECL. Significant GRO at 110 mg/Kg was reported in the sample which hindered an accurate determination of the surrogate compound. The additional surrogate TFT
was within MECL. No data are recommended for qualification .
October 2001 Page 4 99595_DAS.dOC
•
•
•
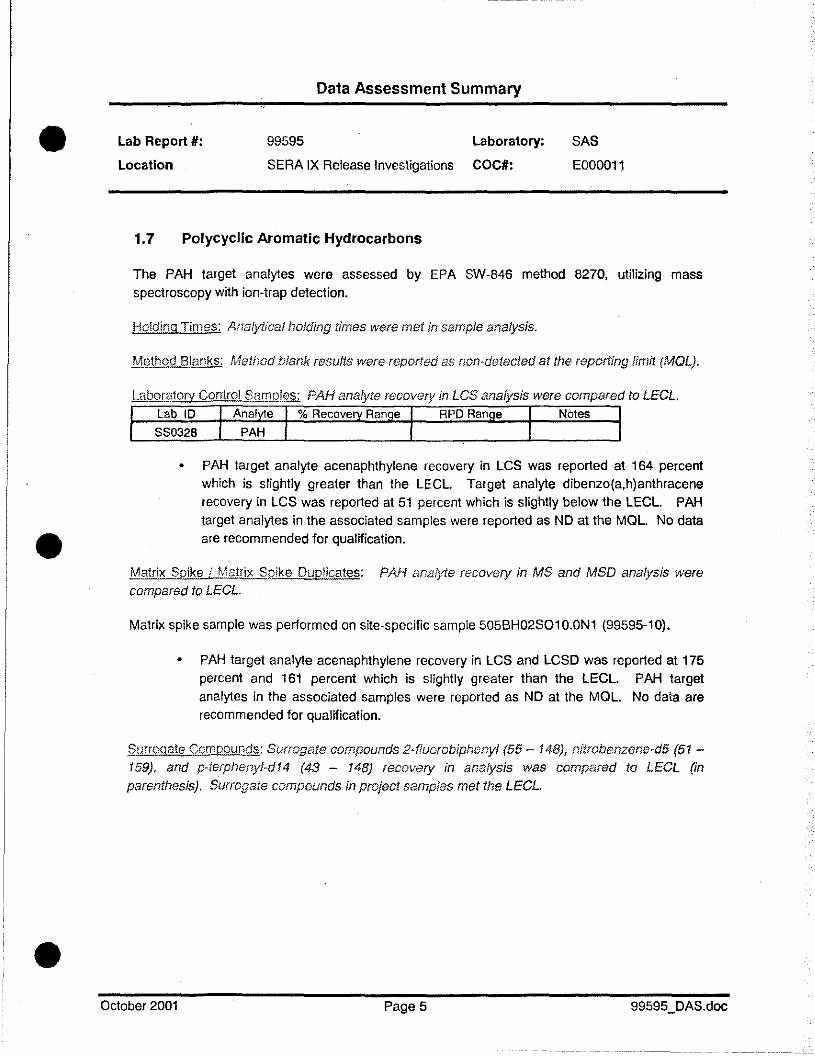
•
•
•
Data Assessment Summary
Lab Report #: 99595 Laboratory: SAS
E000011 Location SERA IX Release Investigations COC#:
1.7 Polycyclic Aromatic Hydrocarbons
The PAH target analytes were assessed by EPA SW-846 method 8270, utilizing mass spectroscopy with ion-trap detection.
Holding Times: Analytical holding times were met in sample analysis.
Method Blanks: Metflod blank results were reported as non-detected at the reporting limit (MQLj.
Laboratory Control Samples: PAH ana/yte recovery in LCS analysis were compared to LECL. Lab ID Anal e % Recove Ran e RPD Ran e Notes
SS0328
• PAH target analyte acenaphthylene recovery in LCS was reported at 164 percent which is slightly greater than the LECL. Target analyte dibenzo(a,h)anthracene recovery in LCS was reported at 51 percent which is slightly below the LECL. PAH target analytes in the associated samples were reported as NO at the MOL. No data are recommended for qualification .
11atrix Spike f Matrix Spike Duplicates: PAH anai,1e recovery In MS and MSD analysis were compared to LECL.
Matrix spike sample was performed on site-specific sample 505BH02S010.0N1 (99595-10).
• PAH target analyte acenaphthylene recovery in LCS and LCSO was reported at 175 percent and 161 percent which is slightly greater than the LECL. PAH target analytes in the associated samples were reported as NO at the MOL. No data are recommended for qualification.
Surrogate Compounds: Surrogate compounds 2-f!uorobiphenyl (55 - 148), nitrobenzene-d5 (51 -159), and p-terphenyl-dI4 (43 - 148) recovery in analysis was compared to LECL (in parenthesis). Surrogate compounds in project samples met the LECL.
October 2001 Page 5

•
•
•
Data Assessment Summary
Lab Report #:
Location
99619 Laboratory:
SERA IX Release Investigations COC#:
SAS
E000012
1.1 Sample Receipt and Integrity
Twenty-seven soil samples were received at SAS on 7/19/01 for analysis.
The temperature of the temperature blank representative of project sample temperatures within
the cooler received at the laboratory were recorded as:
• 99619 @2.1 ·C.
1.2 Corrective Actions
• None
1.3 Data Recommended for Qualification
Sample results reported below the MOL has been recommended to be flagged "J" and be considered an estimated values for:
• GRO sample 505BH04S01 0.ON1 (99619-01) result at 1.0 mg/kg.
• GRO sample 505BH04S015.0Nl (99619-03) result at 1.3 mg/kg .
• GRO sample 532BH02S045.5Nl (99619-11) resun at 1.8 mg/kg.
• RRO sample 532BH02S045.5N1 (99619-12) result at 27 mg/kg.
• RRO sample 906H01 S06.0Nl (99619-20) result at 30 mg/kg.
• BTEX sample 505BH04S010.0Nl (99619-01) result for m,p-xylene at 0.03 mg/kg.
• BTEX sample 505BH04S015.0N1 (99619-03) result for m,p-xylene at 0.054 mg/kg .
October 2001 Page 1 99619_DAS.doc
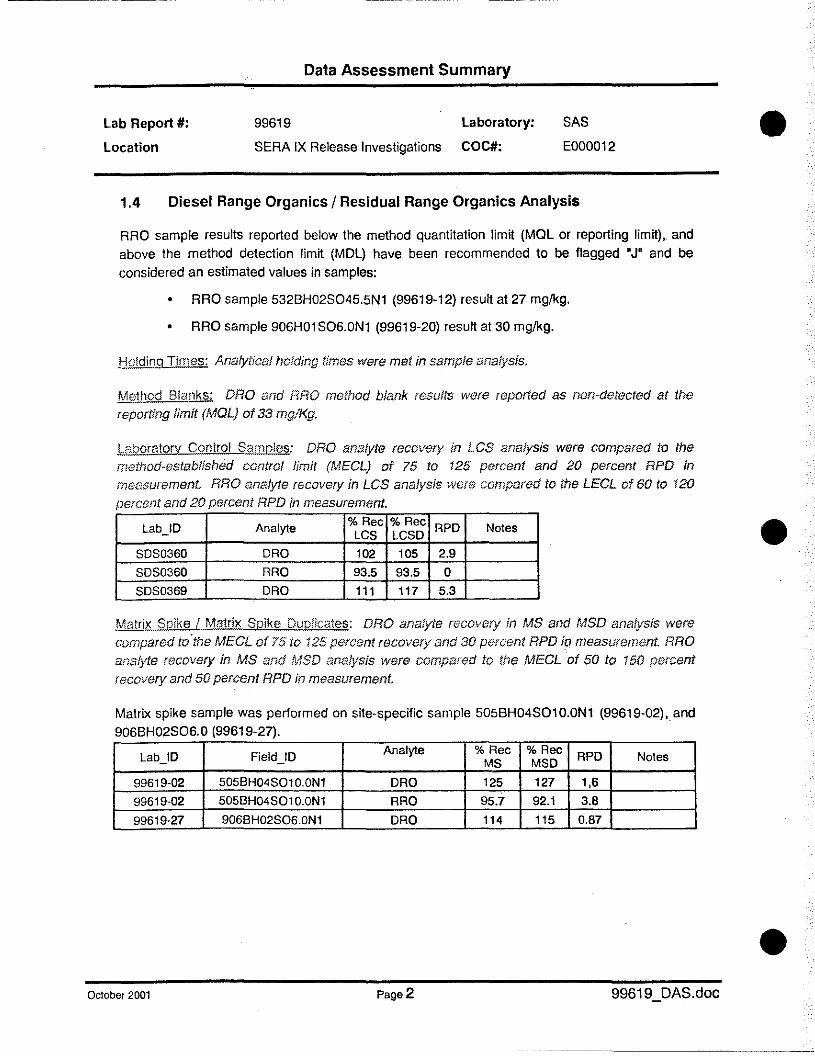
lab Report #:
location
Data Assessment Summary
99619 Laboratory:
SERA IX Release Investigations COC#:
SAS
E000012
1.4 Diesel Range Organics / Residual Range Organics Analysis
RRO sample resu~s reported below the method quantitation limn (Mal or reporting limit), and above the method detection limn (MDl) have been recommended to be flagged "J" and be
considered an estimated values in samples:
• RRO sample 532BH02S045.5N1 (99619-12) result at 27 mg/kg.
• RRO sample 906H01 S06.0N1 (99619-20) result at 30 mg/kg .
.Holding Times: Analytical holding times were met in sample analysis.
Method Blanks: ORO and RRO method blank results were reported as non-detected at the reporting limit (MOL) of 33 mg!Kg.
Laboratorv Control Samples: ORO analyte recovery in LCS analysis were compared to the method-established control limit (MECL) of 75 to 125 percent and 20 percent RPD in measurement RRO analyte recovery in LCS analysis were compared to the LEeL of 60 to 120 percent and 20 percent RPD in measurement.
LabJD Analyte %Ree % Ree RPD Notes LCS LCSD SDS0360 DRO 102 105 2.9
8DS0360 RRO 93.5 93.5 0
SDS0369 ORO 111 117 5.3
Matrix Spike! Matrix Spike Duplicates: DRO analyle recovery in MS and MSD analysis were compared to 'the MEeL of 75 to 125 percent recovery and 30 percent RPD iQ measurement. RRO analyle recovery in MS and MSD analySis were compared to the MEeL of 50 to 150 percent recovery and 50 percent RPD in measurement.
Matrix spike sample was performed on site-specific sample 505BH04S010.0N1 (99619-02),and
906BH02S06.0 (99619-27).
Lab_ID Field_ID Analyte % Ree %Rec RPD Notes MS MSD
99619-02 505BH04S010.0N1 DRO 125 127 1,6
99619-02 505BH04S010.0N1 RRO 95.7 92.1 3.8
99619-27 906BH02S06.0Nl ORO 114 115 0.87
October 2001 Page 2 99619_DAS.doc
•
•
•

•
•
•
Lab Report #:
Location
Data Assessment Summary
99619 Laboratory:
SERA IX Release Investigations COC#:
SAS
E000012
Matrix Duplicates: DRO and FlRO I-eSUitS in matrix duplicate (MO) analysis wel-e reported for an
f-eiative assessment of sample homogeneity.
Lab 10 Field 10 Analyte Result Result RPO Notes
99619-04 505BH04S015.0Nl ORO NO NO NC
99619-04 505BH04S015.0Nl RRO NO NO NC
99619-25 906BH02S03.5Nl ORO NO NO NC
99619-25 906BH02S03.5Nl RRO NO NO NC
99619-27 906BH02S06.0Nl ORO NO NO NC
Surrogate Compounds: DRO surrogate compound (o-/erplJenyl) and RRO surrogate compound (n-triaconlane-d62j recovery in analysis were compared to the MECL of 50 to 150 percent. Surrogate compounds in prcject samples met the LECL in recovery with the exception:
October 2001
• DRO sample 532BH02S030.0N1 (99619-10) did not report the surrogate compound OTP recovery due to a 10-times dilution in analysis. Significant DRO was reported in the sample at 7000 mg/Kg that hindered an accurate determination of surrogate recovery. RRO surrogate compound was within LECL. No data is recommended for qualification.
Page 3 99619_DAS.doc

Data Assessment Summary
Lab Report #: 99619 Laboratory:
Location SERA IX Release Investigations eDeN:
1.5 Volatile Aromatic Hydrocarbons Analysis
SAS
E000012
The BTEX target analytes were assessed by EPA SW-846 method 8021 B in conjunction with GRO AK101 analysis. Soil samples were field-preserved with methanol following AK101
guidance.
BTEX sample results reported below the method quantitation limit (MOL or reporting limit), and above the method detection limit (MDL) have been recommended to be flagged "J" and be considered an estimated values in samples:
• BTEX sample 505BH04S010.0N1 (99619-01) result for m,p-xylene at 0.03 mg!kg.
• BTEX sample 505BH04S015.0N1 (99619-03) result for m,p-xylene at 0.054 mg/kg.
Holdino Times: Analytical holding times were met in sample analysis.
Method Blanks: Method blank results were reported as non-detected at the reporting limit (MOL) of2mg/Kg.
Laboratory Control Samples: BTEX analyle recovery in LCS ana!ysis were compared to the LECL of recovery and relative percent difference {RPD} in measurement of: Benzene (69 - 113%) <21% RPD; Toluene (71 - 131%) <20% RPD; £thy/benzene (63 - 133%) <19% RPD; M&pXylene (74 - 137%) <20% RPD; o-Xylene (65 - 137%) <16"", RPD.
Lab ID RPD Ran e Noles
SGB2763 . 0-7.4
Matrix Sp:ke ! Matrix Spike Duplicates: BETX analyte recovery in MS and MSD analysis were compared to tile quantitalive QA objective (QAOj goal of 70 to 130 percent recovery and 50 percent RPD in measurement.
Matrix spike sample was performed on site-specific sample 505BH04S01 0.ON1 (99619-01).
Lab_ID Field_ID Analyte % Recovery Range RPD Range Notes MS
99619-01 505BH04S010.0N1 BETX 93 - 127 13 - 19
Surrogate CornoDunds: Surrogate compounds bromofluorobenzene (BFB) and Iriflourotoluene (TFT)recovery in analysis was compared to LECL of 70 to 130 percent recovery. Surrogate compounds in prcifect samples met the LECL with the exception:
October 2001
• BTEX sample 505BH03S05.0N1 (99595-20) surrogate compound 4BFB was reported at 134 percent which slightly exceeded the MECL. The additional surrogate compound TFT was within MECL. No data are recommended for qualification.
Page 4 99619_DAS.doc
•
•
•

•
•
•
Data Assessment Summary
Lab Report #: 99619 Laboratory:
Location SERA IX Release Investigations COC#:
1.6 Gasoline Range Organics Analysis
SAS
E000012
GRO sample results reported below the method quantitation limit (MOL or reporting limit), and above the method detection limit (MOL) have been recommended to be flagged "J" and be considered an estimated values in samples:
•
•
•
GRO sample 505BH04S010.0Nl (99619-01) result at 1.0 mg/kg.
GRO sample 505BH04S015.0Nl (99619-03) result at 1.3 mg/kg.
GRO sample 532BH02S045.5Nl (99619-11) result at 1.8 mg/kg.
Holdina Times: Analytical holding times were met in sample analysis.
Method Blanks: Melhod blank results were reported as non-detected at the reporting limit (MOL) of2mg/Kg.
Laboratory Control Samples: GRO analyte recovery in LCS analysis were compared to the MEeL of 70 to 120 percent and 20 percent relative percent difference rRPD) in measorement .
lab_ID Analyte %Rec % Ree RPD Notes MS MSD
SGB2764 GRO 84 84 0
Matrix Spike! Matrix Spike Duplica1es: GRO ana/yle recovery in MS and MSD analysis were compared to the LEeL of 50 to 150 pmcfifll recovery and 50 percent RPD in measurement.
Matrix spike sample was performed on site·specific sample 505BH04S010.0Nl (99619-01).
lab_ID Field_ID Analyte %Rec %Ree RPD Notes MS MSD
99619-01 505BH04S010.0Nl GRO 78.3 78.3 0
SurrOGate Compound: Surrogate compounds bromofluorobenzene, and Irifluorololoene recovery in analYSis was compared to MEeL of 50 10 150 percent recovery. Sorrogate compounds in preject samples met the MECL in recovery with Ihe exception;
October 2001
• GRO sample 702BH14S013.0Nl (99542-03) surrogate compound 4BFB exceeded the MECL. Significant GRO at 110 mg/Kg was reported in the sample which hindered an accurate determination of the surrogate compound. The additional surrogate TFT was within MECL No data are recommended for qualification .
Page 5 99619_DAS.doc

Data Assessment Summary
Lab Report #: 99619 Laboratory: SAS
E000012 Location SERA IX Release Investigations COC#:
1.7 Polycyclic Aromatic Hydrocarbons
The PAH target analytes were assessed by EPA SW-846 method 8270, utilizing mass spectroscopy with ion-trap detection.
Holdino Times: Analylicailloiding times were met in sample analysis.
Met/mel Blanks: Method blank results were reported as non-detected at tile reporting limil (MOL).
Laboratory Comrol Samplas: PAH ana/yle recovery in LCS analysis were compared to LECL
• PAH target analyte acenaphthylene recovery in LCS analysis (SSS0329) was reported at 165 percent which is slightly greater than the LECL PAH target analytes in the associated samples were reported as NO at the MOL No data are recommended for qualification.
Matrix Spike! Matrix. Spike Duplicates: PAH ana/yte recovery in MS and MSD allalysis were compared to LECL
Matrix spike sample was performed on site-specific sample 505BH04S023.0N1 (99619-06).
• PAH target analyte acenaphthylene, and anthracene in MSO was reported slightly greater than the LECL MS recovery met LECL PAH target analytes in the associated samples were reported as NO at the MOL No data are recommended for qualification.
Surrogate Compounds: Surrogate compounds 2-fluorobiphenyl (55 - 148), nitrobenzene-d5 (51 -159), and p-Ierphenyl-dI4 (43 - 148) recovery in analysis was compared to LECL (in parenthesis)_ Swrogate compounds in project samples met the tEeL.
October 2001 Page 6 99619_DAS.doc
•
•
•

I I I I I I I I I I I I I I I I I I I
UNITED STATES AIR FORCE ELMENDORF AIR FORCE BASE, ALASKA
ENVIRONMENTAL COMPLIANCE PROGRAM
SITE EVALUATION AND BIOVENTING STUDIES FOR SERA PHASE V SITES, WORKPLAN
FINAL
AUGUST 1996

I I I I I I I I I
[This page intentionally left blank.]
I I I I I I I I I I

I I I I I I I I I I I I I I I I I I I
1.0
2.0
TABLE OF CONTENTS
Page
INTRODUCTION ........................................................... 1-1
1.1 Background of SERA .................................................. 1-1 1.2 Description of Current Study ............................................. 1-1
1.2.1 Project Objectives ............................................... 1-1 1.2.2 Technical Approach ............................................. 1-4 1.2.3 Data Quality Objectives .......................................... 1-6
SUMMARY OF EXISTING Il\TfORMATION ..................................... 2-1
2.1 ST 501 (UST Site 21) .................................................. 2-1 2.1.1 Site Location and Description ..................................... 2-1 2.1.2 Tank Removal Results ........................................... 2-3 2.1.3 Conclusions and Recommendations ................................. 2-3
2.2 ST 502 (UST Sites 124, 125, and 126) ..................................... 2-3 2.2.1 Site Location and Description ..................................... 2-3 2.2.2 Tank Removal Results ........................................... 2-6 2.2.3 Conclusions and Recommendations ................................. 2-6
2.3 ST 503 (UST Sites 209A and 209B) ....................................... 2-6 2.3.1 Site Location and Description ..................................... 2-8 2.3.2 Tank Removal Results ........................................... 2-8 2.3.3 Conclusions and Recommendations ................................. 2-8
2.4 ST 504 (UST Site 209D) ............................................... 2-11 2.4.1 Site Location and Description .................................... 2-11 2.4.2 Tank Removal Results .......................................... 2-11 2.4.3 Conclusions and Recommendations ................................ 2-11
2.5 ST 505 (UST Sites 306,307, and 308) .................................... 2-14 2.5.1 Site Location and Description .................................... 2-14 2.5.2 Tank Removal Results .......................................... 2-14 2.5.3 Conclusions and Recommendations ................................ 2-16
2.6 ST 506 (UST Sites 395A, 395B, 395C, and 395D) ........................... 2-16 2.6.1 Site Location and Description .................................... 2-16 2.6.2 Tank Removal Results .......................................... 2-19 2.6.3 Conclusions and Recommendations ................................ 2-19
2.7 ST 507 (UST Site 525B) ............................................... 2-19 2.7.1 Site Location and Description .................................... 2-21 2.7.2 Tank Removal Results .......................................... 2-21 2.7.3 Conclusions and Recommendations ................................ 2-21
2.8 ST 508 (UST Site 736) ................................................ 2-24 2.8.1 Site Location and Description .................................... 2-24 2.8.2 Tank Removal Results .......................................... 2-24 2.8.3 Conclusions and Recommendations ................................ 2-26

TABLE OF CONTENTS (CONTINUED)
Page
3.0 FIELD INVESTIGATION ............................ ························· 3-1
3.1 Site Visit ............................................................ 3-1 3.2 Field Sampling and Screening ............................................ 3-1
3.2.1 Initial Soil Boring ............................................... 3-1 3.2.2 Additional Soil Borings .......................................... 3-3 3.2.3 Soil Sampling .................................................. 3-4 3.2.4 Field Screening ................................................. 3-4 3.2.5 Laboratory Confirmation ......................................... 3-5
3.3 Bioventing Systems .................................................... 3-5 3.3.1 Bioventing Wells ............................................... 3-5 3.3.2 Monitoring Implants ............................................. 3-5
3.4 Treatability Tests ...................................................... 3-6 3.5 Site Sampling Plan ..................................................... 3-7
3.5.1 Sampling Plan for ST SOl ......................................... 3-7 3.5.2 Sampling Plan for ST 502 ................. ' ........................ 3-9 3.5.3 Sampling Plan for ST 503 ........................................ 3-11 3.5.4 Sampling Plan for ST 504 ........................................ 3-13 3.5.5 Sampling Plan for ST 505 ........................................ 3-15 3.5.6 Sampling Plan for ST 506 ........................................ 3-17 3.5.7 Sampling Plan for ST 507 ........................................ 3-19 3.5.8 Sampling Plan for ST 508 ........................................ 3-21
4.0 REPORTING REQUIREMENTS ............................................... 4-1
4.1 Monthly Financial and Management Reports ................................ 4-1 4.2 Project Schedules ...................................................... 4-1 4.3 Presentation Materials .................................................. 4-1 4.4 Photo Documentation .................................................. 4-1 4.5 Meeting Minutes ...................................................... 4-1 4.6 No Further Action Memoranda ........................................ ' ... 4-1 4.7 End of Year Report .................................................... 4-1 4.8 End of Study Report ................................................... 4-1
5.0 PROJECT SCHEDULE .. : .................................................... 5-1
6.0 REFERENCES .............................................................. 6-1
Appendix A: AppendixB: AppendixC: AppendixD:
Field Sampling Plan Qual ity Assurance Plan Site Safety and Health Plan Waste Management Plan
ii
I I I I I I I I I I I I I I I I I I I

I I LIST OF FIGURES
I Page
I 1.2-1 Locations of the 1996 SERA V UST Sites ......................................... 1-3
I 1.2-2
2.1-1
SERA Phase V Decision Tree .................................................. I-S
Location of Site ST SOl ....................................................... 2-2
I 2.1-2 Recalculated Matrix Score Sheet for Site ST SOl ................................... 2-4
2.2-1 Location of Site ST 502 ....................................................... 2-S
I 2.2-2 Recalculated Matrix Score Sheet for Site ST 502 ................................... 2-7
I 2.3-1 Location of Site ST 503 ....................................................... 2-9
2.3-2 Recalculated Matrix Score Sheet for Site ST 503 .................................. 2-10
I 2.4-1 Location of Site ST 504 ...................................................... 2-12
I 2.4-2 Recalculated Matrix Score Sheet for Site ST S04 .................................. 2-13
2.S-1 Location of Site ST SOS ...................................................... 2-15
I 2.S-2 Recalculated Matrix Score Sheet for Site ST 505 .................................. 2-17
I 2.6-1
2.6-2
Location of Site ST 506 ...................................................... 2-18
Recalculated Matrix Score Sheet for Site ST 506 .................................. 2-20
I 2.7-1 Location of Site ST 507 ...................................................... 2-22
I 2.7-2
2.8-1
Recalculated Matrix Score Sheet for Site ST 507 .................................. 2-23
Location of Site ST 508 ...................................................... 2-25
I 2.8-2 Recalculated Matrix Score Sheet for Site ST 508 .................................. 2-27
3.1 Field Investigation Decision Tree ................................................ 3-2
3.S-1 Sampling Plan for ST SOl ...................................................... 3-8
3.S-2 Sampling Plan for ST 502 ..................................................... 3-10
3.S-3 Sampling Plan for ST 503 ..................................................... 3-12
iii

3.5-4
3.5-5
3.5-6
3.5-7
3.5-8
5-1
1.2-1
1.2-2
3.5-1
3.5-2
3.5-3
3.5-4
3.5-5
3.5-6
3.5-7
3.5-8
LIST OF FIGURES (CONTINUED)
Page
Sampling Plan for ST 504 ..................................................... 3-14
Sampling Plan for ST 505 ..................................................... 3-16
Sampling Plan for ST 506 ..................................................... 3-18
Sampling Plan for ST 507 ..................................................... 3-20
Sampling Plan for ST 508 ..................................................... 3-22
SERA Phase V Bioventing Study Project Schedule .................................. 5-2
. LIST OF TABLES
Page
SERA Phase V UST Sites Included in the 1996 Bioventing Study ...................... 1-2
Data Quality Objectives for the SERA V Bioventing Study ........................... 1-7
Sampling Plan for ST 501 ...................................................... 3-7
Sampling Plan for ST 502 ...................................................... 3-9
Sampling Plan for ST 503 ..................................................... 3- I I
Sampling Plan for ST 504 ..................................................... 3-13
Sampling Plan for ST 505 ..................................................... 3- I 5
Sampling Plan for ST 506 ..................................................... 3-17
Sampling Plan for ST 507 ..................................................... 3- I 9
Sampling Plan for ST 508 ..................................................... 3-21
iv
I I I I I I I I I I I I I I I I I I I
----- ------

On the basis of the small distance (approximately 4 ft) between the bot1om of the tank and the water table, and the large seasonal groundwater level fluctuations observed at Elmendorf AFB, bioventing may not be recommended for ST 504. Bioventing is primarily designed to deliver oxygen to soils in the unsaturated zone; therefore, it is not an effective technology to remediate water-saturated soils.
Because the extent of contamination beneath this site is unknown, a limited field investigation will be conducted. Section 3 details the decision-making process that will be used during the investigation to detennine the appropriateness ofbioventing, or an alternative remedy at the site.
2.5 ST 505 (UST Sites 306, 307, and 308) ST 505 contains three USTs 306, 307 and 308 that contained diesel, MOGAS, and JP-4,
respectively. These tanks were located near Buildings 42-300 and 42-301, north of the runway, and were removed in 1994, during which environmental samples were taken. The results of the excavation and sampling are presented in the UST Site Assessment, State oj Alaska Underground Storage Tank Register Numbers: 306, 307, & 308, Near Building 42·301 (USAF, August 1994). The following sections summarize the tank removal and investigation, and present recommendations for additional work.
2.5.1 Site Location and Description The USTs were located south of Building 42-300 and west of Building 42-301, and were used to
store fuel for operations support vehicles and equipment. The associated fuel pumps were located approximately lOft to the east of the tanks. Figure 1.2-1 shows the approximate fonner location of the tanks at Elmendorf AFB; Figure 2.5-1 presents a more detailed location map.
The area surrounding the location of the four tanks is level and vegetated with grass; the area surrounding the fuel pumps is level and paved with concrete. A drainage ditch is located to the east and a small stream is located approximately 1.25 miles to the south.
Soils encountered during excavation of the tanks were classified as very fine sands, according to the Unified Soil Classification System. The shallow aquifer is estimated to be 35 ft below grade in the vicinity of the tanks, approximately 24 ft below the base of the tanks. Shallow groundwater flows to the west in this area (USAF, August 1994).
2.5.2 Tank Removal Results All three tanks were excavated and removed in May 1994 and appeared to be in good condition
(USAF, August 1994). A PID was used to SCreen soils during excavation, but no volatile organic compounds (VOCs) were detected. Two soil samples were collected from the base of each tank excavation, within 2 ft of the tank bot1oms. The results of the sampling are shown in Figure 2.5-1. DRO, GRO, and benzene, toluene, ethylbenzene, and xylenes (BTEX) were not detected in four of the six samples collected from beneath the fuel tanks. A sample collected from beneath the south end of the diesel tank contained 146-mglkg DRO, 7-mglkg GRO, and 0.07-mglkg xylenes. The remaining sample, collected beneath the south end of the JP-4 tank, contained only a minor amount ofDRO (14 mglkg).
An additional sample was taken at each of the three associated fuel pumps (diesel, MOGAS, and JP-4). These samples were taken approximately 2 ft below the pipes leading from the fuel tanks to the pumps. Samples collected from near the fuel pumps contained significantly higher concentrations of contaminants than those collected beneath the tanks. The sample collected near the pipe to the diesel pump contained 4160 mglkg DRO, and the sample collected near the pipe to the MOGAS pump
SERA Phase V Workplan, Final 2-14 August 1996
I I I I I I I I I I I I I I I I I I I

- - - - - - ->-c 00 C
Anolyle mg/kg '" - ORO NO '0 GRO NO '0
8 NO '" T NO
[ NO , NO Deplh 13ft
Anolyte mg/kg
ORO NO GRO NO 8 NO T NO [ NO X NO
Deplh 13ft
Anolyle mg/kg
ORO NO GRO NO 8 NO
N T NO , E NO -V. , NO
Oeplh 13ft
Anolyte mg/kg
ORO 4,1£0 GRO 16 8 NO T 0.09 E NO X 0.06
Depth 3.SfI
- - - -
UST 307 1 MOGAS 1 L ________ -l
r---------, UST308
JP-4 L ________ -l
r-----UST 306 DIESEL
L ____
Dispenser Island
Anolyte mg/kg
ORO NO GRO NO 8 NO T 0.06 E NO , NO Depth 3.5ft
- -Analyte mg/kg
ORO NO GRO NO 8 NO T "0 [ "0 , NO
Deplh DB
Analyte mg/kg
ORO 14 GRO NO 8 NO T NO [ NO , NO
Depth 13ft
Analyie mg/kg
ORO '46 GRO 7 8 NO T NO E NO ___ 0
Depth 13ft
Anolyle mg/kg
ORO 193 GRO 3,200 8 57 T 510 E 140 X 720
Depth 3.5ft
Figure 2.5-1. Location of Site ST 505
- - - - -North
~~ ,
ELMENDORF AFB LEGEND
Estimated blenl of Contamination Above
Tonk (removed)
Level A
Previous Sample Location
Groundwater Flow Direction
SCALE o 5 10
Fee!
-

contained 3200-mglkg GRO and significant concentrations ofBTEX. These results are also shown in Figure 2.5-1.
Following excavation of the three USTs, the excavated soils plus some clean soil were used as backfill. The soils around the fuel pumps were not excavated (USAF, August 1994).
2.5.3 Conclnsions and Recommendations The original ACM score calculated for this site was 20, corresponding to Level D cleanup
criteria (USAF, August 1994). This score did not take into account the contamination associated with the fuel pumps; therefore, the ACM score was recalculated using a conservative estimate of the volume of soil contamination, and assuming that the groundwater in the shallow aquifer is not used for consumption within the Base boundaries. Figure 2.5-2 shows the recalculated ACM score of24, which corresponds to Level C cleanup criteria. DRO and GRO exceeded the Level C cleanup criteria near the fuel pumps.
Because the extent of contamination beneath this site is unknown, a limited field investigation will be conducted. If, during the course of this investigation, the vertical extent of contamination is found to be significant, this site may be recommended for bioventing as the presumptive remedy for the remediation of the soils above the water table. Section 3 details the decision-making process that will be used during the investigation to determine whether this site warrants bioventing, an alternative removal action, or no further action.
2.6 ST 506 (UST Sites 395A, 395B, 395C, and 395D) ST 506 contains four former USTs which were 10,000-gal. tanks that contained unleaded and
premium unleaded gasoline. These tanks were located near Building 33-395, a retail gasoline station on the Davis Highway on the eastern part of the Base. These tanks were removed in 1994, and environmental samples were taken during excavation. The results of the excavation and sampling are presented in the UST Site Assessment, State of Alaska Underground Storage Tank Register Numbers: 395A, 395B, 395C, & 395D, Near Building 33-395 (USAF, September 1994). The following sections summarize the tank removal and investigation, and present recommendations for additional work.
2.6.1 Site Location and Description All four USTs were located east of Building 33-395 and west of the Davis Highway, and were
used to store fuel for the retail fuel operation. The four associated fuel pumps were located immediately east of the tanks. Figure 1.2-1 shows the approximate location of the fuel tanks and gasoline station at Elmendorf AFB; Figure 2.6-1 presents a more detailed location map.
The area surrounding the location of the four tanks is paved and slopes gently to the east; the area surrounding the fuel pumps is level and paved with concrete. A drainage ditch is located to the east of the tanks, and Ship Creek is located approximately one-third mile to the south.
Soils encountered during excavation of the tanks were classified as very fine sands, according to the Unified Soil Classification System, and did not appear to be native. The shallow aquifer is estimated to be 35 ft below grade in the vicinity of the gasoline station, approximately 19 ft below the base of the tanks. Shallow groundwater flows to the west in this area (USAF, September 1994).
SERA Phase V Workplan, Final 2-16 August 1996
I I I I I I I I I I I I I I I I I I I

I I I I I I I I I I
, I I I I I I I I •
· •• ·····.·i < .(J.)Vf~'~; .. '" ~O.; <:~. Iii .•......•...•• ., .. , i
1. Depth to Subsurface Water < 5 feet (10) 5-15feet ( 8) 15 - 25 feet ( 6) 25 - 50 feet ( 4) > 50 feet ( I) 6
2. Mean Annual Precipitation > 40 inches (10) 25 - 40 inches ( 5) 15 - 25 inches ( 3) < 15 inches (I) 3
3. Soil Type (Unified Soil Classification) Clean, coarse-grained soils (10 Coarse-grained soils with fmes ( 8) Fine-grained soils (low OC) ( 3) Fine-grained soils (high OC) (I) 3
4. Potential Receptors Public well within 1000 feet, or private well(s) within 500 feet (15) Municipal/private well within l> mile (12) Municipal/private well within I mile ( 8) No known well within Yo mile ( 6) No known well within I mile ( 4) Non-potable groundwater ( I) 4
5. Volume of Contaminated Soil > 500 cubic yards (10) JOO - 500 cubic yards ( 8) 25 - 100 cubic yards ( 5) >De Minimis - 25 cubic yards ( 2) De Minimis ( 0) 8
TOTAL 24
Figure 2.5-2. Recalculated Matrix Score Sbeet for Site ST 505
August 1996 2-17 SERA Phase V Workplan, Final

I I I I I I I I I I I I I I I I I I I
3.5.5 Sampling Plan for ST 505 ST 505 contains USTs 306, 307, and 308 which were 2500-gal. fuel tanks located near Buildings
42-300 and 42-301. These tanks, which were removed in 1994, have three small areas ofDRO and GRO contamination, Dear CST 306 and the dispenser island. The site has an ACM SCOre of24. The limited sampling conducted at the site during tank removal indicates that GRO and DRO contamination exceed the Level CACM cleanup criteria of 500 and 1000 mg/kg, respectively.
Figure 3.5-5 shows the location of the initial boring, in the area of greatest contamination, and the additional soil borings, both on a circle lOft out from the estimated extent of contamination and within the area of contantination. If the field investigation indicates that bioventing is warranted, a bioventing well will be installed in the initial boring. Monitoring implants will be installed in three of the additional borings. One implant will be located on the circle surrounding the estimated plume, and the other two may be placed within the circle in areas of contamination, as shown in Figure 3.5-5, depending on the extent of contamination.
Table 3.5-5 outlines the confirmation sampling proposed for ST 505. The QAP (Appendix B) outlines the laboratory QNQC samples for the field investigation.
Table 3.5-5
Sampling Plan for ST 505
IIbiovf:nti,nQ well.
AKIOI, AKJ02, AK103, 8020, Nitrate/nitrite" total phosphate', TOC'.
2 AKIOI, AKI02, AK103, per boring 8020.
'Borings will be drilled and sampled \0 groundwater. "These analyses will be conducted anI), on the most contaminated sample from the boring. AKJOI := State of Alaska meth(ld for GRO. AK 1 02 "" State of Alaska method for DRO. AK J 03 "" State of Ala~ka method for RRO. 8020 =: EPA method for BTEX. TOC "" Total organic carbon.
August 1996 3-15 SERA Phase V WorkpJan, Final
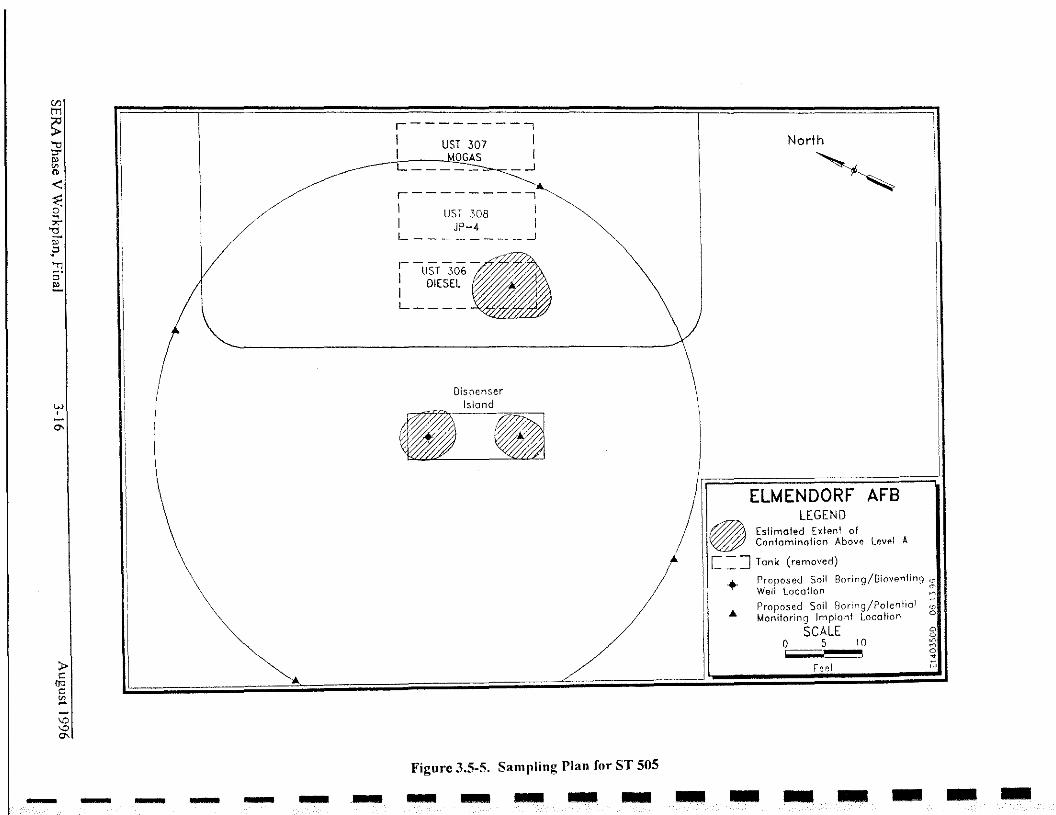
w •
- - - - - -
r--------, lUST 307 I I OGAS I L____ _..J
r--------, I UST 308 I I JP-4 I 1 ________ ..J
~ -UST306 I DIESEL
L ____ ~~~
Dispenser Island
Figure 3.5-5. Sampling Plan for ST 505 - - - - - -
North
ELMENDORF AFB LEGEND
~ Estimated Extent of ~ Contamination Above Level A [= ] Tank (,emaved)
Proposed Soil Boring/8iovenling Well Location
Proposed Soil Boring/Potential Monitoring Implant Location
-
SCALE o 5 10 C:=""==S
- - -
a o ,0
8 • '"
- -