serial cardiovascular adaptations during pregnancy
TRANSCRIPT

Portland State University Portland State University
PDXScholar PDXScholar
Dissertations and Theses Dissertations and Theses
1983
Serial cardiovascular adaptations during pregnancy Serial cardiovascular adaptations during pregnancy
Mark Vincent Hart Portland State University
Follow this and additional works at: https://pdxscholar.library.pdx.edu/open_access_etds
Part of the Biology Commons, Cardiology Commons, and the Cardiovascular System Commons
Let us know how access to this document benefits you.
Recommended Citation Recommended Citation Hart, Mark Vincent, "Serial cardiovascular adaptations during pregnancy" (1983). Dissertations and Theses. Paper 3354. https://doi.org/10.15760/etd.5011
This Thesis is brought to you for free and open access. It has been accepted for inclusion in Dissertations and Theses by an authorized administrator of PDXScholar. Please contact us if we can make this document more accessible: [email protected].
AN ABSTRACT OF THE THESIS OF Mark Vincent Hart for the Master of
Science in Biology presented August 12, 1983.
Title: Serial Cardiovascular Adaptations During Pregnancy
APPROVED BY MEMBERS OF THE THESIS COMMITTEE:
//t
Maternal cardiovascular adaptations appear to be essential in order
to supply extra circulation to both the developing fetus and maternal
system during a successful pregnancy. Since inadequate cardiovascular
adjustments may produce abortions or maternal morbidity, the characteriza
tion of maternal cardiovascular changes during pregnancy and the
elaboration of the underlying mechanism for these changes are essential
2
to the understanding of how the heart enlarges during pregnancy and
what significance this enlargement might have. To provide needed
information regarding this time course and extent of maternal cardiac
enlargement and the hormonal and hemodynamic changes which may be
responsible for these changes, the guinea pig was used as an animal
model to characterize the maternal cardiac, hemodynamic and hormonal
changes during early, mid and late pregnancy.
All animals used were virgin female guinea pigs which were
prospectively weight-matched and randomly assigned to one of the
following groups: 1) Control, 2) Pregnant(20 Days), 3) Pregnant (40
Days), and 4) Pregnant (60 Days). The sows assigned to the pregnant
groups were housed with a boar during estrus to provide a dated preg
nancy. On the day of study, each animal was anesthetized and polyvinyl
catheters were placed in the left ventricle, right atrium and abdominal
aorta. The animals were allowed to recover from the anesthesia and
were then placed in a limited restraint cage where simultaneous
pressures were recorded. Cardiac output and regional blood flows were
then measured by radioactive microspheres indicator dilution technique,
arterial blood gas samples were taken, blood volume was measured by
a dye dilution technique using Evans Blue, and estrogen and progesterone
plasma levels were determined by radioimmunoassay. After all in vivo
measurements were obtained, the animals were sacrificed and the in
vitro left ventricular pressure-volume relations were measured in 14
control and 39 pregnant guinea pigs.
Arterial blood gases and hematocrits obtained at the end of the
study were similar to those previously reported in control animals.
3
Kidney weights, wet lung weights and left ventricular weights were
unchanged during pregnancy despite a significant increase in total
maternal weight. Hemodynamic data from the control and pregnant guinea
pigs demonstrated that there was no statistical difference in heart
or respiratory rates, or in aortic, right atrial or left ventricular
end-diastolic pressures. Total cardiac -0utput was increased as early
as Day 20 of gestation but then gradually returned to pre-pregnant
values. Uterine blood flow was not increased until Day 40 when fetal
and placental weights were increased. Since heart rates were unchanged,
stroke volume was increased by Day 20 and remained elevated throughout
pregnancy. Blood volume steadily increased during pregnancy, reaching
a peak value at the end of gestation. The in vitro pressure-volume
relationships of the left ventricles demonstrated that the curves of the
pregnant animals were shifted to the right as early as Day 20 and
progressively increased with a peak increase in volume occurring at end
gestation. This increase occurred without a change in left ventricular
weight, therefore increasing the radius:wall thickness ratio throughout
pregnancy. There was no change in left ventricle mechanical or material
properties indicating that left ventricular enlargement occurs by
geometric remodeling. Estradiol plasma levels slowly increased during
pregnancy but were not significantly elevated until Day 40 of gestation.
Estrone was only elevated at Day 40 and returned again by Day 60, while
progesterone was significantly increased throughout pregnancy with a
peak value occurring at Day 40.
In sunmary, significant cardiovascular changes are seen during
early pregnancy and occur prior to a major increase in uterine blood
flow. These cardiovascular alterations may be mediated by changing
hormone levels.

SERIAL CARDIOVASCULAR ADAPTATIONS DURING PREGNANCY
by MARK VINCENT HART
A thesis submitted in partial fulfillment of the requirements for the degree of
MASTER OF SCIENCE in
BIOLOGY
Portland State University
1983

TO THE OFFICE OF GRADUATE STUDIES AND RESEARCH:
The members of the Committee approve the thesis of Mark Vincent
Hart presented August 12, 1983.
Kat er1ne C avigny '
APPROVED:
StanleV'Rouch, Dean of Graduate Studies and Research

ACKNOWLEDGEMENTS
I would like to express my appreciation and acknowledge the
assistance that many people have provided during this study. Ors. Jeff
Hosenpud and Mark Morton contributed a good deal of their time to the
experimental design and implementation of this study, and provided much
needed advice during the preparation of this thesis. Dr. James Metcalfe
kindly allowed me to perform my graduate research in the Heart Research
Laboratory, and the staff of the lab provided assistance and support
during the study. Specifically, I would like to thank Sharon Knopp,
Cathy Chase and J. Eugene Welch for their assistance in animal breeding,
data acquisition and blood gas analysis; Lynn Bentson for her help
with the statistical analysis of the data; and Jackie Niemi for typing
the drafts and final copy of this thesis. The hormone analysis was
performed by Dr. John Resko's laboratory in the Department of Physiology
at OHSU.
Finally, this project was financially supported by the Medical
Research Foundation of Oregon, N. L. Tartar Research Fellowship Fund
and Public Health Service grant #HD-10034.
TABLE OF CONTENTS
Page
ACKNOWLEDGEMENTS • • • • • • . • • . • . • • • • • . • . • • • • . . • . . • • . • . • . • . . • • . . . iii
L I ST 0 F TAB L ES • • • • . . • • . . . • • • . • • . • • . . . . • • • • . • • • • . • . . . • . • . • • • • vi
LIST OF FIGURES
CHAPTER
............................................. vii
I INTRODUCTION • . . • . • • • • . . • • . . • • • • . . • • • • . • • . • • . • • • • • • l
II REVIEW OF LITERATUf1E • • . . . . • . . . . . . . . • .. . . . . . . . . • • . . 2
I I I METH ODS . . • . . • . . . . . . . • . . . . . • . . . . . • • • . . . . . • . . • . . . . . . 17
Experimental animal selection . . . . . . . . . . . . . . . . . . 17
Animal preparation and instrumentation ......... 17
Study protocol . . . . . . . . . . . . . . . . . . . . . . . . . . . . . . . . . 20
In vivo pressure measurements Cardiac output and organ blood flow Blood gas analysis Hormone analysis Blood volume measurements In vitro pressure-volume curves Autopsy data Effects of anesthesia Data analysis
IV RESULTS . . • . . • • . . . . . . • • . . . . . . • • • . . • • • . • • • . . • • . . • • . . 33
Anima 1 we 11-bei ng . . . . . . . . . . . . . . . . . . . . . . . . . . . . . . 33
In vivo pressure measurements .................. 39
Cardiac output and regional blood flow ......... 39
Honnone data . . . . . . . . . . . . . . . . . . . . . . . . . . . . . . . . . . . 39
Blood volume data .............................. 42
Pressure-volume data ........................... 42

CHAPTER Page
V DISCUSSION • • • • • • • • • . • • . • • • • • • • • • • • • • • . • • • • • • • • • • • • 57
VI SUMMARY . . • • • • • . • . . • • • • . • . • • • . . . • • • • • • • • • • • • • • • • • • • 69
VII REFERENCES • . . • • • • • . • . . • • • • • • • . • . • . • .. • . . • • • • • • • • • • 72

LIST OF TABLES
Table Page
I Summary of cardiovascular alterations during
pregnancy . . . . . . . . . . . . . . . . . . . . . . . . . . . . . . . . . . . . . . . . . . 10
II Body and organ weights ............................. 34
III Arterial blood gas data ............................ 35
IV Anesthesia recovery . . . . . . . . . . . . . .. . . . . . . . . . . . .. . . . . 36
V Hemodynami c data . . . . . . . . . . . . . . . . . . . . . . . . . . . . . . . . . . . 40
VI Cardiac output and regional blood flow ............. 41
VII Hormone levels during pregnancy .................... 43
VIII Blood volume and hematocrit ........................ 44
IX Left ventricular dimensions ........................ 52
X Stiffness constants . . . . . . . . . . . . . . . . . . . . . . . . . . . . . . . . 53

LI ST OF FI GU RES
Figure Page
Effect of gestational age and posture on cardio-vascular hemodynamics during pregnancy •.........•..•. 6
2 In vitro pressure volume curve of control and end gestation guinea pigs •........••...........•..••...•. 9
3 In vitro pressure volume curves of hormone treated
animals········································•:;.••··· 14
4 Hormone profiles ....................•.••..•.•..•••..• 18
5 Pressure recordings ...................•............•. 21
6 Apparatus for pressure volume measurements ·····••o••~ 27
7 Anesthesia recovery •......•......•..........•.•..•••. 37
8 B 1 o o d v o 1 u me . . . . . . . . . . . . . . . . . • . . . . . . . . . • . • • . . . . • . . . . . 4 5
9 Pressure volume recording ·············=·············· 46
10 Pressure volume curve .................. , .....•.....•. 48
11 Linear pressure volume relations ...........•......... 50
12 Strss-elastic modulus ................................ 54
13 Cardiac output, stroke volume and heart rate during
pregnancy . . . . . . . . . . . . . . . . . . . . . . • . . . . . . . . . . . . . . . . . . . . . 58
14 Heart size and stroke volume .•........•............•. 63
15 Hormona 1 a 1 terat ions during pregnancy ......... 0., •••• 66

I INTRODUCTION
The cardiovascular changes observed during the course of
mammalian pregnancy are among the most extreme alterations seen in
non-pathological states. These maternal cardiovascular adaptations
appear to be essential in order to supply extra circulation to both the
developing fetus and maternal system during a successful pregnancy.
Fetal development may be retarded, or abortion may ensue when maternal
cardiovascular adjustments are inadequate. The interaction of coexist
ing maternal cardiovascular pathophysiology with gestational cardio
vascular changes may produce important maternal morbidity. Therefore,
the characterization of maternal cardiovascular changes during preg
nancy and the elaboration of the underlying mechanism for these changes
are essential to the understanding of how the heart enlarges during
pregnancy and what significance this enlargement might have.
This study will attempt to provide needed information regarding
the time course and extent of maternal cardiac enlargement and the
hormonal and hemodynamic changes which may be responsible for these
changes. To accomplish this goal, the guinea pig was used as an animal
model to 1) characterize the maternal cardiac, hemodynamic and hormonal
changes during early, mid and late pregnancy, and 2) correlate the
changes in heart size with hemodynamic and hormonal values to evaluate
the mechanisms that may be responsible for cardiac enlargement during
pregnancy.

II REVIEW OF THE LITERATURE
Most of the work investigating the maternal cardiovascular adapta
tions to pregnancy has been carried out in humans. Some of the studies
date back over 150 years ago, and despite the limitations of early
techniques and experimental designs, these early studies lead to impor
tant clinical findings and helped provide a direction for future
investigations.
As early as 1825, a French physician who was serving as an intern
in the Paris Maternity Hospital observed that the left ventricle of the
maternal heart was hypertrophied during normal pregnancy (42). Larcher
examined 130 hearts of patients who had died of childbed fever and were
assumed to have been healthy prior to their fever. From these examina
tions, Larcher concluded that 1) the heart is normally enlarged during
pregnancy, 2) the enlargement affects almost exclusively the left
ventricle, 3) that the left ventricle increases from a minimum of
one-quarter the nonnal thickness to one-third, 4) this enlargement con·
sistently occurs, and 5) that the enlargement disappears during ,-actation.
In Angus Macdonald's "The Bearings of Chronic Disease of the Heart on
Pregnancy" (42) which was published in 1878, Macdonald follows a
succession of studies which generally concur with Larcher's observa
tions of left ventricular hypertrophy. All of these studies dealt
mostly with anatomical considerations with very limited discussions of
causation. Despite the limited emperical infonnation that was available
in the late 1870's, Macdonald made the following statement.

It is plain that, as the amount of blood circulating within the mother's vessels during the latter months of pregnancy is increased beyond question, the same must be true of the amount circulating in the heart within a given period of time, since the heart is only a section of the general vascular system, unless it could be shown that the heart beats more quickly during the latter months of pregnancy than at other times. But the latter is not the fact; therefore it follows that at each contraction of the heart a larger amount than normal must be propelled from the ventricles, and at each diastole a larger amount must find its way to these cavities .... There is therefore reason to believe that in the left ventricle, during pregnancy, we have as a physiological condition a certain degree of increase in its capacity, associated with a variable amount of muscular hypertrophy in its walls. (Macdonald, Chapter 2, 1878)
3
The above statement was based primarily on clinical observations
since it was another 35 years until cardiac output was measured during
pregnancy by Lindhard in 1915 (41). He used a nitrous oxide method to
detennine cardiac output before, during and after pregnancy and
observed a 50% increase during pregnancy with a return to pre-pregnant
levels after pregnancy.
In 1926, Stander (79) suspected that the increase in the size of
the uterus during pregnancy might be associated with an increased
cardiac output. This investigator employed the Fick principle in awake
dogs to measure "minute volume", or the amount of blood which passes
through the lungs per minute, by calculating the total oxygen consumed
and the arteriovenous oxygen content difference. From this study he
observed a 33-50% increase in pregnant compared to nonpregnant dogs.
He found most of this increase to take place during the latter half of
pregnancy and attributed it to increased uteroplacental circulation.
He also noted that during the estrus cycle, the dogs' cardiac output was
increased though not to the levels he observed during pregnancy.
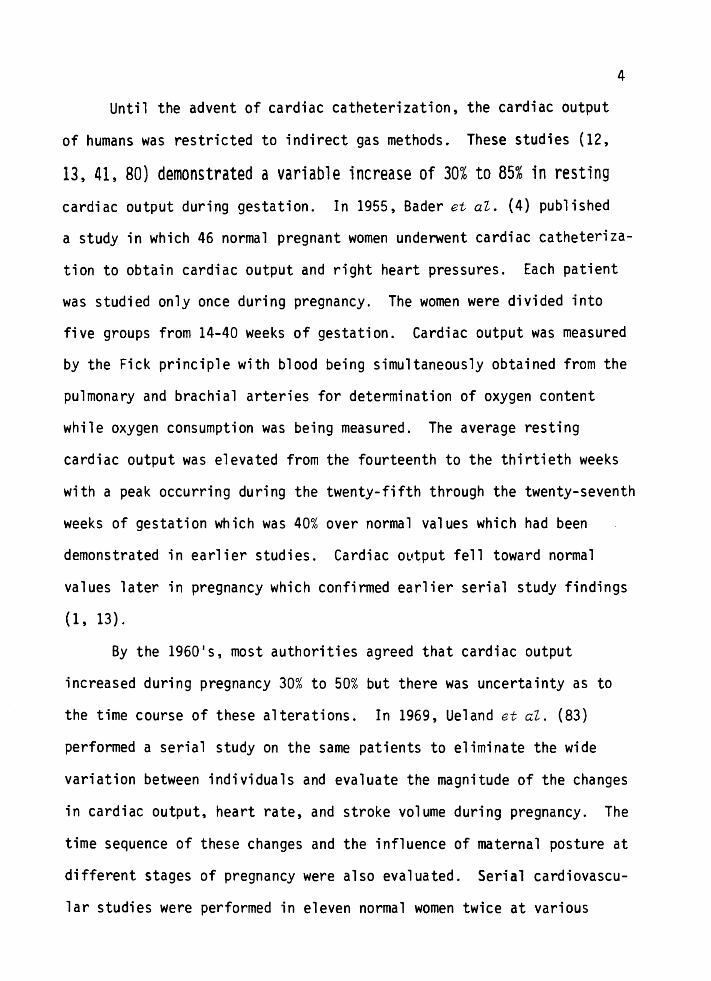
Until the advent of cardiac catheterization, the cardiac output
of humans was restricted to indirect gas methods. These studies (12,
13, 41, 80) demonstrated a variable increase of 30% to 85% in resting
cardiac output during gestation. In 1955, Bader et al. (4) published
4
a study in which 46 normal pregnant women underwent cardiac catheteriza
tion to obtain cardiac output and right heart pressures. Each patient
was studied only once during pregnancy. The women were divided into
five groups from 14-40 weeks of gestation. Cardiac output was measured
by the Fick principle with blood being simultaneously obtained from the
pulmonary and brachial arteries for determination of oxygen content
while oxygen consumption was being measured. The average resting
cardiac output was elevated from the fourteenth to the thirtieth weeks
with a peak occurring during the twenty-fifth through the twenty-seventh
weeks of gestation which was 40% over normal values which had been
demonstrated in earlier studies. Cardiac ovtput fell toward normal
values later in pregnancy which confirmed earlier serial study findings
(1, 13).
By the 1960's, most authorities agreed that cardiac output
increased during pregnancy 30% to 50% but there was uncertainty as to
the time course of these alterations. In 1969, Ueland et al. (83)
performed a serial study on the same patients to eliminate the wide
variation between individuals and evaluate the magnitude of the changes
in cardiac output, heart rate, and stroke volume during pregnancy. The
time sequence of these changes and the influence of maternal posture at
different stages of pregnancy were also evaluated. Serial cardiovascu
lar studies were performed in eleven normal women twice at various

5
stages of pregnancy and once again postpartum. Figure 1 demonstrates
their results. It is apparent that cardiac output was elevated early
in pregnancy and maintained through the thirty-second week, then began
to return towards normal values. An increase in stroke volume occurred
quite early, but later in pregnancy stroke volume fell as heart rate
increased.
The alterations in cardiac output in nonnal pregnancy do not
demonstrate conclusive information concerning the mechanism by which
stroke volume is increased. None of the known detenninants of stroke
volume, preload, contractility or afterload (25, 63) appear to change
significantly during pregnancy.
Numerous studies have demonstrated a 40 to 50% increase in blood
volume during pregnancy (5, 33, 66, 83) suggesting that increased
preload (end-diastolic sarcomere length) may be a factor in increased
cardiac output. Despite this increased blood volume, studies (4) have
shown that right-sided filling pressures are not elevated during preg
nancy. In addition, recent evidence has been presented that shows that
the left ventricle in supine humans may actually work near the peak of
its function curve at normal filling pressures (62). Infusions of whole
blood or dextran (10, 73) in amounts sufficient to double left ventri
cular filling pressure have shown only minor changes in the dimensions
of the normal left ventricle, stroke volume or cardiac output. This
evidence suggests that an increase in preload from increased blood
volume can contribute little to increased stroke volume during pregnancy.
Non-invasive measurements of contractility, such as systolic time
intervals and echocardiography have been used as a means of assessing

Figure 1. The effect of gestational age and maternal posture on the cardiovascular parameters of eleven women
during pregnancy and postpartum.
Cardiac 6 Output
(liters/min}
4
100
He art Rote 80
(beats/min)
60
90 Stroke Volume
7 (cc) 0
50 20-24 28-32 38-40
Gestation
-supine --- side ·····-·I itting
6·8 Wiiks pp
6
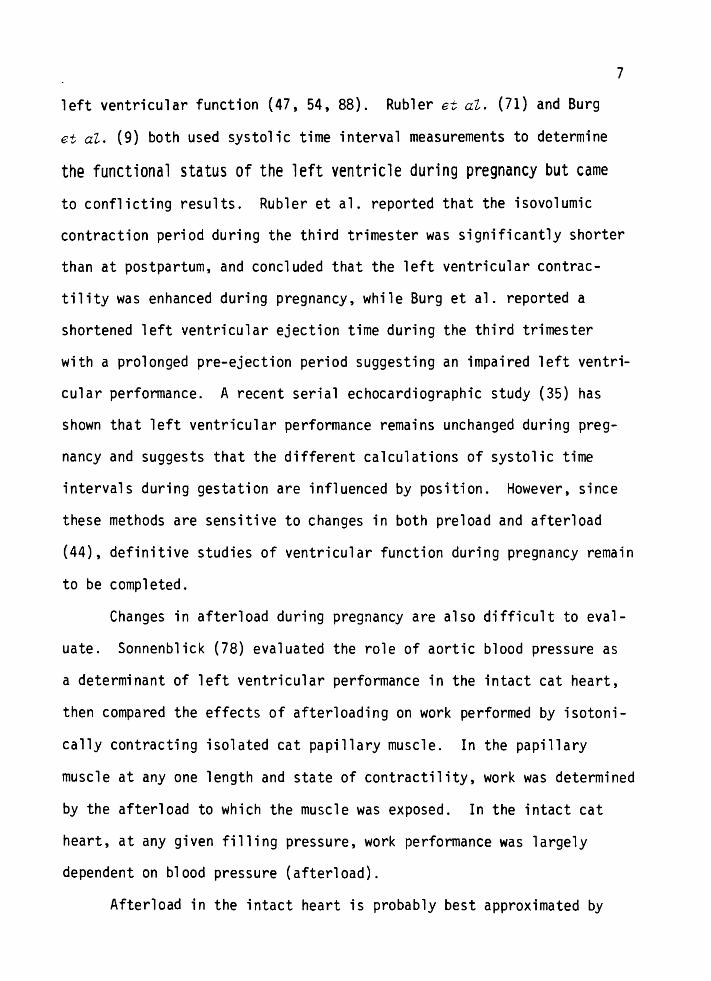
left ventricular function (47, 54, 88). Rubler et al. (71) and Burg
et al. (9) both used systolic time interval measurements to determine
the functional status of the left ventricle during pregnancy but came
7
to conflicting results. Rubler et al. reported that the isovolumic
contraction period during the third trimester was significantly shorter
than at postpartum, and concluded that the left ventricular contrac
tility was enhanced during pregnancy, while Burg et al. reported a
shortened left ventricular ejection time during the third trimester
with a prolonged pre-ejection period suggesting an impaired left ventri
cular performance. A recent serial echocardiographic study (35) has
shown that left ventricular performance remains unchanged during preg
nancy and suggests that the different calculations of systolic time
intervals during gestation are influenced by position. However, since
these methods are sensitive to changes in both preload and afterload
(44), definitive studies of ventricular function during pregnancy remain
to be completed.
Changes in afterload during pregnancy are also difficult to eval
uate. Sonnenblick (78) evaluated the role of aortic blood pressure as
a determinant of left ventricular performance in the intact cat heart,
then compared the effects of afterloading on work performed by isotoni
cally contracting isolated cat papillary muscle. In the papillary
muscle at any one length and state of contractility, work was determined
by the afterload to which the muscle was exposed. In the intact cat
heart, at any given filling pressure, work performance was largely
dependent on blood pressure (afterload).
Afterload in the intact heart is probably best approximated by
8
wall stress. In an isotonically contracting ventricle, wall stress has
been shown to be the major determinant of ventricular performance at a
constant preload (11). In the intact circulation though, stress in the
ventricular wall is related to the external constraints on ventricular
ejection and these relations are complicated by the shape of the con
tracting ventricle and by the physical properties of the vascular
system into which it pumps blood. Milnor (55) described arterial input
impedance as a measure of afterload that expresses all of the external
factors that oppose ventricular ejection of blood making aortic
impedance an important determinant of wall stress. A major component
of aortic impedance is systemic vascular resistance (55). It has been
observed that peripheral vascular resistance decreases during pregnancy
(4) and that this change is manifested by a lowering of systemic arter
ial pressure in spite of an increased cardiac output (35, 43).
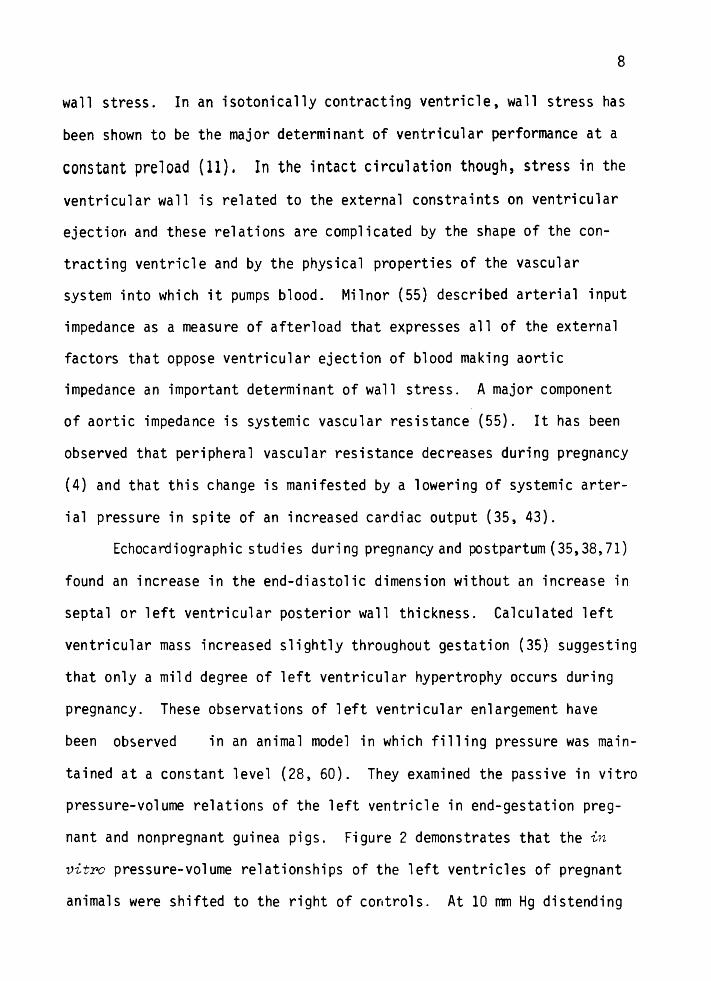
Echocard i ograph i c studies during pregnancy and postpartum ( 35, 38, 71)
found an increase in the end-diastolic dimension without an increase in
septal or left ventricular posterior wall thickness. Calculated left
ventricular mass increased slightly throughout gestation (35) suggesting
that only a mild degree of left ventricular hypertrophy occurs during
pregnancy. These observations of left ventricular enlargement have
been observed in an animal model in which filling pressure was main
tained at a constant level (28, 60). They examined the passive in vitro
pressure-volume relations of the left ventricle in end-gestation preg
nant and nonpregnant guinea pigs. Figure 2 demonstrates that the in
vitro pressure-volume relationships of the left ventricles of pregnant
animals were shifted to the right of controls. At 10 mm Hg distending

~
fz• • l ,.. CtWTROL (mttl\ 1 I SD.) ~ •
6 PREGNANT • N •II •
• •
• •
• • • •
• • ~ . .
• •
•
~ O'--~~---~--~~~~~--~~~---....a o o~ 1.0 1.s
LEFT VENTRICULAR VOLUME (cc/; LV)
Figure 2. Passive tn v1tro left
ventricular pressure-vol1111e curve of
control ind end-gestation pregnant
guinea pigs.
9
pressure, left ventricular volume was increased 16% in the pregnant
animals. There was no difference between the left ventricular weights
of the pregnant and nonpregnant guinea pigs and the calculated radius:
wall thickness ratio was increased in the pregnant animals. These
findings suggest that ventricular enlargement without hypertrophy occurs
in guinea pig pregnancy.
This fourth determinant of stroke volume, ventricular enlargement,
is usually utilized for long-term cardiovascular adaptations (70).
Ventricular radius and wall thickness are the primary geometric deter
minants of wall stress (Law of Laplace). In pregnancy the radius to
wall thickness ratio is increased, potentially increasing wall stress
and raising the possibility that during gestation the left ventricle
may be more susceptible to increases in afterload. These geometric
changes may be offset by the previously mentioned reduction of vascular
resistance and systemic pressure.
The mechanism for the left ventricular enlargement during

10
pregnancy is not adequately explained. In 1938, Burwell (14) presented
the hypothesis that the placenta acted as a modified arteriovenous (A-V)
fistula which may account for the circulating changes seen during preg
nancy. The hemodynamic changes seen in pregnancy (increased cardiac
output, increased heart rate, a narrowed A-V 02 difference, and a
widened pulse pressure) are consistent with features seen in an A-V
fistula (75). Burwell went on to describe the changes in placental
circulation prior to tenn that may be responsible for a reduction in
the A-V shunt effect which may in turn account for the return of cardiac
output and A-V oxygen difference towards nonnal just before delivery.
Recent studies have shown that increased cardiac output in human pregnancy
occurs by the first trimester (35, 8~) but there is not a significant
increase in uterine blood flow at that time to account for the A-V
shunt effect (3, 53). When comparing the ventricular enlargement of
pregnancy to other physiologic or pathophysiologic states associated
with ventricular enlargement, obvious differences emerge (Table I).
Tab1e I. Sul"llT\ary of c1rdiovascu1ar a1teratio~s sttn durin; preg~e~c; •• cnroriic vo1u"tf over1oadin; (e~~erirne~ta1 A·V fistula) •~d p~ysica1 tre~~ing.
Cardiovucular Paramrter
co sv lVEOi' LVED~ l Vtr. SUI
Pre;~e?'l:,y + + • + • +
Cnroric vclu~e overload + ... + .. ? ?
Pt\)~ ical tre ini n; ... + • + + .. CO • c.ardiec: output; SV • stroke volume; LV£0f: • l•ft v•rtric~lar tnd-diasto1ic pr•s~ure; LYEO~ • left v•ntricui1r end-di1stoiic dimer.sior., LV"''i • left ventr1cuhr w111 thickness; R:W • rt~iw~: wall thickness ratio

11
Ross and Mccullagh investigated the mechanisms of adaptation to
chronic ventricular volume overload (50,70). The volume overload is
produced by the surgical creation of an arteriovenous fistula between
the aorta and inferior vena cava. The left-to-right shunt places a
large volume overload on the left ventricle. Left ventricular dimen
sions were measured by cineradiography using radiopaque subendocardial
beads and left ventricular end-diastolic pressure (LVEDP) was measured
with an in-dwelling catheter. A progressive increase in LVEDP, stroke
volume and left ventricular end-diastolic volume was observed over an
eight- to ten-week period. No significant depression of contractility,
as assessed by mean velocity of wall shortening, was noted during this
period despite a markedly elevated LVEDP and left ventricular hyper
trophy. Despite a shift of the left ventricular end-diastolic pressure
volume curve to the right, left ventricular compliance was decreased.
The degree of left ventricular enlargement is comparable in both
arteriovenous fistula and pregnancy, an 11% and a 10% increase in end
diastolic dimensions, respectively. In contrast, left ventricular
enlargement in pregnancy is not associated with an increased filling
pressure (4), suggesting that ventricular compliance is increased or
geometric remodeling occurs during pregnancy.
Echocardiographic studies of the athlete's heart reveal changes
even less similar to the left ventricle during pregnancy (18, 59, 69).
Left ventricular end-diastolic volume is increased, but left ventricular
mass increases markedly with training which decreases the radius:wall
thickness ratio. A concurrent increase in right ventricular dimension
and mass was also observed. Neither of these changes seen in trained
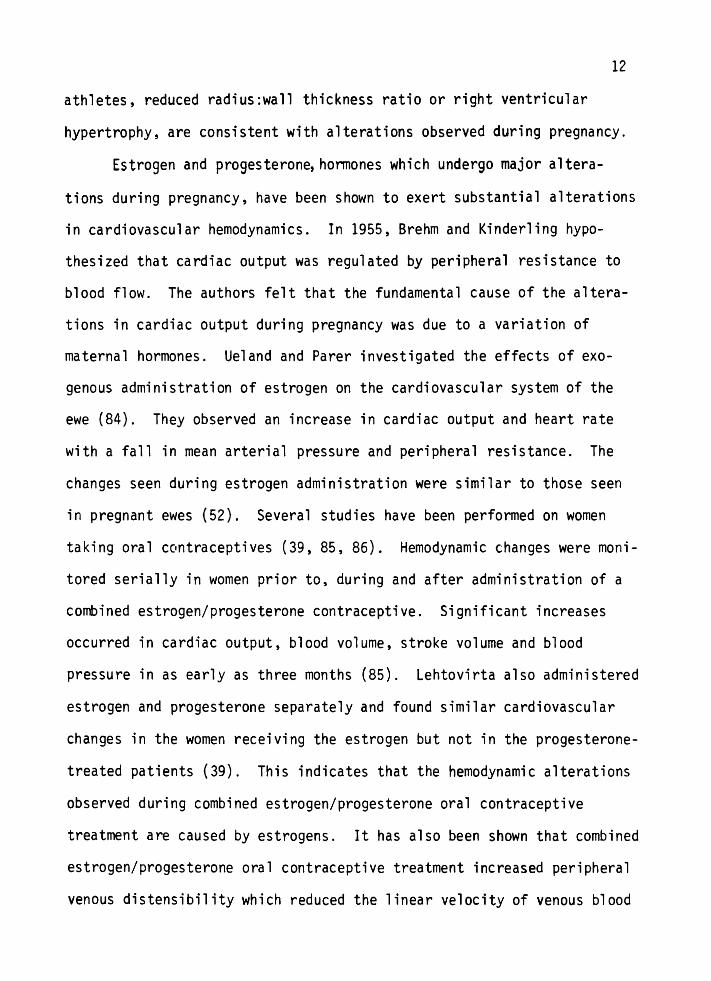
12
athletes, reduced radius:wall thickness ratio or right ventricular
hypertrophy, are consistent with alterations observed during pregnancy.
Estrogen and progesterone, honnones which undergo major altera
tions during pregnancy, have been shown to exert substantial alterations
in cardiovascular hemodynamics. In 1955, Brehm and Kinderling hypo
thesized that cardiac output was regulated by peripheral resistance to
blood flow. The authors felt that the fundamental cause of the altera
tions in cardiac output during pregnancy was due to a variation of
maternal hormones. Ueland and Parer investigated the effects of exo
genous administration of estrogen on the cardiovascular system of the
ewe (84). They observed an increase in cardiac output and heart rate
with a fall in mean arterial pressure and peripheral resistance. The
changes seen during estrogen administration were similar to those seen
in pregnant ewes (52). Several studies have been performed on women
taking oral contraceptives (39, 85, 86). Hemodynamic changes were moni
tored serially in women prior to, during and after administration of a
combined estrogen/progesterone contraceptive. Significant increases
occurred in cardiac output, blood volume, stroke volume and blood
pressure in as early as three months (85). Lehtovirta also administered
estrogen and progesterone separately and found similar cardiovascular
changes in the women receiving the estrogen but not in the progesterone
treated patients (39). This indicates that the hemodynamic alterations
observed during combined estrogen/progesterone oral contraceptive
treatment are caused by estrogens. It has also been shown that combined
estrogen/progesterone oral contraceptive treatment increased peripheral
venous distensibility which reduced the linear velocity of venous blood
13
flow by increasing the venous volume (26, 40). A recent study has con
firmed the changes seen during oral contraceptive treatment but showed
that venous compliance is also modified by progesterone (20). They
also demonstrated that pregnant women differed from women on oral con
traceptives in regard to peripheral circulation. During pregnancy
there is a marked increase in blood flow with secondary vasodilation.
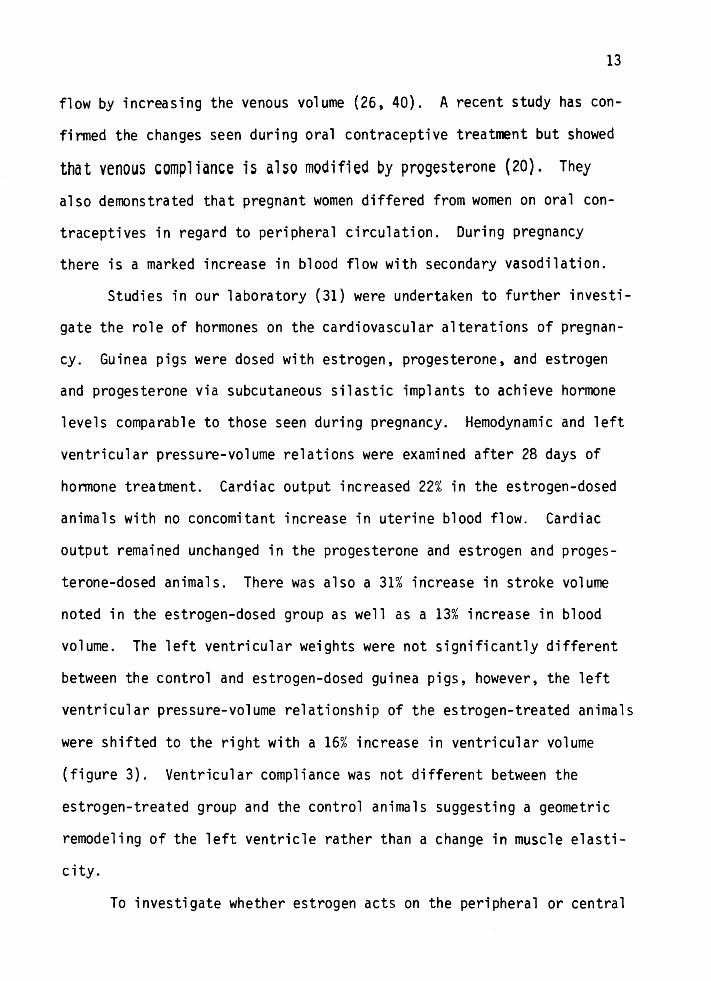
Studies in our laboratory (31) were undertaken to further investi
gate the role of hormones on the cardiovascular alterations of pregnan
cy. Guinea pigs were dosed with estrogen, progesterone, and estrogen
and progesterone via subcutaneous silastic implants to achieve hormone
levels comparable to those seen during pregnancy. Hemodynamic and left
ventricular pressure-volume relations were examined after 28 days of
hormone treatment. Cardiac output increased 22% in the estrogen-dosed
animals with no concomitant increase in uterine blood flow. Cardiac
output remained unchanged in the progesterone and estrogen and proges
terone-dosed animals. There was also a 31% increase in stroke volume
noted in the estrogen-dosed group as well as a 13% increase in blood
volume. The left ventricular weights were not significantly different
between the control and estrogen-dosed guinea pigs, however, the left
ventricular pressure-volume relationship of the estrogen-treated animals
were shifted to the right with a 16% increase in ventricular volume
(figure 3). Ventricular compliance was not different between the
estrogen-treated group and the control animals suggesting a geometric
remodeling of the left ventricle rather than a change in muscle elasti
city.
To investigate whether estrogen acts on the peripheral or central

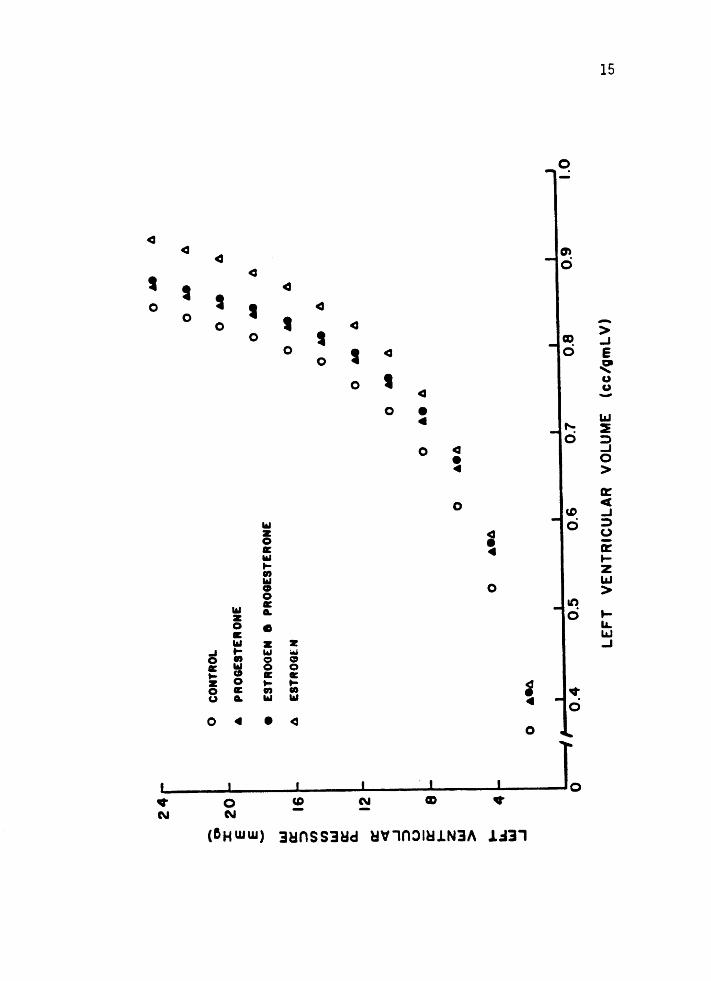
Figure 3. The in vit~o left ventricular (LV) pressurevolume curve is significantly shifted to the
right in the estrogen-treated animals. At 10 mm Hg distending pressure, the LV volume
was increased by 18%.
14
24
-0 x:
20
E
E
l&J er:
::>
U>
Cl)
l&J er: ~
a::
<(
...J ::>
u a::
t z l&J >
16
12 8
...
4 I&
. "' _,
0 CO
NTRO
L
• PR
OG
ESTE
RON
E
e ES
TRO
GEN
8
PRO
GES
TERO
NE
A
ESTR
OG
EN
0 ••A
0
•eA
0
0 ••A
0 ,.
A
0 6
9
A
0 M
A
0 M
A
0 M
A
0 Il
l A
0 6
9
A
0 -
A
&e
A
I .,
I I
I I
I I
I 0
, 0
.4
0.5
0
.6
0.7
0.8
0
.9
1.0
LE
FT
V
EN
TR
ICU
LA
R
VO
LUM
E
(cc/g
mL
V)
......
U'1

cardiovascular system, several studies have examined the location of
steroid receptors (46, 48, 49, 82). These studies all indicate that
16
the heart and major arteries of several mammalian species contain
androgen and estrogen receptors in distinctive patterns of distribution
among muscle and connective tissue cells suggesting that the central
cardiovascular system may be a target organ for these hormones.

III METHODS
EXPERIMENTAL ANIMAL SELECTION
The guinea pig was chosen as the experimental animal model to
study maternal cardiovascular adaptations to pregnancy for several rea
sons. Guinea pigs assume an unusually large reproductive burden as
evidenced by the large weight of its fetuses which is approximately 30%
of maternal weight by the end of gestation. In addition to a relatively
long gestation period of 68 days which allows for long-term cardio
vascular adaptations, the honnonal profile of the guinea pig during
pregnancy is qualitatively more similar than other animals to humans, as
both have an early rise in circulating progesterone levels and a latter
rise in estrogen (see figure 4). A previous study (60) has also demon
strated that cardiac enlargement occurs during pregnancy in the guinea
pig. Finally, the guinea pig is small, easily maintained and relative
ly inexpensive when compared to larger animals, yet they are large
enough to allow adequate instrumentation. These combined characteris
tics make the guinea pig an attractive animal in which to study peri
natal physiology.
ANIMAL PREPARATION AND INSTRUMENTATION
All animals used in this study were virgin female guinea pigs
(Duncan-Hartley strain) between 500 and 800 grams in body weight. The
animals were housed in the Oregon Health Sciences University's Depart
ment of Animal Care facilities in groups of three or four and the

no
o .... p •00 .......... ,
0 0
0 p
Figure 4. Circulating hormone levels during pregnancy in five species. The solid line indicates progesterone (P) and the dashed line estrogen (0).(91)
.._ ..
.,. 0 p
,,' '"' "'" '""' ,.., .. , •o• 'PC ••O 2•C 28C IE.
'""''"'IC"'"''"'I ~-P.O •2 .. °! •o •OO 100
• ){' )00 60
• 10 10
0 0 0 2 • 6
10 0 p
0 0 •0 20 )0 •o ~o 60 10
'"' ,..,·•1"" ..,, .. ,Co•
•O 10
S-.to 100 • I
f 600
~ •oo
lOO • 0 ~ c:. I '
0 20 •o 60 IC IOC •20 ••O
6
• ,,' ---
0
Dot\ II c ~'' P<
, , ,
I I I
'
18

19
temperature maintained at 21°c. A twelve-hour light cycle was employed
and the guinea pigs had free access to food and water at all times.
In order to study the cardiovascular changes at various stages of
pregnancy, the animals were studied at 20, 40, and 60 days of gestation.
The animals were received over a five-month period, ear-tagged for
identification and prospectively weight-matched and randomly assigned
to one of the following study groups:
CONTROL (nonpregnant) PREGNANT (Day 20 of gestation) PREGNANT (Day 40 of gestation) PREGNANT (Day 60 of gestation)
The sows assigned to the pregnant groups were monitored daily to
determine when the animals were in estrus as detected by vaginal open
ing. At that time, the sows were caged with a boar for 48 hours to
provide a dated pregnancy. The sows' weights were recorded on Day O of
gestation for purposes of weight-matching. Pregnancy was verified by
palpation at 16-20 days of gestation.
On the day of the study, each animal was given an intramuscular
injection of 25 mg Ketamine and 0.15mg Xylazine to provide a surgical
level of anesthesia for instrumentation. A ventral neck incision was
made and the left carotid artery and jugular vein were dissected free
and isolated followed by an incision in the right groin to isolate the
superficial saphenous artery. Polyvinyl catheters (0.90 mm O.D., 0.50mm
l.D.) were used for all catheterization. The superficial saphenous
artery catheter was advanced to five cm which extended the tip of the
catheter into the abdominal aorta just below the renal arteries. This
catheter measured systemic arterial pressure and served as an arterial

reference catheter for cardiac output measurements. A right atrial
catheter was placed via the left jugular vein. The left ventricular
20
catheter was then introduced through the left carotid artery. The
catheter was directed into the ascending aorta with the aid of a stylet
and passed retrograde across the aortic valve into the left ventricle.
Following verification of catheter position by pressure monitoring, the
catheters were filled with a dilute heparin solution and capped. All
three catheters were tunneled subcutaneously to the back of the neck
where they were secured until the animal was studied. All animals were
allowed free access to food and water during the recovery period.
STUDY PROTOCOL
In Vivo Pressure Measurements
Between three and four hours after recovery from anesthesia, the
animals were placed in a cage providing limited restraint and allowed
to acclimate for a period of 30-45 minutes. Blood glucose levels were
determined immediately prior to the study. Right atrial, aortic and
left ventricular pressures were then simultaneously recorded with
Statham P-23Db transducers zeroed at midchest on a Beckman R-611 dyno
graph recorder.
Figure 5 demonstrates examples of pressures which were recorded
during the study. Heart rate was obtained from the left ventricular
pulse tracing and the respiratory rate was obtained from the right
atrial wave form which measured changes in the intrathoracic pressure
occurring with respiration.

Figure 5. Strip chart recordings (non-simultaneous) of Aortic (Ao), left ventricular (LV), and right
atrial (RA) pressures at the time of study.
The a wave and left ventricular end-diastolic
pressure (LVEDP) are easily recognized on the
LV tracing. Changes in intrathorasic pressure
that occured with respiration can be seen on
the RA tracing. Ao and RA stand for mean pressures.
21

22
- -~
c -~
c..-__ .----::::> c. c-=~
-~
J C._~ c.
----::::> ~ ·=::::::, c:-:-_-c::-~.
c:---~ c::--· ~ c::----~~
~~ c . -::::::::,
l c ~ c ~ c:--~
~] L ..
-::::> c.. ~
l c . c::--~
-~ C:- .. ~ I~ c -

23
Cardiac Output and Organ Blood Flows
Cardiac output and regional distribution of blood flows were then
obtained by a modified standard indicator dilution technique using 15
micron radioactive microspheres which are trapped on their first pass
through the circulation in the arteriolar or capillary vascular system
(27, 45).
When using microspheres, several important factors were considered
in order to insure accurate measurements of regional flow (8). First,
the microspheres must be evenly mixed and evenly distributed to all
major arteries leaving the injection site so that the spheres evenly
reach all branching sites. To obtain a distribution of spheres that is
similar to the flow of blood, the spheres used have a relative density
of 1.3 gm/ml which is similar to the density of blood and were
passed through a 27-gauge needle and mixed with Dextran and saline
immediately prior to injection to disperse any microsphere aggregates.
The spheres were injected into the left ventricle to insure mixing
throughout the blood prior to the first major arterial branching.
It is also essential that all microspheres are trapped in the
microcirculation and that a significant number not bypass any organs of
interest. Since the diameter of capillaries and arteriovenous anasto
moses may vary considerably among organs, the size of the microsphere
selected must assure that injected microspheres do not pass through the
organ and into the venous system (45, 61, 74). For this study, 15
micron microspheres were selected as they seem to balance the need for
distribution of microspheres similar to red blood cells with the
absence of significant non-entrapment.

24
To obtain a measurement, the arterial reference catheter (abdomi-
nal aortic catheter) was attached via a blunt needle to a previously
weighed triton heparinized 5 ml glass syringe. The syringe was placed
in a Harvard withdrawal pump set at a constant withdrawal rate of .68
ml/min. The withdrawal was started, and a sample of approximately
1 million 15 micron single-labeled radioactive microspheres was injected
into th~ left ventricle over a period of 30 seconds, followed by a slow
two ml flush of normal saline to rinse the catheter of all microspheres.
The withdrawal was continued for three minutes. The syringe was then
reweighed in order to access accuracy of the blood withdrawal. The
triton hemolyzed blood was then carefully transferred into a counting
vial and the syringe rinsed repeatedly with distilled water to wash out
any microspheres and residual blood.
The kidneys, lungs, and uterus and contents were dissected free
and desiccated in alcohol. The remaining carcass was ashed to reduce
the mass of tissue and to allow for even distribution of microspheres
in the ashed aliquots.
The radioactivity of the reference sample, organs, and eight well
mixed weighed aliquots of ashed carcass were then determined using a
512-channel pulse-height analyzer (Packard Autogamma Counter). Organ
and carcass blood flow was calculated by the following formulas:
organ ( cpm) ( ) reference sample (cpm) x BWR = organ blood flow ml/min
x BWR x TAW = carcass blood flow (ml/min)
cpm = counts per minute BWR = blood withdrawal rate

25
AAW =aliquot ash weight
TAW = total carcass ash weight
To detennine cardiac output, all organ and carcass blood flows were
added together giving total cardiac output.
The left and right kidneys were counted separately to serve as an
internal check of the adequacy of microsphere mixing. The lungs were
counted to ensure to adequacy of capillary entrapment of the micro
spheres.
Blood Gas Analysis
Following microsphere injection and reference sample collection,
a one ml sample of heparinized arterial blood was taken from the aortic
catheter. pH, pC02, and p02 were measured with a Radiometer BMS Mark 3
Micro Blood Gas Analyzer calibrated at 39°C. Hematocrit was determined
from packed cell volume after five minutes of centrifugation.
Hormone Analysis
An additional one ml sample was obtained for steroid hormone
analysis. The serum was extracted and stored at -20°c until steroid
analysis was performed. Estradiol (E2), estrone (E1) and progesterone
(P4) were measured by a radioimmunoassay technique (67, 68). An aliquot
of the serum sample was placed in a small tube with an equal volume of
distilled water and then mixed with four to six ml of distilled ether.
The mixture was centrifuged and the aqueous phase quick frozen by
irrmersion into a methanol/dry ice bath and the ether extract was removed
by decanting while the aqueous phase was kept frozen. The extracts were
dried and further concentrated w1th successive washes of 2% ethanol ether.

26
A column was prepared of Sephadex LH-20 with a Hexane:Benzene:
Methanol (62:20:13) solvent system to separate the neutral steroids
from the estrogens and progesterone. The samples were applied to the
columns and allowed to flow into the Sephadex bed before adding the
eluting solvent. El, E2 and p4 fractions were obtained by adding
solvent and collecting the particular fractions. Standard curves were
prepared by placing 8 known concentrations of El, E2 and P4 into cul
ture tubes in duplicate with several blank tubes for each standard
curve. Appropriate antibodies and tritium-labeled solution were added
to the corresponding standard curve, sample, and blank tubes and then
placed on ice overnight. Dextran-coated charcoal solution was next
added to the tubes for 15 minutes, the tubes centrifuged and the super
natant decanted into scintillation vials containing a detergent solu
tion. Standard curves were constructed and the amount of hormone in
the plasma was interpolated from the curve. Corrections for blanks
were made and the data expressed in either picograms/ml {pg/ml) or
nanograms/ml {ng/ml) of serum. This method is sensitive enough to
detect as little as two pg/ml of estrogen or progesterone (68).
Blood Volume Measurements
Blood volume (BV) was measured by standard indicator techniques
employing Evans blue dye (T-1824) as described by Wang (87). A measured
dose of Evans blue dye was infused into the left ventricular catheter
for optimal mixing and was rinsed immediately with two ml of saline to
insure that all of the dye was delivered to the circulatory system. The
dye was allowed to circulate for five minutes and then a one ml blood

27
sample was obtained from the aortic catheter (37). The plasma from the
sample was removed by centrifugation and the dye concentration was
measured at 620 nm with a spectrophotometer zeroed with a blank plasma
reference from the same animal. The plasma volume (PV) was then calcu
lated from a known standard curve. This value combined with hematocrit,
allows the calculation of blood volume by the following equation.
8 v ( m 1 ) = PV ( m 1 ) x 1 ~o 100 - He t ( I=)
In Vitro Pressure-Volume Curves
After hemodynamic data was obtained, the animals were anesthetized
with an I.V. injection of a s~ort-acting barbiturate followed by a one
ml injection of saturated potassium chloride to produce diastolic
cardiac arrest. The chest was rapidly opened, and the heart dissected
free and removed. The right ventricular outflow tract was opened widely
and the right ventricular free wall and papillary muscles were dissected
from the septum. The incision was then extended across the atrial-
ventricular groove ar:d right atrium trimmed back to the interatrial sep-
tum. A snugly-fitting double lumen grooved plug as seen in figure 6 was
Figure 6. Apparatus used to isolate left ventricle during pressure-volume measurements.
~==-. Pressure Transducer
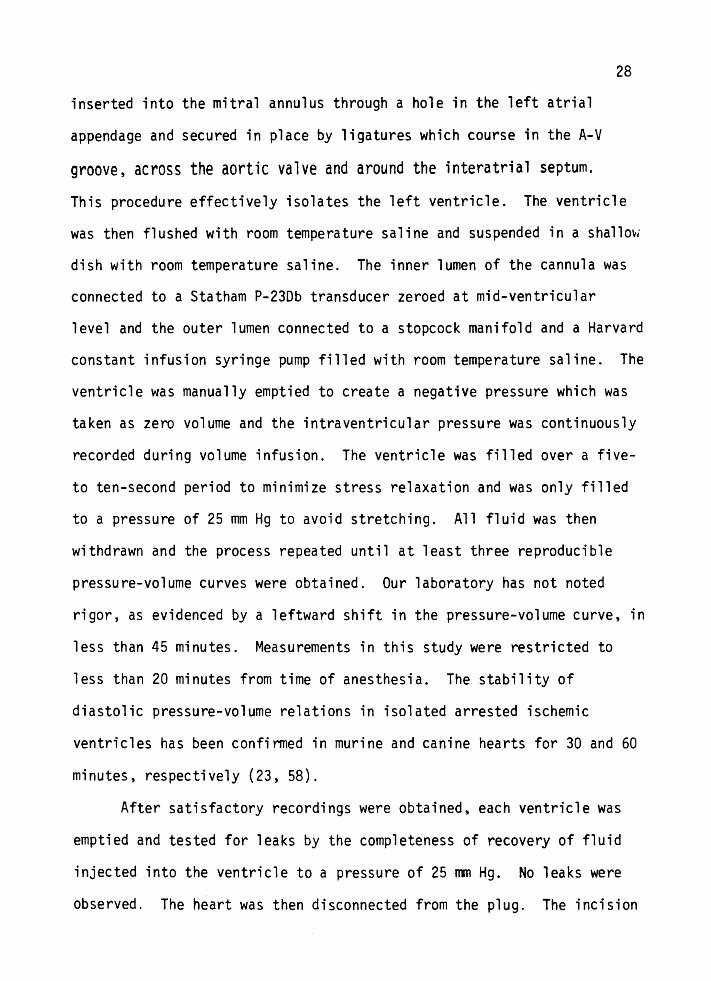
inserted into the mitral annulus through a hole in the left atrial
appendage and secured in place by ligatures which course in the A-V
groove, across the aortic valve and around the interatrial septum.
28
This procedure effectively isolates the left ventricle. The ventricle
was then flushed with room temperature saline and suspended in a shallmJ
dish with room temperature saline. The inner lumen of the cannula was
connected to a Statham P-23Db transducer zeroed at mid-ventricular
level and the outer lumen connected to a stopcock manifold and a Harvard
constant infusion syringe pump filled with room temperature saline. The
ventricle was manually emptied to create a negative pressure which was
taken as zero volume and the intraventricular pressure was continuously
recorded during volume infusion. The ventricle was filled over a five
to ten-second period to minimize stress relaxation and was only filled
to a pressure of 25 mm Hg to avoid stretching. All fluid was then
withdrawn and the process repeated until at least three reproducible
pressure-volume curves were obtained. Our laboratory has not noted
rigor, as evidenced by a leftward shift in the pressure-volume curve, in
less than 45 minutes. Measurements in this study were restricted to
less than 20 minutes from time of anesthesia. The stability of
diastolic pressure-volume relations in isolated arrested ischemic
ventricles has been confirmed in murine and canine hearts for 30 and 60
minutes, respectively (23, 58).
After satisfactory recordings were obtained, each ventricle was
emptied and tested for leaks by the completeness of recovery of fluid
injected into the ventricle to a pressure of 25 mn Hg. No leaks were
observed. The heart was then disconnected from the plug. The incision

29
of the atrioventricular groove was then completed, removing the right
and left atrium from the left ventricle. The aorta was then severed at
the aortic valve and the left ventricle was opened from the aortic
annulus to the apex, blotted and weighed.
Pressure-time recordings during infusion were converted to pres
sure-volume curves utilizing the known infusion rate. The Harvard
syringe pump was calibrated after each experiment by duplicate 60-second
infusions into a graduated cylinder. The mean of three pressure-volume
curves during infusions was obtained for each left ventricle by aver
aging pressure at 0.05 ml increments of volume. The volume of each
even value of pressure was obtained for analysis by interpolation from
the pressure-volume curve over a range of intraventricular pressures
from 2-24 mm Hg.
In order to analyze any significant differences between these
pressure-volume curves, linear transformations were performed on the
data. As pressure increases exponentially with volume, stiffness
constants K1 and K2 were calculated by fitting one exponential function
of the form P=bekv to the data from the low pressure range (2 to 20 mm
Hg) and a second exponential to the upper pressure range (12 to 24 mm
Hg){21). Left ventricular chamber stiffness, derived as dP/dV=KP, and
ventricular volumes were then compared from their exponential functions.
Ventricular dimensions, wall stress, and stress-elastic modulus
relationships were determined by using a thin-walled spherical model
(34). The validity of this model in providing reliable calculations
will be discussed later. The pressure-volume curves were approximated
by a polynomial (fourth or fifth order) and dP/dV detennined by

30
differentiation. Ventricular radius and wall thickness were calculated
from instantaneous volume and the mass of the ventricle {Equations 1
and 2).
1. V = (4/3)n (r-h/2)2
2. h = w/4n r2p)
Wall stress (o) was determined from Equation 3,
Pr 0 = 2h 3.
and elastic modulus from Equation 4, assuming h/2 is small compared to
rand that V = 4/3n r3.
4. E = 3o (V/P) dP/dV + 1
P = ventricular pressure V = ventricular volume
r = mean radius of ventricle h = wall thickness W = ventricular weight p =density of ventricle (1.05 g·ml- 1)
a = wa 11 stress E = elastic modulus
By simultaneous inspection of the pressure-volume relationship,
Equation 3 and the first order differentiation of P with respect to V
for the polynomial, the elastic modulus was calculated at values of wall
stress from 4-24 mm Hg utilizing a Data General computer.
Autopsy Data
After pressure-volume curves were obtained, the left and right
kidneys, lungs, and the uterus and contents were removed from each
animal and carefully weighed and the catheter positions were verified.
In the pregnant animals, each separate fetus and placenta was removed

31
from the uterus and its position and weight were recorded. All organs
and reproductive products were dried in alcohol and the radioactivity
measured as described previously.
Effects of Anesthesia
In order to ascertain the completeness of recovery from anesthe
sia in this study, eight additional guinea pigs were instrumented as
previously described with the same anesthesia mixture (25 mg Ketamine,
0.15mg Xylazine). The animals were allowed to recover for four to six
days with free access to food and water. After the recovery period,
they were weighed and placed in a limited restraint cage and allowed to
acclimate for 30-45 minutes. Pressures were then obtained followed by
an arterial blood gas sample and cardiac output determination with
radioactive microspheres. The animals were then anesthetized with the
identical anesthesia mixture used during the pregnancy study and serial
pressures were taken every 30 minutes. Three to four hours after
recovery from the anesthesia (as evidenced by upright posture and
mobility) pressures, arterial blood gases, and cardiac outputs were
again measured. The animal remained in the limited restraint cage
throughout the recovery and measurement periods. The animals were then
sacrificed and the kidneys were removed and counted separately and the
carcass ashed. Cardiac output was determined as previously described.
Data Analysis
The significance of differences between means of hemodynamic
measurements was determined by analysis of variance. The significance
of differences between pressure-volume coordinates for the different

study groups was determined by analysis of covariance for the linear
relationships defined by pressure as a mono-exponential function of
32
volume. The approximation of pressure-volume curves by polynomials was
accomplished by computing F values from the reduction of the sum of
squares for successive Nth order polynomials. The Nth order polynomial
with an F value indicating a probability of difference of less than 5%
was used (77). The ventricular dimensions derived from the thin-wall
spherical model were compared by analysis of variance and the linear
stress elastic modulus relationship by analysis of covariance. When an
F value indicated a significant difference (P <0.05), a multiple compari
sons test was performed (Scheffe test) to compare the differences
between individual pairs of means (65). This test consists of computing
an F statistic for each comparison using the following formula.
(x1 - x2)2 F = M Se (n1 + n2/n1n2)
The mean square for error (MSe) comes from the ANOVA. The F values
obtained from the Scheffe test are then divided by the number of groups
compared in the ANOVA minus one. This value is then compared to a
critical value from a table to determine the probability of a
difference.

RESULTS
ANIMAL WELL-BEING
Control and pregnant groups were well-matched as evidenced by
their similar bc•dy weights (shown in Table II) at the time of random
ization into study groups. All of the pregnant animals gained weight
during the study with a 70% increase in maternal weight occurring by
60 days of gestation. The individual organ weights are also shown on
Table II. Fetal and uterine and placental weights were significantly
increased during pregnancy (p<0.001) as was expected with the greatest
gain occurring during the last trimester of pregnancy. Kidney weights,
wet lung weights and left ventricular weights were unchanged during
pregnancy despite the increase in total maternal weight.
Arterial blood gases obtained at the end of the study are shown
in Table III. These values are similar to those previously reported in
control animals (6). To further access the recovery of the animals from
anesthesia, an additional set of eight animals were anesthetized with a
similar anesthesia mixture (25 mg Ketamine and0.15 mg Xylazine). Hemo
dynamic data during and after recovery from anesthesia are reported in
Table IV and Figure 7. Cardiac output, heart rate and mean arterial
pressure were not significantly different between the control values
before anesthesia and four hours after recovery. These data further
indicate that the animals had completely recovered from anesthesia.

Table II. Body and organ weights of control 1nd pregnant animals.
PREGNANT GROUPS
CONTROL 20-0AV (n=14) (n=ll)
Starting Mass 620 ± 91 629 ± 88
Study Mass 620 ± 91 720 ± 90
Right Kidney Mass 2.30 = .36 2.45±.31
Left Kidney Mass 2.35! .37 2.60 ± .34
Lung Wet Mass 3.11 ± .46 3.91±.71
LV Mass 1.16! .17 1.19±.16
Uterus & Contents 1.2 ± .3 8.5 ~ 2.9'*
Feta 1 Mass 0 .8 ± .4
Results are expressed as mean weight (gm) : S.O. *F<.001; control vs. pregnant group
40-DAY 60-0AY (n=l3) ( n=13)
595 ± 71 608: 51
812 ± 75 1.033 ± 67
2 .42: .27 2.64 ± .33
2.49 ± .30 2 .52: .27
3.64! .36 3.90 ± .82
1.17±.10 1.18±.13
88. 2 ± 24. 4'* 298. 3 ± 52. 6*
45. 9 ± 13. 9'* 250. 9 ± 47. 8*
34

Table III. Arter;al blood gases analys;s of control and pregnant gu;nea pigs.
PREGNANT GROUPS
CONTROL 20-0AY 40-DAY (n=l4) ( n= 11) (n=l3)
Po2
(torr) 81.7:!:8.0 81.l:!:l0.7 83. 5 :!: 7. 4
Pcoz (torr) 36.4 :!: 5.4 32 .6:: 3. 9 33.8 :!: 4.3
pH 7. 37 :!: . OS 7. 39 ! . 03 7 .40 :!: .04
Results are expressed as mean :!: S.O.
35
60-DAY (n=l3)
86. 5 :!: 10. 4
34 .4 :!: 4. 5
7 .40 :!: • 04

Table lV. Anesthesia recovery data on eight additional guinea pigs.
Heart Rate
Cardiac Output (ml!~in/kg)
Stroke Volu~e (cc)
P02
(torr)
PC02
(torr)
pH
Respirator_. rate-
PRE· ANESTHESIA
(N=B)
304 ! 41
68 : 7
376 : 97
o.9E : o.1e
72.4: 4.1
3t.6 : 4.8
7 .42 : .04
104 ! 35
Result~ are cx~resse~ as mean : S.D.
POSTANESTHESIA
(N=B)
303 : 41
66 :: 7
413 : 131
0.84 :: 0.13
81.0 : 13.0
34 .1 ! 3.0
7.43:: .023
113 : 24
36
Figure 7. Hemodynamic data from anesthesia recovery showing that mean arterial pressure and heart rate both returned to control values within four hours. Results are expressed as mean ± SEM.
37

400
200
!- - - - - - - - - - - - --!
! !
0 2 4
!- - - - - - - +- - - --1 !
0 2 4
Hours Post Anesthesia
38

IN VIVO PRESSURE MEASUREMENTS
Hemodynamic data from the control and pregnant guinea pigs are
presented in Table V. There was no statistically significant differ
ence in heart and respiratory rates, or aortic, right atrial or left
ventricular end-diastolic pressures during pregnancy. Pulse pressure
also remained constant throughout pregnancy.
CARDIAC OUTPUT AND REGIONAL BLOOD FLOW
Cardiac output and regional blood flow data are reported in
39
Table VI. Total cardiac output was increased by 27% (p<0.05) as early
as Day 20 of gestation. Although the cardiac output at Day 40 and Day
60 are not statistically elevated over nonpregnant control values, they
appear to be gradually returning to pre-pregnant values from a high at
20 days. Uterine blood flow was not significantly increased until
Day 40 of pregnancy. Between Day 40 and 60 uterine blood flow increased
only 8% while uterus and content weight increased over 200% during the
same period. Left ventricular blood flow remained unchanged during
pregnancy while renal blood flow exhibited a 25% decrease (p <0.05) at 40
days. Stroke volume was reported earlier in Table VI and was increased
253 at 20 days of pregnancy and remained elevated throughout the remain
der of gestation.
HORMONE DATA
Estradiol, estrone and progesterone were measured at the end of
the study in control and pregnant animals and the results are reported

40
Table v. Hemodynamic data from control and pregnant guinea pigs.
PREGNANT &ROUPS
CONTROL 20-DAY 40-DAY 60-DAV (n•l4) (n•lO) (n•13) (n•9)
Heart rate 284 '! 35 289 '! 17 281 t 34 259 ! 35
MAP {nnHg) 63: 6 61: s 6h8 62 ! 7
Pu1 se pressure (nrnHg) 27 '! 7 25 '! 5 25: 6 23: 6
LVEOP (nriHg) 5:3 5 '! 3 5 '! 3 h4
Mean RA pressure (nrnHg) 1: 2 0 '! 1 t: 2 1: 1
Res pi "'atory rate 95: 33 125: 45 108: 22 129 '! 37
Stroke volume 0.73: .12 0. 91 : . 24• o.91: .ts• o. 96: . ts•
Results are expressed as mean : S.D. •: <.05• control vs. pregnant group. MAP • mea~ arterial pressure; LVEOP = left ventricular end-diastolic pressure; RA = rig~t etriai.

Table VI. Cardiac output and regional blood flows of control and pregnant animals.
Cardiac Output (ml/min)
Lung Blood Flow (ml/min)
LV Blood Flow (ml/min)
CONTROL (n=l3)
206: 25
7.8:4.7
4.2±1.5
20-0AY (n=lO)
261 ± 42'*
12.0± 7.1
4.8:t 1.3
PREGNANT GROUPS
40-DAY (n=lO)
251 :!: 54
16.7:t 5.6
4.7t2.2
60-0AY (n=B)
241 :!: 34
14.8:7.8
4.3:!: 1.9
Uterine Blood Flow {ml/min) 2.1±2.7 3.5 ± 1.8 24.2 ± 7. l** 26.2 ± 9.2*'*
Renal Blood Flow {ml/min} 30.6± 5.9 33.1 ± 6 .8 22.8 ± 4.5* 28.7± 3.8
Results are expressed as mean : S.D. *P<.05. **P<.001; control vs. pregnant group
41

42
in Table VII. Estradiol exhibited a steady gradual increase throughout
pregnancy and reached a peak level of twice that of control at end
gestation. Estrone remained constant except for a marked increase at
40 days which returned to control values by Day 60 of gestation. There
was essentially no circulating progesterone present in the nonpregnant
control animals but the progesterone levels markedly increased by day
20 and continued to rise until a peak value was observed at 40 days.
At the end of gestation, progesterone has declined from the peak value
at 40 days but was still significantly elevated over control values.
BLOOD VOLUME DATA
Blood volume steadily increased during pregnancy reaching a peak
volume of 50% above pre-pregnant values at end-gestation as seen in
Table VIII. Hematocrit values were not significantly different during
pregnancy, therefore indicating that total red cell volume also increases with
increasing plasma volume (Figure 8). The blood volume and hematocrit
values for the control animals are similar to previously reported normal
values (16).
PRESSURE-VOLUME DATA
A recording of left ventricular pressure during continuous filling
is shown in Figure 9. The curve shows the characteristic shape present
when the left ventricle is filled from zero volume. Negative pressure
was required to deform the ventricle and achieve complete emptying.
Negative pressure and puckering of the ventricle were sought in all

Table VII. Steroid hormone analysis data on control and pregnant guinea pigs. Results are expressed in picograms (pg/ml) or nanograms (ng'ml) of plasma.
CONTROL (n=l2)
Estrone (pg/rr,1) 29.7::6.3
Estradiol (pg/rn1) 22.2: E.4
20-DAY {n=9)
29. 8:: 5. 3
29.2:23.9
PREGNANT GROUPS
40-0AY (n=9)
55. 7:: 7 .1 '*'*
35. 9:: 7. 5'*
60-0AY (n=l3)
33. 9:: 3. 3
45.5: 12.t*
Progesterone (ng/rr.1) 2.1: 1.0 105.7:56.0""* 796.7:341.1'*'* 168.4::95.1'*'*
Results are expressed as mean :: S.O. •; <.05, ••: '.001; control vs. pregnant grou:.
43

Table VIII. Blood volume and hematocrit values for nonpregnant control and pregnant guinea pigs.
CO\ ... R:J~ (n=l4)
Blood vclur::e (rr;l) 50.4: 14.C
Hematocrit (-) 35.4: 2.6
Results exrressed as mear. = S.D.
20-0kY (n=lO)
65.2: 17.6
36.2: 2.4
PREGNANi GROIJPS
40-0AY (n=l3)
60-DAY (n=l3)
69. 0: 14. 0* 75. 8: 5, 5u
33.3:3.9 35.1:2.5
·~ <.01. **~ <.OCl; control vs. pregnant group
44

45
Figure 8. Total blood volume and total red cell volume
during pregnancy. Blood volume data expressed
as mean ± S.D.
80
60
20
o Total Blood Volume 6 Total Red Cell Volume
0
0 20 40 60
Days of Gestation

f 1 ~ tt t I(
~ ~ ·~ ~ ~
~
46
Figure 9. lntr1ventricul1r pressure was recorded during filling of the ventricle with 1 c1libr1ted syringe p1111p. The pump was 1llowed to strike the syringe 1t speed to avoid v1ri1ble flow
30
20
10
0
-10
during the start of infusion. When the p1111p was stopped. stress rel1a1tion was evident because pressure decayed 1t constant vol&111e. Accordingly. since pressure-voluine loops showed hysteresis only the pressul"f-volume curve during infusion was used for 1n1lysis. Filling rite 1nd 1111aimum distending pressure were the s1me for each of the ventricles elieinating differential visoelastic effects between pressure-volt.lfte relations obt1ined from ventricle of control or
pregnant 1nimals.
.,_, HC .. ---""'-----"-\ ___ -...... _______ ''----'-·----~-
b . ·----------1r--_J INFUSION RATE QIBml ·sec·•

47
studies to assure a reproducible zero volume. The onset of filling is
identified by the rapid increase volume on the record.
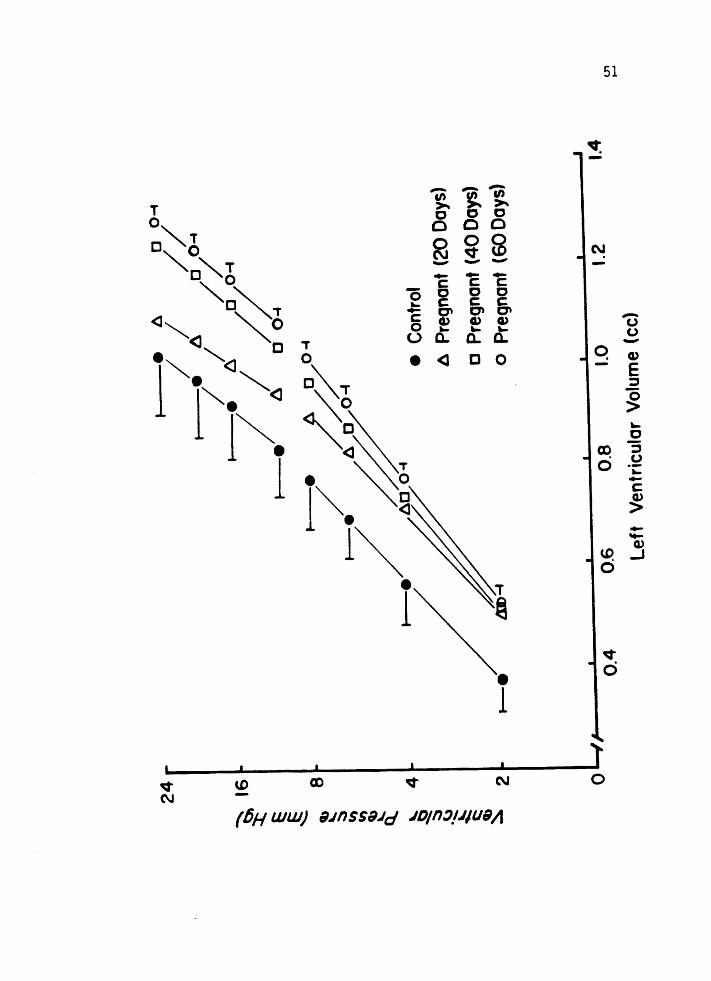
Ventricular pressure-volume relations are illustrated in Figures
10 and 11. For any given left ventricular pressure, mean left ventri
cular volume was greater for the pregnant animals compared to the
nonpregnant controls. At 8 mm Hg distending pressure, left ventricular
vo 1 ume was increased by 16% ( p <0.05) at Day 20, 25% ( p <0 .005) at Day 40
and 31 % ( p <0.001) over nonpregnant control values by Day 60 of gesta
tion. Since there was not a significant difference of left ventricular
weights between any of the study groups, the ventricular volumes were
not normalized to ventricular weight. Calculated left ventricular
dimensions from a thin-wall spherical model are given in Table IX.
Left ventricular radius progressively increased during pregnancy with a
concomitant decrease in left ventricular wall thickness resulting in an
increasing radius: wall thickness ratio throughout pregnancy.
Left ventricular mechanical and material properties were also
examined. Left ventricular stiffness coefficients (K1 and K2) were
determined assuming that pressure is a monoexponential function of
volume. Figure 11 shows that the log pressure-volume relationships are
linear over a range of pressures. Analysis of covariance of the linear
regression of the log pressure-volume relationship showed no significant
difference in the slopes between the study groups (Table X). In addi
tion, the ela~tic modulus was determined at constant levels of stress
assuming thin-wall spherical geometry. Figure 12 demonstrates that the
stress-elastic modulus relationship was linear for the nonpregnant
control and pregnant animals. There was no statistical difference

Figure 10.· The in vitPo left ventricular (LV) pressure volume curves of the control and pregnant guinea pigs. Results are expressed as mean ± S.D. on the left and ± S.E.M. on the right.
48

49
0 0
0 0 D 0
a 0 N -a c 0
c 0 <I <J c 0
<3 <I
• <3 a T q • 0 ,.....
• <3 (.)
<3 .u • c -• <I Cl>
• 0 E <3
~
• c ~ • <I CX)
~
.!2 0 ~
• 0 (.) ·-- - - l ~
Cf) Cf) Cf) a ... ~ ~ ~
c 0 0 0 <3 ~ c c c • 0 0 @
... N v -.....
- - - CD Cl> - - - _J
c c c 0 0 0 0 0 ._ c c c • - C'I C'I C'I c CL> CL> CL> 0 ._ ._ ._ e u a. a. a.
• <3 a 0
v 0
• )'
~ U> CD 0 N
(6H UJUJ) 9.JnSS9.lcf .JD/n~l.J/U911
Figure 11. Average left ventricular pressure and volume in
control nonpregnant guinea pigs (n=l2) and in guinea pigs at Day 20 (n=ll), Day 40 (n=l3), and
Day 60 (n=l2) Of gestation. Pressure is displayed
on a logarithmic scale from 2-24 mmHg to emphasize the similar slopes of the diastolic pressurevolume relationships at similar pressures. Values
are expressed as mean ± S.D. on the left and
~ S.E.M. on the right.
50
51

Table IX. Left ventricular dimensions at 8 nmHg distending pressure.
LY Radius (nm)
LV Wall Thickness (nm)
Radius/Wall Thickness
CONTROL (n=l2)
6.70±.31
1. 92 ! • 22
3.53: .52
Results are expressed as mean ± S.D. tP<.05, *P<.025, **P<.001; control vs.
20-0AY ( n=ll)
7 .03± .18'*
1.77±.21
4.01 :!: .42t
PREGNANT GROUPS
40-0AY (n•13)
7 .14 :!: .25**
1.69 ± .06*
4.23 ± .21**
pregnant group
60-DAY (n•l2)
7 .21 :!: .19*"'
1.68 ! .17'*
4.35: .44'**
52

Table X. Average slope (stiffness constants k1 and kz) from the exponential fit over the low (2-8 nm Hg) ana high (10-24 nrr. Hg) pressure ranges in nonpregnant control anr pregnant guinea pigs.
PREGNANi GROUPS
STIFFNESS CONTROL 20-0AY 40-0AY 60-DAY CONSTANTS {n=l2) (n=ll) (n=l3) (n=l2)
Kl (2-8 nm Hg) 3.41:2.17 3. 57: 1. 98 3.04 :t 1.86 2 .82: 1. 56
Kz (10-24 nm Hg) 4 .80: 3. 74 S.81:2.41 4. 09 = l. 96 4 .08 ! 1.62
Results are expressed as mean : S.D.
53

Figure 12. Stress-elastic modulus as determined assuming thin-wall spherical geometry. Results are expressed as mean - S.D. on top and= S.E.M.
on the bottom.
54

c;; -en &;; ~ ~ ~
Oc c c
0 0 ooo C\J V CD - - -...
- c 0 c ... c .... C' c a.> 0 ... (.) a.. • <1
...... c c c c c c C' C' a.> a.> ... ... a.. a.. c 0
<l [II
'° N
0 -
.._ ___________________ .......i~--------....... ----------~&f> 0 0 v
0 0 rt')
0 0 N
0 Q
(fiH ww) sn1npow ~11so13 117
0
55
_..... C' :r: E E -

56
between groups in the elastic modulus for any given level of left
ventricular stress nor was there a statistical difference in the slopes
of the linear relationships between the control and pregnant groups.

DISCUSSION
During guinea pig pregnancy, cardiac output, blood volume, stroke
volume and heart size are significantly increased as early as Day 20 of
gestation. These alterations occur prior to an increase in uterine
blood flow, which conflicts with previous theories on the mechanisms
behind the cardiovascular changes which occur during pregnancy.
There is only one published study of guinea pig maternal hemodyna
mics investigating the changes in cardiac output during pregnancy (64).
Unfortunately, this report did not use prospectively matched groups and
included only five nonpregnant control animals and 14 sows of gestation
al ages ranging from 39 to 66 days. Unsuitability of their control
group is further suggested by the significantly greater heart and kidney
weights of the five nonpregnant controls compared to the pregnant ani
mals. The data presented in this present study demonstrates that the
non-reproductive organ weights remained unchanged during pregnancy.
In order to control for maternal weight gain during pregnancy, the
guinea pigs were prospectively weight-matched at Day O of gestation as
maternal weight would be expected to return to near pre-pregnant values
following delivery. Since there was no significant difference of body
weights between the groups, hemodynamic data were not normalized.
It was surprising to find that cardiac output was increased as
early as Day 20 of gestation. Figure 13 shows that while this increase
in cardiac output occurred, stroke volume also increased as heart rate
did not change from pre-pregnant levels. The significant changes in
organ blood flow seen during pregnancy occurred in the reproductive

58
Figure 13. Cardiac output, heart rate and stroke volume changes occurring during guinea pig pregnancy.

59
-.... ·~ 260 1 ~ -.....;: 1 ~ ...... 240 ~ ~
~ ~ 220 ·~ "6 ! ~
~ 200 0 20 40 60
290
t ~ ~ .....
270 ! ~ ~
250 0 20 40 60
-.... 100 ' .......
~ ~ .90 §
-..;;:::
~ .BO
~ ' ~ .70 ~ (j)
.60 0 20 40 60
Ooys of Ges1otion

60
organs. Although cardiac output was up by 27% at 20 days of pregnancy,
uterine blood flow did not increase until after Day 20, at which time the
cardiac output fell from its peak value at 20 days and renal blood flow
was reduced 25% from control values. By the end of gestation cardiac
output was still continuing to fall towards pre-pregnant values while
uterine blood flow essentially remained at the same level as seen at
40 days despite a significant increase in placental and fetal weight.
The renal blood flow also returned to normal at the end of gestation.
These changes suggest that cardiac output is increased prior to the
demands of the developing reproductive burden which contradicts
Burwell 's analogy between the pregnant uterus and an arteriovenous
fistula to explain the cardiac alterations during pregnancy.
The validation of cardiac output calculated from injection of
microspheres has been performed by comparison with cardiac output main
tained by a roller pump during cardiopulmonary bypass (2, 72). Roller
pump outputs provide the most accurate reference cardiac output compari
sons because they are calibrated by timed volumetric measurements.
These studies have shown that determinations of cardiac output by micro
sphere injection were within 15%, and 80% of the microsphere determina
tions were within 10% of the known flow. Indirect methods of measuring
cardiac output with an indicator dilution dye technique (indocyanine
green) have been performed (29, 72) simultaneously with microsphere
determinations. The correlation of these two methods is not as high
since the accuracy of c~rdiac output measurement by indicator dye tech
niques may be less than other techniques.
To measure the di stri but ion of mi crospheres, one study employed a

61
mechanical model consisting of four branching tubes perfused by a
rotary pump. Effluent was collected from each branch at varying flow
rates while microspheres were injected into the system. The distribu
tion pattern was similar to the actual distribution of the flow in the
system. To assess the accuracy of the microsphere method for measuring
the distribution of cardiac output to individual organs, early studies
used diffusable indicators with the microspheres (17). More recent
comparisons have been performed utilizing electromagnetic flow trans
ducers (8). Both studies showed a high correlation between flows
measured by electromagnetic flow probes and microsphere injection.
It has been recognized that the in vitro passive pressure-volume
curve is only one of several factors that determines pressure-volume
relationships of the in vivo left ventricle (24). Other factors which
affect the in vivo pressure-volume curve of the left ventricle include
the restraint of simultaneous pressure in the right ventricle (19), the
pericardium (24), and coronary artery pressure {23). In addition,
pressure-volume relations are affected in early diastole by relaxation
and atrial systole may alter viscous behavior of the left ventricle at
end-diastole (22). Although left ventricular in vivo pressure-volume
relationships have not been studied during pregnancy, there are several
hemodynamic parameters available to evaluate the effects of the above
mentioned restraints on in vivo pressure-volume relations. No signifi
cant changes were observed in right or left sided filling pressure in
guinea pig pregnancy which is consistent with Bader's (4) findings in
human pregnancy. Systemic diastolic pressure is slightly decreased in
human (43) and other species (32, 52) during pregnancy but unchanged in

62
the guinea pig. Even a modest decrease in diastolic aortic pressure
would probably not reduce coronary perfusion pressure enough to alter
left ventricular pressure-volume relations (23). The distensibility of
the pericardium during pregnancy has not been investigated. However,
it has been shown that chronic absence of the pericardium does not
result in ventricular enlargement in the guinea pig. Therefore, it
appears unlikely that factors affecting in vivo pressure-volume rela
tionships during pregnancy would alter the changes in in vitro pressure
vol ume relations observed during guinea pig pregnancy.
Left ventricular size increased throughout pregnancy in the guinea
pig. This increased ventricular size at physiological filling pressures
suggests that end-diastolic volume is also increased. If there are no
alterations of preload, afterload or contractility, a corresponding
increase in stroke volume would then be available to augment cardiac
output (see Figure 14).
Blood volume increased by 25% as early as Day 20 of pregnancy and
reached a peak value of 50% above pre-pregnant levels by the end of
gestation. This elevation of blood volume is similar to that observed
in human pregnancy {84) although the guinea pig did not exhibit dilu
tional anemia as seen in humans 06) as total red cell volume expanded propor
tionally with plasma volume during the guinea pig pregnancy. Right
sided filling pressures did not change in either guinea pig or human
pregnancy.
Measurements of ventricular compliance, and particularly measure
ments giving an index of intrinsic stiffness are of interest because
they are important determinants of cardiac performance both in normal

63
Figure 14. This figure illustrates the % change from nonpregnant control values of stroke volume and heart size during pregnancy.
~
~30 • § es • • ~20 ~
§ ......::::
10 ~
~ f2 0 • (/)
0 20 40 60
• ~ 30 ~ § • es
20 ~ '- • -~ ti) 10 .......
~ ~ 0 ~ I I I
0 20 40 60
Do)'S of Gestation

64
and pathological states (7). Simultaneous measurements of intraventri
cular pressure and volume alone do not provide all the information to
completely assess the intrinsic stiffness of the left ventricle. In
order to calculate elastic modulus (E) as a function of wall stress (cr),
the thickness and curvature of the ventricle in one spot must be known
or a geometrical model must be used to calculate the wall thickness and
ventricular volume (57).
The actual geometry of the ventricle is quite complicated because
the ventricular wall is composed of both muscle and connective tissue
with the muscle fibers arranged in overlapping spiral patterns. During
systole, the direction of the local stresses developed in the ventricu
lar wall are different in the several layers of muscles, but roughly of
uniform magnitude because the intrinsic structure of the myofibrils
throughout the ventricle. Though the ventricle is not spherical nor
thin-walled, the thin-wall spherical model is based on the assumption
that the ventricle is thick in regions where the radius of curvature is
large and thin in regions where it is small, thus keeping the local
stress applied to the ventricular wall approximately constant. The law
of Laplace, which assumes that only tensile forces are applied to any
element of material and that the stress is constant across the thickness
of the wall, may be applied to the dimensions of fixed ventricles to
calculate principal stresses at a variety of points (34). This princi
ple was first used by Woods in 1892 (90) for canine hearts and more
recently used for the hearts of guinea pigs, rats, rabbits, hogs and
calves (47).
Others have suggested that use of the more mathematically

complicated thick-wall ventricular models in which stress is allowed
to vary across the wall (81, 89). These models take into account
65
bending stresses in addition to tensile stresses produced by ventricu
lar configurational changes during filling. There are now a number of
investigations which compare the thick-wall and thin-wall models (30,
51, 56). These studies provide evidence which supports the conclusion
by McHale and Greenfield (51) that a thin-wall (Laplace) model of the
left ventricle pennits calculation for both systole and diastole which
are within 10% of the value given by the thick-wall model. As demon
strated earlier by Figure 12, important changes in compliance and
elasticity of ventricular muscle were not present during guinea pig
pregnancy. A change in geometry rather than material properties is
further supported by the similar slopes of the monoexponential fits to
the pressure-volume curves as seen in Figure 11. Together with the
fact that contractility does not seem to change during pregnancy (35),
this evidence supports the belief that left ventricular enlargement is
the dominant mechanism which leads to increased stroke volume dL•ring
pregnancy.
The mechanism by which left ventricular enlargement occurs still
remains unclear. An earlier study suggested that increased circulating
estrogen levels may be responsible for some of the cardiovascular alter
ations seen during pregnancy (31). Figure 15 demonstrates that estro
gen levels in the guinea pig pregnancy are not significantly elevated
by the time most of the cardiovascular changes take place at 20 days.
Progesterone levels are significantly elevated by 20 days suggesting
that progesterone maybe involved in increasing venous compliance (20)

66
Figure 15. Steroid hormone levels during pregnancy. Results are expressed as mean! S.E.M.

67
~ 60 ~
' ~ 40
r ~
e 20 1i; lij
0 0 20 40 60
~ 60
~ ~ 40
I ~
·~ ~ 20 12: ~ t!3
0 0 20 40 60
~ 1000
I ~ ~ Cb 600 ~ t ~ ~ 200 ~ 2 ~ 0
0 20 40 60 Days of Gestation

thereby reducing peripheral resistance which could account for the
absence of an elevation in systemic blood pressure despite a signifi
cant increase in cardiac output.
68
Even though circulating levels of estrogen are not significantly
increased by Day 20 of gestation, this does not rule out the possibility
that estrogen is involved in the cardiovascular changes which are taking
place during the first 20 days of pregnancy. Further studies are
needed to investigate the tissue levels, binding affinity, and locality
of estrogen receptor sites during guinea pig pregnancy to fully under
stand the role of estrogen in mediating some of the cardiovascular
alterations during gestation.

69
SUMMARY
Maternal cardiovascular adaptations appear to be essential in order
to supply extra circulation to both the developing fetus and maternal
system during a successful pregnancy. Since inadequate cardiovascular
adjustments may produce abortions or maternal morbidity, the characteriza
tion of maternal cardiovascular changes during pregnancy and the
elaboration of the underlying mechanism for these changes are essential
to the understanding of how the heart enlarges during pregnancy and
what significance this enlargement might have. To provide needed
information regarding this time course and extent of maternal cardiac
enlargement and the hormonal and hemodynamic changes which may be
responsible for these changes, the guinea pig was used as an animal
model to characterize the maternal cardiac, hemodynamic and hormonal
changes during early, mid and late pregnancy.
All animals used were virgin female guinea pigs which were
prospectively weight-matched and randomly assigned to one of the
following groups: 1) Control, 2) Pregnant (20 Days), 3) Pregnant (40
Days), and 4) Pregnant (60 Days). The sows assigned to the pregnant
groups were housed with a boar during estrus to provide a dated preg
nancy. On the day of study, each animal was anesthetized and polyvinyl
catheters were placed in the left ventricle, right atrium and abdominal
aorta. The animals were allowed to recover from the anesthesia and
were then placed in a limited restraint cage where simultaneous
pressures were recorded. Cardiac output and regional blood flows were
then measured by radioactive microspheres indicator dilution technique,
arterial blood gas samples were taken, blood volume was measured by

70
a dye dilution technique using Evans Blue, and estrogen and progesterone
plasma levels were determined by radioimmunoassay. After all in vivo
measurements were obtained, the animals were sacrificed and the in
vitro left ventricular pressure-volume relations were measured in 14
control and 39 pregnant guinea pigs.
Arterial blood gases and hematocrits obtained at the end of the
study were similar to those previously reported in control animals.
Kidney weights, wet lung weights and left ventricular weights were
unchanged during pregnancy despite a significant increase in total
maternal weight. Hemodynamic data from the control and pregnant guinea
pigs demonstrated that there was no statistical difference in heart
or respiratory rates, or in aortic, right atrial or left ventricular
end-diastolic pressures. Total cardiac output was increased as early
as Day 20 of gestation but then gradually returned to pre-pregnant
values. Uterine blood flow was not increased until Day 40 when fetal
and placental weights were increased. Since heart rates were unchanged,
stroke volume was increased by Day 20 and remained elevated throughout
pregnancy. Blood volume steadily increased during pregnancy, reaching
a peak value at the end of gestation. The in vitro pressure-volume
relationships of the left ventricles demonstrated that the curves of the
pregnant animals were shifted to the right as early as Day 20 and
progressively increased with a peak increase in volume occurring at end
gestation. This increase occurred without a change in left ventricular
weight, therefore increasing the radius:wall thickness ratio throughout
pregnancy. There was no change in left ventricle mechanical or material
properties indicating that left ventricular enlargment occurs by

71
geometric remodeling. Estradiol plasma levels slowly increased during
pregnancy but were not significantly elevated until Day 40 of gestation.
Estrone was only elevated at Day 40 and returned again by Day 60, while
progesterone was significantly increased throughout pregnancy with a
peak value occurring at Day 40.
In summary, significant cardiovascular changes are seen during
early pregnancy and occur prior to a major increase in uterine blood
flow. These cardiovascular alterations may be mediated by changing
honnone levels.
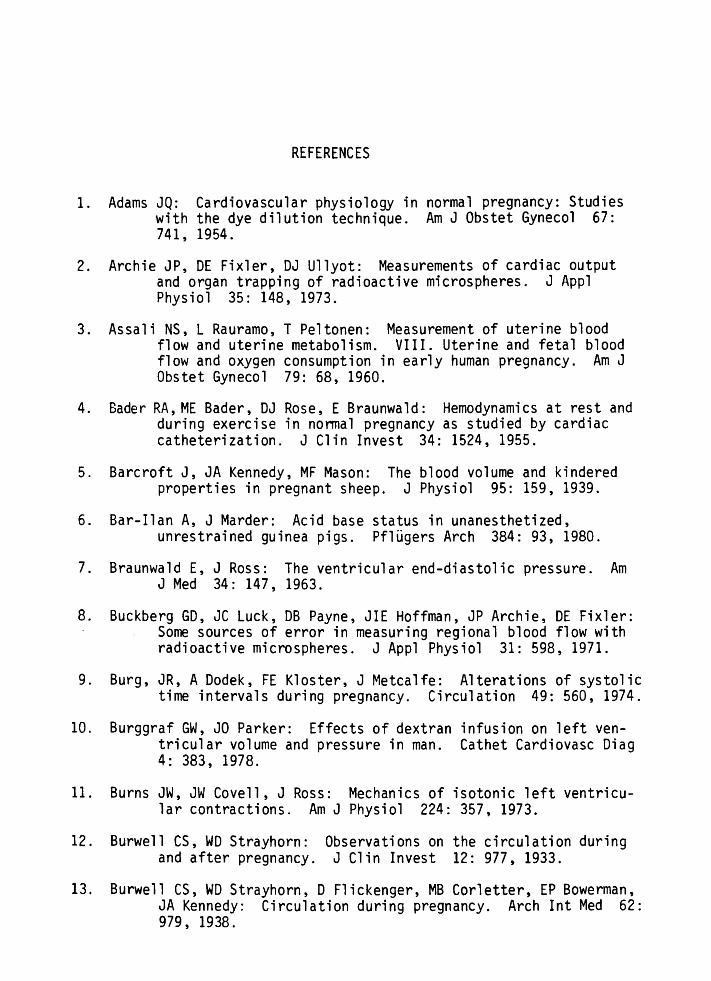
REFERENCES
1. Adams JQ: Cardiovascular physiology in normal pregnancy: Studies with the dye dilution technique. Am J Obstet Gynecol 67: 741, 1954.
2. Archie JP, DE Fixler, DJ Ullyot: Measurements of cardiac output and organ trapping of radioactive microspheres. J Appl Physiol 35: 148, 1973.
3. Assali NS, L Rauramo, T Peltonen: Measurement of uterine blood flow and uterine metabolism. VIII. Uterine and fetal blood flow and oxygen consumption in early human pregnancy. Am J Obstet Gynecol 79: 68, 1960.
4. Bader RA, ME Bader, OJ Rose, E Braunwald: Hemodynamics at rest and during exercise in nonnal pregnancy as studied by cardiac catheterization. J Clin Invest 34: 1524, 1955.
5. Barcroft J, JA Kennedy, MF Mason: The blood volume and kindered properties in pregnant sheep. J Physiol 95: 159, 1939.
6. Bar-llan A, J Marder: Acid base status in unanesthetized, unrestrained guinea pigs. Pflugers Arch 384: 93, 1980.
7. Braunwald E, J Ross: The ventricular end-diastolic pressure. Am J Med 34: 147, 1963.
8. Buckberg GO, JC Luck, DB Payne, JIE Hoffman, JP Archie, OE Fixler: Some sources of error in measuring regional blood flow with radioactive microspheres. J Appl Physiol 31: 598, 1971.
9. Burg, JR, A Oodek, FE Kloster, J Metcalfe: Alterations of systolic time intervals during pregnancy. Circulation 49: 560, 1974.
10. Burggraf GW, JO Parker: Effects of dextran infusion on left ventricular volume and pressure in man. Cathet Cardiovasc Diag 4: 383, 1978.
11. Burns JW, JW Covell, J Ross: Mechanics of isotonic left ventricular contractions. Am J Physiol 224: 357, 1973.
12. Burwell CS, WO Strayhorn: Observations on the circulation during and after pregnancy. J Clin Invest 12: 977, 1933.
13. Burwell CS, WO Strayhorn, D Flickenger, MB Corletter, EP Bowerman, JA Kennedy: Circulation during pregnancy. Arch Int Med 62: 979, 1938.

14. Burwell CS: The placenta as a modified arteriovenous fistula, considered in relation to the circulatory adjustments to pregnancy. Am J Med Sci 195(1): 1, 1938.
73
15. Challis JRG, RB Heap, DV Illingworth: Concentrations of estrogen and progesterone in the plasma of nonpregnant, pregnant and lactating guinea pigs. J Endocrinol 51: 333, 1971.
16. Constable BJ: Changes in blood volume and blood picture during the life of the rat and guinea pig from birth to maturity. J Physiol 167: 229, 1963.
17. Delaney JR, E Grimm: Canine gastric blood flow and its distribution. Am J Physiol 207: 1195, 1964.
18. DeMaria AN, A Neumann, G Lee, W Fowler, OT Mason: Alterations in ventricular mass and performc1nce induced by exercise training in man evaluated by echocardiography. Circulation 57 (2): 237, 1978.
19. Elzinga G, R van Grondelle, N Westerhof, GC van der Bos: Ventricular interference. Am J Physiol 226: 941, 1974.
20. Fawer R, A Dettling, 0 Weihs, H Welti, JL Schelling: Effect of the menstrual cycle, oral contraception and pregnancy on forearm blood flow, venous distensibility and clotting factors. Europ J Clin Pharmacol 13: 251, 1978.
21. Fletcher PJ, JM Pfeffer, MA Pfeffer, E Braunwald: Left ventricular diastolic pressure-volume relations in rats with healed myocardial infarction. Circ Res 49: 618, 1981.
22. Gaasch WH, JS Cole, MA Quinones, JK Alexander: Dynamic determinants of left ventricular pressure-volume relations in man. Circulation 51: 317, 1975.
23. Gaasch WH, OHL Bing, MB Pine, A Franklin, J Clement, 0 Rhodes, WP Phear, RM Weintraub: Myocardial contracture during prolonged ischemic arrest and reperfusion. Am J Physiol 235(6): H619, 1978.
24. Glantz SA, WW Parmley: Factors which affect the diastolic pressurevolume curve. Circ Res 42: 171, 1978.
25. Gleason WL, E Braunwald: Studies on Starling's law of the heart. VI. Relationship between left ventricular end-diastolic volume and stroke volume in man. Circulation 25: 841, 1962.
26. Goodrich SM, JE Wood: The effect of estradiol-17B on peripheral venous distensibility and velocity of venous blood flow. Am J Obstet Gynecol 96(3): 407, 1966.

27.
28.
29.
30.
31.
32.
33.
34.
35.
36.
37.
~.
39.
74
Heymann MA, BO Payne, JE Hoffman, AM Rudolph: Blood flow measurements with radionuclide labeled particles. Prog Cardiovasc Dis 20(1): 55, 1977.
Hohimer AR, MJ Morton, J Metcalfe: Maternal hemodynamics during guinea pig pregnancy. Physiologist 23: 148, 1980.
Hoffbrand BI, RP Forsyth: Validity studies of the radioactive microsphere method for the study of the distribution of cardiac output, organ blood flow, and resistance in the conscious rhesus monkey. Cardiovasc Res 3: 426, 1969.
Hood WP, MJ Thompson, CE Rackley, EI Rolett: Comparison of calculations of left ventricular wall stress in man from thinwalled and thick-walled ellipsoidal models. Circ Res 24: 575, 1969.
Hosenpud JD, MV Hart, MJ Morton, AR Hohimer: Chronic estrogen administration increases left ventricular size and stroke volume. Clin Res 31(2): 192A, 1983.
Hoversland AS, JT Parer, J Metcalfe: Hemodynamic adjustments in the pygmy goat during pregnancy and early postpartum. Biol Reprod 10: 578, 1974.
Hytten FE, DB Paintin: Increase in plasma volume during pregnancy. J Obstet Gynecol (BC) 70: 402, 1963.
Kane RL, TA McMahon, RL Wagner, WH Abelman: Ventricular elastic modulus as a functio~ of age in the Syrian Golden hamster. Circ Res 38(2): 74, 1976.
Katz R, JS Karlin9er, R Resnik: Effects of a natural volume overload state {pregnancy) on left ventricular performance in normal human subjects. Circulation 58(3): 434, 1978.
King TM, WV Whitehorn, B Reeves: Effects of estrogen composition and function of cardiac muscle. Am J Physiol 196: 1282, 1959.
Kutscher C: Plasma volume changes during water-deprivation in gerbils, hamsters, guinea pigs and rats. Biochem Physiol 25: 929, 1968.
Laird-Meeter K, G Van Deley, TH Born, JW Wladimiroff, J Roelandt: Cardiovascular adjustments during pregnancy. An echocardiographic study. Clin Cardiel 2: 328, 1979.
Lehtovirta P: Haemodynamic effects of combined oestrogen/progesterone oral contraceptives. J Obstet Gynecol (BC) 81: 517, 1974.

75
40. Lehtovirta P: Peripheral hemodynamic effects of combined oestrogen/progesterone oral contraceptives. J Obstet Gynecol (BC) 81: 526, 1974.
41. Lindhard J: Uber das Minutevolum des Herzens bei Ruhe und Muskelarbeit. Arch f d ges Physiol 161: 233, 1915.
42. Macdonald A: The Bearings of Chronic Disease of the Heart on Pregnancy, Parturition and Childbed with papers on puerperal pluerol pneumonia and eclampsia. London: J & A Churchill, 1878.
43. MacGillvray I, GA Rose, B Rowe: Blood pressure survey in pregnancy. Clin Sci 37: 395, 1969.
44. Mahler F, J Ross, RA O'Rourke, JW Covell: Effe-ts of changes in prelaod, afterload and inotropic state on ejection and isovolumic phase measurements of contractility in the conscious dog. Amer J Cardiol 35: 626, 1975.
45. Malik AS, JE Kaplan, TM Saba: Reference sample method for cardiac output and regional blood flow determinations in the rat. J Appl Physiol 40(3): 472, 1976.
46. Malinow MR, JA Moguilevsky, B Lema, GE Bur: Vascular and extravascular radioactivity after injection of estradiol in the human being. J Clin Endocrinol Metab 23: 306, 1963.
47. Martin CE, JA Shaver, ME Thompson, PS Reddy, JJ Leonard: Direct correlation of external systolic time intervals with internal indices of left ventricular function in man. Circulation 44: 419, 1971.
48. McGill HC, PJ Sheridan: Nuclear uptake of sex steroid hormones in the cardiovascular system of the baboon. Circ Res 48(2): 238, 1981.
49. McGill HC, VC Anselmo, JM Buchanan, PJ Sheridan: The heart is a target organ for androgens. Science 207: 775, 1980.
50. Mccullagh WH, JW Covell, JR Ross: Left ventricular dilatation and diastolic compliance changes during chronic volume overloading. Circulation 95: 943, 1972.
51. McHale PA, JC Greenfield: Evaluation of several geometric models for estimation of left ventricular wall stress. Circ Res 33: 303, 1973.
52. Metcalfe J, JT Parer: Cardiovascular changes during pregnancy in ewes. Am J Physiol 210: 821, 1966.

76
53. Metcalfe J, SL Romney, LH Ramsey, DE Reid, CS Burwell: Estimation of uterine blood flow in normal human pregnancy at term. J Clin Invest 34: 1632, 1955.
54. Metzger CC, CBC Hough, FW Kroetz, JJ Leonard: True isovolumic contraction time: Its correlation with two external indexes of ventricular performance. Am J Cardiel 25: 434, 1970.
55. Milnor WR: Arterial impedance as ventricular afterload. Circ Res 36(5): 565, 1975.
56. Mirsky I: Left ventricular stresses in the intact human heart. Biophys J 9: 198, 1969.
57. Mirsky I, WW Parmley: Assessment of passive elastic stiffness for isolated heart muscle and the intact heart. Circ Res 33: 233, 1973.
58. Morales PD, RL Wagner, WH Abelman: Right and left ventricular compliance in experimental acute and subacute trypansoma myocarditis. Cardiovasc Res 7: 201, 1973.
59. Morganroth J, BJ Maron, WL Henry, SE Epstein: Comparative left ventricular dimensions in trained athletes. Ann Int Med 82(4): 521, 1975.
60. Morton MJ, AR Hohimer, J Metcalfe: Maternal left ventricular adaptations to pregnancy. Clin Res 28: llA, 1980.
61. Neutze JM, F Wyler, AM Rudolph: Use of radioactive microspheres to assess distribution of cardiac output in rabbits. Am J Physiol 215: 486, 1968.
62. Parker JO, RB Case: Normal left ventricular function. Circulation 60: 4, 1979.
63. Patterson SW, EH Starling: On mechanical factors which determine the output of the ventricles. J Physiol 48: 357, 1914.
64. Peeters LLH, G Grutters, CB Martin: in the unstressed guinea pig. 1177, 1980.
Distribution of cardiac output Am J Obstet Gynecol 138:
65. Phillips DS: Basic Statistics for Health Sciences Students. San Francisco: WH Freeman and Co., 1978, pp. 93-99.
66. Pritchard JA: Changes in blood volume during pregnancy and delivery. Anesthesiology 26: 393, 1965.
67. Resko JA~ MJ Koering, RW Goy, CH Phoenix: Preovulatory progestins: Observations on their source in Rhesus monkeys. J Clin Endocrinol Metab 41(1): 120, 1975.

77
68. Resko JA, JG Ploem, HL Stadelman: plasma of the Rhesus monkey. 1975.
Estrogens in fetal and maternal Endocrinology 97{2): 425,
69. Roeske WR, RA O'Rourke, A Klein, G Leopold, JS Karlinger: Noninvasive evaluation of ventricular hypertrophy in professional athletes. Circulation 53(2): 286, 1976.
70. Ross J: Adaptations of the left ventricle to chronic volume overload. Circ Res 34/35 (Suppl): 11, 1974.
71. Rubler S, R Schneebaum, N HalTITler: Systolic time intervals in pregnancy and the postpartum period. Amer Heart J 86(2): 182, 1973.
72. Rudy LW, MA Heymann, LH Edwards: Distribution of systemic blood flow during cardiopulmonary bypass. J Appl Physiol 34: 194, 1973.
73. Sanghvi VR, AL Mark, F Khaja, JO Parker: Effects of blood volume expansion on left ventricular hemodynamics in man. Circulation 46: 780, 1972.
74. Sasaki Y, HN Wagner: Measurement of the distribution of cardiac output in unanesthetized rats. J Appl Physiol 30: 879, 1971.
75. Schreiner GE, N Freinkel, JW Athens, W Stone: Cardiac output, central volume, and dye injection curves in traumatic arteriovenous fistulas in man. Circulation 7: 718, 1953.
76. Scott DE: Anemia in pregnancy. In: Obstetrics and Gynecology Annual: 1972, edited by RM Wynn. New York: AppeltonCentury-Crofts, 1972, pp. 219-244.
77. Snedecor GW, WG Cochran: Statistical Methods, 6th ed. Ames, Iowa: Iowa State University Press, 1967, pp. 115, 178, 302-303, 433-436, 460-465.
78. Sonnenblick EH, SE Downing: Afterload as a primary determinant of ventricular performance. Am J Physiol 204: 604, 1963.
79. Stander HJ, EE Duncan, WE Sisson: Heart output during pregnancy. J Obstet Gynecol 11: 44. 1926.
80. Stander HJ, JF Cadden: The cardiac output in pregnant women. Amer J Obstet Gynecol 24: 13, 1932.
81. Streeter DD, RH Vaishnav, DJ Patel: Stress distribution in the canine left ventricle during diastole and systole. Biophys J 10: 345, 1970.

82. Stumpf WE, M Sar, G Aumu1ler: The heart: A target organ for estradiol. Science 196: 319, 1977.
78
83. Ueland K, MJ Novy, EN Peterson, J Metcalfe: Maternal cardiovascular dynamics. IV. The influence of gestational age on the maternal cardiovascular response to posture and exercise. Am J Obstet Gynecol 105: 856, 1969.
84. Ueland K, JT Parer: Effects of estrogens on the cardiovascular system of the ewe. Am J Obstet Gynecol 96: 400, 1966.
85. Walters WAW, YL Lim: Cardiovascular dynamics in women receiving oral contraceptive therapy. Lancet 2: 879, 1969.
86. Walters WAW, YL Lim: Haemodynamic changes in women taking oral contraceptives. J Obstet Gynecol (BC) 77: 1007, 1970.
87. Wang L: Plasma volume, cell volume, total volume and F cells factor in the normal and splenectomized Shennan rat. Am J Physiol 196(1): 188, 1959.
88. Weissler AM, RG Peeler, WH Roehill: Relationship between left ventricular ejection time, stroke volume, and heart rate in normal individuals and patients with cardiovascular disease. Am Heart J 62: 367, 1961.
89. Wong AYK, PM Rautaharju: Stress distribution within the left ventricular wall approximated as a thick ellipsoidal shell. Am Heart J 75: 649, 1968.
90. l~oods RH: A few applications of a spherical theorem to membranes in the human body in a state of tension. J Anat Physiol 26: 3E2, 1392.
91. Bedford CA, JRG Challis, FA Harrison, RB Heap: The role of oestrogens and progesterone in the onset of parturition in various species. J Reprod Fert Suppl 16: l, 1972.