serial no. n5658 nafo scr doc. 09/23 scientific council ... filee-mail: [email protected]...
TRANSCRIPT

1
NOT TO BE CITED WITHOUT PRIOR REFERENCE TO THE AUTHOR(S)
Northwest Atlantic Fisheries Organization
Serial No. N5658 NAFO SCR Doc. 09/23
SCIENTIFIC COUNCIL MEETING – JUNE 2009
Results for the Spanish Survey in the NAFO Regulatory Area of Division 3L for the period 2003-2008
by
Esther Román, Concepción González-Iglesias, Ángeles Armesto and Diana González-Troncoso
Instituto Español de Oceanografía
P.O. Box 1552. Vigo, Spain e-mail: [email protected]
Abstract
Since 2003, a stratified random summer bottom trawl survey in the NAFO Regulatory Area of Division 3L (Flemish Pass) was conducted by Spain. The surveys were carried out by the R/V “Vizconde de Eza” using bottom trawl net type Campelen. Entire series of mean catches, biomass and length distribution for Greenland halibut, American plaice and witch flounder are presented for the period 2003-2008. For Greenland halibut an increasing trend along the whole period in biomass and abundance is observed. A good recruitment, mainly in 2006, can be seeing; although the number of individuals of length over 70 cm. is very low. The American plaice biomass has increased since 2004 and a presence of small individuals in the last years is observer. For witch flounder,there is no a clear trend in the period 2003-2008, in 2008 the biomass increased. KEYWORDS: Survey, Flemish Pass, Greenland halibut, American plaice, witch flounder.
Material and Methods
The surveys on NAFO Regulatory Area of Div. 3L (Flemish Pass) were initiated by Spain in 2003. The Research vessel “Vizconde de Eza” carried out the surveys following the same procedures and using the same bottom trawl gear Campelen. In 2003, the survey was carried out in spring (June) and it did not cover all strata adequately (69% of the total area prospected in 2006-2008). In 2004, the survey was carried out in August, for a period of nine days, and it covered only the 96%. In 2005, it was not possible to perform the survey due to problems with the winch of the ship; and in 2006, for the first time, an adequate prospecting survey was conducted in Division 3L with over 100 valid hauls. Table 1 presents the number of valid tows, the depth and number of covered strata and the dates of the survey series. Figure 1 shows haul positions of the Spanish surveys in NAFO Div. 3L in the period 2003-2008. The survey area was stratified following the standard stratification schemes (Bishop, 1994). All surveys had a stratified random design following NAFO specifications (Doubleday, 1981). Sets were allocated to strata proportionally to their size, with a minimum of two planned hauls per stratum and the trawl positions were chosen at random. A synoptic sheet of the survey with the vessel and gear characteristics is shown in Table 2. Biomass and abundance indices were calculated by the swept area method (Cochran, 1997), assuming catchability factor of 1. The catch from each haul was sorted out and weighted by species and a sample of each species was taken in order to measure it and obtain the length distribution. For Greenland halibut, American plaice and witch flounder, each individual of the sample was measured to the total length to the nearest lower cm. and data are given in 2 cm intervals. We present the mean catch per haul, the stratified mean catch per haul and the biomass with their variance per year and the length distribution in number per haul stratified mean catches per length, sex and year for each
2
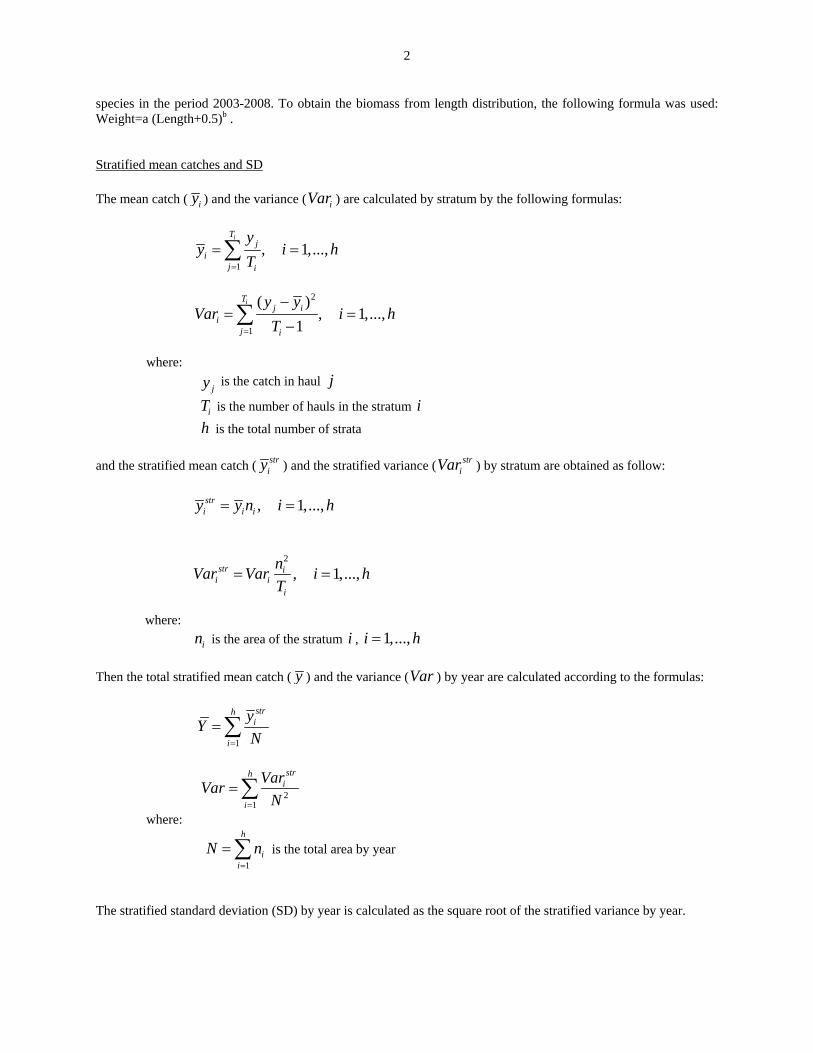
species in the period 2003-2008. To obtain the biomass from length distribution, the following formula was used: Weight=a (Length+0.5)b . Stratified mean catches and SD The mean catch ( iy ) and the variance ( iVar ) are calculated by stratum by the following formulas:
1
, 1,...,iT
ji
j i
yy i h
T=
= =∑
2
1
( ), 1,...,
1
iTj i
ij i
y yVar i h
T=
−= =
−∑
where:
jy is the catch in haul j
iT is the number of hauls in the stratum i
h is the total number of strata and the stratified mean catch ( str
iy ) and the stratified variance ( striVar ) by stratum are obtained as follow:
, 1,...,str
i i iy y n i h= =
2
, 1,...,str ii i
i
nVar Var i hT
= =
where: in is the area of the stratum i , 1,...,i h= Then the total stratified mean catch ( y ) and the variance (Var ) by year are calculated according to the formulas:
1
strhi
i
yYN=
= ∑
21
strhi
i
VarVarN=
=∑
where:
1
h
ii
N n=
= ∑ is the total area by year
The stratified standard deviation (SD) by year is calculated as the square root of the stratified variance by year.
3
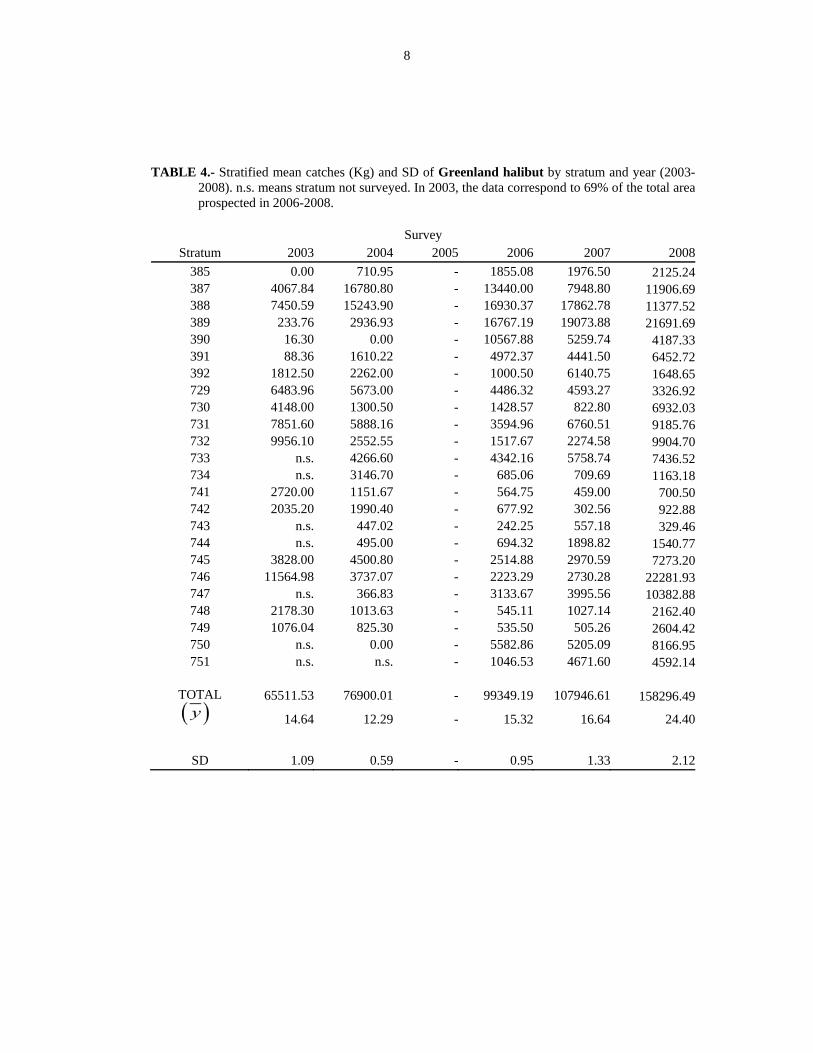
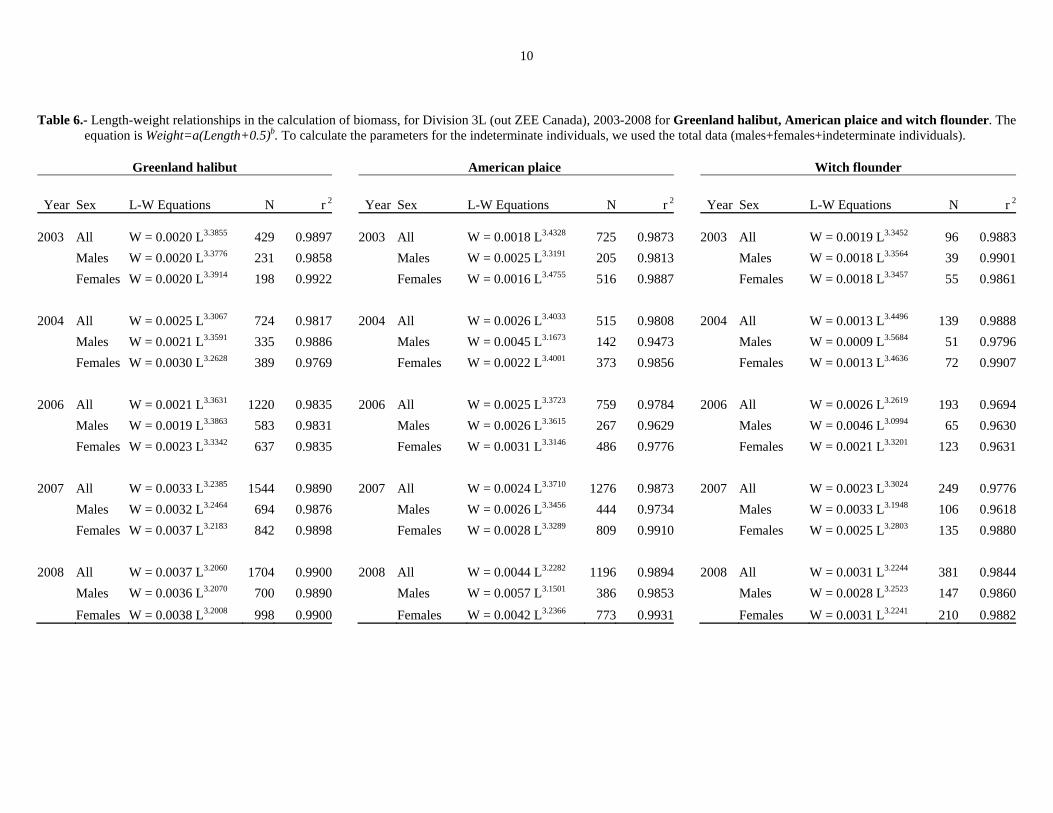
Results In this report, only the results for Greenland halibut, American plaice and witch flounder are presented. The results for the rest of target species will be presented in other SCR in this SC meeting. The detailed results for Northern shrimp, the most abundant species in the catches of all surveys, were presented in Casas et al., 2008. Greenland halibut (Reinhardtius hippoglossoides Walbaum, 1792) The Greenland halibut stock in Subarea 2 and Div. 3KLMNO is considered to be part of a biological stock complex, which includes Subareas 0 and 1. Abundance and biomass indices were available from research vessel surveys by Canada in Div. 2J+3KLMNO (1978-2008), EU in Div. 3M (1988-2008) and EU-Spain in Div. 3NO (1995-2008). Greenland halibut is managed under a fifteen year rebuilding programme that started in 2004. Catches increased sharply in 1990 due to a developing fishery in the NAFO Regulatory Area in Div. 3LMNO and continued at high levels during 1991-94. The exploitable biomass was reduced to low levels in 1995-97 due to very high catches and high fishing mortality. It increased during 1998-2000 due to greatly reduced catches, much lower fishing mortality and improved recruitment. The exploitable biomass has declined in recent years and the current estimates (2004-2008) are amongst the lowest in the series. Recent recruitment has been below average, and fishing mortality remains high (NAFO, 2008). Mean catches and biomass Table 3 shows the swept area, the tow number, the mean catches and their variance per haul and year for Greenland halibut. Table 4 and Figure 2 present the stratified mean catches per stratum with the total variance per year. Table 5 and Figure 3 present the abundance, the biomass per swept area per stratum and their total variance per year. Table 6 presents the length-weight relationships. The biomass of the Greenland halibut has had a increase in the prospected area along the whole period, mainly in 2008. The biomass presents the same trend as mean catches since the year 2004. In 2003, the mean catch does not follow the same pattern; this is probably due to the less area covered in 2003 survey. Length distribution Table 7 presents the stratified mean catches per haul length distribution for the Greenland halibut, by sex and year, with the number of samples in which there were length measures, the total number of individuals measured in these samples, the sampled catch and the range of lengths met, as well as the total catch of this species and the total hauls made in the survey. In Figures 4 and 5 the evolution along the years can be followed. The biomass of the Greenland halibut has had a increase in the 2008 and we can see a high increase in the numbers of individuals. In this period a good recruitment can be seeing, although the number of individuals of length over 70 cm. is very low. Although biomass and stratified mean catch increased in 2007, the number of individuals per stratified mean catches decreased in this year, due to the good recruitment in 2006. The highest recruitment was in 2006, that appears in Fig. 4, with length classes mode 14 cm. We must wait for next years data to see the evolution of this recruitment. American plaice (Hippoglossoides platesoides Fabricius, 1780) There was no directed fishing of American plaice in 1994 and there has been under moratorium since 1995. Catches increased after the moratorium until 2003 after which they began to decline. Biomass and SSB remain low compared to historic levels. SSB declined to the lowest estimated level in 1994 and 1995. It has increased since then still remains very low. There has been no good recruitment to the exploitable biomass since the mid-1980s (NAFO, 2008). Mean catches and biomass American plaice haul mean catches by stratum are presented in Table 8, including swept area, number of hauls and SD. Stratified mean catches per tow by stratum and year and their variance are presented in Table 9. The entire time

4
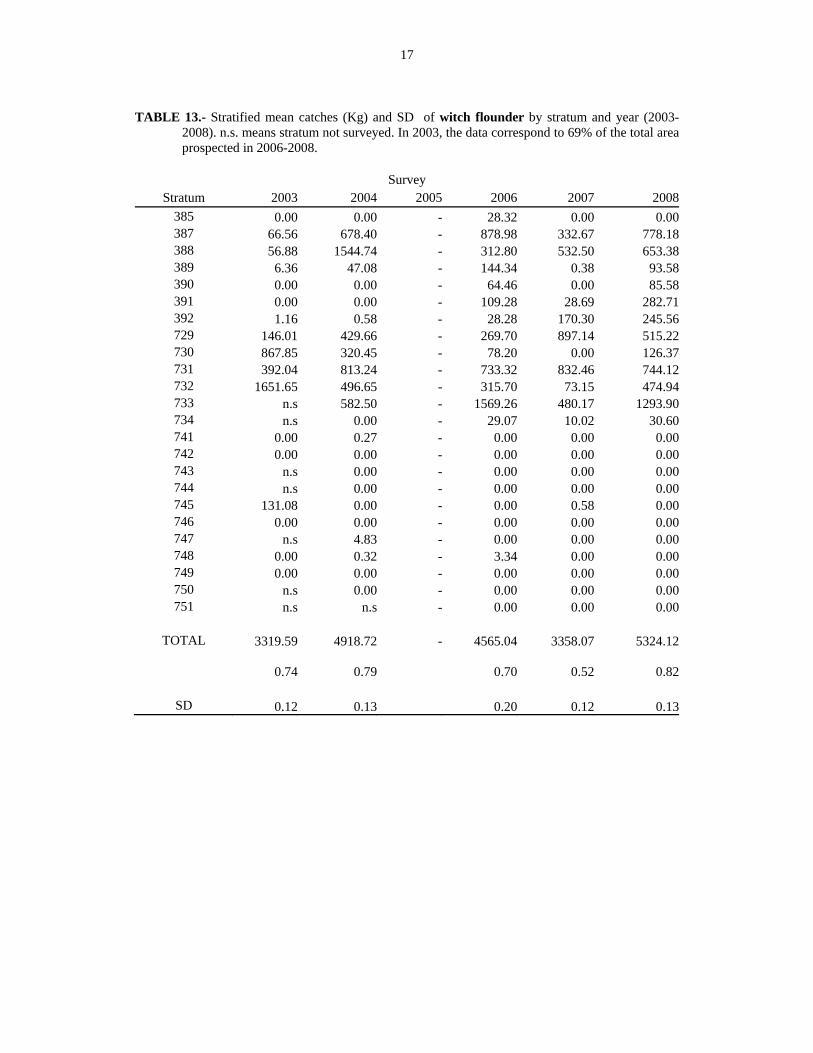
series (2003-2008) of biomass and their SD estimates of American plaice are shown in Table 10. Length-weight relationships are presented in Table 6. The American plaice indices show a general increasing trend in the prospected area along the years (Fig. 6 and 7). The highest values in the estimated biomass have been observed in the shallowest strata, in a range of depth from 93 to 274 meters. Length distribution Table 11 presents the stratified mean catches per haul length distribution by sex and year. As well as the number of samples in which there were length measures, the total number of individuals measured in these samples, the sampled catch and the range of lengths met. The total catch of this species and the total hauls made in the survey are shown too. In Figures 5 and 8 the evolution along the years can be followed. For this species, there is quite good presence of small individuals (around 12-14 cm) since 2006. There is a higher proportion of females than males. Witch flounder (Glyptocephalus cynoglossus Linnaeus, 1758) Witch flounder stock has remained at a low level since 1995. A moratorium on directed fishing was implemented in 1995. Increases in biomass indices for the whole stock area were not observed in abundance indices, suggesting the slight increasing trends in biomass are the result of growth and not recruitment (NAFO, 2008). Mean catches and biomass Table 12 shows the swept area, the tow number, the mean catches and their variance per haul and year for witch flounder. Table 13 and Figure 9 present the stratified mean catches per stratum with the total variance per year. Table 14 and Figure 10 present the abundance and biomass per swept area per stratum and their total variance per year. The length-weight relationships are presented in Table 6. For witch flounder, there is no a clear trend in this period; we can see a decreasing in the indices between 2004 and 2007, and an increasing for 2203-2004 and 2007-2008. Estimated biomass ranged from 483 t in 2008 to a 297 t and 298 t in 2003 and 2007 respectively, although most estimate results comes from few strata. The stratified mean catches per stratum followed similar trends as the biomass and abundance indices (Fig. 9 and 10). Length distribution Table 15 presents the stratified mean catches per haul length distribution for this specie, by sex and year, with the number of samples in which there were length measures, the total number of individuals measured in these samples, the sampled catch and the range of lengths met, as the total catch of this species and the total hauls made in the survey. In Figures 5 and 8 we can follow the evolution along the years. The highest recruitment was in 2003, but since then the number of younger individuals have declined.
References
BISHOP, C.A. 1994. Revision and additions to stratification schemes used during research vessel surveys in NAFO Subareas 2 and 3. NAFO SCR Doc., No 43, Serial No N2413, 23 p.
CASAS, J.M, E. Román and J. Teruel. 2008. Northern Shrimp (Pandalus borealis, Krøyer) from Spanish Bottom Trawl Survey 2008 in NAFO Divisions 3LNO. NAFO SCR Doc., No 66, Serial No N5598, 11 p.
COCHRAM, W. G. 1997. Sampling techniques. J. Wiley and Sons, N. Y., 23 p. DOUBLEDAY, W. G. 1981. Manual on groundfish surveys in the Northwest Atlantic. NAFO Sci.Coun.Studies, 2,
55. NAFO. 2008. Report of Scientific Council Meeting, 5-19 June 2008.

5
TABLE 1.- Spanish bottom trawl surveys in NAFO Division 3L for the period 2003-2008.
Year Vessel Valid tows Depth strata
covered (m) Surveyed
strata (no.) Dates
2003 R/V “Vizconde de Eza” 39 118-1100 17 June 2 - June 6, June 29 2004 R/V “Vizconde de Eza” 50 141-1452 23 August 7 - August 15 2005 - - - - - 2006 R/V “Vizconde de Eza” 100 116-1449 24 July 31 - August 18 2007 R/V “Vizconde de Eza” 94 119-1449 24 July 23 - August 11 2008 R/V “Vizconde de Eza” 100 105-1455 24 July 24 - August 11

6
TABLE 2.- Technical data of the Spanish survey in NAFO Division 3L for the period 2003-2008.
Procedure Specification
Vessel R/V “Vizconde de Eza” GT 1400 t. Power 1800 HP Surveyed area Div. 3L (depth < 1500 m, outside ZEE Canada) Mean trawl speed 3 knots Trawling time 30 minutes effective time Fishing gear type Campelen 1800 Headline 29.5 m Groundrope 19.5 m Type of groundrope 34 rockhopper Floats ( 2 x 39) + 10 Bridle 40 m (20 mm) Vertical opening 4-5 Horizontal opening 26 Trawl doors Polyvalent, 1400 Kg Warp 20 mm Warp to depth ratio 22.287 * Depth (m)0.6667 Mesh size in the cod-end 44 mm Type of survey: Stratified random bottom trawl survey Criterion to change position of a selected tow
Unsuitable bottom for trawling according to commercial fish information or ecosonder register. Information on gear damage from previous surveys.
Criterion to reject data from tow - Severe tears in the gear - tears in cod-end - Less of 20 minutes tow - Bad behaviour of the gear Daily period for fishing 6.00 to 22.00 hours Target species Greenland halibut, American plaice, Atlantic cod, roughhead
grenadier, witch flounder, thorny skate, red fish, black dogfish, northern shrimp.

7
TABLE 3.- Swept area, number of hauls and Greenland halibut mean catch (Kg) and SD (**) by stratum. Spanish Survey on NAFO Div. 3L in the period 2003-2008, on board R/V "Vizconde de Eza". (*) In 2003, the data correspond to 69% of the total area prospected in 2006-2008.
2003 (*) 2004 2006 2007 2008 Stratum Swept
area Tow
numberMean catch
SD Swept area
Tow number
Mean catch
SD Swept area
Tow number
Mean catch
SD Swept area
Tow number
Mean catch
SD Swept area
Tow number
Mean catch
SD
385 0.0225 2 0.000 0.000 0.0229 2 6.025 7.814 0.0229 2 15.721 8.173 0.0225 2 16.750 6.293 0.0229 2 18.011 17.521 387 0.0229 2 15.890 6.661 0.0214 2 65.550 13.930 0.0225 2 52.500 4.950 0.0225 2 31.050 6.576 0.0435 4 46.511 13.072 388 0.0334 3 20.870 13.452 0.0105 1 42.700 - 0.0566 5 47.424 8.026 0.0563 5 50.036 21.899 0.0559 5 31.870 17.546 389 0.0454 4 0.459 0.507 0.0225 2 5.770 1.796 0.0795 7 32.941 14.261 0.0900 8 37.473 14.697 0.0780 7 42.616 22.552 390 0.0563 5 0.020 0.029 0.0345 3 0.000 0.000 0.1249 11 12.967 16.007 0.1350 12 6.454 10.772 0.1395 12 5.138 7.236 391 0.0338 3 0.313 0.369 0.0218 2 5.710 4.398 0.0450 4 17.633 5.302 0.0450 4 15.750 5.063 0.0454 4 22.882 4.673 392 0.0116 1 12.500 - 0.0214 2 15.600 10.607 0.0229 2 6.900 3.111 0.0225 2 42.350 34.153 0.0221 2 11.370 3.210 729 0.0210 2 34.860 7.552 0.0221 2 30.500 3.394 0.0338 3 24.120 9.552 0.0338 3 24.695 4.326 0.0338 3 17.887 7.697 730 0.0221 2 24.400 5.798 0.0221 2 7.650 2.616 0.0326 3 8.403 6.415 0.0225 2 4.840 3.620 0.0323 3 40.777 14.460 731 0.0229 2 36.350 2.758 0.0233 2 27.260 3.338 0.0341 3 16.643 6.408 0.0338 3 31.299 16.813 0.0330 3 42.527 10.506 732 0.0113 1 43.100 - 0.0210 2 11.050 0.778 0.0334 3 6.570 3.380 0.0338 3 9.847 3.027 0.0446 4 42.878 42.441 733 n.s. n.s. n.s. n.s. 0.0330 3 18.233 2.495 0.0454 4 18.556 8.530 0.0338 3 24.610 12.655 0.0431 4 31.780 5.015 734 n.s. n.s. n.s. n.s. 0.0304 3 20.567 11.620 0.0225 2 4.478 1.340 0.0225 2 4.639 1.940 0.0221 2 7.603 1.948 741 0.0113 1 27.200 - 0.0323 3 11.517 6.225 0.0218 2 5.648 0.583 0.0225 2 4.590 6.491 0.0210 2 7.005 5.961 742 0.0116 1 31.800 - 0.0120 1 31.100 - 0.0229 2 10.593 1.453 0.0225 2 4.728 1.503 0.0210 2 14.420 16.150 743 n.s. n.s. n.s. n.s. 0.0188 2 8.765 10.090 0.0225 2 4.750 6.718 0.0225 2 10.925 2.185 0.0203 2 6.460 2.531 744 n.s. n.s. n.s. n.s. 0.0101 1 7.500 - 0.0229 2 10.520 9.588 0.0218 2 28.770 21.835 0.0221 2 23.345 16.553 745 0.0341 3 11.000 8.296 0.0319 3 12.933 1.026 0.0686 6 7.227 3.098 0.0675 6 8.536 4.108 0.0555 5 20.900 19.813 746 0.0446 4 29.503 16.252 0.0338 3 9.533 5.315 0.0675 6 5.672 4.188 0.0664 6 6.965 6.921 0.0638 6 56.842 58.887 747 n.s. n.s. n.s. n.s. 0.0308 3 0.507 0.443 0.1230 11 4.328 5.447 0.1238 11 5.519 6.837 0.1069 10 14.341 11.441 748 0.0109 1 13.700 - 0.0199 2 6.375 5.056 0.0326 3 3.428 4.404 0.0338 3 6.460 6.984 0.0218 2 13.600 5.940 749 0.0221 2 8.540 4.016 0.0221 2 6.550 9.263 0.0229 2 4.250 6.010 0.0113 1 4.010 - 0.0214 2 20.670 21.171 750 n.s. n.s. n.s. n.s. 0.0180 2 0.000 0.000 0.1005 9 10.041 12.221 0.0679 6 9.362 16.847 0.0844 8 14.689 17.321 751 n.s. n.s. n.s. n.s. n.s. n.s. n.s n.s 0.0454 4 4.570 5.958 0.0225 2 20.400 15.981 0.0413 4 20.053 13.204
8
TABLE 4.- Stratified mean catches (Kg) and SD of Greenland halibut by stratum and year (2003-2008). n.s. means stratum not surveyed. In 2003, the data correspond to 69% of the total areaprospected in 2006-2008.
Survey
Stratum 2003 2004 2005 2006 2007 2008385 0.00 710.95 - 1855.08 1976.50 2125.24387 4067.84 16780.80 - 13440.00 7948.80 11906.69388 7450.59 15243.90 - 16930.37 17862.78 11377.52389 233.76 2936.93 - 16767.19 19073.88 21691.69390 16.30 0.00 - 10567.88 5259.74 4187.33391 88.36 1610.22 - 4972.37 4441.50 6452.72392 1812.50 2262.00 - 1000.50 6140.75 1648.65729 6483.96 5673.00 - 4486.32 4593.27 3326.92730 4148.00 1300.50 - 1428.57 822.80 6932.03731 7851.60 5888.16 - 3594.96 6760.51 9185.76732 9956.10 2552.55 - 1517.67 2274.58 9904.70733 n.s. 4266.60 - 4342.16 5758.74 7436.52734 n.s. 3146.70 - 685.06 709.69 1163.18741 2720.00 1151.67 - 564.75 459.00 700.50742 2035.20 1990.40 - 677.92 302.56 922.88743 n.s. 447.02 - 242.25 557.18 329.46744 n.s. 495.00 - 694.32 1898.82 1540.77745 3828.00 4500.80 - 2514.88 2970.59 7273.20746 11564.98 3737.07 - 2223.29 2730.28 22281.93747 n.s. 366.83 - 3133.67 3995.56 10382.88748 2178.30 1013.63 - 545.11 1027.14 2162.40749 1076.04 825.30 - 535.50 505.26 2604.42750 n.s. 0.00 - 5582.86 5205.09 8166.95751 n.s. n.s. - 1046.53 4671.60 4592.14
TOTAL 65511.53 76900.01 - 99349.19 107946.61 158296.49
14.64 12.29 - 15.32 16.64 24.40
SD 1.09 0.59 - 0.95 1.33 2.12

9
TABLE 5.- Survey estimates (by the swept area method) of Greenland halibut biomass (t.) and SD by stratum and year in NAFO Div. 3L (R/V “Vizconde de Eza”). n.s. means stratum not surveyed. In 2003: the data correspond to 69% of the total area prospected in 2006-2008.
Survey Stratum 2003 2004 2005 2006 2007 2008
385 0 62 - 162 176 186387 356 1570 - 1195 707 1095388 670 1452 - 1495 1588 1018389 21 261 - 1476 1695 1947390 1 0 - 931 468 360391 8 148 - 442 395 569392 156 212 - 87 546 149729 618 513 - 399 408 296730 375 118 - 131 73 645731 686 507 - 316 601 835732 885 243 - 136 202 888733 n.s. 388 - 383 512 690734 n.s. 311 - 61 63 105741 242 107 - 52 41 67742 175 166 - 59 27 88743 n.s. 48 - 22 50 33744 n.s. 49 - 61 175 139745 337 424 - 220 264 655746 1037 332 - 198 247 2097747 n.s. 36 - 280 355 971748 200 102 - 50 91 199749 97 75 - 47 45 244750 n.s. 0 - 500 460 774751 n.s. n.s. - 92 415 445
TOTAL 5863 7121 - 8795 9603 14494
SD 445 325 - 551 769 1223
10
Table 6.- Length-weight relationships in the calculation of biomass, for Division 3L (out ZEE Canada), 2003-2008 for Greenland halibut, American plaice and witch flounder. Theequation is Weight=a(Length+0.5)b. To calculate the parameters for the indeterminate individuals, we used the total data (males+females+indeterminate individuals).
Greenland halibut American plaice Witch flounder
Year Sex L-W Equations N r 2 Year Sex L-W Equations N r 2 Year Sex L-W Equations N r 2
2003 All W = 0.0020 L3.3855 429 0.9897 2003 All W = 0.0018 L3.4328 725 0.9873 2003 All W = 0.0019 L3.3452 96 0.9883 Males W = 0.0020 L3.3776 231 0.9858 Males W = 0.0025 L3.3191 205 0.9813 Males W = 0.0018 L3.3564 39 0.9901 Females W = 0.0020 L3.3914 198 0.9922 Females W = 0.0016 L3.4755 516 0.9887 Females W = 0.0018 L3.3457 55 0.9861 2004 All W = 0.0025 L3.3067 724 0.9817 2004 All W = 0.0026 L3.4033 515 0.9808 2004 All W = 0.0013 L3.4496 139 0.9888 Males W = 0.0021 L3.3591 335 0.9886 Males W = 0.0045 L3.1673 142 0.9473 Males W = 0.0009 L3.5684 51 0.9796 Females W = 0.0030 L3.2628 389 0.9769 Females W = 0.0022 L3.4001 373 0.9856 Females W = 0.0013 L3.4636 72 0.9907 2006 All W = 0.0021 L3.3631 1220 0.9835 2006 All W = 0.0025 L3.3723 759 0.9784 2006 All W = 0.0026 L3.2619 193 0.9694 Males W = 0.0019 L3.3863 583 0.9831 Males W = 0.0026 L3.3615 267 0.9629 Males W = 0.0046 L3.0994 65 0.9630 Females W = 0.0023 L3.3342 637 0.9835 Females W = 0.0031 L3.3146 486 0.9776 Females W = 0.0021 L3.3201 123 0.9631 2007 All W = 0.0033 L3.2385 1544 0.9890 2007 All W = 0.0024 L3.3710 1276 0.9873 2007 All W = 0.0023 L3.3024 249 0.9776 Males W = 0.0032 L3.2464 694 0.9876 Males W = 0.0026 L3.3456 444 0.9734 Males W = 0.0033 L3.1948 106 0.9618 Females W = 0.0037 L3.2183 842 0.9898 Females W = 0.0028 L3.3289 809 0.9910 Females W = 0.0025 L3.2803 135 0.9880 2008 All W = 0.0037 L3.2060 1704 0.9900 2008 All W = 0.0044 L3.2282 1196 0.9894 2008 All W = 0.0031 L3.2244 381 0.9844 Males W = 0.0036 L3.2070 700 0.9890 Males W = 0.0057 L3.1501 386 0.9853 Males W = 0.0028 L3.2523 147 0.9860
Females W = 0.0038 L3.2008 998 0.9900 Females W = 0.0042 L3.2366 773 0.9931 Females W = 0.0031 L3.2241 210 0.9882

11
TABLE 7.- Greenland halibut length distribution per haul mean catches by sex and year. Number per stratified mean catches. Spanish Summer Survey on NAFO 3L: 2003-2008 (R/V “Vizconde de Eza”). Indet. means indeterminate. (*) In 2003, the data correspond to 69% of the total area prospected in 2006-2008. (M – Males; F-Females; I-Indet.;T-Total).
2003 (*) 2004 2006 2007 2008 Lenght (cm.) M F I T M F I T M F I T M F I T M F I T
6 0.00 0.00 0.00 0.00 0.00 0.04 0.00 0.04 0.00 0.00 0.00 0.00 0.00 0.00 0.00 0.00 0.00 0.00 0.00 0.008 0.00 0.00 0.00 0.00 0.00 0.00 0.00 0.00 0.00 0.02 0.00 0.02 0.01 0.00 0.01 0.02 0.01 0.02 0.02 0.0510 0.49 0.64 0.00 1.14 0.00 0.04 0.00 0.04 0.26 0.08 0.01 0.35 0.16 0.16 0.06 0.38 0.37 0.35 0.12 0.8512 1.04 1.65 0.00 2.69 0.49 0.68 0.10 1.27 2.12 1.48 0.00 3.60 0.94 0.99 0.06 1.99 0.93 1.14 0.14 2.2114 0.89 1.25 0.00 2.14 1.08 1.42 0.00 2.49 2.64 3.18 0.00 5.82 1.09 1.47 0.00 2.56 0.24 0.44 0.05 0.7316 0.03 0.03 0.00 0.06 0.99 1.20 0.02 2.22 1.01 1.38 0.00 2.40 0.26 0.45 0.00 0.72 0.00 0.00 0.00 0.0018 0.06 0.06 0.00 0.12 0.06 0.42 0.00 0.49 0.05 0.15 0.00 0.19 0.06 0.01 0.00 0.07 0.00 0.03 0.00 0.0320 0.36 0.62 0.00 0.99 0.01 0.02 0.00 0.03 0.01 0.01 0.00 0.02 0.02 0.04 0.00 0.06 0.04 0.13 0.00 0.1722 2.07 2.63 0.00 4.71 0.28 0.10 0.00 0.38 0.01 0.09 0.00 0.10 0.19 0.04 0.00 0.23 0.46 0.55 0.00 1.0124 3.81 3.68 0.00 7.49 0.95 0.33 0.00 1.29 0.16 0.08 0.00 0.24 0.43 0.45 0.00 0.88 0.89 1.16 0.00 2.0526 3.03 2.55 0.00 5.58 1.70 0.81 0.00 2.51 0.40 0.35 0.00 0.75 0.60 0.69 0.00 1.29 0.72 1.57 0.00 2.2928 1.44 1.85 0.00 3.29 1.35 1.14 0.00 2.49 0.65 0.74 0.00 1.39 0.35 0.52 0.00 0.88 0.27 0.67 0.00 0.9430 2.21 2.13 0.00 4.35 1.94 1.30 0.00 3.24 0.82 0.70 0.00 1.52 0.21 0.08 0.00 0.29 0.23 0.21 0.00 0.4432 2.60 2.52 0.00 5.12 2.32 1.85 0.00 4.16 0.85 0.79 0.00 1.64 0.55 0.28 0.00 0.83 0.50 0.46 0.00 0.9634 2.47 1.88 0.00 4.36 2.22 2.11 0.00 4.33 1.54 1.36 0.00 2.90 0.88 0.78 0.00 1.67 0.94 0.88 0.00 1.8236 1.55 1.43 0.00 2.98 1.70 2.29 0.00 3.99 1.57 1.62 0.00 3.19 1.22 1.30 0.00 2.52 1.12 1.20 0.00 2.3238 1.12 1.34 0.00 2.46 1.34 1.75 0.00 3.09 1.26 1.92 0.00 3.18 1.43 1.58 0.00 3.01 0.97 1.24 0.00 2.2140 0.47 1.00 0.00 1.47 0.96 1.47 0.00 2.43 1.28 1.72 0.00 2.99 1.32 2.13 0.00 3.45 1.18 1.26 0.00 2.4342 0.40 0.81 0.00 1.21 0.35 0.80 0.00 1.15 1.31 1.56 0.00 2.87 1.12 2.05 0.00 3.16 1.69 2.02 0.00 3.7144 0.30 0.62 0.00 0.92 0.26 0.67 0.00 0.93 0.85 1.69 0.00 2.53 1.02 1.92 0.00 2.94 1.23 2.24 0.00 3.4746 0.08 0.25 0.00 0.33 0.12 0.28 0.00 0.40 0.48 1.02 0.00 1.50 0.69 1.41 0.00 2.10 1.16 2.06 0.00 3.2248 0.16 0.21 0.00 0.37 0.09 0.19 0.00 0.28 0.30 0.81 0.00 1.12 0.34 1.03 0.00 1.37 0.87 2.08 0.00 2.9550 0.13 0.22 0.00 0.36 0.08 0.08 0.00 0.16 0.13 0.42 0.00 0.54 0.15 0.72 0.00 0.87 0.42 1.62 0.00 2.0452 0.14 0.17 0.00 0.30 0.00 0.07 0.00 0.07 0.05 0.28 0.00 0.33 0.16 0.58 0.00 0.74 0.29 1.30 0.00 1.5954 0.05 0.20 0.00 0.25 0.05 0.07 0.00 0.12 0.07 0.17 0.00 0.24 0.06 0.32 0.00 0.38 0.18 0.80 0.00 0.9856 0.01 0.10 0.00 0.12 0.02 0.03 0.00 0.05 0.01 0.07 0.00 0.08 0.03 0.13 0.00 0.16 0.15 0.43 0.00 0.5858 0.03 0.02 0.00 0.05 0.01 0.04 0.00 0.05 0.03 0.06 0.00 0.09 0.03 0.06 0.00 0.09 0.03 0.28 0.00 0.3060 0.00 0.00 0.00 0.00 0.02 0.03 0.00 0.05 0.00 0.08 0.00 0.08 0.01 0.09 0.00 0.10 0.01 0.13 0.00 0.1462 0.00 0.08 0.00 0.08 0.00 0.01 0.00 0.01 0.01 0.02 0.00 0.03 0.00 0.07 0.00 0.07 0.02 0.06 0.00 0.0864 0.02 0.04 0.00 0.07 0.00 0.02 0.00 0.02 0.00 0.00 0.00 0.00 0.00 0.00 0.00 0.00 0.00 0.08 0.00 0.0866 0.00 0.04 0.00 0.04 0.00 0.00 0.00 0.00 0.00 0.02 0.00 0.02 0.00 0.02 0.00 0.02 0.00 0.05 0.00 0.0568 0.00 0.00 0.00 0.00 0.00 0.04 0.00 0.04 0.00 0.02 0.00 0.02 0.00 0.01 0.00 0.01 0.00 0.02 0.00 0.0270 0.00 0.01 0.00 0.01 0.00 0.00 0.00 0.00 0.00 0.01 0.00 0.01 0.00 0.01 0.00 0.01 0.00 0.04 0.00 0.0472 0.00 0.04 0.00 0.04 0.00 0.00 0.00 0.00 0.00 0.00 0.00 0.00 0.00 0.00 0.00 0.00 0.00 0.02 0.00 0.0274 0.00 0.02 0.00 0.02 0.00 0.04 0.00 0.04 0.00 0.01 0.00 0.01 0.00 0.00 0.00 0.00 0.00 0.03 0.00 0.0376 0.00 0.00 0.00 0.00 0.00 0.00 0.00 0.00 0.00 0.00 0.00 0.00 0.00 0.02 0.00 0.02 0.00 0.01 0.00 0.0178 0.00 0.00 0.00 0.00 0.00 0.00 0.00 0.00 0.00 0.00 0.00 0.00 0.00 0.00 0.00 0.00 0.00 0.02 0.00 0.0280 0.00 0.01 0.00 0.01 0.00 0.00 0.00 0.00 0.00 0.01 0.00 0.01 0.00 0.01 0.00 0.01 0.00 0.04 0.00 0.0482 0.00 0.00 0.00 0.00 0.00 0.00 0.00 0.00 0.00 0.01 0.00 0.01 0.00 0.00 0.00 0.00 0.00 0.01 0.00 0.0184 0.00 0.00 0.00 0.00 0.00 0.00 0.00 0.00 0.00 0.01 0.00 0.01 0.00 0.00 0.00 0.00 0.00 0.00 0.00 0.0086 0.00 0.00 0.00 0.00 0.00 0.00 0.00 0.00 0.00 0.01 0.00 0.01 0.00 0.00 0.00 0.00 0.00 0.00 0.00 0.0088 0.00 0.02 0.00 0.02 0.00 0.00 0.00 0.00 0.00 0.00 0.00 0.00 0.00 0.00 0.00 0.00 0.00 0.01 0.00 0.0190 0.00 0.00 0.00 0.00 0.00 0.00 0.00 0.00 0.00 0.00 0.00 0.00 0.00 0.00 0.00 0.00 0.00 0.00 0.00 0.0092 0.00 0.00 0.00 0.00 0.00 0.00 0.00 0.00 0.00 0.00 0.00 0.00 0.00 0.00 0.00 0.00 0.00 0.01 0.00 0.01
Total 24.98 28.14 0.00 53.12 18.38 19.32 0.12 37.82 17.90 21.93 0.01 39.84 13.32 19.43 0.14 32.88 14.90 24.67 0.34 39.91Nº Ind.: 920 1035 0 1955 935 985 4 1924 1549 1907 1 3457 1205 1759 13 2977 1447 2416 37 3900
Sampled catch: 585 695 1397 1533 2431Range: 10-88 7-75 9-87 9-80 9-92
Total catch: 585 695 1397 1533 2431Total hauls: 40 58 101 99 103

12
TABLE 8.- Swept area, number of hauls and American plaice mean catch (Kg) and SD (**) by stratum. Spanish Survey on NAFO Div. 3L in the period 2003-2008, on board R/V "Vizconde de Eza". (*) In 2003, the data correspond to 69% of the total area prospected in 2006-2008.
2003 (*) 2004 2006 2007 2008 Stratum Swept
area Tow
numberMean catch
SD Swept area
Tow number
Mean catch
SD Swept area
Tow number
Mean catch
SD Swept area
Tow number
Mean catch
SD Swept area
Tow number
Mean catch
SD
385 0.0225 2 3.985 2.920 0.0229 2 19.100 15.132 0.0229 2 48.530 33.757 0.0225 2 31.925 7.955 0.0229 2 64.750 60.033 387 0.0229 2 3.850 4.031 0.0214 2 17.810 2.814 0.0225 2 6.653 5.533 0.0225 2 7.992 2.039 0.0435 4 5.906 4.512 388 0.0334 3 7.317 2.249 0.0105 1 13.450 - 0.0566 5 7.618 2.653 0.0563 5 8.390 2.267 0.0559 5 2.925 1.905 389 0.0454 4 6.455 2.150 0.0225 2 8.950 4.073 0.0795 7 20.584 12.793 0.0900 8 25.475 13.677 0.0780 7 12.982 11.014 390 0.0563 5 1.854 1.584 0.0345 3 27.777 14.246 0.1249 11 76.086 51.616 0.1350 12 69.235 50.977 0.1395 12 117.141 134.128 391 0.0338 3 6.207 1.670 0.0218 2 14.890 3.125 0.0450 4 10.585 9.713 0.0450 4 37.163 30.535 0.0454 4 20.580 28.816 392 0.0116 1 8.400 - 0.0214 2 0.300 0.424 0.0229 2 0.000 0.000 0.0225 2 1.055 0.658 0.0221 2 0.000 0.000 729 0.0210 2 55.190 19.643 0.0221 2 0.150 0.212 0.0338 3 0.000 0.000 0.0338 3 0.000 0.000 0.0338 3 0.000 0.000 730 0.0221 2 59.000 21.779 0.0221 2 0.000 0.000 0.0326 3 0.000 0.000 0.0225 2 0.000 0.000 0.0323 3 0.000 0.000 731 0.0229 2 25.610 11.017 0.0233 2 1.450 2.051 0.0341 3 0.000 0.000 0.0338 3 0.253 0.439 0.0330 3 0.327 0.566 732 0.0113 1 40.700 - 0.0210 2 0.000 0.000 0.0334 3 0.000 0.000 0.0338 3 0.000 0.000 0.0446 4 0.000 0.000 733 n.s. n.s. n.s. n.s. 0.0330 3 1.267 1.186 0.0454 4 0.000 0.000 0.0338 3 0.320 0.554 0.0431 4 0.426 0.762 734 n.s. n.s. n.s. n.s. 0.0304 3 0.000 0.000 0.0225 2 0.000 0.000 0.0225 2 0.000 0.000 0.0221 2 0.066 0.093 741 0.0113 1 0.000 - 0.0323 3 0.000 0.000 0.0218 2 0.000 0.000 0.0225 2 0.000 0.000 0.0210 2 0.000 0.000 742 0.0116 1 0.000 - 0.0120 1 0.000 - 0.0229 2 0.000 0.000 0.0225 2 0.000 0.000 0.0210 2 0.000 0.000 743 n.s. n.s. n.s. n.s. 0.0188 2 0.000 0.000 0.0225 2 0.000 0.000 0.0225 2 0.000 0.000 0.0203 2 0.000 0.000 744 n.s. n.s. n.s. n.s. 0.0101 1 0.000 - 0.0229 2 0.000 0.000 0.0218 2 0.000 0.000 0.0221 2 0.000 0.000 745 0.0341 3 0.610 0.849 0.0319 3 0.000 0.000 0.0686 6 0.000 0.000 0.0675 6 0.000 0.000 0.0555 5 0.000 0.000 746 0.0446 4 0.000 0.000 0.0338 3 0.000 0.000 0.0675 6 0.000 0.000 0.0664 6 0.000 0.000 0.0638 6 0.000 0.000 747 n.s. n.s. n.s. n.s. 0.0308 3 0.000 0.000 0.1230 11 0.000 0.000 0.1238 11 0.000 0.000 0.1069 10 0.000 0.000 748 0.0109 1 1.010 - 0.0199 2 0.000 0.000 0.0326 3 0.000 0.000 0.0338 3 0.000 0.000 0.0218 2 0.000 0.000 749 0.0221 2 0.000 0.000 0.0221 2 0.000 0.000 0.0229 2 0.000 0.000 0.0113 1 0.000 - 0.0214 2 0.000 0.000 750 n.s. n.s. n.s. n.s. 0.0180 2 0.000 0.000 0.1005 9 0.000 0.000 0.0679 6 0.000 0.000 0.0844 8 0.000 0.000 751 n.s. n.s. n.s. n.s. n.s. n.s. n.s n.s 0.0454 4 0.000 0.000 0.0225 2 0.000 0.000 0.0413 4 0.000 0.000
( )(**)
1ix x
SDn
−=
−∑

13
TABLE 9.- Stratified mean catches (Kg) and SD of American plaice by stratum and year (2003-
2008). n.s. means stratum not surveyed. In 2003, the data correspond to 69% of the total area prospected in 2006-2008.
Survey
Stratum 2003 2004 2005 2006 2007 2008385 470.23 2253.80 - 5726.54 3767.15 7640.50387 985.60 4559.36 - 1703.04 2045.95 1511.87388 2612.05 4801.65 - 2719.48 2995.09 1044.23389 3285.60 4555.55 - 10477.26 12966.65 6608.06390 1511.01 22637.98 - 62010.39 56426.39 95469.71391 1750.28 4198.98 - 2984.97 10479.83 5803.56392 1218.00 43.50 - 0.00 152.90 0.00729 10265.34 27.90 - 0.00 0.00 0.00730 10030.00 0.00 - 0.00 0.00 0.00731 5531.76 313.20 - 0.00 54.72 70.56732 9401.70 0.00 - 0.00 0.00 0.00733 n.s 296.40 - 0.00 74.88 99.68734 n.s 0.00 - 0.00 0.00 10.10741 0.00 0.00 - 0.00 0.00 0.00742 0.00 0.00 - 0.00 0.00 0.00743 n.s 0.00 - 0.00 0.00 0.00744 n.s 0.00 - 0.00 0.00 0.00745 212.28 0.00 - 0.00 0.00 0.00746 0.00 0.00 - 0.00 0.00 0.00747 n.s 0.00 - 0.00 0.00 0.00748 160.59 0.00 - 0.00 0.00 0.00749 0.00 0.00 - 0.00 0.00 0.00750 n.s 0.00 - 0.00 0.00 0.00751 n.s n.s - 0.00 0.00 0.00
TOTAL 47434.44 43688.32 - 85621.68 88963.55 118258.27
10.60 6.98 - 13.20 13.71 18.23
SD 0.95 1.12 - 2.06 2.00 4.98
14
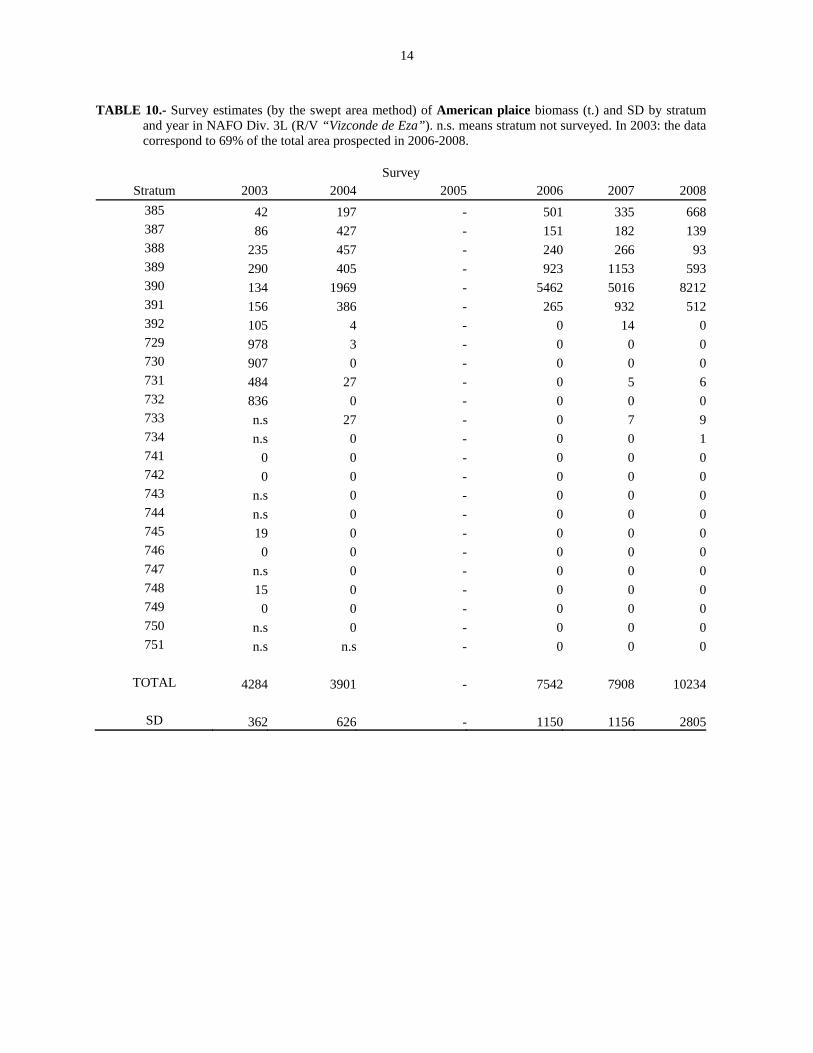
TABLE 10.- Survey estimates (by the swept area method) of American plaice biomass (t.) and SD by stratum and year in NAFO Div. 3L (R/V “Vizconde de Eza”). n.s. means stratum not surveyed. In 2003: the data correspond to 69% of the total area prospected in 2006-2008.
Survey Stratum 2003 2004 2005 2006 2007 2008
385 42 197 - 501 335 668387 86 427 - 151 182 139388 235 457 - 240 266 93389 290 405 - 923 1153 593390 134 1969 - 5462 5016 8212391 156 386 - 265 932 512392 105 4 - 0 14 0729 978 3 - 0 0 0730 907 0 - 0 0 0731 484 27 - 0 5 6732 836 0 - 0 0 0733 n.s 27 - 0 7 9734 n.s 0 - 0 0 1741 0 0 - 0 0 0742 0 0 - 0 0 0743 n.s 0 - 0 0 0744 n.s 0 - 0 0 0745 19 0 - 0 0 0746 0 0 - 0 0 0747 n.s 0 - 0 0 0748 15 0 - 0 0 0749 0 0 - 0 0 0750 n.s 0 - 0 0 0751 n.s n.s - 0 0 0
TOTAL 4284 3901 - 7542 7908 10234
SD 362 626 - 1150 1156 2805
15
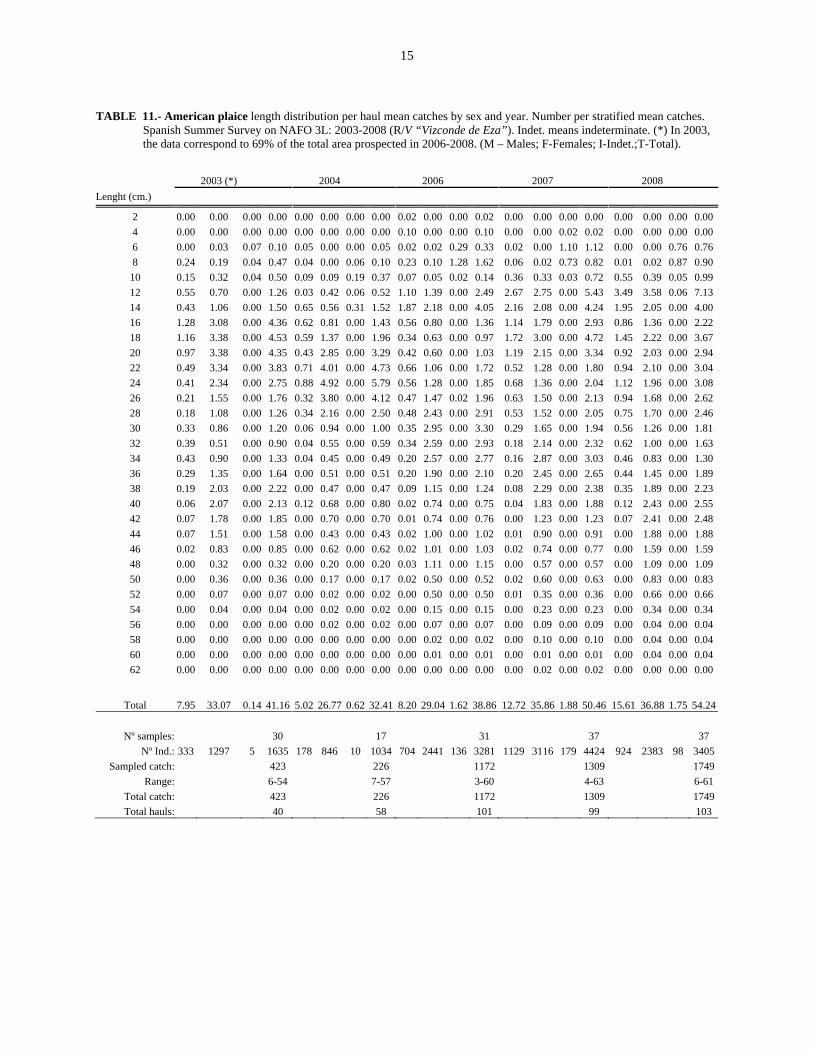
TABLE 11.- American plaice length distribution per haul mean catches by sex and year. Number per stratified mean catches. Spanish Summer Survey on NAFO 3L: 2003-2008 (R/V “Vizconde de Eza”). Indet. means indeterminate. (*) In 2003, the data correspond to 69% of the total area prospected in 2006-2008. (M – Males; F-Females; I-Indet.;T-Total).
2003 (*) 2004 2006 2007 2008 Lenght (cm.)
2 0.00 0.00 0.00 0.00 0.00 0.00 0.00 0.00 0.02 0.00 0.00 0.02 0.00 0.00 0.00 0.00 0.00 0.00 0.00 0.004 0.00 0.00 0.00 0.00 0.00 0.00 0.00 0.00 0.10 0.00 0.00 0.10 0.00 0.00 0.02 0.02 0.00 0.00 0.00 0.006 0.00 0.03 0.07 0.10 0.05 0.00 0.00 0.05 0.02 0.02 0.29 0.33 0.02 0.00 1.10 1.12 0.00 0.00 0.76 0.768 0.24 0.19 0.04 0.47 0.04 0.00 0.06 0.10 0.23 0.10 1.28 1.62 0.06 0.02 0.73 0.82 0.01 0.02 0.87 0.9010 0.15 0.32 0.04 0.50 0.09 0.09 0.19 0.37 0.07 0.05 0.02 0.14 0.36 0.33 0.03 0.72 0.55 0.39 0.05 0.9912 0.55 0.70 0.00 1.26 0.03 0.42 0.06 0.52 1.10 1.39 0.00 2.49 2.67 2.75 0.00 5.43 3.49 3.58 0.06 7.1314 0.43 1.06 0.00 1.50 0.65 0.56 0.31 1.52 1.87 2.18 0.00 4.05 2.16 2.08 0.00 4.24 1.95 2.05 0.00 4.0016 1.28 3.08 0.00 4.36 0.62 0.81 0.00 1.43 0.56 0.80 0.00 1.36 1.14 1.79 0.00 2.93 0.86 1.36 0.00 2.2218 1.16 3.38 0.00 4.53 0.59 1.37 0.00 1.96 0.34 0.63 0.00 0.97 1.72 3.00 0.00 4.72 1.45 2.22 0.00 3.6720 0.97 3.38 0.00 4.35 0.43 2.85 0.00 3.29 0.42 0.60 0.00 1.03 1.19 2.15 0.00 3.34 0.92 2.03 0.00 2.9422 0.49 3.34 0.00 3.83 0.71 4.01 0.00 4.73 0.66 1.06 0.00 1.72 0.52 1.28 0.00 1.80 0.94 2.10 0.00 3.0424 0.41 2.34 0.00 2.75 0.88 4.92 0.00 5.79 0.56 1.28 0.00 1.85 0.68 1.36 0.00 2.04 1.12 1.96 0.00 3.0826 0.21 1.55 0.00 1.76 0.32 3.80 0.00 4.12 0.47 1.47 0.02 1.96 0.63 1.50 0.00 2.13 0.94 1.68 0.00 2.6228 0.18 1.08 0.00 1.26 0.34 2.16 0.00 2.50 0.48 2.43 0.00 2.91 0.53 1.52 0.00 2.05 0.75 1.70 0.00 2.4630 0.33 0.86 0.00 1.20 0.06 0.94 0.00 1.00 0.35 2.95 0.00 3.30 0.29 1.65 0.00 1.94 0.56 1.26 0.00 1.8132 0.39 0.51 0.00 0.90 0.04 0.55 0.00 0.59 0.34 2.59 0.00 2.93 0.18 2.14 0.00 2.32 0.62 1.00 0.00 1.6334 0.43 0.90 0.00 1.33 0.04 0.45 0.00 0.49 0.20 2.57 0.00 2.77 0.16 2.87 0.00 3.03 0.46 0.83 0.00 1.3036 0.29 1.35 0.00 1.64 0.00 0.51 0.00 0.51 0.20 1.90 0.00 2.10 0.20 2.45 0.00 2.65 0.44 1.45 0.00 1.8938 0.19 2.03 0.00 2.22 0.00 0.47 0.00 0.47 0.09 1.15 0.00 1.24 0.08 2.29 0.00 2.38 0.35 1.89 0.00 2.2340 0.06 2.07 0.00 2.13 0.12 0.68 0.00 0.80 0.02 0.74 0.00 0.75 0.04 1.83 0.00 1.88 0.12 2.43 0.00 2.5542 0.07 1.78 0.00 1.85 0.00 0.70 0.00 0.70 0.01 0.74 0.00 0.76 0.00 1.23 0.00 1.23 0.07 2.41 0.00 2.4844 0.07 1.51 0.00 1.58 0.00 0.43 0.00 0.43 0.02 1.00 0.00 1.02 0.01 0.90 0.00 0.91 0.00 1.88 0.00 1.8846 0.02 0.83 0.00 0.85 0.00 0.62 0.00 0.62 0.02 1.01 0.00 1.03 0.02 0.74 0.00 0.77 0.00 1.59 0.00 1.5948 0.00 0.32 0.00 0.32 0.00 0.20 0.00 0.20 0.03 1.11 0.00 1.15 0.00 0.57 0.00 0.57 0.00 1.09 0.00 1.0950 0.00 0.36 0.00 0.36 0.00 0.17 0.00 0.17 0.02 0.50 0.00 0.52 0.02 0.60 0.00 0.63 0.00 0.83 0.00 0.8352 0.00 0.07 0.00 0.07 0.00 0.02 0.00 0.02 0.00 0.50 0.00 0.50 0.01 0.35 0.00 0.36 0.00 0.66 0.00 0.6654 0.00 0.04 0.00 0.04 0.00 0.02 0.00 0.02 0.00 0.15 0.00 0.15 0.00 0.23 0.00 0.23 0.00 0.34 0.00 0.3456 0.00 0.00 0.00 0.00 0.00 0.02 0.00 0.02 0.00 0.07 0.00 0.07 0.00 0.09 0.00 0.09 0.00 0.04 0.00 0.0458 0.00 0.00 0.00 0.00 0.00 0.00 0.00 0.00 0.00 0.02 0.00 0.02 0.00 0.10 0.00 0.10 0.00 0.04 0.00 0.0460 0.00 0.00 0.00 0.00 0.00 0.00 0.00 0.00 0.00 0.01 0.00 0.01 0.00 0.01 0.00 0.01 0.00 0.04 0.00 0.0462 0.00 0.00 0.00 0.00 0.00 0.00 0.00 0.00 0.00 0.00 0.00 0.00 0.00 0.02 0.00 0.02 0.00 0.00 0.00 0.00
Total 7.95 33.07 0.14 41.16 5.02 26.77 0.62 32.41 8.20 29.04 1.62 38.86 12.72 35.86 1.88 50.46 15.61 36.88 1.75 54.24
Nº samples: 30 17 31 37 37 Nº Ind.: 333 1297 5 1635 178 846 10 1034 704 2441 136 3281 1129 3116 179 4424 924 2383 98 3405
Sampled catch: 423 226 1172 1309 1749Range: 6-54 7-57 3-60 4-63 6-61
Total catch: 423 226 1172 1309 1749Total hauls: 40 58 101 99 103
16
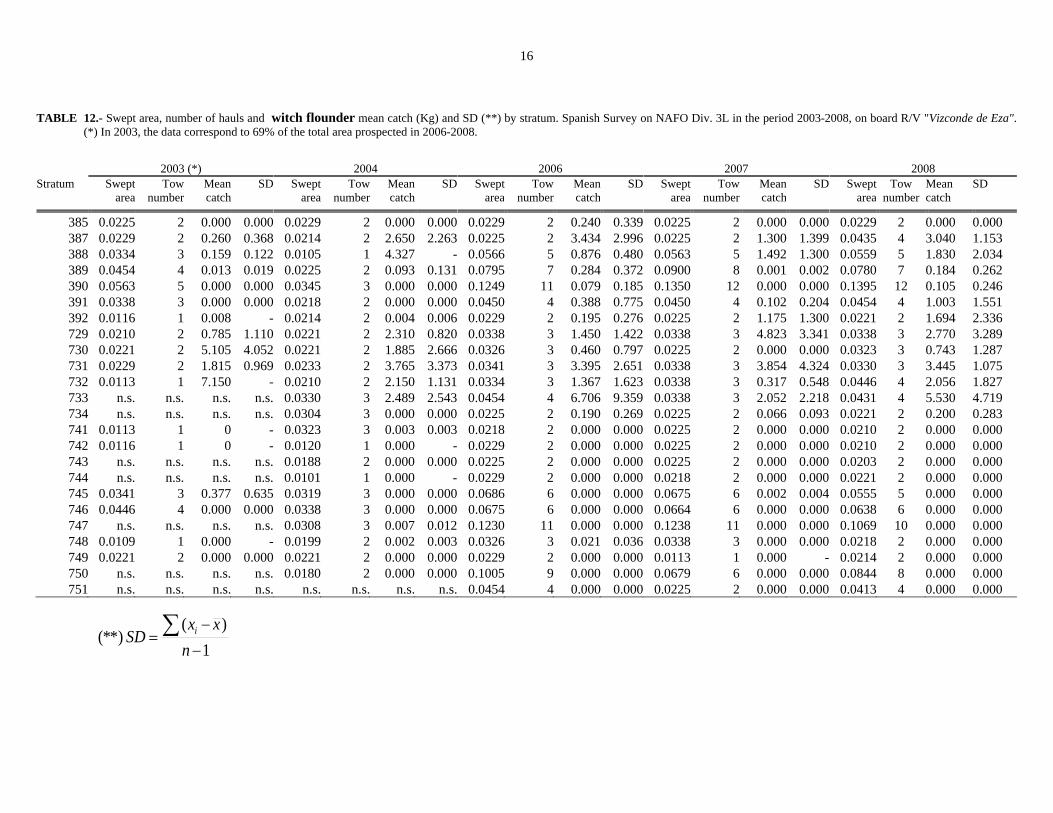
TABLE 12.- Swept area, number of hauls and witch flounder mean catch (Kg) and SD (**) by stratum. Spanish Survey on NAFO Div. 3L in the period 2003-2008, on board R/V "Vizconde de Eza".
(*) In 2003, the data correspond to 69% of the total area prospected in 2006-2008.
2003 (*) 2004 2006 2007 2008 Stratum Swept
areaTow
numberMean catch
SD Swept area
Tow number
Meancatch
SD Swept area
Tow number
Mean catch
SD Swept area
Tow number
Mean catch
SD Swept area
Tow number
Mean catch
SD
385 0.0225 2 0.000 0.000 0.0229 2 0.000 0.000 0.0229 2 0.240 0.339 0.0225 2 0.000 0.000 0.0229 2 0.000 0.000 387 0.0229 2 0.260 0.368 0.0214 2 2.650 2.263 0.0225 2 3.434 2.996 0.0225 2 1.300 1.399 0.0435 4 3.040 1.153 388 0.0334 3 0.159 0.122 0.0105 1 4.327 - 0.0566 5 0.876 0.480 0.0563 5 1.492 1.300 0.0559 5 1.830 2.034 389 0.0454 4 0.013 0.019 0.0225 2 0.093 0.131 0.0795 7 0.284 0.372 0.0900 8 0.001 0.002 0.0780 7 0.184 0.262 390 0.0563 5 0.000 0.000 0.0345 3 0.000 0.000 0.1249 11 0.079 0.185 0.1350 12 0.000 0.000 0.1395 12 0.105 0.246 391 0.0338 3 0.000 0.000 0.0218 2 0.000 0.000 0.0450 4 0.388 0.775 0.0450 4 0.102 0.204 0.0454 4 1.003 1.551 392 0.0116 1 0.008 - 0.0214 2 0.004 0.006 0.0229 2 0.195 0.276 0.0225 2 1.175 1.300 0.0221 2 1.694 2.336 729 0.0210 2 0.785 1.110 0.0221 2 2.310 0.820 0.0338 3 1.450 1.422 0.0338 3 4.823 3.341 0.0338 3 2.770 3.289 730 0.0221 2 5.105 4.052 0.0221 2 1.885 2.666 0.0326 3 0.460 0.797 0.0225 2 0.000 0.000 0.0323 3 0.743 1.287 731 0.0229 2 1.815 0.969 0.0233 2 3.765 3.373 0.0341 3 3.395 2.651 0.0338 3 3.854 4.324 0.0330 3 3.445 1.075 732 0.0113 1 7.150 - 0.0210 2 2.150 1.131 0.0334 3 1.367 1.623 0.0338 3 0.317 0.548 0.0446 4 2.056 1.827 733 n.s. n.s. n.s. n.s. 0.0330 3 2.489 2.543 0.0454 4 6.706 9.359 0.0338 3 2.052 2.218 0.0431 4 5.530 4.719 734 n.s. n.s. n.s. n.s. 0.0304 3 0.000 0.000 0.0225 2 0.190 0.269 0.0225 2 0.066 0.093 0.0221 2 0.200 0.283 741 0.0113 1 0 - 0.0323 3 0.003 0.003 0.0218 2 0.000 0.000 0.0225 2 0.000 0.000 0.0210 2 0.000 0.000 742 0.0116 1 0 - 0.0120 1 0.000 - 0.0229 2 0.000 0.000 0.0225 2 0.000 0.000 0.0210 2 0.000 0.000 743 n.s. n.s. n.s. n.s. 0.0188 2 0.000 0.000 0.0225 2 0.000 0.000 0.0225 2 0.000 0.000 0.0203 2 0.000 0.000 744 n.s. n.s. n.s. n.s. 0.0101 1 0.000 - 0.0229 2 0.000 0.000 0.0218 2 0.000 0.000 0.0221 2 0.000 0.000 745 0.0341 3 0.377 0.635 0.0319 3 0.000 0.000 0.0686 6 0.000 0.000 0.0675 6 0.002 0.004 0.0555 5 0.000 0.000 746 0.0446 4 0.000 0.000 0.0338 3 0.000 0.000 0.0675 6 0.000 0.000 0.0664 6 0.000 0.000 0.0638 6 0.000 0.000 747 n.s. n.s. n.s. n.s. 0.0308 3 0.007 0.012 0.1230 11 0.000 0.000 0.1238 11 0.000 0.000 0.1069 10 0.000 0.000 748 0.0109 1 0.000 - 0.0199 2 0.002 0.003 0.0326 3 0.021 0.036 0.0338 3 0.000 0.000 0.0218 2 0.000 0.000 749 0.0221 2 0.000 0.000 0.0221 2 0.000 0.000 0.0229 2 0.000 0.000 0.0113 1 0.000 - 0.0214 2 0.000 0.000 750 n.s. n.s. n.s. n.s. 0.0180 2 0.000 0.000 0.1005 9 0.000 0.000 0.0679 6 0.000 0.000 0.0844 8 0.000 0.000 751 n.s. n.s. n.s. n.s. n.s. n.s. n.s. n.s. 0.0454 4 0.000 0.000 0.0225 2 0.000 0.000 0.0413 4 0.000 0.000
( )(**)
1ix x
SDn
−=
−∑
17
TABLE 13.- Stratified mean catches (Kg) and SD of witch flounder by stratum and year (2003-
2008). n.s. means stratum not surveyed. In 2003, the data correspond to 69% of the total areaprospected in 2006-2008.
Survey
Stratum 2003 2004 2005 2006 2007 2008385 0.00 0.00 - 28.32 0.00 0.00387 66.56 678.40 - 878.98 332.67 778.18388 56.88 1544.74 - 312.80 532.50 653.38389 6.36 47.08 - 144.34 0.38 93.58390 0.00 0.00 - 64.46 0.00 85.58391 0.00 0.00 - 109.28 28.69 282.71392 1.16 0.58 - 28.28 170.30 245.56729 146.01 429.66 - 269.70 897.14 515.22730 867.85 320.45 - 78.20 0.00 126.37731 392.04 813.24 - 733.32 832.46 744.12732 1651.65 496.65 - 315.70 73.15 474.94733 n.s 582.50 - 1569.26 480.17 1293.90734 n.s 0.00 - 29.07 10.02 30.60741 0.00 0.27 - 0.00 0.00 0.00742 0.00 0.00 - 0.00 0.00 0.00743 n.s 0.00 - 0.00 0.00 0.00744 n.s 0.00 - 0.00 0.00 0.00745 131.08 0.00 - 0.00 0.58 0.00746 0.00 0.00 - 0.00 0.00 0.00747 n.s 4.83 - 0.00 0.00 0.00748 0.00 0.32 - 3.34 0.00 0.00749 0.00 0.00 - 0.00 0.00 0.00750 n.s 0.00 - 0.00 0.00 0.00751 n.s n.s - 0.00 0.00 0.00
TOTAL 3319.59 4918.72 - 4565.04 3358.07 5324.12
0.74 0.79 0.70 0.52 0.82
SD 0.12 0.13 0.20 0.12 0.13

18
TABLE 14.- Survey estimates (by the swept area method) of witch flounder biomass (t.) and SD by stratum and year in NAFO Div. 3L (R/V “Vizconde de Eza”). n.s. means stratum not surveyed. In 2003: the data correspond to 69% of the total area prospected in 2006-2008.
Survey Stratum 2003 2004 2005 2006 2007 2008
385 0 0 - 2 0 0387 6 63 - 78 30 72388 5 147 - 28 47 58389 1 4 - 13 0 8390 0 0 - 6 0 7391 0 0 - 10 3 25392 0 0 - 2 15 22729 14 39 - 24 80 46730 78 29 - 7 0 12731 34 70 - 64 74 68732 147 47 - 28 7 43733 n.s 53 - 138 43 120734 n.s 0 - 3 1 3741 0 0 - 0 0 0742 0 0 - 0 0 0743 n.s 0 - 0 0 0744 n.s 0 - 0 0 0745 12 0 - 0 0 0746 0 0 - 0 0 0747 n.s 0 - 0 0 0748 0 0 - 0 0 0749 0 0 - 0 0 0750 n.s 0 - 0 0 0751 n.s n.s - 0 0 0
TOTAL 297 453 404 298 483
SD 51 75 116 71 80
19
TABLE 15.- Witch flounder length distribution per haul mean catches by sex and year. Number per stratified mean catches. Spanish Summer Survey on NAFO 3L: 2003-2008 (R/V “Vizconde de Eza”). Indet. means indeterminate. (*) In 2003, the data correspond to 69% of the total area prospected in 2006-2008. (M – Males; F-Females; I-Indet.;T-Total).
2003 (*) 2004 2006 2007 2008 Lenght (cm.)
6 0.00 0.00 0.03 0.03 0.00 0.00 0.06 0.06 0.00 0.00 0.00 0.00 0.00 0.00 0.00 0.00 0.00 0.00 0.02 0.02 8 0.00 0.00 0.03 0.03 0.00 0.00 0.31 0.31 0.02 0.00 0.06 0.09 0.00 0.01 0.02 0.03 0.00 0.01 0.22 0.23 10 0.03 0.03 0.00 0.05 0.04 0.00 0.10 0.14 0.03 0.02 0.01 0.07 0.02 0.01 0.05 0.09 0.03 0.01 0.08 0.12 12 0.13 0.22 0.00 0.35 0.00 0.00 0.01 0.01 0.00 0.00 0.00 0.00 0.00 0.01 0.00 0.01 0.01 0.00 0.00 0.01 14 0.38 0.70 0.00 1.08 0.01 0.00 0.07 0.09 0.04 0.01 0.01 0.06 0.01 0.07 0.03 0.11 0.07 0.12 0.04 0.23 16 0.03 0.03 0.00 0.06 0.14 0.17 0.06 0.37 0.15 0.18 0.00 0.34 0.03 0.02 0.01 0.07 0.11 0.10 0.02 0.23 18 0.05 0.03 0.00 0.08 0.11 0.18 0.06 0.35 0.11 0.15 0.00 0.26 0.02 0.01 0.01 0.04 0.17 0.20 0.00 0.37 20 0.15 0.12 0.00 0.27 0.11 0.32 0.00 0.43 0.06 0.07 0.00 0.14 0.04 0.13 0.00 0.17 0.05 0.08 0.00 0.13 22 0.04 0.07 0.00 0.12 0.20 0.37 0.00 0.57 0.10 0.32 0.00 0.42 0.12 0.26 0.00 0.38 0.15 0.10 0.00 0.25 24 0.07 0.00 0.00 0.07 0.17 0.08 0.00 0.25 0.22 0.31 0.00 0.52 0.22 0.15 0.00 0.37 0.11 0.11 0.00 0.23 26 0.04 0.05 0.00 0.09 0.09 0.18 0.00 0.28 0.02 0.11 0.00 0.13 0.14 0.10 0.01 0.25 0.13 0.08 0.00 0.21 28 0.00 0.07 0.00 0.07 0.21 0.18 0.00 0.39 0.07 0.09 0.00 0.16 0.32 0.34 0.00 0.66 0.29 0.32 0.00 0.61 30 0.18 0.23 0.00 0.41 0.14 0.05 0.00 0.19 0.10 0.22 0.00 0.33 0.12 0.11 0.00 0.23 0.09 0.15 0.00 0.24 32 0.02 0.00 0.00 0.02 0.04 0.14 0.00 0.18 0.21 0.24 0.00 0.46 0.03 0.03 0.00 0.07 0.14 0.14 0.00 0.29 34 0.09 0.09 0.00 0.18 0.01 0.23 0.00 0.25 0.13 0.12 0.00 0.25 0.03 0.07 0.00 0.10 0.06 0.09 0.00 0.15 36 0.09 0.08 0.00 0.17 0.01 0.02 0.00 0.03 0.02 0.05 0.00 0.07 0.03 0.04 0.00 0.08 0.09 0.08 0.00 0.16 38 0.08 0.04 0.00 0.12 0.07 0.03 0.00 0.10 0.02 0.13 0.00 0.15 0.02 0.08 0.00 0.10 0.04 0.17 0.00 0.21 40 0.09 0.00 0.00 0.09 0.03 0.09 0.00 0.12 0.03 0.09 0.00 0.12 0.02 0.03 0.00 0.05 0.04 0.11 0.00 0.15 42 0.02 0.10 0.00 0.13 0.00 0.18 0.00 0.18 0.00 0.07 0.00 0.07 0.02 0.01 0.00 0.03 0.01 0.11 0.00 0.12 44 0.00 0.00 0.00 0.00 0.00 0.12 0.00 0.12 0.00 0.07 0.00 0.07 0.00 0.04 0.00 0.04 0.00 0.06 0.00 0.06 46 0.00 0.03 0.00 0.03 0.00 0.00 0.00 0.00 0.00 0.01 0.00 0.01 0.00 0.06 0.00 0.06 0.00 0.12 0.00 0.12 48 0.00 0.05 0.00 0.05 0.00 0.00 0.00 0.00 0.00 0.02 0.00 0.02 0.00 0.00 0.00 0.00 0.00 0.03 0.00 0.03 50 0.02 0.00 0.00 0.02 0.00 0.03 0.00 0.03 0.00 0.01 0.00 0.01 0.00 0.01 0.00 0.01 0.00 0.00 0.00 0.00 52 0.00 0.05 0.00 0.05 0.00 0.09 0.00 0.09 0.00 0.00 0.00 0.00 0.00 0.00 0.00 0.00 0.00 0.00 0.00 0.00 54 0.00 0.05 0.00 0.05 0.00 0.00 0.00 0.00 0.00 0.00 0.00 0.00 0.00 0.01 0.00 0.01 0.00 0.01 0.00 0.01 56 0.00 0.00 0.00 0.00 0.00 0.00 0.00 0.00 0.00 0.00 0.00 0.00 0.00 0.00 0.00 0.00 0.00 0.00 0.00 0.00 58 0.00 0.00 0.00 0.00 0.00 0.00 0.00 0.00 0.00 0.02 0.00 0.02 0.00 0.00 0.00 0.00 0.00 0.00 0.00 0.00 60 0.00 0.05 0.00 0.05 0.00 0.00 0.00 0.00 0.00 0.01 0.00 0.01 0.00 0.00 0.00 0.00 0.00 0.00 0.00 0.00
Total 1.52 2.08 0.05 3.66 1.39 2.47 0.68 4.54 1.36 2.31 0.09 3.76 1.21 1.62 0.14 2.97 1.59 2.19 0.38 4.16
Nº samples: 15 17 32 22 36 Nº Ind.: 57 70 2 129 70 101 20 191 113 198 8 319 106 139 13 258 159 223 37 419
Sampled catch: 25 38 64 46.098 82.871Range: 7-61 7-53 8-60 9-54 7-54
Total catch: 25 38 64 46.098 82.871Total hauls: 40 58 101 99 103
20
100 m
200 m
1000 m
1000 m
1000 m
1500 m
1500 m 2000 m
2000 m
Canada´s EEZ
> )))
.>
> ))) . >
49.00
48.00
47.00
46.00
45.00
48.00 46.0047.0049.00
Survey - 2006 Valid Null
3N
3M3LFlemish
Pass
100 m
200 m
1000 m
1000 m
1000 m
1500 m
1500 m 2000 m
2000 m
Canada´s EEZ
> )))
.>
> ))) . >
49.00
48.00
47.00
46.00
45.00
48.00 46.0047.0049.00
Survey - 2004 Valid Null
3N
3M3LFlemish
Pass
100 m
200 m
1000 m
1000 m
1000 m
1500 m
1500 m 2000 m
2000 m
Canada´s EEZ
> )))
.>
> ))) . >
49.00
48.00
47.00
46.00
45.00
48.00 46.0047.0049.00
Survey - 2008 ValidNull
3N
3M3LFlemish
Pass
100 m
200 m
1000 m
1000 m
1000 m
1500 m
1500 m 2000 m
2000 m
Canada´s EEZ
> )))
.>
> ))) . >49.00
48.00
47.00
46.00
45.00
48.00 46.0047.0049.00
Survey - 2007 Valid Null
3N
3M3LFlemish
Pass
100 m
200 m
1000 m
1000 m
1000 m
1500 m
1500 m 2000 m
2000 m
Canada´s EEZ
> )))
.>
> ))) . >
49.00
48.00
47.00
46.00
45.00
48.00 46.0047.0049.00
Survey - 2003 Valid Null
3N
3M3LFlemish
Pass
FIGURE 1.- Haul positions of the Spanish surveys in NAFO Division 3L in the period 2003 - 2008 (R/V “Vizconde
de Eza”).

21
Greenland halibut stratified mean catches
0
5
10
15
20
25
30
2003 2004 2005 2006 2007 2008
Year
Wei
ght (
kg)
FIGURE 2.- Greenland halibut stratified mean catches in Kg and ±SD by year. Spanish surveys in NAFO Division
3L: 2003 - 2008 (R/V “Vizconde de Eza”). In 2003, the data correspond to 69% of the total area prospected in 2006-2008.
Greenland halibut biomass and abundance
02000400060008000
1000012000140001600018000
2003 2004 2005 2006 2007 2008
Year
Wei
ght (
t)
0
5000
10000
15000
20000
25000
Nº (
´000
)
BiomassAbundance
FIGURE 3.- Greenland halibut abundance (´000), biomass in tonnes and ±SD by year. Spanish surveys in NAFO
Division 3L: 2003 - 2008 (R/V “Vizconde de Eza”). In 2003, the data correspond to 69% of the total area prospected in 2006-2008.

22
2003
0
1
2
3
4
5
6
7
8
6 10 14 18 22 26 30 34 38 42 46 50 54 58 62 66 70 74 78 82 86 90
Num
ber
MalesFemalesTotal
2004
0
1
2
3
4
5
6
7
8
6 10 14 18 22 26 30 34 38 42 46 50 54 58 62 66 70 74 78 82 86 90
Num
ber
2006
0
1
2
3
4
5
6
7
8
6 10 14 18 22 26 30 34 38 42 46 50 54 58 62 66 70 74 78 82 86 90
Num
ber
2007
0
1
2
3
4
5
6
7
8
6 10 14 18 22 26 30 34 38 42 46 50 54 58 62 66 70 74 78 82 86 90
Num
ber
2008
0
1
2
3
4
5
6
7
8
6 10 14 18 22 26 30 34 38 42 46 50 54 58 62 66 70 74 78 82 86 90
Num
ber
FIGURE 4.- Greenland halibut length distribution (cm) in NAFO 3L: 2003-2008. Number per stratified mean
catches. In 2003, the data correspond to 69% of the total area prospected in 2006-2008.

23
FIGURE 5.- Greenland halibut, American plaice and witch flounder length distribution (cm) in NAFO 3L: 2003-2008.
Greenland halibut length distribution
2003200420052006200720082009
6 10 14 18 22 26 30 34 38 42 46 50 54 58 62 66 70 74 78 82 86 90
Length
Yea
r
American plaice length distribution
20032004
20052006
20072008
2009
2 6 10 14 18 22 26 30 34 38 42 46 50 54 58 62
Length
Yea
r
Witch flounder length distribution
2003
2004
2005
2006
2007
2008
2009
6 10 14 18 22 26 30 34 38 42 46 50 54 58
Length
Yea
r

24
American plaice stratified mean catches
0
5
10
15
20
25
2003 2004 2005 2006 2007 2008
Year
Wei
ght (
kg)
FIGURE 6.- American plaice stratified mean catches in Kg and ±SD by year. Spanish surveys in NAFO Division
3L: 2003 - 2008 (R/V “Vizconde de Eza”). In 2003, the data correspond to 69% of the total area prospected in 2006-2008
American plaice Biomass and Abundance
0
2000
4000
6000
8000
10000
12000
14000
2003 2004 2005 2006 2007 2008
Year
Wei
ght (
t)
0
5000
10000
15000
20000
25000
30000
35000
Nº (
´000
)
BiomassAbundance
FIGURE 7.- American plaice abundance (´000), biomass in tonnes and ±SD by year. Spanish surveys in NAFO
Division 3L: 2003 - 2008 (R/V “Vizconde de Eza”). In 2003, the data correspond to 69% of the total area prospected in 2006-2008.

25
2003
0.0
0.5
1.0
1.5
6 10 14 18 22 26 30 34 38 42 46 50 54 58
Num
ber
MalesFemalesTotal
Witch flounder
2004
0.0
0.5
1.0
1.5
6 10 14 18 22 26 30 34 38 42 46 50 54 58
Num
ber
2006
0.0
0.5
1.0
1.5
6 10 14 18 22 26 30 34 38 42 46 50 54 58
Num
ber
2007
0.0
0.5
1.0
1.5
6 10 14 18 22 26 30 34 38 42 46 50 54 58
Num
ber
2008
0.0
0.5
1.0
1.5
6 10 14 18 22 26 30 34 38 42 46 50 54 58
Num
ber
2003
0
1
2
3
4
5
6
7
2 6 10 14 18 22 26 30 34 38 42 46 50 54 58 62
Num
ber
MalesFemalesTotal
American plaice
2004
0
1
2
3
4
5
6
7
2 6 10 14 18 22 26 30 34 38 42 46 50 54 58 62
Num
ber
2006
0
1
2
3
4
5
6
7
2 6 10 14 18 22 26 30 34 38 42 46 50 54 58 62
Num
ber
2007
0
1
2
3
4
5
6
7
2 6 10 14 18 22 26 30 34 38 42 46 50 54 58 62
Num
ber
2008
0
1
2
3
4
5
6
7
2 6 10 14 18 22 26 30 34 38 42 46 50 54 58 62
Num
ber
FIGURE 8.- American plaice and Witch flounder length distribution (cm) in NAFO 3L: 2003-2008. Number per
stratified mean catches. In 2003, the data correspond to 69% of the total area prospected in 2006-2008.

26
Witch flounder stratified mean catches
0.0
0.2
0.4
0.6
0.8
1.0
1.2
2003 2004 2005 2006 2007 2008
Year
Wei
ght (
kg)
FIGURE 9.- Witch flounder stratified mean catches in Kg and ±SD by year. Spanish surveys in NAFO Division
3L: 2003 - 2008 (R/V “Vizconde de Eza”). In 2003, the data correspond to 69% of the total area prospected in 2006-2008.
FIGURE 10.- Witch flounder abundance (´000), biomass in tonnes and ±SD by year. Spanish surveys in NAFO
Division 3L: 2003 - 2008 (R/V “Vizconde de Eza”). In 2003, the data correspond to 69% of the total area prospected in 2006-2008.
Witch flounder Biomass and Abundance
0
100
200
300
400
500
600
2003 2004 2005 2006 2007 2008
Year
Wei
ght (
t)
0
500
1000
1500
2000
2500
3000
Nº (
´000
)