serum and proteins, lysozyme (muramidase), renal...
TRANSCRIPT

Serum and Urinary Proteins, Lysozyme (Muramidase), and
Renal Dysfunction in Mono- and Myelomonocytic Leukemia
W. PRuZANSKI and M. E. PLArrsFrom the Immunoproteins Research Laboratory of the University of TorontoRheumatic Disease Unit, Department of Medicine and Department ofPathology, The Wellesley Hospital, Toronto, Canada
A B S T R A C T Serum levels, urinary excretion, andclearances of several proteins of different molecularweights were studied in 18 patients with mono- and mye-lomonocytic leukemia. Nine patients had normal renalfunction (group A) and nine had impaired renal func-tion with azotemia (group B). The majority of patientsin both groups had increased concentration of immuno-globulins, particularly IgG, IgA, and IgM; IgD levelwas normal. Serum transferrin and a2-macroglobulinwere frequently reduced while the level of ceruloplasminwas often increased, especially in patients with azotemia.The activity of lysozyme in the serum was high in allpatients, but was considerably higher in group B.
Proteinuria was found in most patients but was moreprominent in group B. Almost invariably albumin con-stituted less than 25% of the total protein excreted.Qualitative analysis of various urinary proteins by im-munochemical techniques and clearance studies sug-gested the presence of glomerular as well as tubular dys-function. Determination of urinary lysozyme frequentlyshowed no direct correlation between the serum levelof the enzyme and its concentration in the urine orits clearance by the kidney. In addition to glomerularfiltration, impaired tubular reabsorption may accountfor the high level of lysozyme in the urine. It is postu-lated that the very high level of lysozyme in the glo-merular filtrate and possibly hypergammaglobulinemiamay play a role in the induction of tubular damage.Renal impairment has been correlated with histologicalchanges in the kidneys. From a comparative study ofvarious leukemias, it seems that the combined glomeru-lar-tubular dysfunction is a manifestation unique tomono- and myelomonocytic leukemia.
Received for publication 12 March 1970 and in revisedform 25 May 1970.
INTRODUCTIONHypogammaglobulinemia and susceptibility to infectionhave been well documented in various leukemias (1-3).However, a few authors have reported an increase ratherthan a deficiency of serum gammaglobulins in monocyticand myelomonocytic leukemia (4-8). Surprisingly, theliterature contains little or no information concerningproteinuria in leukemia patients (9) and, with the ex-ception of well documented uric acid nephropathy(10, 11), the problem of renal injury has been studiedfrom a histologic rather than a functional point of view(12). The latter has recently assumed importance inview of the demonstration of increased levels of serumand urinary lysozyme (LZM) in mono- and myelomono-cytic leukemia (7, 13). In addition to lysozymuria, otherproteins have also been found in the urine of these pa-tients. Some of them have had electrolyte disturbanceswith hypokalemia and hypomagnesemia (7, 14, 15).Osserman and Azar have postulated that the abnormallyhigh concentration of LZM in the renal cortex resultsin injury to the proximal tubular cells, thus contributingto the tubular dysfunction (16).
The present report concerns our observations onvarious serum and urinary proteins in 18 patients withmono- and myelomonocytic leukemia. It was found thata majority of the patients had hypergammaglobulinemia.Renal clearance studies of several proteins of differentmolecular weights, as well as immunochemical analysesof various urinary proteins suggested that these pa-tients probably had both glomerular and tubular dys-function. The determination of urinary LZM frequentlyshowed no significant correlation between the serum
level of the enzyme and the degree of lysozymuria, or
its clearance by the kidney. In addition to glomerularfiltration, it is possible that impaired tubular reabsorp-tion and perhaps other mechanisms might be responsiblefor the high level of LZM in the urine. An attempt has
1694 The Journal of Clinical Investigation Volume 49 1970

also been made to correlate the histological changesin kidneys with the degree of functional impairment.
METHODS18 patients with monocytic and myelomonocytic leukemiawere divided into two goups (A and B) on the basis oftheir renal function. Group A consisted of nine patientshaving normal renal function. In this group, blood ureanitrogen (BUN), serum creatinine, and creatinine clearancewere within the normal range. (Normal values were: BUN,5-25 mg/100 ml; serum creatinine, male 0.9-1.4 mg/100 ml,female 0.8-1.2 mg/100 ml; creatinine clearance, 70-130ml/min.) Group B consisted of nine patients having renalimpairment with azotemia. A group of 20 healthy subjectsand 250 patients with various diseases with or withoutrenal failure served as controls. Data pertaining to thispart of the study were reported elsewhere (17).
Samples of serum and urine were examined either im-mediately or stored at -20°C for varying periods of time.When necessary, samples of urine were concentrated asmuch as 500-fold, by dialysis in boiled seamless cellulosemembranes against 25% polyvinylpyrrolidone or by negativepressure dialysis. Total protein was estimated by the biuretmethod (18). Microzone cellulose acetate electrophoresiswas performed using 0.075 Mbarbital buffer, pH 8.6, and themembranes scanned in a Beckman's Analytrol. Immuno-electrophoresis was performed according to the techniqueof Grabar and Williams (19) with minor modifications.Antisera against whole human serum, IgG, IgA, IgM,transferrin, ceruloplasmin, and Fc and Fab fragments wereobtained from Hyland Laboratories, Los Angeles, Calif.Rabbit anti-IgD antiserum (R133A) was kindly providedby the NCI Immunoglobulin Reference Center, Springfield,Va., courtesy of Dr. J. Fahey. This antiserum readilydetected a level of 0.3 mg/ml of IgD. Anti-Bence Jones typekappa and lambda antisera and anti-human lysozyme anti-serum were prepared in our laboratory by immunizingrabbits with purified Bence Jones proteins from urines ofmyeloma patients or with human LZM. Purified LZM wasgenerously provided by Dr. E. F. Osserman, New York,and used in conjunction with our own material isolatedfrom the urine of a patient with monocytic leukemia usingthe technique of Alderton, Ward, and Fevold (20). Thepurity of the isolated LZM was verified by electro- andimmunoelectrophoresis and by analytical ultracentrifugation.Immunoquantitation of IgG, IgA, IgM, transferrin, cerulo-plasmin, and a2-macroglobulin was done using standardimmunoplates obtained from Hyland Laboratories, and thatof IgD using immunoplates of Kallestad Laboratories Inc.,Minneapolis, Minn. The minimal concentration of IgDdetectable by these plates was 0.02 mg/ml. Lysozyme quan-titation was performed by the lysoplate technique asdescribed by Osserman and Lawlor (7). Lysozyme activityin the samples tested was compared to that of pure humanlysozyme, microgram equivalent per milliliter of buffer.Prepared standards of pure human lysozyme containing 5,25, 100, 250, and 500 ug/ml were applied to each lysoplateand a semilog curve plotted. Analyses of urinary amino acidswere kindly performed by Dr. S. H. Jackson, Hospital forSick Children, Toronto, using one-dimensional thin-layerchromatography (21). Clearances of urinary proteins, cre-atinine, and uric acid were calculated on the basis of24-hr collections of urine using the formula (U, X U,) /(S. X 1440) = ml/min. The clearances of eight proteinswere determined; viz. lysozyme, mol wt 14,000-15,000 (7);
transferrin, mol wt 73,000-76,000 (22); ceruloplasmin, molwt 160,000; IgG, mol wt 160,000; IgA and IgD, mol wt160,000 or higher; a2-macroglobulin, mol wt 840,000; andIgM, mol wt 900,000. The selectivity of protein excretionwas examined by plotting the clearance values of IgG anda2-macroglobulin expressed as a percentage of transferrinclearance accepted as 100%, against the respective molecularweights on double-log paper. The slope of the plotted linewould be an expression of the selectivity and values ex-ceeding a slope of 670 were accepted as highly selective(23, 24). The estimation of BUN, uric acid, electrolytes,and creatinine was performed in the same sera and urines inwhich the proteins were determined. White blood cells wereusually counted on the same day that the serum and urineswere collected. In three patients, however, there was alapse of 24-48 hr between these determinations. Autopsyexamination was performed in six patients with specialattention directed to histological changes in the kidneys.The kidneys of seven additional patients with monocyticor myelomonocytic leukemia (not included in the presentstudy) were also examined.
RESULTS
There were no significant differences in age or sex be-tween groups A and B (Tables I and IV). The dura-tion of the disease in group A varied from 2 wk to 48months with a mean of 11 months. In group B, the dura-tion ranged from 3 wk to 24 months, on the average,5.1 months. Patients without renal failure (group A)often had fewer leukemic cells in the peripheral bloodthan patients with azotemia (group B). In nine patients,monoblasts were observed in addition to the abnormalmonocytes and these cells were included in the totalcount of monocytes.
Group A (Tables I and II)Serum. By definition, patients included in this group
had normal BUN, serum creatinine, and creatinineclearance. Blood urea nitrogen varied between 7 and23 mg/100 ml and serum creatinine ranged from 0.8 to1.4 mg/100 ml. Creatinine clearances varied from 71 to104 ml/min. The serum uric acid was normal in all butone patient in whom a value of 12 mg/100 ml was re-corded. The serum potassium was normal in all but twopatients (Nos. 4 and 5) in whom values of 3.0 and3.2 mEq/liter were recorded. In two patients (Nos. 5and 6) the serum calcium was 7.6 mg/100 ml while theserum phosphorus was normal. No other disorders ofelectrolytes were found. One of the patients with hypo-calcemia (No. 5) also had a low serum albumin of 2.9g/100 ml.
The total serum protein varied from 4.67 to 9.6 g/100ml (mean 6.84 +1.33 g/100 ml). In two patients, thelevel exceeded the normal range and in two others wasbelow normal (normal values, Table III). The gammaglobulin concentration ranged from 0.84 to 3.5 g/100 ml(mean 1.7 ±0.73) with hypergammaglobulinemia infour patients. None had hypogammaglobulinemia. Im-
Proteins and Renal Function in Monocytic Leukemias 1695
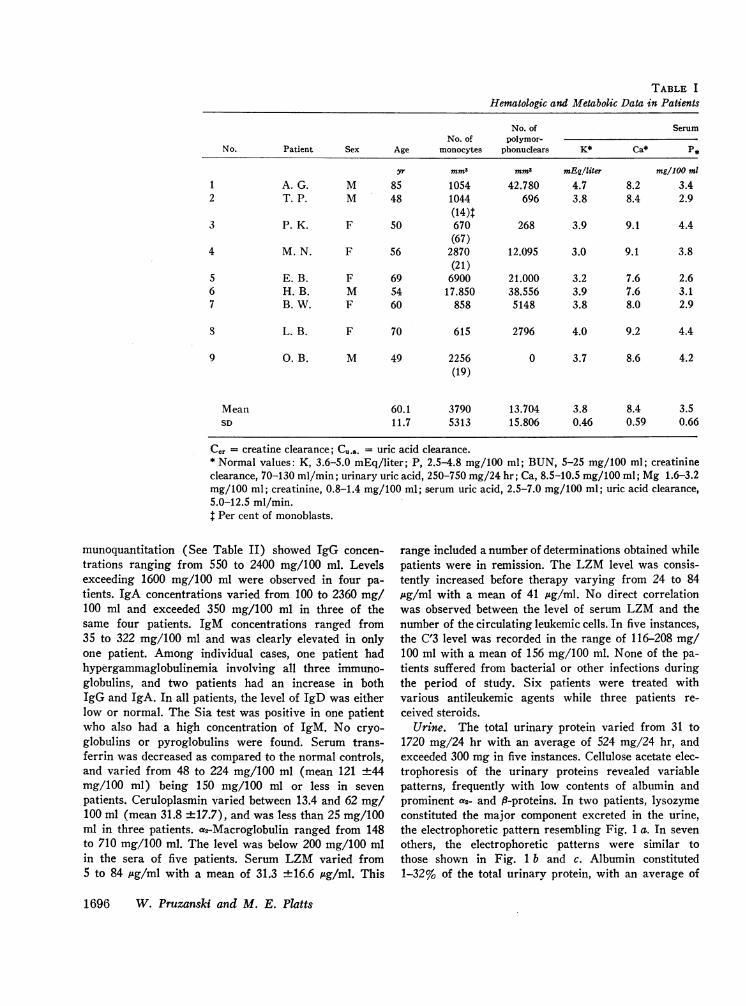
TABLE I
Hematologic and Metabolic Data in Patients
No. of SerumNo. of polymor-
No. Patient Sex Age monocytes phonuclears K* Ca* P*
yr mm3 mm3 mEqlliter mg/100 ml
1 A. G. M 85 1054 42.780 4.7 8.2 3.42 T. P. M 48 1044 696 3.8 8.4 2.9
(14)t3 P. K. F 50 670 268 3.9 9.1 4.4
(67)4 M. N. F 56 2870 12.095 3.0 9.1 3.8
(21)5 E. B. F 69 6900 21.000 3.2 7.6 2.66 H. B. M 54 17.850 38.556 3.9 7.6 3.17 B. W. F 60 858 5148 3.8 8.0 2.9
S L. B. F 70 615 2796 4.0 9.2 4.4
9 G. B. M 49 2256 0 3.7 8.6 4.2(19)
Mean 60.1 3790 13.704 3.8 8.4 3.5SD 11.7 5313 15.806 0.46 0.59 0.66
Cor = creatine clearance; Cu.a. = uric acid clearance.* Normal values: K, 3.6-5.0 mEq/liter; P, 2.5-4.8 mg/100 ml; BUN, 5-25 mg/100 ml; creatinineclearance, 70-130 ml/min; urinary uric acid, 250-750 mg/24 hr; Ca, 8.5-10.5 mg/100 ml; Mg 1.6-3.2mg/100 ml; creatinine, 0.8-1.4 mg/100 ml; serum uric acid, 2.5-7.0 mg/100 ml; uric acid clearance,5.0-12.5 ml/min.t Per cent of monoblasts.
munoquantitation (See Table II) showed IgG concen-trations ranging from 550 to 2400 mg/100 ml. Levelsexceeding 1600 mg/100 ml were observed in four pa-tients. IgA concentrations varied from 100 to 2360 mg/100 ml and exceeded 350 mg/100 ml in three of thesame four patients. IgM concentrations ranged from35 to 322 mg/100 ml and was clearly elevated in onlyone patient. Among individual cases, one patient hadhypergammaglobulinemia involving all three immuno-globulins, and two patients had an increase in bothIgG and IgA. In all patients, the level of IgD was eitherlow or normal. The Sia test was positive in one patientwho also had a high concentration of IgM. No cryo-globulins or pyroglobulins were found. Serum trans-ferrin was decreased as compared to the normal controls,and varied from 48 to 224 mg/100 ml (mean 121 ±44mg/100 ml) being 150 mg/100 ml or less in sevenpatients. Ceruloplasmin varied between 13.4 and 62 mg/100 ml (mean 31.8 ±17.7), and was less than 25 mg/100ml in three patients. a2-Macroglobulin ranged from 148to 710 mg/100 ml. The level was below 200 mg/100 mlin the sera of five patients. Serum LZM varied from5 to 84 Ag/ml with a mean of 31.3 ±16.6 /Ag/ml. This
range included a number of determinations obtained whilepatients were in remission. The LZM level was consis-tently increased before therapy varying from 24 to 84,.tg/ml with a mean of 41 ug/ml. No direct correlationwas observed between the level of serum LZM and thenumber of the circulating leukemic cells. In five instances,the C'3 level was recorded in the range of 116-208 mg/100 ml with a mean of 156 mg/100 ml. None of the pa-tients suffered from bacterial or other infections duringthe period of study. Six patients were treated withvarious antileukemic agents while three patients re-ceived steroids.
Urine. The total urinary protein varied from 31 to1720 mg/24 hr with an average of 524 mg/24 hr, andexceeded 300 mg in five instances. Cellulose acetate elec-trophoresis of the urinary proteins revealed variablepatterns, frequently with low contents of albumin andprominent a2- and f9-proteins. In two patients, lysozymeconstituted the major component excreted in the urine,the electrophoretic pattern resembling Fig. 1 a. In sevenothers, the electrophoretic patterns were similar tothose shown in Fig. 1 b and c. Albumin constituted1-32% of the total urinary protein, with an average of
1696 W. Pruzanski and M. E. Platts

with Normal Renal Function (Group A)
SerumUrine,
Mg* BUN* Creatinine* Uric acid* uric acid* Co. Cu.a. Treatment
mg/100 ml mg/24 hr mi/min ml/min
1.80 21 1.3 6.7 744 82 8.061.72 12 0.8 4.3 780 104 12.6 Vincristine
6MP1.75 11 1.1 5.8 544 75 6.57 Prednisone
6 MP1.75 7 0.7 6.4 396 78 4.29 Allopurinol
6 MP1.70 23 0.6 3.3 266 89 12.1 Prednisone1.90 11 1.0 5.6 798 92 9.91.70 9 0.8 3.4 596 71 12.16 Amethopterin
6MP1.74 16 1.4 3.4 328 73 6.69 Prednisone
6 MP, MTX1.73 17 1.0 12.0 1009 89 6.48 Vincristine
6MPAllopurinol
1.75 14 0.97 5.7 606 83.7 8.770.06 5.1 0.25 2.6 232 10.1 2.85
12.8 ±5.7%. The amount of IgG excreted ranged from6.8 to 364 mg/24 hr. Clearances of IgG varied greatlybut were approximately 7 times higher than in healthycontrols. Excretion of IgA varied from 1.1 to 111.0mg/24 hr. In one instance, the amount of IgA excretedexceeded that of IgG in the urine. In the remainder, theratios of IgG to IgA varied from 2: 1 to 30: 1. Clear-ances of IgA also showed great variations, and wereapproximately 4 times higher than in healthy individuals.IgD and IgM were detected in only one urine each.Fc and F'c fragments of IgG were detected in the urinesof five patients. This observation bore no relationshipto the storage time of the urine since these fragmentswere observed in three completely fresh urines. In oneinstance transitory excretion of Bence Jones type kappaprotein was noted.
Transferrin was excreted in amounts varying from 0 to33.6 mg/24 hr and comprised up to 37% of the totalurinary protein with a mean of 1.34 %. The averageclearance of transferrin was approximately twice ashigh as in healthy persons although a great variabilityin individual clearances was observed.
Ceruloplasmin varied from 0.78 to 8.65 mg/24 hr, andaccounted for 0.09-9.6% of the total urinary proteinwith a mean of 0.43%. The mean clearance was similarto that in normal controls.
a2-Macroglobulin was excreted in the urines of fourpatients in amounts varying from 0.87 to 13.54 mg/24hr. This protein was not found in the urines of ninehealthy persons. The C'3 level was tested in five urinesand detected in one only in the amount of 8.5 mg/24 hr.
Lysozyme excretion varied greatly from 0.9 mg to1320 mg/24 hr (mean 142.5). This range includedvalues obtained during remissions. Pretreatment valueswere always higher with an average excretion of 239mg/24 hr. (The maximum excretion of LZM in theurines of healthy persons never exceeded 2.9 mg/24 hr.)Lysozyme constituted from 1 to 47.2% of the totalurinary protein, with an average of 9.4%. Renal clear-ances of LZM varied greatly, being in the normal rangein 12 instances and increased in 18 others. A correlationcoefficient (r) of a linear function was calculated forthe serum and urinary LZM levels and also for theserum LZM and Clzm. In the first instance, the correla-
Proteins and Rendl Function in Monocytic Leukemias 1697
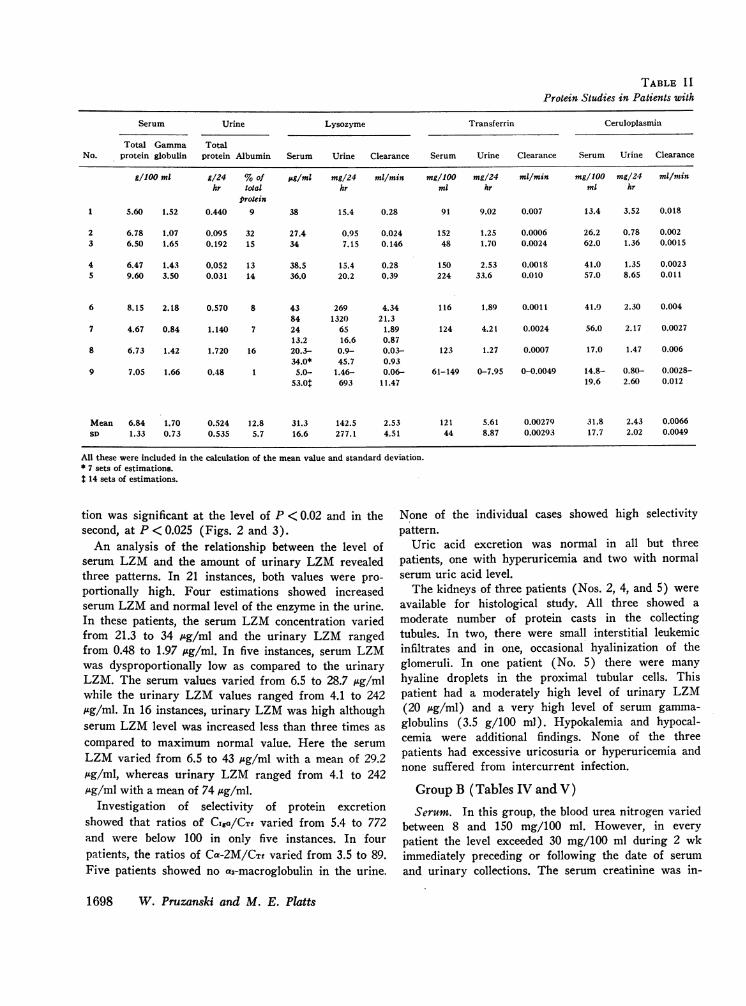
TABLE I IProtein Studies in Patients with
Serum Urine Lysozyme Transferrin Ceruloplasmin
Total Gamma TotalNo. protein globulin protein Albumin Serum Urine Clearance Serum Urine Clearance Serum Urine Clearance
g/1OO ml g/24 %of psg/ml mg/24 ml/min mg/lOG mg/24 ml/min mg/100 mg/24 mi/nZinhr total hr ml hr ml hr
protein1 5.60 1.52 0.440 9 38 15.4 0.28 91 9.02 0.007 13.4 3.52 0.018
2 6.78 1.07 0.095 32 27.4 0.95 0.024 152 1.25 0.0006 26.2 0.78 0.0023 6.50 1.65 0.192 15 34 7.15 0.146 48 1.70 0.0024 62.0 1.36 0.0015
4 6.47 1.43 0.052 13 38.5 15.4 0.28 150 2.53 0.0018 41.0 1.35 0.00235 9.60 3.50 0.031 14 36.0 20.2 0.39 224 33.6 0.010 57.0 8.65 0.011
6 8.15 2.18 0.570 8 43 269 4.34 116 1.89 0.0011 41.0 2.30 0.00484 1320 21.3
7 4.67 0.84 1.140 7 24 65 1.89 124 4.21 0.0024 56.0 2.17 0.002713.2 16.6 0.87
8 6.73 1.42 1.720 16 20.3- 0.9- 0.03- 123 1.27 0.0007 17.0 1.47 0.00634.0* 45.7 0.93
9 7.05 1.66 0.48 1 5.0- 1.46- 0.06- 61-149 0-7.95 0-0.0049 14.8- 0.80- 0.0028-53.0: 693 11.47 19.6 2.60 0.012
Mean 6.84 1.70 0.524 12.8 31.3 142.5 2.53 121 5.61 0.00279 31.8 2.43 0.0066SD 1.33 0.73 0.535 5.7 16.6 277.1 4.51 44 8.87 0.00293 17.7 2.02 0.0049
All these were included in the calculation of the mean value and standard deviation.* 7 sets of estimations.
14 sets of estimations.
tion was significant at the level of P < 0.02 and in thesecond, at P < 0.025 (Figs. 2 and 3).
An analysis of the relationship between the level ofserum LZM and the amount of urinary LZM revealedthree patterns. In 21 instances, both values were pro-portionally high. Four estimations showed increasedserum LZM and normal level of the enzyme in the urine.In these patients, the serum LZM concentration variedfrom 21.3 to 34 Log/ml and the urinary LZM rangedfrom 0.48 to 1.97 /eg/ml. In five instances, serum LZMwas dysproportionally low as compared to the urinaryLZM. The serum values varied from 6.5 to 28.7 ng/mlwhile the urinary LZM values ranged from 4.1 to 242.ug/ml. In 16 instances, urinary LZM was high althoughserum LZM level was increased less than three times ascompared to maximum normal value. Here the serumLZM varied from 6.5 to 43 /hg/ml with a mean of 29.2Ag/ml, whereas urinary LZM ranged from 4.1 to 242Ag/ml with a mean of 74 /Ag/ml.
Investigation of selectivity of protein excretionshowed that ratios of CISO/CTf varied from 5.4 to 772and were below 100 in only five instances. In fourpatients, the ratios of Ca-2M/CTf varied from 3.5 to 89.Five patients showed no a2-macroglobulin in the urine.
None of the individual cases showed high selectivitypattern.
Uric acid excretion was normal in all but threepatients, one with hyperuricemia and two with normalserum uric acid level.
The kidneys of three patients (Nos. 2, 4, and 5) wereavailable for histological study. All three showed amoderate number of protein casts in the collectingtubules. In two, there were small interstitial leukemicinfiltrates and in one, occasional hyalinization of theglomeruli. In one patient (No. 5) there were manyhyaline droplets in the proximal tubular cells. Thispatient had a moderately high level of urinary LZM(20 Ag/ml) and a very high level of serum gamma-globulins (3.5 g/100 ml). Hypokalemia and hypocal-cemia were additional findings. None of the threepatients had excessive uricosuria or hyperuricemia andnone suffered from intercurrent infection.
Group B (Tables IV and V)
Serum. In this group, the blood urea nitrogen variedbetween 8 and 150 mg/100 ml. However, in everypatient the level exceeded 30 mg/100 ml during 2 wkimmediately preceding or following the date of serumand urinary collections. The serum creatinine was in-
1698 W. Pruzanski and M. E. Platts

Normal Renal Function (Group A)
IgG IgA IgD IgM at-Macroglobulin Comments
Clear- Clear- Clear- Clear- Clear-Serum Urine ance Serum Urine ance Serum Urine ance Serum Urine ance Serum Urine ance
mg/ mg/ ml/ mg/ mg/ ml/ mg/ mg/ ml/ mg/ mg/ ml/ mg/ mg/ ml/100 ml 24 hr min 100 ml 24 hr min 100 ml 24 hr min 100 ml 24 hr min 100 ml 24 hr min
2150 121 0.0039 420 18.7 0.0031 2 < 0 - so 0 0 151 13.54 0.0062 Fc and F'c fragmentsin the urine
1380 7.2 0.00036 186 3.60 0.0013 9.2 0 - 110 0 0 260 0 0 -1260 20.4 0.0011 175 6.80 0.0027 5.1 0 - 100 0 0 355 4.42 0.00086 FcandF'cfragments
in the urine1430 24.8 0.0012 340 3.85 0.00079 2 < 0 - 60 0 0 197 0 0 -2400 20.2 0.00054 2360 26.26 0.00070 6.5 0 - 322 0 0 175 0.87 0.00035 Sia test +; Fc and
F'c fragments inthe urine
1730 212 0.0085 430 7.33 0.0012 2< 0 - 53 0 0 148 0 0 FcandFcfragmentsin the urine
550 34.2 0.0052 100 2.51 0.0020 2 < 5.2 - 35 5.7 0.013 710 3.99 0.00039 -
960 6.8 0.00078 125 1.13 0.0010 2 < 0 - 140 0 0 160 0 0 Fc and F'c fragmentsin the urine
1730 364 0.0099 260 111.0 0.0020 2 < 0 - 137 0 0 265 0 0 Transitory excretionof Bence Jonestype kappa globu-lin in the urine
1510 90.1 0.0035 488 20.13 0.0016 - - - 112 - - 269 - -538 116.3 0.00.34 671 33.08 0.0008 - - - 83 - - 169 - -
creased in three patients and creatinine clearances were ml in three patients. Serum potassium was repeatedlylower than normal in seven. The serum uric acid varied low in three patients (Nos. 1, 4, and 7) varying be-from 3.0 and 17.9 mg/100 ml and exceeded 7.5 mg/100 tween 2.2 and 3.4 mEq/liter. In two of these, the
TABLE II IProtein Studies in Healtky Individuals
Serum Urine ClearanceNo. of
Protein cases Range Mean SD Range Mean SD Range Mean SD
mg/100 ml mg/24 hr mi/min
Lysozyme* 20 6.6-13.8 9.69 1.80 7.6-2900 1570 800 0.005-0.33 0.116 0.071Transferrin 9 160-276 219 37 2.07-7.31 3.61 1.88 0.00072- 0.0012 0.0006
0.0023Ceruloplasmin 9 23.5-41.0 30.2 5.1 0.69-4.33 2.68 1.26 0.0013- 0.0064 0.0034
0.012IgG 10 980-1530 1278 227 12.6-112 53.62 40.7 0.00019- 0.00046 0.00014
0.00061IgA 10 204-322 259 45 0-3.36 2.3 1.25 0-0.0011 0.00045 0.00037a2-Macroglobulin 9 372t - 0§ 0 0 0 0 0
9 355IgM 10 63-165 93 38 0 0 0 0 0 0
Serum total protein, normal range 6.3-8.0 g/100 ml; serum gammaglobulin, normal range 0.7-1.6 g/100 ml; urinary total pro-tein, normal range 50-187 mg/24 hr; IgD,'normal range 0.3-40 mg/100 ml (57).* Serum level in ug/ml, daily excretion in jug/24 hr.t Pooled serum samples of nine womenand nine men.§ Nine individual estimations.
Proteins and Renal Function in Monocytic Leukemias 1699

Immunoquantitation of IgG (see Table V) showedvalues from 930 to 3200 mg/100 ml, the level exceeding1600 mg/100 ml in eight patients. IgA levels variedfrom 106 to 1870 mg/100 ml and exceeded 350 mg/100ml in seven patients. IgD was normal or low. IgMranged from 36 to 685 mg/100 ml and exceeded 200mg/100 ml in seven patients. Seven patients showed anincrease in all three immunoglobulins, and one an in-crease in IgG and IgA only. The Sia test was positivein four patients who also had high levels of macro-globulin. One patient had cryoglobulin in the serum andBence Jones proteinuria.
Transferrin levels varied from 89 to 289 mg/100 mlwith values below 150 mg/100 ml in four patients.Three patients suffered from bacterial infection duringthe study (Nos. 1, 7, and 9), requiring treatment withantibiotics. The gammaglobulins were reduced in one ofthese and increased in two. Transferrin was 173, 176,and 263 mg/100 ml, respectively.
Ceruloplasmin ranged from 22.4 to 100 mg/100 mland was less than 25 mg/100 ml in one serum only.ac2-Macroglobulin varied from 130 to 370 mg/100 ml. Infour patients, the level was low (200 mg/100 ml orless). Serum LZM varied from 28.2 to 150 Ag/ml witha mean of 85 ±36.8 isg/ml. C'3 was estimated in threecases and varied from 100 to 254 mg/100 ml.
Urine. The total protein excreted in the urineranged from 0.83 to 6.64 g/24 hr (mean 3.1 ±2.04 g).
FIGURE 1 Representative electrophoretic patterns of con-
centrated urine of patients with mono- and myelomonocyticleukemia. (a) Lysozyme is the major protein excreted. Pa-tient 8, group B: BUN, 48 mg/100 ml; K, 2.9 mEq/liter;proteinuria 1.26 g/24 hr; lysozymuria 1.19 g/24 hr. (b)Predominant excretion of a- and f,-proteins. Patient 6,group B: BUN, 150 mg/100 ml; K, 3.4 mEq/liter; pro-teinuria 6.24 g/24 hr; lysozymuria 18 mg/24 hr. (c) Albu-min and globulins, and lysozyme excreted in large quan-tities. Patient 4, group B: BUN, 77 mg/100 ml; K, 3.3mEq/liter; proteinuria 3.26 g/24 hr; lysozymuria 298mg/24 hr.
calcium was also low (7.4 and 7.7 mg/100 ml) with a
low serum phosphorus and magnesium in one patient.The latter patient had hypoalbuminemia of 2.8 g/100ml and suffered from chronic pyelonephritis in additionto leukemia. In two other patients (Nos. 6 and 8) a
single estimation also showed hypokalemia.The total serum protein varied from 5.6 to 8.5 g/100
ml (mean 7.14 ±0.84/100 ml). It was in excess ofnormal in one patient, and below the normal range intwo. Gammaglobulin ranged from 0.90 to 3.67 g/100 ml(mean 2.26 ±0.84 g/100 ml). The level exceeded theupper normal limit in seven patients. None were sub-normal.
I-,
100 -
80
60-
40
20
10 -
5
0
0
. II
0
40 80 400 600
U- LZM ug/mi
FIGURE 2 Group A. Relationship between serum lysozyme(S-LZM) and urinary lysozyme (U-LZM), 30 estimations.r= 0.4597. Correlation significant at the level P <0.02.Shaded area indicates normal range.
1700 W. Pruzanski and M. E. Platts
a
c

80
E_ 60
40-.**@.
204 0.
0
2 4 6 8 10 12 22
LZM Clearance ml/minFIGURE 3 Group A. Relationship between serum lysozyme (S-LZM)and its clearance by the kidneys, 30 estimations. r2 = 0.42230. Correla-tion significant at the level P < 0.025. Shaded area indicates normalrange.
Cellulose acetate electrophoresis of the urinary proteinsrevealed lysozyme as the predominant constituent inthree patients with a pattern resembling Fig. 1 a. In theremainder, the patterns were similar to those in Fig.1 b and c. Albumin, expressed as a percentage of thetotal protein excreted in the urine, ranged from 3 to33% (mean 18 ±9.9%) being less than 25% in sevenpatients. IgG ranged from 6.8 to 445 mg/24 hr and IgAfrom 3.75 to 228 mg/24 hr. A great variability wasnoted in the renal clearances of both IgG and IgA. IgDwas found in five instances ranging from 2.5 to 146 mgin 24 hr. IgM was found in urines of five patients,varying from 0.9 to 257 mg/24 hr. Fc and F'c fragmentsof IgG were found in urines of seven patients. TheBence Jones heat test was positive in the urine of onepatient.
Transferrin levels ranged from 5.25 to 52.5 mg/24 hr,and accounted for 0.08 to 4.4% of the total protein(mean 0.6%). Ceruloplasmin ranged from 0.59 to 50.4mg/24 hr with a great variability in the renal clear-ances and urinary concentrations. Ceruloplasmin ac-counted for 0.015-0.62% of the urinary protein (mean0.16%). a2-Macroglobulin was found in urines of eightpatients varying from 3.15 to 38.84 mg/24 hr (mean15.06 mg/24 hr). C'3 was determined in three urinesand varied from 0.176 to 0.648 mg/100 ml with a totalexcretion of 0.29 to 9.7 mg/24 hr.
Urinary LZM values ranged from 14 to 1480 ,Fg/ml.The total amount in individual urines was high, reach-ing values up to 2 g/24 hr. Lysozyme constituted from0.3 to 94% of the total protein excreted (mean 23%). Inall but one instance these were high levels of serum andurinary LZM. One patient had a relatively low serum
LZM (28.2 Ag/ml) and high urinary LZM (14.0 lg/ml). Since the number of circulating monocytes and thelevels of serum LZM were greater in patients of groupB, a correlation of the levels of serum LZM to urinaryLZM was determined to check whether the number ofcirculating monocytes was the only factor responsiblefor the increased excretion of LZM. The correlationcoefficient (r) of a linear function for serum level ofLZM and urinary LZM was significant at P < 0.05 andfor serum LZM and CLZM there was no statisticallysignificant relationship (see Figs. 4 and 5). The calcu-lation of CIga/CTf and Caa-M/CTf ratios showed varia-tions from 8.4 to 2136 for the former and from 0 to 1905for the latter. In one instance only was the so-calledhigh selectivity pattern observed.
Uric acid excretion was normal in all but two patients,both with hyperuricemia.
The kidneys of three patients were examined histo-logically (Nos. 6, 7, and 8). In two patients (Nos. 6 and8) there were protein casts in the tubules and smallinterstitial leukemic infiltrates. In patient 6, red bloodcells were also present in the tubules and some glomerulishowed epithelial crescents. In this instance, LZMexcretion was only moderate, but proteinuria wasprominent and there was hypergammaglobulinemia. Inpatient 8, lysozymuria was prominent and there wasmoderate proteinuria. Both had hypokalemia. No uricacid abnormalities were observed in either. In onepatient (No. 7) there was severe tubular degenerationwith hyaline droplets in the proximal tubular cells.Many casts were found in the tubules. There were alsosome inflammatory changes compatible with chronicpyelonephritis. This patient had markedly elevated serum
Proteins and Renal Function in Monocytic Leukemias 1701

TABLE IVHematologic and Metabolic Data in Patients
No. of SerumNo. of polymorpho-
No. Patient Sex Age monocytes nuclears K Ca P
yr mm3 mm mEq/liter mg/100 ml
1* L. L. F 53 96,480 21,960 2.2 7.7 4.5(44)t
2 T. N. M 76 570 1,920 6.5 8.8 4.1
3 A. L. M 41 6,400 8,800 4.0 9.5 3.6(20)
4 H. R. M 72 72,880 38,440 3.3 8.6 3.9
5 A. G. M 85 610 3,100 4.4 8.7 3.46 L. G. F 69 4,700 8,580 3.4 8.1 2.5
711 G. M. F 80 5,880 1,680 2.2 7.4 1.1(2)
8 D. T. M 58 3,740 2,450 2.9 8.9 4.0(7)
9* T. T. M 68 17,780 4,680 3.7 8.6 3.7(3)
Mean 66.9 23,227 10,179 3.6 8.6 3.4SD 13.1 33,653 12,361 1.2 0.6 0.97
* Patients 1 and 9 had bronchopneumonia.t Per cent of monoblasts.§ In a few days BUNincreased to 32 mg/100 ml.1I Patient 7 had chronic pyelonephritis.
ganmmaglobulins, pronounced lysozymuria, persistenthypokalemia, low serum calcium, phosphorus, and mag-nesium. No hyperuricemia was recorded.
In addition to the kidneys of six patients from thepresent series, renal tissue was also available from sevenother patients with mono- or myelomonocytic leukemia.All seven had azotemia with hyperuricemia in three.Proteinuria was recorded in three patients. Significanthistological findings included protein casts in thetubules and focal leukemic infiltrates of variable degreein six cases. Two patients also showed severe hyalinedroplet degeneration of the proximal tubular cells. Theserum LZM was high in both patients (42 and 113Mg/ml). The kidneys of one patient with hyperuri-cemia of 14.2 mg/100 ml contained crystals in the col-lecting tubules. Occasional hyalinization of the glomeruliwas observed in three instances and thickening of thebasement.membranes in one patient.
DISCUSSION
Hypogammaglobulinemia is recognized as an importantfeature in leukemia, especially in acute and chroniclymphocytic types (1, 3, 25-27). In contrast, studies in
patients with mono- and myelomonocytic leukemia haverevealed significant hypergammaglobulinemia, affectingparticularly IgG and IgA (5, 7, 15).
In our series, serum IgG and IgA were increased in12 patients and IgM was increased in 8 patients. Ingeneral, the increase was greater in patients with renalfailure. There was no increase in IgD. Only 2 of 18patients had acute intercurrent infection, while one hadchronic pyelonephritis. Hypergammaglobulinemia wasevident in two of the three patients while one had hypo-gammaglobulinemia. The remaining 15 patients -showedno evidence of increased susceptibility to infections. Itwould appear, therefore, that the increased levels ofgammaglobulins were not attributable to chronic infec-tion. Thus far, no suitable explanation for the hyper-gammaglobulinemia has been forthcoming. The observa-tion that some patients may have homogeneous M-com-ponents in the serum (5-7, 28, 29) while a few mayexcrete Bence Jones globulin in the urine may be sig-nificant, giving rise to speculations concerning thepossible relationship of monocytic to plasmacytic dys-crasia (5, 29). In this regard, it should be noted thatthere was no correlation between the number of circu-
1702 W. Pruzanski and M. E. Platts

with Impaired Renal Function (Group B)
SerumUrine,
Mg BUN Creatinine Uric acid uric acid Car Cu.&. Treatment
mg/100 ml mg/24 hr ml/min ml/min2.25 8§ 2.1 17.9 803 33 3.24 Vincristine
6 MP1.42 39 2.2 7.1 530 51 5.25 Chlorambucil
Allopurinol1.50 35 1.0 4.0 360 41 6.25 Vincristine
6 MP1.30 77 1.4 3.0 483 39 10.82 Vincristine
6 MP1.42 36 2.0 7.8 333 31 2.961.86 150 0.7 6.2 520 82 5.82 Prednisone,
6 MPAllopurinol
0.86 28 1.2 5.4 584 42 7.50 Myleran
1.88 48 1.4 7.1 705 77 7.21 Vincristine6MP
1.87 27 1.3 7.9 995 65 8.74 Prednisone6MP
1.60 49.8 1.48 7.38 590 51.2 6.420.41 39.5 0.49 4.04 200 17.9 2.36
lating monocytes and the level of immunoglobulins inour patients, and no plasmacytosis of the bone marrow.
No reports are available concerning the serum levelsof transferrin, ceruloplasmin, a2-macroglobulin, or otherproteins in monocytic leukemia. The present study re-vealed low serum transferrin in 11 patients, in theabsence of evidence of hemolysis. Ceruloplasmin waseither normal or mildly elevated. a2-Macroglobulin wasdecreased in nine patients. No correlation was foundbetween the low level of transferrin and the lowa2-macroglobulin, the former being more frequent inpatients with normal renal function and the latter inpatients with azotemia.
Finch, Gnabasic, and Rogoway (30) and Jolles, Stern-berg, and Mathe (13) were the first to report anincreased serum level of lysozyme (muramidase) inmonoblastic and myelomonocytic leukemia. Correlationshave been shown between the level of lysozyme and thenumber of circulating monocytes and granulocytes (7,31-33). The marked variability observed in this corre-lation has been attributed to differences in the rate ofproduction, tissue binding, or renal handling of theenzyme (7). However, it is also possible that the total
body pool of lysozyme-producing cells and the rate ofdestruction of the enzyme may play a role. In our series,the serum lysozyme was elevated in all patients duringthe active phase of the disease, being higher in thepresence of azotemia. Renal failure (34, 35) would offeran explanation for the more significant elevation ofserum LZM in group B, if it were not for the fact thatseveral of these patients also had much more pro-nounced peripheral monocytosis than those without azo-temia. Therefore, the possibility remains that enhancedproduction of lysozyme may account for some of thisdifference.
Osserman and Lawlor and others have noted hypo-kalemia and hyperkaluria in a number of patients withmono- and myelomonocytic leukemia (7, 14, 15, 36). Ex-cessive excretion rates of potassium, reduced excretionof titratable acid, and glycosuria were also noted in somepatients (15). In our series, seven patients had hypo-kalemia, three of whom also had a low serum calcium.Two of the latter also had a low magnesium and onehad hypophosphatemia. In several of these patients,attempts were made to correct the low level of serumpotassium by administration of 40-80 mEq of potas-
Proteins and Renal Function in Monocytic Leukemias 1703

TABLE VProtein Studies in Patients with
Serum Urine Lysozyme Transferrin Ceruloplasmin IgG
GammaTotal globu- Total Albu- Clear- Clear- Clear- Clear-
No. protein lin protein min Serum Urine ance Serum Urine ance Serum Urine ance Serum Urine ance
g/100 ml g/24 h %of jug/ml mg/24 hr ml/min mg/ mg/ ml/min mg/ mg/ ml/min mg/ mg/24 hr ml/mintotal 100 ml 24 hr 100 ml 24 hr 100 ml
protein1 7.10 2.23 2.21 22 114 595 3.62 263 24.8 0.0066 100 2.21 0.0015 2440 293 0.0056
2 7.75 2.26 0.83 30 64 187 2.03 213 13.5 0.0044 72 2.60 0.0025 3200 40 0.000873 7.70 2.11 1.20 14 58 533 6.38 289 52.5 0.013 82.5 1.43 0.0012 1660 132 0.0055
4 8.50 3.41 3.26 2 1 150 298 1.38 147 11.97 0.0057 26.5 2.58 0.0067 3000 6.83 0.00048
5 6.54 1.91 2.15 33 52 75.5 1.01 96 22.7 0.016 33 0.59 0.0012 1910 27.1 0.00098
6 6.25 2.52 6.24 7 28.2 18.2 0.45 89 10.73 0.008 35.5 1.76 0.0034 2810 69.6 0.0017
7 7.63 3.67 6.64 23 90 1488 11.48 176 5.52 0.0022 22.4 0.96 0.003 3010 445 0.047
8 7.18 1.31 1.26 8 58 1185 14.19 173 5.25 0.0021 53 5.64 0.0074 1860 70.1 0.0026
9 5.60 0.90 4.13 3 125 1940 10.77 173 25.1 0.010 67 25.70 0.027 930 15.44 0.0011111* 1914 11.97 133 17.4 0.009 75 50.40 0.047
Mean 7.14 2.26 3.10 18 85 823.4 6.33 175 18.95 0.0077 56.7 9.39 0.011 2313 122 0.0073SD 0.84 0.84 2.04 9.9 36.8 709.5 5.03 62 13.16 0.0043 25.2 15.41 0.010 724 141 0.014
* Second set of estimations done 1 wk after the first.
sium daily without success. Two patients with hypo-kalemia showed droplet degeneration in the proximaltubular cells and one also had chronic pyelonephritis.There was no correlation between the electrolyte abnor-
160 -
E
T,X11.4-a
JII
120
80 p
40
0200 600 1000 1400
U- LZM uLg/ml
FIGURE 4 Group B. Relationship between serum lysozyme(S-LZM) and urinary lysozyme (U-LZM), 10 estimations.r2= 0.1665. Correlation significant at the level P < 0.05.
malities and the level of serum or urinary LZM. In-creased serum uric acid levels and hyperuricosuria werenoted in one patient of group A and in three of group B.Hyperuricosuria without hyperuricemia was observed intwo others. No correlation was found between urico-suria, the level of electrolytes, proteinuria, or lysozymeexcretion.
There are no detailed studies on proteinuria in leu-kemia, although patients with lymphatic leukemia havebeen found to excrete more protein in the urine thannormal persons, particularly in regard to gammaglobu-lins (9). In a series of mono- and myelomonocytic leu-kemia, proteinuria varying from 1.4 to 6.6 g/24 hr hasbeen recorded, of which lysozyme has constituted up to40%. Other components have included albumin andsome alpha, beta, and gammaglobulins (7). While ourown control group of healthy subjects aged 21-62 yrshowed proteinuria varying from 59 to 187 mg/24 hrwith a mean of 103 mg, in most of our patients thetotal urinary protein consistently exceeded 300 mg/24hr, being higher in patients with impaired renal func-tion. Albumin generally constituted less than 25% of thetotal protein. Variable amounts of alpha, beta, andgamma globulins were found in all urines, with lyso-
1704 W. Pruzanski and M. E. Plats
.
.
:} .
Impaired Renal Function (Group B)
IgA IgD IgM a2-Macroglobulin Comments
Clear- Clear- Clear- Clear-Serum Urine ance Serum Urine ance Serum Urine ance Serum Urine ance
mg/ mg/24 hr ml/min mg/ mg/24 hr ml/min mg/ mg/24 hr ml/min mg/ mg/24 hr ml/min100 ml 100 ml 100 ml 100 ml
570 24.6 0.003 16.0 17.6 0.00076 202 0 0 200 3.22 0.0011 Fc and F'c fragmentsin the urine
1870 11.0 0.00041 6.5 0 - 275 0 0 263 0 0 Siatest (+490 15.1 0.0021 10.2 2.5 0.00017 291 0 0 260 20.71 0.0055 Fc and F'c-fragments
in the urine400 14.0 0.0024 2< 3.2 - 510 0.9 0.00037 147 10.57 0.0050 Sia test (+) ;Fcand
F'c fragments inthe urine
370 39.96 0.0075 2 < 0 - 216 17.5 0.0056 370 37.89 0.0071 Fc and F'c fragmentsin the urine
338 10.4 0.0021 6.5 0 - 685 1.17 0.00012 234 6.76 0.0020 Siatest (+) ;FcandF'c fragments inthe urine
1250 228 0.013 6.5 0 - 258 0 0 197 3.15 0.0011 Cryoglobulinemia.Sia test ( +); Fc.and F'c fragmentsin the urine, BenceJones heat test (+)
393 3.75 0.00066 2< 37.8 - 78 31.8 0.028 250 14.40 0.040 Fc and F'c fragmentsin the urine
106 103 0.067 2 < 146.2 - 36 257.4 0.50 130 38.84 0.0210
643 30.43 0.011 - - - 283 - - 228 15.06 0.0092525 30.10 0.020 - - - 191 - - 71 12.82 0.012
zyme as the predominant constituent in five instances.In one urine, a significant amount of prealbumin andin another a band of postgamma protein, with slightlyslower electrophoretic mobility than lysozyme, werealso observed. In several patients, the electrophoreticpatterns resembled those reported in tubular disorders,such as cadmium poisoning, adult Fanconi syndrome, andothers in which excretion of low molecular weight pro-teins of alpha, beta, and even gamma mobility haveexceeded that of albumin. Lysozymuria has frequentlybeen observed in this type of proteinuria (3743).
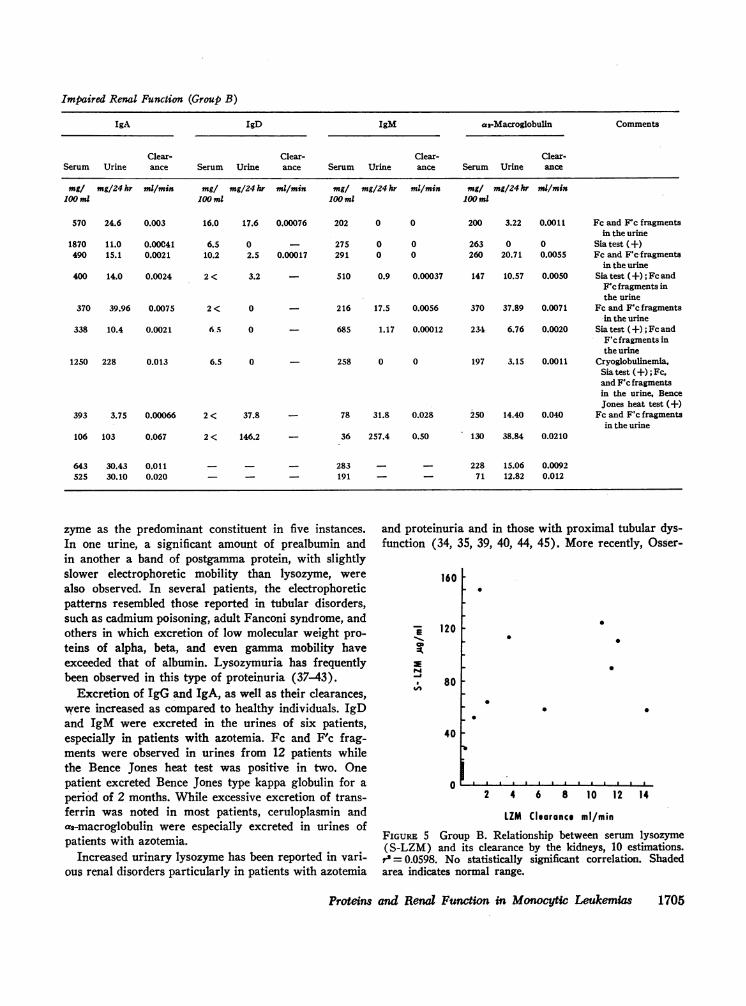
Excretion of IgG and IgA, as well as their clearances,were increased as compared to healthy individuals. IgDand IgM were excreted in the urines of six patients,especially in patients with azotemia. Fc and F'c frag-ments were observed in urines from 12 patients whilethe Bence Jones heat test was positive in two. Onepatient excreted Bence Jones type kappa globulin for aperiod of 2 months. While excessive excretion of trans-ferrin was noted in most patients, ceruloplasmin anda2-macroglobulin were especially excreted in urines ofpatients with azotemia.
Increased urinary lysozyme has been reported in vari-ous renal disorders particularly in patients with azotemia
and proteinuria and in those with proximal tubular dys-function (34, 35, 39, 40, 44, 45). More recently, Osser-
160 F
-E 120
80
.
:I
.0 0
0
40 -
0
b
2 4 6 8 10 12 14
LZM Clearance ml/min
FIGURE 5 Group B. Relationship between serum lysozyme(S-LZM) and its clearance by the kidneys, 10 estimations.
r' = 0.0598. No statistically significant correlation. Shadedarea indicates normal range.
Proteins and Renal Function in Monocytic Leukemias 1705

man and Lawlor and other authors have observed in-creased lysozymuria in patients with monocytic andmonomyelocytic leukemia (7, 31, 46). In our series, theexcretion of lysozyme was increased approximately90-fold in group A and 520-fold in group B. In patientswith azotemia, no correlation was found between theserum level of lysozyme and its renal clearance. It hasbeen reported that the clearance of LZM is not so greatas might be anticipated from its molecular weight (44,47). Since LZM is probably partly bound to the serumproteins (47), its actual glomerular filtration may belower than that which might be expected for a substanceof similar molecular weight and of comparable serumconcentration. It is also possible that the tubular reab-sorption of LZM, which normally exceeds 99% of theglomerular-filtered enzyme (48), is impaired by thetoxic effect of LZM itself. In our patients, in the ma-jority of instances, the serum and urinary lysozymelevels were proportionately high. However, on four oc-casions, the level of urinary lysozyme was normal de-spite an elevated lysozyme in the serum. In these patients,although lysozyme may have been filtered excessivelythrough the glomeruli, apparently it was efficiently reab-sorbed by the tubular cells. In five other instances, ahigh concentration of urinary lysozyme was noted in thepresence of a normal or only slightly elevated serumlevel of the enzyme and normal renal function. Sincelysozyme is continuously elaborated by the leukemic cellsand glomerular filtration was normal in these instances,one might postulate impaired reabsorption and(or) ac-tive tubular secretion of the enzyme or its leakage fromthe damaged tubular cells.
From the above data, it is evident that the patientswith mono- and myelomonocytic leukemia almost in-variably develop prominent proteinuria and that azo-temia develops in approximately 50% of cases. Among12 additional patients with this disease recently stud-ied and not included in the present series, nine had pro-teinuria and six had azotemia. In contrast to this, acomparative study of 37 patients with other types of leu-kemia revealed proteinuria only occasionally and azo-temia very rarely. When present, both were usually re-lated to other complicating renal diseases such as pyelo-nephritis (49). Any explanation for the renal damageobserved therefore must take into account at least twomajor differences between monocytic leukemia and othertypes of leukemia, namely the prominent hypergamma-globulinemia and the increase in lysozyme productionwith subsequent lysozymuria.
It has been reported that hypergammaglobulinemiamay contribute to the development of renal tubular acido-sis (50). Hypergammaglobulinemia and also M-com-ponents have been observed in patients with adult Fan-coni syndrome (43, 51). None of our patients had tu-
bular acidosis, aminoaciduria, or glycosuria but allthese abnormalities have been reported in a few casesof monocytic leukemia (15). The fact that immuno-globulin levels were frequently much higher in the pa-tients comprising our group B than in those with normalrenal function, may be of some importance. Nevertheless,in the absence of renal tubular acidosis, one would ques-tion the role of hypergammaglobulinemia as the mostimportant factor in the production of renal tubularinjury.
Recent evidence suggests that high concentrations oflysozyme may damage the proximal tubular cells. Nor-mally, lysozyme is reabsorbed in the proximal con-voluted tubule and its concentrations in the cortex maybe 10-25 times greater than in the medulla (52). Ex-ogenous lysozyme injected into animals concentrates inthe proximal tubular cells in the form of droplets whichmay be detected by light microscopy (53) or by im-munofluorescent techniques (54). Renal injury in ratstreated with tubular poisons results in greater urinarylysozyme excretion than in those treated with antiglo-merular antiserum (34). Osserman has suggested thathumans and rats with monocytic leukemia, as well asrats injected with exogenous lysozyme, develop "lyso-zyme nephropathy" (55). It has been shown that theincreased concentration of the enzyme in the kidneymay be associated with cytoplasmic droplet degenera-tion of the proximal tubular cells and distortion of themitochondria and nuclei (16, 36). Similarly, in autopsymaterial available to us, droplets of homogenous eosino-philic substances have been found in the proximal tu-bular cells in 4 of 12 cases studied. The higher levelsof serum lysozyme in patients comprising our groupB may therefore be of considerable significance incontributing to renal tubular injury. It is possible thatthe low glomerular filtration rate in these patients maylead to the retention of LZM in the serum and subse-quently to the higher concentration of the enzyme inthe glomerular filtrate. This leads to the inability ofthe proximal tubular cells to reabsorb all the enzymefiltered. Spillover of LZM into the urine and possibledamage to the tubular cells by LZM itself may conse-quently appear. It seems improbable that occasionalintercurrent infections or hyperuricemia, which areusually treated promptly, contribute to the renal damage.
The analyses of the proteins excreted in the urinewould appear to suggest the tubular as well as glomeru-lar dysfunction. In many instances, the electrophoreticpatterns of the urinary proteins including a low albuminand an excessive excretion of a-, P-, and ev-globulins,resembled those seen in various tubular disorders. Onthe other hand, the presence of high molecular weightproteins in the urine suggests that glomerular damagealso occurred. The pathogenesis of azotemia and renal
1706 W. Pruzanski and M. E. Platts

failure which were found in 50% of the patients withmono- and myelomonocytic leukemia has not yet beenelucidated. Recent observations on the glomerular dam-age in myeloma (56) or on azotemia found in patientswith adult Fanconi syndrome (43), may imply that, inconditions involving mainly tubular cells, glomerulardamage may also occur.
From the comparative study of various leukemias, thisparticular glomerular-tubular dysfunction appears to bea manifestation unique to mono- and myelomonocyticleukemia.
ACKNOWLEDGMENTSOur thanks to Dr. M. A. Ogryzlo, Dr. D. E. Bergsagel,and Dr. A. Bruce-Robertson for their contribution in thepreparation of the paper; to Mrs. S. Saito for the technicalhelp; and to Miss M. E. A. Bliss for the photographs.
This work was supported by a grant-in-aid from theOntario Cancer Treatment and Research Foundation (220).
REFERENCES1. Fahey, J. L. 1965. Antibodies and immunoglobulins. II.
Normal development and changes in disease. J. Amer.Med. Ass. 194: 255.
2. Sinn, C. M., and F. W. Dick. 1956. Monocytic leukemia.Amer. J. Med. 20: 588.
3. Bergsagel, D. E. 1967. The chronic leukemias: a reviewof disease manifestations and the aims of therapy. Can.Med. Ass. J. 96: 1615.
4. Ryder, R. J. W. 1966. Chronic monocytic leukemia.Blut. 14: 47.
5. Osserman, E. F. 1967. The Association between plasma-cytic and monocytic dyscrasias in man: clinical and bio-chemical studies. In Gamma Globulins. Structure andControl of Biosynthesis. Nobel Symposium 3, J. Killan-der, editor. Almqvist & Wiksells, Publishers, Stockholm.
6. Brown, R. K., J. T. Read, B. K. Wiseman, and W. G.France. 1948. The electrophoretic analysis of serumproteins of the blood dyscrasias. J. Lab. Clin. Med. 33:1523.
7. Osserman, E. F., and D. P. Lawlor. 1966. Serum andurinary lysozyme (muramidase) in monocytic and mono-myelocytic leukemia. J. Exp. Med. 124: 921.
8. Perillie, P. E., S. S. Kaplan, E. Lefkowitz, and S. C.Finch. 1966. Muramidase (lysozyme) activity in leu-kemia. Blood. 28: 1000.
9. Nettleship, A., J. A. Strother, and H. S. Smith. 1963.Relationship of serum and urinary proteins in neoplasticstates: a preliminary survey. Clin. Chem. 9: 608.
10. Rieselbach, R. E., C. J. Bentzel, E. Cotlove, E. Frei III,and E. J. Freireich. 1964. Uric acid excretion and renalfunction in the acute hyperuricemia of leukemia. Patho-genesis and therapy of uric acid nephropathy. Amer. J.Med. 37: 872.
11. Vogler, W. R., J. A. Bain, C. M. Huguley, Jr., H. G.Palmer, Jr., and M. D. Lowrey. 1966. Metabolic andtherapeutic effects of allopurinol in patients with leu-kemia and gout. Amer. J. Med. 40: 548.
12. Norris, H. J., and J. Wiener. 1961. The renal lesions inleukemia. Amer. J. Med. Sci. 241: 512.
13. Jolles, P., M. Sternberg, and G. Mathe. 1965. The rela-tionship between serum lysozyme levels and the bloodleukocytes. Israel J. Med. Sci. 1: 445.
14. Muggia, F., H. 0. Heinemann, and E. F. Osserman.1967. Hypokalemia in cases of monocytic leukemia withlysozymuria. J. Clin. Invest. 46: 1098.
15. Muggia, F. M., H. 0. Heinemann, M. Farhangi, andE. F. Osserman. 1969. Lysozymuria and renal tubulardysfunction in monocytic and myelomonocytic leukemia.Amer. J. Med. 47: 351.
16. Osserman, E. F., and H. A. Azar. 1969. Renal tubularlesions secondary to lysozyme in human and rat mono-cytic leukemia. Fed. Proc. 28: 619.
17. Pruzanski, W., and S. G. Saito. 1969. The diagnosticvalue of lysozyme (muramidase) estimation in biologicalfluids. Amer. J. Med. Sci. 258: 405.
18. Hiller, A., R. L. Greig, and W. W. Beckman. 1948.Determination of protein in urine by biuret method.J. Biol. Chem. 176: 1421.
19. Grabar, P., and C. A. Williams, Jr. 1955. Methode im-munoelectrophoretique d'analyse de melanges de sub-stances antigeniques. Biochim. Biophys. Acta. 17: 67.
20. Alderton, G., W. H. Ward, and H. L. Fevold. 1945.Isolation of lysozyme from egg-white. J. Biol. Chem.157: 43.
21. Jackson, S. H., I. B. Sardharwalla, and G. C. Ebers.1968. Two systems of amino acid chromatography suit-able for mass screening. Clin. Biochem. 2: 163.
22. Roberts, R. C., D. G. Makey, and U. S. Seal. 1966.Human transferrin, molecular weight and sedimentationproperties. J. Biol. Chem. 241: 4907.
23. Joachim, G. R., J. S. Cameron, M. Schwartz, and E. L.Becker. 1964. Selectivity of protein excretion in patientswith the nephrotic syndrome. J. Clin. Invest. 43: 2332.
24. MacLean, P. R., and J. S. Robson. 1967. A simplemethod for determining selectivity of proteinuria. Lancet.1: 539.
25. Fahey, J. L., and D. R. Boggs. 1960. Serum proteinchanges in malignant diseases. I. The acute leukemias.Blood. 16: 1479.
26. Boggs, D. R., and J. L. Fahey. 1960. Serum-proteinchanges in malignant disease. II. The chronic leukemias,Hodgkin's disease and malignant lymphoma. J. Nat.Cancer Inst. 25: 1381.
27. Sunderman, F. W., Jr., and M. W. Johnson. 1966. Studiesof the serum proteins. VII. Sucrose gradient electro-phoresis. Amer. J. Clin. Pathol. 45: 381.
28. Wildhack, R. 1967. Monozytenleukemie mit yG-Para-proteinamie nach Roentgennachbestrahlung und zyto-statischer Behandlung eines Myosarkoms. Deut. Med.Wochenschr. 92: 255.
29. Poulik, M. D., L. Berman, and A. S. Prasad. 1969."Myeloma protein" in a patient with monocytic leukemia.Blood. 33: 746.
30. Finch, S. C., F. J. Gnabasic, and W. Rogoway. 1964.Lysozyme and Leukopoiesis. Proceedings of the ThirdInternational Symposium on Fleming's Lysozyme. ScuolaArti Grafiche, 0. S. F. Cesano Boscone, Milan.
31. Perillie, P. E., S. C. Kaplan, E. Lefkowitz, W. Rogaway,and S. C. Finch. 1968. Studies of muramidase (lyso-zyme) in leukemia. J. Amer. Med. Ass. 203: 317
32. Noble, R. E., and H. H. Fudenberg. 1967. Leukocytelysozyme activity in myelocytic leukemia. Blood. 30: 465.
33. Charlmagne, D., and P. Jolles. 1966. Les lysozymes desleukocytes et du plasma d'origine humaine. Hommesnormaux et malades atteints de leucemie myeloidechronique. Nouv. Rev. Fr. Hematol. 6: 355.
Proteins and Renal Function in Monocytic Leukemias 1707

34. Prockop, D. J., and W. D. Davidson. 1964. A study ofurinary and serum lysozyme in patients with renal dis-ease. N. Engl. J. Med. 270: 269.
35. Hayslett, J. P., P. E. Perillie, and S. C. Finch. 1968.Urinary muramidase and renal disease, correlation withrenal histology and implications for the mechanism ofenzymuria. N. Engl. J. Med. 279: 506.
36. Wiernik, P. M., and A. A. Serpick. 1969. Clinical sig-nificance of serum and urinary muramidase activity inleukemia and other hematologic malignancies. Amer. J.Med. 46: 330.
37. Schultze, H. E., and J. F. Heremans. 1966. Molecularbiology of human proteins with special reference toplasma proteins. Vol. 1. Elsevier, Amsterdam.
38. Walravens, P., E. C. Laterre, and J. F. Heremans. 1968.Studies on tubular proteinuria. Clin. Chim. Acta. 19:107.
39. Piscator, M. 1966. Proteinuria in chronic cadmiumpoisoning. III. Electrophoretic and immunoelectro-phoretic studies on urinary proteins from cadmiumworkers, with special reference to the excretion of lowmolecular weight proteins. Arch. Environ. Health. 12:335.
40. Piscator, M. 1966. Proteinuria in chronic cadmiumpoisoning. IV. Gel filtration and ion exchange chroma-tography of urinary proteins from cadmium workers.Arch. Environ. Health. 12: 345.
41. Harrison, J. F., and B. E. Northam. 1966. Low molecu-lar weight urine protein investigated by gel filtration.Clin. Chim. Acta. 14: 679.
42. Butler, E. A., F. V. Flynn, H. Harris, and E. B.Robson. 1962. A study of urine proteins by two-dimen-sional electrophoresis with special reference to theproteinuria of renal tubular disorders. Clin. Chim. Acta.7: 34.
43. Harrison, J. F., and J. D. Blainey. 1967. Adult Fanconisyndrome with monoclonal abnormality of immunoglobu-lin light chain. J. Clin. Pathol. 20: 42.
44. Harrison, J. F., G. S. Lunt, P. Scott, and J. D.Blainey. 1968. Urinary lysozyme, ribonuclease and low-molecular-weight protein in renal disease. Lancet. 1: 371.
45. Morris, R. C., I. Veki, A. Sebastian, and E. Morris.1967. Lysozymuria in acidification defects of the proxi-mal nephron. Clin. Res. 15: 142.
46. Jolles, P., M. Bonnafe, A. Mouton, and L. Schwarzen-berg. 1967. Dosage automatique du lysozyme dansl'urine de divers leucemiques: caraterisation et purifica-tion d'un lysozyme chez les seuls malades, atteints deleucemie myeloblastique aigue. Rev. Fr. Etud. Clin.Biol. 12: 996.
47. Marshall, M. E., and H. F., Deutsch. 1950. Clearancesof some proteins by the dog kidney. Amer. J. Physiol.163: 461.
48. Bottomley, R. H., and S. J. Gallemore. 1970. Lysozymeclearance in patients with acute mono-myeloblastic leu-kemia. Clin. Res. 18: 399.
49. Pruzanski, W. 1970. Serum and urinary proteins, mur-amidase and renal function in leukemia. A unique defectin mono- and myelomonocytic type. Proceedings of theXIII International Congress of Hematology, Munich.August 2-8.
50. Morris, R. C., Jr., and H. H. Fudenberg. 1967. Impairedrenal acidification in patients with hypergammaglobu-linemia. Medicine. 46: 57.
51. Constanza, D. J., and M. Smoller. 1963. Multiple mye-loma with the Fanconi syndrome. Study of a case withelectron microscopy of the kidney. Amer. J. Med. 34:125.
52. Sussman, M., A. W. Asscher, and J. A. S. Jenkins. 1968.The intrarenal distribution of lysozyme (muramidase).Invest. Urol. 6: 148.
53. Maack, T. 1967. Changes in the activity of acid hydro-lases during, renal reabsorption of lysozyme. J. Cell.Biol. 35: 268.
54. Glynn, A. A. 1966. R6le et repartition du lysozymeintracellulaire et extracellulaire. Exposes. Annu Bio-chim. Med. 27: 111.
55. Osserman, E. F. 1970. Lysozymuria in renal and non-renal diseases. In Proteins in Normal and PathologicalUrine. Y. Manuel, J. P. Revillard, and H. Betuel, edi-tors. S. Karger AG., Basel. 260.
56. Fisher, E. R., E. Perez-Stable, and Z. A. Zawadzki.1964. Ultrastructural renal changes in multiple myelomawith comments relative to the mechanism of proteinuria.Lab. Invest. 13: 1561.
57. Rowe, D. S., and J. L. Fahey. A new class of humanimmunoglobulins. II. Normal serum IgD. J. Exp. Med.121: 185.
1708 W. Pruzanski and M. E. Platts