serum proteins: a review
TRANSCRIPT

J. clin. Path. (1949), 2, 161
SERUM PROTEINS: A ReviewBY
J. R. MARRACK AND H. HOCHFrom the Department of Chemical Pathology, London Hospital Medical College
(RECEIVED FOR PUBLICATION, JuNE 3, 1949)
CONTENTS
Introduction ... ... ... ... ...
L. Electrophoresis: Method and Interpretation
H. Fractionation by Precipitation Methods ...
Salting OutLow Salt ConcentrationsQuantitative MethodsLow-Temperature-Low-Salt-Low-Dielec-
tric-Constant Fractionation
III. Normal Concentrations of Serum ProteinsTotal ProteinElectrophoretic FractionsSerum Proteins in Pregnancy and Infancy
For many years it has been realized that serglobulin is not a single homogeneous protein,comprises a variety of proteins which have 4ferent physical, chemical, and physiological pperties. The salt fractionation methods that hbeen 'used for many years do not yield fractiwhich are sharply distinguished one from anotin any properties. A striking example is thatthe fractionation of diphtheria antitoxic serwith ammonium sulphate; antitoxin is founda series of fractions ranging from that precipitabetween 30 and 35% saturation to that Ecipitated between 52 and 56% saturation (Eand Glennie, 1931).During recent years new methods have b
used for the separation and study of the Eteins of serum and plasma. In particularmoving boundary method of electrophoretic an:sis developed by Tiselius (1937) raised great holfor by this method at least five fractions of (
ferent mobility can be recognized in human seruthe mobilities of these fractions are distinct E
little material of intermediate mobility can0*
161 IV. Composition, Physical, and PhysiologicalProperties ... ... ... ... 168
162 CompositionMolecular WeightsImmunology
163 Physiological PropertiesV. Serum Proteins in Disease ... 173
Response to Injury and InfectionEffect of Deficiency of ProteinLipaemiaLiver DiseaseMyelomatosisMiscellaneous Diseases
167 Other Abnormal Proteins
VI. Flocculation Reactions ....Erythrocyte Sedimentation Rate
... 185
Discussion ... ... ... ... ... 187
detected. Cohn and his colleagues at Harvardhave studied the factors that affect the solubilityof proteins. On the basis of these studies theyhave developed a method of separation ofproteins by independent variation of thesefactors. This method has revealed the presencein serum of a great variety of distinct proteins.It has now been used extensively and on a largescale for the preparation of active fractions rela-tively free from other protein. Methods havebeen devised by which the molecular weights ofprotein molecules can be calculated and tentativeestimates can be made of their shapes and sizes.The separation of fractions by electrophoresis
is based on one property only, that is, mobilityin an electric field. The molecules contained ina fraction which, on the 'basis of mobility, ishomogeneous, may have different shapes, weights,and sizes, different chemical compositions and dif-ferent physiological properties. The globulin frac-tions separated by Cohn's methods and, still more,those separated by salt fractionation, contain pro-teins of different mobilities. The grouping of

J. R. MARRACK AND- H. HOCH
serum globulins, therefore, depends on the choiceof property on the basis of which they areclassified.The mobilities of the components of the frac-
tions prepared by Cohn's methods have beenmeasured. A very large number of abnormalsera have been studied by electrophoresis; fromthese results it is possible to draw conclusions asto the changes of electrophoretic pattern that maybe expected in various types of disease, and thesignificance of these changes. Few abnormal serahave been studied by the other new methods. Wewill, therefore, use the electrophoretic patterns asthe basis of discussion in this article.Comprehensive reviews of investigations into the
concentration, distribution, and significance of pro-teins in serum have been published by Janeway(1943), Stern and Reiner (1946), Luetscher (1947),and Gutman (1948).
1. Electrophoresis: Method and InterpretationThe object of electrophoresis is to demonstrate the
presence of constituents which have different mobilitiesand to measure the relative concentrations of theseconstituents. The conditions of pH and salt concen-tration influence the results and they have to bespecified. The range of pH commonly used forplasma or serum is between 7.7 and 8.6; in this pHrange all serum proteins carry negative charges andtherefore move towards the anode. The salt concen-tration usually chosen is equivalent to an ionicstrength of 0.1 or 0.2.* The experiments are madein the special apparatus designed by Tiselius whichconsists of a U-tube with a rectangular cross section,the upper enas of which are connected to two elec-trodes. The solution to be analysed is run into thebottom part of the U-tube, buffer solution is placedon it and in the remaining space, including theelectrode vessels.At the beginning there is one boundary between the
protein solution and the supernatant buffer in eachlimb of the U-tube (Fig. la). On passing an electriccurrent these two boundaries move away from theoriginal positions at velocities equal to the velocitiesof the protein ions below these moving boundaries.If several protein constituents of different mobilitiesare presetit the original boundaries will split intoseveral boundaries moving with different speeds. Inaddition to these moving boundaries there are twoalmost stationary boundaries, 8 and e, which are dueto changes in conductivity at the positions of theoriginal boundaries (Fig. 1). Before it is put in theU-tube the protein solution is dialysed against thebuffer. In order to reduce to a minimum convectioncurrents arising from differences in temperature withinthe U-tube between the inner and the marginal parts
*The ionic strensth is defined by j (%+c . . .where c1,c,,. . . are the ion concentrations and z2,z,..are the valenI
:1:1.,1+
K
K+L
I~~ ~ ~ ~ ~K+L+M
I X ~I M I
I. 33
gL+M,
a bFIG. 1 Distribution of three components, K, L, and
M, of different mobilities: (a) Before electro-phoresis; (b) after electrophoresis.
during the passage of the current, the U-tube isimmersed in a water-b'ath of a temperature near thedensity maximum of the solution (0-4' C.).The methods of observing the number and positions
of the boundaries and of measuring the relativeconcentrations of the fractions are based on thechange of refractive index produced by the changein the concentration of protein at the boundary. Onaccount of this change of refractive index a horizontalray of light passing through the tube is deflecteddownwards. The extent of the deflection depends onthe rate of change of the refractive index. In thespace immediately above and below the boundary theconcentration does not change and a ray of light pass-ing through the tube is not deflected. In Thovert'scylindrical lens (Thovert, 1914; Philpot, 1938;Svensson, 1939) and in Longsworth's Schlieren scan-ning (1939) methods the vertical deflection is trans-lated by optical and mechanical devices into a lateraldeflection which is recorded on a screen. Theboundary appears on the screen as a peak. Onmigration the sharpness of the peak changes. Vari-ation in conductivity anrd in pH have each the effectof sharpening the peak in one limb and of broaden-ing it in the other. These effects may be in the oppo-site or in the same direction. Spreading by. diffusionis superimposed in both limbs. If a boundary peakremains single during migration over a long distanceit is usually inferred that the protein is electro-phoretically homogeneous. But this need not neces-sarily be the case, since a mixture of similar proteins,the mobilities of which are distributed in a smoothfrequency curve, can also show a single peak after
162

SERUM PROTEINS
migration over a long distance. Criteria to definethe degree of non-homogeneity have been proposed.(For literature see Alberty, 1948.)
Fig. 2 shows the concentration distribution alongthe vertical direction in a boundary. The differencebetween the concentrations at A and that at A' isproportional to the difference between the refractiveindices at A and that at A'. This can be shown to beproportional to the area under the peak ADA'. Whenthe protein solution used is a solution of serum pro-
C
A' A Xdcdx D
A' A XFIG. 2.-Concentration-distribution in a boundary, and
corresponding peak formed on plate.
teins the components that have different mobilitiesare represented by peaks as in Fig. 3. They are calledalbumin, al- (Longsworth, 1942), a2- /- and y-globulin.In order to separate the a,-globulin from the albumina diethybarbiturate buffer of pH 8.6 is used (Longs-worth, 1942). When the phosphate buffer is used at apH lower than 8.0 the a,-globulin peak does not sepa-rate from the albumin peak; the "albumin " there-fore includes a,-globulin.* Subsequently it has beenshown that each component is composed of a group ofproteins the mobilities of which differ slightly. Fre-quently two peaks can be distinguished in the regionof the 8-globulin boundary. The faster has beencalled 8,- and the slower f,-. A small componentnormally'seen in human sera between the /,- and they-globulins has been designated as 32-, but is nowcalled y4- (Deutsch et al., 1946). If plasma is used thefibrinogen is represented is a peak, 0, which includes
*Throughout this review we will use the term "a-globulin " (without a numerical suffix) to mean a,-globulinseparated at a pH not exceeding 8.0; in these instances,the al-globulin is included in the " albumin."
O**
the -y,-globulin and lies between the /3- and y-globulin.The concentrations of these components are propor-tional to the areas (measured with a planimeter) underthese peaks; the relative concentrations are calculatedfrom the relative proportions of these areas, and, ifthe total concentration of protein in serum has beendetermined, the absolute concentrations of these frac-tions can be calculated.* This simple statement needssome qualification. In the first place it assumes thatthe rate of change of refractive index with change ofconcentration (specific refractive increment) is thesame for each protein and that no gradients of refrac-tive index are produced across the boundaries byconcentration gradients of other substances. In thesecond place, the molecules which move in groupsand cause the changes of refractive index are notsimple proteins, in the sense of compounds built ofamino-acids, but are aggregates of protein, carbo-hydrate, and lipids more or less firmly united.The assumption that the specific refractive incre-ment is the same for each protein is approxi-mately correct if the concentration of " protein"used as a basis of calculation is the weight of thetotal protein-lipid-carbohydrate aggregate that movesas a unit. But the traditional methods of reckoningamounts of proteins are based on the amounts ofnitrogen that they contain, or on the dry weight ofthe protein-carbohydrate complex left after extractionof the lipids. As the amounts of lipid in the a- and/3-globulins of serum are larger than the amounts inthe albumin and y-globulin, the relative propor-tions of a- and /3-globulin calculated from the areasof the peaks are higher than would be found if theproportions were calculated from the amounts ofnitrogen in these fractions. This difference in methodof reckoning accounts for part of the differencebetween the' albumin/globulin ratios found by saltfractionation and by electrophoresis ; the differencebecomes large when the amount of lipid in the serumis high. Other factors affect the apparent concentra-tions and mobilities. All that need be said here isthat for comparable results ionic strength and proteinconcentrations must be kept within certain limits.Experiments to determine these limits have been madeby Perlmann and Kaufman (1945), Svensson (1946),Koenig et al. (1946), and others.
II. Fractionation by Precipitation MethodsIt is not generally practicable to use electro-
phoresis as a routine method of examination.When interest was focused on the reduction ofserum proteins in nephrosis it was sufficient tomeasure the total concentration of proteins. Nowthat it is realized that in some diseases the con-centration of albumin may be very low, althoughthe total concentration of protein is not reduced,
*The reproducibilLy of the measurements can beassessed from the data given by Dole (1944), Seibert et al.(1947), and others. The error in the estimate of the albuminis usually within +2%; that of any other component, if 10or 20% of the total, within + 5%, depending on theresolution of the peaks.
163

J. R. MARRACK AND H. HOCH
and that the concentration of one electrophoreticfraction of the globulin may be changed withoutchanges of the concentrations of the others, therelation of fractions separated by suitable routinemethods to electrophoretic fractions must beconsidered.
Salting Out. The fractions separated by precipita-tion with strong salt solutions are not homogeneous.In the earliest investigations Tiselius (1937) foundthat the globulin fraction, precipitated from horse
pattern very little. (In the serum studied little pro-tein, Howe's 'euglobulin,"* was precipitated by thisconcentration of sulphate.) When the concentrationwas raised to 17.4-,(% about one-half of the y-globulin.a quarter of the /3-, and none of the a-globulin wasprecipitated. This fraction includes Howe's pseudo-globulin I. All the y-, three-quarters of the /3-, andone-quarter of the a-globulin including Howe'spseudoglobulin It were precipitated by 21.50°<, sul-phate. The residual solution, containing Howe's" albumin," contained a- and /3-globulin. Dole (1944)
TABLE IDISTRIBUTION OF ELECTROPHORETIC COMPONENTS (g./100 ml. OF ORIGINAL SERUM) INFRACTIONS PRECIPITATED WITH AMMONIUM SULPHATE FROM NORMAL HUMAN SERUM
(NEURATH EF AL., 1947)
Albumin
Whole Serum 3.52
Globulin
. 1002. 4
0.4 1.07 0.80 1.41
Fractions Precipitated Betw enI~~~~~~~~~~~~~~~~~~~~~~~~~
l lolar SaturationConcentrations (0/O)
0-1.4
1.4-1.71.7-2.12.1-
0-34
34-4242-5151-
0
0.050.102.28
0
00.120.38
0.04
0.220.330.22
0.09 0.62
0.50.08 0.090.20 0
serum by 30% saturation with ammonium sulphate,contained some albumin, and that 250° of the pro-tein not precipitated by 50° . saturation was globulin.Cohn, McMeekin, and colleagues (1940), and Svens-son (1941) found that the fractions of the globulinprecipitated between various concentrations ofammonium sulphate contained all three of theelectrophoretic components. The distribution in thefractions precipitated from human serum are givenin Table I. Jager and Nickerson (1948) found thatabout three-quarters of the globulin precipitated by33% saturated ammonium sulphate was y-globulin;the precipitate also contained 11 to 14°o of 3-globulin and 5 to 160,. of a,-, and a2-globulin. Theheterogeneity of these salt-precipitated fractions isalso shown by the fact that a /8-globulin, whichcontains the mid-piece of complement, makes up aconsiderable part of the globulin precipitated fromhuman and guinea-pig serum by 34°' saturatedammonium sulphate (1.39M.) at a pH of about 6.1(Pillemer et al., 1941, 1943).
In Kekwick's (1940) method of preparing y-globulinfrom normal human serum the precipitate formeJwith 12% sodium sulphate contained 50'0 of 3- anda-globulin. In the course of their study of thefractionation of normal human sera by Howe's (1921)method Gutman and his colleagues (1941) found that13.5 °' sodium sulphate changed the electrophoretic
also found that Howe's albumin contained more thanone globulin fraction.
In other studies of human serum, such as tha: ofKibrick and Blonstein (1948), the amounts of proteinprecipitated by various concentrations of sodium sul-phate have been compared with the amounts of thefractions found by electrophoresis. The fact that theamount of protein precipitated by a given concentra-tion of a salt is equal to the amount of some electro-phoretic fraction does not imply that this precipitateis electrophoretically homogeneous.Low Salt Concentration. The amount of globulin
precipitated from serum by dilution or dialysis againstsolutions of low salt concentration depends on thepH and ionic strength. Thus the so-called ' end-piece" of guinea-pig complement is not precipitatedat pH 5.2 and an ionic strength of 0.075 but is precipi-tated at this pH when the ionic strength is reduced to0.01 (Pillemer et al., 1941). Erickson et al. (1947)found that in euglobulin, precipitated from syphiliticserum by dilution and the passage of CO2 or by addi-tion of HCl to pH 6.06.1, about one-half was T-globulin, about a quarter a-, and a quarter /-globulin.
*The term " euglobulin' has been used promiscuousINto mean the fraction that is insoluble at low salt concentra-tions, the fraction precipitated by saturation withammonium sulphate, and that precipitated by 13.50°sodium sulphate. If the term is used the precise meaningshould be specified.
164
SERUM PROTEINS1
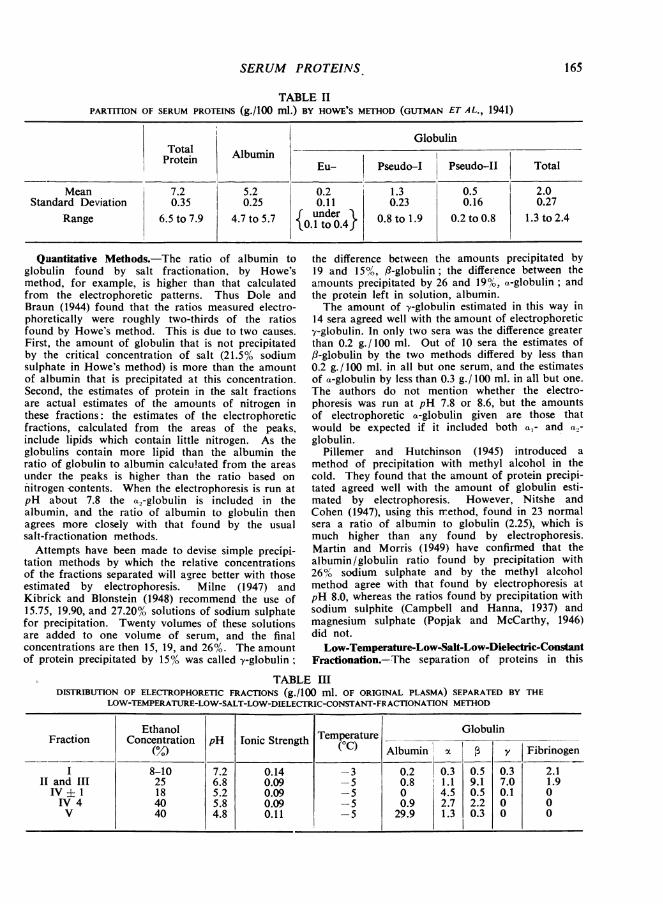
TABLE IIPARTITION OF SERUM PROTEINS (g./100 ml.) BY HOWE'S METHOD (GUTMAN ET AL., 1941)
GlobulinTotal AlbuminProtein ! Albumin Eu- Pseudo-I Pseudo-II Total
Mean 7.2 5.2 0.2 1.3 0.5 2.0Standard Deviation 0.35 0.25 0.11 0.23 0.16 0.27
Range 6.5 to 7.9 4.7 to 5.7 {under} 0.8 to 1.9 0.2 to 0.8 1.3 to 2.4
Quantitative Methods.-The ratio of albumin toglobulin found by salt fractionation, by Howe'smethod, for example, is higher than that calculatedfrom the electrophoretic patterns. Thus Dole andBraun (1944) found that the ratios measured electro-phoretically were roughly two-thirds of the ratiosfound by Howe's method. This is due to two causes.
First, the amount of globulin that is not precipitatedby the critical concentration of salt (21.5% sodiumsulphate in Howe's method) is more than the amountof albumin that is precipitated at this concentration.Second, the estimates of protein in the salt fractionsare actual estimates of the amounts of nitrogen inthese fractions: the estimates of the electrophoreticfractions, calculated from the areas of the peaks,include lipids which contain little nitrogen. As theglobulins contain more lipid than the albumin theratio of globulin to albumin calculated from the areas
under the peaks is higher than the ratio based on
nitrogen contents. When the electrophoresis is run atpH about 7.8 the a.-globulin is included in thealbumin, and the ratio of albumin to globulin thenagrees more closely with that found by the usualsalt-fractionation methods.Attempts have been made to devise simple precipi-
tation methods by which the relative concentrationsof the fractions separated will agree better with thoseestimated by electrophoresis. Milne (1947) andKibrick and Blonstein (1948) recommend the use of15.75, 19.90, and 27.20% solutions of sodium sulphatefor precipitation. Twenty volumes of these solutionsare added to one volume of serum, and the finalconcentrations are then 15, 19, and 26%. The amountof protein precipitated by 15% was called y-globulin;
the difference between the amounts precipitated by19 and 15%, ,3-globulin; the difference between theamounts precipitated by 26 and 19%, a-globulin; andthe protein left in solution, albumin.The amount of y-globulin estimated in this way in
14 sera agreed well with the amount of electrophoretic>/-globulin. In only two sera was the difference greaterthan 0.2 g. /100 ml. Out of 10 sera the estimates of13-globulin by the two methods differed by less than0.2 g. /100 ml. in all but one serum, and the estimatesof a-globulin by less than 0.3 g./ 100 ml. in all but one.The authors do not mention whether the electro-phoresis was run at pH 7.8 or 8.6, but the amountsof electrophoretic a-globulin given are those thatwould be expected if it included both a,- and a2-globulin.
Pillemer and Hutchinson (1945) introduced amethod of precipitation with methyl alcohol in thecold. They found that the amount of protein precipi-tated agreed well with the amount of globulin esti-mated by electrophoresis. However, Nitshe andCohen (1947), using this ir.ethod, found in 23 normalsera a ratio of albumin to globulin (2.25), which ismuch higher than any found by electrophoresis.Martin and Morris (1949) have confirmed that thealbumin/globulin ratio found by precipitation with26% sodium sulphate and by the methyl alcoholmethod agree with that found by electrophoresis atpH 8.0, whereas the ratios found by precipitation withsodium sulphite (Campbell and Hanna, 1937) andmagnesium sulphate (Popjak and McCarthy, 1946)did not.
Low-Temperature-Low-Salt-Low-Dielectric-ConstantFractionation.-The separation of proteins in this
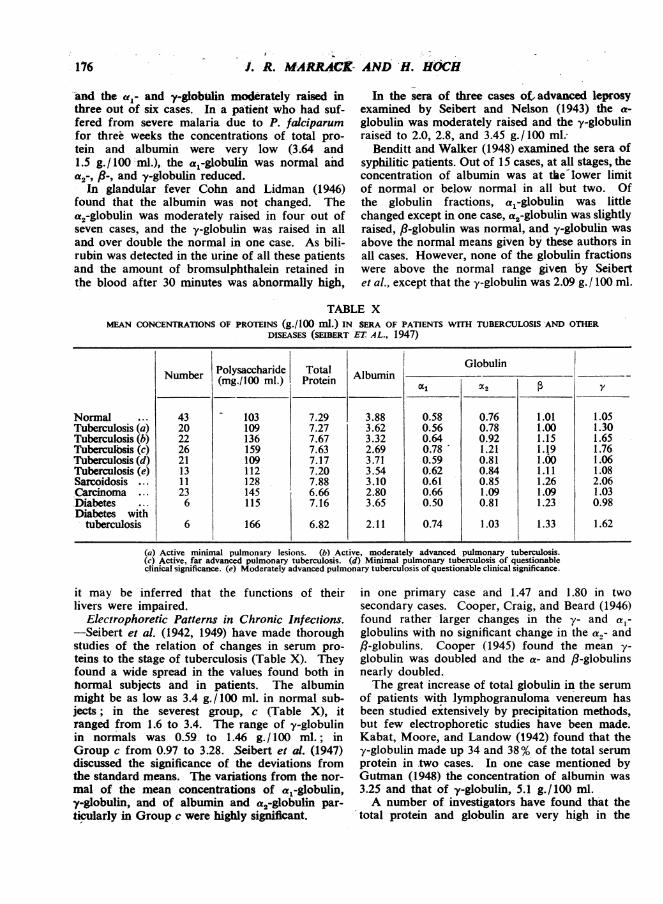
TABLE IIIDISTRIBUTION OF ELECTROPHORETIC FRACTIONS (g./100 ml. OF ORIGINAL PLASMA) SEPARATED BY THE
LOW-TEMPERATURE-LOW-SALT-LOW-DIELECTRIC-CONSTANT-FRACTIONATION METHOD
Ethanol TmeaueGlobulinFraction Concentration pH Ionic Strength 0TemperatureAlbumino_ G
(M/0) ("C) Albumin y Fibrinogen
I 8-10 7.2 0.14 -3 0.2 0.3 0.5 0.3 2.1II and III 25 6.8 0.09 -5 0.8 1.1 9.1 7.0 1.9IV I 1 18 5.2 0.09 -5 0 4.5 0.5 0.1 0IV 4 40 5.8 0.09 -5 0.9 2.7 2.2 0 0V 40 4.8 0.11 -5 29.9 1.3 0.3 0 0
165

IRt
03
001~~~~~~~~~~~~~~~~~~~~~~~~~~~~~2
00
c
0 0~~~~~~~e 0
IIt
E~o
-~.
aA
~~~~~~E
0~~~~~~~~~~~
000-0
i.
en~~~~ ~ ~ ~ ~ ~ ~ ~ ~ ~ ~~~
166 1. R. MARRACK AND H. HOC!!

SERUM PROTEINS
process, developed by Cohn and his colleagues,depends on the fact that small variations of the ionicstrength or dielectric constant of solutions may havea great effect on the solubility of protein molecules;this effect depends on the electric configuration whichmay be highly characteristic of certain molecules.The dielectric constant is lowered by the addition ofethyl alcohol. The five variables-namely, ionicstrength, concentration of protein, pH, temperature,and dielectric constant-can be varied independently.The main fractions obtained are given in Table III.
Fractions 11+111 and IV-4 are further broken downinto sub-fractions. A variety of proteins that appear
homogeneous have been isolated and proteins thathave physiological activity have been allccated tothe various fractions (Tables VI and VIII). Asappears from Table III, this method does notseparate proteins- according to their mobilities, butvarious refined proteins have thus been prepared fortherapeusis. These include albumnin, which containslittle salt; globulin, containing antibodies to measles,whooping-cough, diphtheria, scarlet fever, etc.;fibrinogen for making fibrin foam, a haemostatic; andfibrin film, an absorbable membrane. A full descrip-tion of the method and'the theory on which it is basedis given by Edsall (1947).
III. Normal Concentrations of Serum Proteins
Total Protein.-Estimates of the normal con-centrations of proteins in serum differ widely.The means reported by some authors are belowthe lower limits reported by others. This may beaccounted for, in part, by a difference of activityand of posture of the subjects. Thus Perera andBerliner (1943) found that the total protein in theserum of normal ambulant subjects was about0.8 g./100 ml. more than after they had been inbed for some hours. During recent years moreattention has been paid to the technique for esti-mating nitrogen, and most estimates of concen-
trations in the serum of healthy persons who areup and about approximate to those of Gutmanet al. (1941) given in Table II. The effect ofposture should be born in mind when the concen-trations in the serum of bedridden patients are
considered.The proteins of serum are considered in this
discussion, but proteins are often estimated inplasma. If oxalate is used as an anticoagulant,water diffuses out of the erythrocytes to compen-sate for the increased concentration of salt in theplasma. This water dilutes the plasma slightly,and consequently the concentration of proteinfound in oxalated plasma is usually no higherthan that found in serum, although the plasmacontains about 0.3 g./ 100 ml. of fibrinogenwhereas the serum contains none.
It should be noted that these concentrationsare calculated by multiplying the protein-nitrogenby the conversion factor 6.25.* To get the con-centration of protein-lipid-carbohydrate complexthe average factor for use with normal serumshould be 6.73 (Armstrong et al., 1947), but theuse of this factor is undesirable as the amountof lipid varies.
Electrophoretic Fractions.-Examples of theproportions and amounts of the fractions separ-ated by electrophoresis are given in Table IV. Inthe estimates made at pH 7.8 the albumin includesa,-globulin. Dole's subjects were healthy youngmale adults, but Armstrong's samples were drawnfrom pools of plasma from blood donors. Theconcentrations of the globulin fractions reportedby Dole and by Lewis and McCullagh are lowerthan those reported by Seibert and colleagues.The mean concentration of -y-globulin accordingto Dole differs from the mean of Seibert et al. byalmost two standard deviations. This differencemust be borne in mind when the concentrationsof the globulin fractions in abnormal sera areconsidered.
Serum Proteins in Pregnancy and Infancy.-After about the twenty-second week of preg-nancy the serum protein falls by an averageamount of 0.8 g./100 ml. (Plass and Matthew,1926; Oberst and Plass, 1932, 1936; Hoch andMarrack, 1948). The albumin alone is reduced,and this reduction runs parallel to the reductionof the concentration of haemoglobin in the bloodoccurring at the same time; both are attributedto increase of the bood volume. After deliverythe albumin rises.The serum proteins of babies at birth are low
and variable; mean concentrations range from5.11 (Rapoport et al., 1943) to 5.52 (Darrow andCary, 1933). Lower values are found in theserum of premature babies. The concentrationrises slowly during the first six months (Hickmanset al., 1943), and adult levels are reached by thethird year (Trevorrow et al., 1941-2).Longsworth et al. (1945) reported electrophoretic
analyses of the plasma or serum of foetal blooddrawn from the umbilical cord and of maternalblood taken one hour after delivery. In the mater-nal plasma or serum the average concentration ofalbumin was low (3.56 g./100 ml.) and the con-centration of 8-globulin raised (1.62 g. /100 ml.).In foetal plasma or serum the albumin (3.82 g./
*Various methods, such as the biuret and tyrosinemethods are standardized by nitrogen estimations.
167

J. R. MAYAC-K iAND H. HOCH
TABLE IVRELATIVE PROPORTIONS AND ABSOEUTE CONCENTRATIONS (./100 Mi.) OF ELECROPHORLTIC FRACTONS IN
NORMAL PLASMA AND SERUM
Armstrong -et al.,(1947). Mean of 20pools of plasma...Dole (1944). Plasmaof 15 young maleadults. Mean
S.D.Seibert et al. (1947).Serum of 43 normaladults. Mean
S.D.Range
Moore et al. (1941).Plisma of 25 normaladults Mean
Lewis and McCullagh(1944). Plasma of 21normal adults.
MeanRange
pH
8.6
8.6
8.5
7.8
7.8
Percentage of Total Protein
Alb.
55.2
60.32.8
53.32.6
47.6-59.2
62.5
62.760.1-67.2
Concentration (g./100 ml.)II _
5.3
4.60.7
8.01.355.3-11.5
8.7 113.4 16.5 IL1.O
Alb. aI
7.2 12.1 5.1 11.0 4.041.3 1.9 0.6 2.5 0.27
10.41.387.7-12.9
13.81.897.9-11.6
7.5 13.1
7.26.0-8.7
13.111.0-15.9
14.22.688.7-19.7
5.0 111.9
5.42.8-7.2
11.78.6-14.8
3.880.233.4-4.3
4.093.72-5.11
0.310.051
0.580.100.38-0.87
XC2 9I y
0.48 0.81. 0.34 0.740.083 0.126 0.059 0.151
0.760.100.57-0.94
0.470.39-0.66
0.010.140.73-1.38
0.810.65-1.07
* Estimation by Kieldahl. t Estimation by Biuret method.
1.050.220.59-1.46
0.770.55-0.91
100 ml.) and -y-globulin (0.97 g. /190 ml.) werehigher and other globulin fractions lower than inthe maternal samples.The sera of new-born calves, lambs, and foals
contain very little y-globulin. The colostrum con-tains a globulin which resembles the y-globulin ofserum (Smith, 1946). After the new-born animalshave ingested colostrum, y-globulin appears in theirserum, but ingestion of colostrum after the calveshave reached 24 hours of age does not lead to anincrease of y-globulin (Hansen and Phillips, 1947).It seems that during the first day of life thisglobulin is absorbed without being split up bydigestive enzymes.
Pedersen (1944) found that about 20% of thetotal protein and 50 to 80% of the globulin in theserum of newborn calves is a new protein whichhe called " fetuin." The molecular weight of thisprotein is 51,000, which is less than that ofalbumin. The serum of foetal foals and lambsalso contains fetuin.
IV. Composition, Physical, and PhysiologicalProperlies
Compoiion-This is discussed under theheadings amino acids, lipids, and carbohydrate.Amino Acids.-Complete estimates of the
amino acids of the albumin, a-, ,B-, andy-globulin, and fibrinogen of human serumhave been compiled by Edsall (1947) fromthe work of Brand, Kassel, and Saidel (1944),Brand (1946), and Shemin (1945). The chiefpoints of interest are the very low content oftryptophane and the relatively low content ofglycine in albumin. The contents of variousgroups of amino acids run in the followingorders:
Basic: Albumin > a-globulin>>B-globulin> y-globuliin.
Di-carboxylic: a-globulin>albumin>,8-globulin>y-globulin.
Hydroxy: Albumin<a-globulin<,8-globulin< e-globulin.
Lipids.-Blix, Tiselius, and Svensson (1941)found that the a- and ,8-globulin of normalhuman serum contain considerable quantities ofcholesterol and phospholipids (Table V). Reckon-ing the phospholipid as lecithin the total amounts(averages of three normal sera) in these fractionswere 11.7 and 18.7%. Edsall (1947) considers thatthe amounts of cholesterol found in albuminand y-globulin indicate that these fractions wereimpure, as Cohn, Strong et al. (1946) foundunder 0.04% and 0.06% of cholesterol in purifiedalbumin and -y-globulini.
TotalProtein(g./100 A/Gml.)
1.530.181
1.150.120.91-1.45
6.7*
7.29t0.356.3-8.2
6.51 *5.94-7.82
168
y

SERUM PROTEINS
TABLE VLIPID AND CARBOHYDRATES, AS MANNOSE (g. per 100 g.), IN ELECTROPHORETIC FRACIONS OF HuMAN SERUM*
Normal PneumoniaElectrophoretic --
Fractions Cholesterol Lipid- Carbohydrate Cholesterol Lipid- CarbohydratePhosphorus Phosphorus Croyrt
Albumin 1.07 0.09 1.15 0.71 0.02 5.8a-Globulin 4.45 0.29 6.0 0.42 0.21 9.93-Globulin 8.67 0.40 6.2 0.56 1.5y-Globulin 0.41 0.04 3.0 0.28 0.12 3.7
* Adapted from Blix, Tiselius, and Svensson (1941).
-By the special methods developed by theHarvard school two lipoproteins have been iso-lated from human serum (Table VI). One, withthe mobility of a-globulin, contains 10% of nitro-gen, 16% of cholesterol, and 35% of total lipid;the other, with the mobility of ,8-globulin containsonly 4% of nitrogen, 35% of cholesterol, and 75%of total lipid. The conversion factors, by whichthe nitrogen in these two lipoproteins should bemultiplied to obtain the weight of lipoprotein, are10 and 25.Carbohydrate.-Table V shows that there is
more carbohydrate in the a- and ,B-globulin ofhuman serum than in the albumin and y-globulin.There is some confusion about the amounts ofcarbohydrate .in albumin and other componentsthat are precipitated by the higher concentrationsof ammonium and sodium sulphate. Hewitt (1937)prepared a fraction from horse serum which hecalled " globoglycoid.' Rimington and Van denEnde (1940) consider that this is a complex ofalbumin and globulin. They prepared two albuminsfrom ox serum, both of which contained verylittle carbohydrate; one crystallized in hexagonalplates and the other in needles. McMeekin's(1940) horse serum albumin that contained 5.5%of carbohydrate crystallized in hexagonal discs;his carbohydrate-free albumin crystallized in rods;the two albumins had, the same molecular weights.
Besides true albumin the filtrates obtained afterprecipitation of globulin contain two proteins,seroglycoid and seromucoid, which contain largeamounts of carbohydrate. Hewitt's (1937) sero-glycoid from human serum contains 8.9% andseromucoid 25% of carbohydrate. Both are notcoagulated by heat, but seroglycoid is carrieddown with the coagulum when it is heated withcoagulable proteins. Hewitt (1938) believes thatthe amount of seroglycoid in human serum is ofthe order of 0.4 g./ 100 ml. These carbohydrate-rich proteins have received little attention in the
most recent investigations. An a2-globulin, whichcontains 4.3% of carbohydrate and has the solu-bility of albumin, has been isolated (Surgenor,Strong et al., 1948).
Molecular Weights.-When a solution of a pro-tein is spun in an ultracentrifuge, a boundary zone,above which the solution is free from this protein,travels down the column of solution. If solutionsof proteins which have different sedimentationrates are spun, the boundaries can be observedas peaks, as in electrophoresis; the area under apeak is proportional to the concentration of thecorresponding protein. Sedim-entation constants,calculated from the distance that the boundarysinks in a given time, are reckoned in Svedbergunits (S). The sedimentation constants of moleculesdepend on their weights, shapes, and densities.Other things being equal the sedimentation raterises with the molecular weight: a sphericalmolecule has a higher sedimentation rate than- aflat or elongated molecule. The molecular weightof a protein can be calculated from the sedi-mentation rate, diffusion constant, and partialspecific volume; also from the distribution of themolecules, when they have attained equilibrium ina gravitational field, and from the osmotic pres-sure. If it is assumed that the molecules -have acertain shape the ratio of the long to the shortaxis can be calculated. In Table VI it is assumedthat the molecules, other than the ,B-lipoprotein,are prolate spheroids (that is, cigar-shaped) andthat the fl-lipoprotein is approximately spherical.The ultracentrifuge has been used mainly to
measure the sedimentation constants of isolatedproteins. A difficulty arises, however, in the inter-pretation of the sedimentation patterns found withwhole human serum, but not with the serum ofother animals. Four peaks are found (Pedersen,1945). One small peak corresponds to a heavyfraction with a sedimentation constant between
169

J. R. MARRACK AND H. HOCH
I TABLE VIPHYSICAL PROPERTIES OF FRACTIONS ISOLATED FROM HUMAN SERUM (ONCLEY, SCATCHARD, AND BROWN, 1947)
Fraction Sedimentation Partial Specific Molecular CalculatedConstant Volume Weight Dimensions, A
Albumin 4.6 0.733 69,000 150 X 38xl-globulin, lipopro-
tein 5.0 0.841 200,000 300 X 50m2-globulin 9 0.693 (300,000)Pi-globulin. 5.5 0.725 90,000 190 x 37
7 0.74 (150,000)20 0.74 (500,000 to 1,000,000)
lipoprotein 2.9 0.950 1,300,000 185 x 185p2-globulin 7 0.739 (150,000)y-globulin 7.2 156,000 235 X 44
10 (300,000)
17 S and 20 S. A larger peak corresponds to thebulk of the globulin with a sedimentation constantof about 7 S. A third peak corresponds to thealbumin, and a fourth, that of the " x-component,'merges with the albumin peak. As the concen-tration of the serum rises the proportion of theprotein in the form of the x-component rises.The reason for the relatively slow rate of sedi-mentation of this component is not the relativesmallness of its molecules, but their low density,which is due to a high concentration of lipid(Pedersen, 1945). Pedersen considers that thex-protein is a complex formed by albumin, globu-lin, and lipid. It disappears when the lecithin ofserum is broken down by the lecithinase of Cl.Welchii (Peterman, 1946). The lipoproteins ofTable VI account for only about 5% of the totalprotein of serum, whereas the x-protein mayamount to 50% or more of the total protein inundiluted sera. Blix and Pedersen (1947) thinkthat the x-protein " must in the main be composedof other fractions than the 83-lipoprotein." Thequestion then arises as to whether the fractions,isolated even by such gentle methods as electro-phoresis, are actually separate in serum. Theglobulin fractions with the sedimentation con-stants 5.0, 5.5, 9, and 10 S cannot be detected inthe sedimentation patterns of whole serum.
ImmunologyAntibodies.-Studies of the mobilities and
molecular weights of antibodies are reviewedby Kabat (1943). In the rabbit- sera that havebeen studied antibodies have been found in they-globulin and have molecular weights of thesame order (about 160,000) as that of the bulk ofthe y-globulin. In horse sera, antibodies may havethe mobility of y-globulin, or mobilities rangingfrom that of the faster y-globulin (yl-globulin)
to that of the slower fl-globulin (fl2-globulin); theT-fraction (Van der Scheer, Wyckoff and Clarke,1940) has a mobility between those of 8- andy-globulin. The molecular weights of the horse-serum antibodies to protein antigens are of thesame order as that of the bulk of the y-globulin.Antibodies to polysaccharides (such as those ofpneumococci) may have much higher molecularweights of the order of 900,000 or molecularweights intermediate between this and that ofnormal y-globulin.The fractions 11-1, 2, and 3 of human serum
separated by Cohn's methods, of which 98% isy-globulin by electrophoretic standards, contain alarge number of antibodies effective in diphtheria,influenza, mumps, whooping cough, scarlet fever,poliomyelitis, lymphocytic choriomeningitis, andagainst certain streptococci and vaccinia. TyphoidH-agglutinin is found mainly in fractions I1-i, 2,and 3; typhoid 0-agglutinin and the isohaem-agglutinins in fraction 111-1 (Edsall, 1947).According to Deutsch et al. (1946) the isohaem-agglutinins and typhoid 0-agglutinin are foundmainly in their yl-globulin. The anti-syphiliticantibody also has a mobility between those of ,8-and y-globulin according to Davies et al. (1945);Erickson et al. (1947) also placed most of theactivity in the faster y-globulin, but found someactivity in the slower f8-globulin.
In the sera of human beings and monkeys anti-bodies to pneumococcal polysaccharides havemolecular weights of about 160,000. However,haemagglutinins in rabbit sera (Paic, 1939) andthe isohaemagglutinins of human sera (Pedersen,1946) have molecular weights of the order of1,000,000. The anti-syphilitic antibody, extractedfrom the floccules formed with Kahn antigen,had two components with sedimentation con-stants corresponding to molecular weights of
170

SERUM PROTEINS
about 1,000,000 and 160,000; there was more ofthe lighter component, but the heavier was moreactive serologically (Davis et al., 1945).As already noted the concentration of y-globulin
in the serum of a new-born baby is rather higherthan that in the mother's serum. The baby'sserum also contains any antibodies present inthe mother's serum in about the same concentra-tion. On the other hand no antibodies can bedetected in the sera, which contain little y-globulin,of newborn calves, lambs, and foals.
Generally it may be said that antibodies inhuman serum are found in the y-globulin or ina fraction with a mobility between those of /3- andy-globulin, and that the antibodies to all proteinantigens, as far as is known, have molecularweights of the same order as that of the greaterpart of normal serum globulin. Boyd and Bernard(1937) suggested that all y-globulin may be anti-body of some sort. Kabat (1943) points out that theamount of antibody in the serum of non-immunepersons is small. The largest amount, reported ina human being who had recently recovered frompneumonia, was about 1 mg. of antibody protein/ml. (Kabat, 1939); no antibody could be detectedin the serum of the same person several monthslater. Absorption of antibodies with homologousstreptococci from the serum of patients with rheu-matic fever, when the antistreptolysin 0 titre wasraised, did not change the relative concentrationsof the y-globulin or other serum fractions signifi-cantly (Dole, Watson, and Rothbard, 1945). Whenanimals are immunized the serum globulinincreases, but by no means all this increase isactive antibody (Marrack, 1938). It is probablethat a large proportion of the 8 mg. or so ofy-globulin in 1 ml. of human serum is such inertglobulin, which may be called " reaction " globulin.
Serum Proteins as Antigens.-Rimington andvan den Ende (1940), using the guinea-pig uterustechnique, found no antigenic difference betweenthe two forms of albumin that they prepared fromox serum and that the albumin, seroglycoid andseromucoid reacted as distinct antigens. The albu-min of human serum does not cross-react withother serum proteins. Chow (1947) has used anti-serum for estimating albumin in serum and foundconcentrations which agreed with those obtainedby electrophoresis at pH 8.4. The immunologyof the seroglycoid and seromucoid of humanserum has not been studied.The question arises whether the various com-
ponents of any one of the three fractions, a-, ,3-,and y-globulin of human serum,- are antigenicallysimilar, although they differ in other properties,
and whether proteins, similar antigenically, mayoccur in different electrophoretic fractions.The immunological method recently introduced
by Oudin (1946) shows that horse serum containsat least eight distinct antigens; it is not possibleto recognize which are the antigens that aredetected. It is possible that two of these areseroglycoid and seromucoid. This would leavealbumin and five globulin antigens. In horseserum antigenic differences were found betweenthe high-molecular weight antibodies to bacterialpolysaccharides, diphtheria antitoxin, and a y-globulin of high molecular weight prepared fromnormal horse serum, all of which had the mobilityof y-globulin; /3-globulin formed some pre-cipitate with an antiserum to high-molecular-weight antibody (Treffers et al., 1941, 1942). Onthe other hand, in rabbit serum, which resembleshuman serum more than horse serum does, noantigenic differences were detected between normaly-globulin, antibody to egg-albumin, and anti-bodies to bacterial polysaccharides (Treffers andHeidelberger, 1941).
Kendall (1937) prepared a fraction of humanglobulin by precipitation methods, and called it" a-globulin," but identified with the y-globulin ofTiselius. We have confirmed by electrophoresisin the Tiselius apparatus (Marrack, Johns, andHoch, 1949) that this "a-globulin" is mainly y-globulin; preparations usually contain less than6% of - faster fractions. Kendall prepared anti-serum to his "a-globulin." After absorbing thisantiserum with other globulin fractions he used itfor estimating the amount of this fraction in serumby the quantitative precipitin method. The con-centrations he found were about double theamounts of y-globulin found by electrophoresis.Jager et al. (1948) made antisera by immunizingwith y-globulin prepared by Cohn's method andfound similar high concentrations. However,they did not absorb their antisera with otherglobulin fractions. On the other hand, Kibrickand Blonstein (1948) immunized rabbits withy-globulin, free from other electrophoretic.com-ponents; the antisera were absorbed with albuminand with /8- and a-globulin. The estimates ofy-globulin in human serum made with theseantisera agreed with the estimates made by theirmethod of fractionation with sodium sulphate, andthese, again, agreed with the estimates byelectrophoresis.By Kendall's method a small fraction only of
the total y-globulin of serum is recovered asKendall's " a-globulin." We have found (Marrack,Johns, and Hoch, 1949) that y-globulin, separated
171

J. R. MARRACK AND -. HOCH
by electrophoresis, and Kendall's i a-globulin "gave identical precipitation curves with some anti-sera to Kendall's "a-globulin." Estimates, withthese antisera, of the y-globulin in normal humanserum agreed with estimates made from the electro-phoresis pattern. We, therefore, detected no anti-genic difference between different fractions of they-globulin. However, estimates of y-globulin innormal serum made with other antisera toKendall's " a-globulin " were considerably higherthan those found by electrophoresis. The type ofreaction suggested a cross-reaction between anti-bodies to y-globulin and other globulin fractionsrather than the presence in the antisera of anti-bodies to antigens other than y-globulin. In viewof Kendall's results and the cross-reaction whichTreffers et al. (1942) found between horse f8- andy-globulins we are doubtful whether f#- and y-globulins can be regarded as antigenically com-pletely distinct. On the other hand, the C-reactiveprotein, mentioned later, has the mobility of a-globulin but is a distinct antigen. Members of thesame electrophoretic fraction may therefore beantigenically different.Complement.-Four components are recognized
in complement. C'l (mid-piece) is heat labile and
al., 1941), and of the C'1, C'2, and C'4 of humanserum (Pillemer et al., 1943, Ecker et al., 194i. Itappears that C'2 and C'4 form a complex inguinea-pig serum, but not in human serum. If theelectrophoretic fractions of guinea-pig serum areanalogous to those of human serum, the C'l is a ,B-globulin and the C'2-C'4 complex an a-globulin.The C'l of human serum is a 8-globulin, most ofwhich has a sedimentation constant close to thatof the greater part of the serum globulin. Abouthalf the protein in the fraction that contained C'2,isolated from human serum, was albumin; theslower component in the fraction had a mobilityclose to that of ,B-globulin.The two fractions, C'l and C'2-C'4, isolated
from guinea-pig serum together made up about0.5 mg./ml. of serum; this is slightly more thanthe amount of protein that Heidelberger (1941)found was added to an immense precipitate whenit absorbed complement from 1 ml. of guinea-pigserum. A high proportion of the protein in thestpreparations from guinea-pig serum may, there-fore, be active complement. The amount of com-plement in human serum seems to be of the sameorder. Properties of the components af humanand guinea-pig complement are given in Table VII.
TABLE VIIPROPERTIES OF COMPONENTS OF COMPLEMENT
Subject Resistance to Heat Mobihity s Polysaccharide(pH 7.7) (g.I100 Ml.)Guinea-pig C'l ... Heat labile 2.9 X 10⁻⁵ 6.4 2.7
(major component)
C'4 Heat stable f 4.2 X 10⁻⁵
Human C'1 ... Heat labile 2.9 X IO5 6.9(major component)
C'2 Heat labile 2.6 X 10⁵ 3
insoluble in dilute salt solution (ionic strengthbelow 0.1) at a pH of about 5.2. C'2 (end-piece),also heat labile, is distinguished from C'1 as itdoes not become insoluble until the ionic strengthis reduced to 0.01. C'3 is relatively heat stableand can be removed from serum by adsorption ona polysaccharide prepared from yeast and by pthermeans. C'4 is heat stable and is destroyed by.mmonia and other amines that can combine with
'aldehyde groups. By fractional precipitation withammonium sulphate and at a low pH and ionicstrength, fractions have been isolated that containa considerable proportion of the C'1 and of theC2-C4 complex of guinea-pig serum (Pillemer et -
Isolated y-globulin is anti-complementary. Thesera of a number of diseases (particularly malaria,leprosy, and kala azar) give false positive reactionswith the Wassermann and other tests for syphilis.In most of these sera the concentration of y-globu-lin is abnormally high (Cooper et al., 1946). Volkinet al. (1947) used the euglobulin, separated by dilu-tion and acidification, for these tests. They claimthat crude albumin fractions from normal serainhibit false positives and do not inhibit true reac-tions. More recently they (Volkin et al., 1949)have ascribed this inhibitory action to a phos.pholipid contained in the albumin fraction. Kabat(1946) regards with suspicion such methods of dis-
172

SERUM PROTEINS
tinguishing true from false reactions. He thinksthat the procedures inhibit weak and do not inhibitstrong reactions, so that the effect is merely todistinguish between strong and weak reactions.We may compare the degree of inhibition byhaptenes of precipitate formation with homologousand heterologous antigens.
Physiological PropertiesThe distribution of physiologically active or
important substances in the fractions separatedby the low-temperature-low-ionic-strength-low-dielectric-constant method is given in Table VIII.
TABLE VIIICONSTITUENTS AND PROPERTIES OF FRACTIONS SEPARAT7ED
BY LOW-TEMPERATURE-LOW-SALT-LOW-DIELECTRIC-CONSTAN,T FRACIONATION METHOD
Fraction Constituent PoeteFractions Properties
I FibrinogenAntihaemophilicglobulin
II + III y-globulin Numerous antibodiesPI-globulin, Carries cholesterol
including phospholipidslipo-protein vitamin A
carotenoidssteroid hormones
complement, midpieceProthrombin
(g-globulin Typhoid 0-agglutininIso-haemagglutinins
IV- I ax-globulin, Carries cholesterolincluding phospholipids
lipo-protein some steroidsIV-4 %I-globulin, Thyreotropic hormone
lipid free IdoproteinMetal-combining protein
a,-globulin Carries bilirubinSerum esteraseHypertensinogen
V Albumin Carries bilirubinacl-globulin
The components with the lowest and highestmobilities serve familiar purposes. The y-globulincontains antibodies. About 80% of the colloidosmotic pressure of serum is due to albumin, as itis present in the largest amount and has the lowestmolecular weight. It is therefore essential for themaintenance of the plasma volume. Albumin hasother special properties: it adsorbs a variety ofsubstances which are little or not at all adsorbedby the globulin fractions other than al- and a
carbohydrate-rich fraction of the a2-globulin. The
most familiar of these is bilirubin. Some bilirubinis also carried by the a1- and a9-globulin (Martin,1949), and Cohn (1948) states that a protein inthe a-globulin fraction is the only one that carriesthe biirubin that gives an indirect Van den Berghreaction. A large number of other substances areadsorbed almost exclusively by serum albumin.For example, about 20% of phenol-sulphone-phthalein in serum is free; the rest is adsorbed toalbumin. The dye Evan's blue (T-1824) usedfor estimating plasma volume is carried by thealbumin. This is the basis of the method of esti-mating Evan's blue devised by Morris (1944).Sulphanilamide and the sulphone drugs areadsorbed also. This adsorption must be takeninto account in all comparisons of the concentra-*tion of a substance in the plasma with its rate ofexcretion in the urine. When the concentration ofthe albumin in the plasma is lower than normal,it may be expected that an abnormally high pro-portion of an adsorbable substance will be free.A protein which has the special property of
combining with metals has been crystallized(Koechlin, 1949). It has the mobility of f81-globulin, and contains 1.8% of carbohydrate. Itsmolecular weight is 90,000 (S = 5.0). The complexformed with iron has a salmon red colour (Schade,1946) with maximum absorption at 465 mju. Theamount of complex formed is measured by thelight absorption at this wave length. At apH above 6.5 1 g. of this protein will com-bine with 1.25 mg. of iron; this is two atoms ofiron per molecule of protein (Surgenor, Koechlin,and Strong, 1949). The protein also combines withcopper and with zinc. The maximum amount of-copper, 2 atoms per molecule, is bound near pH8.5. Below pH 8 iron will displace copper fromthe complex. Surgenor et al. estimate that 100 ml.of normal serum contains 0.24 g. of this protein,capable of binding 0.3 mg. of iron. This estimateagrees with the maximum binding capacity (0.315mg. /100 ml.) found by Rath and Finch (1949).The anti-haemophilic globulin can be precipi-
tated from normal serum by dilution and acidifica-tion. The plasma-of haemophilics clots in normaltime when a solution of this globulin is added to it.The a- and ,8-lipoproteins are particularly
interesting. These proteins may serve merely asvehicles for lipids which are insoluble in water orthey may have other functions.
V. Serum Proteins in DiseaseMost of the changes of serum proteins, revealed
by any method, except the immunological, are notspecific. In most investigations the cases studied
173

1- 1. RM.AMA CK H. -HOCH
have not been followed through the course of thedisease and the changes found in the serum pro-teins have not been correlated with the clInicalcondition or with other chemical changes. Sur-veys of the investigations that have been madeare apt to degenerate into a series of variationsof ways of saying " M.N. (194x) found the rela-tive concentration y-globulin raised in P. disease."
Unfortunately many authors report the relativeconcentrations of electrophoretic components with-out mentioning the total concentration of protein.The albumin concentration falls in most conditionsin which protein concentrations are abnormal; arise in relative concentration of the globulincomponents may merely reflect this reduction ofalbumin. The changes that occur in disease can begrouped under the following headings: Responseto infection or injury; effects of deficiency of pro-tein; changes due to excess of lipid in the serum;changes associated with disease of the liver;changes in the serum of patients with myelo-matosis. Examples of electrophoretic patterns indisease are given in Fig. 4 (pp. 188-191).
Response to Injury and Infection.-The changesin the concentrations of albumin and globulin inserum provoked by bacterial toxins are illustrated
acute infections are reduction of the albumin, witha rise in the a-globulin during the acute stage anda rise in the y-globulin continued during the laterstages and convalescence.The most thorough studies of the electrophoretic
changes in acute infections are those of Dole andhis colleagues, in which they made repeated exami-tions of the serum. They used barbiturate bufferat pH 8.6 and therefore separated al-globulin fromalbumin. Unfortunately in two of their reportsthey gave relative concentrations only, displayedon charts. It is however possible to deduce thechanges of absolute concentration when thechanges of relative concentration are morfextreme. In three cases of scarlet fever (Dole,Watson and Rothbard, 1945) in which arthritisdid not occur, the ratio of albumin to total pro-tein fell and remained low for six or more weeksafter the temperature had fallen to normal. Therelative and absolute concentrations of al-globulinwere-raised: in two of the cases the concentrationsremained high for seven weeks after the onset.There was an absolute increase of Ihe a2-globulinin two cases, highest in the first two weeks, and amoderate relative increase in a third. In twocases the relative concentration of y-globulin wasmoderately raised. In the third a purulent infec-
TABLE IXCHANGES OF PLASMA PROTEINS AFTER INJECTION OF T.A.B. VACCINE. (woH AND LOHR, 1922)
Protins (g./lOO ml.)Before Injection Temperature
g ml.)
Total Albumin Globulin Fibrinogen
After first injection3j hours 1000 7.34 4.94 1.99 0.41
2 days 7.48 4.53 2.48 0.47
After second injection 1020 7.04 4.35 2.10 0.692 days 8.59 4.18 3.68 0.73
Before third injection 8.57 3.58 3.96 0.73After ,, ,,
3j hours 10202 days 8.56 3.75 4.08 0.73
by Lohr's (1921) study of the effects of injectionof T.A.B. vaccine (Table IX). The concentrationof albumin fell and that of globulin rose. Thechanges did not reach their height during the firstreaction and progressed as the injections werecontinued. Similar changes that have been foundin various infections will be mentioned later.
Electrophoretic Patterns in Acute Infections.-As far as any generalization is possible from thelimited number of cases reported, it may be saidthat the changes in the plectrophoretic patterns in
tion of the right maxillary antrum and ethmoidsinuses was found at the end of the second week.At this time the temperature rose, and the relativeconcentration of y-globulin rose to about threetimes the normal level ard the antistreptolysin0-titre to about 1,000. The infection of the sinusescleared up under treatment in two days. They,-globulin and titre then sank but were still highabout five weeks later.The concentrations after 3+ hours are the same
as before injection.
17-4

SERUM PROTEINS
In three cases (J.K., G.S., and F.H.) in whichrheumatic fever followed scarlet fever the relativeconcentrations of a,-globulin were raised in theearly stages. In one case the absolute concen-tration was raised. Both relative and absoluteconcentrations of a2-globulin and y-globulin-wereraised andmin.two cases the relative concentrationremained high throughout the 160 days duringwhich the sera were studied. In two of the cases(J.K. and G.S.) a detectable increase of the relativeconcentration of a2-glqbulin followed the cessa-tion-of sulphadiazine therapy and preceded a riseof temperature and the onset of pains in the jointsin the fourth and fifth weeks. In the serum ofG.S. the relative al-globulin also rose. In theserum of J.K., who had a purulent nasal dischargefrom the seventh to the eighteenth day, the rela-tive y-globulin rose to about three times the nor-mal and at the same time the antistreptolysin0-titre rose to over 2,000. The titre then fell,though less rapidly than the relative y-globulin con-centration. In the other two cases the titre waslow. It is an interesting point that patient J.K.had a large boil on the leg in the eleventh week.The white blood count then rose and the tempera-ture and erythrocyte sedimentation rate roseslightly, but no change of the serum proteins wasdetected except a doubtful increase of the relativeconcentration of al-globulin. In these cases therelative concentration of f,-globulin was low orlittle changed.
In a case of typhus fever (Dole et al., 1947) thefirst sample of blood was taken on the fifth dayof illness before the rash appeared and beforethe Weil-Felix reaction was positive. The mainchanges were those of the albumin and y-globulin.The total protein was low in this sample, remainedlow for about three weeks and then rose abovenormal to about 8.5 g. / 100 ml. The absolute con-centration of albumin was low throughout theseven weeks during which the serum was examined.The a.-globulin rose slightly at the end of thesecond week. The e2- was high from the start andstayed high throughout. The relative y-globulinwas over twice the normal average in the firstsample of serum, rose to well over-three times thenormal and was still three times the normal atthe end of seven weeks. Since the total proteinrose the absolute concentration must have risento about four times the normal average. In thecases of scarlet fever and rheumatic fever therewas some evidence of a relation between thepresence of specific antibodies and the rise ofy-globulin. In this case the y-globulin was over
double the normal average before specific anti--bodies were detected.
In most other studies by electrophoresis the pHhas been under 8.0. The a,-globulin has, there-fore, not been separated from the albumin. Intheir early studies Longsworth et al. (1939) calledattention to the increase in a-globulin in the earlystages of disease. Blix (1939) found that theabsolute concentration of a-globulin was raisedin six out of seven cases of pneumonia andremained high after lysis. The highest figureswere about three times the normal level given byBlix. The y-globulin was not appreciably raisedexcept in one case, and this patient died. Luetscher(1941) also found the a-globulin raised to abQuttwice the normal in one of two cases of pneumonia.
Rutstein and others (1945) found that the abso-lute and relative concentrations of y-globulin wereincreased in cases of rheumatic fever both duringattacks and during quiescent periods. The a-globulin was increased less constantly. In twocases, examined during an acute attack, -both a-and y-globulin were about double the normal.In 12 cases of rheumatic fever Malmros and Blix(1946) found that the a-globulin was over 0.8 g./100 ml. in all cases at the first time of examination.The ,-globulin was normal. The y-globilin wasincreased in all, the maximum being 3.4 g. /100 ml.The same authors found that the a-globulin wasraised up to 0.7 to 1.0 g. / 100 ril. in cases oftonsillitis, and the increase persisted after theattack subsided. The absolute concentration ofy-globulin was appreciably raised in one of fourcases during the attack and in all but one caseafter the attack.
In malaria transmitted by mosquitoes the liveris invaded by the malarial parasites at the begin-ning of the infection (Shortt et al., 1948), andthere is considerable evidence of livei*damage inglandular fever. The changes found in the acutestages of these diseases may be, in part, due toimpairment of the functions of the liver. Duringthe febrile stage of malaria artificially induced inthree cases, the albumin fell in all three to 3.3 g./100 ml. or less. The a2-globulin also fell to aboutthree-quarters of its previous level and the y-globulin rose (Guttman et al., 1945). The reduc-tion of the a2-globulin may have been due to the-reduction of cholesterol thatLoccurred in these seraduring the attacks.. Dole and Emerson (1945)studied the proteins in the serum of eight patientssuffering from relapsing malaria in which P. vivaxwas found in the blood. The relation of the timeof taking the blood to the attacks is not reported.The concentration of albumin was somewhat low,
175
J. R. M-ARRAC AND -H. IHOCH
and the ct.- and y-globulin modrately raised inthree out of six cases. In a patient who had suf-fered from severe malaria due to P. falciparumfor three weeks the concentrations of total pro-tein and albumin were very low (3.64 and1.5 g./l00 ml.), the a,,-globulin was normal anda2-, 8-, and y-globulin reduced.
In glandular fever Cohn and Lidman (1946)found that the albumin was not changed. Thea2-globulin was moderately raised in four out ofseven cases, and the y-globulin was raised in alland over double the normal in one case. As bili-rubin was detected in the urine of all these patientsand the amount of bromsulphthalein retained inthe blood after 30 minutes was abnormally high,
In the sera of three cases of, advanced leprosyexamined by Seibert and Nelson (1943) the a-globulin was moderately raised and the y-globulinraised to 2.0, 2.8, and 3.45 g./100 ml.
Benditt and Walker (1948) examined the sera ofsyphilitic patients. Out of 15 cases, at all stages, theconcentration of albumin was at the lower limitof normal or below normal in all but two. Ofthe globulin fractions, al-globulin was littlechanged except in one case, a2-globulin was slightlyraised, sl-globulin was normal, and -y-globulin wasabove the normal means given by these authors inall cases. However, none of the globulin fractionswere above the normal range given by Seibertet al., except that the -y-globulin was 2.09 g. / 100 ml.
TABLE XMEAN CONCENTRATIONS OF PROTEINS (g./100 ml.) IN SERA OF PATIENTS WITH TUBERCULOSIS AND OTHER
DISEASES (SEIBERT ET AL., 1947)
NormalTuberculosis (a)Tuberculosis (b)Tuberculosis (c)Tuberculosis (d)Tuberculosis (e)Sarcoidosis . .Carcinoma . .DiabetesDiabetes with
tuberculosis
Number
43202226211311236
6
Polysaccharide(mg./100 ml.)
103109136159109112128145115
166
TotalProtein Albumin
Globulin
r31-~
7.297.277.677.637.177.207.886.667.16
6.82
3.883.623.322.693.713.543.102.803.65
2.11
0.580.560.640.780.590.620.610.660.50
0.74
0.760.780.921.210.810.840.851.090.81
1.03
1.011.001.151.191.001.111.261.091.23
1.33
y
1.051.301.651.761.061.082.061.030.98
1.62
(a) Active minimal pulmonary lesions. (b) Active, moderately advanced pulmonary tuberculosis.(c) Active, far advanced pulmonary tuberculosis. (d) Minimal pulmonary tuberculosis of questionableclinical significance. (e) Moderately advanced pulmonary tuberculosis of questionable clinical significance.
it may be inferred that the functions of theirlivers were impaired.
Electrophoretic Patterns in Chronic Infections.-Seibert et al. (1942, 1949) have made thoroughstudies of the relation of changes in serum pro-teins to the stage of tuberculosis (Table X). Theyfound a wide spread in the values found both innormal subjects and in patients. The albuminmight be as low as 3.4 g. /100 ml. in normal sub-jects; in the severest group, c (Table X), itranged from 1.6 to 3.4. The range of y-globulinin normals was 0.59 to 1.46 g./100 ml.; inGroup c from 0.97 to 3.28. Seibert et al. (1947)discussed the significance of the deviations fromthe standard means. The variations from the nor-mal of the mean concentrations of al-globulin,y-globulin, and of albumin and a2-globulin par-tcularly in Group c were highly significant.
in one primary case and 1.47 and 1.80 in twosecondary cases. Cooper, Craig, and Beard (1946)found rather larger changes in the y- and a,-globulins with no significant change in the a,- andfl-globulins. Cooper (1945) found the mean y-globulin was doubled and the a- and fl-globulinsnearly doubled.The great increase of total globulin in the serum
of patients with lymphogranuloma venereum hasbeen studied extensively by precipitation methods,but few electrophoretic studies have been made.Kabat, Moore, and Landow (1942) found that they-globulin made up 34 and 38% of the total serumprotein in two cases. In one case mentioned byGutman (1948) the concentration of albumin was3.25 and that of y-globulin, 5.1 g./100 ml.A number of investigators have found that the
total protein and globulin are very high in the
-176

SERUM PROTEINS
serum of kala azar patients and fall as the con-dition improves. Cooper, Rein, and Beard (1946)examined the sera of two patients. In the serumof one, who was clinically ill, the total proteinwas 12.1 g. /100 ml., the y-globulin 7.76, and thealbumin 2.62 g. /100 ml. In the, other case thetotal protein had been 8.9 g./100 ml. with 4.3 g./100 ml. of y-globulin. After improvement the y-globulin was still 2.46, although the'albumin hadgone up to 4.35. In this disease, even more thanin malaria and glandular fever, it is probable thatthe changes in the serum proteins are due both toinfection and to lesions of the liver. In the firstserum examined by Cooper et al. and in our case(Fig. 4.H) the mobility of the y-globulin was slow.Cooper et al. consider that this y-globulin maydiffer from that found in excess in the serum inother infections and in diseases of the liver. Their*serum did not give a positive formol-gel test, butthe serum of our case (Fig. 4.H) gave the stronglypositive reaction usual in kala azar sera.
Striking changes are found in some diseases ofobscure origin which may be regarded as second-ary responses to some chronic infection. In sar-coidosis, proved by biopsy, Fisher and Davis (1942)found that the albumin was low in active casesand the y-globulin over 2.0 and might rise to3.8 g. /100 ml. In the 11 cases studied by Seibertet al., included in Table X, the albumin was low.The a-globulins were, at most, little raised in sar-coidosis whereas the average y-globulin washigher than in active, far advanced pulmonarytuberculosis. The small and scattered sarcoidlesions found in the liver (Scadding and Sherlock,1948) are not likely to affect the electrophoreticpattern. Seibert et al. (1947) suggest that the dif-ference in electrophoretic pattern may be of valuein diagnosis. But it is rather doubtful whetherthe pattern would be of much use owing to thewide spread of the values found in the two diseases.
In two sera from cases of lupus erythematosus,in which the total globulin was high, C-bburn andMoore (1943) found that 22 and 46% of theprotein was y-globulin.' The albumin was lowand the a- and 8-globulins normal. They foundthat the y-globulin might still be high after clini-cal recovery. This may be due to damage to theliver as there may be some infiltration andincrease of fibrous tissue in the liver.
Lovgren (1945) reported the distribution in theserum of patients with rheumatoid arthritis. Insome of these the y-globulin was over 33% of thetotal protein. In most of the cases the albuminwas little reduced and the a- and fl-globulins wereqormal. Malmros and Blix (1946) included seven
cases diagnosed as rheumatoid arthritis. In threeof these the y-globulin was 3.0, 3.1, and 3.1 g./100 ml. respectively. One of these patient's hadacute myocarditis and pleurisy, and a second anendocrine disorder. Dole and Rothbard (1947)followed up a case for eight months during whichtime the patient's condition improved considerably.The albumin was moderately reduced. Absoluteconcentrations of al-, a"-, and y-globulins wereraised compared with Dole's normals (y-globulinto about 1.5 g. /100 ml.), but the albumin roseand the a2-globulin fell to normal at the end ofeight months. The al-globuln and -y-globulinremained high. In one serum, which we examinedbecause it gave a strong thymol-turbidity reaction,the concentrations were albumin 3.2, a-globulin1.0, fl-globulin 1.1, and y-globulin 3.9 g./100 ml.Malmros and Blix (1946) examined the sera of
nine cases of erythema nodosum. Two wereclassed as tuberculous and the remaining seven asrheumatic. The albumin was low in all. In fourcases the y-globulirh was over 2, and in seventhe a-globulin was over 0.7 g./100 ml.; maximumfigures, y-globulin 4.0,and a-globulin 1.3 g./ 100 ml.The occurrence of an increase of a-globulin in
the early stages of acute infections and in themore active stages of chronic infections suggeststhat this increase is a response to the destructionof tissue. Cuthbertson and Tompsett (1935) foundthat the serum globulin rose to high levels afterfractures of bones of the leg. The highest figureswere found in the first week after the injury. Atthe same time the albumin fell. In one casemanipulation under an anaesthetic was followedby an increase of the globulin to 9 g./ 100 ml.Shedlovsky and Scudder (1942) found no increaseof globulin in the serum of one patient threedays after his tibia and fibula were broken. Inanother case the total globulin was 3.0 g./100 ml.two days after fracture of a femur, and both a-and fl-globulin were moderately high. On theother hand Chambers and Gjessing (1946) foundthat the al- and a,-globulin in the serum of adog were doubled in the first week after one tibiahad been broken under an anaesthetic. Burns,subcutaneous injection of turpentine to produce asterile abscess, and injection of bis (f8-chloroethyl)sulphide (Gjessing -and Chambers, 1946) were allfollowed by an increase of al- and a2-globulin.Perlmann, Glenn, and Kauffman (1943) did notfind a significant change in the a-globulin in theserum of calves that had been severely burned.We (May and Hoch, 1949) examined the serum ofa patient before and after his spleen was irradiated.Although the size of the spleen was very much
1771

J. R. MARRACK AND H. HOCH
reduced in a few days, the serum proteins did notchange except for a slight rise of the a-globulin(Fig. 4). Peterman, Karnofsky, and Hogness(1949) found no significant change in the electro-phoretic patterns of the serum of patients withHodgkin's disease and leukaemia after treatmentwith nitrogen mustards, methyl-bis (/8-chloroethyl)amine hydrochloride and tris (,B-chloroethyl)amine hydrochloride, although these reagentsdestroy lymphoid and haematopoietic tissue and,occasionally, tumour tissue. In view of thechanges found in various other diseases not neces-sarily associated with destruction of tissue, it isdoubtful whether an increase of a-globulin canbe regarded as evidence of any special process.
Protein Patterns by Precipitation Methods.-The maximum amount by which concentrationsof the a1- and a2-globulins increase are of theorder of 0.4 and 0.8 g./100 ml., and some of thea-globulin is left in solution with albumin.Increase of the a-globulins, alone, will not producea great increase i the total globulin. Since thealbumin concentration is almost always reduced,increase of the a-globulin, alone, will not pro-duce an increase of the total protein. An increaseof globulin is mainly due to increase of y-globulin.A great increase of globulin and an increase oftotal proteins are evidence of an increase of y-globulin, with or without increase of a-globulin.
Although the albumin estimated by the usualprecipitation methods, such as by half saturationwith ammonium sulphate or by Howe's method,exceeds that estimated by electrophoresis, the twoestimates usually vary in the same direction. ThusDole (1944) found that the albumin/globulin ratiofound by Howe's method was about 1.5 timesthat found by electrophoresis both in normal seraand in sera from ill persons, including that of thetyphus fever patient he studied.
It is usually found that the total globulin, esti-mated by salting out methods, rises during acuteinfection. Malmros and Blix (1946) used bothsalting out and electrophoresis in 25 sera ofpatients with rheumatic fever and tonsillitis. Infive cases the increase shown by electrophoresiswas missed by the salting out method. Moen andReimann (1933) found that the globulin (Howe'smethod) of the serum of pneumonia patients mightbe appreciably raised- on the second day of fever;but the highest figure found was on the tenth dayof the disease. The albunin fell in'all cases, sothat the total protein was low. Oh the thirtiethand forty-eighth days, during convalescence, theglobulin might still be over 3 g. / 100 ml. and the
albumin still low. Stacey (1947) also found thispersistence of an increase in the globulin after theacute stage. The globulin in the serum of a patientwho had had an appendix abscess was still highafter the appendix had been drained for 20 days.As a patient's clinical condition improves, the
albumin rises and the globulin falls. Thus thealbumin rose from 3.9 to 5.6 and the globulin fellfrom 7.2 to 2.6 g. /100 ml. in the serum of atuberculous patient as the condition improved,although, in anoher case, the albumin fell from5.4 to 5.1, with a coincident fall of globulin from3.4 to 2.6 when the patient improved and gained15.5 lb. in weight (Eichelberger and McCluskey,1927). In rheumatoid arthritis Davis (1935-6)found that the globulin (Howe's method) fell from3.9 to 3.0 with improvement in a severe case androse again to 4.0 as the patient relapsed, and inanother less severe case fell from 3.1 to 2.0 whenthe patient recovered. However, in another severecase the globulin, as well as the albumin, rosealthough the patient felt better and had gained7 lb. in weight,When patients with lymphogranuloma venereum
were treated with sulphanilamide the albumin roseand the globulin fell thus in one case the con-centrations of proteins before and on the seventhand 212th days after treatment began were:Albumin, 1.86, 3.37, 3.75, and globulin, 5.87,4.28, 2.60 g./100 ml. (Schamberg, 1941).
In those conditions in which the increase ofy-globulin is highest, namely, typhus fever (Tierneyand Yeomans, 1946), lymphogranuloma venereum(Schamberg, 1941), leprosy (Frazier and Wu, 1925),sarcoidosis (Fisher and Davies, 1942), kala azar(Ling, 1930), and some cases of rheumatoidarthritis (Davis, 1935-6), the total globulin,measured by salting out methods is very muchincreased. In typhus fever the globulin maybe high on the fifth day after onset, before therash appears and before the Weil-Felix reactionbecomes positive (Tierney and Yeomans, 1946);it rises to high levels (over 4 g. / 100 ml.) andremains high for five weeks after the tempera-ture has fallen. These changes are comparableto the changes of -y-globulin found by Dole,Yeomans, and Tierney (1947).The y-globulin is mainly precipifated in Howe's
euglobulin and pseudo-globulin I; these two frac-tions may be taken together. The a-globulins areincluded in the Howe's pseudo-globulin HI andalbumin fractions. (The normal distribution foundby Howe's method is given in Table I.) Moenand Reimann (1933) found that the pseudo-
178

SERUM PROTEINS
globulin 11 was raised in some cases of pneumoniain early stages, but the eu- + pseudo-globulin Iwas also raised and this fraction alone was raisedin the later stages. In the subacute and chronicinfective diseases the increase is almost alwaysconfined to the eu- + pseudo-globulin I fraction.Gutman and colleagues (1941) present a table thatincludes cases of lymphogranuloma venereum,sarcoid, lupus erythematosus, leprosy, and tuber-culous adenitis in which this fraction was increased.Other examples are kala azar (Ling, 1930), andlupus erythematosus (Coburn and Moore, 1943).In rheumatoid arthritis the main change is in thisfraction although the pseudo-globulin II may alsobe increased to an average level of 0.68 g./ 100 ml.in severe cases (Davis, 1935-6).
Other Protein Changes.-A protein, the C-reactive protein, has been detected in the serumof patients suffering from acute infectious diseases,and has the characteristic of forming a precipitatewith the somatic C-polysaccharide of pneumo-cocci. The reaction differs from an ordinary pre-cipitin reaction in that no precipitate is formedunless calcium ions are present in the solution(Abernethy and Avery, 1941). The presence ofthis protein in the serum is not characteristic ofany particular infection. Strong reactions withthe polysaccharide have been found in the serumof patients suffering from lobar pneumonia, otherinfections of the respiratory tract, miscellaneouspurulent infections, septicaemia, Still's disease,typhoid fever, coli pyelitis, rheumatic fever, andtuberculosis (Ash, 1933). This protein was foundin the sera of patients with rheumatoid arthritisby Dole, and Rothbard (1947) and Wallis (1946)have reported finding it in other cases. Thereactions that Wallis found were weak. Weexamined a number of sera and found only onethat reacted strongly with the polysaccharide. TheC-reactive protein is precipitated by ammoniumsulphate between 50 and 75 saturation; it appearsto be an al-globulin (Perlmann et al., 1943). Ithas been crystallized (McCarty, 1947). As anantigen it is different from other serum proteins.The amount of precipitate formed on mixing seraof patients with antisera to the C-reactive protein,suggests that the amount in these sera may be ofthe order of 0.1 g./100 ml. It contributes towardsthe increase of al-globulin found in acute infec-tions, just as the true antibodies contribute to theincrease of the y-globulin.
Blix, Tiselius, and Svensson (1941) noted thelarge amount of polysaccharide in the protein frac-tions of the serum of a patient with pneumonia,
Table V. The largest amount was in the a-globu-lin. Seibert et al. in their analysis on the sera ofpatients with tuberculosis and . carcinoma foundthat the polysaccharide content of the serum rosewith the a2-globulin and was not correlated withy-globulin and albumin.
Cartwright and Wintrobe (1949) have found thatthe iron-binding capacity of serum, which is ameasure of the concentration of the metal-binding protein, may be low or very low in theserum of patients suffering from infections andrise rapidly on recovery. The iron-binding capa-city of the serum falls on the day of injection oftyphoid vaccine and rises again on the followingday. This reduction of iron-binding capacity isnot the cause of the low concentration of serumiron and the anaemia of infections, as the metal-binding protein was less saturated than it normallyis.IEffects of Deficiency of Protein.-Ancel Keys
et al. (1946) found that the average serumproteins of a group of young men who livedfor months on a diet that supplied little proteinand insufficient calories fell by only 0.73 g./ 100 ml.The electrophoretic patterns were practically un-changed. These subjects lost much of their bodyprotein and became oedematous, with a greatincrease in the extracellular water. Their condi-tion resembled that found in famine oedema. Ina large number of cases of famine oedema theserum albumin is much reduced.* However, inrecent investigations, for example, Sinclair (1948) ithas been found that the serum albumin is aboutnormal in a large proportion of cases of famineoedema. It seems that oedema may be due tosome additional cause as well as to the reductionof the serum albumin, and that some other factorbesides loss of body proteins is involved when thealbumin in the serum is reduced. Rytand (1942)studied a patient who had had recurrent oedemawith low serum proteins for some years. Therewere no albumin or casts in the urine. The serumprotein varied between 3.0 and 4.7 g. / 100 ml.The electrophoretic pattern was: albumin 2.83,a-globulin 0.27, ,-globulin 0.70, and y-globulin0.69 g./ 100 ml. In this case the diet was adequateand the defects seems to have lain in the synthesisof serum protein. In another case of recurrentoedema (Schick and Greenbaum, 1945), when theserum atbumin was 3.3 and the globulin 0.8 g./100 ml., no peak corresponding to y-globulin was
*A list of investigations is given in Recommendationswith regard to Methods of Investigation of Nutrition,(1945), issued by the Nutrition Society.
179

-180
seen. In this-case the Schick and Dick tests werenegative, so that the serum contained some anti-bodies, but the association- of antibodies with y-globulin was shown, as no agglutinins to typhoidbacilli and whooping-cough antibodies were formedin response to injection of vaccines. In a thirdcase, a girl whose diet had been poor, the albuminwas 2.0 and the globulin 1.1 g./100 ml. when thepatient was first seen (Krebs, 1946). Later theelectrophoretic pattern was: albumin 1.81, a-globulin 0.49, ,-globulin 0.46, and y-globulin 0.16.After two injections of typhoid vaccine noagglutinins were detected. The patient was givena high protein diet, and the albumin and y-globulinrose to 2.54 and 0.68 g./100 ml. Deficiency ofprotein may therefore in some cases lead to reduc-tion of -y-globulin as -well as to reduction ofalbumin. For other examples see cases F and G(Fig. 4).The great reduction of protein in the serum of
patients with kidney disease and gross oedemawas noted by Bright. Since Epstein (1917) attri-buted the gross oedema of nephrosis to reductionof the osmotic pressure of the serum proteins avery large number of observations have beenmade.. lThese have confirmed the close associa-tion of gross oedema with reduction of the serumalbumin, although other factors are certainlyinvolved in causing oedema. The electrophoreticpatterns found will be discussed in the section'dealing with lipaemia. It has been suggested thatthe serum proteins in this condition may be abnor-mal. These apparent abnormalities are due to theuse of impure fractions for study. Alving andMirsky (1936) found in the plasma of nephroticpatients that the albumin fraction, that is, theprotein not precipitated by half saturation withammonium sulphate, had an abnormally low con-tent of cystine. However, Brand et al. (quotedby Edsall, 1947) have found that certain a-globulinscontain relatively little cystine. a-globulin makesup a relatively large proportion of the so-calledalbumin fraction, when the albumin concentrationis low, and this ca-globulin accounts for these lowcystine contents. The results obtained by Goettschand Reeves (1936) and Goettsch and Lyttle (1940)using immunological methods can be explained bya quantitative change in the serum protein frac-tions. The preparations, used by Bourdillon (1939)for estimating the osmotic pressure of the albuminin the serum of nephrotic patients, certainly con-tained globulin which accounts for the low osmoticpressures; Other investigations (Hewitt, 1927,1929; Widdowson, 1933) have detected no differ-ence between the albumin of serum and urine.
Deficiency of protein is probably one of the fac-tors that cause reduction- of the concentration ofserum proteins and changes in the electrophoreticpatterns in a number of diseases. Seibert et al.(1947) found that the mean concentration of theserum albumin of 23 patients with carcinoma was2.8 g./100 ml. The a2-globulin was moderately-raised; this might be in response to destruc-tion of tissue. If cases which had metastases inthe liver with jaundice were excluded, the meany-globulin was- low. In most cases the y-globulinpeak was much flattened. Low serum albuminwas found in two out of three cases of carcinoma(without secondaries in the liver) by Luetscher(1941), and in ore of these the y-globulin was low.The albumin is particularly low in the serum of
patients with carcinoma of the stomach (Abelset al., 1942). Peterman and Hogness (1948) exam-ining the serum of 25 patients with carcinoma ofthe stomach found that the albumin was under3 g./100 ml. in all of them. The al-globulin wasin the upper range or above the range of normalfound by these authors, but little raised as com-pared with the normals of Seibert et al. Thea2-globulin was slightly raised, but the y-globulinwas not low either in cases without or in caseswith metastases. In these cases the a1-globulinfell on treatment with protein hydrolysates, butthe albumin did nor rise although the nitrogenbalance was positive. Even after the primarytumours had been removed and the patients, withno obvious metastases, had eaten a normal dietfor two months, the serum albumin was still under3.6 g. /100 ml. Peterman and Hogness also foundthat the serum albumin was low in six cases ofgastric ulcer.
Lipaemi.-The proteins to which lipids areattached are in the a- and 8-globulins. It is there-fore to be expected that when the amount of lipidin the serum is raised the a- and f)-globulins willbe raised. Lewis, Schneider, and McCullagh(1944) found the a-globulin high in untreateddiabetes mellitus, a condition in which the lipidsof the plasma are high, but on treatment the,8-globulin fell to normal. Longsworth et al.(1945) point out that the sum of a- and -
globulin is higher than normal in the plasma ofwomen immediately after childbirth and that inthe plasma of blood taken from the umbilical cordthis sum is lower than normal; the concentrationof total lipids of plasma at the end of pregnancyis nearly 150% and in cord blood only about 30%of the concentration in the plasma of normaladults. In hypothyroidism the cholesterol in- the
J. R. Mi j5r.' -H6rn

SERUM PROTEINS
plasma is increased and the /3-globulin is high(Lewis and McCullagh, 1944).
In their early studies Longswofth et al. (1939)found that not only was the concentration ofalbumin in serum in nephrosis even lower thanhad been found by salt fractionation, but also thatthe concentrations of a- and -,8-globulins wereincreased. These observations have been con-firmed by Longsworth and McInnes (1940),Luetscher (1940), and Malmros and Blix (1946).Thorn et al. (1945) made their electrophoresis runsat pH 8.6 and found that the a,-globulin andy-globulin were low. The increase of absoluteconcentrations of a2- and ,8-globulin are lessstriking than those of the relative concentrations.Thus in the serum of a patient with gross oedema
may be little raised although the total pro-tein is low and the concentration of cholesterolin the serum is moderately raised. These patientsare continually losing protein in the urine inamounts up to 20 g. and more daily. If they losetheir oedema they are found to be much wasted.It is reasonable to suppose that the changes foundin the serum are a combination of changes dueto loss of protein and to lipaemia, and are not achange peculiar to nephrosis. Extreme changesmay be found as soon as one month after theappearance of oedema, as in case W.H. ofTable XI.As abnormally large amounts of lipids are asso-
ciated with protein in the complexes that give riseto the a- and /3-peaks, the globulin is overestimated
TABLE XIRELATION BETVWEEN "EDEMA, CHOLESTEROL, AND PROTEIN COMPONENTS (g.1100 ml.) IN NEPi-IR9r[c PLk3.M k
(THORN et al., 1945)
Chol- Total Albumin (XI a2 ( 9Case Oedema esterol ProteinCase Qedema (g.Il00 (g./l00 R* At R Aml.) ml.) A R A R A R A R A
J.R. ++++ 1.10 2.8 7 0.19 4 0.11 42 1.18 28 0.78 16 0.45 3 0.08L.I. +++ 1.17 3.8 17 0.65 5 0.19 36 1.37 22 0.84 16 0.62 4 0.15W.H. +++ 0.755 4.1 17 0.70 5 0.205 21 0.86 38 1.56 15 0.62 4 0.16P.S. +++ 1.00 5.3 26 1.38 8 0.42 22 1.16 30 1.59 9 0.47 5 0.26K.N. + 0.43 5.6 37 2.06 6 0.33 15 0.84 22 1.23 12 0.67 8 0.45
R AE.B. + 0.88 4.1 46 1.88 4 0.16 34 1.4 13 0.53 3 0.12
R.v.Serum ± 0.34 5.6 32 1.79 5 0.28 20 1.12 23 1.28 20 1.12
R Relative concentration as percentage of total protein.
the a2-globulin made up 42% and the /8-globulin28% of the total protein, but the absolute con-centration of a-globulin was only twice thenormal and that of /3-globulin was under theaverage normal.The concentrations of cholesterol, phosphatides,
and neutral fat in the serum are much increasedin nephrosis (see case illustrated in Fig. 4J.),but the concentration of any lipids in sera whichhave been examined by electrophoresis have rarelybeen reported. The relation to concentration ofcholesterol is well illustrated by the data given inTable XI. Longsworth and Maclnnes (1940) andlater Blix and Pedersen (1947) have shown thatthe a- and /3-globulins of nephrotic sera are muchreduced by extraction of the lipids; extraction ofnormal sera has little effect. Longsworth andMcInnes found that the concentration of /8-globu-lin in a nephrotic serum, after extraction withether, was below the normal average. As the caseillustrated in Fig. 4A shows, the a- and /3-globulin
At Concentration in g./100 ml.
when concentrations are calculated from the elec-trophoretic pattern, and, in consequence, thealbumin is underestimated. Also albumin makesup an abnormally low proportion of the proteinleft in solution after precipitation by half-satura-tion with ammonium sulphate or by Howe'smethod. The discrepancy -between the amountsof albumin found by electrophoresis and by saltfractionation is much greater in nephrotic serathan in other sera. However, neither albumin isthe true albumin, in the sense of being free fromassociated globulin or lipid.
In the urine the albumin, as it has the lowestmolecular weight, makes up a very much largerproportion of the total protein than in the serum.However, Luetscher (1940) found a considerableamount of y-globulin in the urine of a patient withamyloid disease. From the figures of Longsworthand MacInnes (1940) it appears that the concen-tration of albumin in the urine is higher than inthe plasma; this is probably due to underestima-
181

.J. R. MARRACK AND H. HOCH
tion of the concentration of albumin in theplasma.
In other-types of nephritis, not characterized bygross oedema and lipaemia, the serum proteinsdiffer little- from normal, the only change being areduction of albumin.
Liver Disease.-The change of serum proteinscharacteristic of disease of the liver parenchyma isan increase of the y-globulin. The albumin isieduced, sometimes to very low levels, and theother fractions are usually little changed. Thesechanges, first detected by Luetscher (1940) havebeen reported by numerous observers (for example,Gray and Barron, 1943 ; Thorn, Armstrong, andDavenport, 1946) since. The relative concentra-tion of y-globulin is always raised; the absoluteconcentration is usually near 2 g./100 ml., andmay rise to 4 g./100 ml., but is sometimes littleabove normal (Thorn, Armstrong, and Davenport,1946). Sherlock (1946) examined cirrhotic liversby biopsy; she classed as " latent" those in whichcell damage was minimal and bands of maturefibrous tissue disrupted the normal architectureand as "active" those with retrogressive paren-chymatous changes and regeneration of survivingcells. The average concentrations of serum albuminand globulin in the active cases were 2.8 and4.0 g. /100 ml., and in the latent cases 4.2 and2.5 g./100 ml. Cases in which the y-globulin islittle raised are probably latent.With local lesions of the liver, such as metastases
of carcinoma, the y-globulin may be normal or
may be raised to 2.4 g. /100 ml. (Gray and Barron,1943). Obstruction of the bile ducts, unless asso-ciated with metastases in the liver or a secondaryhepatitis, causes no significant change of serum
proteins, or a rise of /8-globulin due to increase ofcholesterol in the serum.
In'infective hepatitis Martin (1946) found thatthe relative concentration of y-globulin was
increased. The relative and absolute concentra-tions of albumin were moderately reduced in theearly stages. The increases of absolute concen-trations of y-globulin were slight in five of thesix cases in which absolute concentrations couldbe calculated. In the sixth the concentration was1.76 g./ l00- ml. on the twenty-third day from theonset of symptoms. In this case excess of brom-sulphthalein wvs retained 57 days after the onsetand the y-globulin was then 1.94 g. / 100 ml. In sixcases of acute hepatitis (one arsenical jaundice andfive catarrhal jaundice) Gray and Barron (1943)found y-globulin concentrations of 2.85 and 3.0g. / 100 ml. in two cases; in three others also they-globulin was above the normal range. The
,8-globulin was over 2 g. /100 ml. in two cases(including the arsenical jaundice) but was notraised in the other cases.Thorn, Armstrong, and Davenport (1946), using
Howe's method, did not find the usual discrepancybetween the amount of albumin estimated by saltfractionation and by electrophQresis. However,Moore et al. (1941) found as big a discrepancy inthe serum of a hepatitis patient as in normal serum.In -the serum of subjects intentionally infected withhepatitis, albumin estimated by these methodsfell to a minimum and globulin rose to a maxi-mum in the second week after the onset of symp-toms. The'albumin returned to its original levelat the end of a month, but the globulin was stillraised at the end of 60 days (Havens and Williams,1948). The increase in the globulin is mainlyaccounted for by a rise in Milne's fraction whichcorresponds to y-globulin. As the albuminreturned to normal while the globulin remainedhigh the total serum proteins were increased atfive to six weeks after onset. Rennie (1945) foundthat the globulin might continue to rise for somemonths after the onset of acute hepatitis. Inchronic hepatitis and cirrhosis of the liver the ratioof albumin to globulin is correlated with activityof the'Kupffer cells and damage to cells of theliver parenchyma (Franklin et al., 1948). Post andPatek (1942) found that patients with liver diseasewere more likely to recover when their serumalbumin was above 3.5 g./ 100 ml. Higgins andhis colleagues (1944) found that 20 out of 24patients who had recovered from hepatitis hadserum albumin over 3 g./100 ml. Sherlock (1946)using biopsy studies considered that- the serumalbumin fell and globulin rose as the severity ofthe liver lesions of patients with acute hepatitisincreased. She also found that albumin fell withthe duration of obstructive jaundice and was notmore than 3 g./ 100 ml., in 60% of cases, whereasthe globulin changed but little,Myelomatosis.-Bence-Jones protein, which is
excreted in the urine by about half the patientssuffering from multiple myeloma, has a molecularweight of 37,000 (Svedberg and Pedersen, 1940);this is just over half the molecular weight of serumalbumin. Its mobility in phosphate buffer (pH7.4, ionic strength 0.2) ranges from 1.4 'to 3.1 ;'these values lie between the mobilities of /8- andy-globulin or are equal to that of ,B-globulin.-Gutman et al. (1941) found that in most cases pre-cipitation by ammonium sulphate began at 40%and was complete at 50 or a little'over 50% satura-tion. Most of the Bence-Jones protein was notusually precipitated from urine by 21.5% sodium
182

SERUM PROTEINS
sulphate unless the urine was made strongly acid.Antigenically, Bence-Jones proteins differ from.normal serum proteins. Two types, differing anti-genically, have been distinguished, but may occurtogether in the same urine (Hektoen and Welker,1940).On heating at neutral or slightly acid reaction
Bence-Jones proteins coagulate at 45 to 580 C. Inmany cases the coagulum redissolves on boiling.The resolution is promoted by the presence of salt,salts of divalent kations being more effective thanthose of univalent kations. The protein is repre-cipitated on cooling. In other cases the coagulumdoes not redissolve on boiling but forms a densecurd which floats in the froth on the surface.Gutman and his colleagues (Gutman et al.,
1941; Moore et al., 1943; Gutman, 1948) havemade a thorough study of the electrophoretic com-ponents of the serum of myelomatosis patients, andof the relation of these components to the Bence-Jones protein in the urine and the fractions foundby Howe's method. They classed the sera in threegroups: (1) Sera in which protein of the mobilityof y-globulin is increased and no Bence-Jones pro-tein is detected by electrophoresis or ultracentri-fugation (cf. Fig. 4D). (2) Sera in which variousanomalous patterns are formed, usually with extracomponents of mobility equal to that of f-globulinor lying between those of ,B- and y-globulin; insome cases the extra component is Bence-Jones protein. (3) Sera with apparently normalpatterns. In groups (1) and (2) the concentrationof albumin is low and often very low. Moore,Kabat, and Gutman (1943) found that the a-globulin was increased in two cases. The serastudied by Longsworth, Shedlovsky, and McInnes(1939), Kekwick (1940), Blackman et al. (1944),Malmros and Blix (1946) and Martin (1947) fitinto these groups. In one of the cases of Malmrosand Blix the serum pattern was essentially normalat the first examination.; a year later the albuminwas low and both f8- and y-globulin slightlyincreased. In one case studied by Moore, Kabat,and Gutman (1943) a very large fl-compopent wasfound on one occasion, and on another a com-ponent of mobility between those of ,B- and y-globulin. Gutman et al. (1941) showed that thepatterns found in Groups (1) and (2) could bereproduced by adding urinary Bence-Jones pro-tein to normal serum. However, in most of theinvestigations made with the ultracentrifuge(McFarlane, 1935; Jersild and Pedersen, 1938;von Bonsdorff et al., 1938; Kekwick, 1943) noprotein with the low sedimentation constant ofBence-Jones protein has been found in serum, but
Packalen (1939) found a protein of low molecularweight which crystallized. Moore, Kabat, andGutman (1943) found components with low sedi-mentation constants in two sera; in one themobility of the abnormal component was equal tothat of f8-globulin and in the other lay betweenthose of ,B- and y-globulin. These components,therefore, had the physical properties of Bence-Jones proteins. However, in two other sera inwhich the abnormal component had a mobilitybetween those of f8- and y-globulin their sedimen-tation constants were equal to that of normal y-globulin. In one of Kekwick's (1940) cases threeabnormal components were found which had sedi-mentation constants above that of the bulk of thenormal globulin. Abnormal components are there-fore not usually identical with Bence-Jones pro-tein. In a case of Moore et al., in which theabnormal component had a low sedimentationconstant and mobility between those of f8- and-y-globulin, this component was antigenically iden-tical with the Bence-Jones protein -of the urine.In another serum which contained a large amountof. protein resembling normal y-globulin inmobility and sedimentation constant, a smallamount of Bence-Jones protein was detectedimmunologically.
Bence-Jones protein may be present in or absentfrom the urine in cases of all three groups. Itwas found in the urine in two of the three casesof Moore et al., in which its presence in the serumwas established. Malmros and Blix (1946) foundthat on one occasion a patient's urine containedonly traces of protein; a year later it contained1.5% of Bence-Jones protein. On both occasions-the serum contained a large amount of proteinof mobility equal to that of fl-globulin.The same type of electrophoretic pattern
may be found in the serum of patients withsingle tumours, multiple tumours, or generalized
. osteoporosis.The total protein concentration in serum may
be very high. In just over half of the 43 casesquoted by Gutman (1948) the concentration wasover 8 g./100 ml. and in five it lay between 12 and13.7 g./100 ml. In infective conditions, as alreadynoted, any increase of the total globulin is usuallyaccounted for by an increase of both Howe'seuglobulin and pseudoglobulin I fractions. Inmyelomatosis the euglobulin fraction may remainlow although the globulin is much increased; thismay be found with sera of Groups (1) and (2). Onthe other hand the euglobulin fraction may bemuch increased in sera of both these groups. AsBence-Jones protein is but partially precipitated
183

1841J.R.- MA*AN-II - R.i Ch- 4 :.
by 21.5% sodium sulphate, the concentration ofalbumin in sera that contain Bence-Jones protein,when estimated by Howes' method, may be muchhigher than that found by electrophoresis.
Part of the-calcium in serum is combined in anindiffusible form with protein. This fraction varieswith the concentration of albumin. As globulinbinds relatively little calcium, the concentrationof bound calcium in the serum of myeloma patientsmay be little increased (Gutman and Gutman,1937) although the total protein is high. In somecases high concentrations of calcium are foundin the serum. Laake (1949) ascribes these highconcentrations to the mobilization of calcium fromthe bones.
Miscellaneous Dieases.-Various diseases thatdo not fall into the preceding groups have beenstudied. These include leukaemia and aplasticanaemia (Longsworth et al., 1939); leukaemia,lymphosarcoma and Hodgkin's disease. (Peterman,Karnosky, and Hogness (1948); hyper- andhypo-thyroidism (Lewis and McCullagh, 1944);Addison's disease (NfcCullagh and Lewis, 1945);Cushing's syndrome and acromegaly (Lewis andMcCullagh, 1947). The albumin was usually lowand the a-globulin slightly raised, the degree ofchange varying with the severity of the disease;with improvement of the condition the patternreverted towards normal. In Addison's disease,the reduction of albumin was not in keeping withthe severity of the disease. In one severe, untreatedcase the concentration was 4 g./100 ml., but in amoderate case it was 2.66, and in a mild case3.3 g./100 ml. In eight cases of Cushing's syn-drome the y-globulin was low (Lewis andMcCullagh, 1947). The increase of y-globulinon treatment (for example, from 0.53 to l.22 g./100 ml.) was more striking than the increase ofalbumin.
Other Abnormal Proteins.-The abnormal com-ponent in the serum of one of the cases in theseries of Moore, Kabat, and Gutman (1943) hada mobility between those- of ,B- and y-globulinbut was not Bence-Jones protein, and was studiedfurther by Shapiro, Ross, and Moore (1943). Itwas. a viscous protein with a molecular weight ofabout 160,000.
Lerner and Watson (1947) proposed that thename " cryoglobulin " should be used for a groupof proteins that have the property of precipitatingor gelifying from cooled serum. They quote fourexamples described by other investigators. Shapiroand Wertheimer-(1946) described another examplein which a crystalline protein was separated from
the- serum of a patient with periarteritis nodosa.Four of the patients in the series quoted hadmultiple myeloma.
Lerner, Barnum, and Watson (1947) examinedsera for the presence of cryoglobulin from patientswith a number of diseases. They found thatsmall precipitates, of the order of 10-20 mg./100 ml., formed on cooling the sera of patientswith lymphatic leukaemia, congenital hypopro-thrombinaemia, bronchopneumonia, bronchiecta-sis, rheumatic heart disease, and subacute bacterialendocarditis. About 800 mg. of cryoglobulinprecipitated from- 100 ml. of the serum of a patientwith cardiovascular renal disease. This protein(Lerner and Greenberg, 1946) was electrophoretic-ally homogeneous at pH 4.7; it was soluble at2° C. in distilled water but almost completelyinsoluble in 0.5% solution of NaCl; its molecularweight was 190,000.
In McFarlane's (1935) studies of pathologicalsera there is no evidence of the presence of abnor-mal proteins except in those derived from patientswith multiple myeloma. However, the componentsseemed to be less homogeneous than those ofnormal sera.Peterman and Hogness (1948b) examined sera
in acetate buffer at pH 4.0. Most of the serumprotein is positively charged at this pH, but theydetected a protein which was negatively chargedand had therefore a low isolectric point. Thesera from patients with carcinoma of the stomach,carcinoma of the lung, leukaemia, and Hodgkin'sdisease contained more of this protein than wasfound in the sera of normal persons or patientswith miscellaneous cancer.
In their second account of the copper-sulphatemethod of estimating the specific gravity Phillips,Van Slyke, et al. (1945) reported that the correctformula for calculating protein concentration (P)from specific gravity (G) should be
P=377 (Gp-1.0070)The values of P calculated with this formula areclose to those calculated with the formula
P=364 (Gp-1.0060)we recommended (Hoch and Marrack, 1945a),when tthe specific gravity is of the order of thatfound with nformal sera. Phillips et al. foundthat comparisons of specific gravities vith proteinconcentrations in sera from miscellaneous hospitlpatients measured by macro-Kjeldahl estimates givea mean value of 360 instead of 377 for the con-stan,t. This would imply that the relation of thedensity of serum to the concentration of proteintherein was abnornml, owing either to the presenceof abnormal proteins or to abnormal relative pro-
194

SERUM PROTEINS
portions of the proteins. We found, however, thatthe values for the protein concentrations obtainedby specific gravity methods, using our formula,agreed with those calculated from the Kjeldahl-N(x6.25) to within 4% with the sera -of normalpeople, of those with malnutrition, and ofwomen before and after childbirth (Hoch andMarrack, 1945a, b). The results of further experi-ments with nephritic sera and sera of patients withother diseases, including infective hepatitis, cir-rhosis of the liver, coeliac disease, perniciousanaemia, and, albuminuria are shown in Fig. 5.
Nephritis otg./lOI mlM
8 1 NPN indicated ( ) --
(151)-{ when > 50 mg/100 ml.Og*I'00 mt. x
7 (85)-.. R
6
S
4
8
7
6-(121)-.o
(152)-_
0(59)*{ x
a,fi
o gradientx Cu SO,
S
those in Table XII. There is some disagreementabout the differences between the effects of frac-tions isolated from normal serum and from seraof patients with disease of the liver. Kabat et al.(1943) found that y-globulin separated at pH 7.4from normal and pathological sera (cirrhosis andhepatitis) did not differ in efficiency in floccula-ting either colloidal gold or cephalin-cholesterol.Moore et al. found both equally efficient in floccu-lating cephalin-cholesterol,and McLagan and Bunnfound that in hepatitis -y-globulin was the moreeffective. On the other hand, Moore et al. (1945)
ther Disc
/
R
3 4 s 6 7 5 3 4 5_ g/ lOO ml. by Kieldahl
FIG. 5.-Relation of concentration of protein, calculatedgravity, to the concentration calculated from the nipathological sera.
The errors ranged from +15.4 to -7.0% innephritis, but they were within ±3% in all theother cases. There is therefore no evidence of anabnormal relation between specific gravity andprotein concentration in these cases, and the sameformula is applicable both to normal and to path.o-logical sera.
VI. Flocculation ReactionsIn considering the relation of various aggrega-
tion and flocculation reactions to the fractions ofserum proteins it should be remembered that thesefractions, whether separated by precipitation withsalts or by electrophoresis, are not homogeneous,nor is their composition constant. The a-globulinof infectious conditions differs from that ofnephrosis; and the y-globulin of liver- diseasefrom that of myelomatosis. It is probable, how:ever, that fibrinogen does not vary.Most observers have found that electrophoretic-
ally isolated fractions produce effects similar to
ft
found that hepatitis albu-eases min separated at pH 7.4
was a less efficient inhibitorthan normal albumin of thecephalin - cholesterol reac-
_> tion. Kabat et al. found-that albumin did not signi-ficantly inhibit this reaction.The differences between the
7/ effects of albumin may bedue to differences in theamounts of some inhibiting
0 gradient constituent, other than albu-Cu SO. min, in the preparations.
Bernsohn andBorman (1947)found that a preparation ofalbumin which contains only
6 7 8 3% of a-globulin made bythe low - temperature - low -
ogmn theSpecific salt - low- dielectric - constantmethod did not inhibit thecolloidal gold reaction. It
is remarkable that Guttman et al. (1945) foundthat the albumin isolated from the serum, takenduring an attack of malaria, was more effective ininhibiting the cephalin-cholesterol reaction thanwas albumin isolated from serum taken before orafter the attack. Bernsohn and Borman agreedwith MacLagan and Bunn in finding that prepara-tions containing 8-globulin, without albumin,inhibited the colloidal gold. The effects of a- andfl-fractions on the cephalin-cholesterol reactionmay be due to their affinity for lipids.The thymol-turbidity and thymol-flocculation
reactions differ from the two other flocculationreactions in the importance of lipids. Phospho-lipids and cholesterol make up about one-third ofthe weight of the floccules formed with serum.The turbidity produced by isolated y-globulin withthe thymol reagent alone was very small. For thisreason cephalin was added to the reagent used inthe tests shown in Table XII. The main changeproduced in the electrophoretic patterns by floc-
A a I I
185
0
it]

J. R. MARRACK --AND H. H(XH
TABLE XIIEFFECT OF PROTEIN, SEPARATED ELETOPHORETICALLY AT pH 8.0, ON
(MACLAGAN AND BuNN, 1947)FLOCCULATION REACTIONS
Difference between ProteinsReaction Flocculator Inhibitor of Normal (N) and
Hepatitis (H) Sera
Thymol (cephalin) y-globulin Nornal albumin H y-globulin slightly moreturbidity effetive than N.
H albumin does notinhibit
Thymol (cephalin) H y-globulin Not tested N y globulin does notflocculation flocculate
Colloidal gold, pH y-globulin Albumin, H y-globulin more effective7.8 a- and ,-globulin than N.
Cephalin- y-globulin Albumin H y globulin much morecholesterol H (a + >)-globulin* effective than N.
N oc- and ( globulin donot flocculate
Takata-Ara H y-globulin H AlbuminH (ax+3)-globulin*
* Two fractions not separated.
culation with the thymol reagent is a reduction ofthe relative area of the ,8-globulin peak (Cohenand Thompson, 1947). It is probable that thisreduction is due to removal of lipid which con-tributes to the area of this peak. Kunkel andHoagland (1947) suggest that some -y-globulin mayform a light combination with lipid and that thisfraction migrates with ,8-globulin. We have con-firmed (Marrack, Johns, and Hoch, 1949) byimmunological methods that the bulk of the pro-tein in the floccules is y-globulin. The intensityof the turbidity depends on the amount of lipidin the serum. Popper -and colleagues (1949)demonstrated that absorption of a large meal offat increased the intensity considerably. Kunkeland Hoagland found that in patients with acutehepatitis the intensity of the reaction ran parallelto the alterations of serum lipids in the earlierstages and of the y-globulin during convalescence.The positive flocculations tests found in diseases
other than hepatitis and cirrhosis of the liver, forexample, malaria, glandular fever, rheumatoidarthritis, and heart failure (Carter and MacLagan,1946), are all probably due to an increase- ofy-globulin and a decrease of albumin, secondaryin some cases to damage to the liver. The seraof multiple myeloma patients do not give positivethymol turbidity reactions (Kinkel and Hoagland,1947). Other flocculation and precipitation reac-tions such as the cadmium-turbidity test (Wunderly
and Wuhrman, 1947) and the zinc-sulphate reac-tion of Kunkel (1947) depend on an increase ofy-globulin in serum. In the series of sera examinedby Malmros and Blix (1946) the -y-globulin wasover 2 g. /100 ml. when the formol-gel reactionwas positive.
Erythrocyte Sedimentation Rae.-Gray andMitchell (1942) studie'd the effects of electro-phoretically isolated fractions on the erythrocytesedimentation rate. Fibrinogen increased the ratemost, a- and ,B-globulin were less effective, andy-globulin least. Albumin delayed sedimentation.*These four factors therefore affect the E.S.R., evenif the efficiency of the globulin fractions does notchange with disease. The rate is not necessarilycorrelated with the concentration of any one com-ponent. Thus Shedlovsky and Scudder (1942)found that in infective conditions the E.S.R. wasmore closely correlated with the concentration ofa-globulin than it was with the concentration offibrinogen. In the series reported by Malmros andBlix (1946) the E.S.R. was high in some cases ofmultiple myeloma in which the only abnormalitieswere reduction of the albumin and increase ofy-globulin. -In these cases the y-globulin wasprobably abnormal.
*According to the latest report (Surgenor, Strong, et al.,1948) fibrinoge is the most effective protein, and thenext most effective a carbohydrate-rich a,-globufln, whichalso binds bilirubin.
186

SERUM PROTEINS
DiscussionThe changes found in the electrophoretic pat-
terns are not characteristic of any disease. Theoutstanding changes are reduction of albumin, anincrease of y-globulin or a moderate increase ofa-globulin. These are found in a variety of con-ditions. The increase in the relative areas of thea- and 8-globulin peaks in the patterns in nephro-sis appears to be secondary to an increase of thelipids of the serum, an increase that can be betterdetected by simpler means. The reduction ofy-globulin which may have a better claim to beregarded as specific of nephrosis is found in otherconditions associated with deficiency of protein.Owing to the wide spread of the concentrations
of the components of normal serum, a componentmay change considerably without passing beyondthe normal range. Such changes will not bedetected unless the patient's serum is examinedrepeatedly. The average change found in onedisease may be greater than the average foundin another, but in individual cases the differencemay be in the opposite direction; thus the highestconcentration of y-globulin found by Siebert et al.(1947) in tuberculosis was higher than any theyfound in sarcoidosis, in which high figures weremore common.The bulk fractions separated by electrophoresis
or by any other method are complex mixtures ofseveral small components. It cannot be expectedthat changes in these bulk fractions will measureor even detect changes in the various components.The maximum amount of an antibody found inhuman serum is about 1 mg./ml., and the standarddeviation of y-globulin, according to Siebert et al.(1947), is 2.2 mg./ml. It is only in sera of hyper-immunized animals that the amounts of antibodyrise to several mg./ml., and are enough to show inthe electrophoretic pattern, and when the antibodyis precipitated by antigen, an appreciable reduc-tion of a peak can be seen. Possibly the reduc-tion of 8-globulin which is often found in infec-tions is due to reduction of the metal-combiningprotein which normally makes up about one-quarter of this fraction.The plasma of patients with haemophilia appears
to lack the anti-haemophiliac globulin, but the
electrophoretic pattern is normal in spite of itsabsence (Lewis et al., 1946). The amounts ofother components are very small. The cholineesterase (Surgenor, Strong, et al., 1949), makes upabout 1% of the protein of fraction IV-6, whichis a sub-fraction of fraction IV-4 (Table IV).At present changes in the serum proteins charac-
teristic of certain diseases are detected by thespecific reactions of the antibody globulins thatappear in these diseases. It is probable that otherchanges characteristic of certain types of diseasewill be detected by the reactions of other com-ponents, such as the reaction of the metal-bindingprotein with iron or the precipitation of theC-reactive protein with the C-polysaccharide.Such reactions may be less specific than those ofantibodies but still be characteristic of a certaintype of disease. The amounts of the fractionsseparated by electrophoresis or by other meanswill serve more as a measure of severity than asevidence of the nature of an illness. The empiricalflocculation reactions, which appear to depend onquantitative as well as qualitative changes of theprotein fractions, take an intermediate position,and should, in time, be replaced by less empiricaltests.The gross changes of the concentrations of
albumin and y-globulin can be detected by saltingout methods. In liver disease the estimates ofalbumin usually agree with those found by electro-phoresis. In nephrosis the concentration ofalbumin calculated from the electrophoretic pat-tern has little better claim to be called the truealbumin than has the concentration obtained bysalt fractionation. It remains to be seen how wellthe results obtained by methods proposed byMilne (1947) and Kibrick and Blonstein (1948)agree with those derived from electrophoreficpatterns.Like the E.S.R., abnormalities of the electro-
phoretic pattern are a measure of the clinical stateof the patient rather than specific evidence ofdisease. The main interest of the study of abnor-malities of the electrophoretic components ofserum lies in the correlation of the degree ofchange to the clinical condition of the patient andin the investigation of the causes of these changes.
187

FIG. 4.-Electrophoretic patterns of (A) nephrosis, (B) cirrhosis of liver, (C) obstructive jaundice, (Dl, 1D2)multiple myeloma, (El, 2, 3) enlarged spleen (irradiated), (F) idiopathic hypoproteinaemia, (G) steatorrhea,(H) kala azar, and (J) nephrosis.
ELECTROPHORETIC ANALYSES OF SERA SHOWN IN FIG. 4
Serum Diluted Total Proti Albumin Globulin g./100 ml. (npH to g./100 ml. g./100 ml gI/0)ml.
A 8.0 1.15 4.3 1.9 (44.0) 0.7 (16.5) 11.2 (28.0) 0.5 (11.5)B 8.0 1.25 7.3 2.9 (40.0) 0.5 (17.0) I1.4 (19.0) 2.5 (34.0)C 8.0 1.4 7.0 3.1 (44.0) 0.7 (10.0) 1.2 (17.0) 2.0 (29.0)DI 8.6 1.4 7.6 3.3 (43.0) 0.3 (4.0) 0.7 (9.5) 0.8 (11.0) 12.5 (33.0)El ) f 5.8 2.95 (48.5) 0.6 (9.5) 0.90 (15.0) 0.95 (15.5) 0.70 (11.5)2 S 8.6 1.4 6.1 2.75 (47.5) 0.5 (9.0) 0.95 (16.0) 1.00 (17.0) 0.60 (10.5)3 J .1 2.60 (43.0) 0.75 (12.0) 1.20 (19.0) 0.95 (15.5) 0.60 (10.5)
F 8.6 1.4 4.4 2.1 (47.5) 0.4 (9.0) 0.7 (16.0) 0.9 (20.5) 0.3 (7.0)G 8.6 1.4 5.2 1.7(33.0) 0.7 (13.5) 1.1 (21.0) 0.7 (13.5) 1.1 (21.0)H 8.0 0.8 8.7 2.4 (27.5) 0.4 (4.5) 0.8 (9.0) 5.1 (59.0)J not analysed
A.-NEPHROSIS. History of oedema for 10 months. Blood pressure, 130/85; renal efficiency tests normal; plasmacholesterol, 0.33 g./100 ml. y- globulin low in spite of respiratory infection one month before sample taken.
B. CIRRHOSIS OF LiVER.-Jaundice; ascites; thymol turbidity 16 units.C. OBSTRUCTIVE JAUNDICE.-Carcinoma of pancreas; chronic hepatitis; thymol turbidity, 2.5 units; colloidal
gold, 0; cephalin-cholesterol, 0.

Lj~~ILAscending
A )-~1 2 -
arnkI
A Y a
Descending
DI
C)2
II.
L1S,~~~~~~~~~~~~~~~~r; y¾ L1 A
A
A
IS
A a1 2-l *S ElF 2 A
A
A XI 2, rJ "I C,E X> ;- AA a , 22. 7 E 2 7 v.1 A
D. MULTIPLE MYELOMA (1) serum, (2) urine.-X-ray examination showed multiple punched-out areas in bones.Thymol turbidity, 3 units; E.S.R. (Wintrobe), 18 mm./l hour. Urine contained a little albumin and muchBence-Jones protein which did not redissolve on boiling.
E. ENLARGED SPLEEN (irradiatei).-(l) Before irradiation; (2) one day after irradiation (see over).
.1
I

J. R. MARRACK AND H. HOCH
J
J..Si~~~~~~~~~
~~~
.'t't'S Ru~~~~~'J
I /.J\'v(A,~J
.V-
A
I I.
A~~~~~~~~~~~~~~~~~~~~~~~~~~~~~~~~~~~~~~~~
.A- V---rNJ 6
E. EiLAxGcw SPLEEN (irradiated).--() and (2) see p. 188; (3) six days after irradiation.F. IDEOPATHIC HYPOPROTEINAEMIA (? coeliac disease).G. STEATORRHEA.-Subject-very emaciated; voluminous fatty stools; serum calcium, 6.5 mg./100 ml.H. KALA AZAR.-Jaundice; thymol turbidity, 26 units.
190
A
nI
.
r\* It
=. I.fi, _.*AI
t,
I
i-r /_

SERUM PROTEINS
A OC2+PJ
FiG. 4
C+r
191
P+OCa A.
J. NEPHRos1s.-Subject had oedema since pregnancy 10 months previously. Gross osdema with effusions; bloodpressure, 180/100; blood urea, 42 mg./100 ml.; plasma c'iolesterol, 1.25 g./100 ml. Received two injectionsT.A.B. vaccine. Agglutinin titres, typhaid-H to 1/2560, typhaid-O to 1/14), although y-globulin low.
REFERENCESAbels, J. C., Rekers, P. E., Binkl-y, G. E., Pack, G. J., and Rhoads,
C. P. (1942). Ann. intern. Med., 16. 221.Abernethy, T. J., and Avery, 0. T. (1941). J. exp. Med., 73, 173.Alberty, R. A. (1948). J. 4mer. chem. Soc., 70, 1675.Alving, A. S., and Mirsky, A. E. (1936). J. clin. Invest., 15, 215.Armstrong, S. H., Jr., Budka, M. J. E., and Morrison, K.C. (1947a).
J. Amer. chem. Soc., 69, 416.Armstrong, S. H. Jr., Budka, M. J. E., Morrison, K. C., and Hasson,
M. (1947b). J. Amer. chem. Soc. 69, 1747.Ash, R. (1933). J. infect. Dis., 53, 89.Barr, M., and Glennie, A. T. (1931). Brit. J. exp. Path., 12, 337.Benditt, E. P., and Walker, S.-A. (1948). Amer. J. Med., 4, 663.Bernsohn, J., and Borman, E. K. (1947). J. clin. Invest., 26, 1026.Blackman, S. S. Jr., Barker, W. H., Bueli, M. V., and Davis, B. D.
(1944). J. clin. Invest., 23, 163.Blix, G. (1939). Z. ges. exp. Med., 105, 595.Blix, G., and Pedersen, K. 0. (1947). Act. chem. scand., 1, 51 1.
Blix, G., Tiselius, A., and Svensson, H. (1941). J. biol. Chem., 137,485.
Bonsdorff, B. von,Groth, H., and Packalen, T. (1938). Folia Haemat.,59, 184.
Bourdillon, J. (1939). J. exp. Med., 69, 819.Boyd, W. C., and Bernard. 1H. (1937). J. Immunol., 33, 111.Brand, E. (1946). Ann. N.Y. Acad. Sci., 47, 187.Brand, E., Kassell, B., and Saidel, L. J. (1944). J. clin. Invest., 23,437.Brand, E., Saidel, L. J., Goldwater, W. H., Kassely, B., and Ryan,
F. J. (1945). J. Amer. chem. Soc., 67, 1524.Campbell, W. R., and Hanna, M. I. (1937). J. biol. Chem., 119, 15.
Carter, A. B., and MacLagan, N. F. (1946). Brit. med. J., 2, 80.Cartwright, G. E., and Wintrobe. M. M. (1949). J. clin. Invest.,
28, 86.Chanutin, A., and Gjessing, E. C. (1946). J. biol. Chem., 165, 421.Chow, B. F. (1947). J. biol. Chem., 167, 757.Coburn, A. F., and Moore, D. H. (1943). Bull. Johns Hopk. Hosp.,
73, 196.Cohen, P. P., and Thompson, F. L. (1947). J. Lab. clin. Med., 32,475.Cohn, E. J. (1948). Blood, 3, 471.Cohn, C., and Lidman, B. I. (1946). J. clin. Invest., 25 145.Cohn, E. J., McMeekin, T. L., Oncley, J. L., Newell, J. M., Hughes,
W. L., Jn., (1940). J. Amer. chem. Soc., 62, 3381.Cohn, E. J., Strong, L. E., Hughes, W. L., Jn., Mulford, D. J., Ash-
woth, J., Melin, M., Taylor, H. L. (1946). J. Amer. chem. Soc.,68, 459.
Cooper, G. R., Rein, C. R., and Beard, J. W. (1946). Proc. Soc. exp.Biol. Med., 61, 179.
Cooper, G. R., Craig, H. W., and Beard, J. W. (1946). Am. J. Syph.,30, 555.
Cooper, J. A. (1945). J. Invest. Derm., 6, 109.Cutberbertson, -D. P., and Tompsett, S. L. (1935). Brit. J. exp. Path.,
16,47.Darrow, D. C., and Cary, M. K. (1933). J. Pediat., 3, 573.Davis, B. D., Moore, D. H., Kabat, E. A., and Harris, A. D. (1945).
J. Immunol., 50, 1.
Davis, J. S. (1935-36). J. Lab. clin. Med., 21, 478.Deutsch, H. F., Alberty, R. A., and Gosting, L. J. (1946). J. biol.
Chem., 10, 21.
Deutsch, H. F., Alberty, R. A., Gosting, L. J., and Williams, J. W.(1946). J. Immunol., 56, 183.
Dole, V. P. (1944). J. clin. Invest., 23, 708.Dole, V. P. (1945). J. Amer. chem. Soc., 67, 1119.Dole, V. P., and Emerson K., Jr. (1945). J. clin. Invest. 24, 644.Dole, V. P., and Rothbard S. (1947). J. clin. Invest. 26 87.Dole, V. P., Watson, R. F.. and Rothbard, S. (1945). J. clin. Invest.,
24, 648.Dole, V. P., Yeomans, A., and Tierney, N. A. (1947). J. clin. Invest.,
26, 298.Ecker, E. E., Seifter, S., and Dozois, T. F. (1945). J. Lab. clin. Med.,
30, 39.Edsa1l, J. T. (1947). Adv nces in Protein Chem., 3, 383.Eichelberger, L., and McCluskey, K. L. (1927). Arch. intern. Med.
40, 831.Epstein, A. A. (1917). Amer. J. med. Sci., 154, 638.Erickson, J. O., Volkin, E., Craig, H. W., Cooper, G. R., Neurath,
H. (1947). Amer. J. Syph., 31, 347.Fisher, A. M., and Davies, B. D. (1942). Bull. Johns Hopk. Hosp.,
71, 364.Franklin, M., Popper, H., Steigmann, F.. and Kozoll, D. D. (1948).
J. Lab. clin. Med., 33, 435.Frazier, C. N., and Wu, H. (1925). Amer. J. trop. Med., 5, 297.Gjessing, E. C., and Chanutin, A. (1946). J. biol. Chem., 165, 413.Goettsch, E.. and Lyttle, J. D. (1940). J. clin. Invest. 19, 9.Goettsch, E., and Reeves, E. B. (1936). J. clin. Invest., 15, 173.Gray, S.J., and Barron, E. S. G. (1943). J. clin. Invest., 22, 191.Gray, S. J., and Mitchell, E. B. (1942). Proc. Soc. exp. Biol. Med.,
51, 403.Gutman, A. B. (1948). Advances in Protein Chem., 4, 155.Gutman, A. B., and Gutman, E. B. (1937). J. clin. Invest., 16, 903.Gutman, A. B., Moore, D. H., Gutman, E. B., McClellan, V., and
Kabat, E. A. (1941). J. clin. Invest., 20, 765.Guttman, S. A., Potter, H. R., Hanger, F. M., Moore, D. B., Pierson,
P. S., and Moore, D. H. (1945). J. clin. Invest., 24, 296.Havens, W. P., and Williams, T. L. (1948). J. clin. Invest., 27, 340.Heidelberger, M. (1941). J. exp. Med., 73,681.Hektoen, L., and Welker, W. H. (1940). Biochem. J., 34, 487.Hewitt, L. F. (1927). Biochem. J., 21, 1109.Hewitt, L. F. (1929). Iancet, 1, 66.Hewitt, L. F. (1937). Biochem. J., 31, 360.Hewitt, L. F. (1938). Biochem. J., 32, 1540.Hickmans, E. M., Finch, E., and Tonks, E. (1943). Arch. Dis. Childh.,
18, 96.Higgins, G., O'Brien, J. R. P., Stewart, A., and Witts, L J. (1944).
Brit. med. J., 1,211.Hoch, H. (1947). Unpublished.Hoch, H., and Marrack, J. R. (1945a). Brit. med. J., 2, 151.Hoch, H., and Marrack, J. R. (1945b). Brit. med. J., 2, 876.Hoch, H., and Marrack, J. R. (1948). J. Obstet. Gynaec. Brit. Emp.,
5, 1.Howe, P. E. (1921). J. biol. Chem., 49,93, 109.Jager, B. V., and Nickerson, M. (1948). J. biol. Chem., 173, 683.Jager, B. V, Smith, E. L., Nickerson, M., and Brown, D. M. (1948).
J. biol. Chem., 176, 1177.Janeway, C. A. (1943). New Engl. J. Med., 22, 751, 779.Jersild, M., and Pedersen, K. 0. (1938). Acta path. microblol.
scand., 15, 426.

J. R. MARRACK AND H. HOCH
Kabat, E. A. (1939). J. exp. Med., 69, 103.Kabat, E. A. (1943). J. Immunol., 47, 513.Kabat, E. A. (1946). Ann. Rev. Biochem., 15, 505.Kahat, E. A., Hanger, F. M., Moore, D. H. and Landow, H. (1943).J. clin. Invest., 22, 563.Kabat, E. A., Moore D. H. and Landow, H., (1942). J. clin. Invest.,21, 571.Kekwick, R. A. (1940). Biochem. J., 34, 1248.Keys, A., Taylor, H. L., Mickelsen, O., and Henschel, A. (1946).Science, 103, 669.Kibrick, A. C., and Blonstein, M. (1948). J. Biol. chem., 176, 983.Koechlin, B. A. (1949). Quoted by Surgenor el al. (1949).Koenig, V. L., Perrings, J. D., and Hogness, K. R. (1946). Arch.Biochem., 11, 345.Krebs, E. G. (1946). J. Lab. clin. Med., 31, 85.Kunkel, H. G. (1949). Proc. Soc. exp. Biol. Med., 66, 217.Kunkel, H. G., and Hoagland. C. L. (1947). J. clin. Invest., 26, 1060.Laake, H. (1949). Acta med. scand., 132, 440.Lerner, A. B., Barnum, C. P., and V'atson, C. J. (1947). Amer. J.
med. Sci., 214, 416.Lerner, A. B., and Greenberg, G. R. (1946). J. biol. Chem., 162, 429.Lerner, A. B., and Watson, C. J. (1947). Amer. J. med. Sci., 214, 410.Lewis, J. H., Davidson, C. S., Minot, G. R., Soulier, J. P., Tagnon,H. P., and Taylor, F. H. L. (1945). J. clin. Invest., 25, 870.Lewis, L. A., and McCullagh, E. P. (1944). Amer. J. med. Sci.,208, 727.Lewis, L. A., and McCullagh, E. P. (1947). J. clin. Endocrinol., 7, 559.Lewis, L. A., Schneider, R. W., and McCullagh, E. P. (1944). J. clin.Endocrinol., 4, 535.Ling, S. M. (1930). Proc. Soc. exp. Biol. Med., 27, 247.Lohr, W., and Lohr, H. (1922). Z. ges. exp. Med., 29, 139.Longsworth, L. G. (1942). Chem. Rev., 30, 323.Longsworth, L. G., and MacInnes, D. A. (1940). J. exp. Med.,
71, 77.
Longsworth, L. G., Curtis, R. M., and Pembroke, R. H.. Jr. (1945).J. clin. Invest., 24, 46.Longsworth, L. G., Shedlovsky, T., and Macinnes, D. A. (1939).J. exp. Med., 70, 399.Lovgren, 0. (1945). Acta med. scand., Suppl., 163, 61.Luetscher, J. A., Jr. (1940). J. clin. Invest., 19, 313,Luetscher, J. A., Jr. (1941). J.clin. Invest., 20, 99.Luetscher, J. A., Jr. (1947). Physiol. Rev., 27, 621.Malmros, H., and Blix, G. (1946). Acta med. scand., Suppl., 170,280.Marrack, J. R. (1938). Chemistry o] Antigens and Antibodies. Med.Res. Council Spec. Rept., No. 230. London, H. M. StationeryOffice, p. 165.Marrack, J. R., and Duff, D. A. (1938). Brit. J. exp. Path., 19, 171.Marrack, J. R., Johns, R. G. S., and Hoch, H. (1949). In press.Martin, N. H. (1946). Brit. J. exp. Path., 27, 363.Martin, N. H. (1947). J.clin. Invest., 26, 1189.Martin, N. H. (1949). J. Amer. chem. Soc., 71, 1230.Martin, N. H., and Morris, R. (1949). J.clin. Path.. 2, 64May, H. B., and Hoch, H. (1949). Unpublished.McCarty, M. (1947). J. exp. Med., 85, 491.McCullagh, E. P., and Lewis, L. A. (1945). Amer. J. med. Sci.,210, 81.McFarlane, A.S. (1935). Biochem. J., 29, 1175.McMeekin, T. L. (1940). J. Amer. chem. Soc., 62, 3393.Milne, J. (1947). J. biol. Chem., 169, 595.Moen, J. K., and Reimann,H. A. (1933). J.clin. Invest., 12, 589.Moore, D. H., Kabat, E. A., and Gutman, A. B. (1943). J. clin.Invest., 22, 67.Moore, D. B., Pierson, D. S., Hanger, F. M., and Moore, D. H.(1945). J.clin. Invest., 24, 292.Morris, C. J. 0. R. (1944). Biochem. J., 38, 203.Nitshe, G. A., Jr., and Cohen, P. P. (1947). Blood, 2, 363.Oberst, F. W., and Plass, E. D. (1932). J.clin. Invest., 11, 123.Oberst, F. W., and Plass,E. D. (1936). Amer.J. Obstet. Gynec., 31,61.Oncley, J. R., Scatchard, G., and Brown, A. (1947). J. Physic. Chem.,51, 184.Oudin, J. (1946). C. R. Acad. Sci., 222, 115.Packalen, T. (1939). Acta med. scand., 100, 1.Paid, M. (1939). Bull. Soc. Chim. Biol., 21, 412.Payne, S. A., and Peters, J. P. (1932). J.clin. Invest., 11, 103.Pedersen, K.O. (1944). The Stedberg, 1884, 30/8, 1944. Uppsala,
p. 490.Pedersen, K. 0. (1945). Ultracentrifugal Studies of Serum and Serumn
Fractions. Almqvist and Wiksells. Uppsala.Perera, G. A., and Berliner, R. W. (1943). J.clin. Invest., 22, 25.
Perlmann, G. E., Glenn, W. W., and Kaufman, D. (1943). J. clin.Invest., 22, 627.Perlnann, G. E., and Kaufman, D. (1945). J. Amer. chem. Soc.,67, 638.Peterman, M. L. (1946). J. biol. Chem., 162, 37.Peterman, M. L., Karnofsky, D. A., and Hogness, K. R. (1948).Cancer, 1, 109.Pbillips, R. A., van Slyke, D. D., Dole, V. P., Emerson, K. Jr.,Hamilton, P. B., and Archibal, R. M. (1945). Copper SulphateMethod of Measuring Specific Gravities. Josiah Macy, Jr.,Foundation. New York.Philpot, J. St. L. (1938). Nature, Lond., 141, 283.Pillemer, L., Ecker, E. E., Oncley, J. L., and Cohn, E. J. (1941).J. exp. Med., 74, 297.Pillemer, L., Siefter, S., San Clemente, C. L., and Ecker, E. E.(1943). J. Immunol., 47, 205.Pillemer, L., and Hutchinson, M. C. (1945). J. biol. Chem., 158, 299.Plass, E. D. and Matthew, C. W. (1926). Amer. J. Obstet. GYner.,12, 346.Popjack, G., and McCarthy, E. F. (1946). Biochem. J., 40, 789.Popper, H., Steigmann, F., Dyniewicz, H., and Dubi, A. (1949).J. Lab. clin. Med., 34, 105.Post, J., and Patek, A. J. (1942). Arch. intern. Med., 69, 67.Rapoport, M., Rubin, M. I., and Chaffee, D. (1943). J. clin. Invest.,22, 487.Rath, C. E., and Finch, C. A. (1949). J. clin. Invest., 28, 79.Rennie, J. B. (1945). Amer. J. med. Sci., 210, 18.Rimington, C., and van den Ende, M. (1940). Biochem. J., 34, 941.Rutstein, D. D., Clarke, F. H., and Taran, L. M. (1945). Science,101, 669.Rytand, D. A. (1942). Arch. internt. Med., 69, 251.Scadding, J. G., and Sherlock, S. (1948). Thorax, 3, 79.Schade, A. L., and Caroline, L. (1946). Scienc(, 104, 340.Schamberg, I. L. (1941). Amer. J. med. Sci., 201, 67.Schick, B., and Greenbaum, J. W. (1945). J. Pediat., 27, 241.Seibert, F. B., and Nelson, J. W. (1942). J. biol. Chem., 143, 29.Seibert, F. B., and Nelson, J. W. (1943). Amer. Rev. Tuberc., 47, 66.Seibert, F. B., Seibert, M. V., Atno, A. J., and Campbell, H. W.(1947). J. clin. Invest., 26, 90.Shapiro, B., and Wertheimer, E. (1946). Brit. J. exp. Path., 27, 225.Shapiro, S., Ross, V., and Moore, D. H. (1943). J. clin. Invest.,22, 137.Shedlovsky, T., and Scudder, J. (1942). J. exp. Med., 75, 119.Shemin, D. (1945). J. biol. Chem., 159, 439.Sherlock, S. P. V. (1946). J. Path. Bact., 58, 523.Shortt, H. E., Garnham, P. C. C., Covell, G., and Shute, P. G.(1948). Brit. med. J., 1, 547.Sinclair, H. M. (1948). Proc. R. Soc. Med., 41, 550.Smith, E. L. (1946). J. biol. Chem., 164, 395.Stacey, R.S. (1947). J. Lab. clin. Med., 32, 1002.Stern, K. G., and Reiner, M. (1946). YaleJ. Biol. Med., 19, 67.Surgenor, D. M., Koechlin, B. A., and Strong, L. E. (1949). J. clin.Invest., 28, 73.Surgenor, D. M., Strong, L. E., Taylor, H. L., Gordon, R. S., Jr.,and Gibson, D. M. (1948). J. Amer. chem. Soc., 71, 1223.Svedberg, T., and Pedersen, K. 0. (1940). The Ultracentrifuge,Clarendon Press, Oxford.Svensson, H. (1939). Kolloidzschr., 87, 181.Svensson, H. (1941). J. biol. Chem., 139, 805.Svensson, H. (1946). Arkiv. Kemi. Mineral Geol., 22a, 1.Tierney, N. A., and Yeomans, A. (1946). J.clin. Invest., 25, 822.Tiselius, A. (1937). Biochem. J.. 31, 1464.Thorn, G. W., Armstrong, S.H., Jr., and Davenport, V. D. (1946).J.clin. Invest., 25, 304.Thorn, G. W., Armstrong, S. H., Jr., and Woodruff, L. M., andTyler, F. H. (1945). J.clin. Invest., 24, 802.Thovert, J. (1914). Ann. Phys., Ser. 9, 2, 369.Treffers, H. P., and Heidelberger, M. (1941). J. exp. Med., 73, 125,293.Treffers, H. P., Moore, D. H., and Heidelberger, M. (1942). J. exp.Med., 75, 135.Trevorrow, V., Kaser, M., Patterson, J. P., and Hill, R. M. (1941).J. Lab.clin. Med., 27, 471.Van der Scheer, J., Wyckoff, R. W. G., and Clarke, F. H. (1940).J. Immunol., 39, 65.Volkin, E. (1949). J. Immunol., 61, 143.Volkin, E., Neurath, H., Erickson, J.O., and Craig, H. W. (1947).Amer. J. Syph., 31, 397.Wallis, A. D. (1946). Amer. J. med. Sci., 212, 713,Widdowson,E. M. (1933). Biochem. J., 27, 1321.Wunderly, C., and Wuhrmann, F.(1947). Brit. J. exp. Path., 28. 286.
192