service and energy awareness in optical networks dan kilper g
TRANSCRIPT

Service and Energy Awareness in Optical Networks Dan Kilper G. Atkinson, K. Guan, J. Llorca, Y. Pan

What is GreenTouch?
Broad, open and global consortium executing research projects to
achieve aggressive goal
Roadmap organization establishing reference architectures and
research targets to overcome major challenges facing network
scaling and energy
Venue for cooperation and enabling demonstrations among research
organizations
Forum for the exchange of information on energy trends,
challenges, & research on communication networks
2 GreenTouch Introduction | 2012
GreenTouch Mission By 2015, our goal is to deliver the architecture, specifications and
roadmap — and demonstrate key components — needed to increase
network energy efficiency by a factor of 1000 from current levels.
© 2012 GreenTouch Consortium
GreenTouch Members
3
Athens Information Technology (AIT) Center
Bell Labs, Alcatel-Lucent
Broadcom
CEA-LETI Applied Research Institute for Microelectronics
China Mobile
Chunghwa Telecom
Columbia University
Commscope/Andrew
Dublin City University
ETRI
ES Network/Lawrence Berkeley Labs
Fondazione Politecnico di Milano
Fraunhofer-Geselleschaft
France Telecom
Fujitsu
Huawei
IBBT
IMEC
Indian Institute of Science
IIT Delhi
INRIA
KAIST
Karlsruhe Institute of Tech.
Katholieke Universiteit Leuven (K.U. Leuven)
King Abdulaziz City for Science and Technology
KT Corporation
National Chiao Tung University
National ICTA Australia
Nippon Telegraph and Telephone Corp
Politecnico di Torino
Portugal Telecom Inovação, S.A.
Samsung (SAIT)
Seoul National University
Shanghai Institute of Microsystems & Information Technology
Swisscom
TNO
Tsinghua University
TTI
TU Denmark
TU Dresden
University College London
University of Cambridge
University of Delaware
University of L’Aquila
University of Leeds
University of Manchester
University of Maryland
University of Melbourne CEET
University of Missouri-KC
University of New South Wales
University of Paderborn
University of Rochester
University of Toronto
Utah State University
Vodafone Group
Waterford Institute of Technology
ZTE
GreenTouch Introduction | 2012
© 2012 GreenTouch Consortium

ALL RIGHTS RESERVED. COPYRIGHT © ALCATEL-LUCENT 2012. 4 |
SEASON: Architecting an Energy-Efficient Service-Centric Network
IP InternetIP Internet
WirelessWireless
PONPON
EnterpriseEnterprise
App
Center
IP InternetIP Internet
WirelessWirelessWirelessWireless
PONPONPONPON
EnterpriseEnterpriseEnterpriseEnterprise
App
Center
• Historically networks have found success by providing a common agnostic platform to support a range of activities, but this comes at a cost in terms of energy that increases as the diversity of Internet services expands…
• SEASON is a clean-slate network design project focusing on opportunities to design networks for maximum energy efficiency through awareness of service requirements
• Focus on services with high bandwidth
• Elephant flow picture: 90% of traffic due to 10% of flows
• Understand from clean-slate perspective how service requirements (bandwidth, duration, latency, multi-cast, security, protection,…) impact energy
• Focus on core network dynamic functionality and connect with other groups and projects on transmission design, switching hardware
YEAR
2000 2005 2010 2015 2020 20251995
AN
NU
AL
GR
OW
TH
RA
TE
(%
)
250
200
150
100
0
50
300
High growth,
early phase
Constrained growth,
mature phase

ALL RIGHTS RESERVED. COPYRIGHT © ALCATEL-LUCENT 2012. 5 |
Different Directions
Energy follows load,
maximum efficiency in
today‟s network
„Service aware‟,
function specific
hardware
2008 2010 2012 2014 2016 2018 20201
10
100
Po
we
r/U
se
r (W
)
Year
BAU
Optimistic
Improvements
1010.1
Average Area Efficiency (GOPS/mm2)
0.001
1
10
0.01
Ave
rage
En
erg
y Ef
fici
en
cy
(GO
PS/
mW
)
µProc
Prog. DSP
Dedicated
100
0.1
FPGA
ISSCC & VLSI 1999-2011, averaged
> 100x improvement
< 10x improvement
VLSI chips
Apply ‘ASIC’ concept to networks
A.
B.
Kilper, et. al., JSTQE 2011

ALL RIGHTS RESERVED. COPYRIGHT © ALCATEL-LUCENT 2012. 6 |
Bell Labs Univ. of Toronto
CEET
SEASON Activities & Partners
Participants: • Bell Labs (Holmdel, Murray Hill, Seoul, Stuttgart): D. Kilper
• Columbia: K. Bergman, G. Zussman (CIAN Center)
• UNSW: V. Sivaraman
• INRIA: L. Lefevre
• Toronto: L. Pavel
• CEET: K. Hinton
Energy & locality aware
placement and execution of
m-data center services
Energy-aware wavelength
routing & protocols
Univ. of Toronto
Columbia Univ.
INRIA
CEET
Bell Labs
Multi-fiber, silicon-photonic
fast switching & control
devices End-to-end coding
Robust & distributed
multi-layer control
Service-aware
flow switching
/CCN/CDN
Enterprise
App
Center
Bell Labs
UNSW
Bell Labs
Bell Labs
Columbia Univ. Univ. of Toronto
• ESnet: I. Monga

ALL RIGHTS RESERVED. COPYRIGHT © ALCATEL-LUCENT 2012. 7 |
• Service-dependent networks: two steps
• Determine minimum network energy for service categories with different characteristics
• Identify how energy depends on characteristics: delay, transaction size, security, multi-cast,…
• Merge service category solutions to find a total network solution
• Clean-slate: consider bottom up solutions
• Highly efficient optical transmission
• How do we minimize large non-transmission (control, coding, thermal,…) energy load?
• How do we maximize efficiency of optical link? Move toward interconnect levels?
• How do we achieve bandwidth efficiency?
• Simplified switching & routing
• How do we match circuit and packet operation to service needs at hardware level
• Determine energy cost for service dependent requirements: latency, security, QoS,…
• Determine protocols based on hardware & service requirements
• End-to-End
• Service dependent coding and capacity impacts all layers
• Utilization, QoS, wavelength switching require coordination across layers
• Low utilization at high efficiency: dynamic operation
Key Issues in SEASON
Main SEASON
differentiators

ALL RIGHTS RESERVED. COPYRIGHT © ALCATEL-LUCENT 2012. 8 |
Large gap between basic devices and commercial
systems
Where does the energy go?
2010 2015 2020 20251E-12
1E-11
1E-10
1E-9
1E-8
1E-7
1E-6
1E-5
Switches
Transmission
En
erg
y p
er
Bit (
J)
Year
Transmission
Routers &
Switches
Lower Bound
Analysis
Current
Trends
~ 104
Difference
Tucker JSTQE 2011
Kilper JSTQE 2011

ALL RIGHTS RESERVED. COPYRIGHT © ALCATEL-LUCENT 2012. 9 |
• QoS, security, coding, queuing:
• Can we eliminate redundant processing or push to the edge?
• Efficient placement of content/processing
• Layering, protocols oblivious to HW
Service Requirements…
Metro
Client
Data Center
Long Haul
Access
• Source Coding
• Cloud processing
Channel Coding Source Coding
• Pattern-
matching
• Security
• QoS
• Addressing
• Queuing
Chop data
up into
individually
wrapped
packets
ALL RIGHTS RESERVED. COPYRIGHT © ALCATEL-LUCENT 2012. 10 |
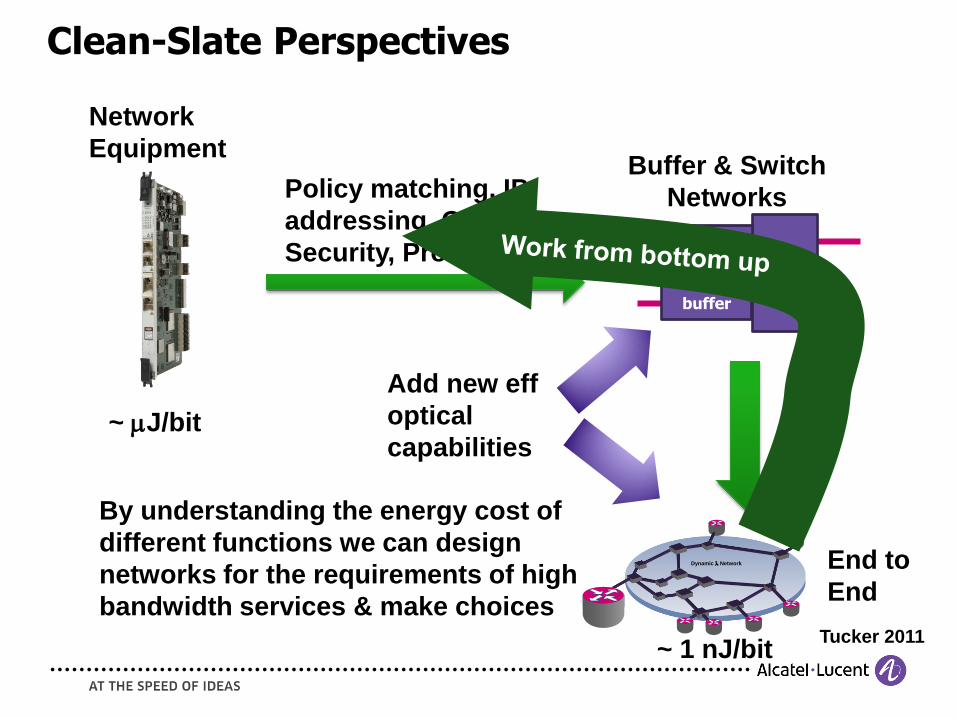
Tucker 2011
XC
Clean-Slate Perspectives
Network
Equipment
Policy matching, IP
addressing, QoS,
Security, Protocols buffer
Buffer & Switch
Networks
~ mJ/bit
~ 1 nJ/bit
By understanding the energy cost of
different functions we can design
networks for the requirements of high
bandwidth services & make choices
buffer
Add new eff
optical
capabilities
Dynamic l Network End to
End

ALL RIGHTS RESERVED. COPYRIGHT © ALCATEL-LUCENT 2012. 11 |
Bandwidth Leverage: More with Less
• Reduce buffering & switch energy through excess transport bandwidth
• Illusion of excess bandwidth by turning up and re-directing wavelengths
• Use service awareness to schedule app center processes
• First need to minimize common equipment/infrastructure energy
• Second need to solve challenges prohibiting dynamic capability
Dynamic l Network
Enterprise
Monthly
Daily
Micro-Data
Center

ALL RIGHTS RESERVED. COPYRIGHT © ALCATEL-LUCENT 2012. 12 |
• Duration of wavelength connection: T* = B/C
• B = Total data flow, C = wavelength capacity
• For wavelengths C > 10 Gbits/sec
• ~ 1 Gbyte = 1 sec
• Wavelength tear down delay: Td
• Wavelength setup delay: Tu
• Total WoD delay: T0 = Tu + Td
• EWoD ~ Plink (T0 + B/C) = gPlinkB/C
• γ >> 1: Inefficient wavelength utilization
• Today T0 ~ 10 min. B > 750 Gbytes for g < 2
CB
CBT
/
/
g
Compare B with CT0:
Control-delay bandwidth
product is key to efficiency
for dynamic wavelengths
Wavelength on Demand: Turn up + Tear Down Delays
λ2
λ3λ1
B C
A

ALL RIGHTS RESERVED. COPYRIGHT © ALCATEL-LUCENT 2012. 13 |
Network and Traffic Model
CDN Networks
• Characterize the relationship between hop
distance Hr and no. of caches n
Traffic Model
• File download rate vs. file size
• Use bounded Pareto distribution to model
heavy-tailed traffic
12802064 N
0 200 400 600 800 1000 1200 14000
5
10
15
20
No. of Copies
Ho
p D
ista
nce
46.0
64.0)(
n
NnHr
102
103
104
10-7
10-6
10-5
10-4
10-3
10-2
10-1
File Size
Dow
nlo
ad R
ate
Large Small - frequentdownload oflarge files
UL
B
B
L BxBxB
xf
U
L
,1
)()1(

ALL RIGHTS RESERVED. COPYRIGHT © ALCATEL-LUCENT 2012. 14 |
10-4
10-3
10-2
10-1
100
101
10-8
10-7
10-6
Normalized File Size (Bk/C
l T
)
Op
tim
al C
om
bin
ed
Tra
nsp
ort
a
nd
Sto
rag
e E
ne
rgy P
er
Bit (
J/b
it)
CDN without Bypass, =0.2
CDN with Bypass, =0.2, pd
wdm/p
d
r=10
-1
CDN with Bypass, =0.2, pd
wdm/p
d
r=10
-2
~ 100 Mbits ~ 1 Gbits ~ 10 Gbits ~ 100 Gbits~ 10 Mbits
Dynamic Wavelength Power Reduction Potential for CDN
pwdm/pr = 0.1
pwdm/pr = 0.01
Frequent download of very large files
• Better wavelength utilization
• Trade transport energy with storage energy
BL=10 Mb, BU=1 Tb, t=1 day, R=105, To=5 s, Cλ=10 Gb/s
r
d
wdm
dk
p
pTCB
l
K. Guan, et. al., INFOCOM 2011

ALL RIGHTS RESERVED. COPYRIGHT © ALCATEL-LUCENT 2012. 15 |
Our Approach
Connection Time/Setup Time = Size/T0BW
En
d t
o E
nd
Eff
icie
nc
y (
bit
/J)
Pacing, Sched EFIC
OST
Service
Constraints
How do we define these curves?
Where are the transition points?
What controls these curves?
Dedicated
Network
Rest of
Network
Today 2020 Beyond

ALL RIGHTS RESERVED. COPYRIGHT © ALCATEL-LUCENT 2012. 16 |
Dynamic Wavelengths
• Small Networks: solved problem
• Matisse networks, lab demos
• ~ 4 amplifiers, ~ <40 chans, rings, OOK
• Large Networks: complex/challenging engineering rules & network control, transients & power dynamics, advanced modulation formats
• > 4 amplifiers, > 40 channels, complex mesh, phase sensitive
• Dynamic wavelength capability similar to transmission technologies:
• With infinite money and resources can completely solve problems
• Problems get harder depending on distance and capacity (and speed in this case) – need higher performance devices, algorithms
• Trade-off performance vs cost for given network
• Additional trade-off related to energy
• Algorithms/control that leads to lowest overall energy
• Trade-off performance/service req. and energy
SEASON

Stability Problem
19/09/2012 17
𝑣1
𝑦21
𝑦12 𝑃1
𝑃2
𝑦11
𝑣2 𝑦22
𝒘𝟏𝟐 = 𝒚𝟐𝟐
𝒘𝟐𝟏 = 𝒚𝟏𝟏

19/09/2012 18
Case Description Result
1 1 WSS + integral
control
Impossible to oscillate
2 2 WSS + 2 sets of
integral control
Impossible to oscillate
3 1 WSS + (state +
integral control +
delay)
With small adaptation dynamic on one
of the channels. Relaxation oscillation
is possible
4 2 WSS + 2 sets of
(state + integral
control + delay)
Network of passive oscillators (as case
2) will oscillate at right bifurcation
values
Oscillation Analysis Results
Z. Wang, J. Tsai, P. Yan, D. C. Kilper, and L. Pavel, “Oscillation Analysis for a Quasi-
ring Optical Network” American Control Conference, Montreal, July 2012.

ALL RIGHTS RESERVED. COPYRIGHT © ALCATEL-LUCENT 2012. 19 |
Enhanced Network Simulator (NS3)
(ECOFEN)
ATOM
Packets, IP,
TCP, buffers
Wavelengths,
RWA, GMPLS,
Impairments
ATOM: A Transparent Optical Mesh Simulator ECOFEN: Energy Consumption mOdel For End-to-end Networks
Bell Labs Columbia Toronto
SEASON Contributors INRIA UNSW CEET
• Cross-layer simulation platform: combine widely used NS3 with ATOM simulator
• Enable cross-layer analysis that would not otherwise be possible
Simulator for SEASON & GreenTouch

ALL RIGHTS RESERVED. COPYRIGHT © ALCATEL-LUCENT 2012. 20 |
Application Centers: Energy Optimized Selective Services
GW 1 2 n …
• Micro Data Center (MDC)
• Limited number of pre-provisioned high quality, high-bandwidth services
• (CDN ++: Content distribution + processing)
• Includes transparent pass-through services
• Use natural cooling, PUE ~ 1.05
• Enhanced capabilities for on demand instantiation of “personalized” services
• residential “co-processor”, virtual home gateway
• Super-central office
• Highly efficient, optical access to the HQ HB services: low power, long-reach PON
• GW: Separation and bandwidth restriction of IP (Internet) traffic
• Connects directly to other App Centers
• Scheduled & adaptive dedicated network highly coordinated with service delivery/CDN
IP
Internet
PON
Enterprise
Wireless
Micro Data Center
Applications
l
Dynamic l
Network

ALL RIGHTS RESERVED. COPYRIGHT © ALCATEL-LUCENT 2012. 21 |
Multi-View Video J. Llorca, et. al. INFOCOM 2012, ICC 2012
Trade-off Video Processing & Transport Energy
More Views = More Data & More Processing
Best Architecture Depends on Processing Energy
Use dynamic wavelengths to stay on low energy curves
Greater than 10x difference depending on architecture
Greater energy
savings with
dynamic network
topologies
Software Coding Hardware Coding Increasing Processing Power
Distributed processing centers use more power as the processing power increases
Distributed
Optimal
Access
Video
Processing
Special
View 1
Core network
Special
View Ms
User
User
View
1
View
2
View
M
View
1
View
2
View
M
Transport M
captured views Processing
node
Transport
processed views
Transport
processed views

ALL RIGHTS RESERVED. COPYRIGHT © ALCATEL-LUCENT 2012. 22 |
CCN vs. Centralized CDN with Optical Bypass:
CCN becomes more energy efficient as the frequency of requests increase
• Break-even point depends on topology and traffic
Energy-Efficient CCN
CCN vs. Distributed CDN:
Energy efficiency depends on characteristics of content library
• Content catalog size and popularity distributions
• E = Energy/bit
K. Guan, et. al., “On the Energy Efficiency of Content
Delivery Architectures” ICC 2011
0 0.2 0.4 0.6 0.8 10.8
0.9
1
1.1
1.2
1.3
1.4
1.5
1.6
EC
CN
/EC
DN
Ring, N=64
8X8 Grid, N=64
IP Backbone, N=24
EON, N=19
0 0.2 0.4 0.6 0.8 10.8
0.9
1
1.1
1.2
1.3
1.4
1.5
1.6
in Zipf Distribution, F=1000
EC
CN
/E
CD
N
Ring, N=64
8X8 Grid, N=64
IP Backbone, N=24
EON, N=19
CCN is more efficientfor small-sized catalog
Distributed CDN is more efficientfor large-sized catalog
in Zipf Distribution, F=50
101
102
103
0.8
1
1.2
1.4
1.6
1.8
2
2.2
2.4x 10
-6
No. of Requests, Rk
Op
tim
al
En
erg
y p
er
bit
, E
bit (
J/b
it)
Ring, N=64, CCN
Ring, N=64, Bypass
8X8 Grid, N=64, CCN
8X8 Grid, N=64, Bypass
IP Backbone, N=24, CCN
IP Backbone, N=24, Bypass
EON, N=19, CCN
EON, N=19, Bypass
Break-even points
ALL RIGHTS RESERVED. COPYRIGHT © ALCATEL-LUCENT 2012. 23 |
• Potential for deep energy savings through service aware/centric design
• Most of the energy is consumed by service driven features
• Requires clear understanding of trade-offs and choices
• Bottom up clean-slate, end-to-end
• Takes large effort over time to build up models, tools
• Use flexible models to incorporate full range from ideal to commercial
• Better enable use of optical switching for efficient high BW network functions
• GreenTouch SEASON Project
• Large effort both inside GT and in cooperation with other organizations
• Address problems from transmission to applications
Conclusions

ALL RIGHTS RESERVED. COPYRIGHT © ALCATEL-LUCENT 2012. 24 |

ALL RIGHTS RESERVED. COPYRIGHT © ALCATEL-LUCENT 2012. 25 |
Kilper et. al., JSTQE 2011
2010-2020:
10x
2010 2015 2020
0.1
1
10
100
Pow
er/
Use
r (W
)
Year
Fixed Access WDM
Mobile Routing & Sw
Low
High
Reduce
Processing?
BAU Energy Trends & System Over-provisioning …
Time
Cap
acit
y
Over-
provisioning