service delivery · web viewintroduction 1 chapter 1 – service and budget strategies 5 growing...
TRANSCRIPT

Service Delivery2009-10
Presented by
John Lenders, M.P.Treasurer of the State of Victoria
for the information of Honourable Members


TABLE OF CONTENTS
Introduction............................................................................................................1Chapter 1 – Service and Budget Strategies.........................................................5
Growing Victoria Together..................................................................................................7More quality jobs and thriving, innovative industries........................................................14Growing and linking all of Victoria....................................................................................17High quality, accessible health and community services.................................................21High quality education and training for lifelong learning...................................................25Protecting the environment for future generations...........................................................29Efficient use of natural resources.....................................................................................30Building friendly, confident and safe communities...........................................................31A fairer society – reducing disadvantage and respecting diversity..................................37Greater public participation and more accountable government......................................42Sound financial management...........................................................................................43
Chapter 2 – Linking Departmental Outputs to Government Outcomes...........45Chapter 3 – Departmental Output Statements...................................................65
Department of Education and Early Childhood Development..........................................67Department of Human Services.......................................................................................71Department of Innovation, Industry and Regional Development......................................71Department of Justice......................................................................................................71Department of Planning and Community Development...................................................71Department of Premier and Cabinet................................................................................71Department of Primary Industries.....................................................................................71Department of Sustainability and Environment................................................................71Department of Transport..................................................................................................71Department of Treasury and Finance..............................................................................71Parliament........................................................................................................................71
Chapter 4 – Election Commitments Implementation Report Card...................71Appendix A – Output, Asset Investment, and Revenue Initiatives...................71
Government-wide initiatives.............................................................................................71Departmental initiatives....................................................................................................71Efficiencies.......................................................................................................................71Revenue initiatives...........................................................................................................71
Appendix B – Growing Victoria Together Progress Report..............................71Appendix C – Discontinued Outputs and/or Measures.....................................71Appendix D – Local Government Financial Relations.......................................71
Local Government in Victoria...........................................................................................712009-10 Budget initiatives................................................................................................71
Appendix E – Victorian Transport Plan..............................................................71
i

Table of Contents (continued)
Abbreviations and Acronyms..............................................................................71Style Conventions................................................................................................71Index.......................................................................................................................71
ii

INTRODUCTION
Budget Paper No. 3, Service Delivery, provides information about the goods and services the Government intends to deliver. This budget paper provides the link between the Government’s key priorities and outcomes, identified in Growing Victoria Together and outlined in Budget Paper No. 2, Strategy and Outlook, and the outputs delivered by individual government departments.
This budget paper takes into account the financial impacts of all policy decisions taken by the Victorian Government, as well as Commonwealth Government funding revisions and other information that affects the projected general government sector financial statements as at 29 April 2009 unless otherwise stated. Financial impacts of decisions taken after that date, including the April meeting of the Council of Australian Governments will be reflected in the 2009-10 Budget Update.
Budget Paper No. 3 is the primary source of information for readers interested in the service delivery plans of individual departments and consists of the following chapters and appendices:
Chapter 1 – Service and budget strategiesThis chapter details the Government’s 2009-10 service and budget initiatives, linking these to the achievement of the longer-term outcome themes in Growing Victoria Together.
Chapter 2 – Linking departmental outputs to government outcomesThis chapter provides a high level overview of the Government’s service delivery achievements and the impact they have made towards achieving the Government’s long term vision identified in Growing Victoria Together.
Service Delivery 2009-10 Introduction Page 1

Chapter 3 – Departmental output statementsDepartmental output statements detail the goods and services that government departments intend to deliver in 2009-10 and how they will contribute to achieving Growing Victoria Together.
Each departmental output statement lists performance measures and targets for quantity, quality, timeliness and cost for each output to be delivered in 2009-10. These tables also include, wherever possible, 2007-08 actual, 2008-09 target and 2008-09 expected outcome results for these performance measures.
The cost measure for each output is the total output cost which will be met from a variety of revenue sources, including appropriation revenues.
Chapter 4 – Election commitments implementation report cardThis chapter summarises the implementation of the Government’s election commitments under Labor’s Financial Statement 2006.
Appendix A – Output, asset investment and revenue initiativesAppendix A contains summary descriptions and detailed tables for all new output initiatives, infrastructure investments, revenue and savings initiatives announced since the 2008-09 Budget.
It includes a cross reference between output initiatives and their relevant departmental output(s), which aims to clearly indicate the impact of policy decisions on relevant portfolios and reinforces the Government’s commitment to greater transparency and accountability in the budget papers.
Appendix B – Growing Victoria Together progress reportLaunched in 2001-02, Growing Victoria Together sets out the Government’s vision to 2010 and beyond, balancing the Government’s economic, social and environmental responsibilities. A revised edition of Growing Victoria Together was released in March 2005. Appendix B contains the Government’s seventh report, detailing progress towards the goals of the policy.
Appendix C – Discontinued outputs and/or measuresAppendix C provides details of those previously published outputs and performance measures that will be discontinued in 2009-10.
Appendix D – Local government financial relationsAppendix D provides an overview of the local government sector, the State’s contribution to local government funding in Victoria, and highlights budget initiatives that have a major impact on local government.
Page 2 Introduction Service Delivery 2009-10

Appendix E – Victorian Transport Plan report cardAppendix E summarises the implementation of the Government’s commitments under the Victorian Transport Plan.
Machinery of government changesThe Department of Premier and Cabinet assumed responsibility for Multicultural Affairs from the Department of Planning and Community Development from 1 January 2009.
The Victorian Multicultural Commission was established as an administrative office within the Department of Premier and Cabinet in recognition of the need for a whole of government approach to multicultural affairs.
Service Delivery 2009-10 Introduction Page 3
Page 4 Introduction Service Delivery 2009-10

CHAPTER 1 – SERVICE AND BUDGET STRATEGIES
The Victorian economy has been substantially impacted by the Global Financial Crisis and the bushfires that affected parts of Victoria in February 2009. An ongoing commitment to deliver services that matter to Victorians while maintaining fiscal discipline and the State’s triple-A credit rating has put the Government in a strong position in what are difficult times for governments across the world.
This budget delivers for Victoria with investment in infrastructure to secure jobs in cooperation with the Commonwealth Government’s Nation Building – Economic Stimulus Plan. The Budget provides $7 billion of funding for infrastructure investment in 2009-10 to secure up to 35 000 jobs and help soften the impact of the Global Financial Crisis.
The budget announces funding of $6.5 billion over five years and enhances the Government’s service delivery objectives as set out under Growing Victoria Together. Significant additional funding is included in this budget to support Victorian Government schools, sustain the capacity of health and hospital services and assist disadvantaged Victorians.
In response to the February 2009 bushfires, the Government has taken swift action to assist people to get their lives back on track and for communities to begin the important rebuilding process. This budget includes funding of $908 million over five years and $78 million TEI for bushfire response and recovery.
During a downturn, it is vital that any additional education and training effort be directed to the skills required for tomorrow’s workforce. In the budget, the Government continues to build on the Securing Jobs for Your Future: Skills for Victoria statement with a further $141 million over five years and $70 million TEI for skills related initiatives including implementation of the Commonwealth Government’s Productivity Places Program.
Victorian government schools will receive a significant boost of $2.9 billion for infrastructure funding in this budget. This includes $402 million TEI from the State Government to continue the rebuilding and modernising of all government schools under the Victorian Schools Plan, and $2.4 billion for Victorian education infrastructure under the Commonwealth Government’s Building the Education Revolution initiative.
Service Delivery 2009-10 Chapter 1 5
The 2009-10 Budget provides $1.1 billion over five years and $177 million TEI for health and hospital services, including funding provided by the Commonwealth under National Partnership Agreements. This includes funding to expand hospital and community health service delivery and infrastructure, implement hospital and health workforce reforms, and increase rural and regional dental services.
The 2009-10 Budget delivers substantial funding commitments for the first tranche of initiatives included in the $38 billion Victorian Transport Plan. Funding of $4.9 billion is provided in cooperation with the Commonwealth Government to deliver new services and infrastructure to begin the transformation of Victoria’s transport system.
In partnership with the Commonwealth, the Government will deliver a $1.7 billion boost to social housing through the Nation Building – Economic Stimulus Plan and the National Partnership Agreement on Social Housing. This is expected to deliver over 5 000 new houses and stimulate jobs in the construction sector.
The 2009-10 Budget commits a further $330 million over four years and $80 million TEI to strengthen the justice system, enhance policing and expand corrections services. This funding will improve safety and help build a confident, friendly and safe Victoria.
The Government continues to provide targeted service delivery for disadvantaged Victorians under A Fairer Victoria. The budget provides $125 million over four years to continue reforms to increase the quality of services provided in the Out of Home Care sector and $10 million TEI to commence the redesign of existing facilities to create more welcoming environments.
To continue to promote good mental health in Victoria the budget provides $108 million over four years and $74 million TEI to support the treatment and recovery of those with mental health issues. This includes $24 million provided through the Sustaining Health Services Capacity initiative.
Protecting the environment is a key government objective, and this budget provides $32 million over four years and $6.5 million TEI to establish four new national parks as part of the River Red Gums strategy.
6 Chapter 1 Service Delivery 2009-10

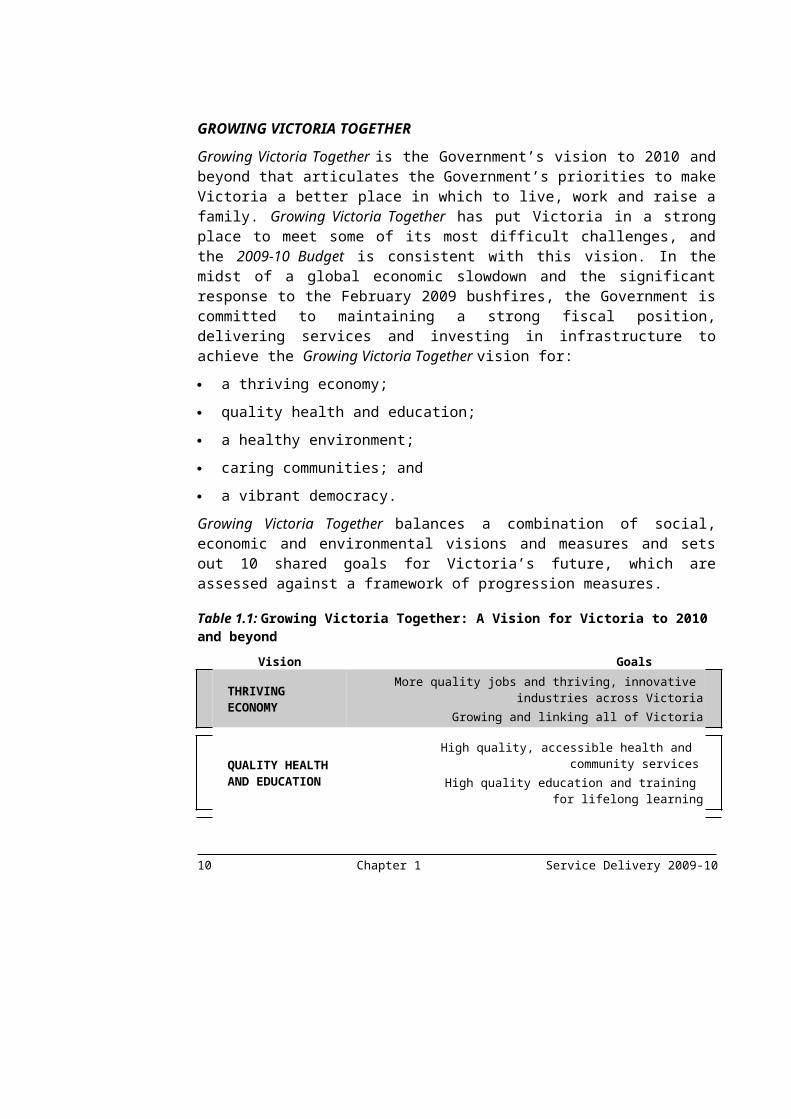
GROWING VICTORIA TOGETHERGrowing Victoria Together is the Government’s vision to 2010 and beyond that articulates the Government’s priorities to make Victoria a better place in which to live, work and raise a family. Growing Victoria Together has put Victoria in a strong place to meet some of its most difficult challenges, and the 2009-10 Budget is consistent with this vision. In the midst of a global economic slowdown and the significant response to the February 2009 bushfires, the Government is committed to maintaining a strong fiscal position, delivering services and investing in infrastructure to achieve the Growing Victoria Together vision for:
a thriving economy;
quality health and education;
a healthy environment;
caring communities; and
a vibrant democracy.
Growing Victoria Together balances a combination of social, economic and environmental visions and measures and sets out 10 shared goals for Victoria’s future, which are assessed against a framework of progression measures.
Table 1.1: Growing Victoria Together: A Vision for Victoria to 2010 and beyond Vision Goals
THRIVING ECONOMY
More quality jobs and thriving, innovative industries across Victoria
Growing and linking all of Victoria
QUALITY HEALTH AND EDUCATION
High quality, accessible health and community services
High quality education and training for lifelong learning
HEALTHY ENVIRONMENT
Protecting the environment for future generations
Efficient use of natural resources
CARING COMMUNITIES
Building friendly, confident and safe communities
A fairer society that reduces disadvantage and respects diversity
VIBRANT DEMOCRACY
Greater public participation and more accountable government
Sound financial management
Service Delivery 2009-10 Chapter 1 7
This chapter provides an overview of the service delivery initiatives included in the 2009-10 Budget that support the Government’s vision as set out in Growing Victoria Together. Full details of initiatives by department can be found in Appendix A. The Election Commitments Implementation Report Card in Chapter 4 summarises the implementation of the Government’s election commitments under Labor’s Financial Statement 2006.
A key commitment of Growing Victoria Together is regular reporting on the progress that the Government has made towards achieving its visions and goals. The Government’s seventh Growing Victoria Together Progress Report is included at Appendix B to this budget paper.
Responding to the Global Financial CrisisVictoria’s recent history of fiscal discipline and strong economic growth means the Government is well positioned to respond to the Global Financial Crisis and the subsequent economic slowdown. Strong economic fundamentals, including solid population growth and the highest rate of building approvals in the nation, complemented by recent reforms to business regulation and the planning system, make the State an attractive jurisdiction to invest in. A diverse economic base has allowed economic growth to average 2.8 per cent a year since 1999-2000. Fiscal discipline and a commitment to maintaining a triple-A credit rating over a decade of strong economic growth has the Government well positioned to respond to the downturn.
The 2009-10 Budget has been framed against the deteriorating global and domestic economic environment. It delivers a record level of investment in infrastructure that will secure jobs in the short term and ensure Victoria is well positioned when the economy recovers. The budget also builds on the Government’s long-term service delivery vision to increase liveability for Victorians, their families and communities.
The budget takes action to protect jobs, generate jobs and attract new investment that will result in jobs.
Record infrastructure investment programThe 2009-10 Budget will deliver the largest infrastructure program in the State’s history in partnership with the Commonwealth Government. Victoria will benefit from this investment as public projects position Victoria for the economic recovery and future growth. Accelerating investment in public infrastructure will balance any decline in private sector investment resulting from the economic downturn, and be a key source of employment opportunities in the State, generating tens of thousands of jobs in construction over the next four years.
8 Chapter 1 Service Delivery 2009-10

The infrastructure investment program in this budget includes the following:
$4.9 billion under the Victorian Transport Plan (VTP). This is the first of the VTP funding announcements, which will increase the capacity of the transport network and enhance productive capacity in the future;
$2.9 billion in education facilities and schools, including $402 million TEI from the Victorian Government, recognising that Victoria’s economic and social progress is increasingly linked to knowledge, skills and innovation;
$1.7 billion for social housing infrastructure under the Commonwealth Government’s Nation Building – Economic Stimulus Plan and the National Partnership Agreement on Social Housing, with a portion of this funding to be provided to housing associations to deliver projects; and
$177 million TEI to invest in health services through funding hospital and community health facility enhancements and upgrades.
These 2009-10 Budget announcements build on other major infrastructure projects currently underway or nearing completion, which are securing jobs and transforming the state. These include:
a new Royal Children’s Hospital, which will combine world-class health facilities with an iconic design;
the new Melbourne Convention Centre, which when combined with the Exhibition Centre will be the largest convention and exhibition facility in Australia;
the Channel Deepening Project, which will maintain the Port of Melbourne’s status as the largest and most efficient container port in Australia and deliver ongoing economic benefits to the State;
a desalination plant, which will provide 150 billion litres of water each year – more than a third of Melbourne’s annual needs; and
a new rectangular stadium in the Melbourne and Olympic Park precinct, which will enhance Melbourne’s reputation as the home of Australian sport.
This record infrastructure investment will create world-class infrastructure and offer significant long-term returns to the Victorian economy, increasing the economic, social and environmental benefits for the current and future generations.
Responding to the bushfiresThe February 2009 Victorian bushfires were the worst in Australian history in terms of the scale and breadth of the fires, destruction of property and loss of life. Tragically, 173 people perished in the bushfires and 2 029 homes and 57 businesses were destroyed. Many people also suffered injuries, trauma and extensive damage to their properties.
Service Delivery 2009-10 Chapter 1 9

The Government immediately responded by partnering with the Commonwealth Government and the Red Cross to set up the 2009 Victorian Bushfire Appeal Fund to support fire victims. Donations from Australians and abroad have been very generous with more than $330 million raised. An independent advisory panel established to determine how best to use the donations has already allocated more than $240 million to support bushfire victims and assist in the rebuilding and recovery process.
The Government has committed significant resources to fighting the fires and introduced a range of initiatives to support individuals, businesses and communities affected by the bushfires. The Commonwealth Government has shared the cost of many of these initiatives on a dollar for dollar basis, under the National Disaster Relief and Recovery Arrangements and has also worked in partnership with Victoria to deliver programs and support, and ensure services are integrated.
To ensure that Victoria is well prepared to manage and respond to future bushfires, the Government announced a Royal Commission into the 2009 Victorian bushfires, to be led by Justice Bernard Teague. The Royal Commission has broad terms of reference and will investigate the causes and responses to the bushfires and provide recommendations on bushfire prevention, response policy and practices. An interim report will be released on 17 August 2009 and the final report is due by 31 July 2010.
Ahead of the interim report, this budget increases funding to emergency services organisations in recognition of the vital role they will continue to play in Victoria’s ability to prepare for, respond to and recover from future bushfires.
The budget provides a total of $908 million over five years and $78 million TEI for bushfire response and recovery.
Fighting the fires and emergency management Emergency services organisations responded to fires across Victoria in the 2009 summer. The 2009-10 Budget includes:
$344 million for fire suppression activities undertaken, including Department of Sustainability and Environment (DSE), Country Fire Authority (CFA), and Metropolitan Fire Brigade operations, inter-jurisdictional assistance, aerial measures and containment line restoration;
$24 million for additional police resources required to respond to the fires, including support from Victoria Police and police from other jurisdictions;
$6.5 million for coronial hearings and victim identification services; and
$5.6 million for bushfire emergency stabilisation works, including stabilising waterways, treating exposed contamination sites and addressing sedimentary issues.
10 Chapter 1 Service Delivery 2009-10
Supporting bushfire affected individuals To ease the hardship experienced by individuals and families affected by the bushfires, the budget includes:
$70 million over two years for case managers to ensure that people can access the range of services that they need;
$33 million and $2.8 million TEI for compassionate assistance, including temporary housing assistance, funeral expenses, emergency health and medical services, counselling services, and emergency hardship grants;
$6.5 million for operational costs in managing the delivery of a range of bushfire relief and recovery services;
$4 million for storage and logistics to ensure that donated goods are distributed efficiently and equitably;
$2 million for the State Government donation to the Red Cross Bushfire Appeal Fund; and
tax relief through the waiving of stamp duty on replacement homes and vehicles, waiving Land Victoria search and registration services fees, and free replacement of driver licences and vehicle registration.
Assisting bushfire affected businessesThe Government recognises that businesses and trade in a number of areas have been affected by the bushfires. The budget provides:
$51 million for a business assistance package to assist small businesses and primary producers through measures including subsidised low-interest loans, business assistance grants and business re-start mentors;
$10 million for a tourism package to encourage tourists to visit regions economically affected by the bushfires through a cooperative marketing, branding and rebuilding program and redevelopment of tourism and visitor facility infrastructure;
$5.1 million for assistance to primary producers, including treating and managing bushfire affected livestock, and repairing or replacing fences;
$4 million for VicForests to commence management of salvage operations in the burnt and damaged Central Highlands forest estate; and
$1.6 million to assist businesses and communities by providing advice, information, grants and other services.
Service Delivery 2009-10 Chapter 1 11

Rebuilding communities The Government is committed to rebuilding communities devastated by the bushfires. This budget provides:
$46 million over two years for a program for clean-up and demolition of hazardous debris to allow rebuilding to commence;
$21 million over two years for the establishment of the Victorian Bushfire Reconstruction and Recovery Authority, which will oversee and coordinate the rebuilding of communities;
$16 million to support local councils recover and rebuild, including the establishment of Municipal Emergency Coordination Centres, relief centres and repair and restoration of council assets;
$15 million to restore roads and public transport services in bushfire affected areas;
$10 million for the Community Recovery Fund which includes grants for sports clubs, community events and other community facilities;
$4.8 million to support schools, kindergartens and students affected by the bushfires;
$1.7 million to support volunteer organisations by providing a range of grants; and
$0.9 million for community building and neighbourhood houses to assist with emergency and relief operations.
Preparing for the futureThe Government recognises the vital role of emergency services organisations in preparing for, responding to and managing future bushfires.
This budget provides $165 million over five years and $76 million TEI for emergency services, including:
$121 million over four years and $46 million TEI to maintain and improve emergency services communications for the public and between emergency services organisations;
$40 million over five years and $29 million TEI to the CFA and the Victoria State Emergency Service (VICSES) for modern fire fighting equipment and additional operational staff; and
$3.9 million to retain and recruit emergency services volunteers and recognise the efforts of volunteer organisations that supported the Government’s response to the 2009 Victorian bushfires.
12 Chapter 1 Service Delivery 2009-10
This budget also provides:
$40 million over two years for the Royal Commission into the 2009 Victorian Bushfires;
$1 million for communication and training material to ensure that the new bushfire building standards are adopted; and
$0.5 million for research to investigate the impacts of bushfires.
In addition, as reported in 2008-09 Budget Update, $53 million over five years has been provided for additional fire management resources to boost prevention and supression capacity to meet future bushfire challenges.
Working cooperatively with the Commonwealth Government The Victorian Government has long been a leader in the pursuit of national reforms and improvements to Commonwealth-State relations through the National Reform Agenda. Working cooperatively with the Commonwealth, the Government has been influential in driving policies and strategies that will deliver improvements in productivity, efficiency and innovation throughout Australia.
In a new era of a cooperative relationship with the Commonwealth Government, the Council of Australian Governments (COAG) meeting in November 2008 produced new agreements to deliver reforms to service delivery areas such as health, education, skills and workforce development, disabilities, and housing. In total, COAG announced a funding package including $96 billion over five years for all states and territories to be invested in the five new National Specific Purpose Payments. As well as this, new National Partnerships payments will fund specific projects and reward states that deliver on nationally significant reforms.
At the February 2009 COAG meeting, new national coordination arrangements were agreed to ensure the timely and effective delivery of the Commonwealth Government’s Nation Building – Economic Stimulus Plan. It is estimated that Victoria will receive around $5 billion in economic stimulus payments from the Commonwealth, building on Victoria’s sustained effort to invest in infrastructure at record levels. Funding to schools, social housing and roads will provide economic stimulus and deliver jobs, and Victoria will play a key role in implementing the package. The 2009-10 Budget includes funding in these areas to maximise the benefits for all Victorians.
The Government is engaging with the Commonwealth Government in seeking access to the Building Australia, Health and Hospitals and Education Investment Funds as a means of complementing its own record infrastructure investment. In November 2008 COAG agreed to develop a process to better coordinate government and private sector infrastructure planning and investment across the nation. The Commonwealth Government is making a significant contribution to Victorian infrastructure through the Nation Building – Economic Stimulus Plan. The Victorian Government will continue to work cooperatively with the Commonwealth Government following Infrastructure
Service Delivery 2009-10 Chapter 1 13
Australia’s announcement on the allocation of funds in the coming months to ensure the best outcomes in infrastructure investment for Victorians.
The Commonwealth Government has agreed to provide $550 million nationally over five years under the Seamless National Economy National Partnership to the states to deliver regulatory reforms that will benefit businesses and strengthen the economy. These reforms will complement the successful work that Victoria continues to undertake through the Reducing the Regulatory Burden initiative. The Commonwealth Government has allocated an initial Seamless National Economy Partnership Payment of $25 million to Victoria to drive reforms in areas such as deregulation and competition. Subsequent reward payments will be available once milestones have been achieved.
MORE QUALITY JOBS AND THRIVING, INNOVATIVE INDUSTRIES During a downturn it is vital that any additional education and training effort be directed to skills required for a twenty-first century workforce. Maintaining training effort in areas that will flourish again when demand picks up will ensure that skill bottlenecks do not constrain growth in the recovery.
The 2009-10 Budget invests in initiatives that will expand the capacity of the Victorian training system and meet the needs of workers and employers.
Investing in the State’s skills baseA key role for government that is accentuated during an economic downturn is to meet increased demand for training by providing more opportunities for people who need to upgrade their skills. The Government took the initiative of reforming the vocational education and training (VET) system before the economic downturn took hold through the $316 million Securing Jobs for Your Future: Skills for Victoria statement. The statement delivers an additional 172 000 training places to meet the needs of individuals and employers.
From 1 July 2009, some Victorians will begin to benefit from a new VET system that is responsive to the needs of individuals and employers and will guarantee a place for anyone who wishes to train at a higher qualification level by 2011. Skills reform will greatly assist Victorians who have been displaced from the workforce or who need to upgrade their skills. A more highly skilled workforce will position Victoria to take advantage of the economic recovery when it occurs.
The Victorian Government has also joined with the Commonwealth to ensure Victorians continue to gain the skills they need during the economic downturn through the Productivity Places Program.
The 2009-10 Budget provides $141 million over five years for additional investment in skills related initiatives including:
14 Chapter 1 Service Delivery 2009-10
$10 million over two years to continue the New Workforce Partnerships program, which creates projects linking Victorian jobseekers facing persistent labour market disadvantage to jobs;
$14 million over two years for the Skills to Transition program which will create over 6 000 training places in 2010 for targeted groups at Certificate I to IV levels;
$22 million for Victoria’s contribution to the Income Contingent Loans scheme which is to be administered by the Commonwealth Government and will allow students at Diploma and Advanced Diploma levels to defer the costs of their tuition until they reach a specified income threshold;
$14 million over four years to ensure that job-seekers who enrol in qualifications at Certificate I to IV levels are not required to pay a personal contribution for their tuition; and
$50 million over three years for an additional 15 000 training places under the Productivity Places Program which will help meet an expected increased in demand for training places during a period of slower economic growth.
In addition, in this budget the Victorian Government is:
making a $67 million TEI contribution towards a new state-wide TAFE Student Management Solution that will replace a number of systems nearing the end of their technological life, enable better management and coordination of students’ pathways and needs to assist in delivering skills reform; and
providing $3 million for the development of an Aviation Centre of Excellence at the Kangan Batman Institute of TAFE in Tullamarine.
Education Investment FundSince coming to office, the Government has provided over $420 million TEI in infrastructure funding to Victorian TAFE providers. The Commonwealth Government’s Education Investment Fund presents an opportunity for Victorian TAFE providers, universities and research institutes to accelerate their infrastructure programs and provide a stimulus to the economy.
The Commonwealth Government has also established a $500 million Teaching and Learning Capital Fund for VET as part of the Nation Building – Economic Stimulus Plan that will provide infrastructure grants of up to $8 million to all Victorian TAFE providers and a competitive grants process for additional projects. The Government will work with successful institutes to ensure funded projects can begin as soon as possible.
Improving vocational education and training opportunitiesThe Government recognises the importance of providing young people with a range of opportunities to meet their vocational interests and addressing skills shortages in traditional trades and emerging industries.
Service Delivery 2009-10 Chapter 1 15
The 2009-10 Budget includes:
$25 million for one year to extend the Apprentice/Trainee Completion Bonus which will encourage employers to continue to employ apprentices and trainees during the economic downturn;
$15 million over two years to improve access for government school students to nationally accredited vocational subjects as part of the Victorian Certificate of Education and Victorian Certificate of Applied Learning programs; and
estimated Commonwealth funding of $146 million to Victorian government schools for Trade Training Centres.
Accelerating planning to create jobsThe Government is clearing the path for key building projects to create more jobs and provide a boost to the Victorian economy. The 2009-10 Budget provides $5.2 million over four years to expand the Government’s development facilitation role and establish a one-stop-shop assessment and approval process to streamline planning decisions for key projects.
The planning permit assessment and approval process is currently paper based. The 2009-10 Budget provides $7 million TEI and $3.4 million over four years to make all planning applications electronic and available online, significantly reducing the time required to process applications and improving the clarity and certainty of the application process.
Building Our Industries for the FutureIn November 2008, the Government announced its industry and manufacturing strategy Building Our Industries for the Future, which provides a blueprint for industry during a time of uncertainty.
The strategy brings together $245 million of initiatives that will assist Victorian industries to identify new opportunities that will create jobs and grow exports. The centrepiece of the strategy is the $50 million Industry Transition Fund which will assist firms that are strategically important and able to move into emerging markets by investing in new technologies, developing skills and creating sustainability through the economic downturn.
Also included in the plan are several initiatives aimed at strengthening specific industry sectors including:
$8 million over four years for the Defence Industry Acceleration Program;
$6.8 million over four years for the Victorian Automotive Manufacturing Action Plan;
$4.2 million over four years for the Export Clusters Program; and
$1.2 million over four years for financial services initiatives.
16 Chapter 1 Service Delivery 2009-10

In the 2009-10 Budget, the government will provide $1.2 million over two years to establish the Transport Infrastructure Manufacturing Scheme to boost Victoria’s capability to manufacture trains, buses and other major transport assets, helping to create jobs and support Victorian industry.
Innovation: Victoria’s FutureIn order to maintain its competitive advantage in a complex global environment, Victorian industries must find new ways to add value through innovation to continue to maintain and create jobs. Since the 2008-09 Budget, the Government has renewed its innovation policy in the form of the Innovation: Victoria’s Future statement.
Innovation: Victoria’s Future brings the total of innovation-related initiatives announced since 1999 to $3.4 billion, including two previous generations of the Science, Technology and Innovation initiative.
Innovation: Victoria’s Future includes:
$145 million over four years for Victoria’s Science Agenda Investment Fund;
$40 million over four years to support highly innovative small and medium enterprises;
$35 million over four years to improve information and communication technology capability; and
$20 million over four years for the Biotechnology Strategic Development Plan.
GROWING AND LINKING ALL OF VICTORIAIn the face of strong population growth the Government is responding to growing demand for transport infrastructure and services across the State.
In December 2008, the Government released its long term vision for the Victorian transport system, the Victorian Transport Plan (VTP). The goal of the $38 billion VTP is to transform Victoria’s transport networks for a more liveable, productive and sustainable state.
The 2009-10 Budget provides over $4.9 billion in funding to deliver new services and infrastructure including projects to be delivered in partnership with the Commonwealth against key VTP objectives to begin the transformation of Victoria’s transport system:
Linking rural, regional and metropolitan Victoria – the continued growth of regional Victoria is supported through major investment in transport links to support key regional communities and industries, improve safety on the transport network and meet current demand and future growth.
Better public transport – trains, buses and trams - significant new capacity will be built into the existing network, while short, medium and long term initiatives will be introduced to extend the reach of the public transport network into growth areas.
Service Delivery 2009-10 Chapter 1 17

Moving around Melbourne – a range of measures have been funded to deliver new and upgraded roads that cater for all users, while reducing congestion and improving safety.
Shaping Victoria and taking practical steps for a more sustainable state – the budget provides funding for integrating transport and development to enable more people to live closer to their workplaces and other opportunities, and initiatives to move towards a more sustainable and low emission transport system.
Strengthening Victoria’s and Australia’s economy – investment in projects that improve connections between freight origins and destinations in metropolitan Melbourne and across regional Victoria.
The 2009-10 Budget delivers a number of commitments in the first full year of the VTP providing a significant economic boost to the state with new investment and thousands of direct and indirect jobs. Of the 47 State prioritised projects identified in the VTP, 34 projects will commence in the 2009-10 year or earlier, with a further range of road and rail projects to be commenced in partnership with the Commonwealth Government, under the Nation Building (AusLink II) program.
The State Government is also continuing to work with the Commonwealth Government to secure support through the Building Australia Fund to deliver additional key transport projects for Victoria.
Better Roads
Linking rural, regional and metropolitan Victoria In partnership with the Commonwealth Government, the Government will commence a number of Nation Building (AusLink II) road projects in regional locations with a total TEI of $716 million.
State regional arterial roads will also be enhanced to better connect regional communities and support ongoing investment in regional Victoria. The 2009-10 Budget will provide $102 million TEI to deliver improvements and upgrades.
18 Chapter 1 Service Delivery 2009-10

Moving around MelbourneA range of measures have been funded to ensure metropolitan roads cater for all users, while reducing congestion and improving safety.
The Government will construct the Peninsula Link, a 25 kilometre connection between EastLink at Carrum Downs to the Mornington Peninsula Freeway at Mount Martha to improve traffic flow, unblock congestion in the Frankston area, and better link communities. This budget provides $354 million TEI to ensure work commences on this project in 2009-10. Peninsula Link has a budgeted cost of $750 million under the VTP. The State Government continues to work cooperatively with the Commonwealth Government to secure a funding contribution to deliver this initiative in partnership.
In addition, work will commence on the Dingley Arterial linking Perry Road and Springvale Road at Westall Road with funding of $75 million TEI provided in the 2009-10 Budget. A program of new and upgraded arterial routes and priority outer suburban roads will also commence in 2009-10 with funding of $29 million TEI to improve safety and capacity.
The State Government, in partnership with the Commonwealth Government will separate the rail and road level crossing at Springvale Road, Nunawading, allowing for the smooth flow of traffic and trains, as well as planning for future grade separations, at a total of $142 million TEI.
The budget also provides state funding for the commencement of a number of Nation Building (AusLink II) projects around the metropolitan area to be delivered in partnership with the Commonwealth Government. The TEI for these projects is $1.1 billion.
Better public transport – trains, buses and tramsThe 2009-10 Budget provides significant new investment to increase the capacity of the existing public transport network over the short to medium term. Funding of $721 million TEI and $62 million over four years will deliver:
20 new metropolitan trains and associated maintenance and stabling facilities – bringing the total number of new metropolitan trains on order to 38; and
a package of innovative approaches to address rail service efficiencies across the network.
The 2009-10 Budget also provides funding of $904 million TEI to extend rail services to growth areas including:
$559 million TEI to construct the 5 kilometre duplication from Keon Park to Epping and to extend the metropolitan rail network by 3.5 kilometres from Epping to South Morang including the construction of a new premium station at South Morang;
Service Delivery 2009-10 Chapter 1 19
$195 million TEI to extend the metropolitan rail network by 15 kilometres through the electrification of the track between Watergardens and Sunbury; and
$151 million TEI for new stations to cater for growing communities at Williams Landing, Lynbrook and Caroline Springs.
The 2009-10 Budget continues the Government’s investment in improving public transport safety with funding of $19 million over four years for 50 extra transit police, and $8.7 million TEI to upgrade safety and amenity at metropolitan stations. This is in addition to $4 million provided under the Taxi Rank Safety Program which will provide grants to local government to install and upgrade taxi rank infrastructure to improve amenity and safety at highly patronised taxi ranks.
The 2009-10 Budget also provides $81 million TEI and $173 million over four years for additional metropolitan bus services including:
the Doncaster Area Rapid Transit service which will upgrade the key peak hour commuter bus routes from Doncaster into the central business district to a 10 minute service frequency in peak periods;
the further roll-out of the SmartBus Yellow orbital network from Whitehorse Road to Melbourne Airport; and
the expansion of a range of metropolitan bus services into new suburbs.
The 2009-10 Budget will also provide $5 million TEI to enable procurement planning to commence for the purchase of up to 50 new low floor trams for Melbourne.
Strengthening public transport in regional VictoriaThe 2009-10 Budget provides $8.7 million TEI to commence upgrades to railway stations in regional Victoria. Funding will provide for car parking upgrades and improved amenity and safety measures.
In addition to the existing order of 54 regional train carriages, the 2009-10 Budget includes funding of $19 million TEI and $8.5 million over four years to re-establish passenger rail services to Maryborough.
Further, funding of $5.9 million TEI and $17 million over four years has been provided to improve bus services in the Greater Geelong Region.
The 2009-10 Budget also includes $20 million over two years to upgrade rural airports across the State.
Toward a sustainable transport systemThe Government recognises the need for new and innovative approaches to facilitate a shift to a sustainable and lower emissions transport system to help Victorians preserve their environment.
20 Chapter 1 Service Delivery 2009-10
In addition to initiatives that increase the frequency, reliability and safety of public transport, the Government has committed funding to implement its Cycling Strategy. Funding of $13 million TEI is provided for bicycle lanes and shared walking and cycling paths, including the extension of the Federation Trail between Millers Road, Altona and Williamstown Road, Yarraville. The budget also provides funding of $10 million to improve rail trails and off-road walking and cycling paths in regional Victoria.
The 2009-10 Budget also provides funding of $5 million over four years for a new public bicycle hire scheme for inner Melbourne.
To encourage change in public behaviour and attitudes, $4.2 million over four years is provided for initiatives that promote the use of low emission vehicles and $5.4 million over four years is provided to encourage Victorians to car pool to work and school.
HIGH QUALITY, ACCESSIBLE HEALTH AND COMMUNITY SERVICESVictorians enjoy one of the longest life expectancies in the world, however the quality of life can be affected by ill health. In order to continue the improvement in Victorians’ life expectancy, the Government is committed to making sure that health and community services continue to be accessible and of a high quality. Since 1999, the Government has invested in delivering better health outcomes and provided an additional $3.8 billion to expand the capacity of the hospital sector. This investment has enabled our hospitals to now provide over 600 000 more treatments than in 1999, including 350 000 extra admissions. An additional $5.1 billion TEI has also been allocated to rebuild and refurbish health, aged care and community services facilities since the Government came to office.
The 2009-10 Budget expands on this investment and delivers on a number of agreed COAG reforms.
Sustaining our health system and working with the CommonwealthIn November 2008, COAG agreed to a significant boost for health funding, which will increase services to the community and build the foundations for genuine reform. The National Healthcare agreement is worth approximately $14.7 billion over five years and a new practical framework for health reform will be introduced including transparency, accountability and performance measurement. It will require all sectors to work together – government, community and private sector – to embrace reform and commit new resources to investing in the health of all Australians. It will also support people to take responsibility for their own health and wellbeing. The Intergovernmental Agreement on Federal Financial Relations also introduces a number of supporting National Partnerships focused on taking the pressure off public hospitals, and investing in the health workforce and preventive health measures.
The 2009-10 Budget provides $1.1 billion over five years for health and hospitals, including funding provided by the Commonwealth under National Partnerships.
Service Delivery 2009-10 Chapter 1 21

Sustaining our hospitals and health workforceThrough the National Partnership Agreement on Hospital and Health Workforce Reform, Victoria will work with the Commonwealth to pursue reforms and improvements in the health and hospital sector, to address increasing demand pressures driven by factors such as an ageing population and the increased incidence of chronic disease.
The 2009-10 Budget commits $781 million over five years to expand hospital services. This investment will meet Victoria’s commitments to expand sub-acute and emergency department services under the National Partnership, as well as providing extra funding for additional acute inpatient services, and growth in essential services such as renal dialysis and chemotherapy.
Key initiatives include:
$350 million over five years to expand inpatient services and open an additional 100 acute beds, which will treat an additional 39 500 patients in Victoria’s public hospitals;
$179 million over five years to expand sub-acute services, which will improve the management of patient flow. This includes $148 million for new sub-acute beds and $17 million for the expansion of the Transition Care Places Program;
$57 million over five years to relieve system pressure and increase access to emergency care;
$45 million over four years to enable more patients to receive medical services such as renal dialysis, chemotherapy and radiotherapy;
$64 million over five years and $1 million TEI for critical care and retrieval services, including neonatal cots and intensive care beds;
$24 million over five years for the Hospital Admission Risk Program and additional community rehabilitation services to treat patients; and
$24 million over four years for new mental health services, including new inpatient beds at Maroondah Hospital, an enhancement of the specialist residential services at Ambermere and increased community support for mental health patients with severe symptoms.
On top of this investment, an additional $45 million in 2009-10 is also provided for an elective surgery blitz to treat an additional 9 000 patients.
The National Partnership also recognises the critical importance of investing in the health workforce in order to meet the future challenges of the health system. The 2009-10 Budget provides $72 million over four years for Victoria’s contribution to clinical placement subsidies and a national registration and accreditation scheme.
As part of reforms to increase efficiency in public hospitals, the 2009-10 Budget allocates $35 million over four years to meet Victoria’s commitment under the National Partnership Agreement on Hospital and Health Workforce Reform to support the 22 Chapter 1 Service Delivery 2009-10

implementation of a nationally consistent activity based funding system. In addition, the Victorian Government will promote better utilisation of hospital resources by providing $25 million in 2009-10 for Support for Public Hospitals, to fund clinical practice improvements and a range of cost control reforms.
The 2009-10 Budget also provides:
$27 million over three years for Victoria's contribution to the National E-health Transition Authority to enable it to continue its existing work program;
$7.8 million over four years to extend and enhance communicable disease initiatives, including prevention and screening for tuberculosis; and
$2.7 million over two years for the National Partnership Agreement on Preventive Health, with an initial focus on the development of an implementation plan prior to significant investment commencing in 2011-12.
Rural and regional dental care The Government has a strong commitment to improving the dental health of Victorians, allocating $21 million over four years for those who have difficulty accessing or affording treatment.
This funding will address the shortage of dentists in rural and regional Victoria by commissioning new training clinics in Wodonga and Bendigo.
The Government will also address long waiting lists in Melbourne and regional Victoria, including Ballarat, Geelong and Moe by enabling an extra 20 000 public dental patients to be treated. This will include the provision of general dental care and dentures to those in the greatest need.
Health care facilitiesSince 1999, the Government has invested $4.8 billion to build or refurbish health and aged care facilities. The Government is currently improving suburban hospitals at Sunshine, Frankston, Dandenong, Kingston Centre and Caulfield, and is completing the development of the Royal Children’s Hospital.
The 2009-10 Budget provides an additional $177 million TEI for hospital and community health assets, including:
$55 million TEI to upgrade facilities and infrastructure at Bendigo Hospital;
$30 million TEI for an expansion of services at Geelong Hospital;
$26 million TEI for the construction of a new Integrated Care Centre at Warrnambool Hospital;
$20 million TEI for a redevelopment at Ballarat Hospital including coronary services and an expansion of the special care nursery;
Service Delivery 2009-10 Chapter 1 23
$19 million TEI to redevelop the Alexandra District Hospital, including capital contributions of $3.7 million from health agencies;
$6.4 million TEI for a new operating theatre suite and recovery services at Sunbury Day Hospital;
$3.1 million TEI to provide accommodation for the Rosebud Community Health Centre, which was destroyed by fire in 2008;
$2.5 million TEI for the Monashlink Community Health Centre Oakleigh; and
$1 million TEI to expand critical care services in metropolitan and regional Victoria.
The Commonwealth’s Health and Hospitals Fund also provides a significant opportunity for a further boost to health infrastructure in Victoria. Announcements regarding specific projects to be funded will be made once Commonwealth consideration of applications is completed.
Mental health reformThe Government continues its focus on promoting good mental health, and supporting the treatment and recovery of those who experience mental health problems. The 2009-10 Budget provides significant new investment to continue implementing Because Mental Health Matters: Victorian Mental Health Reform Strategy 2009-2019.
Funding of $84 million over four years is allocated to new measures focused on early intervention and effective and coordinated health and social care that will enable people with mental health conditions to lead fulfilling lives. Key initiatives include:
$38 million over four years to build foundations for recovery and participation through coordination of care for people with multiple needs, and providing supported housing and court support services;
$21 million over four years to provide increased support for young people experiencing mental health problems; and
$11 million over four years for an enhanced triage referral service including a follow up service that ensures people seeking assistance have accessed appropriate care.
In addition, $24 million over four years for new mental health services is funded as part of the Sustaining Health Services Capacity initiative.
The 2009-10 Budget will provide new mental health care facilities, including:
$66 million TEI for a redevelopment and expansion of mental health services provided by Dandenong Hospital; and
$8 million TEI for Youth Prevention and Recovery Care Services in Bendigo and Frankston.
24 Chapter 1 Service Delivery 2009-10

The expansion of services at Geelong Hospital will also provide an additional eight mental health care beds.
Seniors and aged careThe Government continues its commitment to services that enhance the capacity of senior Victorians to maintain their independence and personal safety in the home and engage in the community. Key initiatives include:
$50 million over four years for additional Home and Community Care Services which provide practical support to enable people to remain in their own home;
$5.8 million over four years to provide personal alerts and monitoring services to an additional 4000 senior Victorians; and
$2 million over two years to boost the Men's Sheds program, which provides opportunities for men to learn new skills and get involved in their local community.
The 2009-10 Budget provides $3 million TEI to continue the Aged Care Land Bank Program. This will enable senior Victorians to access residential aged care close to their family and neighbourhoods, by providing land in inner and middle suburbs to not-for-profit agencies to build aged care facilities.
HIGH QUALITY EDUCATION AND TRAINING FOR LIFELONG LEARNINGEducation is the Government’s number one priority. The Government’s goal in education and early childhood development is to ensure children and their families are consistently supported from birth to adulthood. This goal was behind the creation of the Department of Education and Early Childhood Development in 2007, and the ongoing focus on developing strong literacy and numeracy skills in primary school as a basis for advanced education and training.
The 2009-10 Budget acts on this goal by providing further support to the Government’s Blueprint for Education and Early Childhood Development and a historic level of funding to implement the Victorian Schools Plan and Building the Education Revolution. The Budget also reflects Victoria’s strong commitment to work in partnership with the Commonwealth Government and other states to pursue ambitious educational reforms as outlined by COAG in November 2008.
A significant investment in Victorian Government schoolsThe 2009-10 Budget announces a record investment in government schools. The investment recognises that high quality school infrastructure is critical to delivering excellent educational outcomes. The infrastructure build will also provide for immediate construction activity to stimulate the economy and create jobs. This historic level of investment will lead to a $2.9 billion injection of new funding into Victorian government schools.
Service Delivery 2009-10 Chapter 1 25

The Victorian Schools Plan has committed $1.9 billion of State investment over four years towards schools with the goal of rebuilding or modernising all government schools over 10 years. This budget continues the Government’s investment with a further $402 million TEI instalment of the Victorian Schools Plan.
The Commonwealth Government builds on that plan with a significant contribution through the Building the Education Revolution initiative. The State and Commonwealth Government funding commitments demonstrate the importance both governments place in creating and sustaining jobs; and positioning schools to provide the educational needs of future generations.
The Victorian investment of $402 million TEI in the 2009-10 Budget will provide:
$128 million TEI for modernisation projects;
$92 million TEI for regeneration projects;
$47 million TEI for priority projects including a replacement school at Glenroy Specialist School;
$31 million TEI to purchase land for new schools;
$25 million TEI for four new schools;
$24 million TEI for co-educational Select Entry Schools at Berwick and Melbourne’s West;
$19 million TEI for new energy efficient relocatable classrooms which will provide flexible solutions to the changing accommodation needs of schools due to enrolment growth or emergencies such as fires;
$16 million TEI for the replacement of relocatable buildings with permanent modern facilities at rural schools;
$12 million TEI for three Maths and Science Specialist Centres; and
$7.6 million TEI for Better Schools Today projects.
The funding from the Building the Education Revolution initiative and Victorian Schools Plan will be used collaboratively to ensure that the opportunities provided to schools are maximised. Construction on projects under the Building the Education Revolution initiative will commence immediately.
The Building the Education Revolution initiative provides $2 billion to government schools to build major new infrastructure for primary schools and all special schools as part of the Primary Schools for the 21st Century program. Buildings that will be funded include libraries, multipurpose halls, indoor sporting centres, performing arts centres and classrooms. Where a school already has a contemporary library or hall, refurbishment of existing facilities will take place.
A further $209 million will be allocated to Victorian government schools for maintenance and minor works as part of the National School Pride program. This program will enable Australian schools – primary and secondary, government and 26 Chapter 1 Service Delivery 2009-10

non-government – to undertake construction of small scale infrastructure and/or minor refurbishment projects.
Funding for science and language centres in secondary schools will also flow to those Victorian secondary schools that have the greatest need as well as a demonstrated capacity to build the facilities within the 2009-10 financial year. The final amount of funding to be allocated to Victorian schools will be subject to a competitive bidding process.
Supporting early childhood – the importance of a good start early in lifeThe 2008 Blueprint for Education and Early Childhood Development outlines the Government’s five-year reform agenda for education and early childhood services. Victoria has a high level of participation in kindergarten and learning programs, and as part of the 2009-10 Budget, the Government is providing funding of $14 million in 2009 to ensure sufficient kindergarten places are funded to meet the recent growth in the birth rate.
The 2009-10 Budget also allocates $211 million in funding from the Commonwealth Government for the National Partnership on Early Childhood Education to help Victoria meet the COAG target of delivering access to 15 hours of preschool a week to all four year olds by 2013.
Increasing support for the Victorian school systemThe Government, as part of the 2009-10 Budget, is substantially increasing support to the Victorian school system through:
$46 million for the continuation of 200 teaching and learning coaches who will work with teachers in selected schools to build their capacity to improve student learning outcomes, particularly in maths and science;
$54 million for capital grants to non-government schools in need as announced in the 2008-09 Budget Update; and
$2.5 million for a community engagement project that will develop local and state-wide information for families and communities on twenty-first century approaches to learning and teaching, including changes to school configurations, new forms of curriculum and the role of technology in the classroom.
Service Delivery 2009-10 Chapter 1 27
National Partnerships – a new way of delivering improved educational outcomesVictoria is working cooperatively with the Commonwealth Government to deliver key reforms in the areas of teacher quality, literacy and numeracy, and low socio-economic status school communities. These reforms will be delivered through National Partnerships arrangements, which aim to improve educational outcomes.
These reform areas were also identified by the Victorian Government in the 2008 Blueprint for Education and Early Childhood Development for which funding was announced in the 2008-09 Budget. The 2009-10 Budget will provide a further $38 million in additional state funding beyond Victoria’ required co-investment under the National Partnership agreements. This will ensure Victoria achieves COAG targets across a range of key education areas, such as teacher quality and literacy and numeracy.
The Commonwealth Government will provide funding to schools through National Partnerships in the 2009-10 Budget, including:
$24 million over four years for the National Partnership on Improving Teacher Quality in acknowledgement that improving and maintaining the quality of the teaching workforce in this country will be fundamental to any overall improvements in Australian schooling;
$27 million over two years for the National Partnership on Literacy and Numeracy to fund a range of approaches to accelerate improvement in literacy and numeracy outcomes for targeted students and schools; and
$275 million over seven years for the National Partnership on Low Socio-economic Status School Communities to fund a range of within school and out-of-school reforms that will support the educational and wellbeing needs of students and schools in low socio-economic status communities.
This new funding, in combination with existing Victorian Government funding already targeting these action areas, will make a real difference to educational outcomes and student performance.
Implementing the Digital Education RevolutionThe Commonwealth Government’s Digital Education Revolution program aims to make sustainable and meaningful change to teaching and learning in Australian schools by preparing students for further education, training and life and work in a digital world.
The 2009-10 Budget recognises the Commonwealth Government’s investment of $497 million for the National Secondary School Computer Fund, to provide for the purchase and deployment of computers for government and non-government secondary school students in years to 9 to 12. In addition, the Victorian Government is providing $12 million of funding over four years to assist with the implementation of this initiative.28 Chapter 1 Service Delivery 2009-10
As part of Labor’s Financial Statement 2006, the Victorian Government is also providing $7 million for computers in schools to enable up to 7 000 new or replacement computers to be purchased by government schools. In addition, the 2009-10 Budget provides $12 million for the continuation of 50 Ultranet coaches to work with government schools in implementing Ultranet, a state-wide online teaching and learning ICT system.
PROTECTING THE ENVIRONMENT FOR FUTURE GENERATIONSThe government has demonstrated a commitment to protecting the environment. The Government remains committed to actively constructing and managing the natural environment in order to achieve the state’s social and economic goals and to preserve the diverse environment for future generations to enjoy.
Protecting the environmentIn 2009-10 the Government will deliver comprehensive strategies relating to the environment that address land issues, biodiversity and climate change.
As a signatory to the Murray-Darling Basin Agreement, Victoria is committed to its role in the national process to protect and enhance the most important water resource in Australia. The Government provides funding to the Murray-Darling Basin Authority to develop and implement policies and programs that are aimed at addressing the environmental and efficienct issues that historically have limited the effectiveness of water management policy between multiple jurisdictions.
River Red GumsRecognising the importance of the environment, the Government is allocating $32 million over four years and $6.5 million TEI to the River Red Gums strategy – a far reaching initiative that will establish four new national parks and introduce significant changes to public land management. The project forms the Government’s response to the Victorian Environment Assessment Council’s River Red Gums Forests Investigation Report and delivers on the Victoria’s National Parks and Biodiversity election policy to create new national forest parks. Acknowledging the impact of this initiative on timber industry jobs, the strategy includes a structural adjustment package aimed at assisting the transition of timber workers into new employment, including active forest management.
The River Red Gums strategy will also facilitate the voluntary take up of fencing by private land owners along river frontages and undertake structural works to deliver and manage environmental water. These works will be built in wetlands which have high environmental value and will include regulators and channels, either direct from the rivers or from irrigation supply systems. The community will benefit from significantly increased opportunities for recreational use of the new national parks and the expansion of other parks and conservation reserves.
Service Delivery 2009-10 Chapter 1 29

Upgrading parks and conservation areasThis Budget reinforces the Government’s commitment to improving Victoria’s parks through a $24 million parks package. The package contains initiatives that will enhance public amenity at parks across the state, including:
$4 million TEI to upgrade and plan for key infrastructure across Port Phillip and Westernport Bays;
delivering on an election commitment, State funding of $10 million TEI and $4 million over four years will be combined with a Commonwealth Government contribution to increase the size of the Point Nepean National Park and open the site of the Quarantine Station to the community;
$2 million over four years to maintain and improve Yarra Bend Park's existing assets and conservation areas;
$2 million TEI to provide additional works at the Frankston Reservoir and Dingley Chain of Parks; and
$2 million TEI to allow priority works to be undertaken at six outer urban parks including Tarneit, Melton, Yan Yean and Narre Warren.
EFFICIENT USE OF NATURAL RESOURCESThe Garnaut Review confirmed that Australia will be adversely affected by global warming and needs to accelerate action to reduce greenhouse gas emissions. The Government is committed to playing a leading role in national and international efforts. The Commonwealth Government’s Carbon Pollution Reduction Scheme White Paper represents a major step in Australia’s transition to a low-carbon economy. Analysis of the implications of the White Paper and public consultations through the Premier’s Climate Change Summit will inform a Victorian Government Climate Change Green Paper to be released in mid 2009. Following this, a broad public consultation program will be conducted before finalising a Victorian climate change policy in a white paper to be released later this year.
Large-scale solar facilitationThe 2009-10 Budget allocates up to $100 million (net present value) to encourage large-scale solar power generation in Victoria. Subject to a matching contribution from the Commonwealth Government’s Renewable Energy Demonstration Program, this funding will facilitate the construction of a solar power station that can produce about 330 gigawatt hours of electricity a year or enough power to run 50 000 homes. With the new power station likely to be situated in the north of the State, this project will drive investment and create jobs in regional Victoria.
30 Chapter 1 Service Delivery 2009-10

This initiative builds on existing government support for the solar industry, and the proposed premium feed-in tariff applicable to roof-top photovoltaic systems. Combined with the State’s $50 million contribution to the Solar Systems large-scale power plant, it is a key pathway for delivering low emissions energy and diversifying Victoria’s renewable energy supply, which is currently sourced predominantly from hydro and wind power.
Gippsland regional infrastructure developmentVictoria has one of the world’s largest reserves of brown coal. Although this resource has traditionally been used for electricity generation, emerging technologies including non power technology to produce export commodities have the potential to attract major investment and enable the future development of the coal industry in a carbon constrained, ‘green’ economy.
The 2009-10 Budget provides $1 million for the Gippsland Regional Infrastructure Development initiative, which will commence the identification of road, rail and port infrastructure needed to support the growth of coal based industries in regional Victoria. This is the first step in removing barriers to investment and creating new employment opportunities in the Latrobe Valley.
BiosecurityBiosecurity is fundamental to the health, wellbeing and prosperity of all Victorians. It is essential that Victoria remains vigilant towards harmful pests and diseases that affect agriculture and the natural environment in other parts of the world in order to maintain market access and support trade and jobs. To this end, the Government has provided $13 million during 2008-09 to manage and eradicate outbreaks of fruit flies, locusts and potato cyst nematode.
However, the Government recognises that emerging biosecurity threats will require different strategies and capabilities to those employed previously. With this in mind, the Government is developing a new biosecurity strategy that will build on the existing system and introduce an integrated, flexible and innovative approach to biosecurity risks across all sectors. Implementation of the strategy commences later in 2009 with a refocusing of current programs and an emphasis on collaboration between government, industry and the community.
BUILDING FRIENDLY, CONFIDENT AND SAFE COMMUNITIESIn October 2008, the Government released Justice Statement 2 which provides a renewed focus on maintaining and improving services in Victoria’s justice system. The 2009-10 Budget commits a further $330 million over four years and $80 million TEI to strengthen the justice system, enhance policing and expand corrections services.
Service Delivery 2009-10 Chapter 1 31

Improving access to JusticeAccess to justice will be improved with $57 million over four years to address over-representation of offenders from disadvantaged and marginalised backgrounds, reduce re-offending and better respond to the needs of people with mental health issues who come into contact with the justice system. Initiatives funded in the 2009-10 Budget include:
$25 million in 2009-10 for Victoria Legal Aid, which provides essential duty lawyer services and legal representation to disadvantaged Victorians who are unable to afford legal assistance;
$14 million over four years through the Victorian Mental Health Reform Strategy to trial a new Mental Health List pilot in the Melbourne Magistrates’ Court to better meet the needs of people with a mental illness. This will provide additional support to offenders including mental health assessments, and referrals to appropriate community based services to help reduce the underlying causes of offending;
$11 million over two years to extend the Court Integrated Services Program, which provides offenders from disadvantaged backgrounds with a multidisciplinary intervention program and priority access to treatment services to reduce re-offending; and
$7.5 million over four years to ensure the continuation of the Sentencing Advisory Council to inform, educate and advise on sentencing issues and ensure that properly informed public opinion is incorporated into the sentencing process.
The successful Family Violence Court Division operating at the Ballarat and Heidelberg Magistrates’ Courts will continue, with the allocation of $11 million over four years. This reaffirms the Government’s commitment to improving the safety of all Victorians experiencing family violence, and holding perpetrators accountable for their behaviour.
The Government is working with Victorians to build stronger and safer communities. This budget provides $31 million over four years for communities and service providers to work together to address local justice issues, including:
$26 million over four years to extend the Neighbourhood Justice Centre pilot in Collingwood. This builds community involvement in the justice system and pioneers a new approach to deliver justice more effectively. The centre provides mediation, restorative justice and crime prevention programs which to date have shown improved completion rates for community corrections and lower breach rates for family intervention orders.
$4.5 million over two years to build on the Graffiti Prevention and Removal Strategy which will clean up an estimated 350 000 square metres of graffiti (equal to an area almost the size of 18 MCG playing fields) and assist communities to deliver local responses to graffiti.
32 Chapter 1 Service Delivery 2009-10

Safety and crime preventionSince coming to office, the Government has boosted police resources, resulting in an extra 1 400 frontline police being employed. As announced by the Government in the 2007-08 Budget, an additional 350 sworn officers will be recruited before November 2010. This investment together with the efforts of Victoria Police has resulted in a 24.5 per cent reduction in the overall crime rate since 2000-01.
This budget commits an additional $54 million over four years and $28 million TEI to reduce crime, improve public safety and provide Victoria Police with improved infrastructure to ensure Victoria remains the safest place to live in Australia.
To deter and disrupt serious and organised crime, $14 million over four years is provided to continue the Asset Confiscation Scheme which restrains and forfeits property used in, or derived from criminal activity
To boost safety on the public transport network and increase passenger security, $19 million over four years has been committed for an additional 50 transit police to patrol the network, consistent with the VTP. This will take the total number of transit police to 250 and allow for more patrols on trains and trams, especially at night.
In this budget, the Government will continue to upgrade police infrastructure. Funding of $28 million TEI and $4.8 million over four years will be used to replace or upgrade 10 police stations in rural and regional Victoria. This includes stations at Castlemaine, Axedale, Buninyong, Koo Wee Rup, Pyalong, Balmoral, Riddells Creek, Korumburra, Lara, Mortlake and seed funding for South Melbourne and Prahran. To provide improved working facilities for police, $16 million over two years is allocated for refurbishments to Victoria Police accommodation at the World Trade Centre.
Road safety Many Victorians are impacted by road trauma each year with speed, drink driving and drug-impaired driving being major contributors. Under the Government’s road safety strategy, Arrive Alive 2, the Government aims to save an estimated 100 extra lives and prevent around 2 000 serious injuries a year by the end of 2017. The 2009-10 Budget provides additional funding of $127 million over four years and $28 million TEI to support the fight against the road toll through a range of road safety initiatives.
More than 30 per cent of fatal accidents on Victorian roads are caused by speed. In the 2009-10 Budget, $102 million and $22 million TEI will be provided towards enhancing enforcement of speed restrictions through the allocation of additional mobile camera hours, upgrades of red-light road safety camera technology, and additional moving mode radars in police vehicles. This enhanced detection will focus on high speed zones in country areas and better location targeting of high-risk crash sites.
Service Delivery 2009-10 Chapter 1 33

While the impacts of drink driving are well known, drug driving is emerging as a major contributor to trauma on our roads, with over 30 per cent of drivers involved in fatal crashes on our roads having one or more impairing drugs in their blood. The Budget provides $9.7 million over four years and $0.3 million TEI for Victoria Police to conduct an additional 20 000 drug tests each year.
Current legislative provisions under the Vehicle Impoundment Scheme allow vehicles to be confiscated for a period of 48 hours where police find a driver poses a significant risk to road safety. These risks include hoon related offences as well as repeated driving while disqualified and extremely high level speeding. Since hoon laws were introduced in June 2006, police have impounded vehicles on over 7 300 occassions. The 2009-10 Budget provides $9.9 million to expand the Vehicle Impoundment Scheme. Legislation will be put before Parliament to lower the excessive speeds covered under the scheme, expand impoundment provisions relating to unauthorised driving, and expand the impoundment of vehicles driven by repeat drink and drug drivers.
CorrectionsThe 2009-10 Budget allocates $61 million to support the corrections system. This includes an additional 100 temporary beds across the prison system. These beds will provide additional capacity in the system prior to and following the opening of the new 350 bed prison at Ararat.
Home Detention is a community based alternative to imprisonment, used for relatively low risk offenders. This program is currently in a pilot phase and will be extended to allow judges to choose this as a ‘front end’ sentence for appropriate offenders. The benefits of Home Detention include lower reoffending rates, and an increased likelihood that offenders will maintain family relationships, continue in employment and contribute to the community, while still providing an effective deterrent.
Emergency ServicesThe 2009-10 Budget provides $165 million over five years and $76 million TEI for emergency services organisations. This aims to improve the capability of Victoria’s emergency services organisations through a package of initiatives to strengthen communication capability between emergency services organisations during an emergency event, improve capacity to respond to 000 calls from the public, provide critical new infrastructure to respond to events and prepare for future emergencies, and retain and recruit volunteers.
Funding of $102 million over four years and $45 million TEI has been provided to ‘Project 000 Response’, for emergency service organisation communications and response to 000 emergency calls.
34 Chapter 1 Service Delivery 2009-10

Components of this initiative include:
Ongoing emergency call taking and dispatch of emergency services for the CFA and VICSES by the Emergency Services Telecommunications Authority (ESTA). This will ensure a high quality first link in the chain of events for emergency response services. Emergency calls for ambulances in regional Victoria will transition from five separate call centres to an integrated ESTA service to further improve response and attendance of emergency services;
Strengthened communications between emergency services by improving network access for Regional Radio Dispatches for the CFA and VICSES, enhanced capability for the Emergency Alerting System Pagers, and new radios for VICSES to enable them to acknowledge dispatches and coordinate emergency responses effectively;
Pagers and radios for DSE personnel which are compatible with the CFA, to ensure a coordinated response to fire on both public and private land; and
Integrated DSE and CFA fire maps at ESTA which will further enhance coordination between all emergency services organisations in responding to fires.
To further enhance communications during an emergency, $19 million over four years and $1.3 million TEI has been provided to improve radio coverage deficiencies which currently exist in four geographic blackspots.
To continue the Government’s commitment to high quality infrastructure for emergency services, funding of $23 million TEI and $30 million over four years is provided to the CFA to upgrade fire fighting equipment, infrastructure and additional operations staff. This includes replacement of ageing pumper trucks, tankers and operational support vehicles to maximise emergency response capability and provide additional protection for fire crews in the case of burnovers to ensure volunteer safety. CFA will also procure 42 additional ultra-light tankers to improve response to lightning strikes and backburning operations, particularly in remote and rugged terrain.
Funding of $6.6 million TEI and $3.7 million over four years is provided to sustain critical VICSES assets. This will enable VICSES to replace rescue trucks and equipment and continue delivery of vital emergency services. Additional funding of $6.8 million over four years will increase the subsidy provided to VICSES Volunteer Units to continue to attract and retain volunteers. This will help meet day-to-day operating costs, including maintenance of motor vehicles, supplies and provision of local unit operational support and training.
Funding of $3.9 million has also been provided to retain and recruit volunteers and recognise the effort of volunteer organisations that supported the Government's response to the February bushfires.
Service Delivery 2009-10 Chapter 1 35
Investing in the artsThe government continues to support a strong arts and cultural sector, enhancing access across the community and maximising the potential contribution of the arts to a flexible, dynamic economy. The 2009-10 Budget provides $69 million in funding for arts related initiatives, including:
$21 million TEI to assist in maintaining the existing asset base of State owned cultural facilities through minor capital works and equipment renewal;
$23 million over three years for the Victorian Arts Centre to support enhanced public programming and provide safe facilities that meet the needs and expectations of visitors and the community;
$9.2 million over three years to renew permanent exhibitions at Museum Victoria’s three sites and to undertake a regional touring exhibition;
$6.2 million over four years in additional support for Victorian Opera;
$5.2 million over four years for the State Library of Victoria to continue enhancing access to collections and to support planning for the restoration and refurbishment of the Queen’s Hall; and
$3 million TEI to upgrade and improve facilities at the Geelong Performing Arts Centre, including the main performing space and associated rehearsal spaces of the Ford Theatre.
Supporting grassroots sporting organisations and investing in sporting facilitiesIn this budget, the Government will continue to support grassroots sporting organisations and aim to increase the involvement of people in sport. The Government recognises the importance of continuing to invest in elite sporting facilities to maintain Melbourne’s position as Australia’s sporting capital. Work has commenced on a masterplan for the redevelopment of Melbourne Park to ensure that Melbourne continues to be the home of the Tennis Grand Slam of the Asia Pacific.
The 2009-10 Budget provides $13 million over three years and $13 million TEI to support sporting organisations and upgrade facilities. Initiatives include:
$5.7 million over three years for grants to improve soccer facilities in the community;
$4.5 million over three years and $1.2 million TEI to improve sporting facilities at the Melbourne Sports and Aquatic Centre and the State Netball Hockey Centre;
$1.2 million over two years to continue the Country Football and Netball grants program;
36 Chapter 1 Service Delivery 2009-10

$1.7 million to continue the popular Our Club, Our Future Sporting Uniform Grants program for two years;
$7 million TEI towards the construction of a State Basketball Centre at Knox which will become the new home of Basketball Victoria;
$5 million TEI to continue planning for the redevelopment of the Melbourne and Olympic Park precinct.
A FAIRER SOCIETY – REDUCING DISADVANTAGE AND RESPECTING DIVERSITY
A Fairer VictoriaThe Government’s strong record in economic management has provided the means for delivering services which promote a stronger and fairer society and build the resilience of individuals and communities. Substantial investments in universal programs have provided a strong foundation from which all Victorians can benefit, with additional support directed to particular groups and places to assist them to participate in these benefits. The Government remains committed to protecting its vulnerable members and build Victoria’s collective capacity and resilience to meet the challenges during difficult times such as the economic downturn.
The Government will continue to invest in the education, housing, health and well being of its citizens. Alongside major investments in these programs, the Government is also pursuing long term reforms in particular service systems to maximise the outcomes for disadvantaged Victorians. Funding is provided in the 2009-10 Budget to continue the Because Mental Health Matters: Victorian Mental Health Reform Strategy 2009-2019 and to continue reform of the Out of Home Care system with a particular emphasis on improving placement quality and increasing prevention and diversion programs. The Justice Statement 2 will continue to focus on breaking the cycle of crime and build individual’s connection and accountability to their community while systemic discrimination is being tackled through the Government’s response to the review of the Equal Opportunity Act 1995.
Increasing the supply of social housing As part of the Nation Building – Economic Stimulus Plan, the Commonwealth Government and the state governments have agreed to an ambitious construction program that will significantly boost the supply of social housing stock and stimulate jobs in the construction sector. The Victorian Government will provide opportunities for the not-for-profit housing sector to participate in the delivery and overarching management of these projects.
Service Delivery 2009-10 Chapter 1 37
Recently announced funding for Victoria includes:
$172 million for the construction of 667 new social housing dwellings under Stage One of the Nation Building – Economic Stimulus Plan; and
$99 million over two years for repairs and maintenance work that will benefit up to 5 600 social housing dwellings and enable the retention of at least 1 600 properties that would otherwise be unsuitable for occupancy.
The Victorian Government is working with the Commonwealth on proposals for approval by August 2009 under Stage Two of the Nation Building – Economic Stimulus Plan, which is expected to provide a further $1.3 billion to deliver around 4 300 new houses in Victoria.
Access to safe and secure housing for disadvantaged people will also be enhanced through $99 million over two years for the National Partnership Agreement on Social Housing, which will provide approximately 488 new dwellings.
Reducing homelessnessThe Government maintains a strong commitment to assisting vulnerable Victorians and Victoria will work with the Commonwealth Government to reduce the number of people who are homeless.
As well as delivering on commitments under the A Place to Call Home initiative announced in 2008, the 2009-10 Budget allocates $105 million over four years for a package of initiatives under the National Partnership Agreement on Homelessness, comprising:
$36 million over four years to intervene earlier to stop people becoming homeless; $16 million over four years for services that help break the cycle of homelessness
by providing integrated housing and social support; and $53 million over four years to improve and expand the homeless service system.
Additional assistance will also be provided for clients in the mental health and justice systems who are homeless or at risk of homelessness.
Supporting people with a disabilityThe Government is continuing reform of disability services by committing $87 million to improve outcomes for people with a disability by building their skills and capabilities to live independently, and promoting community inclusion. The Government’s reform program complements the directions of the National Disability Agreement.
Building on the biggest ever investment in disability services of $233 million over five years announced in the 2008-09 Budget, the Government will provide an additional $68 million over four years for improved support, including:
$30 million over four years to provide additional individual support packages;
38 Chapter 1 Service Delivery 2009-10
$17 million over four years for additional services to assist school leavers transition to employment or access further education and community activities;
$12 million over four years to assist the day services sector to transition to individual service models; and
$9 million over four years to improve the early childhood intervention services program and to build a common assessment approach for children with a disability.
Funding of $19 million TEI is also provided for enhanced facilities including:
$14 million TEI for 13 new purpose-built houses to enable the relocation of young people with high care needs from residential aged care services to more age-appropriate facilities; and
$5 million TEI to make community facilities more accessible for people with a disability.
Closing the gap in Indigenous health outcomesThe Government is committed to closing the 17 year gap in life span between Indigenous and Non-indigenous Victorians. The National Partnership on Closing the Gap in Indigenous Health Outcomes will see Victoria and the Commonwealth Government work together on a multifaceted approach to reduce Indigenous chronic disease through targeted primary health care services.
The 2009-10 Budget will provide $47 million over four years to:
promote healthy lifestyle choices for Indigenous young people including smoking cessation and healthy transitions to adulthood;
assist universal health services to become more culturally competent; and
provide training to the clinical health workforce in Aboriginal Community Controlled Organisations and Community Health Services.
Improving the lives of Indigenous VictoriansAddressing Indigenous disadvantage requires improvements in outcomes during the early years. The National Partnership on Indigenous Early Childhood Development will establish two Indigenous Children and Family Centres in Victoria to deliver integrated services including early learning, child care and family support programs. The $22 million in funding over six years will also increase access to antenatal care, and teenage reproductive and sexual health services, and maternal and child health services.
The Government will also invest $9.7 million over four years in a range of initiatives designed to improve the life and well being of Indigenous Victorians. This includes
$6.2 million over four years to extend services for the Stolen Generations to ensure that this assistance is maintained for both individuals and communities;
Service Delivery 2009-10 Chapter 1 39
funding to extend both the Aboriginal Land and Economic Development and Koorie Business Network programs which will increase workforce participation rates of Indigenous Victorians;
funding for continuation of governance arrangements in Lake Tyers and high priority projects which build individual and community leadership; and
strengthening the Indigenous community’s capacity to protect Aboriginal heritage through efficient assessment of planning applications.
Assisting vulnerable children The Victorian Government recognises that children living away from their families due to serious abuse or neglect are amongst the State’s most vulnerable. Building on recent investments in the child protection system, the 2009-10 Budget invests an additional $160 million over four years to further strengthen Victoria’s response to children at risk.
This additional investment will provide:
$125 million over four years to continue reform of Out of Home Care services provided to children who are unable to live with parents or extended family. Initiatives include additional placements for children removed from their family; further support to community agency providers of residential care; expanded capacity in programs which provide intensive in-home assistance to children, young people and their families to resolve difficulties; creating a new intensive in home support option for children with challenging behaviours; expanded behavioural and psychological treatment services for children living in placement services; establishing a community mentor program for children in placement services to ensure these children have access to positive and encouraging adult role models; and, providing cultural competence training for placement services to better meet the needs of indigenous children;
$10 million TEI is also provided to continue a program of renovating, upgrading and if necessary, replacing residential care facilities to ensure building designs promote good quality care for children and young people;
$14.6 million over four years to enhance the capacity to respond to children in crisis outside of office hours. This funding will enable expansion of the after hours child protection emergency service, the streetwork outreach service to young people, and the advocacy and alternative accommodation service which supports those young people at risk of being remanded; and
$10.5 million over four years to continue the sexual assault counselling services for children and support further reduction in waiting times.
40 Chapter 1 Service Delivery 2009-10

Autism State PlanThe 2009-10 Budget provides $8.3 million over four years for the Autism State Plan to improve assessment, diagnosis and support to Victorians with Autism Spectrum Disorders, their families and carers. This includes:
$4.2 million over four years for mental health service enhancement which will provide greater access to mental health services, particularly for young children and adolescents; and
$4.1 million over four years to improve support to pre-school children and young people of school age, and provide staff development opportunities.
This investment builds on the December 2008 commitment to acknowledge Autism Spectrum Disorders as a neurological impairment under the Disability Act 2006. The initiatives will complement the existing service system and link to other key Government initiatives including the Blueprint for Education and Early Childhood Development and the Because Mental Health Matters: Victorian Mental Health Reform Strategy 2009-2019.
Creating stronger communitiesThe 2009-10 Budget provides $41 million over four years to contribute to the building of strong and resilient communities with high levels of trust and social participation, with measures including:
$17 million over four years to extend 17 Neighbourhood Renewal sites in Victoria, assist two sites to transition to a mainstream approach, and establish two new sites;
$8.9 million over four years to extend the eight Community Renewal sites in Craigieburn, Chelsea, Frankston North, Hampton Park, Laverton, Rosebud West, Bayswater North and Whittington to six years;
$12 million to support the provision of community amenities and infrastructure to improve liveability and social inclusion in growth areas; and
$3.7 million over four years and ongoing for additional coordination hours, including funding for a further 33 Neighbourhood Houses.
In addition, the budget includes $44 million over four years to increase the water and sewerage concession cap for 2009-10 to assist low income households manage water price increases. The concession provides a 50 per cent discount on water and sewerage bills up to a maximum cap. The maximum cap will increase from $187.90 in 2008-09 to $216.60 in 2009-10, an increase of 14.2 per cent. Funding will also be provided for the Water Wise program, to assist low income households reduce their water usage.
Service Delivery 2009-10 Chapter 1 41
Promoting respect – volunteeringThe 2009-10 Budget includes funding of $9.3 million to improve the engagement of all Victorians, particularly young people, in volunteering. Volunteering allows people to improve their skills, gain experience and be involved in their community. The additional funding will support volunteer and community organisations develop new types of volunteering opportunities that attract young people to volunteering, fostering a stronger sense of respect for self and respect for others.
GREATER PUBLIC PARTICIPATION AND MORE ACCOUNTABLE GOVERNMENT
AccountabilityThe Auditor-General's Office provides assurance to the Victorian Parliament on accountability and performance of Victorian public sector agencies and authorities. To maintain delivery of Parliamentary Reports and Services and Audit reports on Financial Statements, $2.3 million is provided in 2009-10. This will achieve ongoing reporting to Parliament and the community on the efficiency and effectiveness of the Victorian public sector.
The Office of the Ombudsman Victoria is responsible for the independent investigation of complaints about state government departments, public statutory bodies and local government. Additional funding of $2.3 million over five years is provided to enable Ombudsman Victoria to meet growing community expectations associated with its increased jurisdiction and community profile.
Public Records Office Victoria is the archive of the State of Victoria, managing the State’s records for use of the public and the Government. The 2009-10 Budget provides $7.1 million TEI and $3.3 million over four years to Public Records Office Victoria to maintain and renew essential infrastructure and facilities to ensure that government records are securely managed and accessible over the long term. This will improve access to state records and help maintain an open and accountable government.
Making government more efficientIn previous budgets, the Government has made commitments to adopt a whole-of-government approach to shared services in order to achieve more efficient government administration, while not reducing service delivery. The 2009-10 Budget includes output funding of $66 million over three years and $29 million TEI to implement the Efficient Technology Services project. This will allow Government to change the way it does business by consolidating and rationalising information
42 Chapter 1 Service Delivery 2009-10

technology infrastructure to deliver services. Current technologies that are not compatible make it difficult to enhance services through a whole-of-government approach. By removing departmental boundaries, the Government is aiming to improve services to the community and deliver long-term savings.
Gambling licences reviewTo assist with the transition to the post-2012 gambling licence arrangements, the 2009-10 Budget provides funding of $29 million over four years. The funding is provided to undertake competitive bidding processes, further develop the new licence arrangements for gaming machines, wagering and keno and to ensure the industry is prepared to operate under the new arrangements from 2012. Funding is also provided to ensure high standards for monitoring and regulation takes place.
SOUND FINANCIAL MANAGEMENTVictoria’s financial performance remains solid despite the Global Financial Crisis. A decade of sound financial management has positioned Victoria to deal with these uncertain times. The state has maintained its triple-A credit rating and delivered a solid operating surplus. Since 1999-2000, the Government has announced over $5.3 billion worth of tax cuts. The tax cuts include those announced in the 2008-09 Budget which delivered the biggest tax cuts in a decade, further encouraging business investment and economic growth. Victoria’s tax system is now one of the most competitive in the nation, making Victoria an attractive place to conduct business. This competitive tax environment, combined with the Government’s solid position, allows for ongoing services and prosperity for Victorians during these challenging times.
Maintaining Victoria’s triple-A credit ratingIn the last decade, the government has been committed to maintaining net debt and financial liabilities at prudent levels and retaining the State's triple-A credit rating. Ratings agencies use a variety of measures when examining the credit worthiness of states, or more specifically in rating the securities issued by them. This includes both net debt and net financial liabilities of the general government sector and the non-financial public sector which are measures of overall indebtedness. They also look at the capacity of jurisdictions to service the obligations arising from these measures. Maintaining a triple-A credit rating is an important part of maintaining the State's ability to borrow to fund its infrastructure investments and reduce the burden of repaying the cost of borrowing.
Service Delivery 2009-10 Chapter 1 43

State Revenue Management SystemState taxation revenue in Victoria is collected by the Victorian State Revenue Office (SRO). The SRO administers the State’s taxation legislation and collects a range of taxes, duties and levies. In 2007-08, the SRO collected almost $9.6 billion in revenue for the Victorian Government. In order to ensure consistency and fairness in the collection of State taxation revenue, the SRO aims to maximise its taxpayer compliance activities. The 2009-10 Budget provides $12 million over four years to expand business intelligence capabilities and enhance targeted audit, investigation and detection of taxpayer non-compliance to help meet this aim. In addition, $10 million TEI is provided to upgrade and extend the SRO’s core revenue management system, eSys.
44 Chapter 1 Service Delivery 2009-10

CHAPTER 2 – LINKING DEPARTMENTAL OUTPUTS TO GOVERNMENT OUTCOMES
Budget Paper No. 3, Service Delivery, sets out in detail the outputs, or goods and services, that the Government will deliver in this budget and how these will contribute to the achievement of Growing Victoria Together (GVT).
GVT is the Government’s vision to 2010 and beyond that articulates its priorities to make Victoria a better place in which to live, work and raise a family. GVT balances a combination of economic, social and environmental goals to help guide the Government’s setting of short to medium term priorities and policies.
During the annual budget cycle, several processes operate to integrate and align decision-making with the Government’s desired outcomes and strategic priorities. Through a process of integrated planning, resource allocation decision making, performance monitoring, evaluation and reporting, the Government aims to deliver services efficiently and effectively. Most importantly, these processes help to ensure that service delivery is responsive to the needs of a changing community.
An important element of this cycle is ensuring that the goods and services that the Government intends to deliver as part of the annual budget achieve the Government’s desired outcomes, articulated in GVT, associated policy statements, Labor’s Financial Statement 2006 and the Premier’s policy priorities outlined in July 2007. The budget cycle also considers what combinations of service delivery will deliver optimal outcomes for all Victorians.
The activities of government are broad. Departments and their agencies, on behalf of the Government, deliver a variety of goods and services to achieve the Government’s policy outcomes. Goods and services provided by government are the tangible outputs that government provides to the community in each budget cycle. These outputs include educational services, new or upgraded schools, hospital and health care services, new and better roads, additional police and quality museums, art galleries and libraries.
In the last decade, the Government has introduced a range of priorities, strategies and initiatives for delivering services, which are directed towards achieving the broad vision and goals set out in GVT. These priorities have focused on the delivery of services in health, education and community safety. The Government has also focused on meeting important challenges facing Victoria, such as climate change, investment in transport infrastructure and improving the State’s productivity.
Service Delivery 2009-10 Chapter 2 45

While one of the Government’s key priorities for the 2009-10 Budget is to position Victoria for recovery from the economic downturn, the Government remains committed to improving the economic and social wellbeing of all Victorians by delivering and investing in services to achieve its broader economic and social objectives.
The initiatives included in the 2009-10 Budget, coupled with the continued implementation of the Government’s election commitments as set out in Labor’s Financial Statement 2006, are designed to continue the focus on the achievement of the ten goals set out in GVT.
This chapter provides an overview of the Government’s cumulative service delivery achievements in the last decade, the base year for reporting on progress towards achieving the GVT goals.
Detailed information on all outputs to be delivered by departments, including associated measures of quantity, quality, timeliness and cost, is contained in Chapter 3, Departmental Output Statements. A full report on all GVT measures of progress is included in Appendix B Growing Victoria Together Progress Report.
46 Chapter 2 Service Delivery 2009-10

THRIVING ECONOMY
The significance of a thriving economyImproved living standards and opportunities for all Victorians will be built on a thriving and adaptive industry base that creates rewarding jobs. Economic growth is not an end in itself. It is important because it creates jobs which in turn generate improved living standards and opportunities.
Population growth underpins economic growth, sustains regional revitalisation and further strengthens the diversity of Victoria. Transport and communications infrastructure links people and businesses across Victoria, throughout Australia and to the world.
Over the past year the global economic environment has continued to deteriorate. While Victoria’s economy faces a much more challenging economic environment than it has for many years, the Government’s work over the past nine and a half years has ensured that Victoria is well placed to withstand these challenges.
Victoria’s strong economic record has been supported by a combination of sound financial management, an ambitious reform agenda and investment in the State’s productive capacity. These are the building blocks for growth in production and jobs, remaining a priority for Victoria, even in the current circumstances.
ACHIEVEMENTS TO DATEMore quality jobs and thriving, innovative industries across VictoriaIn the last decade, the Government has invested in more quality jobs and thriving, innovative industries across Victoria by:
creating an environment in which businesses have been encouraged to grow by building on a solid track record of prudent economic management. This has been created partially through over $5.3 billion worth of announced tax cuts, including cutting payroll tax rate in Victoria to 4.95 per cent and cutting land tax rates;
boosting the sustained economic and industry development of provincial Victoria through the Regional Infrastructure Development Fund and the Small Towns Development Fund which have supported infrastructure development in regional Victoria; and
enhancing the productivity and competitiveness of Victoria’s economy and workforce by encouraging greater workforce participation and focusing on improving the skills of Victorians.
Service Delivery 2009-10 Chapter 2 47
Victoria has had strong employment growth, with an average annual employment growth of 2.4 per cent over the period from 1999-2000 to 2007-08. In 2007-08 the average annual employment rate was 62.3 per cent, higher than the 58.5 per cent in 1999-2000. From October 1999 to March 2009, Victoria’s employment rose by 460 200 persons, or 21.0 per cent. Both private business investment and investment in machinery and equipment grew strongly between 1999-2000 and 2007-08.
Growing and linking all of VictoriaIn the last decade, government investment focused on growing and linking all of Victoria and included:
extensively upgrading the metropolitan and regional road network and reducing travel times through the opening of EastLink, Geelong Ring Road stages one to three, Calder Highway, Dandenong Bypass, Deer Park Bypass, Pakenham Bypass, and the commencement of the Monash-CityLink-West Gate upgrade;
investing in public transport services for regional Victoria including a regional fast rail service to Ballarat, Bendigo, Geelong and Latrobe Valley, 40 new VLocity trains, a one off reduction to V/Line fares, and returning services to Ararat and Bairnsdale. This investment has contributed to reducing travel times between Melbourne and regional Victoria; and
improving public transport accessibility, including tram platform stops designs that provide full accessibility, low-floor buses on metropolitan and regional services at a rate of 90 a year through the Bus Replacement Program and introducing new fully-compliant trains on the metropolitan rail system and on the regional rail network.
Between September 1999 and September 2008, Victoria’s population grew by 13.6 per cent, reaching more than 5.3 million people. The number of regional rail services increased by 3.4 per cent in 2007-08 and regional rail patronage rose by 23.8 per cent in the year to 2007-08. Metropolitan public transport patronage rose 7.7 per cent in the year to 2007-08, reaching 8.67 million passenger trips per week. This represents the highest level of public transport passenger trips for over four decades.
Challenges and responsesThe achievements previously described have positioned Victoria favourably in the face of economic challenges. The Government’s commitment to sound fiscal management will continue to underpin economic growth. Our future living standards will depend on improved productivity, increased workforce participation and an increase in skill levels. It is vital for Victoria’s future prosperity that we continue to invest in infrastructure, improve taxation competitiveness and promote skills to attract business to the State.
48 Chapter 2 Service Delivery 2009-10

The Government will continue to deliver goods and services and invest in infrastructure aimed towards securing jobs and sustaining growth. While regional Victoria has grown strongly in recent years, challenges such as the Global Financial Crisis, climate change and water security will have a large impact on the success, survival and prosperity of regional communities and industries.
In the 2009-10 Budget, the Government is continuing to invest in services and infrastructure directed towards achieving a Thriving Economy by:
meeting Victoria’s growing infrastructure and transport demands by shaping a more productive, liveable and sustainable state through the Victorian Transport Plan. This will contribute to a number of outputs delivered by the Department of Transport, the Department of Primary Industries, the Department Innovation, Industry and Regional Development, the Department of Justice, the Department of Planning and Community Development and the Department of Sustainability and Environment;
continuing the reform of the Victorian training and skills system through Securing Jobs for your Future: Skills for Victoria to provide Victoria with an improved vocational and educational system to meet the challenges of the future. This reform will contribute to a number of the Department Innovation, Industry and Regional Development, the Department of Planning and Community Development and the Department of Education and Early Childhood Development outputs; and
delivering strategic leadership, policies, programs and investment through Building Our Industries for the Future to help ensure Victorian industry and manufacturing grow stronger. This will contribute to a number of the Department Innovation, Industry and Regional Development outputs.
Linking outputs with outcomesThe following table summarises, by department, the goods and services that the Government will deliver in 2009-10 in working towards the achievement of a Thriving Economy.
Education and Early Childhood Development
Transport
Early Years (schools);Middle Years (schools);
Later Years and Youth Transitions;Services to Students;Policy and Regulation.
Road Asset Management;Integrated and Sustainable Transport
Development;Public Transport Infrastructure Development;
Road Network Improvements;Freight, Logistics, Ports and Marine
Development;Integrated Metropolitan Public Transport
Services;Rural and Regional Public Transport Services;
Specialist Transport Services.
Service Delivery 2009-10 Chapter 2 49

Innovation, Industry and Regional Development
Justice
Investment Attraction and Facilitation;Exports;
Small Business;Industrial Relations;
Science and Technology;Sector Development;
Regional Economic Development, Investment and Promotion;
Regional Infrastructure Development;Strategic Policy;
Tourism; Skills;
Innovation;Major Projects;
Workforce Participation.
Promoting and Protecting Consumer Interests;Gaming and Racing Management and
Regulation.
Planning and Community Development Premier and CabinetPlanning;
Sport and Recreation Development;Community Development;
Developing the Local Government Sector;Youth Affairs;
Women’s Policy;Disability;
Seniors and Veterans;Indigenous Community and Cultural
Development;Adult and Community Further Education.
Arts Development and Access;Creating Place and Space;
Arts Portfolio Agencies;Strategic Policy Advice and Projects;
Government Information Services and Support;Protocol and Special Events;
Multicultural Affairs;Portfolio Services and Policy.
Primary Industries Sustainability and EnvironmentPrimary Industries Policy;
Regulation and Compliance;Strategic and Applied Scientific Research;
Sustainable Practice Change.
Sustainable Water Management and Supply;Public Land;Biodiversity;
Forests and Parks;Natural Resources;
Land and Fire Management;Environmental Policy and Climate Change;
Statutory Activities and Environment Protection;Land Administration and Property Information.
Detailed output information for these outputs can be found in Chapter 3, Departmental Output Statements.
50 Chapter 2 Service Delivery 2009-10

QUALITY HEALTH AND EDUCATION
The significance of quality health and educationHigh quality health and community services need to be available to all Victorians.
Investing in the health of all Victorians is vital to the State’s future economic growth and living standards. Victorians enjoy excellent health by world standards. However, as our lifestyles continue to change and our population ages, new patterns of chronic disease present economic and social challenges for our community.
Education is the key to creating a dynamic, successful community and improving the opportunities in life for all Victorians. Early experiences have a direct impact on the future wellbeing of children. Victoria must be a place where children are able to receive the best possible start to their education, and where people of all ages are motivated to keep learning. A key priority for government has been the creation of new opportunities for all Victorians to receive world-class education and develop the skills they need for the future.
ACHIEVEMENTS TO DATEHigh quality, accessible health and community servicesIn the last decade, government investment in high quality, accessible health and community services has included:
expanding hospital capacity to enable the provision of 600 000 more treatments this year than in 1999, including 350 000 extra admissions;
increasing the capacity of essential hospital services to treat additional patients each year in emergency departments, as well as capacity to treat more elective surgery patients sooner, ease pressure on emergency departments, and provide an extra 8 800 nurses and 2 500 doctors.
Victorians continue to enjoy a long life expectancy that has been consistently above the Australian average. Victoria’s public hospitals treated 143 817 elective surgery patients in 2008 compared to 130 340 elective surgery patients in 2007. Immunisation rates for children have continued to increase steadily.
High quality education and training for lifelong learningIn the last decade, government investment in high quality education and training for lifelong learning has included:
Service Delivery 2009-10 Chapter 2 51

improving educational outcomes for school students by implementing the Blueprint for Government Schools (2003) and the Blueprint for Education and Early Childhood Development (2008);
investing in improved school years curriculum, and providing an additional 8 500 teachers and support staff for schools;
modernising and rebuilding Victorian schools, in particular building new schools in growth areas; and
investing in training and skills development for lifelong learning through continued investment in Victoria’s Technical and Further Education (TAFE) system, boosting apprenticeship capacity and creating more opportunities for Victorians for vocational learning pathways.
The percentage of Year 3 and 5 Victorian students achieving reading, writing and numeracy benchmarks continues to be above the national average. The percentage of Victorians aged 20 to 24 who have completed Year 12 or its national equivalent (88.7 per cent) continues to be above the national average (84.2 per cent). Vocational Education and Training (VET) student contact hours among 25 to 64 year olds increased from just over 40 million in 1999 to more than 53 million in 2007.
Challenges and responses While Australians enjoy health outcomes that are among the best in the world and have access to high quality health care, there is considerable scope for improvement. The Government is committed to a more active approach to maintaining wellness, better support for people with chronic diseases, and reforms to our workforce, information technology and funding systems to enable major change.
In Victoria’s education system, some groups of children face unique challenges or require a different set of educational approaches. Students from low socio-economic status backgrounds are disproportionately over-represented among low achievers. The development and learning of children from low socio-economic backgrounds is where Victoria has to make the greatest progress.
To meet the challenges ahead and maintain its competitive advantage, Victoria needs a population that is highly skilled, productive and engaged in work. The Victorian Government will take action to ensure that the early childhood development, VET and higher education sectors are positioned to meet Victoria’s skills needs.
In the 2009-10 Budget, the Government is continuing to invest in goods and services directed towards achieving Quality Health and Education including:
meeting the growing demand for acute health services including additional emergency and inpatient capacity which will contribute to the DHS output groups Acute Health and Mental Health and the Small Rural Services – Acute Health output;
52 Chapter 2 Service Delivery 2009-10

improving the health system by implementing COAG National Partnerships agreements and associated reforms to the health workforce, improving Indigenous health outcomes and other chronic disease prevention measures. These reforms contribute to a range of DHS outputs;
continuing to deliver the Victorian Schools Plan to rebuild or modernise 500 schools by 2011. Every Victorian Government school will be rebuilt, or modernised by 2016-17, this includes regeneration of schools in selected local communities. This investment contributes to a number of the Department of Education and Early Childhood Development outputs; and
reforming the vocational education and training sector to be more flexible, responsive and demand driven.
Linking outputs with outcomesThe following table summarises, by department, the goods and services that the Government will deliver in 2009-10 in working towards Quality Health and Education.
Service Delivery 2009-10 Chapter 2 53

Education and Early Childhood Development Education and Early
Childhood Development
Human Services
Early Years (schools);Middle Years (schools);
Later Years and Youth Transitions;Services to Students;Policy and Regulation;
Adolescent Health Services (schools);Early Childhood Education and Care;Child Health and Support Services;
Early Childhood Intervention Services.
Admitted Services;Non-Admitted Services;Emergency Services;
Acute Training and Development;Ambulance Emergency Services;
Ambulance Non-emergency Services;Clinical Care;
Psychiatric Disability Rehabilitation and Support Services;
Residential Aged Care;Aged Care Assessment;Aged Support Services;
HACC Primary Health, Community Care and Support;
Community Health Care;Dental Services;
Small Rural Services – Acute Health;Small Rural Services – Aged Care;
Small Rural Services – Home and Community Care Services;
Innovation, Industry and Regional Development
Industrial Relations;Science and Technology;
Sector Development;Strategic Policy;
Skills;Workforce Participation;
Innovation.
Planning and Community Development Human Services (continued)Sport and Recreation Development;
Community Development;Developing the Local Government Sector;
Youth Affairs;Women’s Policy;
Disability;Seniors and Veterans;
Indigenous Community and Cultural Development;
Adult and Community Further Education.
Small Rural Services – Primary Health;Health Protection;
Health Advancement;Public Health Development, Research and
Support;Drug Prevention and Control;
Drug Treatment and Rehabilitation;Information Planning and Capacity Building;
Targeted Services;Individual Support;
Residential Accommodation Support;Statutory Child Protection Services;
Specialist Support and Placement Services;Family and Community Services;Youth Justice Custodial Services;
Community Based Services;Homelessness Assistance;
Home Ownership and Renovation Assistance;Long Term Housing Assistance.
Premier and CabinetStrategic Policy Advice and Projects;
Government Information Services and Support;Protocol and Special Events;
Arts Development and Access;Creating Place and Space;
Multicultural Affairs;Portfolio Services and Policy;
Arts Portfolio Agencies.
Detailed information for these outputs can be found in Chapter 3, Departmental Output Statements.
54 Chapter 2 Service Delivery 2009-10

HEALTHY ENVIRONMENT
The significance of a healthy environment Victoria must actively conserve and manage the natural environment in order to achieve social and economic goals. The State has diverse environments which are critical for the survival of precious native plants and animals that must be preserved for future generations.
A prosperous and liveable Victoria depends on a healthy environment. Victoria’s rich and diverse natural environments support our lives, communities, industries, jobs and the economy. While much progress has been made in protecting and sustaining the environment, there are serious challenges that have significant economic and social implications, such as climate change and threatened biodiversity. Climate change is a challenge that requires economic and environmental reforms to ensure costs are distributed equitably and all Victorians are prepared for these impacts.
ACHIEVEMENTS TO DATEProtecting the environment for future generationsIn the last decade, government effort towards protecting the environment for future generations has included:
maintaining and restoring Victoria’s natural assets, including the establishment of 13 marine national parks and 11 marine sanctuaries covering 54 000 hectares of Victoria’s marine waters;
preserving Victoria’s natural environment by reducing logging across the State by 31 per cent, closing the last logging operation in the Otways, and passing legislation to end harvesting in the ranges;
increasing the protection of Victoria’s parks and reserves with almost 4 million hectares, or 17 per cent of Victoria, now protected. This has helped preserve our native flora and fauna for future generations of Victorians, including threatened species such as the Baw Baw Frog, the long-footed Potoroo and the State’s faunal emblem, the Leadbeater’s possum; and
continuing the State’s commitment to sustainable forest management and protecting Victoria’s key biodiversity areas including the protection of more than 20 000 hectares of Gippsland native forest.
Over the last four years the Government has worked with landowners to rehabilitate some 445 hectares, build 37 kilometres of fences and plant some 10 500 native trees.
Service Delivery 2009-10 Chapter 2 55
This means that approximately 712 tonnes of soil has been prevented from entering the Mitchell River and the Gippsland Lakes.
The quality of Victoria’s drinking water continues to improve, with compliance of the E. coli water quality standard increasing from 95.5 per cent in 2005-06 to 99.2 per cent in 2007-08 across the State’s water sampling localities.
Efficient use of natural resourcesIn the last decade, government effort towards promoting the efficient use of natural resources has included:
promoting environmental sustainability through the introduction of greenhouse and energy requirements for Environmental Protection Authority (EPA) licences, establishing environmentally sustainable suburbs, and setting new standards and recommendations for efficient water usage;
reducing water wastage through upgrading irrigation infrastructure, such as the completion of the Goldfields superpipe and fast-tracking the Wimmera Mallee pipeline; and
implementing strategies to reduce Victoria’s greenhouse gas emissions by introducing the Victorian Renewable Energy Target. This target seeks to increase the share of renewable energy for electricity consumption to 10 per cent by 2016.
During 2007, total greenhouse gas emissions in Victoria were 119.1 mega tonnes of CO2 equivalent, a 3 per cent increase in the last decade, but a 2.3 per cent decrease from the previous year’s level. Compared with 1999-2000, the Victorian economy is producing less waste per unit of real GSP. The amount of material recovered from the solid waste stream in Victoria for reuse, recycling and energy generation has steadily increased from 43 per cent in 1999-2000 to 62 per cent in 2006-07.
Challenges and responsesGiven the current global economic conditions, it is even more important to strike the right balance between the competing needs of the community, the environment and the economy. In 2004, the Government put in place a long-term plan for water, Our Water Our Future, which aimed to implement a combination of water saving, sharing and creating measures. Having a secure water supply will enable Victoria’s economy and population to continue to grow and prosper. Whilst progress has been made in some key areas, such as recycling and efficient water use, other challenges include the amount of waste and greenhouse gas produced.
56 Chapter 2 Service Delivery 2009-10
In the 2009-10 Budget, the Government is continuing to invest in goods and services directed towards achieving a Healthy Environment including: renewed commitment to protect Victoria’s natural habitat through the establishment
of four new National Parks and the expansion of existing National Parks to protect the stressed River Red Gum forests, contributing to the Department of Sustainability and Environment’s (DSE) Forests and Parks output;
facilitating the development of a large-scale solar power station in Victoria, contributing to all of the Department of Primary Industries (DPI) output; and
continuing to implement the Future Farming Strategy to drive innovation in the farming sector and adapt farming systems to future climatic conditions, contributing to a number of DPI and DSE outputs.
Linking outputs with outcomesThe following table summarises, by department, the goods and services that the Government will deliver in 2009-10 in working towards a Healthy Environment.
Transport Planning and Community DevelopmentIntegrated Metropolitan Public Transport
Services;Rural and Regional Public Transport Services;
Specialist Transport Services.
Planning.
Premier and Cabinet Primary IndustriesStrategic Policy Advice and Projects;
Government Information Services and Support;Protocol and Special Events.
Primary Industries Policy;Regulation and Compliance;
Strategic and Applied Scientific Research;Sustainable Practice Change.
Sustainability and EnvironmentSustainable Water Management and Supply;
Public Land;Biodiversity;
Forests and Parks;Natural Resources;
Land and Fire Management;Environmental Policy and Climate Change;
Statutory Activities and Environment Protection;Land Administration and Property Information.
Detailed information for these outputs can be found in Chapter 3, Departmental Output Statements.
Service Delivery 2009-10 Chapter 2 57
CARING COMMUNITIES
The significance of caring communitiesFriendly and confident communities have strong support networks, services and infrastructure to meet the needs of the people who live and work in them. Safety in communities depends on good communication, responsive policing and emergency services, and effective measures to address the causes of crime.
Research shows that successful community strengthening strategies can contribute to improved wellbeing and increased social and economic opportunities.
Improving opportunities, overcoming barriers and reducing disadvantage is the cornerstone of A Fairer Victoria which sets out a high-level policy framework to reduce disadvantage and increase opportunities for all Victorians. The Government will take decisive action to provide safe streets and homes for Victorians, to ensure that Victoria remains one of the safest places to live, work and raise a family.
ACHIEVEMENTS TO DATEBuilding friendly, confident and safe communitiesIn the last decade, government investment to build friendly, confident and safe communities has included:
improving the safety of Victorians through building a stronger and more accessible police presence. This is evidenced by an additional 1 400 police, initiatives to fight organised crime and terrorism, and investment to rebuild and refurbish more than 150 police stations across the State;
protecting the rights of the community through delivering a Charter of Human Rights and Responsibilities and establishing specialist courts to tackle disadvantage in indigenous communities, family violence and drugs; and
significantly improving services and support for victims of crime including; implementing The Victims Charter, increasing compensation to victims, providing specialist family violence services and making major changes to sexual assault laws and procedures.
The annual road toll has decreased 32 per cent between 2001 and 2008. Since 2000-01, Victoria’s crime rate has reduced by 24.5 per cent. In 2008, the Perceptions of Justice Survey continued to show that Victorians’ feelings of personal safety remained at high levels, with most people surveyed feeling ‘safe’ or ‘very safe’ throughout 2008.
58 Chapter 2 Service Delivery 2009-10

A fairer society that reduces disadvantage and respects diversityIn the last decade, government investment focused on creating a fairer society that reduces disadvantage and respects diversity and has included:
addressing disadvantage in the community through investing $4 billion to date in initiatives outlined in A Fairer Victoria, delivering universal services and targeting resources for disadvantaged places and people;
keeping young people engaged through Local Learning and Employment Networks, assisting thousands of young people to re-engage in education and training; and
continuing to close the gap across a range of economic, social and life expectancy indicators for Indigenous Victorians, particularly for young people. Initiatives include an education strategy for Indigenous students (Wannik), new Indigenous courts, free kindergarten for three-year old Indigenous children, new Indigenous maternity services and new in-home support for new indigenous parents.
In 2008, the self-rated health status of Victorians continues to improve. The number of people assisted with homelessness support increased by over 10 000 people from 1999 to 2006-07.
Challenges and responsesThe Government will make Victoria a safer place to live, work and raise a family. However, there are a number of challenges in achieving these goals. These challenges include continuing to protect the safety of Victorians and addressing the growing community concern about alcohol and community violence.
The Government will address these challenges through improving crime prevention measures, increasing Victorian’s awareness of their human rights, reducing discrimination and providing community assistance.
In the 2009-10 Budget, the Government is continuing to invest in initiatives directed towards building Caring Communities through:
improving the safety on Victorian roads, and reducing the impact of road trauma on the Victorian community through implementing the strategies outlined in the road safety strategy Arrive Alive 2. These strategies contribute to the Department of Justice (DoJ) outputs of Policing Services and Infringement and Orders Management;
focusing on reducing disadvantage and supporting victims of crime through strategies outlined in the Justice Statement 2. In particular continuing to support courts to address family violence, continuation of the Sentencing Advisory Council
Service Delivery 2009-10 Chapter 2 59

and supporting Victoria Legal Aid to provide accessible legal representation and duty lawyer services to the community. These contribute to a number of the Department of Justice outputs; and
continuing to improve services, experiences and outcomes for people with disabilities and their families, to improve the cohesiveness of the disability support system. This contributes to the Department of Human Services output Disability Services and the Department of Education and Early Childhood Development and Early Childhood Intervention Services output.
Linking outputs with outcomesThe following table summarises, by department, the goods and services that the Government will deliver in 2009-10 in working towards building Caring Communities.
60 Chapter 2 Service Delivery 2009-10

Education and Early Childhood Development Human ServicesEarly Years (schools);
Middle Years (schools);Later Years and Youth Transitions;
Services to Students;Policy and Regulation;
Early Childhood Education and Care;Child Health and Support Services;
Early Childhood Intervention Services.
Admitted Services;Non-Admitted Services;Emergency Services;
Acute Training and Development;Clinical Care;
Psychiatric Disability Rehabilitation and Support Services;
Residential Aged Care;Aged Care Assessment;Aged Support Services;
HACC Primary Health, Community Care and Support;
Community Health Care;Dental Services;
Small Rural Services – Acute Health;Small Rural Services – Aged Care;
Small Rural Services – Home and Community Care Services;
Small Rural Services – Primary Health;Health Protection;
Health Advancement;Public Health Development, Research and
Support;Drug Prevention and Control;
Drug Treatment and Rehabilitation;Information Planning and Capacity Building;
Targeted Services;Individual Support;
Residential Accommodation Support;Statutory Child Protection Services;
Specialist Support and Placement Services;
TransportPublic Transport Safety and Regulation;
Road Safety and Regulation;Vehicle and Driver Regulation;Marine Safety and Regulation;
Transport and Marine Safety Investigations;Infrastructure Security and Emergency
Management.
Innovation, Industry and Regional Development
Regional Economic Development, Investment and Promotion;
Regional Infrastructure Development;Small Business;
Science and Technology;Strategic Policy;
Sector Development;Innovation;
Skills;Workforce Participation;
Industrial Relations.Justice Human Services (continued)
Policing Services;Police Integrity;
Legal Policy Advice and Law Reform;Protecting Community Rights;
Supporting the Judicial Process;Privacy Regulation;
State Electoral Roll and Elections;Court Matters and Dispute Resolution;
Public Prosecutions;Infringement and Orders Management;
Community Safety and Crime Prevention;Emergency Management Capability;Prisoner Supervision and Support;
Community Based Offender Supervision;Promoting and Protecting Consumer Interests;
Gaming and Racing Management and Regulation.
Family and Community Services;Youth Justice Custodial Services;
Community Based Services;Concessions to Pensioners and
Beneficiaries;Social and Community Services;
Homelessness Assistance;Home Ownership and Renovation
Assistance;Long Term Housing Assistance.
Planning and Community Development Premier and Cabinet
Service Delivery 2009-10 Chapter 2 61
Developing the Local Government Sector;Community Development;
Sport and Recreation Development;Youth Affairs;
Women’s Policy;Seniors and Veterans;
Indigenous Community and Cultural Development;
Disability;Adult and Community Further Education;
Planning.
Strategic Policy Advice and Projects;Government Information Services and
Support;Protocol and Special Events;
Arts Development and Access;Creating Place and Space;
Multicultural Affairs;Portfolio Services and Policy;
Arts Portfolio Agencies.Primary Industries
Primary Industries Policy;Regulation and Compliance;
Strategic and Applied Scientific Research;Sustainable Practice Change.
Sustainability and EnvironmentPublic Land;Biodiversity;
Forests and Parks;Natural Resources;
Land and Fire Management;Environmental Policy and Climate Change;
Statutory Activities and Environment Protection;
Land Administration and Property Information.
Detailed output information for these outputs can be found in Chapter 3, Departmental Output Statements.
62 Chapter 2 Service Delivery 2009-10
VIBRANT DEMOCRACY
The significance of a vibrant democracyOpen and accountable government is one of the fundamental commitments the Government has made to the people of Victoria. Victoria’s ability to attract people, investment and new jobs, to provide better services, and to protect the environment, depends on a strong and secure financial base.
The Global Financial Crisis means that, like most advanced nations, Australia and Victoria with it, will face significant challenges in the foreseeable future. These challenges require the Government to maintain its strong focus on sound financial management while also providing the community with the services it needs.
ACHIEVEMENTS TO DATEGreater public participation and more accountable governmentIn the last decade, government effort towards encouraging greater public participation and more accountable government has included:
providing the opportunity for Victorians to speak directly with decision-makers, with 85 Community Cabinets held in towns and suburbs from Mildura to Gippsland;
providing the community with more opportunity to participate in and be consulted on a range of key policy areas, such as climate change, transport, drought and mental health; and
improving the transparency of the Government through implementing the Parliament’s annual Statement of Government Intentions and the Premier’s Website, ensuring the agenda of Government is transparent for the forthcoming year.
The Victorian Population Health Survey showed that in 2008, the proportion of Victorians who feel they have a say on issues that matter to them has slightly increased from both 2001 and 2007.
Sound financial managementIn the last decade, government effort towards providing sound financial management has focused on:
maintaining a healthy operating surplus to assist in managing future risks and using the proceeds to invest in vital infrastructure;
achieving a triple-A credit rating and improving the State’s tax competitiveness, reaffirming the Government’s long record of responsible financial management; and
Service Delivery 2009-10 Chapter 2 63

continuing to improve the service delivery efficiency of the Government, including the efficiency of administrative services across the public sector.
Victoria’s triple-A local and foreign currency debt ratings were reaffirmed by Standard & Poor’s in November 2008 and Moody’s in January 2009.
Challenges and responsesWhile Victoria’s triple-A credit rating has recently been reaffirmed, and the state’s debt levels remain at fiscally prudent levels, Victoria faces increasing economic challenges. Continuing sound financial management is essential for Victoria to achieve its goals.
In the 2009-10 Budget, the Government is continuing to invest in initiatives directed towards achieving a Vibrant Democracy including:
implementing the Government’s Respect Strategy which aims to encourage more people to get involved in their communities and volunteer work; and
balancing the expansion of Victoria’s infrastructure program with the need to maintain levels of service delivery in an economic environment that requires a prudent fiscal strategy approach to the economic downturn.
Linking outputs with outcomesThe following table summarises, by department, the goods and services that the Government will deliver in 2009-10 in working towards the achievement of a Vibrant Democracy.
Education and Early Childhood Development
Transport
Policy and Regulation. Road Asset Management;Integrated and Sustainable Transport
Development;Public Transport Infrastructure Development;
Road Network Improvements;Freight Logistics,
Ports and Marine Development;Integrated Metropolitan Public Transport
Services;Rural and Regional Public Transport Services;
Specialist Transport Services.
64 Chapter 2 Service Delivery 2009-10
Justice Planning and Community DevelopmentLegal Policy Advice and Law Reform;
Protecting Community Rights;Supporting the Judicial Process;
Privacy Regulation;State Electoral Roll and Elections;
Gaming and Racing Management and Regulation.
Developing the Local Government Sector;Community Development;
Sport and Recreation Development;Youth Affairs;
Women’s Policy;Seniors and Veterans;
Indigenous Community and Cultural Development;
Disability;Adult and Community Further Education.
Premier and Cabinet Treasury and FinanceStrategic Policy Advice and Projects;
Government Information Services and Support;Protocol and Special Events;
Advice and Support to the Governor;Multicultural Affairs;
State Services Authority;Ombudsman Services;
Chief Parliamentary Counsel Services.
Revenue Management Services to Government;
Financial Reporting;GBE Performance Monitoring and Financial
Risk Management;Economic and Financial Policy;
Financial and Resource Management Frameworks;
Budget and Financial Policy Advice;Land and Infrastructure Investment
Management;Economic Regulatory Services;
Business Environment Policy Advice;Government Services.
Detailed output information for these outputs can be found in Chapter 3, Departmental Output Statements.
Service Delivery 2009-10 Chapter 2 65

CHAPTER 3 – DEPARTMENTAL OUTPUT STATEMENTS
Departmental output statements detail the goods and services that government departments intend to deliver in 2009-10 and how they will contribute to the achievement of the Government’s desired outcomes as outlined in Growing Victoria Together.
The output information included in this chapter provides clear and transparent accountability for departmental service delivery. An output represents the aggregate of goods or services which are either produced or delivered by, or on behalf of, a department and its agencies.
The quantity, quality, timeliness and cost performance measures listed for each output are used to assess each department’s performance in service delivery. The output statements reflect the Government’s investment in services during the year in terms of the cost of each output, the quantity of the output units to be delivered, the level of quality and the timeliness of the output delivery.
Preceding each department’s output statement is a summary of the main challenges or issues facing the department in the medium-term and a discussion of the department’s significant policy decisions and directions. This information intends to explain, at an aggregate level, how departmental service delivery in the forthcoming year will contribute to the achievement of Growing Victoria Together.
Consistent with the Government’s ongoing commitment to improve accountability and performance, departmental outputs and the performance measures used to evaluate service delivery are assessed annually for their continuing relevance and robustness. Where departments have introduced changes to their outputs, these changes are reflected in a summary table with an explanation as to the nature of the change.
For some outputs, performance measures that were reported in 2008-09 may not be reported in 2009-10. Outputs and their performance measures which are no longer being reported in 2009-10 are identified in Appendix C – Discontinued outputs and/or measures. Common reasons for the discontinuation of performance measures include the achievement of milestones in a period, the impact of policy decisions and the implementation of different programs.
Service Delivery 2009-10 Chapter 3 67

In 2009-10, some departments have also introduced changes to the outputs and associated performance measures that they will deliver. These changes mainly reflect the impact of machinery of government changes since the 2008-09 Budget as well as the implementation of changes to departments’ organisation/business structures to better facilitate improvements in the delivery of goods and services on behalf of government. Information about these changes is provided within each department’s output statement.
Within the output statements, ‘nm’ refers to a new performance measure and ‘na’ refers to data either not being available or not applicable in the specified year. Where a department has included a new measure in 2009-10, historical performance data has been provided, where available, to assist with comparability of performance over time.
Total expenditure for departments can be found in Budget Paper No. 4, Chapter 3, Departmental Financial Statements.
Impact of the Global Financial Crisis and 2009 Victorian bushfiresIn recent months, departments and agencies have been working under the constraints of external factors such as the Global Financial Crisis and responding to the February bushfires.
The Global Financial Crisis has affected world economies, and the Australian and Victorian economies have felt the impact of tighter credit conditions and the negative impacts on consumer and business confidence. The Global Financial Crisis may have an impact on several departments reaching some of their 2008-09 performance measure targets and their agreed 2009-10 targets. Departmental performance measures related to economic transactions, economic activity and social service demand may also be affected.
The bushfires have had a significant impact on the Victorian community, and in the near term resources continue to be channelled to meet the increased demand on services that are most needed, and to assist in bushfire recovery and reconstruction efforts. This includes working in partnership with the Commonwealth Government. However, government anticipates that due to asset destruction and staff diversion, some departmental performance targets in program areas may be temporarily affected.
The Government has attempted to retain performance targets at current levels despite the challenges that the Global Financial Crisis and bushfire relief efforts present to service delivery. This is because it is difficult to anticipate the actual impact of the Global Financial Crisis and bushfires on government services and performance, but resources and activity will be channelled to areas of most need. Any 2008-09 expected outcomes that have been affected by the Global Financial Crisis or the bushfires have been explained in the footnotes for each department.
68 Chapter 3 Service Delivery 2009-10
DEPARTMENT OF EDUCATION AND EARLY CHILDHOOD DEVELOPMENT
Departmental mission statementEnsure a high-quality and coherent birth-to-adulthood learning and development system to build the capability of every young Victorian.
Significant challenges facing the Department in the medium termThe key environmental challenges that have the potential to impact on the Department’s service delivery include:
increased birth rates in Victoria and a growing expectation of increased quality of early childhood services will require a sustained effort to build on existing early childhood service delivery;
an increasing pace of technological change and a growing need for technology literacy among both students and education providers;
an increasing global demand for complex problem solving skills creating growing pressure on schools to prepare learners for participation in the knowledge economy;
increasing demand for access to formal childcare, currently constrained by hours of operation, limited availability of places, cost and recent instability in the private sector; and
the need to address the effects of disadvantage on Victorian children and young people.
The Department’s challenges include:
responding to the dramatic population increase due to increased migration, and in particular, the significantly increasing birth rate;
coordinating services so that all children are accessing programs that will ensure a healthy and safe start to life while supporting the workforce participation needs of parents;
linking early childhood services to clear developmental outcomes for children;
improving the quality of early childhood services by reviewing the regulations which prescribe minimum standards;
enhancing confidence in government schools;
raising achievement levels, particularly at secondary school level;
Service Delivery 2009-10 Education and Early Childhood Development 69

ensuring supply of high quality entrants into the teaching profession, including the early childhood education workforce sufficient to deliver the Council of Australian Government’s (COAG) commitment to provide access to kindergarten for all four year olds by 2013; and
reconfiguring education provision in areas of declining enrolments and providing new assets in growth corridors.
Major policy decisions and directionsThe Department’s key directions and strategies for early childhood development and education are set out in the Blueprint for Education and Early Childhood Development (2008). The Blueprint sets out the Government’s five-year agenda for learning and development from birth to adulthood. It provides an integrated policy framework for early childhood and education services and focuses on system improvements; partnerships with parents and communities, and workforce reform.
Growing Victoria Together highlights the importance of high quality education and training for lifelong learning and high quality accessible health and community services and include the following key measures of achievement:
the wellbeing of young children will improve;
the proportion of Victorian primary students achieving the national benchmark levels for reading, writing and numeracy will be at or above the national average;
by 2010, 90 per cent of young people in Victoria will successfully complete Year 12 or its educational equivalent; and
the number of early school leavers who are unemployed after six months will decline.
Victoria continues to work cooperatively to influence COAG and other nationally agreed policies across early childhood development and education and to ensure that new Commonwealth policies and funding arrangements are based on appropriate principles and agreed outcomes and help deliver on Victoria’s policy and directions.
Ministerial portfoliosThe Department supports the ministerial portfolios of Education, and Children and Early Childhood Development.
70 Education and Early Childhood Development Service Delivery 2009-10

Changes to the output structure The Department has not made any changes to its output structure in 2009-10.
Discontinued performance measures are detailed in Appendix C of this budget paper.
The following table summarises the total output cost.
Table 3.1: Output summary($ million)
2008-09 Budget
2008-09 Revised
2009-10 Budget
Variation (a)
%Early Years (schools) (b) 2 348.7 2 535.4 2 710.7 15.4Middle Years (schools) (b) 2 335.5 2 527.6 2 697.8 15.5Later Years and Youth Transitions (b) 1 508.2 1 621.5 1 727.1 14.5Services to Students (c) 741.0 772.9 811.7 9.5Policy and Regulation 40.8 40.8 41.9 2.7Adolescent Health Services (schools) (d) 9.6 10.3 10.1 5.2Early Childhood Services (e) 328.6 337.9 374.8 14.1Total (f) 7 312.4 7 846.4 8 374.1 14.5Source: Department of Education and Early Childhood Development
Notes:(a) Variation between 2008-09 Budget and 2009-10 Budget.(b) The variance is attributable to the impact of an output price review, initiatives funded from within the
2009-10 Budget, additional supplementation funded by the Commonwealth and price escalation for anticipated cost increase in 2009-10.
(c) The variance is attributable to the impact of an output price review and price escalation for anticipated cost increases in 2009-10.
(d) The variance is attributable to the impact of an output price review.(e) The variance is attributable to initiatives funded from within the 2009-10 Budget and price escalation
for anticipated cost increases in 2009-10.(f) Total output expense may not equate to the total expense reported in Budget Paper No. 4, Chapter 3,
Departmental Financial Statements due to additional expenses in Budget Paper No. 4 that are not included in departmental output costs.
Service Delivery 2009-10 Education and Early Childhood Development 71

The following section provides details of the outputs to be provided to Government, including performance measures and costs for each output. Due to the calendar year focus of the delivery of education and early childhood development:
2009-10 targets refer to the 2009 calendar year unless otherwise explicitly indicated.
2008-09 expected outcomes and targets refer to the 2008 calendar year unless otherwise explicitly indicated.
2007-08 actuals refer to the 2007 calendar year unless otherwise explicitly indicated.
2008-09 expected outcomes reflect 2008-09 targets unless 2008-09 results were available at 31 December 2008.
School related measures mainly refer to the government school sector. Total expenditure for the department can be found in Budget Paper No. 4, Chapter 3, Departmental Financial Statements.
72 Education and Early Childhood Development Service Delivery 2009-10
Early Childhood ServicesThis output group provides funding for a range of services that provide support to children in the early years, including kindergarten and child care, maternal and child health, school nursing for primary school-aged children, and early intervention services for children with a disability. The early childhood services outputs make a significant contribution to the key Government outcomes of:
high quality, accessible health and community services;
a fairer society that reduces disadvantage and respects diversity; and
building friendly, confident and safe communities.
Service Delivery 2009-10 Education and Early Childhood Development 73
Major Outputs/deliverablesPerformance measures
Unit of Measure
2009-10 Target
2008-09 Expected Outcome
2008-09 Target
2007-08 Actual(a)
Child Health and Support ServicesCommunity-based maternal and child health services available to all families with children aged 0 to 6 years, and school nursing services for primary school-aged children, that provide developmental health surveillance, early intervention, parenting support and health education.
Quantity Prep aged students assessed by school nurses(b)
number 55 500 55 500 57 000 55 153
Total number of clients with children aged 0 to 1 years(c)
number 70 000 70 000 70 000 67 080
Quality Maternal and child health clients with children aged 0 to 1 years receiving enhanced maternal and child health services(c)(d)
per cent 10 7 7 12.6
Timeliness Children aged 0 to 1 month enrolled at maternal and child health services from birth notifications(c)
per cent 98.5 98 98 99.3
Cost Total output cost(e)(f) $ million 98.6 86.2 86.2 70.7
Early Childhood Education and CareProvision of kindergarten and child care services. These services include the licensing and monitoring of centre-based children’s services, and specialist services to improve access to kindergartens for disadvantaged children.
Quantity Children funded to participate in kindergarten(g)
number 62 508 58 600 58 600 59 465
Kindergarten participation rate(h) per cent 92 92 96 94Quality
Funded kindergarten services with a quality assurance process
per cent 94 94 94 94
Cost Total output cost(e)(f)(i) $ million 210.8 202.7 188.4 168.0
Early Childhood Intervention ServicesA range of services and support for children with a developmental delay or disability and their families.
Quantity Number of places and packages funded annually(e)
number 10 325 9 825 9 825 9 325
74 Education and Early Childhood Development Service Delivery 2009-10
Major Outputs/deliverablesPerformance measures
Unit of Measure
2009-10 Target
2008-09 Expected Outcome
2008-09 Target
2007-08 Actual(a)
Total number of children receiving a service(e)
number 12 650 12 150 12 150 11 650
Quality Families who are satisfied with the service provided
per cent 85 85 85 85
Timeliness Support plans completed within four weeks of service commencement
per cent 80 80 80 80
Cost Total output cost(e)(f)(j) $ million 65.3 49.0 54.0 48.1
Source: Department of Education and Early Childhood Development
Notes:(a) 2007-08 Actuals reflect those published in DEECD’s 2007-08 Annual Report and explanations for
significant variances from 2007-08 Targets may be found in that Report. (b) The 2009-10 Target has been adjusted to reflect the finding that while all prep-aged students are
offered a health assessment by school nurses, not all parents consent and take up the offer. The 2008-09 Expected Outcome is also expected to reflect this lower level of take up. Includes non-government schools.
(c) Refers to the previous financial year.(d) The 2009-10 Target (refers to 2008-09 financial year) has been increased as a result of the 2008-09
Healthier Mothers and Babies initiative.(e) Refers to financial year.(f) The 2009-10 Target is greater than the 2008-09 Target due to initiatives funded from the 2009-10
Budget and price escalation for anticipated cost increases in 2009-10.(g) The 2009-10 Target (refers to the 2009 calendar year) takes into account additional funding provided
for the ‘Meeting Increased Demand for Kindergarten Enrolments’ initiative. The number of children funded to participate in kindergarten includes second year participants.
(h) The 2009-10 Target and 2008-09 Expected Outcome for the Kindergarten Participation Rate measure are calculated using revised population figures issued by the Australian Bureau of Statistics following the latest census, and are not directly comparable with the 2008-09 Target or Actuals of previous years. The 2008-09 Expected Outcome reflects the actual result. The 2009-10 Target (no decimal places and refers to the 2009 calendar year) covers only first year participants.
Service Delivery 2009-10 Education and Early Childhood Development 75
Notes (continued):(i) The 2008-09 Expected Outcome is greater than the 2008-09 Target due to new initiatives approved as
part of the 2009-10 Budget process with funding implications in the 2008-09 financial year.(j) The 2008-09 Expected Outcome is less than the 2008-09 Target due to expenditure for the
administration of the Early Childhood Regulations being carried over into the 2009-10 financial year.
76 Education and Early Childhood Development Service Delivery 2009-10
Compulsory YearsCompulsory years consists of two outputs.
The ‘early years’ of schooling output is concerned with developing the essential skills necessary for ongoing progress in education and providing learning experiences to engage young minds. Literacy and numeracy are foremost among the skills learnt during these foundation years.
The ‘middle years’ of schooling output refers to a fundamental stage of learning where students growing from childhood to adolescence consolidate competencies in literacy and numeracy, and continue their physical, social, emotional and intellectual development of early adolescence. It is also a stage when they attain a greater breadth of knowledge and learning, including extending their capacity for creative and critical thinking.
These outputs include development and management of education programs and curriculum.
The Compulsory Years outputs, along with other education outputs, are one of the primary mechanisms through which the Government will achieve the key outcome of high quality education and training for lifelong learning. These outputs will also make a significant contribution to the following key Government outcomes:
growing and linking all of Victoria; and
a fairer society that reduces disadvantage and respects diversity.
Major Outputs/DeliverablesPerformance Measures
Unit of Measure
2009-10 Target
2008-09 Expected Outcome
2008-09 Target
2007-08 Actual(a)
Early Years (schools)This output involves provision of education and other associated services designed to improve the quality of student learning of those in Prep-Year 4 in Government and Non-Government Schools.
Quantity Average P-2 class size number 21 20.6(b) 21 20.7Investment in Non-Government Schools (P-Year 4)(c)
$ million 135.9(d) 137.2(e) 125.4 116.5
Number of assistant principals, aspiring leaders and leadership teams participating in leadership development programs(f)
number 800 380 380 800
Number of principals participating in statewide, centrally funded leadership development programs
number 310 310 310 313
Schools funded for primary welfare officers(g)
number 450 450 450 573
Statewide computer to student ratio: primary(c)
ratio 1:5 1:5 1:5 1:3.37
Quality Parent satisfaction with primary schooling on a 100-point scale
100-point scale
80 81(b) 80 81
Service Delivery 2009-10 Education and Early Childhood Development 77

Major Outputs/DeliverablesPerformance Measures
Unit of Measure
2009-10 Target
2008-09 Expected Outcome
2008-09 Target
2007-08 Actual(a)
Percentage of children meeting the national minimum standard for numeracy in Year 3 National Assessment Program Literacy and Numeracy (NAPLAN testing)(h)
per cent 94 nm nm nm
Percentage of children meeting the national minimum standard for reading in Year 3 (NAPLAN testing)(h)
per cent 91 nm nm nm
Percentage of Indigenous children meeting the national minimum standard for numeracy in Year 3 (NAPLAN testing)(h)
per cent 76 nm nm nm
Percentage of Indigenous children meeting the national minimum standard for reading in Year 3 (NAPLAN testing)(h)
per cent 66 nm nm nm
Student attainment at text level 1 at end of Prep in reading (metropolitan and non-metropolitan students)(i)
per cent 96.5 96.5 96.5 96.3
Student attainment at text level 5 at end of Year 1 reading (metropolitan and non-metropolitan students)(j)
per cent 99.5 99.5 99.5 99.2
Students in non-metropolitan regions achieving at text level 1 at end of Prep in reading(k)
per cent 96.3 96.3 96.3 95.3
Cost Total output cost(l) $ million 2 710.7 2 535.4 2 348.7 2 308.5
Middle Years (schools)This output involves provision of education and other associated services designed to improve the quality of student learning of those in Years 5-9 in Government and Non-Government Schools.
Quantity Average rate of student attendance at Year 5(m)
per cent 94 94 94 93
Average rate of student attendance at Year 6
per cent 94 93 93 93
Average rate of student attendance in Years 7-10
per cent 91 91 91 91
Investment in Non-Government Schools (Year 5-9)(c)
$ million 208.1(d) 210.1(e) 192.0 178.4
State-wide computer to student ratio: secondary(c)
ratio 1:5 1:5 1:5 1:3.51
78 Education and Early Childhood Development Service Delivery 2009-10

Major Outputs/DeliverablesPerformance Measures
Unit of Measure
2009-10 Target
2008-09 Expected Outcome
2008-09 Target
2007-08 Actual(a)
Quality Parent satisfaction with secondary schooling on a 100-point scale
100-point scale
72 72(e) 72 72
Percentage of children meeting the national minimum standard for reading in Year 5 (NAPLAN testing)(h)
per cent 90 nm nm nm
Percentage of children meeting the national minimum standard for numeracy in Year 5 (NAPLAN testing)(h)
per cent 92 nm nm nm
Percentage of children meeting the national minimum standard for numeracy in Year 7 (NAPLAN testing)(h)
per cent 95 nm nm nm
Percentage of children meeting the national minimum standard for reading in Year 7 (NAPLAN testing)(h)
per cent 93 nm nm nm
Percentage of children meeting the national minimum standard for numeracy in Year 9 (NAPLAN testing)(h)
per cent 93 nm nm nm
Percentage of children meeting the national minimum standard for reading in Year 9 (NAPLAN testing)(h)
per cent 92 nm nm nm
Percentage of Indigenous children meeting the national minimum standard for numeracy in Year 5 (NAPLAN testing)(h)
per cent 67 nm nm nm
Percentage of Indigenous children meeting the national minimum standard for reading in Year 5 (NAPLAN testing)(h)
per cent 61 nm nm nm
Percentage of Indigenous children meeting the national minimum standard for numeracy in Year 7 (NAPLAN testing)(h)
per cent 76 nm nm nm
Percentage of Indigenous children meeting the national minimum standard for reading in Year 7 (NAPLAN testing)(h)
per cent 69 nm nm nm
Percentage of Indigenous children meeting the national minimum standard for numeracy in Year 9 (NAPLAN testing)(h)
per cent 70 nm nm nm
Service Delivery 2009-10 Education and Early Childhood Development 79

Major Outputs/DeliverablesPerformance Measures
Unit of Measure
2009-10 Target
2008-09 Expected Outcome
2008-09 Target
2007-08 Actual(a)
Percentage of Indigenous children meeting the national minimum standard for reading in Year 9 (NAPLAN testing)(h)
per cent 68 nm nm nm
Years 5-6 students’ opinion of their connectedness with the school(n)
number (1-5)
4.3 4.3(b) 3.8 4.2
Years 7-9 students’ opinion of their connectedness with the school(n)
number (1-5)
3.6 3.6(b) 3 3.5
Cost Total output cost(l) $ million 2 697.8 2 527.6 2 335.5 2 295.7
Source: Department of Education and Early Childhood Development
Notes:(a) 2007-08 Actuals reflect those published in DEECD’s 2007-08 Annual Report and explanations for
significant variances from 2007-08 targets may be found in that Report. (b) Result as at end of December 2008.(c) Refers to financial year. (d) The 2009-10 Target is greater than the 2008-09 Target due to the Grants to Upgrade Needy
non-government schools funding and price escalation for anticipated cost increases in 2009-10.(e) The 2008-09 Expected Outcome is greater than the 2008-09 Target due to the ‘Grants to Upgrade
Needy Non-Government Schools’ funding provided for the 2008 and 2009 calendar years.(f) The high 2009-10 Target and 2007-08 Actual reflect the high priority placed by Government on
increasing leadership capacity and developing a strategic response to principal succession. The Department successfully negotiated contracts to deliver additional places for a broad suite of leadership development programs.
(g) The 2007-08 and subsequent Targets take into account funding provided by the ‘Primary Welfare Officers’ output initiative to support 450 schools. Refers to financial year.
(h) This measure replaces the National Benchmark measures that are no longer calculated. The 2009-10 Target for all schools (Government and Non-Government) has been set at the average 2008 Australian result for that measure. As 2008 was the first year of introduction of NAPLAN testing, these targets will be reviewed in future years.
(i) Targets and actuals refer to students deemed as capable of reading previously unseen text with 90 per cent accuracy at text level 1.
(j) Targets and actuals refer to students deemed as capable of reading previously unseen text with 90 per cent accuracy at text level 5.
(k) Targets and actuals refer to students deemed as capable of reading previously unseen text with 90 per cent accuracy at text level 1.
(l) Financial year measure. (m) The attendance rate covers all absences, including those due to illness and family holidays.(n) The 2009-10 Target has been raised to align with 2008-09 Expected Outcomes.
80 Education and Early Childhood Development Service Delivery 2009-10

Later Years and Youth TransitionsThe Later Years and Youth Transitions output involves provision of education and other associated services designed to improve the quality of student learning of those in Years 10–12 in Government and Non-Government schools.
The priority during the later years of schooling is to provide young people with effective and varied pathways and support to secure their first formal qualification and to make a successful transition to further study, employment or a combination of both. It includes the provision of integrated support for successful transition across sectors through organisational networks and linkages, and through transition support such as pathway plans and monitoring of destination data.
The Later Years and Youth Transitions output, along with other education outputs, is one of the primary mechanisms through which the Government will achieve the key outcome of high quality education and training for lifelong learning. These outputs will also make a significant contribution to the following key Government outcomes:
growing and linking all of Victoria; and
a fairer society that reduces disadvantage and respects diversity.
Major Outputs/DeliverablesPerformance Measures
Unit of Measure
2009-10 Target
2008-09 Expected Outcome
2008-09 Target
2007-08 Actual(a)
Later Years and Youth TransitionsThis output involves the provision of education and other associated services designed to improve the quality of student educational outcomes of those in Years 10 to 12 in Government and Non-Government schools. It also covers the provision of cross-sectoral services to improve the transition of young people to further education, training and employment.
Quantity Investment in Non-Government Schools (Years 10-12)(b)
$ million 127.9(c) 129.1(d) 118.0 109.6
Number of certificate enrolments in accredited vocational programs in schools(e)
number 41 000 41 000 41 000 nm
Number of school students enrolled in Victorian Certificate of Applied Learning (VCAL)(e)
number 11 200 11 200 11 200 nm
Number of school students participating in accredited vocational programs(e)
number 34 000 34 000 34 000 nm
Number of school students satisfactorily completing at least one VCAL certificate(e)
number 5 200 5 200 5 200 nm
Number of school-based apprentices/trainees(e)(f)
number 2 000 4 000 4 000 nm
Quality Average rate of student attendance in Years 11 and 12
per cent 91 91 91 93
Service Delivery 2009-10 Education and Early Childhood Development 81

Major Outputs/DeliverablesPerformance Measures
Unit of Measure
2009-10 Target
2008-09 Expected Outcome
2008-09 Target
2007-08 Actual(a)
Enrolments in units of accredited vocational programs in schools as a proportion of total VCE unit enrolments in schools(e)
per cent 7.6 7.6 7.6 nm
Median Victorian Certificate of Education (VCE) study score
number 29 29 29 29
Percentage of school leavers completing a VCE VET certificate program in a school progressing to further education, training or work(e)
per cent 90 90 90 nm
Percentage of school leavers completing an Intermediate or Senior VCAL certificate in a school progressing to further education, training or work(e)
per cent 80 80 80 nm
Percentage of Year 10-12 school students provided with detailed (mail and phone) follow-up in the year after exit(g)
per cent 70 70 70 70
Percentage of VCAL Certificates satisfactorily completed by school students(e)
per cent 60 60 60 nm
State-wide rate of transition from Year 10 to Year 11(h)
per cent 97 97(h) 97 97.1
Cost Total output cost(i) $ million 1 727.1 1 621.5 1 508.2 1 475.3
Source: Department of Education and Early Childhood Development
Notes:(a) 2007-08 Actuals reflect those published in DEECD’s 2007-08 Annual Report and explanations for
significant variances from 2007-08 targets may be found in that report.(b) Financial year measure.(c) The 2009-10 Target is greater than the 2008-09 Target due to the Grants to Upgrade Needy
Non-Government Schools funding and price escalation for anticipated cost increases in 2009-10.(d) The 2008-09 Expected Outcome is greater than the 2008-09 Target due to the Grants to Upgrade
Needy Non-Government Schools funding provided for the 2008 and 2009 calendar years.(e) Includes Non-Government schools.(f) The lower 2009-10 Target is based on the Victorian Skills Commission’s new definition of School
Based Apprenticeships and Traineeships that takes effect from 1 January 2009. Only integrated School Based Apprenticeships and Traineeships will be counted from that date. Consequently targets and results from 2009 onwards are not comparable with previous years.
(g) Assessed by the On-Track survey and includes Government and Non-Government schools.(h) February census. Government schools only.(i) Financial year measure.
82 Education and Early Childhood Development Service Delivery 2009-10

Services to StudentsThis consists of one output which covers student welfare and support, services to students with disabilities, education maintenance allowance, school start bonus payments and student transport.
It involves provision of:
education services relating to student welfare, including drug education and mental health issues;
student support services in the area of student wellbeing including speech pathology, visiting teacher services for hearing, visually, health and physically impaired students, curriculum services and alternative programs;
education services for students with disabilities in regular and specialist schools;
the education maintenance allowance to eligible parents of school students up to the age of 16 years in Government and Non-Government Schools;
the school start bonus payment to students in the Preparatory Year and Year 7;
student conveyance allowances and the transport of Government and Non-Government School students, including those attending specialist schools; and
school-focused youth services.
The Services to Students output, along with other education outputs, is one of the primary mechanisms through which the Government will achieve the key outcome of high quality education and training for lifelong learning. This output will also make a significant contribution to the following key Government outcomes:
growing and linking all of Victoria; and
a fairer society that reduces disadvantage and respects diversity.
Major Outputs/DeliverablesPerformance Measures
Unit of Measure
2009-10 Target
2008-09 Expected Outcome
2008-09 Target
2007-08 Actual(a)
Services to StudentsThis output covers student welfare and support, services to students with disabilities, school focused youth services, education maintenance allowance and student transport.
Quantity Eligible special school students provided with appropriate travel(b)
number 6 850 6 850 6 850 6 694
Investment in services to students with disabilities(b)
$ million 490.2(c) 461.4(d) 435.6 428
Investment in student transport(b) $ million 87.9 87.6 85.8 80.7Investment in student welfare and support(b)
$ million 124.7(c) 121.7(d) 113.9 113.5
Provision of Education Maintenance Allowance(b)
$ million 62.8 58.4 60.7 57.5
Provision of school start bonus payment(e)
$ million 41.7 39.6 40.8 38.1
Service Delivery 2009-10 Education and Early Childhood Development 83

Major Outputs/DeliverablesPerformance Measures
Unit of Measure
2009-10 Target
2008-09 Expected Outcome
2008-09 Target
2007-08 Actual(a)
School students (government) supported by conveyance allowance(b)
number 13 300 12 980 12 980 12 179
School students (non-government) supported by conveyance allowance(b)
number 34 900 32 400 32 400 33 293
Students funded under the disabilities program in government schools as a proportion of the total student population
per cent 3 3 3 3
Students receiving school start bonus payment(f)
number 130 000 130 000 130 000 129 549
Quality Parent satisfaction with special education on a 100-point scale
100-point scale
85 85(g) 85 85
School satisfaction with student support services
per cent 84.7 84.7(g) 82 88.2
Cost Total output cost(b) $ million 811.7 772.9 741.0 721.9
Source: Department of Education and Early Childhood Development
Notes:(a) 2007-08 Actuals reflect those published in the Department’s 2007-08 Annual Report and
explanations for significant variances from 2007-08 Targets may be found in that Report.(b) Refers to financial year. (c) The 2009-10 Target is greater than the 2008-09 Target due to the impact of an output price review
and price escalation for anticipated cost increases in 2009-10.(d) The 2008-09 Expected Outcome is greater than the 2008-09 Target due to the impact of an output
price review.(e) Refers to financial year and includes non-government schools. This performance measure replaces
the 2008-09 Performance Measure ‘Provision of school start-up payment’. The 2009-10 Performance Measure is the same as the 2008-09 Measure except for replacement of the word ‘up’ with ‘bonus’ and measures the exact same activity as per the performance measure in 2008-09.
(f) Refers to financial year and includes non-government schools. This performance measure replaces the 2008-09 performance measure ‘Students receiving school start-up payment’. The 2009-10 performance measure is the same as the 2008-09 performance measure except for replacement of the word ‘up’ with ‘bonus’ and measures the exact same activity as per the performance measure in 2008-09.
(g) Result as at end of December 2008.
84 Education and Early Childhood Development Service Delivery 2009-10
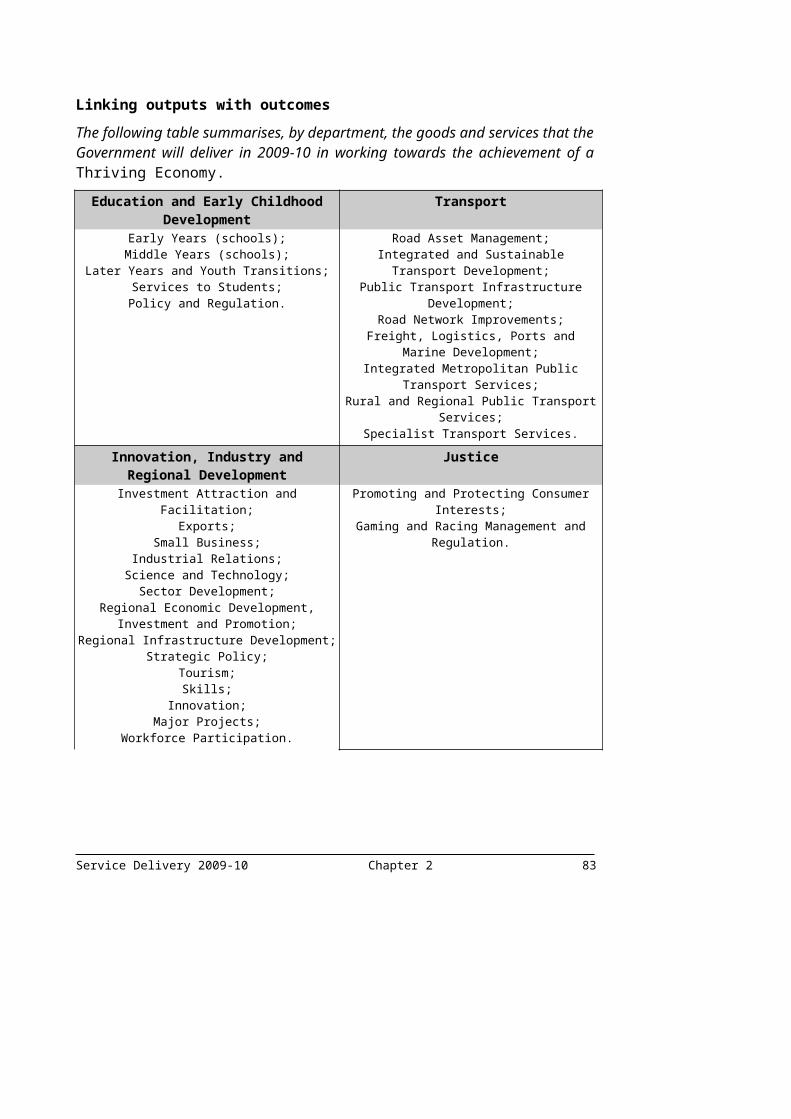
Adolescent Health Services (schools)This consists of one output and involves the provision of school nursing services for secondary school-aged children. It makes a significant contribution to the key government outcome of:
high quality, accessible health and community services.
Major Outputs/DeliverablesPerformance Measures
Unit of Measure
2009-10 Target
2008-09 Expected Outcome
2008-09 Target
2007-08 Actual(a)
Adolescent Health Services (schools)This output involves the provision of school nursing services for secondary school-aged children.
Quantity Designated schools receiving secondary school nursing services
number 199 199 199 199
Cost Total output cost(b) $ million 10.1(c)(d) 10.3(e) 9.6 9.5
Source: Department of Education and Early Childhood Development
Notes:(a) 2007-08 Actuals reflect those published in DEECD’s 2007-08 Annual Report and explanations for
significant variances from 2007-08 targets may be found in that Report. (b) Refers to financial year.(c) The 2009-10 Target is less than the 2008-09 Expected Outcome due to a one-off bonus payable in the
2008-09 financial year only.(d) The 2009-10 Target is greater than the 2008-09 Target due to the impact of an output price review.(e) The 2008-09 Expected Outcome is greater than the 2008-09 Target due to the impact of an output
price review.
Service Delivery 2009-10 Education and Early Childhood Development 85

Policy and RegulationThe Policy and Regulation output involves provision of policy, administrative support and strategic advice to the Ministers in relation to their parliamentary and legislative responsibilities.
It includes provision of information services about education to the community, including dissemination of information through public promotions, telephone services, publications and advertising services. It also covers the provision of administrative support services for the statutory authorities in the education portfolio including regulatory and advisory bodies. It covers:
regulatory activities; and
services for international education including recruitment, assessment, student placement, marketing, organisation of study tours, and international teacher and principal exchange programs.
The Policy and Regulation output, along with other education outputs, is one of the primary mechanisms through which the Government will achieve the key outcome of high quality education and training for lifelong learning. These outputs will also make a significant contribution to the following key government outcomes:
growing and linking all of Victoria;
sound financial management; and
a fairer society that reduces disadvantage and respects diversity.
Major Outputs/DeliverablesPerformance Measures
Unit of Measure
2009-10 Target
2008-09 Expected Outcome
2008-09 Target
2007-08 Actual(a)
Policy and RegulationThis output involves provision of policy, administrative and strategic advice to the ministers (including parliamentary and legislative responsibilities). It also covers provision of administrative support services for the various statutory authorities including the Victorian Curriculum and Assessment Authority and Victorian Registration and Qualifications Authority, regulation and advisory bodies and for international education.
Quantity Participants benefiting from initiatives to increase the supply of qualified teachers(b)
number 525 500 575 666
Cost Total output cost(c) $ million 41.9 40.8 40.8 38.4
Source: Department of Education and Early Childhood Development
Notes:(a) 2007-08 Actuals reflect those published in DEECD’s 2007-08 Annual Report and explanations for
significant variances from 2007-08 targets may be found in that Report. (b) Refers to financial year. The deferred implementation of the ‘Improving the Quality of Graduate
Teachers’ initiative means there were no intakes for that initiative in 2008. Consequently, the 2008-09 Expected Outcome is estimated at 500 participants. The first intake of 25 graduates (included in the 2009-10 Target) will occur in 2009 (to start teaching in 2010) with another 50 expected in 2010.
(c) Refers to financial year.
86 Education and Early Childhood Development Service Delivery 2009-10
DEPARTMENT OF HUMAN SERVICES
Departmental mission statementTo enhance and protect the health and wellbeing of all Victorians, emphasising vulnerable groups and those most in need.
Significant challenges facing the Department in the medium termThe bushfires of February 2009 have had a profound impact on many communities and individuals. During 2009-10, the Department of Human Services (DHS) will play a critical role in supporting these communities and individuals.
The provision of a case management service will assist in supporting people affected by the fires to rebuild their lives. DHS will also facilitate the provision of short and medium term accommodation and psychosocial support. DHS will continue to support the Victorian Bushfire Appeal Fund in the distribution of assistance to those affected by the fires.
While providing individual support is a priority in the recovery effort, another important element is providing assistance to help communities to recover. To support community recovery DHS will provide coordination, support and professional development to the Community Development Officers who are employed by many local government authorities.
To support this range of activity and services provided by other agencies, DHS has established Community Service Hubs in ten of the affected communities. The hubs will form a focal point and a point of access for the range of services.
A Bushfire Recovery Service Delivery Unit has been established to coordinate DHS activities and work closely with the Victorian Reconstruction and Recovery Authority which has responsibility for coordinating efforts across Victoria.
The Department plans, funds and delivers health, community, mental health and housing services in support of the Government’s vision for making Victoria a better place to live and raise a family. Other challenges identified by the Department to ensure access, quality and sustainability of Victoria’s human services in the medium term include:
Managing demand for services aligning service capacity with service demand;
responding to increasing complexity of client need; and
ensuring access to appropriate service types.
Service Delivery 2009-10 Human Services 87

Acting sooner and more effectively shifting the focus towards effective prevention and early intervention; and
delivering services around person and place.
Addressing emerging health and social issues improving the care and early detection of chronic disease; and
preventing obesity.
Addressing disadvantage improving access to universal services;
strengthening assistance to disadvantaged groups; and
breaking down concentrations of disadvantage.
Improving sustainability and productivity improving service productivity;
developing a skilled and flexible workforce; and
using progress in technology and knowledge.
Major policy decisions and directionsThe Department has six objectives to guide responses to these challenges and to address the goals set out in Growing Victoria Together and A Fairer Victoria. The Department’s objectives are:
building sustainable, well managed and efficient human services;
providing timely and accessible human services;
improving human service safety and quality;
promoting least intrusive and earliest effective care;
strengthening the capacity of individuals, families and communities; and
reducing inequalities through improving health and wellbeing, particularly for disadvantaged people and communities.
Ministerial portfoliosThe Department supports the ministerial portfolios of Health, Mental Health, Community Services, Senior Victorians, and Housing.
88 Human Services Service Delivery 2009-10

Changes to the output structureThe Department has made changes to its output structure in 2009-10 as shown in the table below.
2009-10 Outputs Reason 2008-09 OutputsSpecialist Support and Placement Services
Restructure Child Protection Specialist ServicesPlacement and Support Services
Concessions to Pensioners and Beneficiaries
Restructure Energy, Water and Municipal Rates ConcessionsSocial and Community Services
The Department’s output structure has been altered to align with the strategic directions and priorities of the Government and the Department. The merging of the two outputs, Child Protection Specialist Services and Placement and Support Services emphasises the continuity and integration of child protection and out of home care placement system. Similarly, the outputs, Energy, Water and Municipal Rates Concessions and Social and Community Services are clustered into a single output under Concessions to Pensioners and Beneficiaries to provide a unified response on concessions to vulnerable households.
Discontinued outputs and performance measures are detailed in Appendix C of this budget paper.
The following table summarises the total output cost. It has been prepared on the basis of the Department’s 2009-10 output structure and therefore allocations may differ from the Department’s previously published budget.
Service Delivery 2009-10 Human Services 89

Table 3.2: Output Summary($ million)
2008-09 Budget
2008-09 Revised
2009-10 Budget
Variation (a)(b)
%Acute Health Services 7 015.7 7 081.8 7 602.0 8.4Ambulance Services 494.4 518.8 529.1 7.0Mental Health 883.8 889.3 945.0 6.9Aged and Home Care 915.5 922.4 974.3 6.4Primary and Dental Health (c) 330.3 368.6 418.2 26.6Small Rural Services 442.9 439.7 452.6 2.2Public Health (d) 280.7 310.9 265.6 -5.4Drug Services 123.9 128.8 127.5 2.9Disability Services 1 175.5 1 228.7 1 287.9 9.6Child Protection and Family Services (e) 520.2 553.9 583.0 12.1Youth Services and Youth Justice (f) 105.1 105.8 104.8 -0.3Concessions to Pensioners and Beneficiaries (g) 446.7 429.6 463.4 3.7Housing Assistance (h) 367.0 470.2 969.7 164.2Total (i) 13 101.7 13 448.5 14 723.1 12.4Source: Department of Human Services.
Notes:(a) Variation between 2008-09 Budget and 2009-10 Budget.(b) Increases in the Department of Human Services' 2009-10 Budget compared with the 2008-09 Budget
are due primarily to: – funding provided for government policy commitments including the full-year effect of initiative
funding announced in previous years budgets;– output price increases arising from Australian Industrial Relations Commission decisions and
enterprise bargaining agreements and the outcome from an output price review;– indexation funding provided for anticipated cost increases in 2009-10;– output price increases for depreciation, amortisation and capital asset charge costs associated
with the approved asset investment program for 2009-10;– increased Commonwealth funding due to the expansion of a number of programs; and– increases in income from the sale of goods and services, particularly for Public Hospital and
Ambulance services.(c) The 2009-10 Budget includes additional funding for the Victorian Bushfire Case Management
Service, Commonwealth Closing the Gap in Indigenous Health, Indexation and enterprise bargaining agreement outcomes.
(d) The 2009-10 Budget includes a reduction of fixed term vaccine funding, additional funding for Indigenous Early Childhood Development, Public Health Governance and Regulatory Reform, ‘Victoria's Cancer Action Plan’, Indexation and enterprise bargaining agreement outcomes.
(e) The 2009-10 Budget reflects additional funding for new initiatives.(f) 2009-10 Budget reflects the cessation of fixed-term funds provided in 2008-09.(g) The output summary includes funding for transport concessions transferred to the Department of
Transport. This funding is reflected in the Department of Transport's Public Transport Services outputs.
(h) The 2009-10 Budget reflects an increase in Commonwealth funding for the Nation Building National Partnership for Repairs and Maintenance and New Construction, Remote Indigenous Housing National Partnership Agreement, Social Housing National Partnership Agreement, 'A Place To Call Home' initiative and for the Homelessness National Partnership Agreement. Additional funding was also provided in 2009-10 for the 'Building on Success on Neighbourhood Renewal' initiatives.
(i) Total output expense may not equate to the total expense reported in Budget Paper No. 4, Chapter 3, Departmental Financial Statements due to additional expenses in Budget Paper No. 4 that are not included in departmental output costs.
90 Human Services Service Delivery 2009-10

The following section provides details of the outputs to be provided to government, including performance measures and costs for each output. Total expenditure for the Department can be found in Budget Paper No. 4, Chapter 3, Departmental Financial Statements.
Service Delivery 2009-10 Human Services 91

Acute Health Services Acute Health Services outputs, through the provision of a range of timely and high quality acute hospital inpatient, ambulatory, emergency, community-based and specialist services, make a vital contribution to the key government outcomes of:
high quality, accessible health and community services;
a fairer society that reduces disadvantage and respects diversity; and
building friendly, confident and safe communities.
Major Outputs/DeliverablesPerformance Measures
Unit of Measure
2009-10 Target
2008-09 Expected Outcome
2008-09 Target
2007-08 Actual
Admitted ServicesAcute and sub-acute patient services (elective and non-elective) provided at Victorian metropolitan and rural public hospitals.
Quantity Palliative care bed days(a) number
(‘000)79 76 76 76
Sub-acute bed days(a) number (‘000)
655 627 612 598
Total separations – all hospitals(a) number (‘000)
1 468 1 425 1 457 1 394
Weighted Inlier Equivalent Separations (WIES) – all hospitals except small rural health services(a)
number (‘000)
985 960 948 938
WIES funded separations – all hospitals except small rural health services(a)
number (‘000)
1 365 1 322 1 345 1 292
WIES funded emergency Separations – all hospitals(b)
number (‘000)
496 484 500 483
Quality Hospitals participating in Victorian Hospital Acquired Infection Surveillance System (VICNISS)
per cent 100 100 100 98
Major trauma patients transferred to a major trauma service(c)
per cent 75 84 75 84
Perinatal morbidity notices received, processed and reported(d)
per cent 100 100 100 100
Public hospitals meeting cleaning standards, as assessed by external audit
per cent 100 100 100 100
Public hospitals accredited per cent 100 100 100 100Timeliness
Emergency patients transferred to ward within 8 hours(e)
per cent 80 69 80 67
92 Human Services Service Delivery 2009-10
Major Outputs/DeliverablesPerformance Measures
Unit of Measure
2009-10 Target
2008-09 Expected Outcome
2008-09 Target
2007-08 Actual
Non-urgent (Category 3) elective surgery patients admitted within 365 days
per cent 90 90 90 91
Semi-urgent (Category 2) elective surgery patients admitted within 90 days(f)
per cent 80 74 80 70
Urgent (Category 1) elective surgery patients admitted within 30 days
per cent 100 100 100 100
Cost Total output cost $ million 5 940.0(g) 5 514.4(h) 5 467.1 5 166.7
Non-Admitted ServicesAcute and sub-acute services provided at Victorian metropolitan and rural public hospitals.
Quantity Completed post acute episodes(a) number 38 000 36 000 36 000 36 967Patients treated in Specialist Outpatient Clinics – unweighted(i)
number (‘000)
1 261 1 261 1 291 1 250
Patients treated in Specialist Outpatient Clinics – weighted(j)
number (‘000)
1 374 1 406 1 335 1 382
Sub-acute ambulatory care occasions of service(a)
number 471 000 463 500 461 000 448 400
Quality Post-acute clients not readmitted to acute hospital
per cent 90 90 90 92
Timeliness Sub-acute ambulatory care service clients contacted within three days of referral
per cent 80 80 80 80
Cost Total output cost $ million 1 035.2(k) 973.5(l) 963.6 905.8
Emergency ServicesEmergency presentations at reporting hospitals with emergency departments.
Quantity Emergency presentations(m) number
(‘000)1 370 1 340 1 410 1 350
Quality Time on hospital bypass(n) per cent 3 2.5 3 2.9
Timeliness Emergency Category 1 treated immediately
per cent 100 100 100 100
Service Delivery 2009-10 Human Services 93

Major Outputs/DeliverablesPerformance Measures
Unit of Measure
2009-10 Target
2008-09 Expected Outcome
2008-09 Target
2007-08 Actual
Emergency Category 2 treated in 10 minutes
per cent 80 83 80 78
Emergency Category 3 treated in 30 minutes
per cent 75 72 75 68
Non-admitted emergency patients with a length of stay of less than four hours(o)
per cent 80 75 80 74
Cost Total output cost $ million 338.7(k) 314.3(l) 308.4 292.8
Acute Training and DevelopmentProvision of grants to hospitals for the training and accreditation of health workers.
Quantity Total full time equivalent (FTE) (early graduate) medical positions in public system(p)
number 1 069 979 928 917
Total FTE (early graduate) nursing positions in public system
number 1 305 1 305 1 313 1 305
Total FTE (early graduate) allied health positions in public system(q)
number 453 453 446 440
Post graduate nursing places at Diploma and Certificate level
number 832 832 832 929
Cost Total output cost $ million 288.1(r) 279.6(s) 276.6 245.0
Source: Department of Human Services.
Notes:(a) 2009-10 Target reflects additional recurrent funding for policy initiative ‘Sustaining Health Service
Capacity’.(b) 2009-10 Target reflects fewer lower acuity patients presenting to emergency departments.(c) The patterns of transfer across the system indicate patients were transferred appropriately to a
trauma service based on the trauma triage guidelines.(d) Measure transferred from ‘Public Health’ output group.(e) Factors affecting performance include workforce shortages impacting on the availability of beds at
some campuses and a higher number of complex patients presenting at some Emergency Departments.
(f) 2008-09 Expected Outcome reflects impact of strategy to target long-waiting patients.(g) 2009-10 Target reflects additional funding for indexation and enterprise bargaining agreements and
policy initiatives including ‘Sustaining Health Service Capacity’, establishment of Albury Wodonga Health Service, Council of Australian Governments National E-Health Transition Authority Core Operations, National Partnership Agreement on Hospital and Health Workforce Reform and Support for Public Hospitals.
(h) 2008-09 Expected Outcome reflects additional funding for enterprise bargaining agreements and for the ‘Sustaining Health Service Capacity’ policy initiative.
(i) The target has been adjusted to reflect the increasing level of complexity of patients presenting to health services.
94 Human Services Service Delivery 2009-10
Notes (continued):(j) The higher 2008-09 Expected Outcome reflects higher acuity outpatients and the inclusion
(part-year) of activity from Maroondah and Casey hospitals. 2009-10 Target has been adjusted accordingly.
(k) 2009-10 Target reflects additional funding for indexation and enterprise bargaining agreements and policy initiatives including ‘ Sustaining Health Service Capacity’, establishment of Albury Wodonga Health Service, Council of Australian Governments National E-Health Transition Authority Core Operations, National Partnership Agreement on Hospital and Health Workforce Reform and Support for Public Hospitals.
(l) 2008-09 Expected Outcome reflects additional funding for enterprise bargaining agreements and for the ‘Sustaining Health Service Capacity’ policy initiative.
(m) 2008-09 Expected Outcome reflects lower acuity patients presenting to emergency departments. 2009-10 Target has been adjusted accordingly.
(n) This is a positive result reflecting hospitals’ ability to cope with emergency demand.(o) Factors impacting on performance include higher presentations at hospitals with limited capacity.
Workforce shortages have also impacted upon performance.(p) 2008-09 Expected Outcome reflects 51 additional post-graduate training places starting in
January 2009. 2009-10 Target reflects a further 90 post-graduate places.(q) 2009-10 Target reflects additional training positions.(r) 2009-10 Target reflects additional funding for indexation and enterprise bargaining agreements and
policy initiatives including the National Partnership Agreement on Hospital and Health Workforce Reform and ‘Support for Public Hospitals’.
(s) 2008-09 Expected Outcome reflects additional funding for enterprise bargaining agreements.
Service Delivery 2009-10 Human Services 95
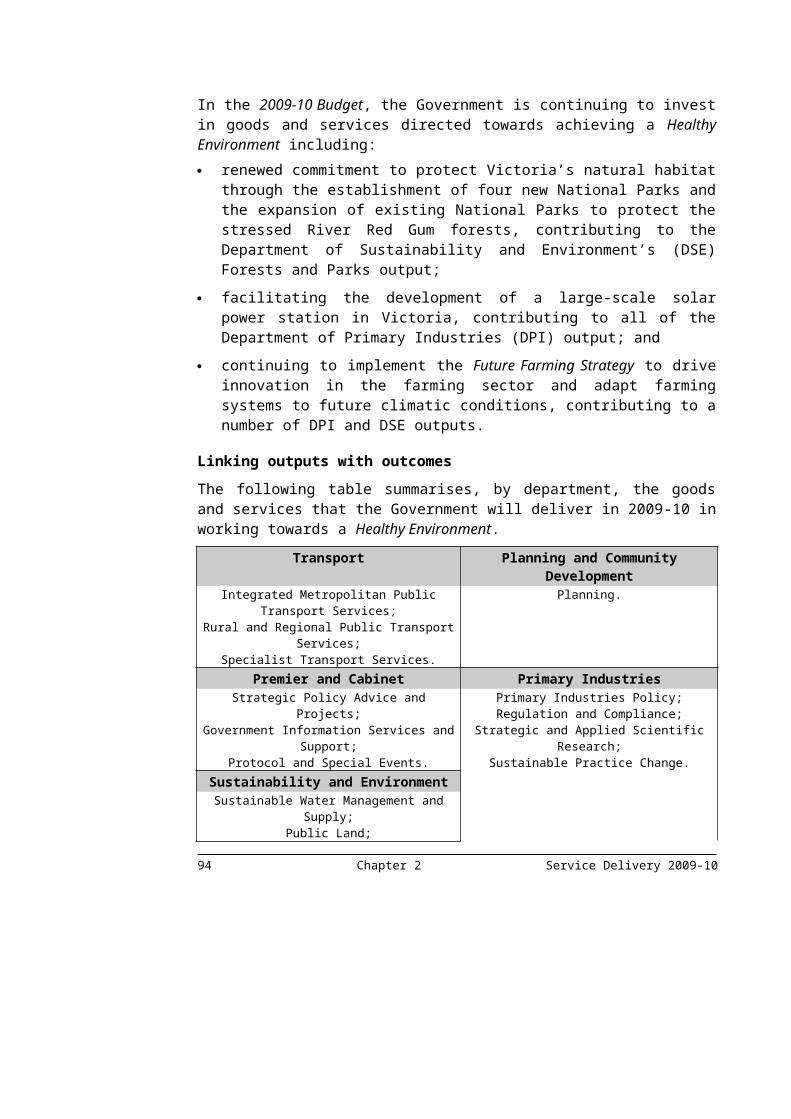
Ambulance ServicesAmbulance Services outputs, through the provision of emergency and non emergency ambulance services, make a significant contribution to the key government outcome of high quality, accessible health and community services.
Major Outputs/DeliverablesPerformance Measures
Unit of Measure
2009-10 Target
2008-09 Expected Outcome
2008-09 Target
2007-08 Actual
Ambulance Emergency ServicesEmergency road, rotary and fixed air wing patient treatment and transport services, associated education and first responder support.
Quantity Country road cases number 127 000 124 223 127 000 120 842Metropolitan road cases(a) number 319 000 298 628 319 000 309 614Pensioner and concession card-holder cases(a)
number 198 600 193 792 204 600 nm
Statewide air cases(b) number 2 650 2 892 2 500 2 334Quality
Audited cases attended by Community Emergency Response Teams (CERT) meeting clinical practice standards(c)
per cent 90 97 85 96
Audited cases statewide meeting clinical practice standards
per cent 95 98 95 98
Proportion of patients experiencing severe cardiac and traumatic pain whose level of pain is reduced significantly
per cent 90 89 90 87
Proportion of patients satisfied or very satisfied with quality of care provided by paramedics
per cent 95 98 95 98
Timeliness CERT arrival occurs prior to ambulance
per cent 85 84 85 83
Proportion of emergency (Code 1) incidents responded to within 15 minutes – statewide
per cent 85 83 85 81
Proportion of emergency (Code 1) incidents responded to within 15 minutes in centres with more than 7 500 population
per cent 90 89 90 88
Cost Total output cost $ million 442.6(d) 435.0(e) 416.1 379.8
96 Human Services Service Delivery 2009-10

Major Outputs/DeliverablesPerformance Measures
Unit of Measure
2009-10 Target
2008-09 Expected Outcome
2008-09 Target
2007-08 Actual
Ambulance Non-Emergency ServicesNon-emergency road and fixed air wing patient transport services.
Quantity Country road cases(f) number 56 600 56 365 55 000 54 360Metropolitan road cases number 222 800 221 827 222 800 213 898Pensioner and concession card holders transported(a)
number 174 000 169 759 181 100 nm
Statewide air cases(g) number 4 100 3 659 4 100 3 771Quality
Audited cases statewide meeting clinical practice standards
per cent 94 98 94 98
Cost Total output cost $ million 86.5(d) 83.8(e) 78.3 78.0
Source: Department of Human Services.
Notes:(a) 2008-09 Expected Outcome reflects lower than anticipated demand. The 2009-10 Target has been
adjusted on the basis of 2008-09 activity.(b) 2008-09 Expected Outcome reflects continual improvement in service coordination as well as
ongoing focus on appropriate use of service. The 2009-10 Target increase reflects anticipated increase in statewide air cases following the commencement of the Warrnambool helicopter service.
(c) 2009-10 Target reflects full integration of the program within the ambulance service system.(d) 2009-10 Target reflects additional funding provided for the ‘Ambulance Services Strategy’ initiative.(e) 2008-09 Expected Outcome reflects increased contributions from membership and transport fees, and
increased funding from other users.(f) 2008-09 Expected Outcome reflects growth in demand and 2009-10 Target has been adjusted
accordingly.(g) 2009-10 Target reflects improved coordination of air retrieval services. The 2008-09 Expected
Outcome reflects improvement in service coordination and ongoing focus on appropriate use of service.
Service Delivery 2009-10 Human Services 97

Mental HealthMental Health outputs, including the provision of a range of inpatient, community-based residential and ambulatory services which treat and support people with a mental illness and their families and carers, make a significant contribution to the key government outcomes of:
high quality, accessible health and community services;
a fairer society that reduces disadvantage and respects diversity; and
building friendly, confident and safe communities.
98 Human Services Service Delivery 2009-10
Major Outputs/DeliverablesPerformance Measures
Unit of Measure
2009-10 Target
2008-09 Expected Outcome
2008-09 Target
2007-08 Actual
Clinical CareA range of inpatient, residential and community-based clinical services provided to people with mental illness and their families.
Quantity Clinical inpatient separations(a) number 19 250 19 100 21 100 21 148Community contact hours hours
(‘000)1 097 1 072 1 097 1 027
New case index per cent 50 50 50 45.5Registered community clients number 58 000 58 000 58 000 57 426Residential bed days(b) number 343 000 338 000 338 000 nm
Quality Pre-admission community care per cent 60 60 60 57.6Post-discharge community care per cent 70 70 70 68.5New client index per cent 45 45 45 42.4Number of area mental health services achieving or maintaining accreditation under the National Standards for Mental Health Services
number 21 21 21 21
Clients readmitted (unplanned) within 28 days
per cent 14 14 14 13.4
Timeliness Emergency patients admitted to a mental health bed within 8 hours
per cent 80 80 80 72
Cost Total output cost $ million 857.3(c) 807.3(d) 801.8 754.9
Psychiatric Disability Rehabilitation and Support Services (PDRSS)A range of rehabilitation and support services provided to people with a psychiatric disability, as well as their families and carers.
Quantity Bed days number 75 000 75 000 75 000 75 941Clients receiving psychiatric disability support services(e)
number 12 500 12 500 12 400 13 578
Contact hours(f) number (‘000)
1 175 1 160 1 160 1 168
Quality Proportion of major agencies accredited against the PDRSS standards
per cent 100 100 100 70
Cost Total output cost $ million 87.8(g) 82.0 82.0 78.9
Service Delivery 2009-10 Human Services 99
Source: Department of Human Services.
Notes:(a) 2008-09 Target has been adjusted (was 21 100, now 19 100) and Expected Outcome reflects a
change to the way same day admissions (no overnight stay) are recorded for Electro Convulsive Therapy (ECT) to ensure accurate recording of ECT treatment. 2009-10 Target is adjusted accordingly.
(b) 2009-10 Target adjusted to reflect additional beds.(c) 2009-10 Target reflects additional funding for indexation and enterprise bargaining agreements and
policy initiatives including ‘Sustaining Health Service Capacity’, ‘Autism State Plan’ and the ‘Mental Health Reform Strategy’.
(d) 2008-09 Expected Outcome reflects additional funding for enterprise bargaining agreements.(e) 2009-10 Target adjusted to reflect impact of increased demand.(f) 2009-10 Target reflects additional funding for ‘Mental Health Reform Strategy’ initiatives.(g) 2009-10 Target reflects additional funding for indexation and policy initiatives including the ‘Mental
Health Reform Strategy’.
100 Human Services Service Delivery 2009-10
Aged and Home CareAged and Home Care outputs, through the provision of a range of in-home, community-based, specialist geriatric and residential care services for older people, make a significant contribution to the key government outcomes of:
high quality, accessible health and community services;
a fairer society that reduces disadvantage and respects diversity; and
building friendly, confident and safe communities.
This includes Home and Community Care (HACC) services for frail older people, people with a disability and their carers.
Major Outputs/DeliverablesPerformance Measures
Unit of Measure
2009-10 Target
2008-09 Expected Outcome
2008-09 Target
2007-08 Actual
Residential Aged CareServices for people requiring ongoing care and support in a residential aged care setting.
Quantity Bed days in high-care places number 924 000 924 000 924 000 913 531Bed days in low-care places(a) number 414 000 417 000 421 000 425 118Standard Equivalent Value Units(b)
(c)number 498 000 495 300 495 300 488 815
Quality Residential care services certified and accredited
per cent 100 100 100 100
Cost Total output cost $ million 290.0(d) 284.7(e) 275.7 290.0
Aged Care AssessmentComprehensive assessment of people's requirements for treatment and residential aged care services.
Quantity Aged care assessments(f) number 59 000 57 790 57 790 57 688
Timeliness Average wait between client registration and ACAS assessment – hospital-based assessment(g)
days 2.5 1.9 2.5 1.9
Average wait between client registration and ACAS assessment – community-based assessment(h)
days 15 22 15 21.8
Cost Total output cost $ million 39.6 38.0 38.0 36.8
Service Delivery 2009-10 Human Services 101
Major Outputs/DeliverablesPerformance Measures
Unit of Measure
2009-10 Target
2008-09 Expected Outcome
2008-09 Target
2007-08 Actual
Aged Support ServicesA range of community services that support older Victorians and their carers.
Quantity Individuals provided with respite services
number 22 000 22 000 22 000 21 239
Pension-level beds available in assisted Supported Residential Services facilities
number 1 870 1 871 1 870 1 894
Pension-level Supported Residential Services residents provided with service coordination and support/brokerage services(i)
number 890 447 775 211
Personal alert units allocated(j) number 23 255 22 255 22 255 21 261Victorian EyeCare Service (occasions of service)
number 75 800 75 800 75 800 72 116
Quality Funded research and service development projects for which satisfactory reports have been received
per cent 100 100 100 100
Cost Total output cost $ million 103.3 99.1(k) 101.4 87.8
HACC Primary Health, Community Care and SupportA range of community-based nursing, allied health and support services enabling frail, older people and younger people with disabilities to maintain their independence in the community.
Quantity Clients receiving Home and Community Care services(l)
number 256 600 250 400 250 400 256 162
Home and Community Care service delivery hours(l)
number 9 786 000 9 549 000 9 549 000 9 575 343
Standard Equivalent Value Units(l) number 4 789 000 4 749 000 4 749 000 4 730 847Quality
Eligible population receiving Home and Community Care services
per cent 30 30 30 32
Cost Total output cost $ million 541.4(m) 500.6 500.4 470.1
Source: Department of Human Services.
Notes:(a) 2009-10 Target is adjusted to reflect changing patterns in demand for low-care places.(b) Standard Equivalent Value Units (SEV) is a single measure across relevant outputs; an exchange
rate that measures the relative resource intensity of service activity using a common benchmark price.
102 Human Services Service Delivery 2009-10
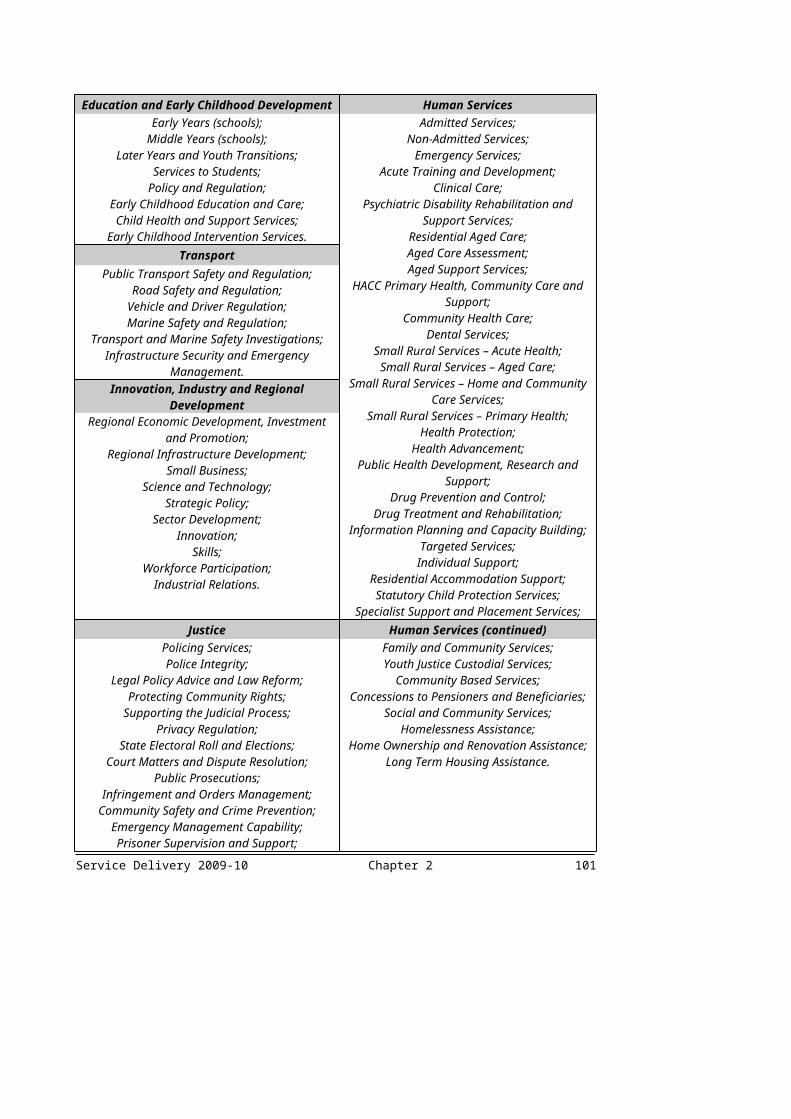
Notes (continued):(c) 2009-10 increased target reflects the change in the low-care bed day targets and a changed target
calculation methodology.(d) 2009-10 Target includes an increase in Commonwealth and third party revenue, indexation,
enterprise bargaining agreement outcomes and transfers to ‘Small Rural Services’.(e) 2008-09 Expected Outcome reflects an increase in Commonwealth and third party revenue,
enterprise bargaining agreement outcomes and transfers to ‘Small Rural Services’.(f) 2009-10 Target increase reflects additional Commonwealth funding in 2008-09.(g) 2008-09 Expected Outcome reflects the priority given to assessments conducted in hospitals.(h) 2008-09 Expected Outcome reflects increased referrals for community based assessments due to the
ageing population. Work is continuing with the Commonwealth Government to address this issue.(i) 2008-09 Expected Outcome is lower due to later than expected service start-up for the ‘Supported
Accommodation for Vulnerable Victorians’ initiative. 2009-10 Target reflects the services to be rolled out to additional residents.
(j) 2009-10 Target increase is due to additional funding for the Personal Alert Victoria program.(k) 2008-09 Expected Outcome reflects transfer of funding to ‘Small Rural Services’ and ‘Residential
Aged Care Services’.(l) 2009-10 Target increase reflects additional Commonwealth/State matched funding for HACC.(m) The 2009-10 Target reflects additional Commonwealth/State matched funding for Home and
Community Care Services, HACC Bonus Pool funding, enterprise bargaining agreement outcomes and transfers to Small Rural Services.
Service Delivery 2009-10 Human Services 103

Primary and Dental HealthPrimary and Dental Health outputs, through the provision of a range of in-home, community-based, community, primary health and dental services designed to promote health and wellbeing and prevent the onset of more serious illnesses, make a significant contribution to the key government outcomes of: high quality, accessible health and community services;
a fairer society that reduces disadvantage and respects diversity; and
building friendly, confident and safe communities.
104 Human Services Service Delivery 2009-10

Major Outputs/DeliverablesPerformance Measures
Unit of Measure
2009-10 Target
2008-09 Expected Outcome
2008-09 Target
2007-08 Actual
Community Health CareA range of community care and support services, including allied and women’s health, that enable people to continue to live independently in the community.
Quantity Better Health Channel visits(a) number
(‘000)11 000 12 000 10 000 10 600
Primary Care Partnerships with reviewed and updated strategic plans(b)
per cent 100 100 100 100
Service delivery hours in community health care(c)
number 982 000 939 920 972 000 920 559
Standard Equivalent Value Units(c) number 1 065 500 1 040 490 1 076 000 1 074 600Quality
Agencies with satisfactorily completed health promotion plans
per cent 100 100 100 100
Cost Total output cost $ million 269.3(d) 228.2(e) 191.0 182.1
Dental ServicesA range of dental health services to support health and wellbeing in the community.
Quantity Persons treated(f) number 314 700 305 000 305 000 320 920Standard Equivalent Value Units(f) number 1 386 700 1 369 000 1 369 000 1 298 174
Quality Ratio of emergency to general courses of dental care(g)
ratio 53:47 43:57 53:47 49:51
Timeliness Waiting time for restorative dental care(h)
months 23 19 23 18
Waiting time for dentures(h) months 22 17 22 13Cost
Total output cost $ million 148.9(i) 140.4(j) 139.3 144.2
Source: Department of Human Services
Notes:(a) This performance measure replaces the 2008-09 performance measure Better Health Channel
internet sessions (visits). The 2009-10 performance measure is the same as the 2008-09 measure and measures the exact same activity as per the performance measure in 2008-09. The 2008-09 Expected Outcome reflects the upward trend in demand and the 2009-10 Target is adjusted accordingly.
(b) This performance measure replaces the 2008-09 performance measure ‘Primary Care Partnerships’ with reviewed and updated Community Health Plans. The 2009-10 performance measure is the same as the 2008-09 measure and measures the exact same activity as per the performance measure in 2008-09.
Service Delivery 2009-10 Human Services 105

(c) Lower 2008-09 Expected Outcome due to the implementation of new initiatives experiencing workforce recruitment issues and delays in new program establishment. 2009-10 Target changes include the impact of additional funding approved in the 2008-09 Budget.
(d) The 2009-10 Target includes additional funding for the Victorian Bushfire Case Management Service, Council of Australian Governments Closing the Gap in Indigenous Health, indexation and enterprise bargaining agreement outcomes.
(e) 2008-09 Expected Outcome reflects additional funding for Victorian Bushfire Case Management Service, Bushfire Recovery Resources, Drought Counselling, Cranbourne Landfill Incident Community Support Plan, National Diabetes and Syringe Support Program and transfers to Dental Health.
(f) 2009-10 Target increase reflects the impact of the 2009-10 additional funding for ‘Improving Access to Dental Care’.
(g) 2008-09 Expected Outcome reflects improved performance.(h) 2008-09 Expected Outcome reflects the strategic targeting of agencies with long wait times which has
lowered dental waiting times significantly. (i) 2009-10 Target includes additional funding for Improving Access to Dental Care, indexation and
enterprise bargaining agreement outcomes.(j) 2008-09 Expected Outcome reflects transfer of funds from Primary Health for Dental Chairs and
depreciation adjustments.
106 Human Services Service Delivery 2009-10

Small Rural ServicesSmall Rural Services includes a range of health and aged care services delivered in small rural towns. The funding and service delivery approach focuses on achieving a sustainable, flexible service mix that is responsive to local needs. Service providers include small rural hospitals, community health services, bush nursing centres, multi-purpose services and public sector residential aged care services. These outputs contribute to the key government outcomes of:
high quality, accessible health and community services;
a fairer society that reduces disadvantage and respects diversity; and
building friendly, confident and safe communities.
Major Outputs/DeliverablesPerformance Measures
Unit of Measure
2009-10 Target
2008-09 Expected Outcome
2008-09 Target
2007-08 Actual
Small Rural Services – Acute Health(a)
Admitted and non-admitted services delivered by small rural services, including elective and non-elective surgical and medical care, accident and emergency services, and maternity services.
Quantity Standard Equivalent Value Units(b) number
(‘000)1 318 1 188 1 300 1 233
Weighted Inlier Equivalent Separations (WIES)(b)
number (‘000)
28.5 26.1 28.5 27.3
Separations number (‘000)
43.7 41.9 43.7 43.2
Quality Beds accredited per cent 100 100 100 100
Cost Total output cost $ million 261.3(c) 249.9(d) 252.4 238.1
Small Rural Services – Aged Care(a)
In-home, community-based and residential care services for older people, delivered in small rural towns.
Quantity Bed days in high care places(e) number 399 000 394 000 394 000 388 684Bed days in low care places(e) number 317 000 313 000 313 000 307 494Standard Equivalent Value Units(f) number 222 000 218 400 218 400 213 474
Quality Residential care services certified and accredited
per cent 100 100 100 100
Cost Total output cost $ million 147.1(g) 144.7(h) 149.2 150.8
Service Delivery 2009-10 Human Services 107

Major Outputs/DeliverablesPerformance Measures
Unit of Measure
2009-10 Target
2008-09 Expected Outcome
2008-09 Target
2007-08 Actual
Small Rural Services – Home and Community Care Services(a)
In-home, community-based care services for older people, and younger people with disabilities delivered by small rural services.
Quantity Home and Community Care (HACC) service delivery hours(b)
number 737 000 740 000 740 000 720 029
Standard Equivalent Value Units(i) number 326 000 325 000 325 000 315 477Cost
Total output cost $ million 27.9(j) 28.7(k) 26.3 26.3
Small Rural Services – Primary Health(a)
In-home, community-based community and primary health services delivered by small rural services and designed to promote health and wellbeing and prevent the onset of more serious illness.
Quantity Service delivery hours in community health care
number 100 700 98 180 100 700 93 596
Standard Equivalent Value Units(b) number 106 260 105 850 107 500 125 263Cost
Total output cost $ million 16.3(l) 16.4(l) 15.0 15.9
Source: Department of Human Services.
Notes:(a) Substitution of acute, aged and home care, primary health and other services is encouraged under
the small Rural Health Services funding and accountability approach in order to meet local needs. Therefore the quantity of services delivered per output may vary from target.
(b) 2008-09 Expected Outcome and 2009-10 Target reflect service substitution.(c) The 2009-10 Target includes indexation and enterprise bargaining agreement outcomes and a
reduction in Commonwealth and third party revenue.(d) 2008-09 Expected Outcome reflects a reduction in Commonwealth and third party revenue, transfers
to Acute Health and an increase in enterprise bargaining agreement outcomes.(e) 2009-10 Target increase reflects changes in bed numbers and changes in counting methodology.(f) 2009-10 Target increase reflects the change in the bed day targets and a changed target calculation
methodology.(g)2009-10 Target includes enterprise bargaining agreement outcomes, transfers from ‘Aged and Home
Care’ and a reduction in Commonwealth and third party revenue.(h) 2008-09 Expected Outcome reflects a reduction in Commonwealth and third party revenue, transfers
from ‘Aged and Home Care’ and an increase in enterprise bargaining agreement outcomes.(i) 2009-10 Target increase reflects additional Commonwealth/State matched funding for HACC.(j)2009-10 Target includes an increase in Commonwealth and third party revenue, enterprise bargaining
agreement outcomes and transfers from ‘Aged and Home Care’.(k) 2008-09 Expected Outcome reflects an increase in Commonwealth and third party revenue,
enterprise bargaining agreement outcomes and transfers from ‘Aged and Home Care’.(l) 2009-10 Target includes enterprise bargaining agreement outcomes and transfers from Primary
Health and Drugs.
108 Human Services Service Delivery 2009-10
Public HealthPublic Health outputs, through the provision of leadership, services and support which promote and protect the health and wellbeing of all Victorians in partnership with key stakeholders and communities, make a significant contribution to the key government outcomes of:
high quality, accessible health and community services;
a fairer society that reduces disadvantage and respects diversity; and
building friendly, confident and safe communities.
Service Delivery 2009-10 Human Services 109
Major Outputs/DeliverablesPerformance Measures
Unit of Measure
2009-10 Target
2008-09 Expected Outcome
2008-09 Target
2007-08 Actual
Health ProtectionProtects the health of Victorians through a range of prevention programs including regulation, surveillance and the provision of statutory services.
Quantity Calls to food safety hotlines number 5 000 5 000 5 000 4 357Environmental health inspections undertaken and occasions of technical advice
number 4 600 4 600 4 600 5 100
Screens for preventable illness(a) number 1 049 000 1 029 000 1 040 000 1 032 526Quality
Calls to food safety hotlines that are answered
per cent 92 95 92 98
Immunisation coverage: At two years of age
per cent 90 90 90 94
Immunisation coverage: At school entry
per cent 90 90 90 91
Immunisation coverage: At 65+ years of age (influenza)
per cent 80 80 80 81
Immunisation coverage: adolescent (Year 10) students fully immunised for DTPa (diphtheria, tetanus and pertussis)
per cent 80 80 80 78
Public Health emergency response calls dealt with within designated plans and procedure timelines
per cent 100 100 100 100
Timeliness Average time taken from notification of a food complaint to commencement of appropriate action
hours 24 24 24 24
Infectious disease outbreaks responded to within 24 hours
per cent 100 100 100 100
Target population screened within specified timeframe for breast cancer(b)
per cent 56 55 60 59
Target population screened within specified timeframe for cervical cancer(c)
per cent 63 63 65 63
Cost Total output cost $ million 183.3(d) 233.3(e) 203.0 273.1
110 Human Services Service Delivery 2009-10

Major Outputs/DeliverablesPerformance Measures
Unit of Measure
2009-10 Target
2008-09 Expected Outcome
2008-09 Target
2007-08 Actual
Health AdvancementImproves the general health and wellbeing of Victorians through a range of health promotion programs including the provision of community information and the fostering of healthy behaviours.
Quantity Persons completing the Life! Taking Action on Diabetes course(f)
number 8 500 2 500 6 250 nm
Primary schools in Victoria signed up as members of Kids – Go for your life!(g)
per cent 70 55 55 42
Workplaces and pubs and clubs complying with smoke-free environment laws(h)
per cent 99 99 95 99
Quality Local Government Authorities with Municipal Public Health Plans(i)
per cent 85 80 80 84
Cost Total output cost $ million 68.9(j) 64.1 64.1 58.9
Public Health Development, Research and SupportDevelops and advocates for research and development activities, which support evidence based public health policies.
Quantity Funded public health projects for which satisfactory reports have been received
per cent 90 90 90 93
Department of Human Services funded public health training positions(k)
number 9 9 10 10
Number of people trained in emergency response
number 2 000 2 000 2 000 2 237
Quality Graduating public health trainees achieving Master of Health Science (La Trobe University) qualification
per cent 100 100 100 100
Cost Total output cost $ million 13.4(l) 13.5(m) 13.6 15.2
Source: Department of Human Services
Notes:(a) 2008-09 Expected Outcome and 2009-10 Target reflect the transfer of responsibilities for
Thalassemia tests and other Screens to ‘Acute Health Services’. The target for 2009-10 also takes into account increased breast cancer screening throughput.
Service Delivery 2009-10 Human Services 111

(b) 2008-09 Expected Outcome reflects the higher demand for breast screening services and ongoing workforce pressures. 2009-10 Target has been revised to align with the current national average.
(c) 2009-10 Target adjusted to reflect change in calculation method by the Victorian Cervical Cytology Registry.
(d) 2009-10 Target includes a reduction of fixed term vaccine funding, additional funding for Indigenous Early Childhood Development, Public Health Governance and Regulatory Reform, Victoria's Cancer Action Plan, indexation and enterprise bargaining agreement outcomes.
(e) 2008-09 Expected Outcome reflects additional funding for human papillomavirus, childhood pneumococcal and other vaccines, transfer of funding from Public Health Development, Research and Support and transfer of Genetics Program to Acute Health.
(f) 2008-09 Expected Outcome and 2009-10 Target reflect changes made following a policy proposal by Diabetes Australia to implement the program statewide over four years to enable building of capacity and infrastructure. This improved approach has resulted in a delay in commencement of the courses.
(g) 2009-10 Target reflects the participation of additional schools signing up for the ‘Go for your Life’ program following the successful establishment of the program in 2007-08.
(h) 2009-10 Target increase reflects high compliance rate due to the success of the community education and communication programs and acceptance of the reforms.
(i) 2009-10 Target increase is due to additional funding from the Commonwealth for chronic disease prevention.
(j) 2009-10 Target includes additional funding for chronic disease prevention, indexation and carryover from 2008-09.
(k) 2008-09 Expected Outcome and 2009-10 Target reflects individual trainees’ decision to exit training.(l) The 2009-10 Target reflects additional funding for the Victorian Innovation Strategy – Streamlining
Ethical Review of multi-site Clinical Trials, cessation of Reducing the Regulatory Burden of Food Regulation, indexation and transfers to Primary Health.
(m) 2008-09 Expected Outcome reflects additional funding for the Victorian Innovation Strategy – Streamlining Ethical Review of Multi Site Clinical Trials, transfers to Health Protection and transfers to Primary Health.
112 Human Services Service Delivery 2009-10

Drug ServicesDrug Services outputs, through the provision of programs to promote and protect the health and wellbeing of all Victorians by reducing death, disease and social harm caused by the use and misuse of licit and illicit drugs, make a significant contribution to the key government outcomes of:
high quality, accessible health and community services;
a fairer society that reduces disadvantage and respects diversity; and
building friendly, confident and safe communities.
Major Outputs/DeliverablesPerformance Measures
Unit of Measure
2009-10 Target
2008-09 Expected Outcome
2008-09 Target
2007-08 Actual
Drug Prevention and ControlEncourages all Victorians to minimise the harmful effects of illicit and licit drugs, including alcohol, by providing a comprehensive range of strategies, which focus on enhanced community and professional education, targeted prevention and early intervention, and the use of effective regulation.
Quantity Contacts through Family Drug Help
number 5 000 5 000 5 000 6 229
GPs trained to prescribe pharmacotherapy(a)
number 70 50 70 40
Licences and permits for supply or use of drugs and poisons(b)
number 1 275 1 260 1 245 1 285
Needles and syringes provided through the Needle and Syringe Program
number (‘000)
7 200 7 200 7 200 7 348
Participants in peer education programs for injecting drug users
number 250 250 250 250
Quality Pharmacotherapy permits processed within designated timeframe
per cent 100 100 100 100
Cost Total output cost $ million 24.1 26.5(c) 22.5 21.6
Drug Treatment and RehabilitationAssists the community and individuals to control and reduce the harmful effects of illicit and licit drugs, including alcohol, in Victoria through the provision of residential and community-based services, which include withdrawal services, rehabilitation, supported accommodation, education and training, counselling and support.
Quantity Clients on the pharmacotherapy program(d)
number 11 800 11 800 11 200 11 590
Commenced courses of treatment: community-based drug treatment services
number 33 420 33 420 33 420 33 764
Service Delivery 2009-10 Human Services 113
Major Outputs/DeliverablesPerformance Measures
Unit of Measure
2009-10 Target
2008-09 Expected Outcome
2008-09 Target
2007-08 Actual
Commenced courses of treatment: residential-based drug treatment services
number 6 062 6 062 6 062 6 359
Quality Alcohol and drug workers accredited
per cent 85 85 85 64
Drug treatment services accredited per cent 100 100 100 99Evaluation, research and development projects satisfactorily completed
per cent 100 100 100 100
Successful courses of treatment (episodes of care): community-based drug treatment services
number 31 085 31 085 31 085 29 656
Successful courses of treatment (episodes of care): residential-based drug treatment services
number 5 636 5 636 5 636 5 672
Timeliness Average working days between screening of client and commencement of residential-based drug treatment(e)
days 6 6.9 6 6.9
Average working days between screening of client and commencement of community-based drug treatment(f)
days 3 2 3 2
Cost Total output cost $ million 103.4 102.3 101.4 99.7
Source: Department of Human Services
Notes:(a) 2008-09 Expected Outcome reflects difficulties in recruiting GPs to the training. A new marketing
and recruitment program is now underway but commenced later than initially anticipated.(b) 2008-09 Expected Outcome reflects above target performance due to increased demand. This trend is
expected to be repeated in 2009-10.(c) 2008-09 Expected Outcome includes funding provided under the ‘Victorian Alcohol Action Plan’,
and increased Commonwealth funding for drug diversion.(d) 2008-09 Expected Outcome reflects an increase in numbers of pharmacotherapy providers and
dispensers resulting in increased access to pharmacotherapy.(e) The 2008-09 Expected Outcome reflects increased demand for residential-based services.(f) 2008-09 Expected Outcome is a positive result and reflects improvements in waiting times.
114 Human Services Service Delivery 2009-10
Disability ServicesDisability Services outputs, through the provision of continuing care and support services for people with disabilities, their carers and their families, make a significant contribution to the key government outcomes of:
high quality, accessible health and community services;
a fairer society that reduces disadvantage and respects diversity; and
building friendly, confident and safe communities.
Major Outputs/DeliverablesPerformance Measures
Unit of Measure
2009-10 Target
2008-09 Expected Outcome
2008-09 Target
2007-08 Actual
Information, Planning and Capacity BuildingInformation, assistance with planning access to services and coordination of services to maximise independence and participation of people with disabilities.
Quantity Clients receiving case management services
number 5 300 5 300 5 300 5 280
Quality Outlets reporting a minimum of two planned quality improvement activities in the forthcoming year
per cent 90 90 90 93
Timeliness Average case management waiting time
days 50 50 50 45
Cost Total output cost $ million 94.2(a) 88.6 88.3 84.4
Targeted ServicesPrograms and services aimed at maintaining and increasing the functional independence of people with disabilities, including support with intervention services for people with complex and challenging behaviours.
Quantity Clients accessing aids and equipment(b)
number 28 820 28 820 28 310 28 139
Clients receiving specialist services
number 2 420 2 420 2 420 2 392
Quality Clients satisfied with the aids and equipment services system
per cent 85 85 85 88
Timeliness Clients either in receipt of equipment or sent written acknowledgment of aids and equipment applications within ten working days
per cent 90 90 90 96
Service Delivery 2009-10 Human Services 115
Major Outputs/DeliverablesPerformance Measures
Unit of Measure
2009-10 Target
2008-09 Expected Outcome
2008-09 Target
2007-08 Actual
Clients waiting less than one month for specialist services
per cent 60 60 60 62
Cost Total output cost $ million 76.9 84.7(a)(c) 73.6 77.1
Individual SupportIndividually tailored packages and supports enabling people with a disability, and families and carers of people with a disability, to access support based on choice.
Quantity Clients receiving individual support(b)
number 14 373 13 980 13 810 8 342
Clients with day activities number 8 100 8 100 8 100 8 329Episodes of respite provided(b) number 21 790 21 680 21 130 20 614Support plans completed number 4 500 4 500 4 500 4 500
Quality Carer households satisfied with quality of respite service provided
per cent 80 80 80 82
Outlets reporting a minimum of two planned quality improvement activities in the forthcoming year
per cent 90 90 90 92
Support plans reviewed at least once during each period of three years commencing from when the support plan was first prepared
per cent 100 100 100 100
Timeliness Support plans prepared within 60 days of the person commencing to regularly access the disability services
per cent 100 100 100 100
Cost Total output cost $ million 532.9(a) 483.1(a) 465.3 403.6
Residential Accommodation SupportAccommodation support services provided to groups of clients in community-based settings and centre-based residential institutions.
Quantity Clients in shared supported accommodation
number 5 010 5 000 4 880 5 006
Clients in residential institutions number 190 190 190 186Support plans completed number 1 500 1 500 1 500 1 500
116 Human Services Service Delivery 2009-10

Major Outputs/DeliverablesPerformance Measures
Unit of Measure
2009-10 Target
2008-09 Expected Outcome
2008-09 Target
2007-08 Actual
Quality Outlets reporting a minimum of two planned quality improvement activities in the forthcoming year
per cent 90 90 90 91
Support plans reviewed at least once during each period of three years commencing from when the support plan was first prepared
per cent 100 100 100 100
Support plans reviewed every twelve months for persons residing in residential institutions
per cent 100 100 100 100
Timeliness Support plans prepared within 60 days of the person commencing to regularly access the disability services
per cent 100 100 100 100
Cost Total output cost $ million 584.0(a) 572.3(a) 548.3 597.2
Source: Department of Human Services
Notes:(a) The 2009-10 Target and 2008-09 Expected Outcome reflects additional Commonwealth funding and
enterprise bargaining agreement outcomes.(b) 2009-10 Target reflects additional Commonwealth funding provided through the Disability
Assistance Package.(c) The 2008-09 Expected Outcome reflects additional one-off investment in the aids and equipment
program, and for individuals with multiple and complex needs.
Service Delivery 2009-10 Human Services 117

Child Protection and Family ServicesChild Protection and Family Services outputs, through the funding of statutory child protection services, family support and parenting services, adoption and placement care services and specialist support services to ensure the safety and wellbeing of adolescents and children at risk of harm, abuse and neglect, make a significant contribution to the key government outcomes of:
high quality, accessible health and community services;
a fairer society that reduces disadvantage and respects diversity; and
building friendly, confident and safe communities.
Major Outputs/DeliverablesPerformance Measures
Unit of Measure
2009-10 Target
2008-09 Expected Outcome
2008-09 Target
2007-08 Actual
Statutory Child Protection ServicesChild protection services to ensure the safety and wellbeing of children and young people at risk of harm, abuse and neglect.
Quantity Child Protection reports(a) number 44 750 43 150 41 600 40 940
Quality Children and young people who were the subject of an investigation which led to a decision not to substantiate, who were subsequently the subject of a substantiation within three months of case closure
per cent 5 5 5 5
Protective cases re-substantiated within 12 months of case closure
per cent 17.5 17.5 17.5 15.2
Timeliness Percentage of Child Protection reports requiring an immediate response visited within two days
per cent 97 97 97 97
Cost Total output cost $ million 137.9(b) 139.4 na(c) na(c)
Specialist Support and Placement Services(d)
Specialist Support and Placement services to ensure the safety and wellbeing of children and young people who require support to remain with their family or are placed in out of home care.
Quantity Daily average number of placements(e)
number 6 000 5 700 5 400 5 517
Number of children receiving an intensive support service(f)
number 900 nm nm nm
Number of clients receiving funding to support placement stability(g)
number 1 000 nm nm nm
118 Human Services Service Delivery 2009-10

Major Outputs/DeliverablesPerformance Measures
Unit of Measure
2009-10 Target
2008-09 Expected Outcome
2008-09 Target
2007-08 Actual
Quality Children and young people in out of home care who have had three or more placements in the last 12 months (not including placements at home)
per cent 14 14 14 11
Percentage of community service organisations who have successfully completed a scheduled external review against the registration standards under the Children, Youth and Families Act (2005)(h)
per cent 95 nm nm nm
Proportion of placements that are home-based care
per cent 90 90 90 92
Cost Total output cost $ million 302.7(i) 278.9 na(c) na(c)
Family and Community ServicesA range of early intervention and support services for families and individuals: family support services, parenting services, family violence support services and sexual assault support services.
Quantity Number of referrals to Child FIRST(j)
number 6 000 nm nm nm
Number of family services cases provided to Aboriginal families(k)
number 1 800 nm nm nm
Total number of family services cases provided(l)
number 23 150 24 600 23 150 26 211
Timeliness Sexual assault support services clients receiving an initial response within five working days of referral(m)
per cent 90 90 80 95
Cost Total output cost $ million 142.4(n) 135.6 na(c) na(c)
Source: Department of Human Services
Notes:(a) 2009-10 Target reflects an increase and a wider range of report numbers since the introduction of
the Children Youth and Families Act 2007. The increase in the population of children in Victoria is also factored into the higher target. Reports are the number of child protection reports received. Substantiations are the number of allegations investigated and subsequently substantiated.
(b) 2009-10 Target reflects the cessation of fixed term funds provided in 2008-09.(c) Comparative output cost not available due to amended output structure in 2009-10.
Service Delivery 2009-10 Human Services 119
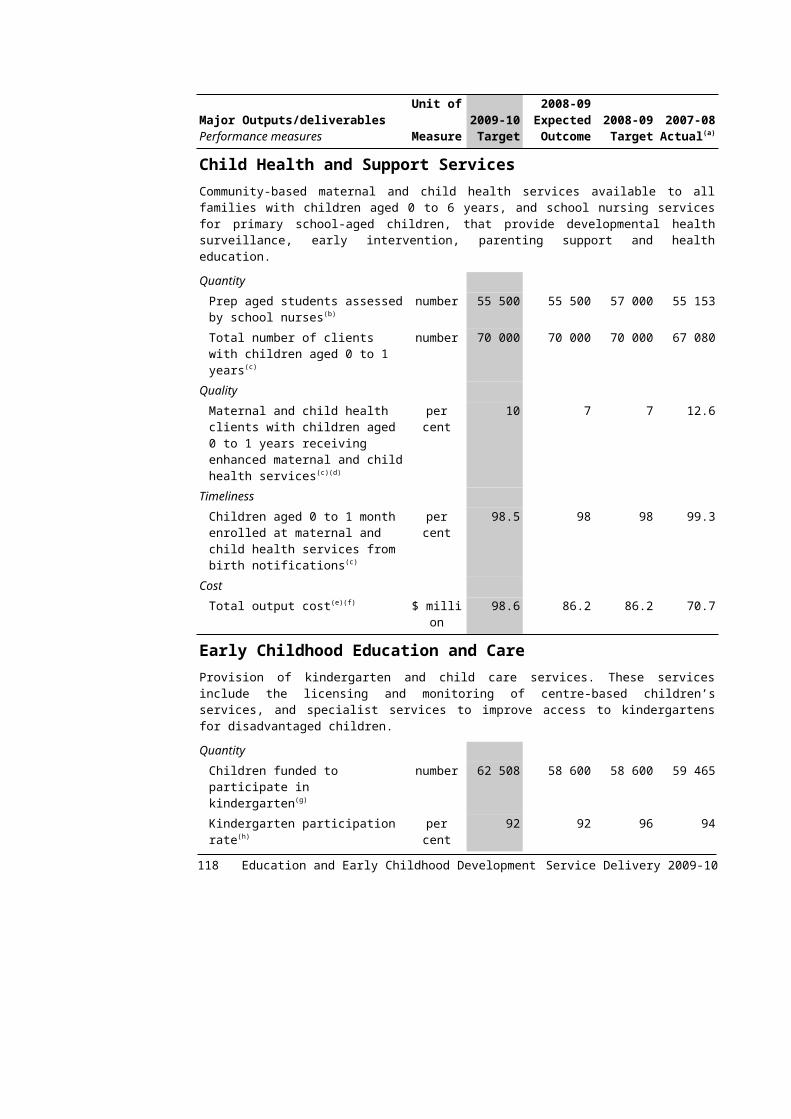
Notes (continued):(d) This output has merged ‘Placement and Support Services’ and ‘Child Protection Specialist services’.
The new output is ‘Specialist Support and Placement Services’. This is in line with the more integrated model of placement and specialist services that is being provided.
(e) 2008-09 Expected Outcome reflects increased demand as children are staying in out of home care for longer periods of time. The 2009-10 Target has been increased by 600 to reflect additional funding.
(f) New measure provides information on the intensive support services that are provided to children in out of home care and better represents the division of activities under the new outputs.
(g) New 2009-10 measure which replaces 'Number of children and young people receiving a stability package' and provides information on funding to improve placement stability for children in out of home care.
(h) New measure: replaces discontinued measure ‘Family and placement services subject to a quality audit and review’. New measure provides information on the number of completed external reviews as a proportion of the scheduled reviews.
(i) The 2009-10 Target reflects additional funding provided by government for out of home care reform.(j) New measure: replaces 'Number of operational ChildFIRST sites' as ChildFIRST is now fully
operational in line with the Children, Youth and Families Act 2005 and 'Number of referrals to ChildFIRST' reflects this operational status. This measure will provide information on the number of referrals to ChildFIRST which is one of the initiatives stemming from the legislative reforms.
(k) New measure: provides information on the number of services provided to support Indigenous families.
(l) This performance measure replaces the 2008-09 performance measure ‘Total number of family services clients’. The 2009-10 performance measure is the same as the 2008-09 measure except that the wording has been changed to reflect the case based nature of services provided and measures the exact same activity as per the 2008-09 performance measure. The 2009-10 Target reflects the trend towards longer case service duration.
(m) 2008-09 Expected Outcome and 2009-10 Target reflects improved performance.(n) The 2009-10 Target reflects additional funding provided by government for the ‘Sexual Assault
Counselling Services for Children’ initiative.
120 Human Services Service Delivery 2009-10
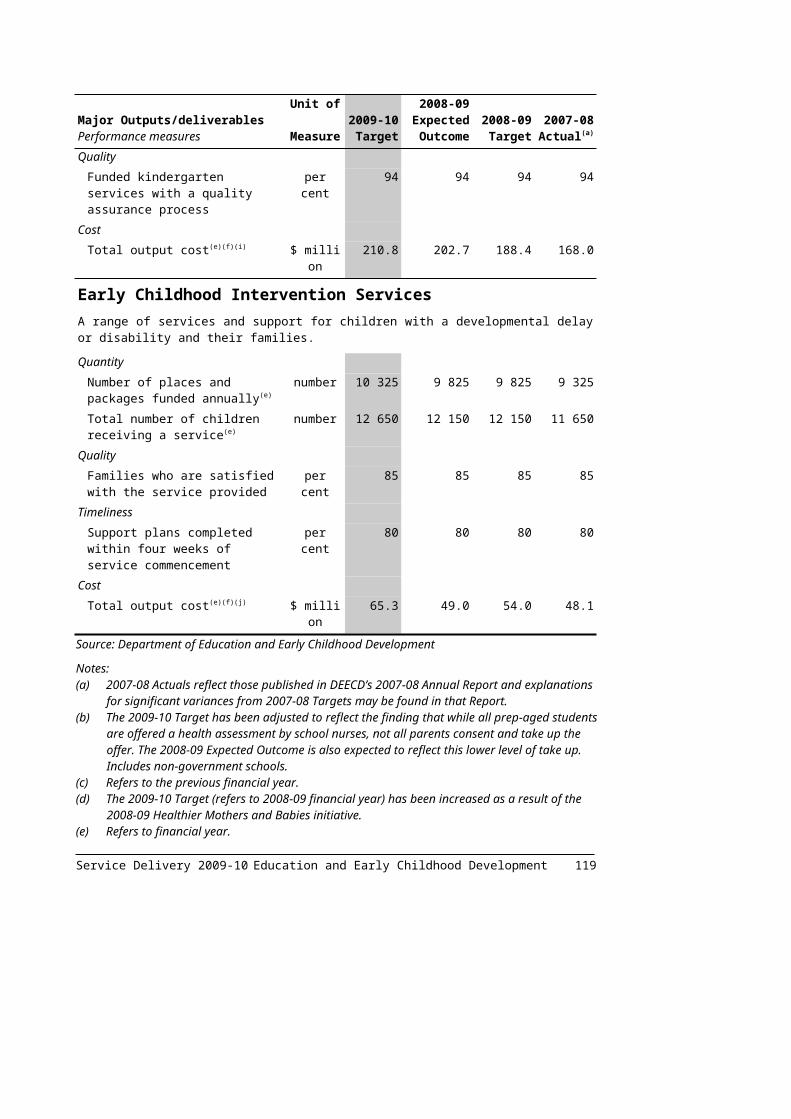
Youth Services and Youth JusticeYouth Services and Youth Justice outputs, through the funding of a range of services including the provision of advice to courts, community based and custodial supervision, and youth services, make a significant contribution to the key government outcomes of:
high quality, accessible health and community services;
a fairer society that reduces disadvantage and respects diversity; and
building friendly, confident and safe communities.
Major Outputs/DeliverablesPerformance Measures
Unit of Measure
2009-10 Target
2008-09 Expected Outcome
2008-09 Target
2007-08 Actual
Youth Justice Custodial ServicesSupervision and rehabilitation, through the provision of case management, health andeducation services and the establishment of structured community supports, to assist youngpeople address offending behaviour, develop non-offending lifestyles and support there-integration of the young person into the community at the completion of their sentence.
Quantity Annual daily average number of young people in custody: males (15 years plus)(a)
number 115-155 116 115-155 140
Annual daily average number of young people in custody: Male (under 15 years) and female(a)
number 15-25 14 15-25 18
Average Daily Custodial Centre utilisation rate: males (15 years plus)(a)
per cent 65-85 63 65-85 76
Average Daily Custodial Centre utilisation rate: males (under 15 years) and female(a)
per cent 40-65 35 40-65 46
Client assessment and plans for custodial clients(b)
number 180 116 180 158
Clients eligible for community re-integration activities(b)
number 220 225 220 260
Quality Clients participating in community re-integration activities(b)
per cent 70 75 70 74
Timeliness Young people on custodial orders who have a client assessment and plan completed within six weeks of the commencement of the order
per cent 95 95 95 65.2
Cost Total output cost $ million 54.1(c) 55.5 54.8 52.2
Service Delivery 2009-10 Human Services 121

Major Outputs/DeliverablesPerformance Measures
Unit of Measure
2009-10 Target
2008-09 Expected Outcome
2008-09 Target
2007-08 Actual
Community Based ServicesProvide community based supervision in order to divert young people from the youth justice system and minimise the likelihood of further offending and provide health care and support services for young people.
Quantity Average Daily Number of Clients under community-based supervision(d)
number 1 200 1 249 1 050 1 112
Client Assessment and Plans for young people on supervised orders(d)
number 900 940 800 891
Proportion of Youth Justice Clients under community-based supervision(e)
per cent 85 91 85 88
Quality Youth Justice clients participating in post release support activities(e)
per cent 95 89 95 77
Timeliness Young people on supervised orders who have a Client Assessment and Plan completed within six weeks of the commencement of the order
per cent 95 97 95 96
Cost Total output cost $ million 50.7 50.3 50.3 49.1
Source: Department of Human Services.
Notes:(a) The 2008-09 Expected Outcome is positive and reflects lower than expected rates of custodial
sentences.(b) 2008-09 Expected Outcome reflects fluctuations in the number of young people on custodial
sentences.(c) 2009-10 Target reflects the cessation of fixed-term funds provided in 2008-09.(d) 2009-10 Target and 2008-09 Expected Outcome reflects court sentencing trends and practices.(e) 2008-09 Expected Outcome reflects improved compliance in reporting this measure.
122 Human Services Service Delivery 2009-10

Concessions to Pensioners and BeneficiariesConcessions to Pensioners and Beneficiaries outputs, through the development and coordination of the delivery of concessions and relief grants to eligible consumers and concession card holders, make a significant contribution to the key government outcome of a fairer society that reduces disadvantage and respects diversity.
Major Outputs/DeliverablesPerformance Measures
Unit of Measure
2009-10 Target
2008-09 Expected Outcome
2008-09 Target
2007-08 Actual
Concessions to Pensioners and Beneficiaries(a)
Provides reductions in the price of energy, water and municipal rates to eligible consumers and concession card holders. Provision of trustee services for low income people or those who are subject to an order by the Victorian Civil and Administrative Tribunal, and other social and community services, including the provision of emergency relief for individuals or families who are experiencing immediate and personal distress due to a financial or domestic crisis.
Quantity Households receiving mains electricity concessions(b)(c)
number 734 000 750 000 763 700 739 734
Households receiving mains gas concessions(c)(d)
number 558 000 571 000 565 900 563 479
Households receiving water and sewerage concessions(d)
number 665 000 662 000 644 500 642 345
Households receiving pensioner concessions for municipal rates and charges(d)
number 439 000 433 000 412 800 425 918
Households receiving non-mains energy concessions(e)
number 17 900 18 600 19 000 19 534
Number of clients receiving trustee services(a)
number 13 100 13 000 13 100 12 600
Quality Compliance with standards(a) per cent 90 90 90 90
Timeliness Responses and ongoing management within agreed product specific service level(a)
per cent 90 90 90 90
Cost Total output cost $ million 348.0(f) 319.0(g) 336.1 300.0
Source: Department of Human Services.
Notes:(a) Two outputs have been merged, ‘Energy, Rates and Municipal Rates Concessions’ and ‘Social and
Community Services’ and the new output is ‘Concessions to Pensioners and Beneficiaries’. The merging of these two outputs reflects the change to more integrated service delivery and response across Concessions.
(b) As the 2008-09 Expected Outcome is lower than the target set of 763 700, the 2009-10 Target has been adjusted to reflect current billing levels of utility companies.
(c) 2009-10 Target reflects impact of introduction of new verification procedures. (d) The 2008-09 Expected Outcome reflects higher uptake of entitlement.
Service Delivery 2009-10 Human Services 123

Notes (continued):(e) 2008-09 Expected Outcome and 2009-10 Target reflects the impact of roll out of mains energy
resulting in fewer households claiming this concession. (f) 2009-10 Target reflects additional funding provided by government for the ‘Improving Water
Affordability for Low-Income Victorians’ initiative.(g) 2008-09 Expected Outcome reflects billing patterns of utility companies in respect of actual
concessions provided to pensioners and beneficiaries during the 2008-09 financial year.
124 Human Services Service Delivery 2009-10
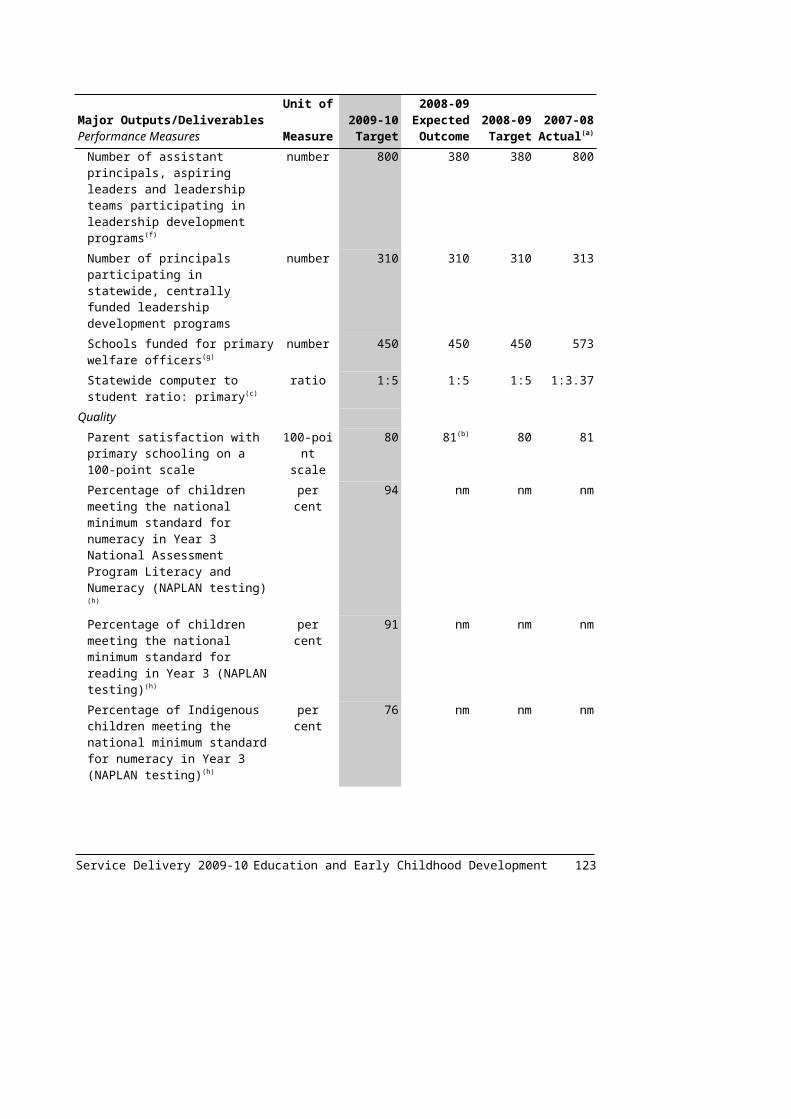
Housing AssistanceHousing Assistance outputs, through the provision of homelessness services, crisis and transitional accommodation and long term adequate, affordable and accessible housing assistance, coordinated with support services where required, home renovation assistance and the management of the home loan portfolio, make a significant contribution to the key government outcomes of:
high quality, accessible health and community services;
a fairer society that reduces disadvantage and respects diversity; and
building friendly, confident and safe communities.
Major Outputs/DeliverablesPerformance Measures
Unit of Measure
2009-10 Target
2008-09 Expected Outcome
2008-09 Target
2007-08 Actual
Homelessness AssistanceHomelessness services to people who are homeless or at risk of homelessness, and who are in crisis. Short-term crisis housing in emergency or crisis situations. Medium-term accommodation, linked to support services.
Quantity Clients assisted with homelessness support(a)
number 38 450 nm nm nm
Housing information or referral assistance (occasions of service)(b)
number 80 000 80 000 91 300 76 712
Households assisted with crisis/transitional housing accommodation (occasions of service)
number 13 000 13 000 13 000 13 000
Households assisted with housing establishment assistance during year(c)
number 36 000 36 000 33 450 38 600
Quality Clients in urgent housing need as a share of all assisted/new households
per cent 100 100 100 100
Timeliness Proportion of homelessness support episodes where an accommodation need was unable to be met(d)
per cent 12 12 17 8.2
Cost Total output cost $ million 161.2(e) 145.1(e) 140.2 130.2
Service Delivery 2009-10 Human Services 125
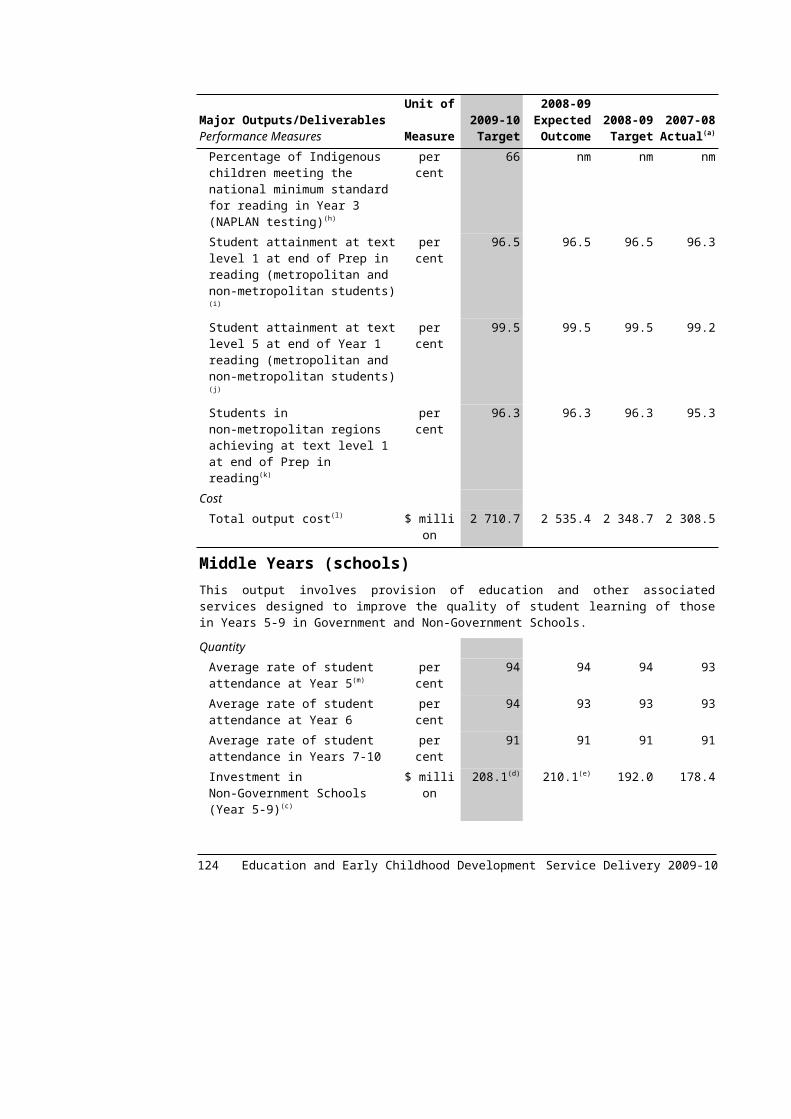
Major Outputs/DeliverablesPerformance Measures
Unit of Measure
2009-10 Target
2008-09 Expected Outcome
2008-09 Target
2007-08 Actual
Long Term Housing AssistanceLong term rental accommodation assistance for low-income families, older persons, singles, youth and other households, coordinated with support services where required. Appropriate and secure housing to meet the social, cultural and economic aspirations of the Victorian Indigenous community, with the assistance of the Aboriginal Housing Victoria.
Quantity Bond loans provided during year(f) number 8 400 8 700 9 300 8 716Number of dwellings with major upgrade during year (includes neighbourhood renewal areas)(g)
number 3 000 2 650 2 150 2 346
Number of households assisted (public, Indigenous and community long term tenancies at end of year)(h)
number 74 656 72 445 72 319 72 015
Properties acquired during year for long term housing (includes leases, and joint ventures and Office of Housing funded community-owned dwellings)(g)
number 3 430 1 110 1 030 1 262
Total long-term, social housing properties (incudes leases, joint ventures and Office of Housing funded community owned dwellings)(h)
number 76 947 74 532 74 556 74 284
Quality Percentage of neighbourhood renewal projects that have achieved active resident participation in governance structures
per cent 100 100 100 100
Timeliness Average waiting time for public rental housing for those clients who have received early housing allocation (those with urgent housing need, under waiting list segments 1, 2 and 3)(i)
months 7 7.1 6 5.9
Cost Total output cost $ million 808.5(j) 325.1(k) 226.8 297.1
126 Human Services Service Delivery 2009-10
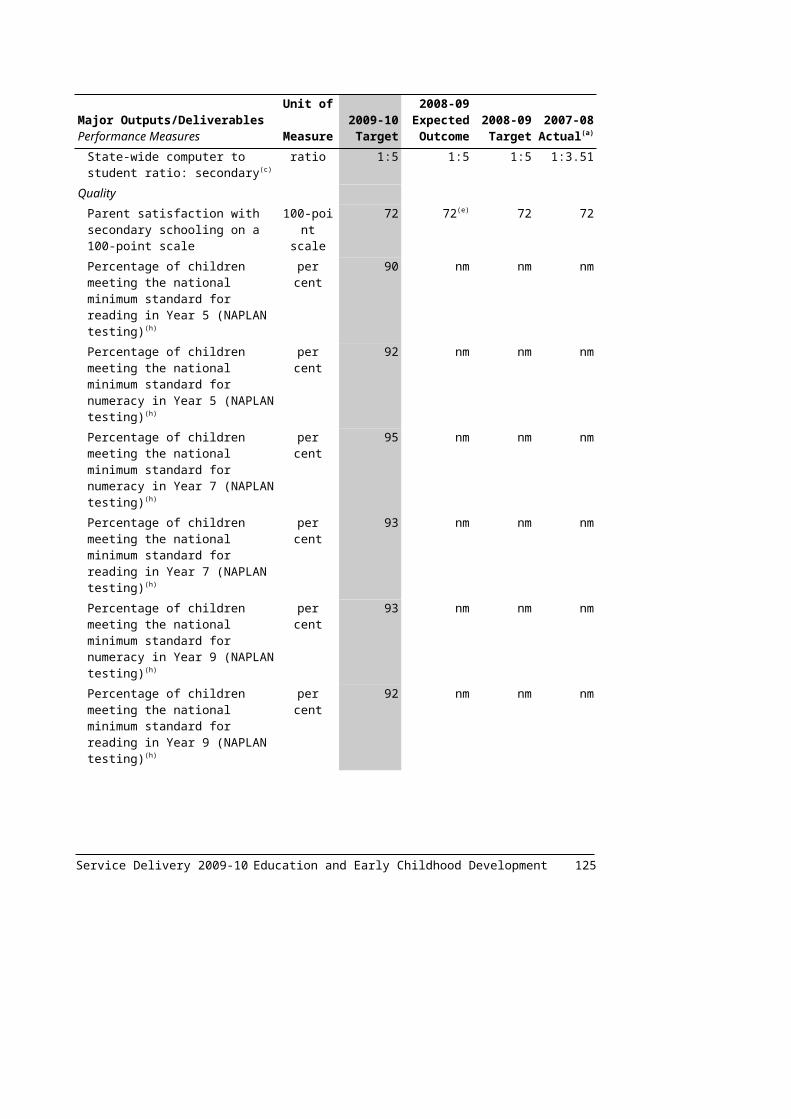
Major Outputs/DeliverablesPerformance Measures
Unit of Measure
2009-10 Target
2008-09 Expected Outcome
2008-09 Target
2007-08 Actual
Home Ownership and Renovation AssistanceLong-term home ownership and shared ownership arrangements provided under various government home loan programs. This output also contains home modification/renovation advice provided to aged or disabled home owners to enable them to remain living independently in their own home in a safe and secure environment. This involves a free home inspection service by a qualified architect and subsidised loan assistance (where required) to assist with the cost of identified works.
Quantity Number of new households assisted (including home renovation inspections as well as loans)
number 4 375 4 375 4 375 4 758
Quality Proportion of assisted households satisfied with renovation assistance
per cent 95 95 95 98
Proportion of new loans to low income or special needs clients (including group self build and home renovation loans and home loan restructures)
per cent 100 100 100 100
Timeliness Loans in arrears by more than 30 days as a proportion of total loans
per cent 5 5 5 2.9
Cost Total output cost(l) $ million na na na na
Source: Department of Human Services.
Notes:(a) New measure which provides information on the total number of clients assisted by funded
homelessness support agencies replaces the 2008-09 performance measure ‘SAAP support episodes (occasions of service)’, which measured support episodes of more than one day.
(b) 2008-09 Expected Outcome and 2009-10 Target reflects the implementation of Opening Doors and the Victorian Homelessness data collection that has resulted in improvements in data quality and standards, leading to more accurate measurement of performance for this indicator.
(c) 2008-09 Expected Outcome and 2009-10 Target reflects additional resources allocated by government to housing establishment by providing additional grants to homelessness agencies, and reporting of activity was improved. In addition, demand for immediate assistance increased during 2007-08, principally driven by the private rental market.
(d) This performance measure replaces the 2008-09 performance measure 'Proportion of SAAP support episodes where an accommodation need was unable to be met'. The 2009-10 performance measure is the same as the 2008-09 measure except for the replacement of the acronym 'SAAP' with the words 'homelessness support', and measures the exact same activity as per the 2008-09 performance measure.
(e) The 2008-09 Expected Outcome and 2009-10 Target reflect an increase in Commonwealth funding for 'A Place To Call Home' initiative. The 2009-10 Target includes additional Commonwealth funding for the Homelessness National Partnership Agreement.
Service Delivery 2009-10 Human Services 127
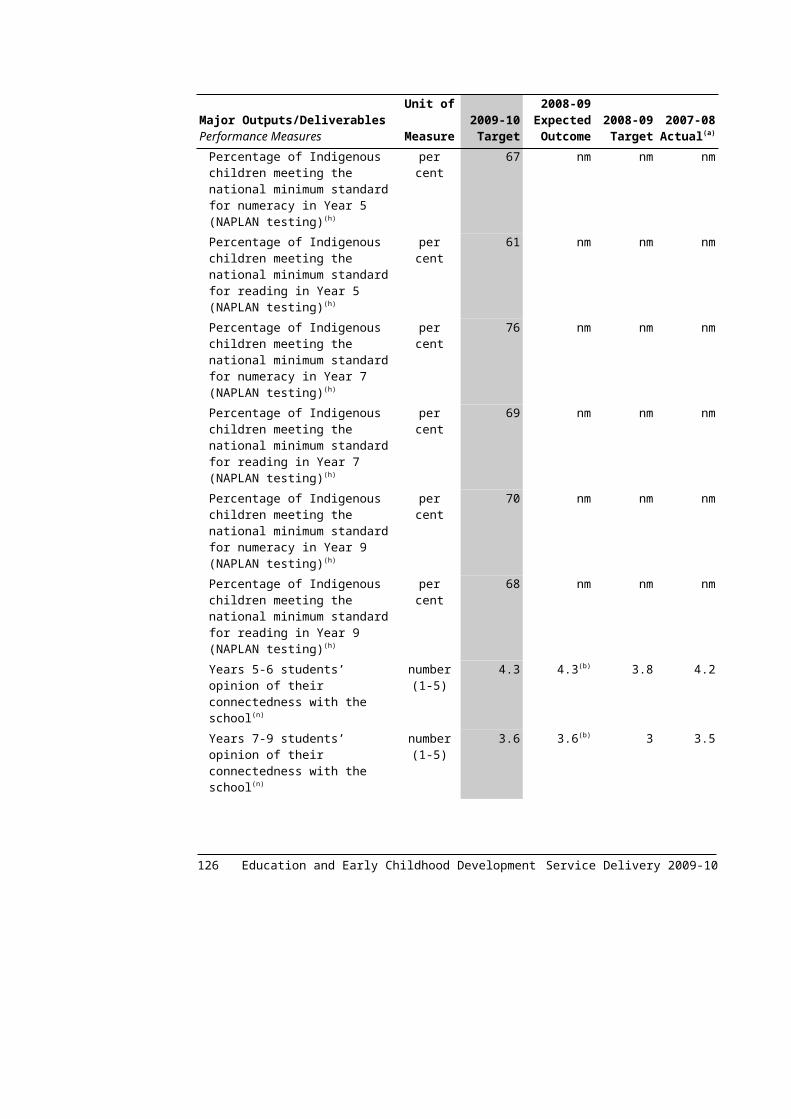
Notes (continued):(f) 2008-09 Expected Outcome and 2009-10 Target reflects low turnover rates in the private rental
market resulting in reduced take up of this program, which is demand driven.(g) 2008-09 Expected Outcome and 2009-10 Target reflects an increase in upgrades following the
allocation of new funding to social housing from the Commonwealth as part of the Nation Building and Jobs Plan National Partnership.
(h) 2009-10 Target reflects funding decisions from the Commonwealth to provide more funding to social housing.
(i) Low vacancy rates in the private rental market have increased demand for public housing. It is also expected the 2009 Victorian bushfires will impact on this measure in both the 2008-09 and 2009-10 financial years, as clients who would have been otherwise housed earlier receive delayed allocations.
(j) The 2009-10 Target reflects an increase in Commonwealth funding for the Nation Building National Partnership for Repairs and Maintenance and New Construction; Remote Indigenous Housing National Partnership Agreement; and Social Housing National Partnership Agreement. Additional funding was also provided in 2009-10 for the 'Building on Success of Neighbourhood Renewal' initiative.
(k) The 2008-09 Expected Outcome reflects an increase in Commonwealth funding in 2008-09 for the Nation Building National Partnership for Repairs and Maintenance and New Construction; Remote Indigenous Housing National Partnership Agreement; and Social Housing National Partnership Agreement. The 2008-09 Expected Outcome also includes one-off additional funding for bushfire recovery resources.
(l) Home Ownership and Renovation Assistance has been funded by the Housing and Community Building division of the Department since 2002-03.
128 Human Services Service Delivery 2009-10

DEPARTMENT OF INNOVATION, INDUSTRY AND REGIONAL DEVELOPMENT
Departmental mission statementThe Department of Innovation, Industry and Regional Development (DIIRD) is the Victorian Government’s lead agency for economic and regional development. The Department develops and implements a diverse range of programs, initiatives and projects designed to attract and facilitate investment, encourage exports and industries, foster skills, stimulate innovation, and promote Victoria nationally and internationally.
Significant challenges facing the Department in the medium termThe global economic slowdown presents a significant challenge for DIIRD. Developing appropriate responses to maximise employment and investment opportunities through the current economic climate is a key imperative for the Department. There still remains however, a number of longer-term economic and environmental challenges that the Department, working with its stakeholders will need to address. These include an ageing workforce, international market and competitive pressures and social and technological change.
Major policy decisions and directionsThe Department works closely with business, other government agencies and the community to deliver key elements of the Growing Victoria Together vision and to achieve the Government’s major economic development goals of increased investment, exports and high quality jobs. The Department has lead responsibility for the implementation of major policy statements including ‘Innovation: Victoria’s Future’ Innovation Statement, ‘Building Our Industries for the Future’ Victorian Industry Manufacturing Statement ‘Securing Jobs For Your Future – Skills for Victoria’ Skills Statement the ‘10 Year Tourism and Events Industry Strategy’, ‘Moving Forward’ Provincial Victoria Statement, and ‘Time to Thrive: Supporting the changing face of Victorian small businesses’ Small Business Statement contributes to the implementation of many other significant policy statements.
Service Delivery 2009-10 Innovation, Industry and Regional Development 129
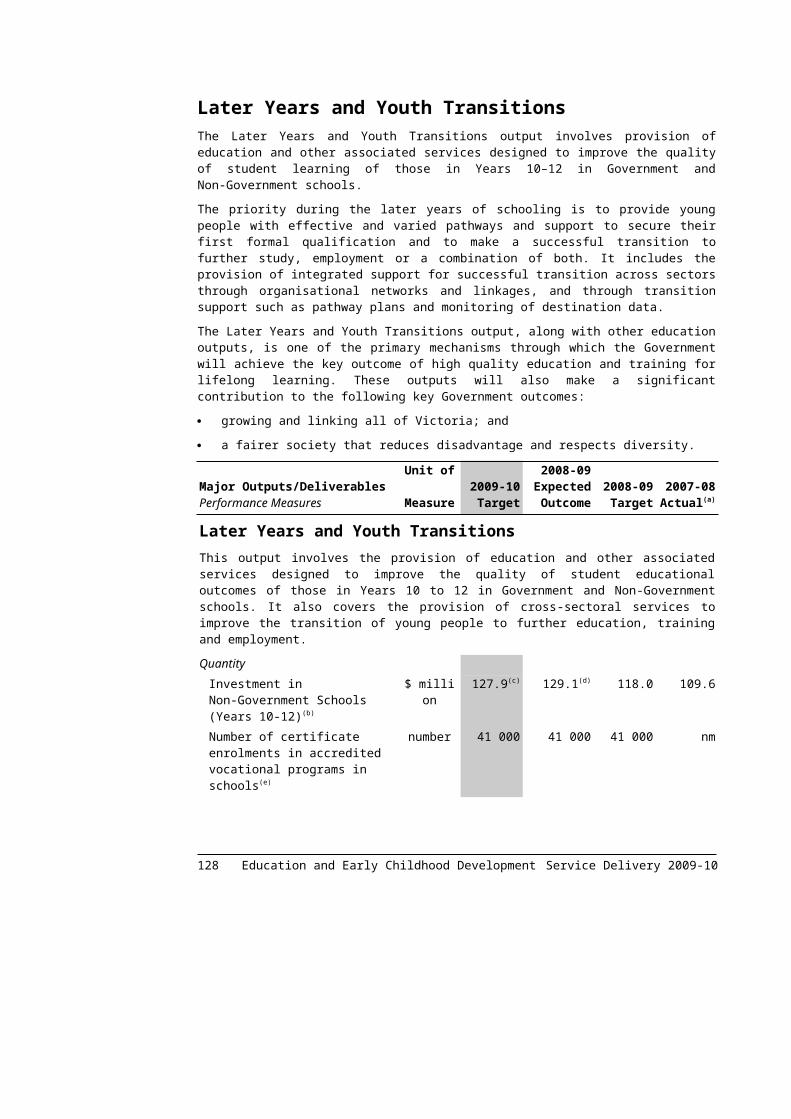
Ministerial portfoliosThe Department supports the ministerial portfolios of Industry and Trade, Information and Communication Technology, Industrial Relations, Regional and Rural Development, Skills and Workforce Participation, Tourism and Major Events, Financial Services, Small Business, Major Projects and Innovation.
Changes to the output structure The Department’s 2009-10 output structure has changed due to machinery of government changes outlined in the table below. 2009-10 Outputs Reason 2008-09 OutputsMajor Projects Machinery of
government Transferred from Department of Transport
On 30 April 2008 new administrative arrangements came into effect through the Administrative Arrangements Order No. 199 of 2008. As part of this, Major Projects Victoria was transferred to the Department of Innovation, Industry and Regional Development. Due to the timing of the change, this machinery of government change was not reflected in the 2008-09 Budget Papers. The transfer of Major Projects has now been incorporated into the output structure.
Discontinued performance measures are detailed in Appendix C of this budget paper.
The following table summarises the total output cost. It has been prepared on the basis of the Department’s 2009-10 output structure and therefore allocations may differ from the Department’s previously published budget.
130 Innovation, Industry and Regional Development Service Delivery 2009-10
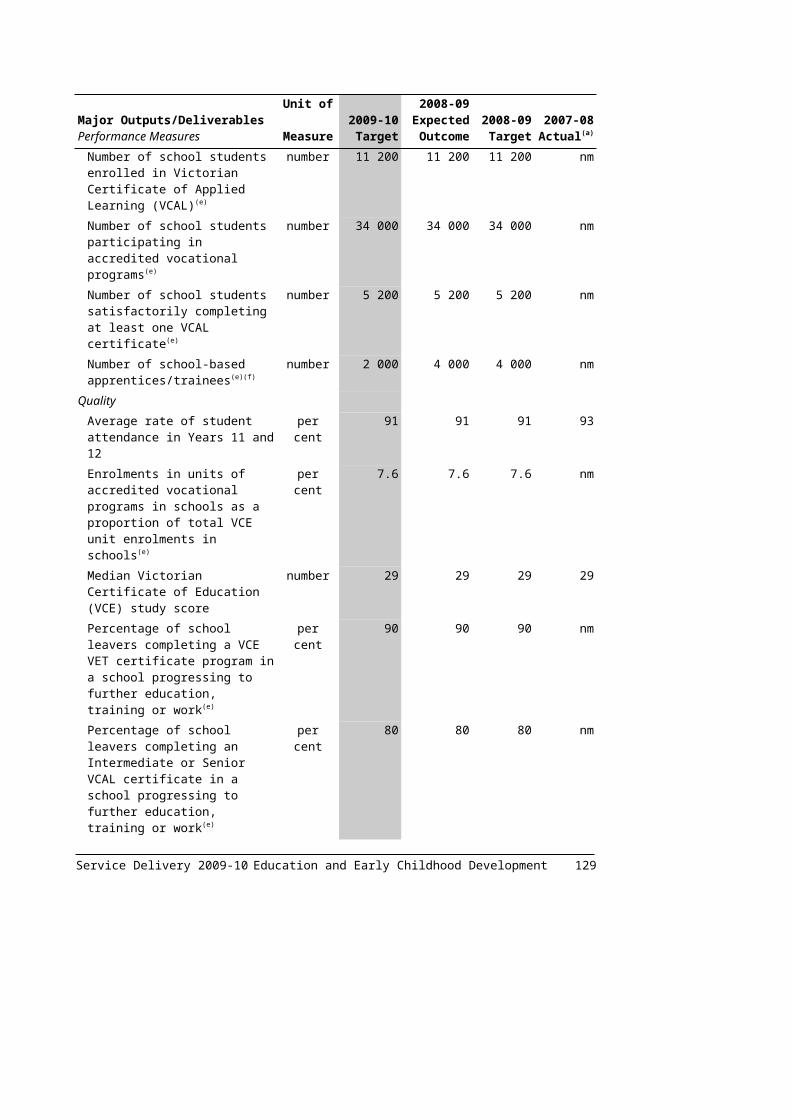
Table 3.3: Output summary ($ million)
2008-09 Budget (a)
2008-09 Revised (a)
2009-10 Budget
Variation (b)
%Industries and Innovation (c) 226.1 214.0 312.4 38.2Investment and Trade (d) 79.4 90.7 90.2 13.6Regional Development (e) 90.1 102.0 154.1 71.0Skills and Workforce (f) 1 690.1 1 830.1 1 864.8 10.3Marketing Victoria (g) 79.4 86.1 75.2 -5.3Major Projects (h) 10.4 25.9 9.3 -10.6Total 2 175.5 2 348.8 2 506.0 15.2Source: Department of Innovation, Industry and Regional Development
Notes:(a) Both the 2008-09 Budget and 2008-09 Revised columns reflect the 2009-10 Output structure,
adjusted on a comparative basis for machinery of government changes and other output structure changes. As such, they incorporate changes made to the Department’s output structure in 2009-10, restated for comparative purposes, and will differ from Budget Paper No. 4, Chapter 3, Departmental Financial Statements.
(b) Variation between 2008-09 Budget and 2009-10 Budget.(c) Variance between the 2008-09 to 2009-10 Target is the difference in the annual funding for the
Victorian Innovation Strategy initiatives, additional funding provided for the ‘Skills for Growth Small Business’ initiatives and additional funding provided for the Industry Transition Fund.
(d) Variance between the 2008-09 Budget and 2009-10 Target is due to additional funding provided for the Building our Industries initiatives, the new Commissioners in Victorian Government Business Offices, the Rail Management Taskforce, as well as the impact of the estimated carryover of funding from 2008-09 to 2009-10.
(e) Variance between the 2008-09 Budget and 2009-10 Target is the difference in the annual funding under the Regional Infrastructure Development Fund, the Provincial Victoria Growth fund and the additional funding for Victorian Transport Plan initiatives, the Industry Transition Fund and the transfer of funding from capital for the Geelong Future Cities Master Plan.
(f) Variance between the 2008-09 Budget and 2009-10 Target reflects additional funding under the Skills Reform Package, Purchased Places, Fee Waivers for Job Seekers, Skills to Transition Program, New Workforce Partnerships and additional fee for service revenue for TAFE.
(g) Variance between the 2008-09 Budget and 2009-10 Target reflects the transfer for major events funding to the Department of Planning and Community Development, which is partly offset by additional funding for Bushfire Recovery.
(h) Variance between the 2008-09 to 2009-10 Target reflects the inclusion of an estimated carryover included in 2008-09 Target.
The following section provides details of the outputs to be provided to Government, including performance measures and costs for each output. Total expenditure for departments can be found in Budget Paper No. 4, Chapter 3, Departmental Financial Statements.
Service Delivery 2009-10 Innovation, Industry and Regional Development 131
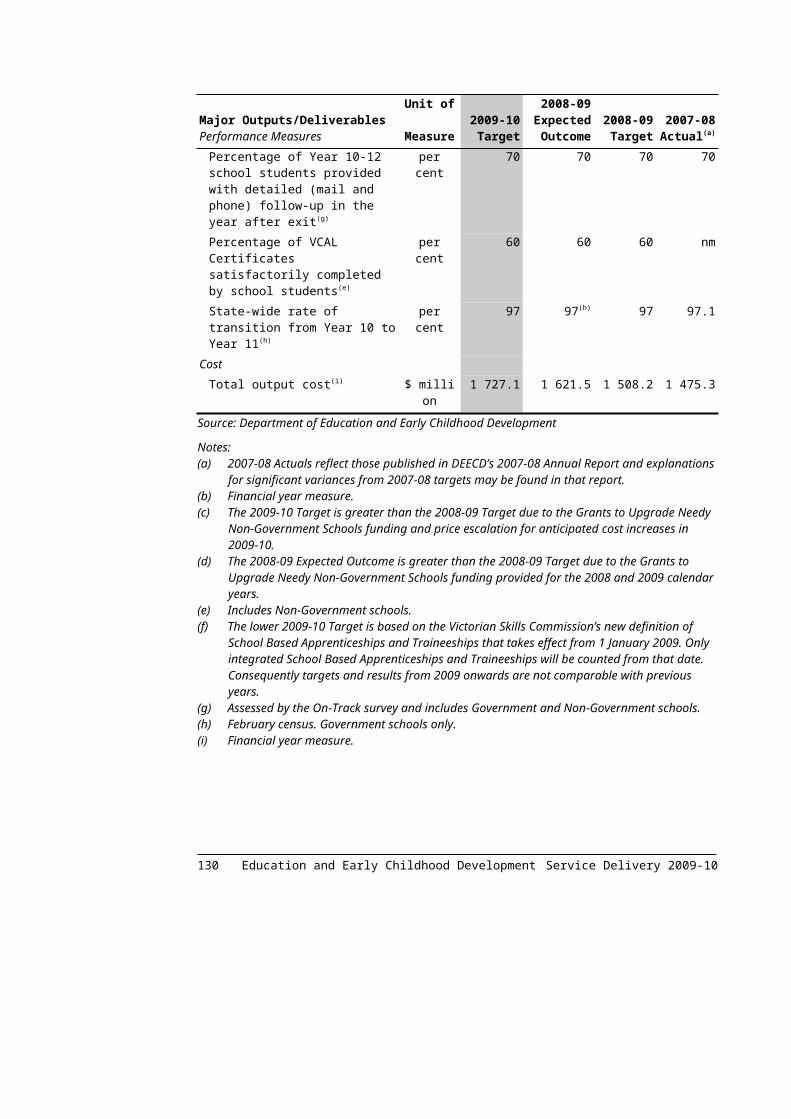
Industries and InnovationIndustries and Innovation outputs drive sustainable and enduring economic growth in industries across Victoria through programs and initiatives that support research, innovation and commercialisation and a thriving small business sector.
These outputs make a significant contribution to the following key government outcomes:
more quality jobs and thriving, innovative industries across Victoria;
growing and linking all of Victoria;
high quality education and training for lifelong learning; and
a fairer society that reduces disadvantage and respects diversity.
Major Outputs/DeliverablesPerformance Measures
Unit of Measure
2009-10 Target
2008-09 Expected Outcome
2008-09 Target
2007-08 Actual
Sector DevelopmentFacilitates the growth and sustainability of Victorian industries through specialised sector engagement.
Quantity Additional employment from production supported by Film Victoria(a)
number of FTE
2 340 2 340 2 340 6 147
Companies assisted in the financial services sector
number 40 40 40 41
Value of film, television and new media production supported by Film Victoria production(a)
$ million 78 78 78 204.9
Quality Percentage of companies that intend to implement new best practice tools and methodologies as a result of participating in the Innovation Insights program(b)
per cent 90 nm nm nm
Cost Total output cost(c) $ million 66.3 39.7 33.1 32.8
Small BusinessProvides business information and advisory and referral services that contribute to the growth and development of small and medium sized enterprises across Victoria.
Quantity Agencies participating in World Class Service initiative(d)
number 200 140 140 120
Business interactions (call, web, in person)(d)
number 260 000 220 000 180 000 200 539
Registration for online services(d) number 60 000 50 000 50 000 28 181
132 Innovation, Industry and Regional Development Service Delivery 2009-10

Major Outputs/DeliverablesPerformance Measures
Unit of Measure
2009-10 Target
2008-09 Expected Outcome
2008-09 Target
2007-08 Actual
Skills for Growth – businesses assisted(e)
number 1 500 nm nm nm
Skills for Growth – training placements(e)
number 15 000 nm nm nm
Quality Client satisfaction of small business information, referral, mentoring service and business programs(f)
per cent 90 90 90 89
Victorian Small Business Commissioner – client satisfaction with mediation service
per cent 80 80 80 81
Victorian Small Business Commissioner – proportion of business disputes successfully mediated by the Commissioner(g)
per cent 75 79 60 81
Cost Total output cost(h) $ million 40.5 28.1 24.1 27.8
InnovationFacilitates and supports innovation through access to information and building capacity to make effective use of new practices and technologies.
Quantity Average monthly number of visits to Victoria Online(i)
number 150 000 nm nm nm
Design Sector Initiative: Business immersions completed(j)
number 6 nm nm nm
Design Sector Initiative: People participating in lectures, seminars and workshops(k)
number 4 000 4 000 2 400 2 418
Information Victoria public contact per contact officer per day
number 41 41 41 38
Quality Customer satisfaction with information services from Information Victoria(l)
per cent 90 nm nm nm
Timeliness Timely provision of public information
per cent 95 95 95 95
Cost Total output cost(m) $ million 20.2 33.1 39.1 80.9
Service Delivery 2009-10 Innovation, Industry and Regional Development 133

Major Outputs/DeliverablesPerformance Measures
Unit of Measure
2009-10 Target
2008-09 Expected Outcome
2008-09 Target
2007-08 Actual
Science and TechnologyFacilitates growth and sustainability of Victoria's science and technology sector through the development and advanced use of new, emerging and transformative technologies.
Quantity Biotechnology projects and programs underway(n)
number 15 13 11 nm
ICT projects and programs underway(o)
number 40 27 27 27
New contracts established for the Technology Commercialisation program(p)
number 4 nm nm nm
Operational Infrastructure Support grants under management
number 13 13 13 nm
Science projects and programs underway(q)
number 7 nm nm nm
Small/medium enterprise (SME) research and development feasibility studies or contracts underway(r)
number 4 nm nm nm
Quality Percentage of funded science projects that are industry led or contain an industry partner as a founding consortium member(q)
per cent 60 nm nm nm
Cost Total output cost(s) $ million 177.4 105.9 124.7 132.0
Strategic PolicyProvides research, analysis and advice on issues of strategic importance to Victoria's economic development as well as ministerial and government services.
Quantity ICT policy reviews underway number 3 3 3 2Number of major research and evaluation projects completed(t)
number 12 12 12 8
Quality Service provision rating(u) per cent 80 80 80 87
Cost Total output cost(v) $ million 8.0 7.2 5.1 6.9
Source: Department of Innovation, Industry and Regional Development
Notes:(a) The 2007-08 Actual reflects the large scale productions of ‘The Pacific’ and ‘Knowing’ commenced
in the second and third quarters of 2007-08.(b) New measure to replace the Companies participating in the Innovation Insights Visits Program.
134 Innovation, Industry and Regional Development Service Delivery 2009-10

Notes (continued):(c) Variance between the 2008-09 to 2009-10 Target reflects additional funding received for the Industry
Transition Fund and estimated carryover of funding.(d) Increase in 2009-10 Target is consistent with phasing and the implementation plan.(e) Part of the Skills Reform package, ‘Skills for Growth’ is a new program administered by Small
Business and Skills Victoria.(f) The 2009-10 performance measure is the same as the 2008-09 measure except for the deletion of the
word 'or', and the inclusion of the words 'and business programs'. The inclusion of these words has no material impact on the meaning or methodology of this measure.
(g) Increase in target reflects the increase in demand for dispute resolution.(h) Variance between the 2008-09 and 2009-10 Target reflects additional funding received under the
Skills for Growth for Small Business initiatives.(i) New performance measure to replace the 2008-09 measure Victoria Online-Increase in usage. The
new measure is consistent with measures relating to websites and is indicative of the services provided.
(j) New, more meaningful measure to replace the ‘Design Sector Initiative: Case studies completed’. (k) Increase in target reflects the increase in demand and consolidation of the discontinued measure
Design Sector Initiative: Lectures, seminars and workshops held.(l) This new performance measure replaces the discontinued measure ‘Develop information resource
products, standards and guidelines in response to identified government requirements’. This improved measure serves to guide continuous improvement of the services provided.
(m) Variance between the 2008-09 and 2009-10 Target reflects the transfer of some ‘ICT Victorian Innovation Strategy’ initiatives to the ‘Science and Technology’ output.
(n) Increase in target reflects the additional programs to be undertaken as a result of the ‘Biotech Bridges initiative under Innovation: Victoria’s Future’.
(o) Increase in target reflects additional projects to be undertaken as a result of the ‘Technology: ICT Capability’ initiative under ‘Innovation: Victoria’s Future’ and integration of the of the discontinued measure Development of whole of government information and service access strategic directions relating to improvements in service performance and greater public participation.
(p) This new performance measure provides information on the Technology Commercialisation program under ‘Innovation: Victoria’s Future’.
(q) This new performance measure provides information on the Victorian Science Agenda (VSA) initiative under ‘Innovation: Victoria’s Future’.
(r) This new performance measure provides information on the Boosting Highly Innovative SME’s initiative under ‘Innovation: Victoria’s Future’.
(s) Variance between the 2008-09 to 2009-10 Target reflects variation in annual funding for the Victorian Innovation Statement initiatives, and the transfer of some ICT initiatives from the Innovation output.
(t) The 2008-09 increase in target reflects the additional evaluation activity that was to be undertaken.(u) The 2007-08 Actual reflects the satisfaction level of policy advice provided to Ministers. (v) Variance between the 2008-09 to 2009-10 Target reflects the establishment of a new division
(Economic Infrastructure).
Service Delivery 2009-10 Innovation, Industry and Regional Development 135
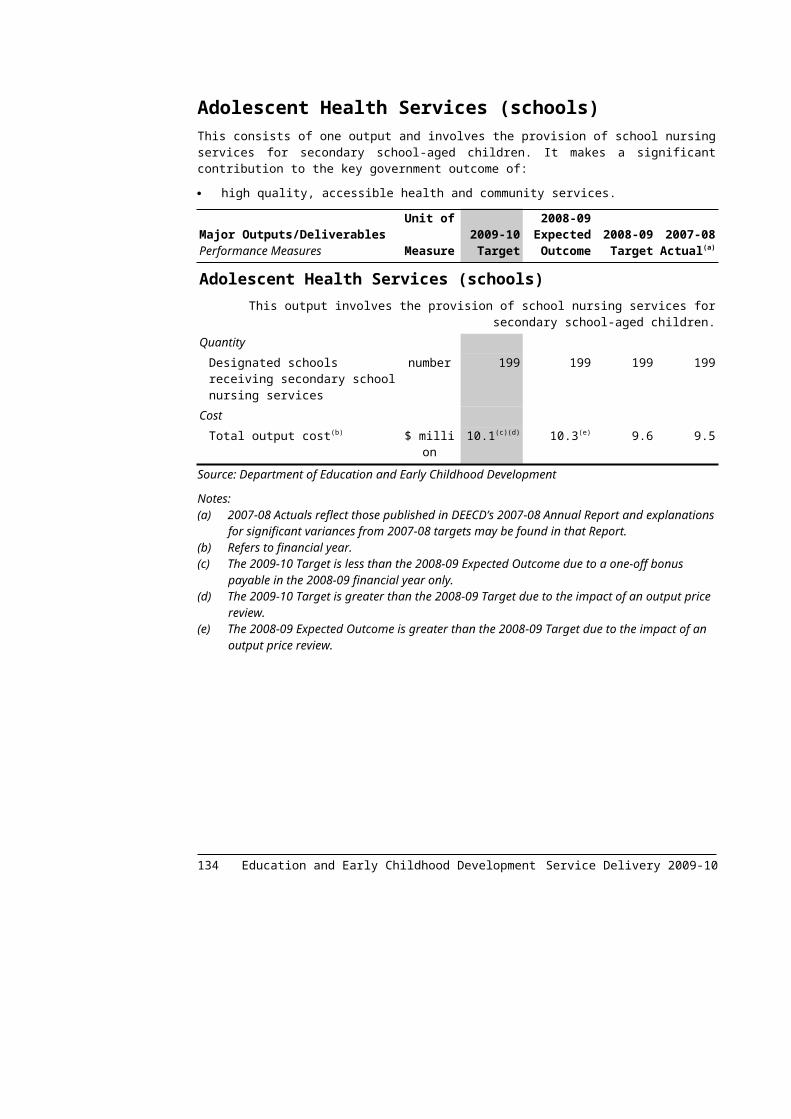
Investment and TradeInvestment and Trade outputs position Victoria as a world class investment location and optimise trade opportunities through investment attraction and facilitation services and export development initiatives and assistance.
These outputs make a significant contribution to the following key government outcomes:
more quality jobs and thriving, innovative industries across Victoria; and
growing and linking all of Victoria.
Major Outputs/DeliverablesPerformance Measures
Unit of Measure
2009-10 Target
2008-09 Expected Outcome
2008-09 Target
2007-08 Actual
Investment Attraction and FacilitationProvides investment and facilitation services to attract new international investment and encourage additional investment by companies already operating in Victoria.
Quantity ICT Investment projects under development
number 25 25 25 26
Investment projects under development(a)
number 250 290 250 270
Jobs derived from investments facilitated(b)
number 5 000 2 800 5 000 8 212
New investments facilitated(c) $ million 1 600 2 500 1 600 3 254New investments facilitated in financial/shared services(d)
number 5 2 5 6
Cost Total output cost(e) $ million 71.8 79.9 67.8 36
ExportsPromotes and facilitates export opportunities for Victorian businesses particularly small and medium sized enterprises.
Quantity Companies provided with export assistance(f)
number 4 050 3 250 3 250 3 481
Exports facilitated and imports replaced(g)
$ million 739 620 739 2150
ICT companies provided with export promotion(h)
number 200 200 200 224
ICT Trade Fairs and Missions supported(i)
number 6 5 6 7
Trade fairs and missions supported
number 29 29 29 38
136 Innovation, Industry and Regional Development Service Delivery 2009-10

Major Outputs/DeliverablesPerformance Measures
Unit of Measure
2009-10 Target
2008-09 Expected Outcome
2008-09 Target
2007-08 Actual
Quality Client satisfaction with export assistance offered
per cent 80 80 80 85
Cost Total output cost(j) $ million 18.4 10.8 11.6 10.3
Source: Department of Innovation, Industry and Regional Development
Notes:(a) The 2008-09 Expected Outcome captures both confirmed and potential projects.(b) The 2008-09 Expected Outcome is due to the effects of the economic downturn. The 2007-08 Actual
reflects long lead times associated with some projects, and the volatility in the investment attraction and facilitation market.
(c) The 2008-09 Expected Outcome is due to the amortisation of certain large investment projects. The 2007-08 Actual reflects long lead times associated with some projects, and the volatility in the investment attraction and facilitation market.
(d) This measure has been transferred from the Sector Development output. The 2008-09 Expected Outcome is due to the Global Financial Crisis and the effects of the economic downturn.
(e) Variance between the 2008-09 to 2009-10 Target reflects additional funding for the new Commissioners in Victorian Government Business Offices, the Rail Management Taskforce and carryover of funding into 2009-10.
(f) The 2009-10 Target has been increased to reflect consolidation of the discontinued performance measure ‘Number of firms participating in individual export specific programs’.
(g) The 2008-09 Expected Outcome is due to the effects of the economic downturn. The 2007-08 Actual encompasses a broader range of export programs that are being undertaken and reflects improved data collection methods.
(h) The 2007-08 Actual reflects the expansion of the Program during the year to meet increased demand.(i) The 2008-09 Expected Outcome is based on target less one planned Information and Communication
Technology (ICT) mission, which was cancelled due to the terrorist attacks in Mumbai, India.(j) Variance between the 2008-09 and 2009-10 Target reflects variation in annual funding for the World
Expo Shanghai, transfer of part funding of the Victorian Government Business Office Network from the Investment Attraction and Facilitation output and carryover of funding into 2009-10.
Service Delivery 2009-10 Innovation, Industry and Regional Development 137
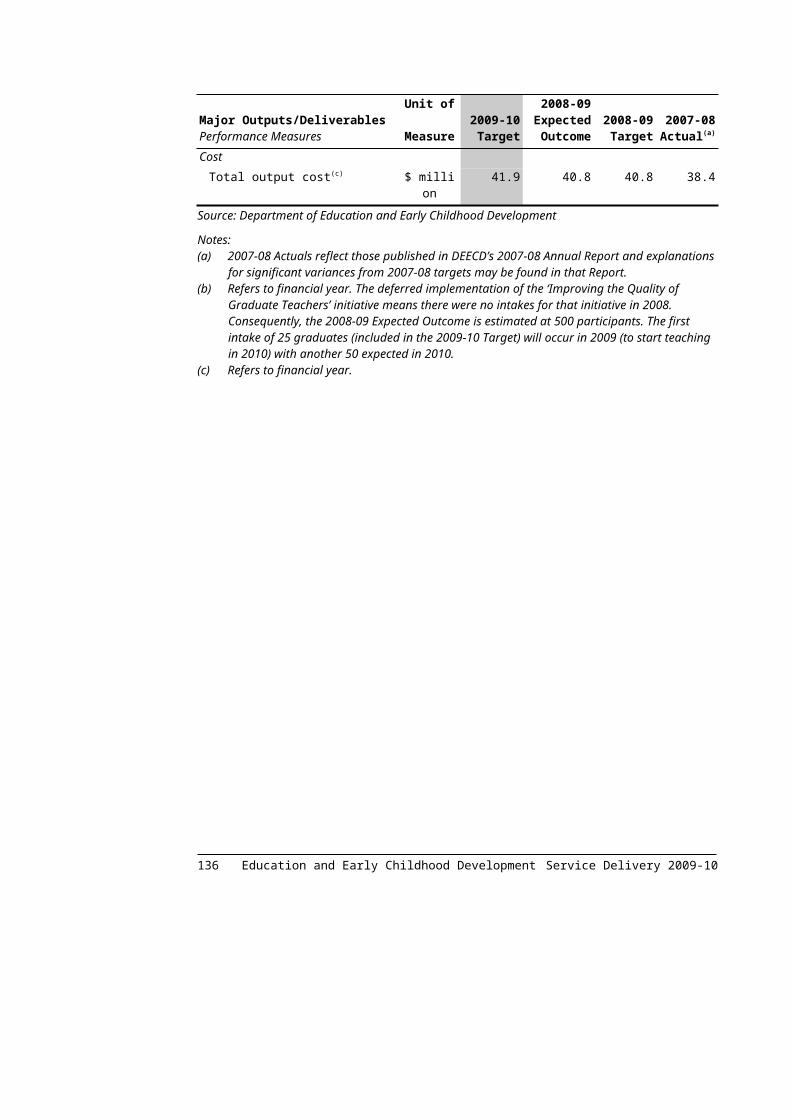
Regional DevelopmentRegional Development outputs support the sustained economic and industry development of provincial Victoria. Regional Development Victoria (RDV) takes a leading role in the delivery of these outputs.
These outputs make a significant contribution to the following key government outcomes:
more quality jobs and thriving, innovative industries across Victoria;
growing and linking all of Victoria; and
building friendly, confident and safe communities.
Major Outputs/DeliverablesPerformance Measures
Unit of Measure
2009-10 Target
2008-09 Expected Outcome
2008-09 Target
2007-08 Actual
Regional Infrastructure DevelopmentSupports infrastructure development in regional Victoria.
Quantity RIDF projects funded (excluding Small Towns Development Fund)(a)
number 20 42 15 55
Small Towns Development Fund projects funded
number 60 60 60 73
Quality RIDF Committee recommendations accepted by ministers
per cent 90 90 90 100
Timeliness Advice to RIDF applicants – after receipt of applications
days 90 90 90 90
Cost Total output cost(b) $ million 84.6 51.2 41.4 53.8
Regional Economic Development, Investment and PromotionFacilitates economic growth and revitalisation of regional cities and towns.
Quantity Companies in regional Victoria provided with assistance for growth opportunities
number 160 160 160 166
Jobs created in regional Victoria(c) number 1 000 1 200 1 000 2 766New exports facilitated in regional Victoria
$ million 150 150 150 699
New investment facilitated in regional Victoria(d)
$ million 750 1 045 750 750
Projects to support councils plan for growth and change(e)
number 20 25 25 32
Projects to support growth in Victorian food industry
number 25 25 25 nm
138 Innovation, Industry and Regional Development Service Delivery 2009-10
Major Outputs/DeliverablesPerformance Measures
Unit of Measure
2009-10 Target
2008-09 Expected Outcome
2008-09 Target
2007-08 Actual
Provincial Economic Partnerships – projects supported(f)
number 15 25 25 43
Provincial events held with RDV support
number 55 55 55 68
Quality Participant satisfaction with Provincial leadership programs(g)
per cent 75 nm nm nm
Cost Total output cost(h) $ million 69.5 50.8 48.7 44.2
Source: Department of Innovation, Industry and Regional Development
Notes:(a) Increase in target reflects an increase in funding provided for 2009-10. The 2008-09 Expected
Outcome and the 2007-08 Actual reflects a large number of smaller projects approved under the Local Roads to Markets Program.
(b) Variance between the 2008-09 to 2009-10 Target reflects variation in annual funding under the Regional Infrastructure Development Fund, additional funding for the Victorian Transport Plan initiatives and the transfer of funding from capital for the Geelong Future Cities Master Plan.
(c) The 2008-09 Expected Outcome and 2007-08 Actual includes a small number of large projects. (d) The 2008-09 Estimated Outcome includes a small number of large projects.(e) Decrease in target reflects planned reduction in funding provided for the Planning for Growth and
Planning for Change programs.(f) Decrease in target reflects planned reduction in funding provided for the Provincial Economic
Partnerships.(g) New, more relevant measure replacing the Delivery of Leadership Programs in Provincial Victoria.(h) Variance between the 2008-09 and 2009-10 Target relates to variation in annual funding under the
Provincial Victoria Growth Fund and additional funding for the Industry Transition Fund.
Service Delivery 2009-10 Innovation, Industry and Regional Development 139

Skills and WorkforceSkills and Workforce outputs respond to the labour and skills needs of industry through the planning and purchasing of vocational education and training services and the provision of targeted employment initiatives and facilitate cooperative, flexible and productive workplaces.
These outputs make a significant contribution to the following key government outcomes:
more quality jobs and thriving, innovative industries across Victoria;
growing and linking all of Victoria;
high quality education and training for lifelong learning; and
a fairer society that reduces disadvantage and respects diversity.
Major Outputs/DeliverablesPerformance Measures
Unit of Measure
2009-10 Target
2008-09 Expected Outcome
2008-09 Target
2007-08 Actual
SkillsProvides planning and purchasing of vocational education and training services from TAFE institutions and private registered training organisations and builds the capability and competitiveness of the vocational education and training system in Victoria to ensure and enhance the quality of services.
Quantity Annual government funded module enrolments(a)
number (million)
2.56 2.61 2.3 2.48
Audit of contract compliance by registered training organisations and other State Training Systems organisations
number 175 175 175 176
Government funded student contact hours of training and further education provided(a)
number (million)
80 86.9 78.5 82.7
Number of apprenticeship/traineeship commencements by new employees(b)
number 56 000 50 000 56 000 57 991
Number of apprenticeships/trainees completion who qualify for the completion bonus(c)
number 14 000 14 000 15 000 16 057
Number of government funded course enrolments in Skills Deepening qualifications(d)
number 55 800 nm nm nm
Number of individuals assisted through Skill Up(e)
number 1 000 5 000 1 000 2 374
Quality Participation rate of 15-24 year olds in training and further education in Victoria: all Victoria(f)
per cent 25.1 nm nm nm
140 Innovation, Industry and Regional Development Service Delivery 2009-10

Major Outputs/DeliverablesPerformance Measures
Unit of Measure
2009-10 Target
2008-09 Expected Outcome
2008-09 Target
2007-08 Actual
Participation rate of 25-64 year olds in training and further education in Victoria: all Victoria(g)
per cent 9.2 nm nm nm
Percentage of VET graduates who rate quality of training as four or more out of five(h)
per cent 88 88.1 87 88.9
Successful training completions as measured by module load pass rate
per cent 77.5 77.8 77.5 76.8
VET graduates in employment six months following graduation(i)
per cent 81 81.8 81 81.6
Cost Total output cost(j)(k) $ million 1 829.1 1 796.7(l) 1 659.9 1 608
Industrial RelationsAdvocates for and delivers programs aimed at establishing fair, cooperative and dynamic work environments in Victoria in private and public organisations.
Quantity Respond to general workplace enquiries
number 15 000 14 500 15 000 17 596
Quality Client satisfaction with services provided to facilitate innovative and high performing workplaces and major investment projects(m)
per cent 90 90 90 90
Client satisfaction with the programs and activities delivered under the Working Families agenda(n)
per cent 90 90 80 90
Victoria represented in major industrial relations cases and inquiries in accordance with Government policy
per cent 100 100 100 100
Cost Total output cost(o) $ million 8.6 11.8 11.7 12.1
Workforce ParticipationProvides programs that respond to labour and skills needs of industry which link disadvantaged job seekers with jobs and utilise skilled migration to meet Victoria's skills requirements.
Quantity Global Skills for Victoria – average number of visits per month to the Live in Victoria website(p)
number 60 000-65 00
0
60 000-70 000
60 000-70 00
0
69 399
Service Delivery 2009-10 Innovation, Industry and Regional Development 141

Major Outputs/DeliverablesPerformance Measures
Unit of Measure
2009-10 Target
2008-09 Expected Outcome
2008-09 Target
2007-08 Actual
Government Youth Employment Scheme – apprenticeships and traineeships commenced(q)
number 450-550 450-550 450-550 682
New Workforce Partnerships – jobseekers who achieve sustainable employment outcomes (minimum of 16 weeks)(r)
number 550-650 0 350-450 nm
Number of people assisted by Returning to Earning Program
number 2 500-3 500
2 500-3 500
2 500-3 500
2 950
Quality Client satisfaction with targeted employment initiatives
per cent 80 80 80 nm
Global Skills for Victoria – client satisfaction with services provided
per cent 85 85 85 90
Timeliness Global Skills for Victoria – average processing time for state sponsorship applications
working days
25-30 25-30 25-30 23
Cost Total output cost(s) $ million 27.1 21.6 18.5 26.3
Source: Department of Innovation, Industry and Regional Development
Notes:(a) Increase in target is based on an estimated increase in modules due to the release of the Skills
Statement ‘Securing Jobs for your Future’.(b) Increase in target is based on an estimated increase in student contact hours of training due to the
release of the Skills Statement ‘Securing Jobs for your Future’. The 2008-09 Expected Outcome is due to the impact of the economic downturn which has resulted in a decrease in the number of apprentice/trainee commencements.
(c) Decrease in target and the 2008-09 Expected Outcome reflects the softening of the labour market and the impact on apprentices/trainees completions.
(d) New measure reflects the impact of skills reform including demand driven funding and the new Skills for Growth program.
(e) The 2008-09 Expected Outcome is based on a change in definition which is now broader. Expectations are that the final outcome for the year will be higher than expected.
(f) New measure replaces the Government funded student contact hours of training and further education provided to 15-19 year olds and participation rate of 15-19 year olds in training and further education in Victoria: all Victoria.
(g) New measure replaces the Persons aged 15-64 participating in TAFE programs as proportion of population.
(h) Change in terminology, the word ‘TAFE’ has been replaced with ‘VET’ to reflect overall program and targets. This measures the same activity as the performance measure in 2008-09.
(i) Change in terminology, the word 'TAFE' has been replaced with 'VET' to reflect overall program and targets. This measures the same activity as the performance measure in 2008-09, however more accurately represents what the indicator measures.
(j) $14.4 million of the outputs for that part of Skills Reform package relating to the Skills for Growth program, which is administered by Small Business and Skills Victoria, are listed under Small Business (Businesses Assisted and Training Placements measures).
142 Innovation, Industry and Regional Development Service Delivery 2009-10

Notes (continued):(k) Variance between the 2008-09 and 2009-10 Target reflects additional funding under Skills Reform
Package, Purchased Places, Fee Waivers for the Job Seekers, Skills to Transition Program, and additional fee for service revenue for TAFE.
(l) The variance between the 2008-09 Target and the 2008-09 Expected Outcome relates to additional funding for the Skills Reform initiative, as well as additional funding for income contingent loans as well as a difference in estimated and actual carryover and additional TAFE fee for service revenue.
(m) The 2009-10 performance measure is the same as the 2008-09 measure except for the replacement of the words 'activities designed to facilitate high performing and innovative workplaces and with investment facilitations services' with 'services provided to facilitate innovative and high performing workplaces and major investment projects. This measures the same activity as the performance measure in 2008-09, however more accurately represents what the indicator measures.
(n) The 2009-10 performance measure is the same as the 2008-09 measure except for the replacement of the words 'activities arising from' with 'programs and activities delivered under'. This measures the same activity as the performance measure in 2008-09, however more accurately represents what the indicator measures.
(o) Variance between the 2008-09 and 2009-10 Target relates to the cessation of funding for the Victorian Workplace Rights Advocate.
(p) The 2009-10 performance measure is the same as the 2008-09 measure except for the removal of the word ‘unique’. The methodology (Google Analytics) is a standard use across Victorian Government websites, and provides a more reliable basis for measuring website success. The new measure is the monthly average, of the annual number of visits to the website as at the end of quarter 4. This annual figure will address seasonal variations. The reduced target reflects the uncertain impact of the global economic conditions on migration intentions.
(q) The 2007-08 Actual reflects the lag time in reporting of apprenticeship and traineeship outcomes. (r) The Expected Outcome reflects the lag time in reporting of outcomes. New Workforce Partnerships
has 29 projects now in place that will deliver the target outcomes during 2009-10 rather than the original 2008-09 period. These projects are contracted to realise job placements before November 2009, leading to the achievement of the original overall target of 350-450 16-week employment outcomes during 2009-10. The 2009-10 Target has also been increased by 200 to reflect new funding.
(s) Variance between the 2008-09 to 2009-10 Target relates mainly to the additional funding for New Workforce Partnerships and carryover of funding into 2009-10.
Service Delivery 2009-10 Innovation, Industry and Regional Development 143

Marketing VictoriaMarketing Victoria outputs promote Victoria both nationally and internationally as a great place to live, work, invest, visit and learn by positioning Victoria as a distinct, competitive and fair business environment, exporter and tourist destination.
These outputs make a significant contribution to the following key government outcomes:
more quality jobs and thriving, innovative industries across Victoria; and
growing and linking all of Victoria.
Major Outputs/DeliverablesPerformance Measures
Unit of Measure
2009-10 Target
2008-09 Expected Outcome
2008-09 Target
2007-08 Actual
TourismFacilitates employment and longer term economic benefits of tourism to Victoria by developing and marketing the state as a competitive tourist destination for both domestic and international tourists.
Quantity Investment projects facilitated $ million 250-300 250-300 250-300 301Number of visitors (international)(a) number
(million)1.4-1.6 1.4 1.5-1.8 1.5
Visitor expenditure (domestic) $ billion 12-13 12.3 12-13 12.1Visitor expenditure (international)(b) $ billion 3.0-3.5 3.2 3.2-3.6 3.2Visitor expenditure in regional Victoria (domestic)
billion 5.8-6.3 6 5.8-6.3 6
Visitor expenditure in regional Victoria (international)
million 230-280 257 230-280 260
Visitvictoria.com annual visits to site(c)
number (‘000)
6 500 6 000-6 500
5 400 5 166
Quality Victoria’s share of domestic tourism advertising awareness among target markets: intrastate(d)
per cent 16-21 nm nm nm
Victoria’s share of domestic tourism advertising awareness among target markets: interstate(d)
per cent 21-26 nm nm nm
Value of media coverage generated: Domestic(e)
$ million 20-30 20-30 20-25 24.4
Value of media coverage generated: International
$ million 80-120 80-120 80-120 104.4
Cost Total output cost(f) $ million 75.2 86.1 79.4 79.8
Source: Department of Innovation, Industry and Regional Development
Notes:(a) Decline in target. Inbound tourism arrivals are expected to decline in 2009 due to the Global
Financial Crisis. This is based on the latest data from the Tourism Forecasting Council (December 2008).
144 Innovation, Industry and Regional Development Service Delivery 2009-10

Notes (continued):(b) Decline in target. Inbound tourism and expenditure is expected to decline in 2009 due to the Global
Financial Crisis.(c) Increase in target reflects the change in methodology used to measure the number of visits to site (i.e.
Google Analytics).(d) The new measure reflects the targe market awareness of domestic tourism advertising as well as
measures performance directly against competitor states.(e) Increase in target reflects the expected media coverage to be achieved in 2009-10. This is mainly a
slight re-focus from international market to domestic market due to the current global economic environment.
(f) Variance between the 2008-09 to 2009-10 Target reflects the transfer of funding for major events funding to the Department of Planning and Community Development, partly offset by additional funding for the Bushfire Recovery.
Service Delivery 2009-10 Innovation, Industry and Regional Development 145

Major ProjectsInfrastructure investment ensures that future generations of Victorians enjoy high levels of improved services, stronger economic growth and increased job opportunities.
This output makes a significant contribution to the following key government outcomes:
more quality jobs and thriving, innovative industries across Victoria; and
growing and linking all of Victoria.
Major Outputs/DeliverablesPerformance Measures
Unit of Measure
2009-10 Target
2008-09 Expected Outcome
2008-09 Target
2007-08 Actual
Major ProjectsManagement and delivery of nominated public construction and land development projects, the coordination of development projects and associated feasibility studies.
Quality Delivery of nominated Major Projects Victoria projects complies with agreed plans
per cent 100 100 100 100
Timeliness Melbourne Rectangular stadium – completed(a)
date qtr4 nm nm nm
Princess Pier: commence reinstatement of deckworks(b)
date qtr 3 0 qtr 1 nm
Cost Total output cost(c)(d) $ million 9.3 25.9 10.4 na
Source: Department of Innovation, Industry and Regional Development
Notes:(a) New performance measure to reflect new project. (b) Target not met. When the existing timber beams were exposed, their re-use was not viable preventing
planned works proceeding.(c) Major Projects Victoria transferred from the Department of Infrastructure (now Department of
Transport) under machinery of government changes. 2007-08 Actual is not reported for DIIRD. (d) Variance between the 2008-09 and 2009-10 Target reflects the estimated carryover included in the
2008-09 target.
146 Innovation, Industry and Regional Development Service Delivery 2009-10

DEPARTMENT OF JUSTICE
Departmental mission statementThe Department provides a policy and organisational management focus for the vision of a safe, just, innovative and thriving Victoria, where rights are respected and diversity is embraced.
Significant challenges facing the Department in the medium termThe Department’s challenges include:
affordable and accessible justice for all Victorians;
minimising social harm from alcohol misuse;
reforms to key areas of criminal law and civil procedure;
changing the patterns of offending and re-offending;
restructuring the gambling industry;
reducing the incidence of serious and violent crime in the community;
building police capability to deal with increasingly sophisticated crime;
reducing the levels of disadvantage and over-representation of Indigenous persons in the criminal justice system;
support for victims of crime and their families;
safe and appropriate containment of prisoners while reducing the rate of recidivism;
building the capacity of emergency services to respond to increased threats from more extreme weather events; and
contributing to a national approach to consumer protection.
Immediate challenges facing the DepartmentThe Department’s challenges include:
responding to the 2009 Victorian bushfires – supporting the Royal Commission into Victoria’s bushfires;
intervening to minimise social harm from alcohol misuse – measures contributing to Restoring the Balance – Victoria’s Alcohol Action Plan 2008-2013;
implementing Justice Statement 2 – the Attorney General’s vision for modernising the justice system, including reducing the cost of justice, appropriate dispute resolution, civil justice reform and creating an engaged and unified court system;
Service Delivery 2009-10 Justice 147

Closing the Gap between Indigenous and Non-Indigenous Australians – reducing the levels of disadvantage and over-representation of Indigenous Australians in the criminal justice system;
managing the impact of economic circumstances on the demand for justice services – managing core business and the impact of increasing demand for services whilst continuing to address key business priorities; and
responding to the Global Financial Crisis.
Major policy directions and strategiesThe Department of Justice has seven key objectives:
community safety and crime reduction;
consumer empowerment and rights protection;
responsible business and citizen conduct;
integrated ‘all hazards – all agencies’ community focused emergency management;
fair and efficient dispute resolution;
human rights protection; and
modern management and business support.
These objectives directly support the Growing Victoria Together goals of:
building friendly, confident and safe communities;
a fairer society that reduces disadvantage and respects diversity;
greater public participation and more accountable government; and
more quality jobs and thriving innovative industries across Victoria.
Ministerial PortfoliosThe department supports the Ministerial portfolios of the Attorney-General, Police and Emergency Services, Corrections, Consumer Affairs, Gaming and Racing.
148 Justice Service Delivery 2009-10
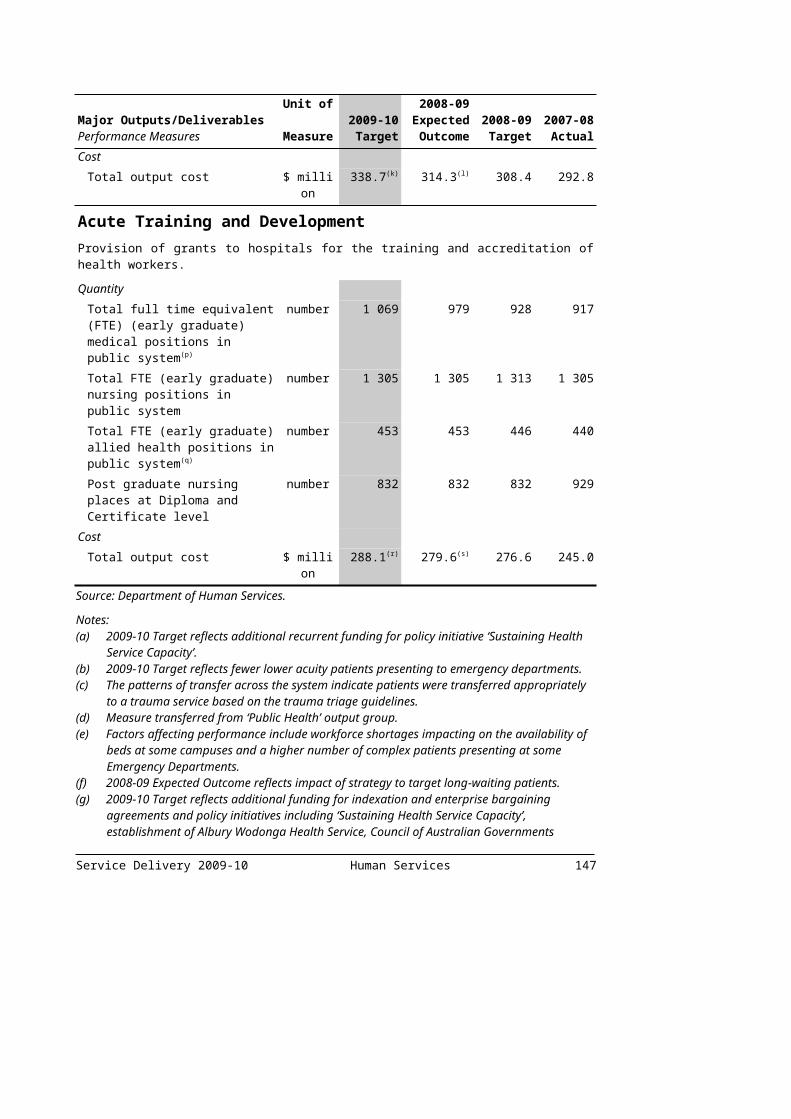
Changes to the output structureThere are no changes to the output structure intended for 2009-10.
Discontinued performance measures are detailed in Appendix C of this budget paper.
The following table summarises the total output cost. It has been prepared on the basis of the Department’s 2009-10 output structure and therefore allocations may differ from the Department’s previously published budget.
Table 3.4: Output summary ($ million)
2008-09 Budget
2008-09 Revised
2009-10 Budget
Variation (a)
%Providing a Safe and Secure Society (b) 1 773.9 1 791.3 1 918.5 8.2Legal Support to Government and
Protecting the Rights of Victorians (c) 186.3 214.5 209.0 12.2
Dispensing Justice (d) 415.2 425.6 441.3 6.3Community Operations (e) 222.1 219.1 259.6 16.9Supporting the State's Fire and Emergency
Services (f) 200.0 202.6 217.5 8.7
Enforcing Correctional Orders 570.3 549.3 592.9 4.0Protecting Consumers 141.2 137.3 144.2 2.2Regulating Gaming and Racing (g) 72.2 80.9 123.7 71.4Total 3 581.1 3 620.6 3 906.7 9.1Source: Department of Justice
Notes:(a) Variation between 2008-09 Budget and 2009-10 Budget.(b) The 2009-10 Budget includes incremental funding to support the Victoria Police 2009-13 The Way
Ahead.(c) The 2009-10 Budget includes increased funding for Victorian Legal Aid.(d) The 2009-10 Budget includes new and incremental funding for Victoria’s Courts and Tribunals for
Family Violence, Mental Health and Reducing Court Delays.(e) The 2009-10 Budget includes additional funding for Road Safety initiatives as part of the Arrive
Alive 2 strategy.(f) The 2009-10 Budget reflects additional funding for the Response to the Victorian Bushfire
Emergency.(g) The 2009-10 Budget reflects funding for the Gambling Licences Review and Victorian Racing
Industry grants.
The following section provides details of the outputs to be provided to Government, including performance measures and costs for each output. Total expenditure for the department can be found in Budget Paper No. 4, Chapter 3, Departmental Financial Statements.
Service Delivery 2009-10 Justice 149

Providing a Safe and Secure SocietyThese outputs enable people to undertake their lawful pursuits confidently and safely and support the aim of providing access to high quality policing services that are delivered fairly and with integrity. Victoria Police contributes to a high quality of life for individuals in the community by ensuring a safe and secure society that underpins the economic, social and cultural wellbeing of Victoria. Its role has expanded from one focused primarily on law enforcement, to one of community assistance, guidance and leadership.
The Office of Police Integrity is an independent and impartial organisation that ensures the highest ethical and professional standards are maintained by Victoria Police at all times.
These outputs contribute to the following key government outcomes:
building friendly, confident and safe communities; and
a fairer society that reduces disadvantage and respects diversity.
Major Outputs/DeliverablesPerformance Measures
Unit of Measure
2009-10 Target
2008-09 Expected Outcome
2008-09 Target
2007-08 Actual
Policing ServicesVictoria Police delivers a range of services:
responding to calls for assistance in matters of personal and public safety, including emergencies, serious incidents and routine response calls;
detection and investigation of offences and bringing to justice those responsible for committing them;
supporting the judicial process to achieve efficient and effective court case management, providing safe custody for alleged offenders and ensuring fair and equitable treatment of both victims and alleged offenders;
providing community safety and crime prevention programs such as the authorised release of criminal history information in the interests of public safety; and
promoting safer road user behaviour and enforcing road safety laws.
Quantity Crime prevention and community safety checks conducted(a)
number 480 000 440 000 480 000 531 281
Events responded to(b) number 795 000 780 000 760 000 723 286Reduction in crimes against the person(c)
per cent 2 2 2 (1.4)
Reduction in property crime per cent 2 1 2 0.4Quality
Proportion of drivers tested who comply with alcohol limits
per cent 99 99 99 99.5
Proportion of drivers tested who comply with posted speed limits
per cent 99 99 99 99.7
Proportion of drivers tested who return clear result for prohibited drugs
per cent 97 97 97 98.3
150 Justice Service Delivery 2009-10

Major Outputs/DeliverablesPerformance Measures
Unit of Measure
2009-10 Target
2008-09 Expected Outcome
2008-09 Target
2007-08 Actual
Proportion of the community who have confidence in police (an integrity indicator)
per cent 82 82 82 82.4
Proportion of community satisfied with policing services (general satisfaction)(d)
per cent 69 69 72 69.7
Proportion of successful prosecution outcomes
per cent 92 92 92 93.1
Timeliness Proportion of crimes against the person resolved within 30 days
per cent 56 56 56 52.9
Proportion of property crime resolved within 30 days
per cent 20 20 20 19.1
Cost Total output cost $ million 1 892.1 1 766.8 1 748.5 1 625.9
Police IntegrityThe Office of Police Integrity (OPI) aims to ensure that the highest ethical and professional standards are maintained in the police force, and that police corruption and serious misconduct is detected, investigated and prevented.
Quantity Corruption prevention initiatives number 50 60 50 76Parliamentary reports published number 6 8 5 6
Quality OPI investigations resulting in significant outcomes
number 75 75 75 nm
Timeliness Compliance with complaint handling requirements prescribed in legislation within set timeframes
per cent 100 100 100 nm
Cost Total output cost $ million 26.4 24.6 25.3 21.5
Source: Department of Justice
Notes:(a) The target for the number of crime prevention and community safety checks has been maintained at
the same level as that for 2008-09, despite an expected outcome lower than the set target. The decline in the number of checks conducted across the 2008-09 year is attributable to a number of factors. These factors include a reduction in the number of checks conducted as a consequence of Commonwealth aged care legislation (required only on a triennial basis); transfer of some categories of checks to the national agency, Crimtrac; and streamlining of procedures allowing persons to apply for checking once, rather than multiple times.
(b) The 2009-10 Target reflects a consistent increase in the number of calls for assistance from the community for police attendance at incidents involving potential threats to personal and public safety.
Service Delivery 2009-10 Justice 151

Notes (continued):(c) The target for this performance measure is a percentage reduction in the crimes against the person
(represented as a positive number), the negative result for the 2007-08 Actual, represents an increase in the percentage of crimes against the person.
(d) The 2009-10 Target has been adjusted to reflect a level consistent with the 2008-09 expected outcome, whilst maintaining a level above the national average.
152 Justice Service Delivery 2009-10

Legal support to government and protecting the rights of VictoriansThese outputs provide the Department’s primary focus for state law reform, the development of justice policy and procedures, provision of legal advice to other departments and the implementation of new or amended legislation.
Increasing awareness of rights and obligations, and reducing levels of individual and systemic discrimination are key challenges in the effective promotion and protection of human rights. These outputs support the administration of equal opportunity legislation and the Information Privacy Act 2000, the provision of advocacy and guardianship services for adults with disabilities, maintenance of the Victorian electoral system and the Births, Deaths and Marriages database.
The outputs also incorporate the provision of legal aid for system users, support to victims of crime and forensic pathology and scientific services.
These outputs contribute to the following key government outcomes:
a fairer society that reduces disadvantage and respects diversity;
building friendly, confident and safe communities; and
greater public participation and more accountable government.
Major Outputs/DeliverablesPerformance Measures
Unit of Measure
2009-10 Target
2008-09 Expected Outcome
2008-09 Target
2007-08 Actual
Legal Policy, Advice and Law ReformProvides support to government in the provision of:
legal policy, particularly in relation to new or amended legislation and administrative reforms and assistance with executive matters including through the Victorian Government Solicitor's Office (VGSO);
legal advice on constitutional and other legal matters on behalf of client government departments;
law reform in relation to issues referred to the Victorian Law Reform Commission (VLRC) by the Attorney-General and the provision of advice in relation to minor changes of the law without a reference; and
management of Native Title claims on behalf of the State and leadership on whole of government Native Title policy.
Quantity Community education and consultation sessions conducted by VLRC
number 50 50 50 60
Legal policy briefings, memorandums, Cabinet submissions and correspondence prepared
number 5 300 5 300 5 300 7 132
Law reform projects conducted by Legal Policy (including legislative program matters)
number 28 28 28 28
Service Delivery 2009-10 Justice 153
Major Outputs/DeliverablesPerformance Measures
Unit of Measure
2009-10 Target
2008-09 Expected Outcome
2008-09 Target
2007-08 Actual
Law reform projects conducted by VLRC
number 4 4 4 5
Native Title claims for which evidence has been assessed
number 3 3 3 3
Quality Client satisfaction with quality of legal advice provided (VGSO)
per cent 80 nm nm nm
Stakeholder satisfaction with consultation/education processes (VLRC)
per cent 85 85 85 85
Stakeholder satisfaction with law reform projects, briefings and consultations (legal policy)
per cent 80 80 80 80
Timeliness Client satisfaction with timeliness of legal advice provided (VGSO)
per cent 80 nm nm nm
Cost Total output cost $ million 45.6 49.7 39.8 34.5
Protecting Community RightsProtects community rights through:
provision of complaints handling, investigation, research, advice, education and training services provided by the Victorian Equal Opportunity and Human Rights Commission (VEOHRC);
supporting the Public Advocate in its role as the statutory guardian of last resort for adults with disabilities; and
management of a database of Victorian births, deaths and marriages, name changes and adoptions, and provision of certificates for official use.
Quantity Community education/training programs, services and events delivered by VEOHRC
number 350 350 350 nm
Public Advocate protective interventions for people with a disability
number 2 510 2 510 2 510 2 415
Quality Births, Deaths and Marriages registration transaction error rate
per cent 0.9 0.9 0.9 0.3
Customer satisfaction rating: Community education/training programs, services and events delivered by VEOHRC
per cent 85 85 85 nm
154 Justice Service Delivery 2009-10

Major Outputs/DeliverablesPerformance Measures
Unit of Measure
2009-10 Target
2008-09 Expected Outcome
2008-09 Target
2007-08 Actual
Timeliness Timely provision of Births, Deaths and Marriages certificates
per cent 90 90 90 95
VEOHRC complaints finalised within agreed timeframe
per cent 85 85 85 nm
Cost Total output cost $ million 29.5 29.7 28.7 26.6
Supporting the Judicial ProcessSupport the judicial process by:
providing legal assistance and representation to members of the community in legal cases through Victoria Legal Aid and Community Legal Centres;
providing forensic pathology and scientific services through the Victorian Institute of Forensic Medicine (VIFM), which is responsible for the production of reports to the Coroner as part of death investigations; and
providing referral to appropriate support agencies for victims of crime, administering a Victims Counselling Scheme and funding community programs to establish victim support networks and specialist statewide victim support services.
Quantity Duty lawyer services(a) number 60 000 nm nm nmGrants of assistance(b) number 35 000 nm nm nmLegal advice to clients(c) number 90 000 90 000 72 000 86 598Medico-legal death investigations(d) number 4 992 4 860 4 710 4 309Number of victims receiving a service
number 7 500 7 500 7 500 6 896
Quality Victorian Institute of Forensic Medicine quality audit
per cent 95 95 95 98
Timeliness Applications for legal aid processed within 15 days
per cent 95 95 95 96
Medical and scientific investigations on the body of the deceased completed within two days(e)
per cent 65 55 65 nm
Medico-legal death investigation reports issued within agreed period(e)
per cent 70 65 70 67
Cost Total output cost $ million 108.9 98.0 80.7 76.7
Service Delivery 2009-10 Justice 155
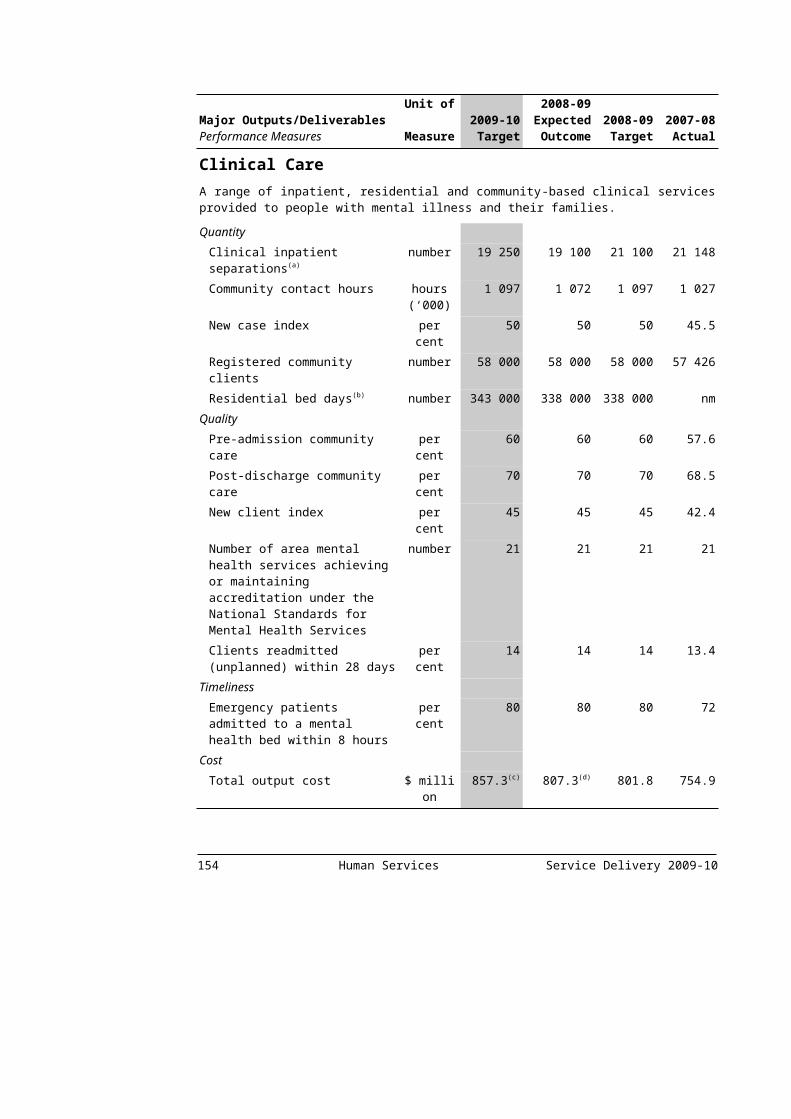
Major Outputs/DeliverablesPerformance Measures
Unit of Measure
2009-10 Target
2008-09 Expected Outcome
2008-09 Target
2007-08 Actual
Privacy RegulationThe Office of the Victorian Privacy Commissioner administers the Information Privacy Act 2000, which includes complaints handling, investigation and audit, advice and guidance, and education and training for state and local government and the general public.
Quantity Compliance activities conducted number 2 640 2 630 2 630 2 378Privacy awareness activities conducted
number 190 186 186 186
Quality Client satisfaction with services provided
level high high high high
Timeliness Statutory or agreed timelines met per cent 90 90 90 90
Cost Total output cost $ million 2.4 2.3 2.2 2.1
State Electoral Roll and ElectionsThe Victorian Electoral Commission (VEC) maintains the integrity of the Victorian electoral system through the conduct of fair and impartial elections.
Quantity State Government, Municipal and Non-government elections, by-elections and polls(f)
number 26 97 90 25
Quality Challenges to VEC conduct upheld in court
number 0 0 0 0
Timeliness Elector enrolment changes and new enrolments processed within set timeframes(g)
per cent 98 nm nm nm
Cost Total output cost $ million 22.6 34.8 34.8 18.1
Source: Department of Justice
Notes:(a) This measure and the measure ‘Grants of Assistance’ were previously amalgamated and referred to
as the 2008-09 measure ‘Legal representation to clients’. They have been separated in recognition of the different levels of resource intensity for each activity.
(b) This measure and the measure ‘Duty lawyer services’ were previously amalgamated and referred to as the 2008-09 measure ‘Legal representation to clients’. They have been separated in recognition of the different levels of resource intensity for each activity.
(c) The increased target in 2009-10 is a reflection of the increased demand for legal services delivered to the public by Victoria Legal Aid in recent times.
156 Justice Service Delivery 2009-10
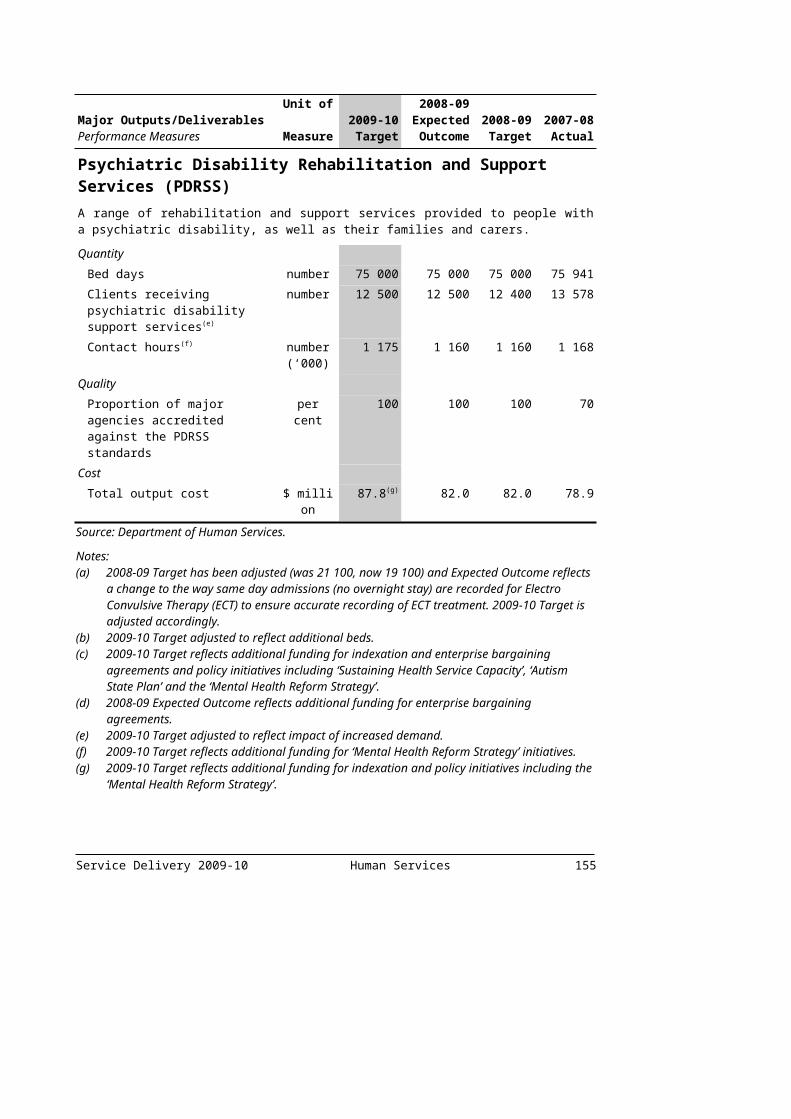
Notes (continued):(d) The increased target in 2009-10 is a prediction based on the ageing Victorian population and
increased number of deaths reported to the Coroner with requests for medico-legal investigation by the VIFM in recent years.
(e) The 2008-09 expected outcome has been influenced by an increased workload resulting from the extreme weather conditions and bushfires experienced by Victoria in 2008-09.
(f) This measure is a consolidation of the 2008-09 measures ‘State Government elections, by-elections and polls’, ‘Municipal elections, by-elections and polls’ and ‘Non-government elections, by-elections and polls’. The 2008-09 outcome was impacted by Municipal elections being held in Victoria, a higher than anticipated number of by-elections and fee-for-service elections. The 2009-10 Target is lower than the 2008-09 outcome because neither general municipal nor State elections are scheduled in 2009-10.
(g) This measure replaces the 2008-09 measure ‘Elector enrolment changes’, with the focus being on the timeliness of processing. The previous measure included an estimate of the number of enrolment changes attributed to the Australian Electoral Commission (AEC) activity that is outside of the VEC’s control.
Service Delivery 2009-10 Justice 157

Dispensing JusticeThese outputs involve supporting the State’s judiciary in their dispensation of criminal and civil matters, maintaining the administrative operations of the system of courts and statutory tribunals, and providing alternative civil dispute resolution mechanisms. These outputs also incorporate the management of criminal prosecutions on behalf of the State.
Through these outputs, the Department aims to reduce crime through early intervention, build the capacity of law enforcement agencies, divert and rehabilitate offenders, ensure a more flexible and efficient justice system, protect the vulnerable, resolve disputes appropriately, and engage and consult with the community.
These outputs contribute to the following key government outcomes:
building friendly, confident and safe communities; and
a fairer society that reduces disadvantage and respects diversity.
Major Outputs/DeliverablesPerformance Measures
Unit of Measure
2009-10 Target
2008-09 Expected Outcome
2008-09 Target
2007-08 Actual
Court Matters and Dispute ResolutionThis includes services provided by the Supreme Court, County Court, Magistrates' Court of Victoria, Children's Court of Victoria, Coroner's Court, Victorian Civil and Administrative Tribunal, and the Dispute Settlement Centre of Victoria.
Quantity Criminal and non-criminal matters disposed(a)
number 355 914 356 400 335 614 359 248
Quality Quality of court registry services per cent 85 85 85 95Quality of dispute resolution services
per cent 90 90 90 92
Timeliness Criminal and non-criminal matters disposed within agreed timeframes
per cent 80 80 80 80
Cost Total output cost $ million 380.8 369.7 358.5 315.5
Public ProsecutionsThe Office of Public Prosecutions prepares and conducts proceedings on behalf of the Director of Public Prosecutions in the High Court, Supreme Court, County Court and Magistrates' Court in an effective and efficient manner.
Quantity Judicial Officer sitting days requiring prosecutors(b)
number 11 250 nm nm nm
Number of briefs prepared and hearings attended
number 72 500 70 000 72 000 nm
Number of victim and witness consultations(c)
number 5 000 nm nm nm
158 Justice Service Delivery 2009-10

Major Outputs/DeliverablesPerformance Measures
Unit of Measure
2009-10 Target
2008-09 Expected Outcome
2008-09 Target
2007-08 Actual
Quality Guilty outcomes (guilty pleas and trial convictions) as a percentage of case completions(d)
per cent 85 nm nm nm
Timeliness Proportion of trials listed which did not proceed to adjournment on application of the Crown(e)
per cent 99 nm nm nm
Cost Total output cost $ million 60.4 55.8 56.7 50.1
Source: Department of Justice
Notes:(a) The increase in the 2009-10 Target is due largely to the expansion of, and increases in, offences
subject to infringements flowing into the Magistrates' Court and Children's Court and the inclusion of CAYPINS (Children and Young Persons Infringement Notice System) matters.
(b) This measure provides an indicator of the overall court-related workload of the OPP and shows the number of days OPP is required to provide prosecutors to the County Court, Supreme Court, Circuit Courts and Magistrates' Court committal listings.
(c) This performance measure replaces the 2008-09 performance measure ‘Number of witness assistance case referrals’. The 2009-10 performance measure shows the service provided by OPP to victims and witnesses and is broader in scope compared to the 2008-09 measure that has been replaced.
(d) This performance measure replaces the 2008-09 performance measure ‘Guilty pleas as a percentage of case disposals’. The 2009-10 performance measure is a more comprehensive quality measure as it reflects outcomes of both pre-trial and trial activities.
(e) This performance measure replaces the 2008-09 performance measure ‘Number of adjournments sought by the Crown in the County Court and Magistrates' Court on the grounds of insufficient time to prepare’. The 2009-10 performance measure is a more comprehensive timeliness measure as it refers to all adjournments sought by the Crown.
Service Delivery 2009-10 Justice 159
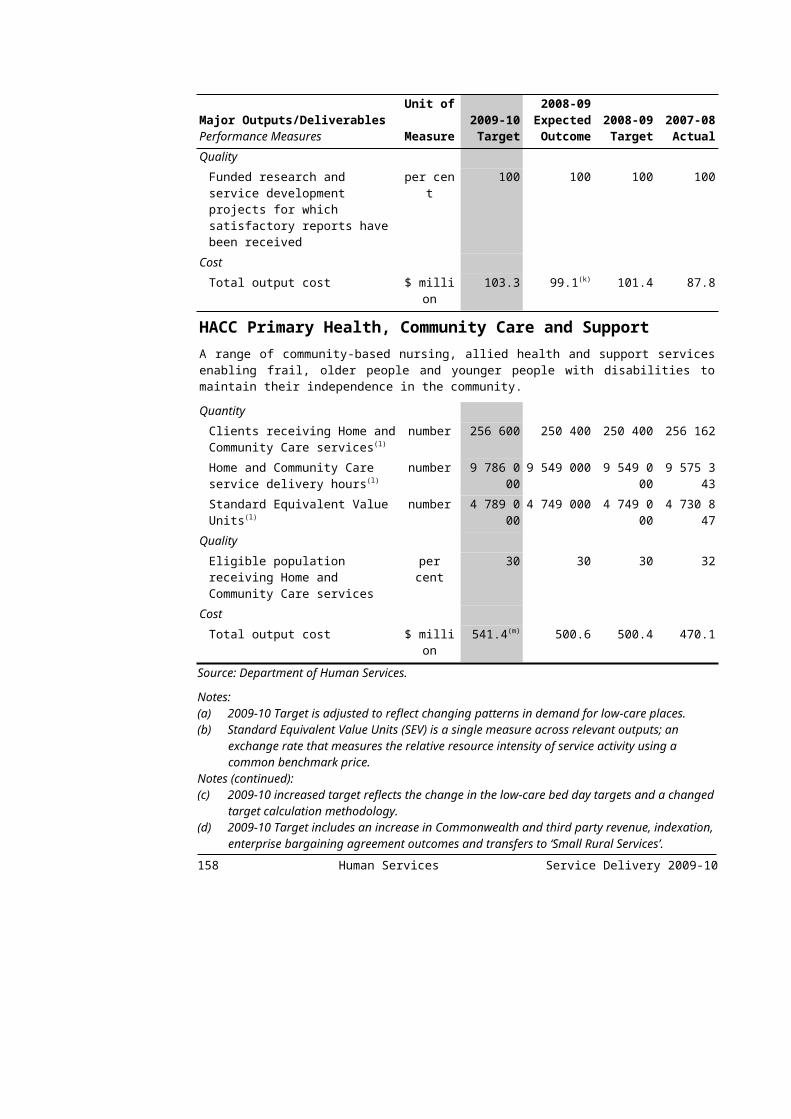
Community OperationsThese outputs involve enforcing judicial fines, court orders and warrants, and processing traffic infringement notices. Unpaid fines are also followed up on behalf of local government, on a fee-for-service basis. A key strategic priority of these outputs is to ensure the infringements notice system remains fair and effective.
These outputs also involve the implementation of crime prevention strategies which aim to reduce the propensity to offend. These include programs such as the Working with Children initiative and the Aboriginal Justice agreement. The administration of the Working with Children Act 2005 aims to protect children from sexual or physical harm.
These outputs contribute to the following key government outcomes:
building friendly, confident and safe communities; and
a fairer society that reduces disadvantage and respects diversity.
Major Outputs/DeliverablesPerformance Measures
Unit of Measure
2009-10 Target
2008-09 Expected Outcome
2008-09 Target
2007-08 Actual
Infringement and Orders ManagementEnforcement and management of infringements and orders through:
administering the processing of traffic infringement notices, penalty payments and referral for enforcement action where required;
providing for the coordination of confiscations and the management or conversion of assets tainted through criminal activity; and
supporting enforcement action by the Office of the Sheriff as and where necessary to ensure judicial fines, court orders and warrants are discharged, and delivering fines enforcement services to other state and local government agencies.
Quantity Infringement notices processed(a) number
(million)2.55-2.75 2.50 2.70-2.90 2.28
Warrants actioned(b) number 675 000 672 000 600 000 723 220Quality
Prosecutable images per cent 88 88 88 87Timeliness
Assets converted within 90 day conversion cycle (c)
per cent 80 86 80 85
Clearance of infringements within 180 days
per cent 75 75 72 75
Cost Total output cost $ million 220.0 182.4 185.9 132.9
160 Justice Service Delivery 2009-10
Major Outputs/DeliverablesPerformance Measures
Unit of Measure
2009-10 Target
2008-09 Expected Outcome
2008-09 Target
2007-08 Actual
Community Safety and Crime PreventionEnsures community safety and crime prevention through:
protecting children from sexual or physical harm by ensuring that people who work with, or care for, them have their suitability to do so checked by a government body; and
contributing to the implementation of crime prevention initiatives with particular focus on addressing the over representation of the Indigenous population in the criminal justice system.
Quantity Crime prevention initiatives established to support the Koori community
number 35 34 35 36
Number of Working with Children checks processed(d)
number 100 000-150 000
150 000-200 000
100 000-150 000
227 299
Quality Issuing of Working with Children Check assessments in accordance with the Working with Children Act 2005
per cent 100 100 100 100
Timeliness Timely commencement of occupational phasing for Working with children checks
per cent 100 100 100 100
Cost Total output cost $ million 39.6 36.6 36.1 31.6
Source: Department of Justice
Notes:(a) The 2008-09 Expected Outcome for Infringement notices processed is below the forecast due to a
number of contributing factors including lower than expected traffic volumes and tolling infringements on Eastlink, roadwork improvements to a number of major roads and increased public awareness of road safety matters. The 2009-10 Target has been set to reflect these trends.
(b) The increase in the 2008-09 Expected Outcome is largely attributable to the strategic targeting of sheriff’s operations on multiple warrant holders. The 2009-10 Target has also been adjusted to reflect continued management of outstanding warrants.
(c) The increase in the 2008-09 Expected Outcome is driven by improved efficiency in current asset confiscation conversion process conducted by Victoria Police on behalf of the Department.
(d) The 2008-09 Expected Outcome has been driven by a higher than anticipated demand for Working with children checks, particularly from the volunteer sector in the latter part of the year.
Service Delivery 2009-10 Justice 161

Supporting the State’s Fire and Emergency ServicesThis output supports emergency prevention and response services provided by the Metropolitan Fire and Emergency Services Board, Country Fire Authority and Victoria State Emergency Services, to reduce death and injury rates and to improve emergency response times. Key strategic priorities involve emergency services working together in a coordinated manner, developing common arrangements that apply to a range of hazards facing the community, focusing on prevention and therefore minimising the risk of emergencies and ensuring emergency services work in active partnership with the community.
This output contributes to the key government outcome of building friendly, confident and safe communities.
Major Outputs/DeliverablesPerformance Measures
Unit of Measure
2009-10 Target
2008-09 Expected Outcome
2008-09 Target
2007-08 Actual
Emergency Management CapabilityDelivering emergency management through:
provision of fire suppression, emergency prevention and response services in the metropolitan fire district and in rural and regional Victoria including outer metropolitan Melbourne;
management of major natural disasters, provision of road accident rescue and support of local government and communities in disaster prevention and mitigation; and
monitoring performance standards for fire and emergency services and provision of high level emergency management advice.
Quantity Emergency service delivery points number 1 400 1 400 1 400 1 400
Quality Advice meets internal benchmarks per cent 95 95 95 94Municipal customer satisfaction per cent 85 85 85 87Structural fire contained to room or object of origin
per cent 70 70 70 73
Timeliness Emergency response times meeting benchmarks
per cent 90 90 90 91
Cost Total output cost $ million 217.5 202.6 200.0 187.5
Source: Department of Justice
162 Justice Service Delivery 2009-10
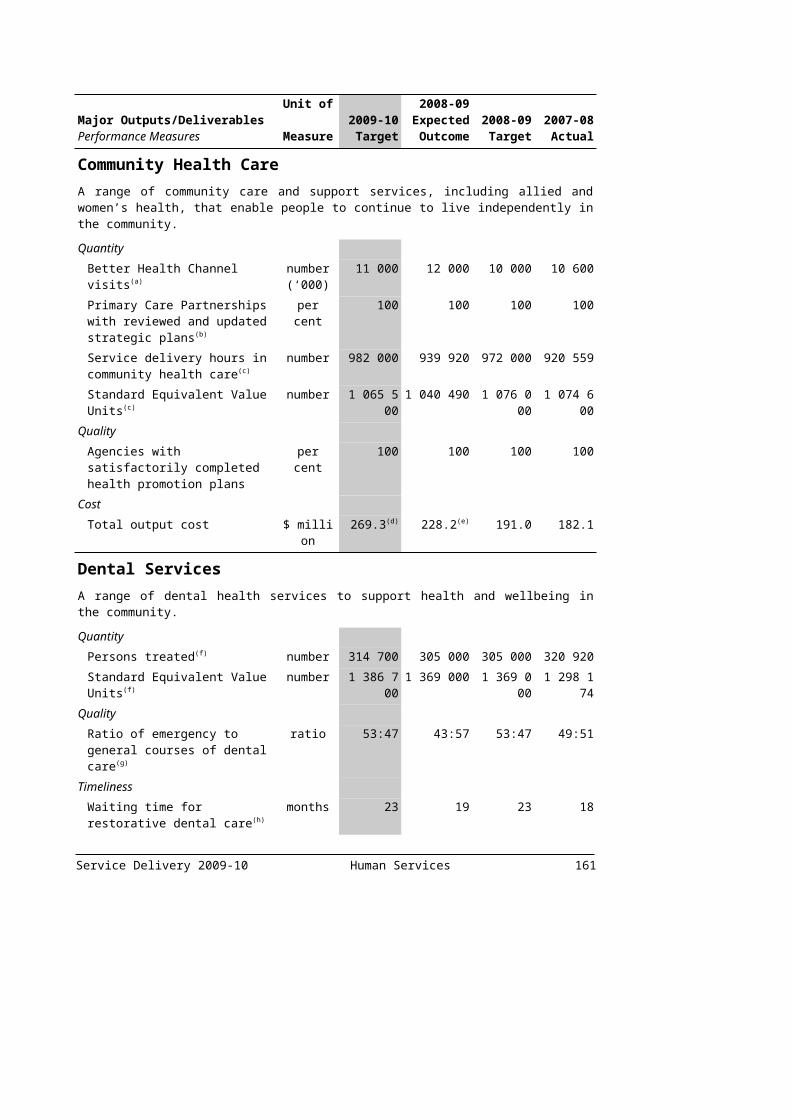
Enforcing Correctional OrdersThese outputs ensure that correctional dispositions of the courts and orders of the Adult Parole Board are implemented through the management of the State’s system of correctional facilities and programs for the containment and rehabilitation of prisoners as well as the community based supervision of offenders.
These outputs contribute to the key government outcome of building friendly, confident and safe communities.
Service Delivery 2009-10 Justice 163
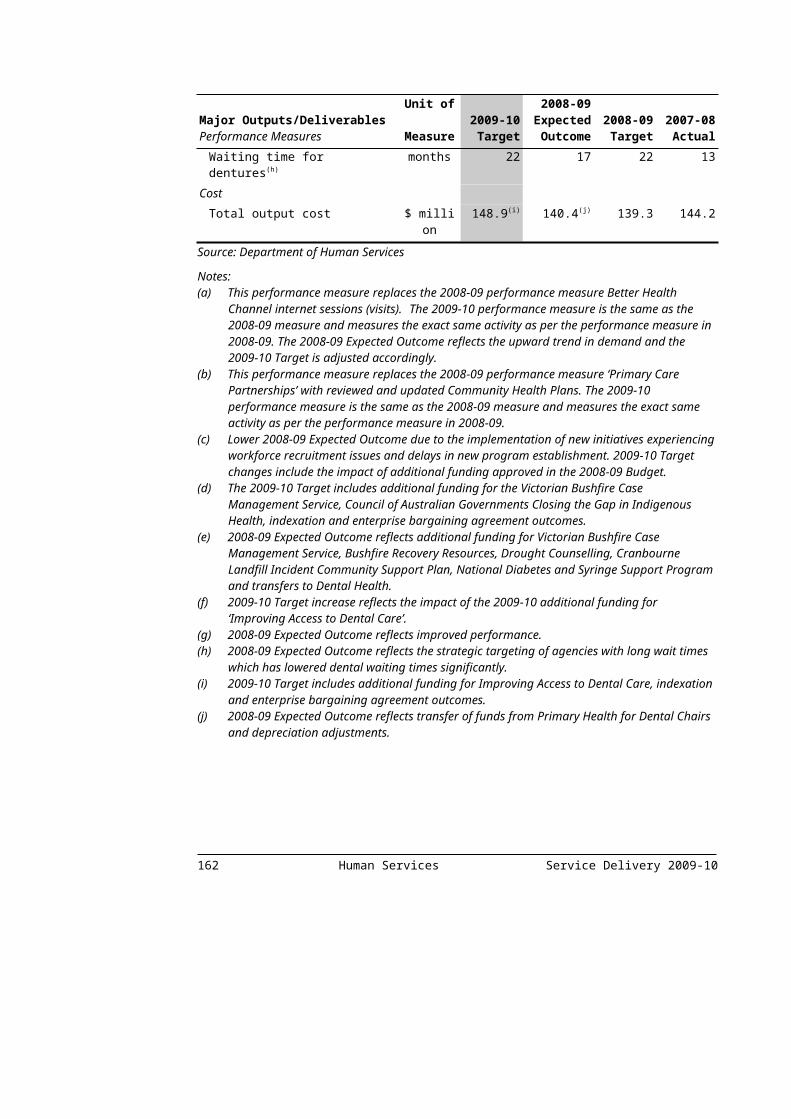
Major Outputs/DeliverablesPerformance Measures
Unit of Measure
2009-10 Target
2008-09 Expected Outcome
2008-09 Target
2007-08 Actual
Prisoner Supervision and SupportProvides constructive containment of prisoners.
Quantity Average daily prison utilisation rate of total prison capacity
per cent 90-95 93 90-95 92.3
Total annual daily average numbers of prisoners(a)
number 4 400-4 600
4 400 4 200-4 400
4 177
Quality Proportion of benchmark measures in prison services agreement achieved
per cent 90 91 90 93
Cost Total output cost $ million 511.1 479.9 504.9 438.1
Community Based Offender SupervisionProvides for supervision in the community of offenders on court orders.
Quantity Average daily offenders under community based supervision
number 5 810 5 820 5 810 5 536
Community work hours performed(b)
number 700 000-800 000
nm nm nm
Quality Community supervision orders successfully completed
per cent 65 64.1 68 62.6
Timeliness Offenders with a treatment or personal development program condition who have been appropriately referred to a program within set timelines
per cent 90 92 90 91.4
Cost Total output cost $ million 81.8 69.4 65.4 59.5
Source: Department of Justice
Notes:(a) The increase in the 2009-10 target can be attributed to a number of factors such as change in
sentencing practices for serious offences, reduction in the number of prisoners in police cells and a tougher breach policy by community corrections.
(b) This performance measure replaces the 2008-09 measure ‘Average daily offenders on community work-only orders’. The 2009-10 measure provides a more comprehensive and accurate account of Community Correctional Services (CCS) performance.
164 Justice Service Delivery 2009-10

Protecting ConsumersThe output ensures that consumers are protected through appropriate regulation and education that promotes awareness and compliance with consumer laws, specifically focusing on the needs of vulnerable and disadvantaged consumers, and providing flexible dispute resolution and fostering business and industry growth.
This output involves developing and administering consumer protection legislation, including legislation relating to misleading and deceptive conduct, unconscionable conduct and unfair contract terms, product safety, trade measurement and the sale of liquor. It informs people of their rights and responsibilities in the marketplace, promotes more informed and educated buying decisions, provides assistance to those seeking redress and promotes the compliance of business with the law. Business registers and licences are maintained to ensure minimum standards of transparency and competence and, where necessary, to influence and regulate trading behaviour.
This output contributes to the following key government outcomes:
building friendly, confident and safe communities;
more quality jobs and thriving, innovative industries across Victoria; and
a fairer society that reduces disadvantage and respects diversity.
Service Delivery 2009-10 Justice 165
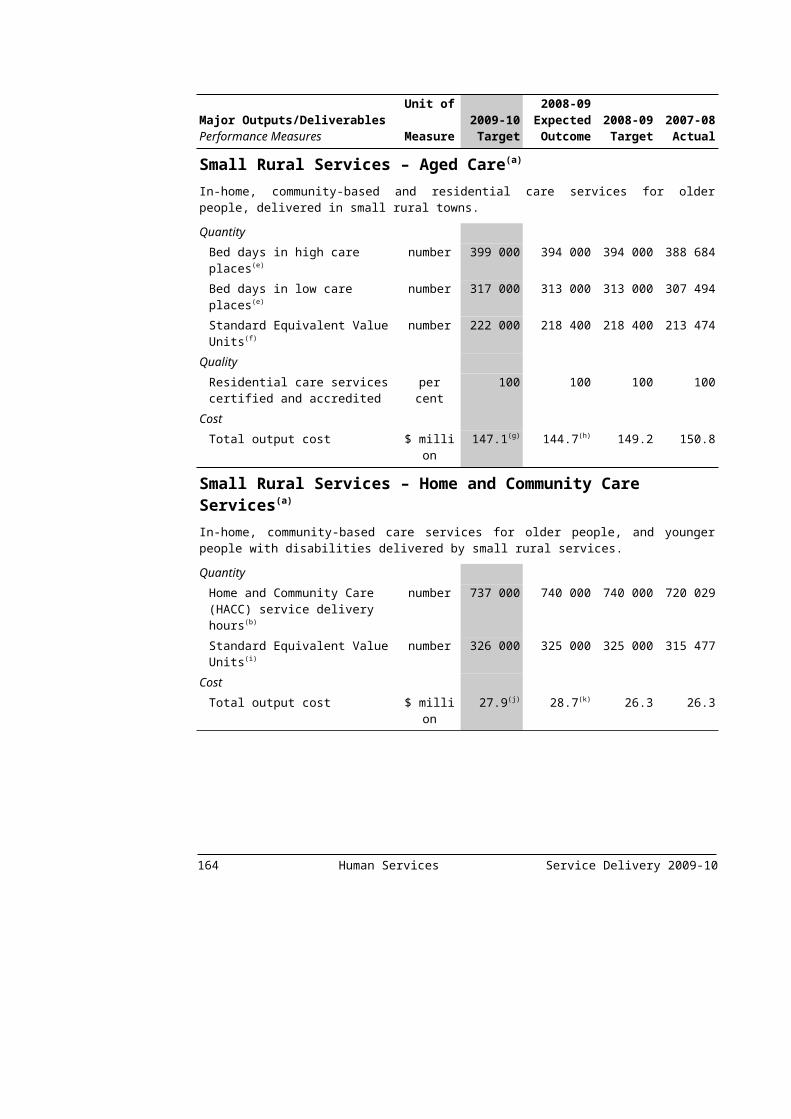
Major Outputs/DeliverablesPerformance Measures
Unit of Measure
2009-10 Target
2008-09 Expected Outcome
2008-09 Target
2007-08 Actual
Promoting and Protecting Consumer InterestsThis output provides information and advice to consumers and traders, and provides dispute resolution services, monitors and takes action to promote and enforce compliance with legislation, manages the delivery of trade measurement and product safety services, and registers or licenses certain occupations or industries (including liquor sales), business names, and community organisations.
Quantity Information and advice provided to consumers and traders(a)
number 598 000 598 000 598 000 nm
Inspections, compliance monitoring and enforcement activities(b)
number 33 250 7 750 7 750 8 108
Registration and licensing transactions(a)
number 600 000 600 000 600 000 628 520
Quality Customer satisfaction with services provided
per cent 90 90 90 89.7
Timeliness Services provided within agreed timeframes
per cent 90 90 90 93.5
Cost Total output cost(c) $ million 144.2 137.3 141.2 127.9
Source: Department of Justice
Notes:(a) This measure is comprised of activities delivered by Consumer Affairs Victoria and Responsible
Alcohol Victoria. Responsible Alcohol Victoria deliver services that are associated with liquor licensing that contribute to the Victorian Alcohol Action Plan.
(b) The increase in the 2009-10 target is attributed to activities delivered by Consumer Affairs Victoria and Responsible Alcohol Victoria, in particular activities associated with liquor licensing that contribute to the Victorian Alcohol Action Plan.
(c) The primary component of the cost for this output is Trust expenditure, in particular grants made to private organisations and other departments to provide services.
166 Justice Service Delivery 2009-10

Regulating Gaming and RacingThe Victorian community expects the best outcomes from gambling and racing activities for all Victorians. Accordingly, the output focuses on policy development, regulation, research and community education and the delivery of problem gambling services to achieve responsible, safe and sustainable gambling and racing environments.
The output provides strategic policy advice to the Minister for Gaming and leadership on the responsible management and regulation of the gaming sector. The output provides advice and support to the Minister for Racing in the interactions between government and the racing industry and supports the racing industry through a range of advisory, administrative and regulatory services, and selected initiatives.
It also advances awareness of and access to problem gambling services, particularly for the vulnerable and disadvantaged. Consultative processes are established to encourage input from a wide variety of people interested in the gambling sector, including stakeholders and the broader community.
The output also promotes the ongoing enhancement of the regulatory environment, the conduct of enforcement activities to ensure compliance with gambling laws and measures that assist and protect problem gamblers and those at risk of becoming problem gamblers. High standards of probity and transparency are maintained for gambling service providers and, to the extent possible, gaming services operate in a competitive environment.
This output contributes to the following key government outcomes:
building friendly, confident and safe communities;
a fairer society that reduces disadvantage and respects diversity;
more quality jobs and thriving, innovative industries across Victoria;
greater public participation and more accountable government; and
sound financial management.
Major Outputs/DeliverablesPerformance Measures
Unit of Measure
2009-10 Target
2008-09 Expected Outcome
2008-09 Target
2007-08 Actual
Gaming and Racing Management and RegulationProvides for:
monitoring and regulation of gambling activities in Victoria; and
leadership and strategic policy advice to the Minister for Gaming and the Minister for Racing on the responsible management and regulation of the gaming and racing industries.
Quantity Office of Gaming and Racing briefings processed(a)
number 900 900 700 823
Racing matters processed (including licences, permits, appeals, registrations and grant applications)(b)
number 160 650 800 1 994
Regulatory services including licensing and compliance activities(c)
number 29 024 25 962 26 606 24 068
Service Delivery 2009-10 Justice 167
Major Outputs/DeliverablesPerformance Measures
Unit of Measure
2009-10 Target
2008-09 Expected Outcome
2008-09 Target
2007-08 Actual
Quality Accuracy of regulatory compliance activities
per cent 100 100 100 100
Timeliness Gamblers Help Service clients who receive a service within five days of referral
per cent 90 95 90 95.5
Racing and gaming applications and initiatives completed within elapsed time benchmark
per cent 100 100 100 100
Regulatory compliance and licensing activities progressed within set timeframes
per cent 85 85 85 83.6
Cost Total output cost $ million 123.7 80.9 72.2 62.6
Source: Department of Justice
Notes:(a) The increase in the 2009-10 Target recognises the increased level of briefing activity experienced in
2008-09.(b) Bookmakers and bookmakers’ clerks registrations occur on a triennial basis. All current
registrations were renewed in 2007-08 and are not due for renewal again until 2010-11. The 2009-10 Target has been reduced to reflect this cycle. Some Racing activities will be performed on behalf of Racing by the Victorian Commission for Gambling Regulation (VCGR) at the commencement of 2009-10 and have been incorporated into the ‘Regulatory Services including Licensing and Compliance Activities’ measure.
(c) The increase in the 2009-10 Target is due to some racing activities being delivered on behalf of Racing by the VCGR.
168 Justice Service Delivery 2009-10

DEPARTMENT OF PLANNING AND COMMUNITY DEVELOPMENT
Departmental mission statementThe Department of Planning and Community Development (DPCD) leads and supports the development of liveable communities.
Significant challenges facing the Department in the medium term
The Department’s challenges include:
developing strategies to assist in the management of population growth and minimising the pressure it places on communities and services;
creating more liveable outer suburbs;
integrating planning decisions with the needs of the community and the services they require to expedite access to affordable housing and better services;
expanding the opportunities for our increasingly diverse populations to participate in social, civil and economic life;
putting residents front and centre to make our suburbs and towns better places to live;
promoting shared approaches to the use of community infrastructure and encouraging communities, councils and developers to share the costs of new services, facilities and infrastructure; and
responding to the increasing need to tackle climate change.
Major policy decisions and directionsThe Department has maintained a strong focus on progressing A Fairer Victoria through the realisation of service delivery reforms, building human capital and expanding economic opportunities for all Victorians.
In addition, the Department has an ongoing role in progressing the Government's vision for the state, Growing Victoria Together – a Vision for Victoria to 2010 and Beyond.
The Department also has responsibility for advising the Government on various critical issues including building policy, housing affordability, heritage, central activities districts, Melbourne 2030 and Melbourne @ 5 million, the Community Support Fund, community enterprise and volunteering, family violence, Aboriginal affairs, Men's sheds, youth, sport and recreation development, local government and disability.
Service Delivery 2009-10 Planning and Community Development 169

To deliver on these government priorities, the Department maintains a strong focus on these three strategic directions:
improved planning and design for sustainable communities;
increased opportunities for participation; and
better access to housing, infrastructure, jobs and services.
Ministerial portfoliosThe Department supports nine ministers across 11 portfolios – Planning, Community Development, Skills and Workforce Participation (Adult Community and Further Education), Veterans Affairs, Sport and Recreation, Youth Affairs, Women’s Affairs, Senior Victorians, Local Government, Community Services (Office for Disability), and Aboriginal Affairs.
Changes to the output structure The Department has made some changes to its 2009-10 Output structure. The changes are shown in the table below:
2009-10 Outputs Reason 2008-09 OutputsRefer to Department of Premier and Cabinet Output Statements
Machinery of government
Multicultural Affairs
Planning Output restructure Heritage ProtectionPlanning, Urban Design and Housing Affordability
Community Development Output restructure Neighbourhood Houses and Men's ShedsCommunity Strengthening
Adult Community and Further Education Title Change Adult and Community Education
Developing the Local Government Sector
Title Change Local Government Sector Development
As a result of a machinery of government change, the Victorian Multicultural Commission and Multicultural Affairs output have been transferred to the Department of Premier and Cabinet.
To provide the community with greater clarity on how the Department is assisting the Government to develop liveable communities, a departmental review has been conducted aimed at simplifying the output structure and better aligning the performance measures to the delivery of outputs. As a result of this review, the following outputs have been merged:
Heritage Protection and Planning, Urban Design and Housing Affordability into the new Planning output; and
Neighbourhood Houses and Men’s Sheds and Community Strengthening into the new Community Development output.
170 Planning and Community Development Service Delivery 2009-10
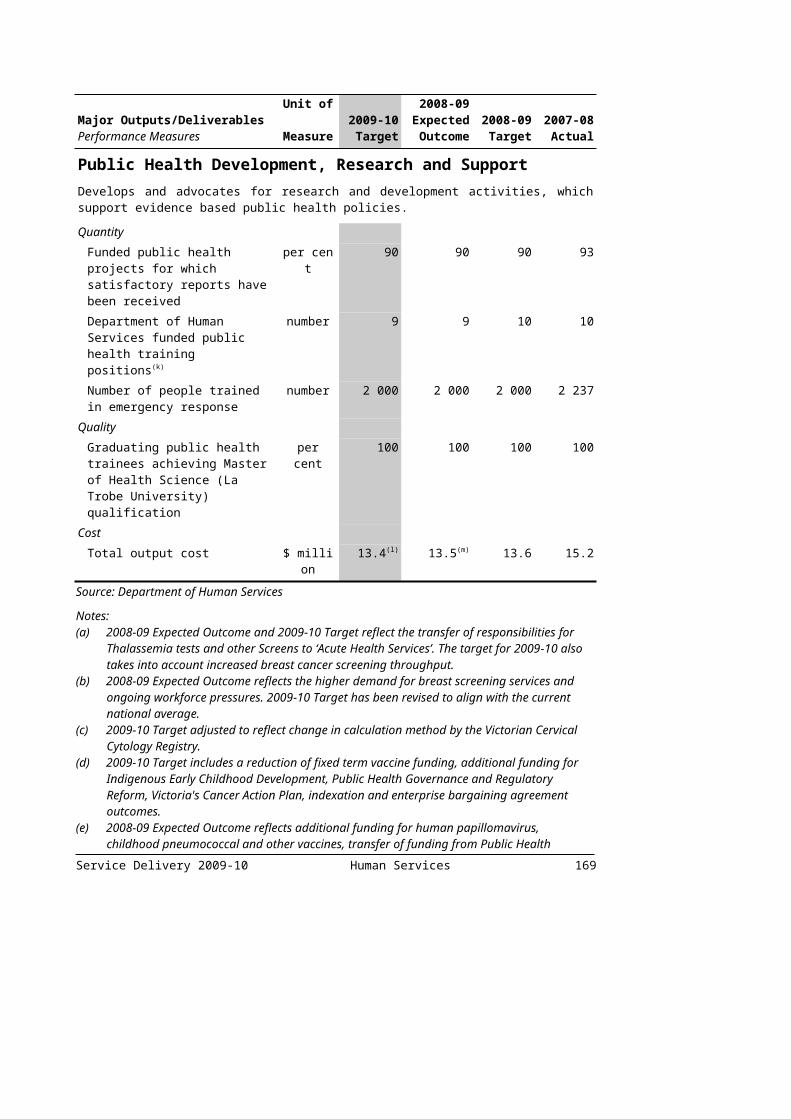
The Adult and Community Education output has been renamed Adult Community and Further Education to better align to the portfolio name. The Local Government Sector Development output has been renamed Developing the Local Government Sector to more clearly reflect the activity of this output.
The discontinued performance measures are detailed in Appendix C.
The following table summarises the total output cost. It has been prepared on the basis of the Department’s 2009-10 output structure and therefore allocations may differ from the Department’s previously published budget.
Table 3.5 Output Structure ($ million)
2008-09 Budget (a)
2008-09 Revised (a)
2009-10 Budget
Variation (b)
%Planning for liveable communities 151.6 142.2 152.2 0.4Opportunities for participation (c) 187.6 201.7 200.0 6.6Access to housing, infrastructure, jobs and
services (d) 97.8 101.2 103.5 5.8
Total (e) 437.0 445.1 455.7 4.3Source: Department of Planning and Community Development
Notes:(a) Both the 2008-09 Budget and 2008-09 Revised columns reflect the 2009-10 Output structure,
adjusted on a comparative basis for machinery of government changes and other output structure changes. As such, they incorporate changes made to the Department’s output structure in 2009-10, restated for comparative purposes, and will differ from Budget Paper No. 4, Chapter 3, Departmental Financial Statements.
(b) Variation between 2008-09 Budget and 2009-10 Budget.(c) This includes the outputs formerly reported under People in Liveable Communities (except the
Multicultural Affairs output) and the Sport and Recreation Development output, which has resulted in the variance between the 2008-09 and 2009-10 Budgets.
(d) This includes the new Community Development and Developing the Local Government Sector outputs.
(e) Total output expense may not equate to the total expense reported in Budget Paper No. 4, Chapter 3, Departmental Financial Statements due to additional expenses in Budget Paper No. 4 that are not included in departmental output costs.
The following section provides details of the outputs to be provided to the Government, including performance measures and costs for each output. Total expenditure for the Department can be found in Budget Paper No. 4, Chapter 3, Departmental Financial Statements.
Service Delivery 2009-10 Planning and Community Development 171
Planning for liveable communitiesThese outputs:
manage growth and facilitate land supply, appropriate land development and usage;
support the development of diverse and affordable housing;
protect and manage Victoria’s cultural and natural heritage;
streamline regulation and systems; and
integrate urban development and community planning.
These outputs contribute to the achievement of the Growing Victoria Together goals of:
more quality jobs and thriving, innovative industries across Victoria;
growing and linking all of Victoria;
protecting the environment for future generations;
building friendly, confident and safer communities; and
a fairer society that reduces disadvantage and respects diversity.
Major Outputs/DeliverablesPerformance Measures
Unit of Measure
2009-10 Target
2008-09 Expected Outcome
2008-09 Target
2007-08 Actual
Planning(a)
Through this output, the Department will implement government strategies for sustainable metropolitan and regional development, including the implementation of Melbourne 2030. It will also deliver associated urban design and development programs and coordinate analysis and cross portfolio action towards the Government’s affordable housing objectives. The Department will also develop regulatory and statutory planning, administer the planning system and statutory responsibilities of the Minister for Planning, support heritage conservation projects and assistance to local governments and community organisations and conduct environment effects assessments.
Quantity Complete annual Urban Development Program analysis of supply, demand and adequacy of residential and industrial land(b)
number 1 1 1 1
Co-ordination and implementation of Victoria’s Heritage Strategy(c)
per cent 100 nm nm nm
Development Assessment Committees (DACs) established in priority activity centres to make decisions on significant development applications(c)
number 5 nm nm nm
Development facilitation priority projects considered(d)
number 50 40 40 40
Development of model to support housing growth requirements in metropolitan region(e)
per cent 100 nm nm nm
172 Planning and Community Development Service Delivery 2009-10
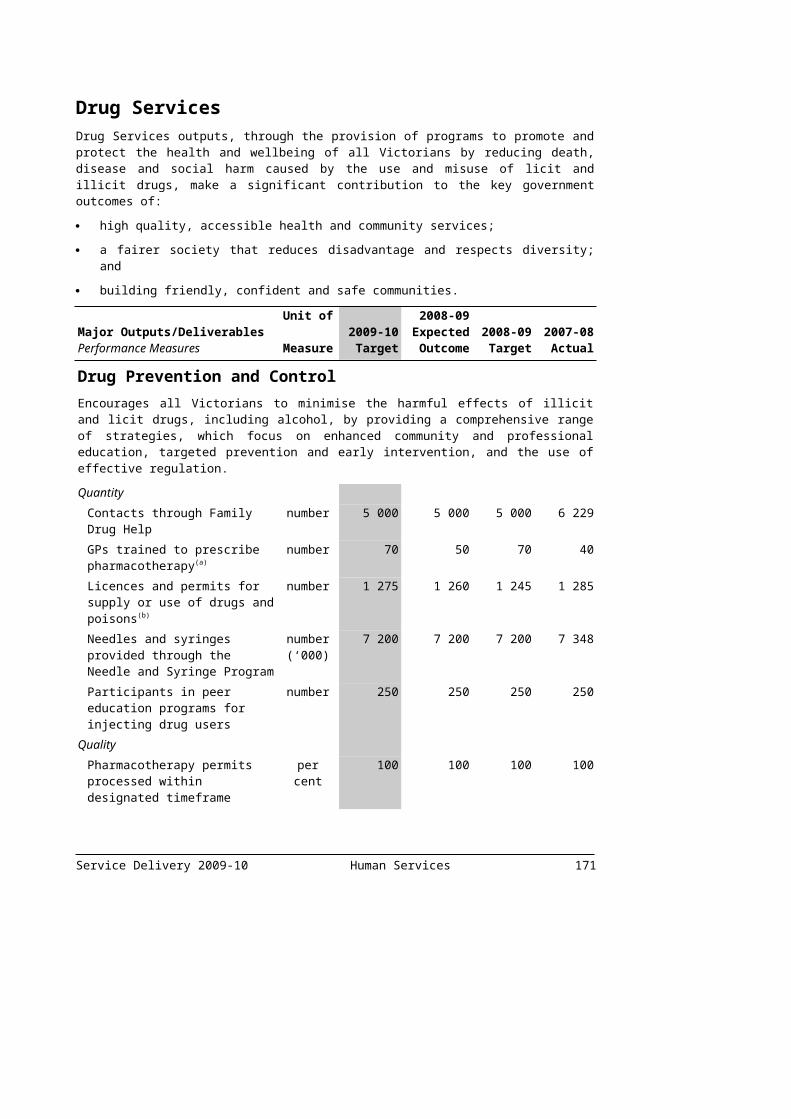
Major Outputs/DeliverablesPerformance Measures
Unit of Measure
2009-10 Target
2008-09 Expected Outcome
2008-09 Target
2007-08 Actual
Environmental effects assessments
number 6 6 6 1
Government departments engaged in policy development for housing affordability
number 4 4 4 nm
Implement program leading to development of regional land use plans (RLUP) as part of overall government regional planning initiative(c)
per cent 100 nm nm nm
Increased housing density in established areas
per cent 10 10 10 nm
Places or objects assessed for the Victorian Heritage Register(c)
number 80 nm nm nm
Regional strategies commenced number 2 2 2 nmResearch bulletins on population projections and residential land published(f)
number 5 8 8 13
Quality Appeals lodged against heritage permits
per cent 6 <6 <6 <5
Central Activities District projects delivered against agreed project implementation plans(g)
per cent 80 nm nm nm
Changes made to Victoria’s zoned land consider formal capacity assessments and constraints and incorporate local government, stakeholder and community consultation programs(c)
per cent 85 nm nm nm
Creating Better Places and Expert Assistance Program funding committed to eligible projects(h)
per cent 100 nm nm nm
Establish boundaries for five activity centres and development frameworks which take into account input from councils, the department and the community, and advice from the advisory committee(c)
per cent 100 nm nm nm
Heritage certificates issued accurately and satisfactorily
per cent 99 99.8 99.5 99.8
Regional stakeholders effectively engaged in informing and shaping contents of RLUP(c)
per cent 85 nm nm nm
Service Delivery 2009-10 Planning and Community Development 173
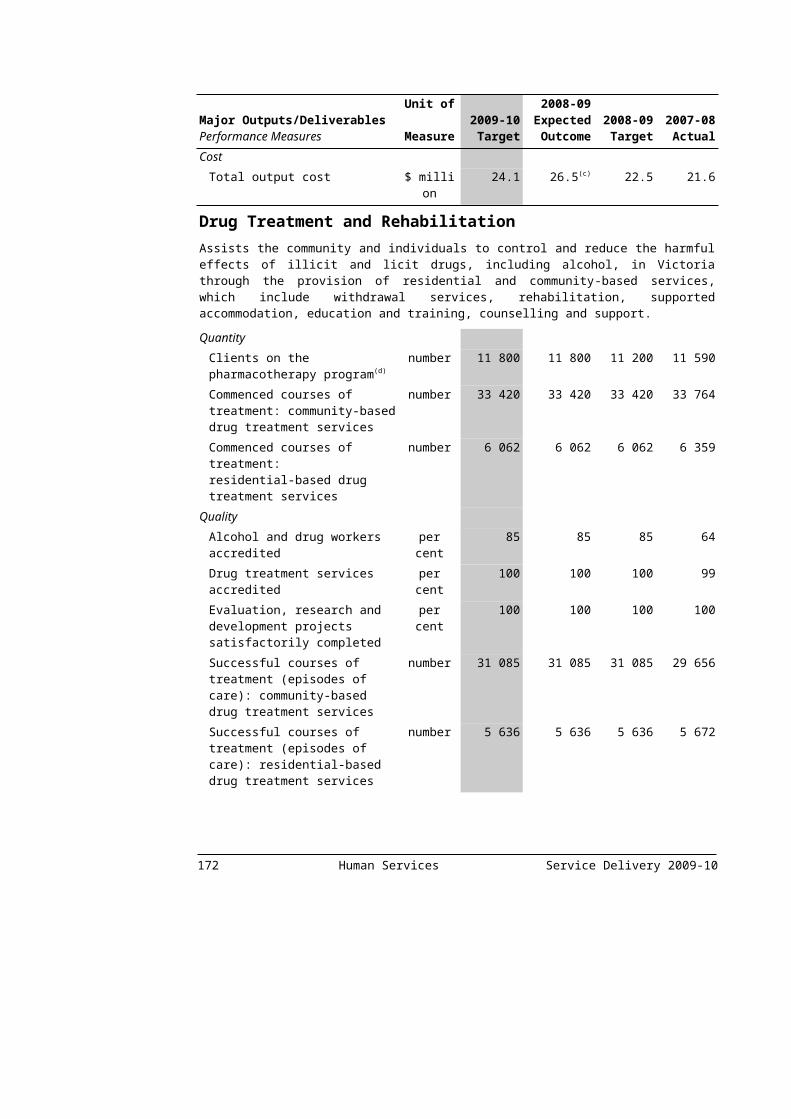
Major Outputs/DeliverablesPerformance Measures
Unit of Measure
2009-10 Target
2008-09 Expected Outcome
2008-09 Target
2007-08 Actual
Timeliness Amendments completed in 30 days
per cent 80 80 80 nm
Authorisations completed in 15 days
per cent 80 80 80 nm
Completion of analysis of residential and industrial land stocks for Urban Development Program (UDP) Report
date Jun 2010
Jun 2009
Jun 2009
Jun 2008
DACs established in Camberwell, Coburg, Doncaster Hill, Central Geelong and Preston by December 2009(c)
per cent 100 nm nm nm
Government response to expert group recommendations for the Future Farming strategy report completed by May 2010(c)
per cent 100 nm nm nm
Heritage grant payments are made within the timeframe specified in the terms and conditions of the funding agreements(c)
per cent 100 nm nm nm
Owners notified of accepted nominations to the Victorian Heritage Register within 14 days(c)
per cent 95 nm nm nm
Regional UDP Pilot Projects underway(c)
date Jul 2009
nm nm nm
Review of the Planning and Environment Act 1987 to ensure the Act responds to contemporary planning issues and simplifies current requirements completed by 30 December 2009(c)
per cent 100 nm nm nm
State population projections reviewed and updated (bi-annual)
date Feb 2010
Feb 2009
Feb 2009
Feb 2008
Two RLUPs are commenced by December 2009(c)
per cent 100 nm nm nm
Cost Total output cost $ million 152.2 142.2 151.6 134.1
Source: Department of Planning and Community Development
Notes:(a)This output combines the former Heritage Protection and Planning, Urban Design and Housing
Affordability outputs from the 2008-09 output structure.(b) This performance measure replaces the 2008-09 performance measures ‘Urban Development
Program (UDP)’ and ‘UDP prepared’. The 2009-10 performance measure is the same as the 2008-09 measure except for additional wording included and measures the same activity as per the performance measure in 2008-09.
174 Planning and Community Development Service Delivery 2009-10
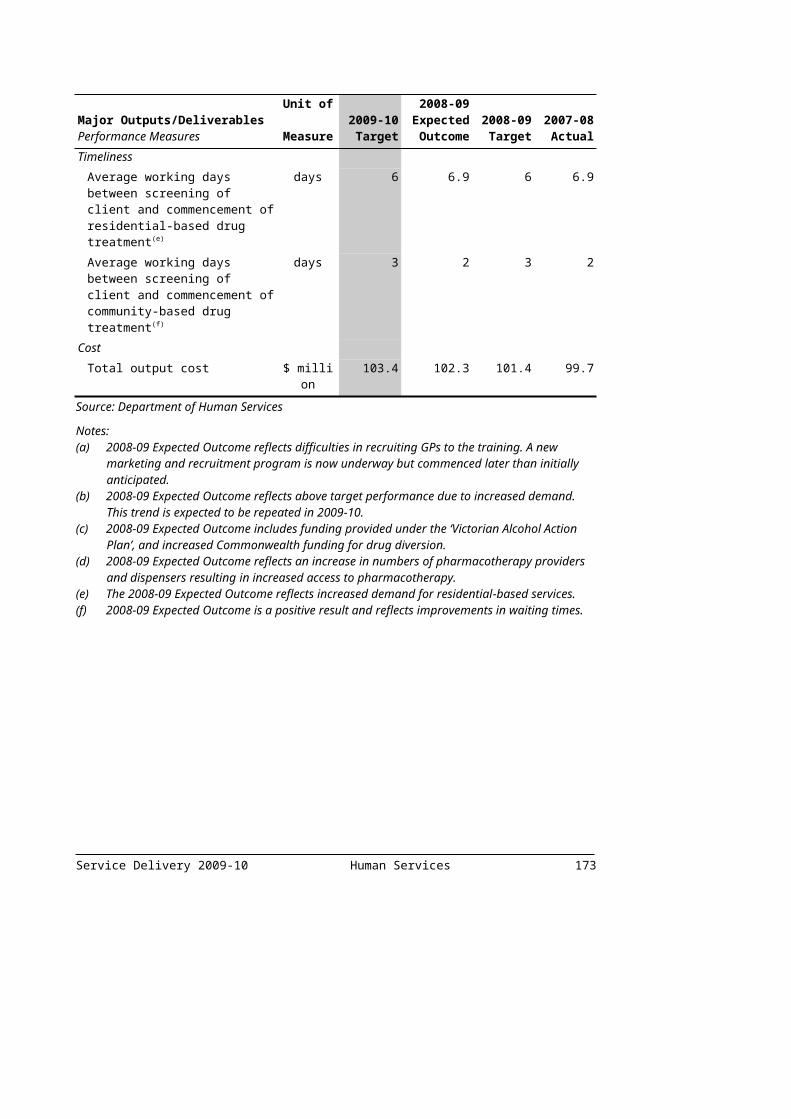
Notes (continued):(c) New performance measure introduced as a result of a departmental review to ensure that the
Department's 2009-10 performance measures are better aligned and appropriately allow for the assessment of the department's production and delivery of outputs.
(d) This performance measure replaces the 2008-09 measure 'Development facilitation of priority projects'. It has been reworded as a result of a departmental review. The 2009-10 Target has increased to reflect the Government’s commitment to development facilitation of priority projects.
(e) This performance measure replaces the 2008-09 measure 'Metropolitan councils housing growth requirements established'. It has been reworded as a result of a departmental review.
(f) This performance measure replaces the 2008-09 measure 'Research bulletins published'. It has been reworded to better reflect the nature of the measure. The 2009-10 Target has been reduced from the previous year as it no longer includes the general research publication, Research Matters. This quarterly publication has been replaced by an annual Population Bulletin that is more targeted.
(g) New performance measure introduced in 2009-10 to reflect the Government’s commitment to the Central Activities District projects.
(h) New performance measure introduced in 2009-10 to reflect the Government’s commitment to the Creating Better Places and Expert Assistance program.
Service Delivery 2009-10 Planning and Community Development 175

Opportunities for ParticipationThese outputs:
invest in and provide accessible, targeted support to specific population groups and priority places;
increase inclusion and access for our diverse communities; and
increase sport and recreation, adult education, skills development and workforce participation opportunities.
These outputs contribute to the achievement of the Growing Victoria Together goals of:
building friendly, confident and safer communities;
a fairer society that reduces disadvantage and respects diversity;
greater public participation and more accountable government;
high quality education and training for lifelong learning; and
more quality jobs and thriving, innovative industries across Victoria.
Major Outputs/DeliverablesPerformance Measures
Unit of Measure
2009-10 Target
2008-09 Expected Outcome
2008-09 Target
2007-08 Actual
Youth AffairsDevelop and coordinate whole of government information and advice on issues of youth policy. Develop and manage targeted programs and services for young people aged between 12 and 25 years.
Quantity FReeZA: event attendance(a) number 130 000 145 000 130 000 150 664Number of organisations funded through Youth Participation and Access Program and Mentoring and Capacity Building Initiative(b)
number 112 nm nm nm
Number of young people attending FreeZA Central intensive workshops
number 500 500 500 510
Young people participating in the Advance Youth Development Program(c)
number 10 000-10 250
14 129 10 000-10 250
13 509
Youthcentral website total page impressions(d)
number (‘000)
1 400-1 600
1 700 1 200-1 400
1 670
Quality Young people completing the Advance Youth Development Program
per cent 75 75 75 93
176 Planning and Community Development Service Delivery 2009-10

Major Outputs/DeliverablesPerformance Measures
Unit of Measure
2009-10 Target
2008-09 Expected Outcome
2008-09 Target
2007-08 Actual
Timeliness Youth Participation and Access Program: Grants acquitted within the timeframe specified in the terms and conditions of the funding agreement
per cent 90 100 >90 100
Cost Total output cost $ million 14.7 14.7 15.4 14.7
Women’s PolicyProvide leadership in strategic whole of government policy advice on key issues of concern to women by working across government to inform policies, programs and services available to women.
Quantity Women participating in consultations(e)
number 600 600 600 500
Quality Funded projects that meet or exceed project outcomes(f)
per cent 90 nm nm nm
Participant satisfaction with consultation forums
per cent 85 85 85 82
Queen Victoria Women’s Centre occupancy rate
per cent 85 >85 >85 100
User satisfaction with diversity register(f)
per cent 85 nm nm nm
Timeliness Projects delivered according to agreed outputs and milestones
per cent 90 90 90 90
Cost Total output cost $ million 4.4 5.1 4.6 4.3
DisabilityDisability involves advocating for people in communities through the development of policies and the provision of services that emphasise an integrated approach to government service provision.
Quantity Number of agencies supported to develop Disability Action Plans
number 150 150 150 nm
Number of Disability Advocacy clients(g)
number >1900 nm nm nm
Number of meetings of the Victorian Disability Advisory Council held
number 6 6 6 10
Service Delivery 2009-10 Planning and Community Development 177

Major Outputs/DeliverablesPerformance Measures
Unit of Measure
2009-10 Target
2008-09 Expected Outcome
2008-09 Target
2007-08 Actual
Quality Client satisfaction with advice provided
per cent 100 100 100 100
Participant satisfaction with community engagement consultation
per cent 85 85 85 83
TimelinessProjects complete within required timelines
per cent 100 100 100 100
Cost Total output cost(h) $ million 7.2 11.4 11.6 7.0
Seniors and VeteransWork in partnership with community, business and across government to provide support for the diverse needs and interests of older Victorians. Through the Veterans Unit, strengthen community recognition of veterans’ achievements.
Quantity Digitised veterans’ histories completed
number 50 50 50 nm
New University of the Third Age (U3A) memberships
number 1 800-2 200
1 800-2 200
1 8002 200
1 873
Restoring community war memorials grants: projects approved(i)
number 35 35 40 34
Seniors activities grants programs: number approved
number 110-130 110-130 110-130 140
Premier’s spirit of ANZAC prize: number of entries received(j)
number 200 132 >200 183
Quality Commemorative and educative projects that meet or exceed agreed outcomes(k)
per cent 100 100 100 100
Eligible seniors in the seniors card program
per cent 95 95 95 95
Senior satisfaction with Victorian Seniors Festival events
per cent 90 90 90 90
Timeliness Commemorative and Education program: Grants acquitted within the timeframe specified in the terms and conditions of the funding agreement
per cent 100 100 100 100
Cost Total output cost $ million 10.2 10.7 11.5 11.1
178 Planning and Community Development Service Delivery 2009-10

Major Outputs/DeliverablesPerformance Measures
Unit of Measure
2009-10 Target
2008-09 Expected Outcome
2008-09 Target
2007-08 Actual
Indigenous Community and Cultural DevelopmentWork in partnership with Victorian Indigenous communities and their organisations to build their capacity to deliver programs and services. Develop whole of government policies promoting partnerships between Indigenous communities and government agencies. Increase understanding and respect for Indigenous culture within the broader community and promote Indigenous community control of the protection and management of Indigenous cultural heritage.
Quantity Cultural heritage management capacity building activities undertaken with community groups(l)
number 16 18 18 18
Governance training programs implemented(m)
number 7 7 7 8
Increase in membership of Stolen Generations Victoria(n)
per cent 5 nm nm nm
Participants who complete governance training(f)
number 120 nm nm nm
Quality Governance training initiatives participant completion rate(o)
per cent 80 nm nm nm
Local Indigenous representation groups completed stage one of community plans(p)
per cent 80 nm nm nm
Proportion of Indigenous community organisations receiving funding from multiple departments on a single funding agreement(q)
per cent 15 10 10 5
Timeliness Cultural heritage management Plans assessed by Aboriginal Affairs Victoria (AAV) within legislative timeframes(r)
per cent 100 nm nm nm
Cost Total output cost(s) $ million 19.8 25.3 26.8 24.7
Service Delivery 2009-10 Planning and Community Development 179
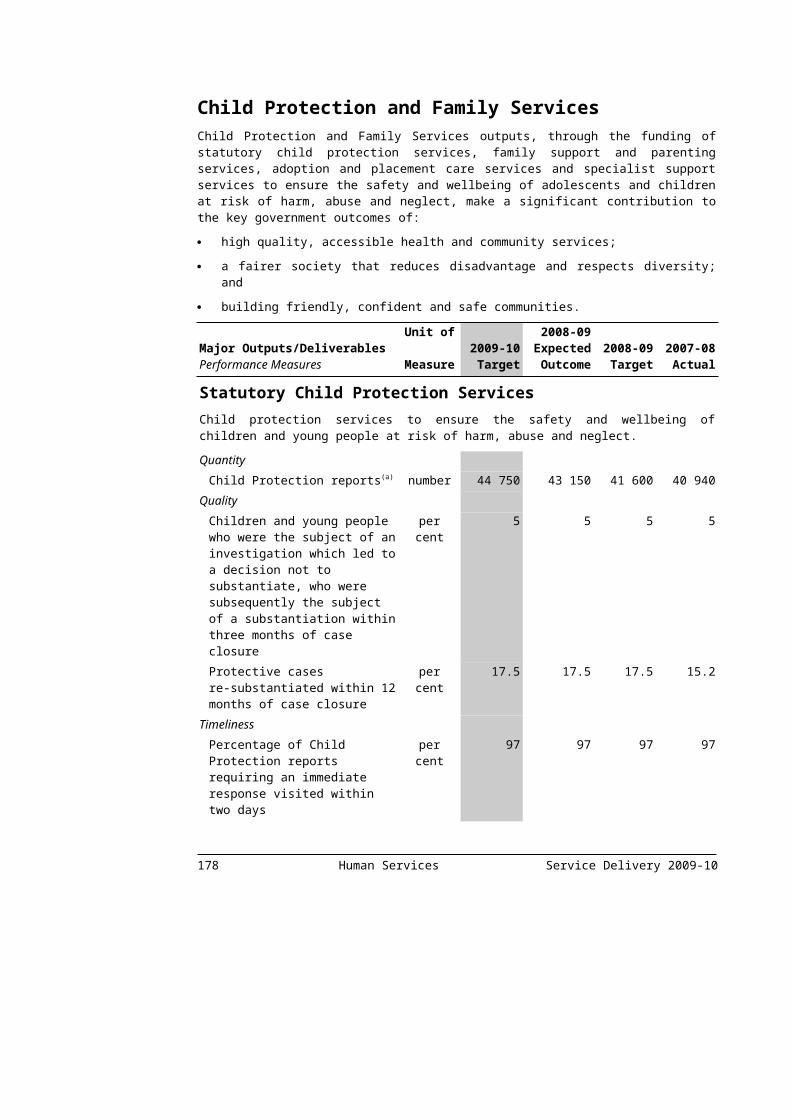
Major Outputs/DeliverablesPerformance Measures
Unit of Measure
2009-10 Target
2008-09 Expected Outcome
2008-09 Target
2007-08 Actual
Adult Community and Further Education(t)
Develop and implement strategies designed to further enhance participation in adult community education (ACE) across Victoria and strengthen the contribution that community-based adult education organisations make to education and training. Education and training is provided in community settings and Adult Education Institutions (AEI’s), including Adult Multicultural Education Services and the Centre for Adult Education in accordance with the priorities set by government and in response to community demand. Learning opportunities are promoted and provided by the Adult, Community and Further Education Board (ACFEB) that supports and strengthens the capacity of local communities to respond to and meet educational needs.
Quantity Annual delivery of student contact hours government funded through the ACFEB – ACE organisations and AEIs
number (million)
5.74 5.95 5.65 nm
Annual Vocational Education and Training (VET) module enrolments government funded through the ACFEB – ACE organisations and AEIs(u)
number 170 000 178 550 150 000 nm
Number of government funded Skills Deepening level course enrolments in ACFEB registered ACE organisations and AEIs(v)
number 600 nm nm nm
Number of pre-accredited module enrolments government funded through the ACFEB – ACE organisations and AEIs(v)
number 48 000 nm nm nm
Student contact hours government funded through the ACFEB to 15 to 24 year olds – ACE organisations and AEIs(w)
number (million)
1.67 nm nm nm
Student contact hours government funded through the ACFEB to 16 to 64 year olds who do not have a Year 12 level of education (or equivalent) – ACE organisations and AEIs
number (million)
2.4 2.72 2.4 nm
Quality Minimum target for ACE and AEI students funded through Youth Pathways Program
number 500 500 500 nm
Student satisfaction with ACE courses meeting overall needs
per cent 80 83.9 80 85.6
Successful completions as measured by module load completion rate – ACFEB funded ACE organisations and AEIs
per cent 73 73 73 nm
180 Planning and Community Development Service Delivery 2009-10

Major Outputs/DeliverablesPerformance Measures
Unit of Measure
2009-10 Target
2008-09 Expected Outcome
2008-09 Target
2007-08 Actual
Cost Total output cost(x) $ million 57.7 57.2 50.1 60.3
Sport and Recreation DevelopmentProvide strategic leadership for the sport and recreation sector. Provide funding, coordination and facilitation services to develop and extend sport and recreation opportunities in Victoria, through improved facilities and increased community participation.
Quantity Aquatic facility grants: number approved
number 10-15 12 10-15 18
Athletes on Victorian Institute of Sport (VIS) scholarships
number >350 390 >350 408
Combat sports licences, registrations and permits issued(y)
number 400-500 450 400 468
Community Facility Grants: number approved(z)
number >145 nm nm nm
International teams/sports: sports visits facilitated
number 100-200 160 150 185
Key sport and recreation organisations undertaking projects or activities, or providing services or strategic advice(aa)
number >85 nm nm nm
Major events facilitated(ab) number 10-12 15 8-10 10Projects related to state level facilities in progress(ac)
number 8-12 nm nm nm
Victorian Institute of Sport scholarship holders on national teams/squads
per cent >55 65 >55 56
Quality Completion of an approved business plan and ongoing operational and budget reports for each event(ad)
per cent 100 nm nm nm
Government branding and promotion requirements undertaken at each event
per cent 100 100 100 100
Outdoor recreation camps contract management key performance indicators met
per cent >90 95 >90 95
Timeliness Awards conducted date Aug-Nov
20096 Oct 2008 Aug-Nov
200819 Nov
2007Commencement of urgent capital works at State Sports Centres Trust’s facilities(ae)
date qtr 2 nm nm nm
Service Delivery 2009-10 Planning and Community Development 181
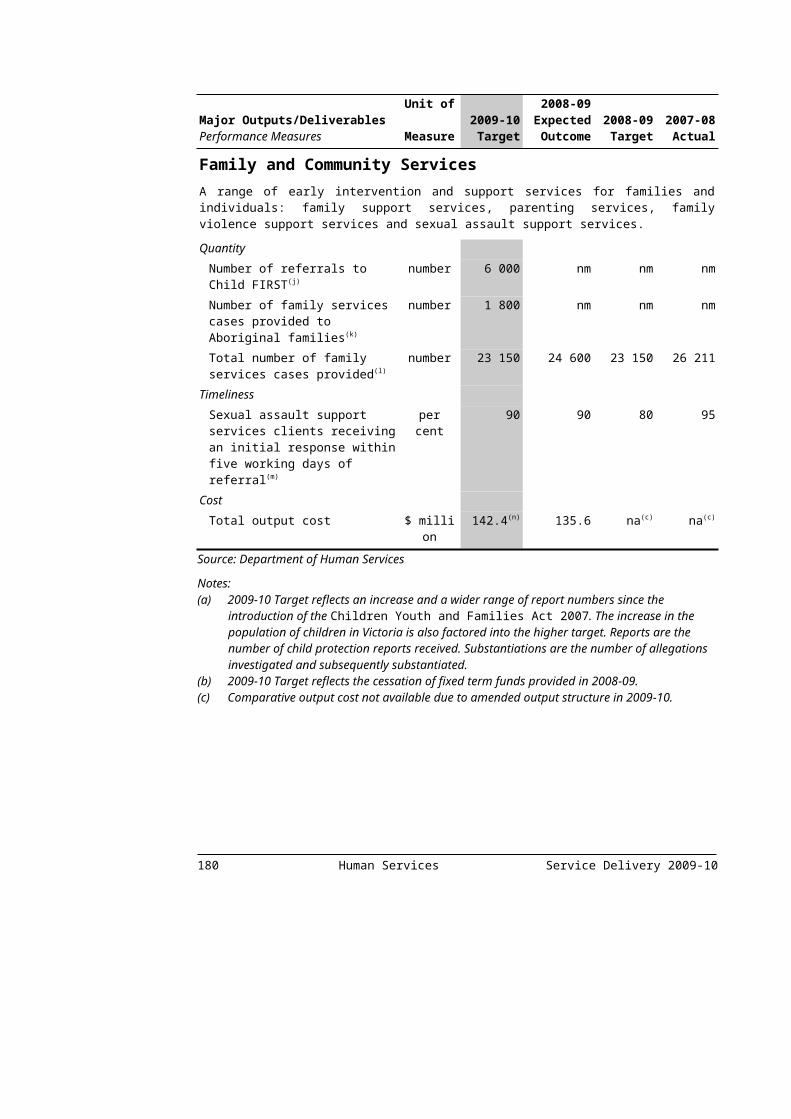
Major Outputs/DeliverablesPerformance Measures
Unit of Measure
2009-10 Target
2008-09 Expected Outcome
2008-09 Target
2007-08 Actual
Completion of appropriate post event reports and formal economic impact assessment (where required) at the completion of each event
per cent 100 100 100 100
Construction continuing at the State sports facility project in Albert Park(af)
date qtr 4 nm nm nm
Rectangular Pitch Stadium – Completion of works(ag)
date qtr 3 nm nm nm
Cost Total output cost(ah) $ million 85.9 77.4 67.6 93.8
Source: Department of Planning and Community Development
Notes:(a) The 2008-09 Target has been exceeded due to a greater than expected number of young people
participating in larger community festivals.(b) New performance measure replaces the 2008-09 performance measure ‘Youth Participation and
Access Program Grants’ and incorporates the number of organisations funded through the Mentoring and Capacity Building Initiative.
(c) The 2008-09 Target has been exceeded as more young people participated in the program than the number of young people for which funding was provided.
(d) The 2008-09 Target has been exceeded and therefore increased for 2009-10 as it is expected there will be continued growth in the popularity of the youthcentral website due to the success of the sites search engine optimisation and strong general growth in the use of the internet by young people.
(e) The number of women participating in consultations in 2007-08 was reduced to 500 due to the Office of Women's Policy not undertaking online consultation.
(f) New performance measure added in 2009-10 as a result of the internal review to ensure that the Department’s 2009-10 performance measures are better aligned and appropriately allow for the assessment of the department’s production and delivery of outputs.
(g) New performance measure introduced as a result of a machinery of government change, transferring responsibility for the Disability Advocacy Program from the Department of Human Services.
(h) The Access for All Abilities (AAA) program recurrent budget of $3.6 million has transferred from the Office for Disability to Sport and Recreation for the 2009-10 Budget.
(i) The 2008-09 Expected Outcome is lower than the Target as the value of individual grants has increased which will reduce the total number of grants within a limited budget. As a result of a departmental review, the 2009-10 Target has been lowered to reflect the smaller number of larger grants expected and the performance measure slightly reworded.
(j) The 2008-09 Expected Outcome is lower than the Target due to a limited uptake of applications for the Spirit of ANZAC prize. This will be addressed through increased and enhanced direct marketing in 2009-10.
(k) New performance measure replaces the 2008-09 performance measure ‘Commemorative and educative initiatives for which satisfactory reports have been received’. The 2009-10 performance measure is the same as the 2008-09 measure but has been reworded to focus on agreed outcomes.
(l) New performance measure replaces the 2008-09 performance measures 'Heritage projects jointly developed and carried out with Aboriginal communities' and 'Heritage training activities addressing community identified priority issues'. The 2009-10 performance measure is the same as the 2008-09 measures but has been reworded to better describe the focus of these activities. The 2009-10 Target is therefore higher than previously as it combines both activities.
182 Planning and Community Development Service Delivery 2009-10
Notes (continued):(m) New performance measure replaces the 2008-09 performance measure 'Governance training
programs supported’. The 2009-10 performance measure is the same as the 2008-09 measure but has been reworded to better describe the focus of these activities.
(n) New performance measure for 2009-10 to reflect the Government's ongoing commitment regarding the Stolen Generations.
(o) New performance measure replaces the 2008-09 performance measure ‘Increase in board members undertaking governance training’ to better reflect a focus on the completion of governance training.
(p) New performance measure replaces the 2008-09 performance measure 'Local Indigenous groups developing local plans'. This performance measure has changed to reflect the completion of stage one of the three stage community planning process undertaken by the Local Indigenous Network.
(q) The Target for this performance measure will increase to 15 per cent for 2009-10 as departments progressively use single funding agreements for funding of Indigenous community organisations.
(r) New performance measure replaces the 2008-09 quantity performance measure ‘Verified records added to heritage database’ as it provides an improved measure of integrated planning for land use development and the timeliness of response to stakeholders
(s) The decrease in total output cost from the 2008-09 Expected Outcome to the 2009-10 Target relates to a number of programs lapsing at the end of 2008-09. However, these programs have received additional funding as part of the 2009-10 Budget from the Community Support Fund.
(t) This output was named Adult and Community Education under the 2008-09 output structure.(u) The 2008-09 Expected Outcome exceeds the Target due to changes in patterns of participation and in
length of modules delivered. The Target for 2009-10 has been increased to reflect an upward trend in this measure.
(v) New performance measure introduced in 2009-10 to describe the elements of the skills policy statement that will be implemented during 2009.
(w) The 2008-09 performance measure and Target have been amended to include 15 year olds because of the inclusion of 15 year olds in the ACE Youth Guarantee program.
(x) The 2009-10 Total Output Cost may increase due to new grant initiatives and funding from other state government departments throughout 2009-10 that are not included in the projected BP3 Output Target.
(y) The 2008-09 Expected Outcome exceeds the Target due to additional boxing and combat sport events and competitions.
(z) New performance measure for 2009-10 combines the 2008-09 measures 'Community Sporting Facility Grants: number approved' and 'Country football/netball grants: number approved’.
(aa) New performance measure for 2009-10 combines the 2008-09 measures 'Community sport and recreation organisations undertaking projects/activities' and 'Key industry organisations providing strategic advice to Government’.
(ab) The 2008-09 Expected Outcome exceeds the Target due to additional events won by the Victorian Major Events Company. The 2009-10 Target reflects a higher expected number of events.
(ac) New performance measure for 2009-10 combines the 2008-09 measures ‘State level facilities: under design or construction’ and ‘State level facilities: under investigation’.
(ad) New performance measure for 2009-10 combines the 2008-09 measures ‘Completion of ongoing operational and budget reports for each event’ and ‘Delivery of an approved business plan for each event incorporating appropriate operational, marketing plan and financial information’.
(ae) New performance measure introduced in 2009-10 to reflect the Government’s commitment to sporting facilities.
(af) New performance measure introduced to reflect the Government's commitment to improving major sports precincts.
(ag) New performance measure introduced in 2009-10 to better reflect the progress of this project.(ah) The variance between the Sport and Recreation Development 2008-09 Target and 2008-09 Expected
Outcome is due to additional funding received post Budget for drought relief for community sport and recreation and synthetic surfaces programs, as well as Major Events initiatives. The variance between the 2008-09 Expected Outcome and 2009-10 Target is due to additional funding for major events projects to be delivered by the Department in 2009-10.
Service Delivery 2009-10 Planning and Community Development 183

Access to Housing, Infrastructure, Jobs and ServicesThese outputs:
increase civic, cultural and voluntary participation opportunities;
improve opportunities and capacity for people and communities to have a say in decisions and directions that affect their lives; and
support and develop strong and sustainable community networks, organisations and local governance.
These outputs contribute to the achievement of the Growing Victoria Together goals of:
growing and linking all of Victoria;
high quality accessible health and community services;
building friendly, confident and safer communities;
a fairer society that reduces disadvantage and respects diversity; and
greater public participation and more accountable government.
Major Outputs/DeliverablesPerformance Measures
Unit of Measure
2009-10 Target
2008-09 Expected Outcome
2008-09 Target
2007-08 Actual
Community Development(a)
Implement whole of government strategies which build the capacity of communities to achieve common objectives and develop facilities to meet current and future community needs. Administer grants for programs delivering neighbourhood houses, men’s sheds, volunteering, community information and communication technology and place-based community projects that generate shared educational, social, economic, cultural and environmental benefits.
Quantity Community enterprises supported(b)
number 30 nm nm nm
Hours of coordination funding provided to Neighbourhood Houses
number (‘000)
450 450 450 450
Projects funded through the Victorian Community Support Grants program for the purpose of planning, community strengthening and infrastructure(c)
number 90-100 nm nm nm
Resident participation in community renewal governance structures(d)
per cent 50 nm nm nm
Quality Community foundation boards or advisory committees have completed financial and/or governance training(d)
per cent 100 nm nm nm
184 Planning and Community Development Service Delivery 2009-10
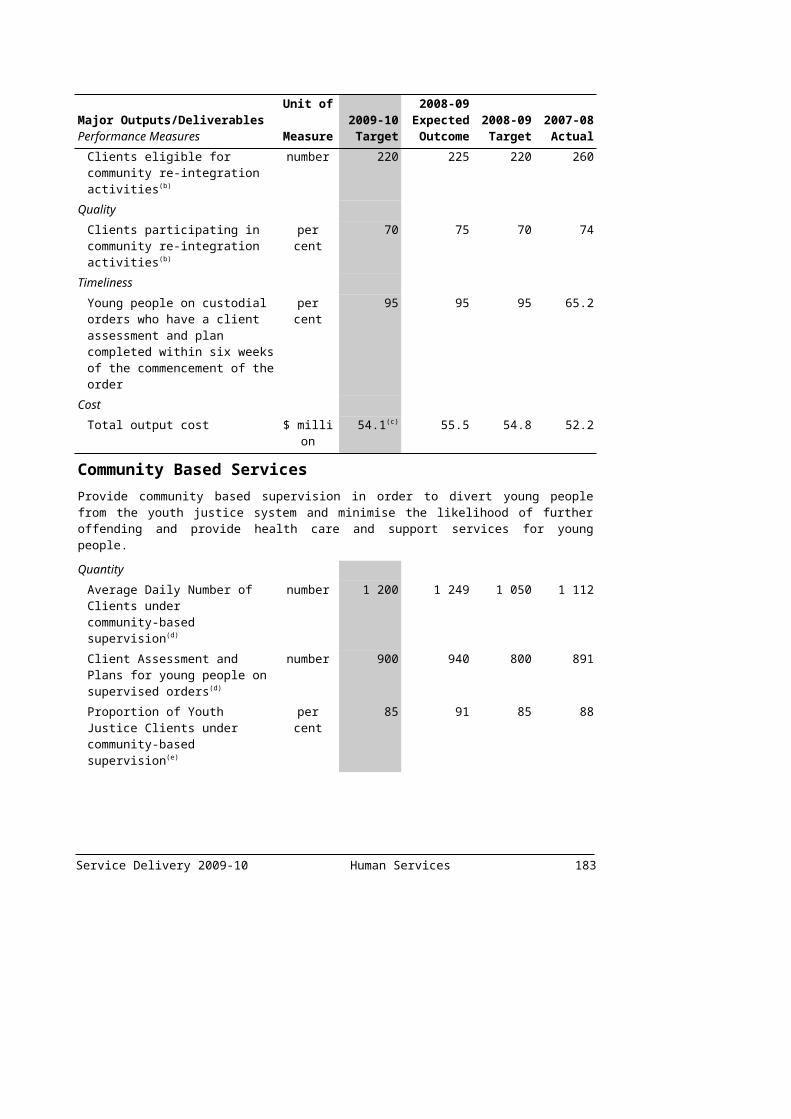
Major Outputs/DeliverablesPerformance Measures
Unit of Measure
2009-10 Target
2008-09 Expected Outcome
2008-09 Target
2007-08 Actual
Grant payments paid against completion of funding agreement milestones(e)
per cent 100 nm nm nm
Grant projects which are completed and have successfully met their objectives(d)
per cent 90 nm nm nm
Progress on implementation of actions in Strengthening Community Organisations Action Plan complies with agreed performance targets(d)
per cent 100 nm nm nm
Progress on implementation of actions in the volunteering strategy complies with agreed performance targets(f)
per cent 100 nm nm nm
Timeliness Grants acquitted within the timeframe specified in the terms and conditions of the funding agreement(g)
per cent >90 nm nm nm
Cost Total output cost(h) $ million 61.8 55.0 53.4 39.9
Developing the Local Government Sector(i)
Work in partnership with the local government sector to develop sustainable service delivery and asset management policies and practices that maximise community value and accountability. Encourage and support best practice and continuous development in local governance, administer programs that assist local government in delivering public library services, and provide support to the Victorian Grants Commission.
Quantity Living Libraries grants provided to improve public library services in partnership with local councils(j)
number 15 15 15 15
Local councils receiving Victorian Grants Commission funding(d)
number 79 nm nm nm
Quality Assessment of Living Libraries grant applications against funding agreement criteria(d)
per cent 100 nm nm nm
Funding for Public Library Services grants and Premier’s Reading Challenge Book Fund paid against milestones of funding agreements(k)
per cent 100 100 100 100
Service Delivery 2009-10 Planning and Community Development 185
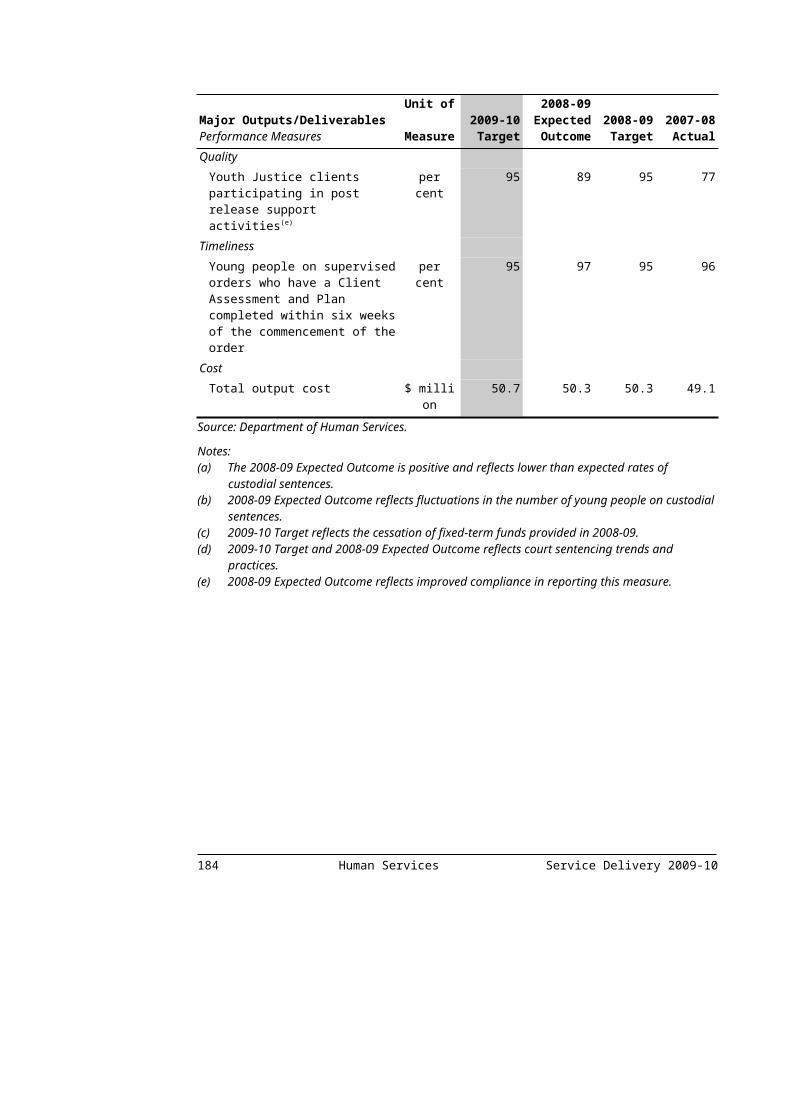
Major Outputs/DeliverablesPerformance Measures
Unit of Measure
2009-10 Target
2008-09 Expected Outcome
2008-09 Target
2007-08 Actual
Timeliness Funding grants are provided within timeframes agreed with grant recipient(d)
per cent 100 nm nm nm
Living Libraries grant payments are made within timeframes agreed with grant recipients(d)
per cent 100 nm nm nm
Victoria Grants Commission payments are made within timeframes agreed with local councils(d)
per cent 100 nm nm nm
Cost Total output cost $ million 41.7 46.2 44.3 44.5
Source: Department of Planning and Community Development
Notes:(a) This output combines the former ‘Community Strengthening’ output and ‘Neighbourhood Houses and
Men’s Sheds’ output.(b) New performance measure replaces the 2008-09 measure 'Community Enterprise grants: number
approved'. The performance measure has been reworded for 2009-10 as a result of a departmental review to ensure that the Department's 2009-10 performance measures are better aligned and appropriately allow for the assessment of the Department's production and delivery of outputs.
(c) New performance measure introduced as a result of a departmental review to ensure that the Department's 2009-10 performance measures are better aligned and appropriately allow for the assessment of the Department's production and delivery of outputs. This measure also reflects the Government’s commitment to building community facilities.
(d) New performance measure for 2009-10 introduced as a result of a departmental review to ensure that the Department's 2009-10 performance measures are better aligned and appropriately allow for the assessment of the Department's production and delivery of outputs.
(e) New performance measure combines a number of 2008-09 performance measures: 'Community Renewal: grants paid against milestones of funding agreement', 'Community Support Fund: grants paid against milestones of funding agreements' , 'Enterprise Communities: grants paid against milestones of funding agreement’, ‘Flexible Transport Solutions Grants: grants paid against milestones of funding agreements’, ‘No Interest Loans Scheme: grants paid against milestones of funding agreements’, ‘Men’s Shed Program: grants paid against milestones of funding agreements’, ‘Neighbourhood House program: grants paid against milestones of funding agreements’, and ‘Payments made according to contracts provided ICT grant recipients meet contract terms’. These measures have been combined as a result of a departmental review to ensure that the Department's 2009-10 performance measures are better aligned and appropriately allow for the assessment of the Department's production and delivery of outputs.
(f) New performance measure introduced in 2009-10 to reflect the Government's commitment to participation in volunteering.
(g) New performance measure combines a number of 2008-09 performance measures: 'Community Renewal: grants paid acquitted within the timeframe specified in the terms and conditions of the funding agreement' and 'Community Support Fund: grants acquitted within the timeframe specified in the terms and conditions of the funding agreement'. These measures have been combined as a result of a departmental review to ensure that the Department's 2009-10 performance measures are better aligned and appropriately allow for the assessment of the Department's production and delivery of outputs.
186 Planning and Community Development Service Delivery 2009-10
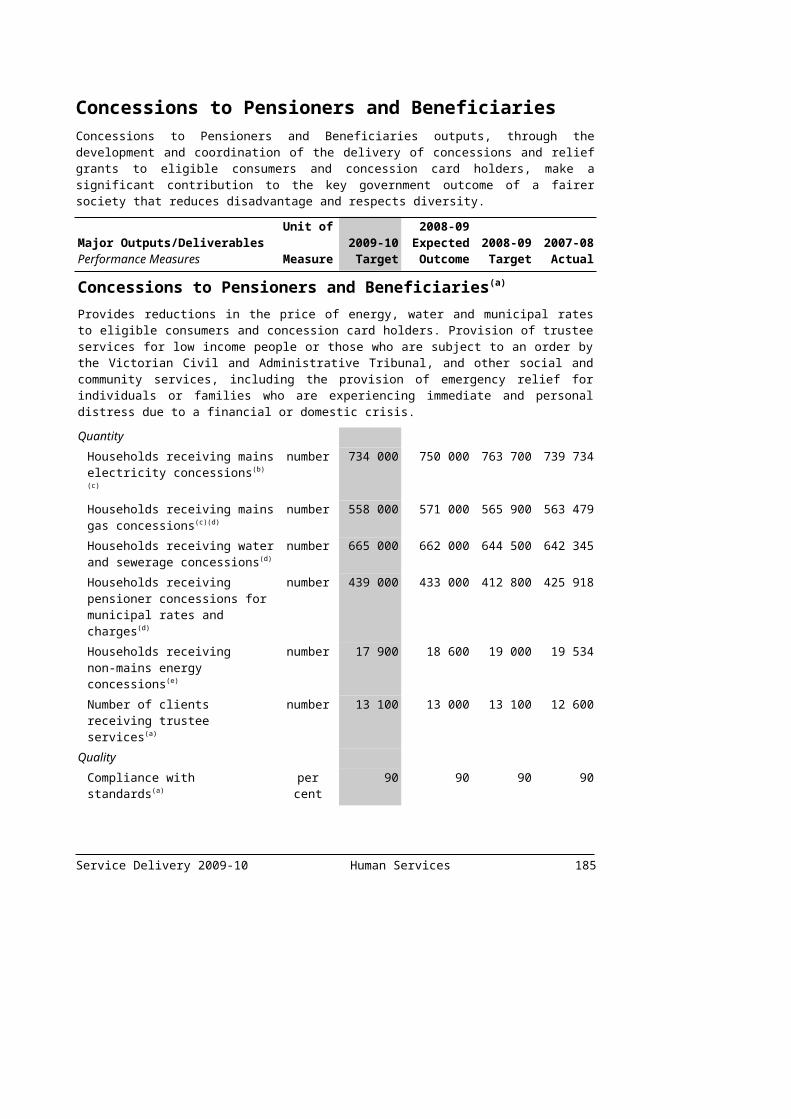
Notes (continued):(h) Includes an adjustment of $6.1 million for the Community Support Fund, being the difference
between the estimated revenue of $101.9 million and estimated payments of $108 million in 2009-10 (2008-09 Expected Outcome $5.6 million; $102.4 million revenue and $108 million expenditure).
(i) This output was named Local Government Sector Development under the 2008-09 output structure.(j) New performance measure replaces the 2008-09 performance measure ‘Living Libraries Program
grants: number approved’. The 2009-10 performance measure is the same as the 2008-09 measure except for additional wording included and measures the same activity as per the performance measure in 2008-09.
(k) New performance measure replaces the 2008-09 performance measures ‘Public Library Services: grants paid against milestones of funding agreements’ and ‘Premiers Reading Challenge Book Fund: proportion of funds allocated within agreed timelines’ as a result of a departmental review.
Service Delivery 2009-10 Planning and Community Development 187

DEPARTMENT OF PREMIER AND CABINET
Departmental mission statementThe Department’s mission is to ensure the best possible outcomes for all Victorians by providing exemplary leadership and innovation in the development of policy and delivery of services. It achieves this through:
supporting the Premier as head of Government and Cabinet;
providing strategic policy leadership;
developing and coordinating whole of government initiatives; and
delivering whole of government services and programs.
The Department manages the implementation of the Growing Victoria Together framework; relationships with other governments in Australia and overseas; and the delivery of services and programs in relation to the arts and multicultural affairs.
Significant challenges facing the Department in the medium termSignificant challenges facing the Department in the medium term include:
ensuring Victoria is able to respond to the changing global economy and economic downturn, and to the effects of climate change;
maximising the social, environmental and economic benefits for Victoria from the National Reform Agenda; and
providing whole of government coordination for major projects, such as the Victorian Bushfire Reconstruction and Recovery Authority.
Major policy decisions and directionsIn 2009-10, the Department will monitor and evaluate emerging policy challenges from a whole of government perspective. A major program of work in 2009-10 will be driven by the need to take a leadership role in responding to climate change, continuation of the National Reform Agenda, and coordination of whole of government responses to urgent issues.
The Department will continue to oversee the development of the Growing Victoria Together framework and contribute to the goal of ‘Greater public participation and more accountable government’ through the provision of advice from a whole of government, and Growing Victoria Together, perspective.
188 Premier and Cabinet Service Delivery 2009-10

Ministerial portfoliosThe Department supports the ministerial portfolios of the Premier, Arts and Multicultural Affairs.
Changes to the output structureThe Department has made some changes to its output structure in 2009-10, as shown in the table below.
2009-10 Outputs Reason 2008-09 OutputsStrategic Policy Advice and Projects Consolidation Strategic Policy Projects
Strategic Policy AdviceMulticultural Affairs Machinery of
governmentRefer to Department of Planning and Community Development output statements
The consolidation of the Strategic Policy Advice and Strategic Policy Projects outputs will bring together the main functions of the Department, providing advice and coordination to the Premier in his role as head of the government.
New funding provided for the Victorian Bushfire Reconstruction and Recovery Authority has been included in the Strategic Policy Advice and Projects output.
In 2009, the Victorian Multicultural Commission was established as an administrative office within the Department of Premier and Cabinet in recognition of the need for a whole of government approach to multicultural affairs. The Multicultural Affairs output has been established as a new output group.
Discontinued performance measures are detailed in Appendix C of this budget paper.
The following table summarises total output cost. It has been prepared on the basis of the Department’s 2009-10 output structure and therefore allocations may differ from the Department’s previously published budget.
Service Delivery 2009-10 Premier and Cabinet 189

Table 3.6: Output Summary ($ million)
2008-09 Budget (a)
2008-09 Revised (a)
2009-10 Budget
Variation (b)
%Strategic Policy Advice and Support (c) 89.2 149.6 119.2 33.6Public Sector Management, Governance
and Support 32.8 34.8 34.1 4.0
Arts and Cultural Development (d) 410.5 416.2 431.1 5.0Multicultural Affairs (e) 14.1 14.0 12.9 -8.5Total (f) 546.6 614.6 597.3 9.3Source: Department of Premier and Cabinet
Notes:(a) Both the 2008-09 Budget and 2008-09 Revised columns reflect the 2009-10 Output structure,
adjusted on a comparative basis for machinery of government changes and other output structure changes. As such, they incorporate changes made to the Department’s output structure in 2009-10, restated for comparative purposes, and will differ from Budget Paper No. 4, Chapter 3, Departmental Financial Statements.
(b) Variation between 2008-09 Budget and 2009-10 Budget.(c) 2008-09 Revised and 2009-10 Budget total output cost has increased due to the inclusion of the
Victorian Bushfire Reconstruction and Recovery Authority costs and related Bushfire recovery costs in the Strategic Policy Advice and Projects output. Refer to Appendix A.
(d) 2009-10 Budget has increased due to 2009-10 Budget initiatives. Refer to Appendix A. (e) Output group cost has decreased as the Refugee Action Program will now be funded through the
Community Support Fund rather than through appropriation. Refer to Appendix A.(f) Total output expense may not equate to the total expense reported in Budget Paper No. 4, Chapter 3,
Departmental Financial Statements due to additional expenses in Budget Paper No. 4 that are not included in departmental output costs.
The following section provides details of the outputs to be provided to government, including performance measures and costs for each output. Total expenditure for the Department can be found in Budget Paper No. 4, Chapter 3, Departmental Financial Statements.
190 Premier and Cabinet Service Delivery 2009-10
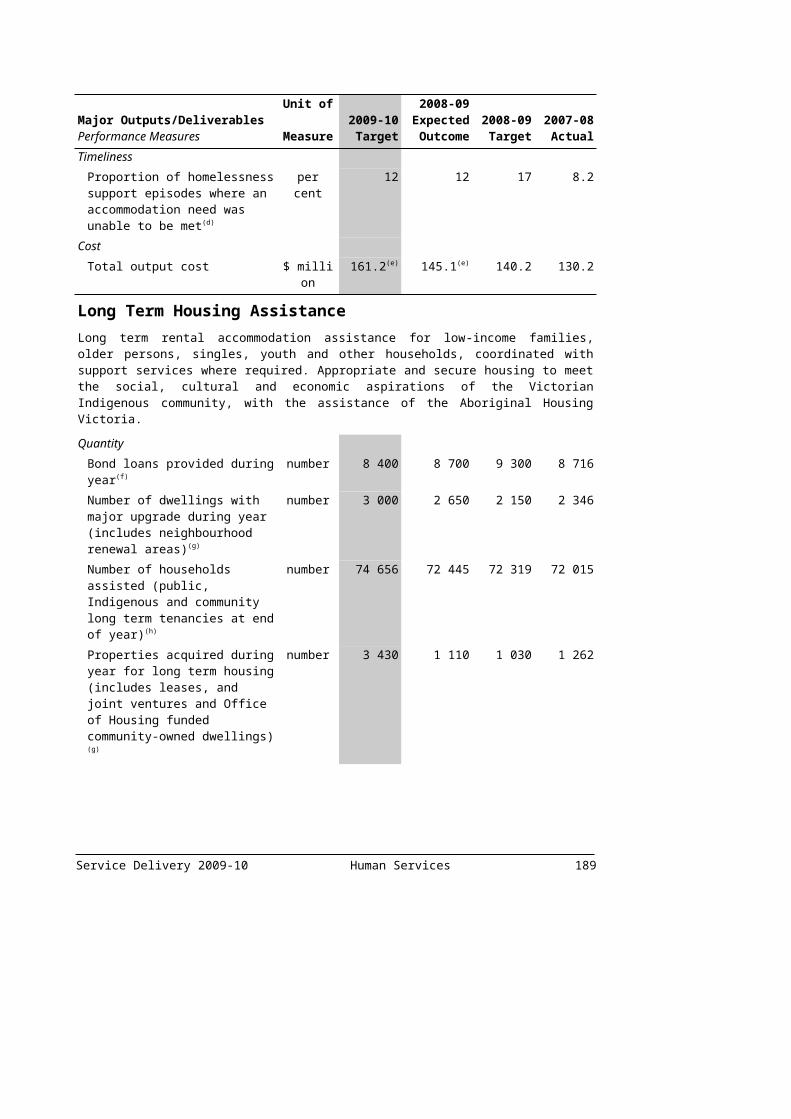
Strategic Policy Advice and SupportProvision of advice and support to the Premier and Cabinet on all aspects of policy including the Government’s medium-term strategic directions. This involves advice on issues as they arise, policy coordination and analysis, consultation with key internal and external stakeholders and leadership in long-term policy development and research.
These outputs contribute to the Growing Victoria Together framework by providing quality policy advice and support that contributes to all key government outcomes as well as coordinating policy initiatives that span more than one government outcome.
Major Outputs/DeliverablesPerformance Measures
Unit of Measure
2009-10 Target
2008-09 Expected Outcome
2008-09 Target
2007-08 Actual
Strategic Policy Advice and ProjectsProvide strategic policy analysis and advice to the Premier on all matters affecting the Premier's role as head of government; administrative support for the operation of the Cabinet, Cabinet Committees and Executive Council and for the Government's relationship with Parliament; and assist the Premier in identifying emerging issues, carrying out practical forward planning, reviewing policy and assessing the impact of government decisions and actions.
On behalf of the Premier, lead and participate in policy projects including development and coordination of new initiatives; and manage the implementation of the Growing Victoria Together strategy and other strategic policy initiatives.
Quantity Development of the Growing Victoria Together outcomes report for the public
number 1 1 1 1
Policy briefs prepared(a) number 3 150 5 500 3 050 6 500Whole of government strategic policy projects
number 31 31 31 31
Quality Policy services rating per cent 86 86 86 87
Timeliness Advice provided to government about the bushfire reconstruction and recovery process within agreed timelines(b)
per cent 100 100 nm nm
Delivery of bushfire reconstruction and recovery projects within agreed timelines(b)
per cent 85 85 nm nm
Development of the Growing Victoria Together outcomes report within required timeframe
yes/no yes yes yes yes
Policy projects completed within required timelines
per cent 100 100 100 100
Policy services rating per cent 95 95 95 96Cost
Total output cost(c) $ million 70.3 103.2 43.4 49
Service Delivery 2009-10 Premier and Cabinet 191

Major Outputs/DeliverablesPerformance Measures
Unit of Measure
2009-10 Target
2008-09 Expected Outcome
2008-09 Target
2007-08 Actual
Government Information Services and SupportContinuously improve communications and information about government policies, programs and services with the Victorian public and across government.
Quantity Communication activities/products reviewed by the Government Communications Review Group (GCRG)(d)
number 250 279 130 224
Develop communications resource products, standards and guidelines in response to identified Government requirements(d)
number 3 12 3 3
Briefs prepared number 80 80 80 90Quality
Policy services rating per cent 86 86 86 83Timeliness
Communication activities/requests reviewed by GCRG by due by date
per cent 95 100 90 100
Cost Total output cost $ million 45.8 43.5 43.7 44.0
Protocol and Special EventsInitiate, plan and implement diplomatic and business visits, hospitality events and special projects including government-sponsored programs and activities and provision of advice in relation to these matters.
Quantity Annual special events number 5 5 4 5Official visitors to Victoria number 20 20 20 37
Quality Policy services rating per cent 86 86 86 92
Timeliness Timely delivery of events, functions and visit arrangements
per cent 100 100 100 100
Cost Total output cost(e) $ million 3.1 2.9 2.1 1.9
Source: Department of Premier and Cabinet
Notes:(a) The 2008-09 Expected Outcome is significantly higher than the 2008-09 Target, reflecting the current
high demand for advice.(b) New measure reflects activities related to the Victorian Bushfire Reconstruction and Recovery
Authority.(c) 2008-09 Expected output cost is significantly higher than the 2008-09 Target due to the inclusion of
the Victorian Bushfire Reconstruction and Recovery Authority and other related costs in this output. 192 Premier and Cabinet Service Delivery 2009-10
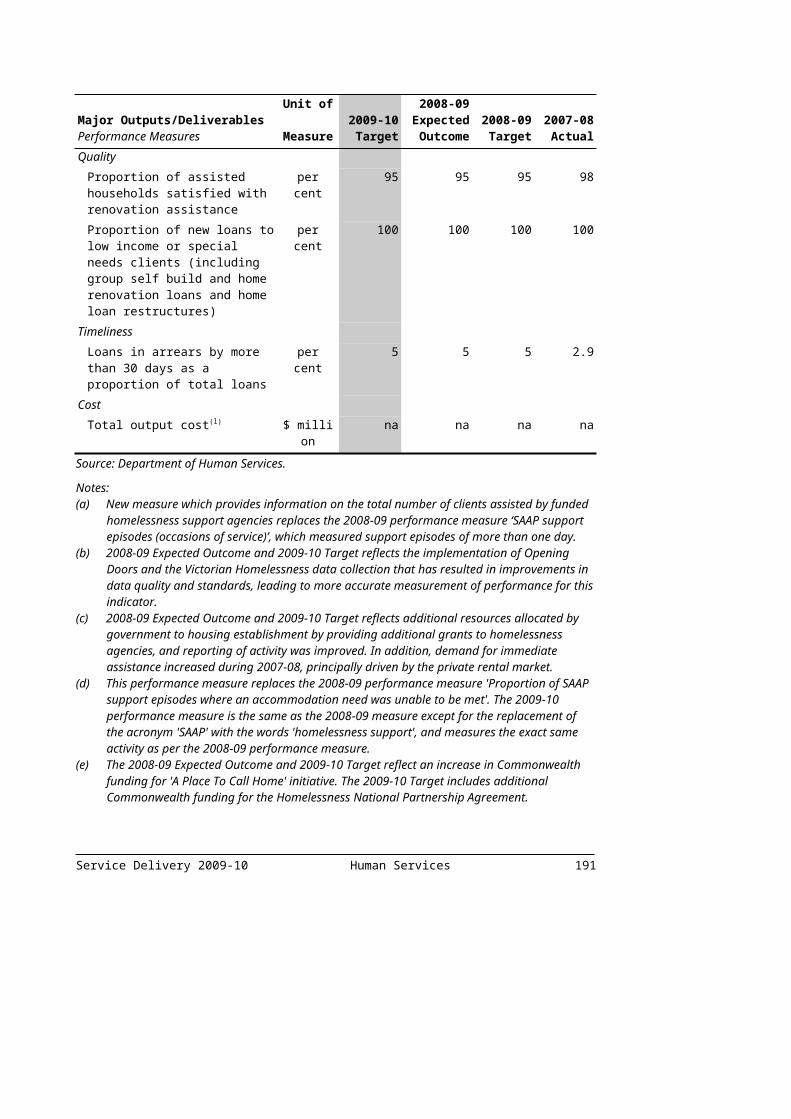
Notes (continued):(d) Expected Outcome is higher than the 2008-09 Target due to the introduction of a new
communications approval process which now also includes public entities and special bodies, requiring the one off development of additional communication resources.
(e) 2008-09 Expected output cost is higher then the 2008-09 Target output cost due to an internal transfer of the team responsible for the Australia Day coordination function into this output.
Service Delivery 2009-10 Premier and Cabinet 193
Public Sector Management, Governance and SupportThese outputs relate to the provision of independent services and aim to ensure effective management, governance and support of the public sector. These outputs contribute to the key government outcome of greater public participation and more accountable government.
194 Premier and Cabinet Service Delivery 2009-10

Major Outputs/DeliverablesPerformance Measures
Unit of Measure
2009-10 Target
2008-09 Expected Outcome
2008-09 Target
2007-08 Actual
Advice and Support to the GovernorProvide advice and support to the Governor, and maintenance of Government House and its collections as a heritage asset of national importance.
Quantity Events and services arranged in response to requests by the Governor and the Premier
per cent 100 100 100 100
Quality Maintenance of assets in accordance with asset management strategy
per cent 100 100 100 100
Management of the program of events and services meets the expectations of the Governor
per cent 95 95 95 95
Standard, physical appearance and security of Government House, the gardens and grounds meet appropriate standards as per the asset management strategy
per cent 95 95 95 95
Timeliness Contract milestones are met per cent 100 100 100 100Timely arrangement of events and services
per cent 100 100 100 100
Cost Total output cost $ million 9.2 8.9 8.8 8.8
State Services AuthorityProvide recommendations and advice to Government to improve delivery and integration of government services; promote key public sector conduct values and employment principles; undertake independent investigations of complaints; develop workforce and public administration capability; and promote high standards of governance, accountability and performance of public entities.
Quantity Formal events and activities delivered across the public sector that promote values and employment principles; effective workforce planning and development; good governance in public sector entities; and effectiveness in public administration(a)
number 100 143 100 206
Service Delivery 2009-10 Premier and Cabinet 195

Major Outputs/DeliverablesPerformance Measures
Unit of Measure
2009-10 Target
2008-09 Expected Outcome
2008-09 Target
2007-08 Actual
Referred reviews underway or completed, aimed at improving service delivery, governance, and/or public administration efficiency and effectiveness
number 12 15 12 18
Quality Recommendations arising from reviews of actions (Section 64) implemented by the public service
per cent 100 100 100 100
Timeliness Proportion of referred reviews completed within agreed timelines
per cent 90 100 90 100
Cost Total output cost(b) $ million 12.3 12.9 12.1 11.4
Ombudsman servicesResponsible for independent investigation of complaints concerning administrative actions taken in government departments, statutory bodies, or by officers and employees of municipal councils.
Quantity Finalise consideration of cases including general, Freedom of Information and Whistleblower complaints(c)
number 8 000 10 400 8 000 8 741
Internal reviews of complaint investigations conducted at the request of the complainant(d)
number 80 60 80 70
Outreach initiatives delivered under the Outreach program
number 100 100 100 104
Undertake and complete own motion investigations and studies
number 4 4 4 7
Quality Proportion of complaint investigations reviewed at the request of complainants (by a fresh, senior investigator) where the original findings were found to be sound and well founded
per cent 80 85 80 87
Proportion of complaints, which were found to be substantiated, where effective outcomes were achieved on behalf of complainants or where identified inappropriate administrative processes were changed
per cent 80 85 80 80
196 Premier and Cabinet Service Delivery 2009-10

Major Outputs/DeliverablesPerformance Measures
Unit of Measure
2009-10 Target
2008-09 Expected Outcome
2008-09 Target
2007-08 Actual
Proportion of recommendations emanating from own motion investigations which are accepted and implemented by the entities concerned
per cent 80 85 80 80
Timeliness Complaints resolved within required timelines
per cent 93 93 93 97
Cost Total output cost(e) $ million 7.8 8.3 7.2 6.7
Chief Parliamentary Counsel ServicesPreparation of Bills for introduction in Parliament, including: provision of advice on proposed statutory rules and other subordinate legislation, publishing and reprinting of Acts and Statutory Rules; and maintenance of a database of Victorian legislation.
Quantity Advice given on legislation in response to written requests
number 400 400 400 330
Statutory Rules made and bills prepared and introduced into Parliament
number 260 270 260 251
Versions of Acts and Statutory Rules published electronically
number 800 800 800 1 447
Quality Accuracy levels maintained in terms of document management, printing and publishing
per cent 96 98 96 99
Bills drafted, Statutory Rules drafted or settled, and advice provided is to the required standard
per cent 96 96 96 99
Timeliness Bills drafted, Statutory Rules drafted or settled, and advice provided within required timelines
per cent 96 99 96 99
Electronic versions published within required timelines
per cent 96 96 96 99
Cost Total output cost $ million 4.8 4.7 4.7 4.4
Source: Department of Premier and Cabinet
Notes:(a) The demand for presentations and seminars continues to be high.(b) The 2008-09 Expected output cost is higher than the 2008-09 target due to projects deferred from the
previous year. (c) The number of cases continues to increase, which is in line with trends over the past four years.
Service Delivery 2009-10 Premier and Cabinet 197

(d) Fewer internal reviews than expected were requested by complainants in the first half of 2008-09. (e) 2009-10 Target and 2008-09 Expected output cost are higher than the 2008-09 Target due to new
funding provided as part of the 2009-10 Budget. Refer to Appendix A.
198 Premier and Cabinet Service Delivery 2009-10

Multicultural AffairsThis output provides for accessible, targeted support to specific population groups, encouraging the full participation of Victoria’s culturally, linguistically and religiously diverse communities in all aspects of life in Victoria and supporting enhanced access to government and other services. This output contributes to the key outcomes of a fairer society that reduces disadvantage and respects diversity.
Service Delivery 2009-10 Premier and Cabinet 199
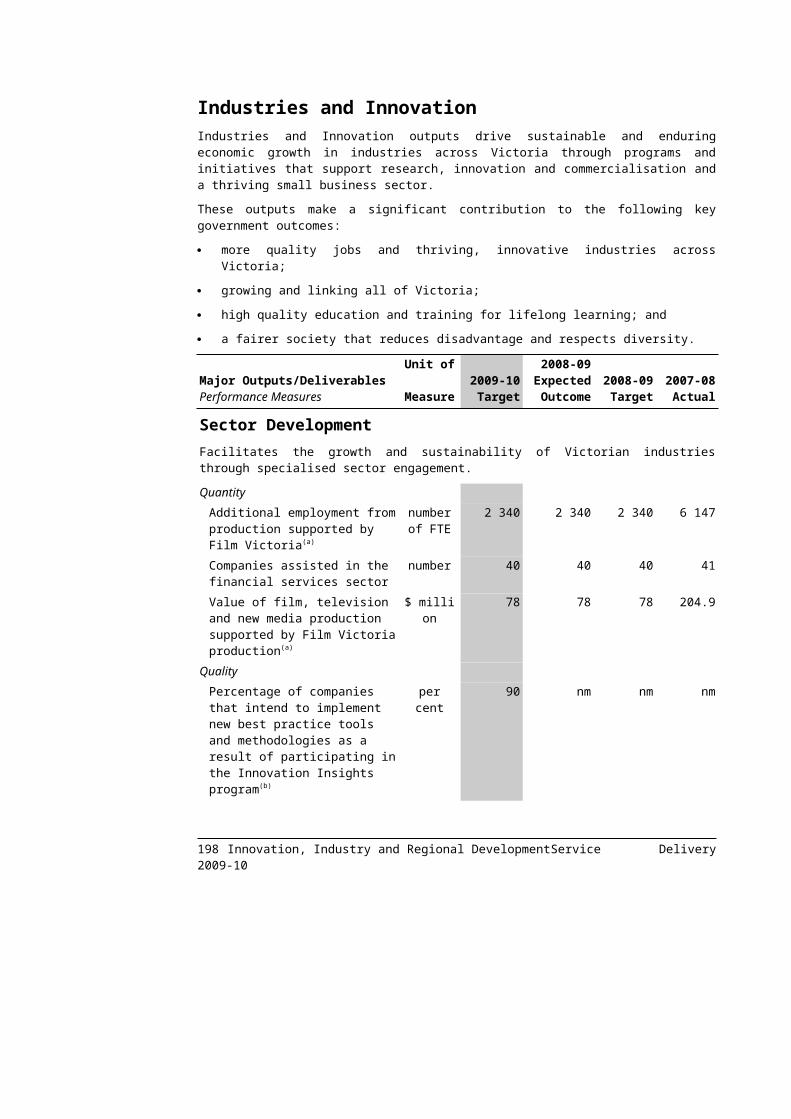
Major Outputs/DeliverablesPerformance Measures
Unit of Measure
2009-10 Target
2008-09 Expected Outcome
2008-09 Target
2007-08 Actual
Multicultural AffairsCoordinate the provision of policy advice and the whole of government approach to Multicultural Affairs, and coordinate the monitoring of government departments’ responsiveness to Victorians from non-English speaking backgrounds. Provide advice to Government on community relations and culturally and linguistically diverse communities’ participation in Victoria.
Quantity Active refugee support service Agreements
number 9 9 9 nm
Celebrate our Cultural Diversity Week events held
number 200 200 200 nm
Consultations with cultural and linguistically diverse (CALD) Communities
number 60 60 60 60
Language Services Partnerships implemented
number 10 10 10 10
Metropolitan Grants approved number 2 200 2 271 2 200 nmRegional/Rural grants approved(a) number 350 329 350 nm
Quality Community satisfaction with Celebrate our Cultural Diversity Week events
per cent 100 100 100 nm
Cultural Precinct Enhancement projects completed against milestones in the strategic plan
per cent 100 100 100 100
Local refugee communities developing local plans
per cent 100 100 100 nm
Victorian Multicultural Grants: grants paid against milestones of funding agreements
per cent 100 100 100 100
Timeliness Interpreting and Translating Workforce Strategy plan developed
per cent 85 85 85 nm
Multicultural projects completed within the required timeframe
per cent 85 85 85 85
Cost Total output cost $ million 12.9 14.0 14.1 10.1
Source: Department of Premier and Cabinet
Note:(a) Fewer than expected rural and regional applications were received in the first half of 2008-09,
reducing the 2008-09 Expected Outcome.
200 Premier and Cabinet Service Delivery 2009-10
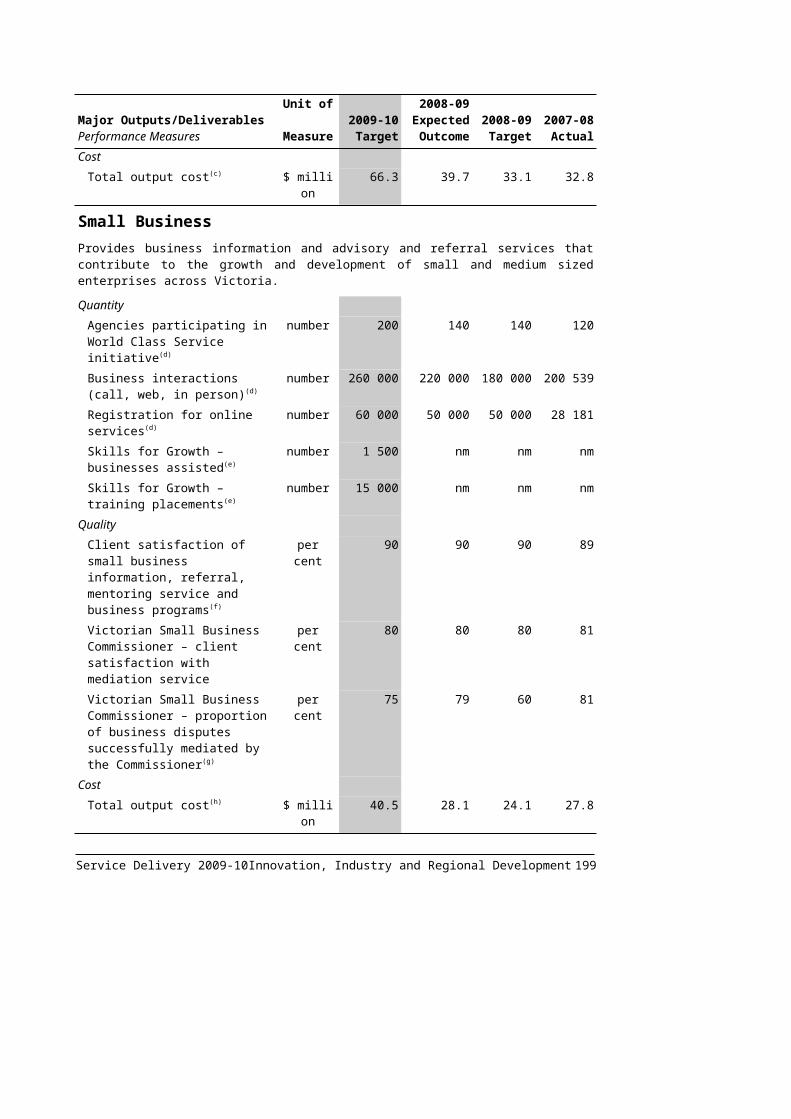
Arts and Cultural DevelopmentThese outputs contribute to the development of the Victorian arts and cultural sector through the provision of industry assistance programs, infrastructure development and policy advice.
The outputs contribute to the following key government outcomes:
a fairer society that reduces disadvantage and respects diversity;
high quality education and training for lifelong learning;
more quality jobs and thriving, innovative industries across Victoria; and
growing and linking all of Victoria.
Service Delivery 2009-10 Premier and Cabinet 201
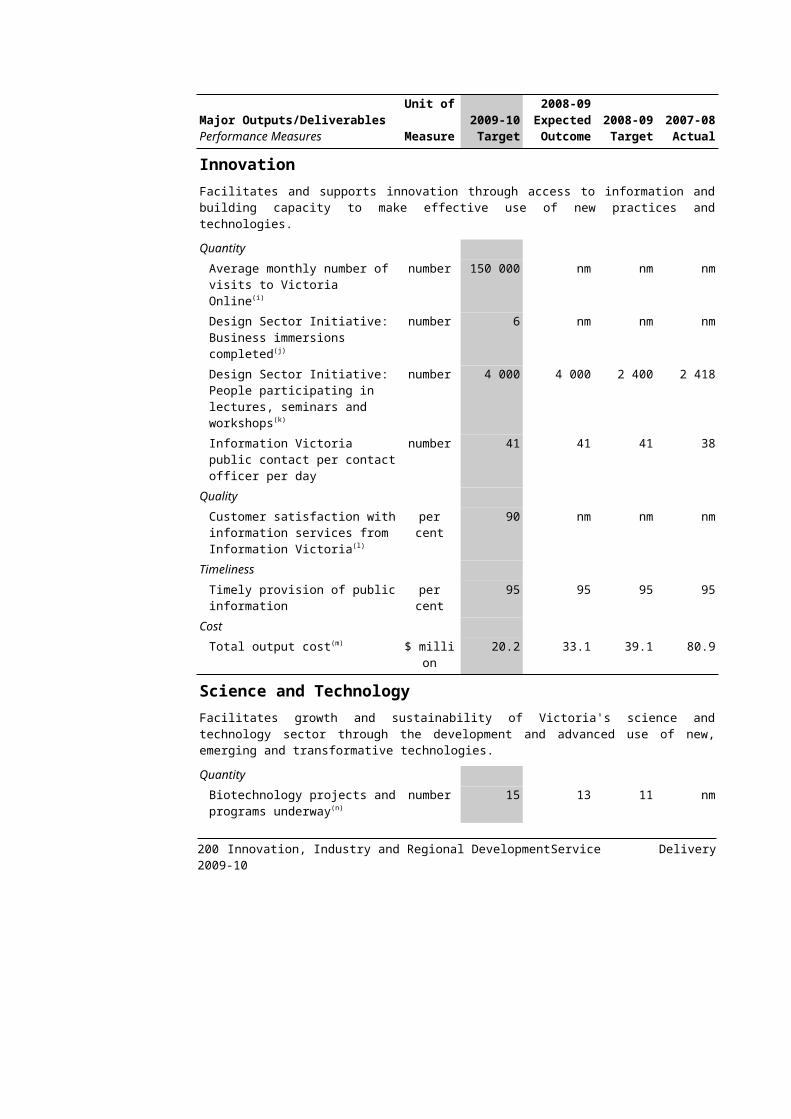
Major Outputs/DeliverablesPerformance Measures
Unit of Measure
2009-10 Target
2008-09 Expected Outcome
2008-09 Target
2007-08 Actual
Arts Development and AccessSupport for artists and arts organisations, expanding access to a diverse range of arts products through:
developing artists, ideas and knowledge;
engaging creative communities; and
building creative industries.
Quantity Access to diverse range of supported projects:
local festivals funded number 19 21 19 23 regional Touring Victoria destinations(a)
number 45 45 53 43
artist residencies in schools number 32 32 30 42Attendances at major festivals(b) number
(‘000)2 000 1 600 1 270 1 387
Attendances at major performing arts organisations
number (‘000)
950 980 950 1 190
Diverse range of product, producers and cultural venues supported:
organisations recurrently funded
number 109 109 109 111
regionally based organisations recurrently funded
number 45 45 45 48
project companies and artists funded
number 300 300 300 400
project companies and artists funded which are regionally based
number 22 22 22 22
International markets accessed number 20 20 20 20Quality
Grant recipients who met or exceeded agreed outcomes
per cent 85 85 85 86
Timeliness Arts Development applications processed for Ministerial consideration
days 60 60 60 58
All other applications processed for Ministerial consideration
days 40 40 40 34
202 Premier and Cabinet Service Delivery 2009-10

Major Outputs/DeliverablesPerformance Measures
Unit of Measure
2009-10 Target
2008-09 Expected Outcome
2008-09 Target
2007-08 Actual
Performance and grant agreements acquitted within timeframes specified in the funding agreement(c)
per cent 80 80 80 86
Cost Total output cost(d) $ million 45.1 41.3 41.2 41.4
Creating Place and SpaceSupport for Victorian cultural venues and state-owned facilities. Provides strategic assessment and advice on portfolio infrastructure proposals and projects. Consolidates portfolio asset management plans and manages funding programs for maintenance and minor capital works.
Quantity Infrastructure development projects
number 4 4 4 4
Risk management projects number 3 3 3 3State-owned cultural facilities maintained to meet service and statutory standards(e)
number 27 nm nm nm
Quality Success measures of projects achieved
per cent 90 95 90 90
Timeliness Project and grant agreements completed within agreed timeframes
per cent 90 95 90 90
Cost Total output cost(f) $ million 92.5 98.4 98.2 101.2
Portfolio Services and PolicyProvision of governance, policy implementation and advice, research, planning and communications services across portfolio agencies.
Quantity Agency Service Agreements in place
number 6 6 6 6
Ministerial briefs number 600 600 600 619Planning and research projects number 13 13 13 14
Quality Level of satisfaction with policy advice
per cent 95 95 95 98
Public information rated informative or very informative
per cent 90 90 90 91
Service Delivery 2009-10 Premier and Cabinet 203

Major Outputs/DeliverablesPerformance Measures
Unit of Measure
2009-10 Target
2008-09 Expected Outcome
2008-09 Target
2007-08 Actual
Timeliness Arts Portfolio public body annual reports tabled in Parliament by the required statutory dates
per cent 100 100 100 100
Cost Total output cost $ million 4.9 4.9 4.9 4.0
Arts Portfolio AgenciesPromotion, presentation and preservation of our heritage and the arts through Victoria's cultural agencies: Australian Centre for the Moving Image, Geelong Performing Arts Centre, Museum Victoria, National Gallery of Victoria, Public Record Office Victoria, State Library of Victoria and the Victorian Arts Centre Trust. The cultural agencies contribute to government arts policy goals by developing artists, ideas and knowledge, engaging creative communities, building creative industries, and creating place and space.
Quantity Access – users/attendances at all Agencies
number(‘000)
7 650 8 000 7 650 8 875
Access – online visitors to Agency websites
number(‘000)
20 300 20 300 20 300 16 635
Community engagement – members and friends of agencies
number 29 450 33 000 29 450 33 163
Community engagement – volunteer hours
number 93 850 94 000 93 850 84 280
Education – students participating in Agency education programs
number 475 500 485 500 475 500 534 236
Public Record Office Victoria – hard copy records preserved
shelf metres
88 000 88 000 88 000 87 365
Public Record Office Victoria – Victorian Electronic Records Strategy (VERS) departmental consultants
number 100 105 100 124
Public Record Office Victoria – digital records preserved
number 100 000 100 000 100 000 143 220
Quality Agency collections stored to industry standard
per cent 85 85 85 88
Visitors satisfied with visit: Australian Centre for the Moving Image
per cent 90 90 90 91
National Gallery of Victoria per cent 95 95 95 95 Geelong Performing Arts Centre
per cent 98 98 98 99
Public Record Office Victoria
per cent 90 90 90 90
204 Premier and Cabinet Service Delivery 2009-10
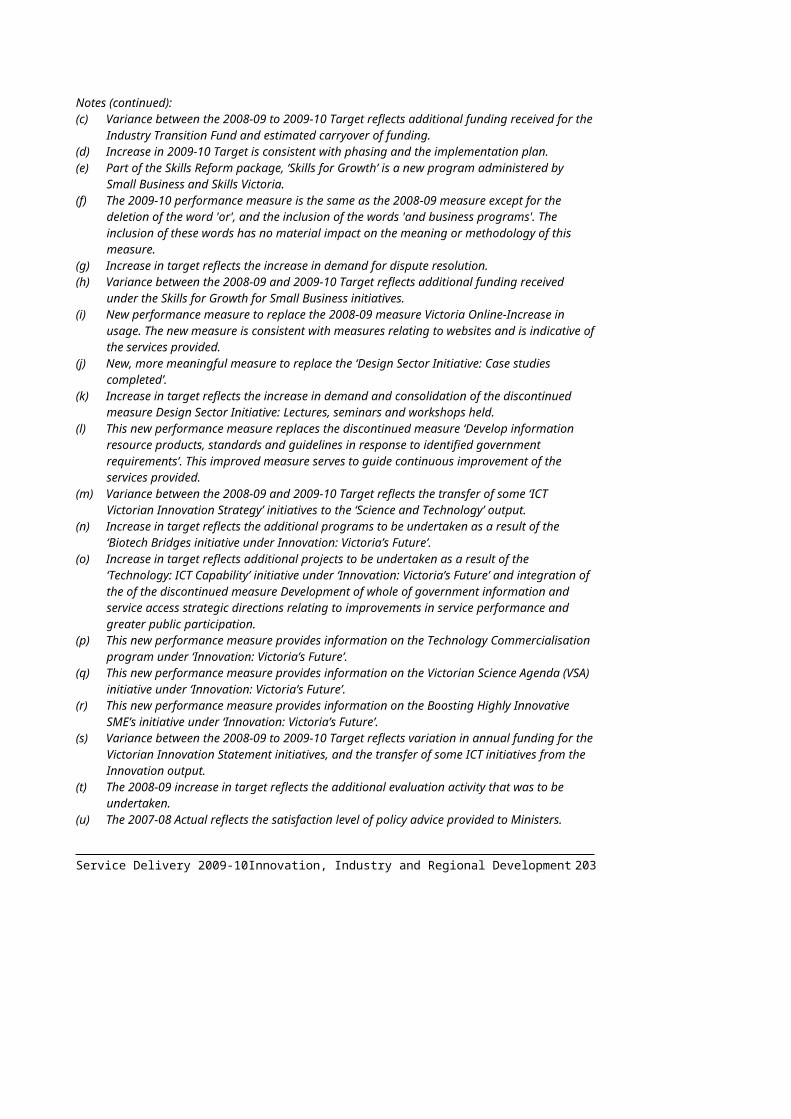
Major Outputs/DeliverablesPerformance Measures
Unit of Measure
2009-10 Target
2008-09 Expected Outcome
2008-09 Target
2007-08 Actual
State Library of Victoria per cent 90 90 90 96 Victorian Arts Centre Trust per cent 95 95 95 98 Museum Victoria per cent 95 95 95 97
Timeliness Public Record Office Victoria records issued within specified timeframes
per cent 95 95 95 95
Cost Total output cost(g) $ million 288.6 271.6 266.2 253.3
Source: Department of Premier and Cabinet
Notes:(a) The 2008-09 Expected Outcome is lower than the 2008-09 Target due to increasing costs of regional
touring, resulting in fewer grants being able to be supported. The 2009-10 Target has been revised accordingly.
(b) A transfer of funding during 2008-09 has increased the funding for festivals within the portfolio, and the 2009-10 Target.
(c) This measure was amended to better align it with statutory requirements for grant recipients.(d) 2009-10 Target output cost is higher than the 2008-09 Target due to new funding provided as part of
the 2009-10 Budget. Refer to Appendix A. (e) The measure ‘Major projects managed’ has been replaced with this new measure, which better
captures the work undertaken by Arts Victoria to maintain assets. (f) 2009-10 Target output cost is lower than the 2008-09 Target due to the transfer of Melbourne Recital
Centre operating costs to the Arts Portfolio Agencies output upon completion of building works.(g) 2009-10 Target output cost is higher then the 2008-09 Target due to the inclusion of the Melbourne
Recital Centre operating costs in this output, and due to new funding provided as part of the 2009-10 Budget. Refer to Appendix A.
Service Delivery 2009-10 Premier and Cabinet 205

DEPARTMENT OF PRIMARY INDUSTRIES
Departmental mission statementThe Department of Primary Industries (DPI) designs and delivers government policies and programs that enable Victoria’s primary and energy industries to sustainably maximise the wealth and wellbeing they generate, by providing essential goods and services, employment, investment and recreational opportunities.
DPI’s role is primarily economic, ensuring that human needs are met from the State’s natural resources through mostly privately-owned industries operating in competitive and regulated markets. A focus on production and productivity is therefore central to DPI’s work, but so too is a complementary focus on public and employee safety, community resilience, animal welfare and the natural environment.
DPI is responsible for agriculture, earth resources, energy, fisheries and forestry in Victoria.
Significant challenges facing the Department in the medium termOver the coming years Victoria’s primary and energy industries will undergo major change, driven by challenges and opportunities such as:
climate change and water scarcity – driving substantial adaptation in primary industries, and greenhouse gas abatement and water efficiency in the energy sector;
global competition and trade – requiring continued growth in productivity;
changing community attitudes – driving more safe, clean and ethically sound practices, products and services as Victorians exert more influence over government decisions; and
demographic changes – presenting challenges and opportunities in rural and regional Victoria.
Major policy decisions and directionsDPI’s strategies for 2008-11 reflect these challenges and opportunities, and the context in which the Department operates. They are:
develop a strategic policy framework: DPI will develop a comprehensive, integrated and long-term strategic policy framework to build the productivity, competitiveness and sustainability of Victoria’s primary and energy industries;
drive innovation in science, technology and practice: DPI will fund important research, development, demonstration, commercialisation and practice change in primary and energy industries that would not occur sufficiently if left entirely to the market;
206 Primary Industries Service Delivery 2009-10
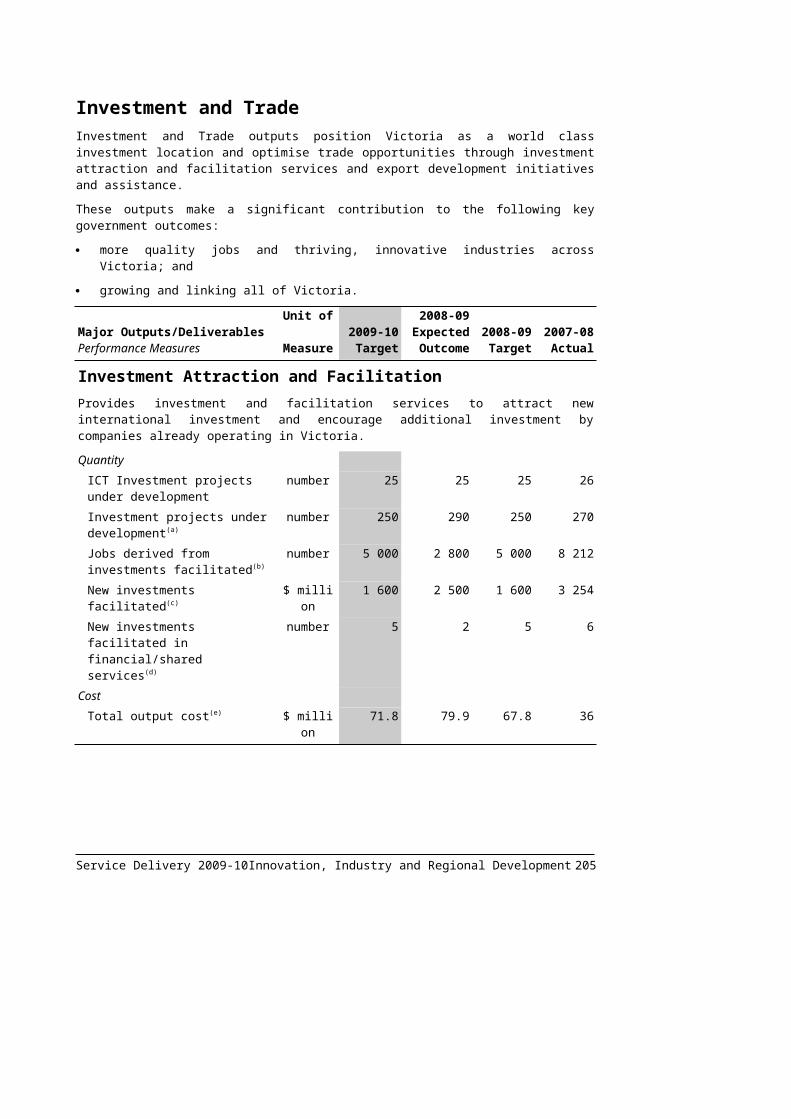
develop and operate efficient markets and regulatory frameworks: DPI will enable the best use of Victoria’s abundant natural resources by allocating them to productive uses, developing administered markets in downstream goods and services, enhancing primary producers’ access to markets, and establishing and overseeing the regulation of primary and energy industries;
negotiate and facilitate major investments: DPI will assist developers of large energy and earth resources projects to understand and comply with approval processes, and play a key role in delivering major infrastructure investments that provide public benefits that would not occur without government involvement;
manage emergencies promptly and effectively: DPI will advise and implement the Government’s response to a wide range of emergencies, notably biosecurity incursions and energy supply shortfalls, and provide considerable assistance in bushfire response and recovery work; and
achieve excellence in corporate and business management: Successful delivery of the above strategies depends on high-quality, efficient business and corporate services.
Ministerial portfoliosDPI supports the ministerial portfolios of Energy and Resources, and Agriculture.
Service Delivery 2009-10 Primary Industries 207

Changes to the output structureThere are no changes to the output structure for 2009-10. Discontinued performance measures are detailed in Appendix C of this budget paper.
The following table summarises the total output cost.
Table 3.7: Output Summary ($ million)
2008-09 Budget
2008-09 Revised
2009-10 Budget
Variation (a)
%Primary Industries Policy 50.7 49.7 51.9 2.4Regulation and Compliance (b)(c) 86.8 96.4 97.3 12.1Strategic and Applied Scientific Research (d)(e) 200.7 182.3 211.6 5.4Sustainable Practice Change (f)(g) 142.8 214.7 163.1 14.2Total (h) 481.0 543.1 523.9 8.9Source: Department of Primary Industries
Notes:(a) Variation between 2008-09 Budget and 2009-10 Budget.(b) The increased 2008-09 revised output cost reflects additional funding allocated during 2008-09 to
address outbreaks of locusts, fruit flies and potato cyst nematode.(c) The increased output cost in 2009-10 reflects the transfer of weeds and pests functions from the
Department of Sustainability and Environment to DPI.(d) The decreased 2008-09 revised output cost reflects adjusted delivery timelines for the Energy
Technology Innovation Strategy and Future Farming initiatives.(e) The increase in the 2009-10 Budget output cost relates to funding scheduled to be received in
2009-10 for initiatives such as the Biosciences Research Centre and Securing and Developing Services to Farmers. Cash flow revisions of Energy Technology Innovation Strategy initiatives have also contributed to the increase.
(f) The increased 2008-09 revised output cost reflects additional funding allocated during 2008-09 for drought response and bushfire recovery activities, as well as additional on-passing of revenue from the Commonwealth for the Exceptional Circumstances Drought Assistance Program.
(g) The increased output cost in 2009-10 is due to additional on-passing of revenue from the Commonwealth for Exceptional Circumstances Drought Assistance Program.
(h) Total output expense may not equate to the total expense reported in Budget Paper No. 4, Chapter 3, Departmental Financial Statements due to additional expenses in Budget Paper No. 4 that are not included in departmental output costs.
The following section provides details of the outputs to be provided to government, including performance measures and costs for each output. Total expenditure for the department can be found in Budget Paper No. 4, Chapter 3, Departmental Financial Statements.
208 Primary Industries Service Delivery 2009-10
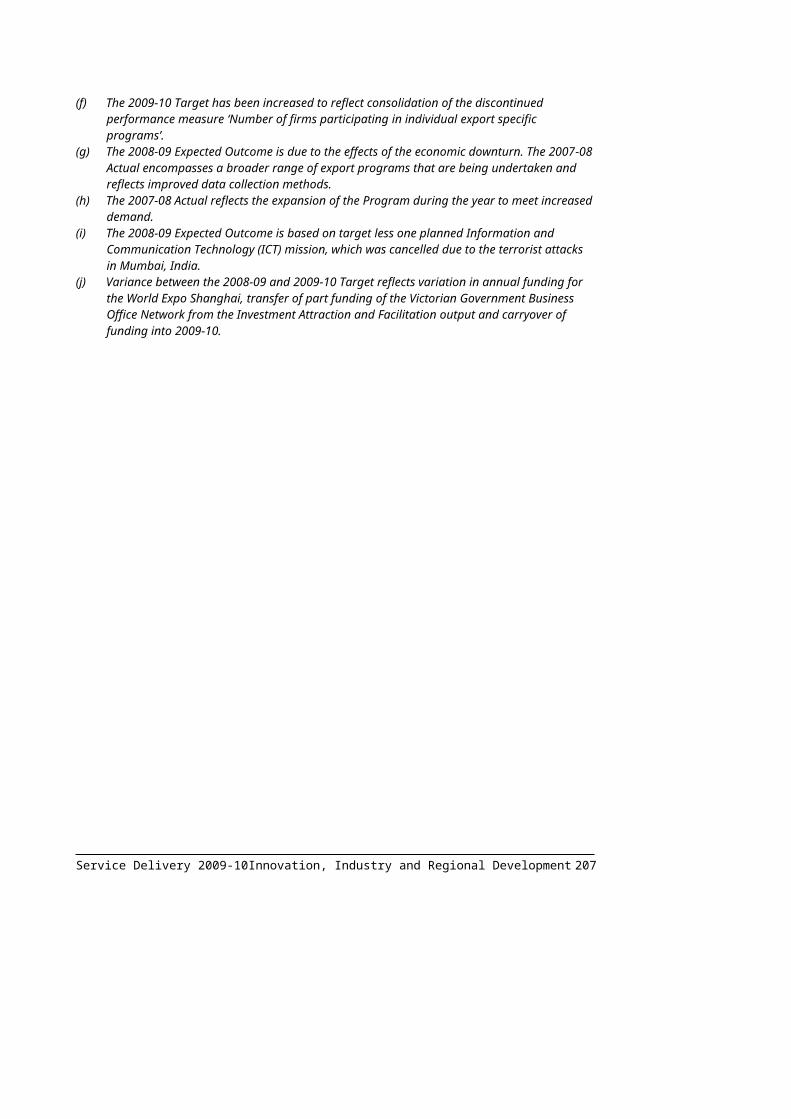
Sustainable Development of Primary and Energy IndustriesThe Department of Primary Industries works with energy companies, research partners, primary producers, mineral explorers and rural communities across Victoria, as well as other Government departments and national and international research associates to address the major and emerging challenges in sustainability and productivity. The Department’s services are delivered through four outputs encompassing innovative policy, world class science and technology, leading edge protection and regulation practices, and sustainable practice change.
The Department principally contributes to the following key government outcomes:
efficient use of natural resources;
protecting the environment for future generations;
more quality jobs and thriving, innovative industries across Victoria; and
building friendly, confident and safe communities.
Major Outputs/DeliverablesPerformance Measures
Unit of Measure
2009-10 Target
2008-09 Expected Outcome
2008-09 Target
2007-08 Actual
Primary Industries PolicyDevelop policy frameworks and legislative reforms that aim to improve investment in, and protection of, energy and resources and primary industries through the establishment of efficient and equitable resource definition, allocation and management processes, leading to improved market access, industry performance, efficiency of resource use and reduced adverse impacts on the environment.
Quantity Exercise strategies for maintaining security of electricity and gas supply(a)
number 4 4 2 4
Industry information packages released targeted at minerals and petroleum(b)
number 12 14 14 14
Major strategic policy briefings to government(c)
number 10 11 10 nm
Number of structured management arrangements in place for fisheries(d)
number 24 20 20 16
Powerline relocation grants approved(e)
number 20 25 20 17
Strategic policy briefings on energy matters to portfolio minister(f)
number 210 216 200 249
Quality Compliance with criteria for approval of powerline relocation grants
per cent 100 100 100 100
Service Delivery 2009-10 Primary Industries 209
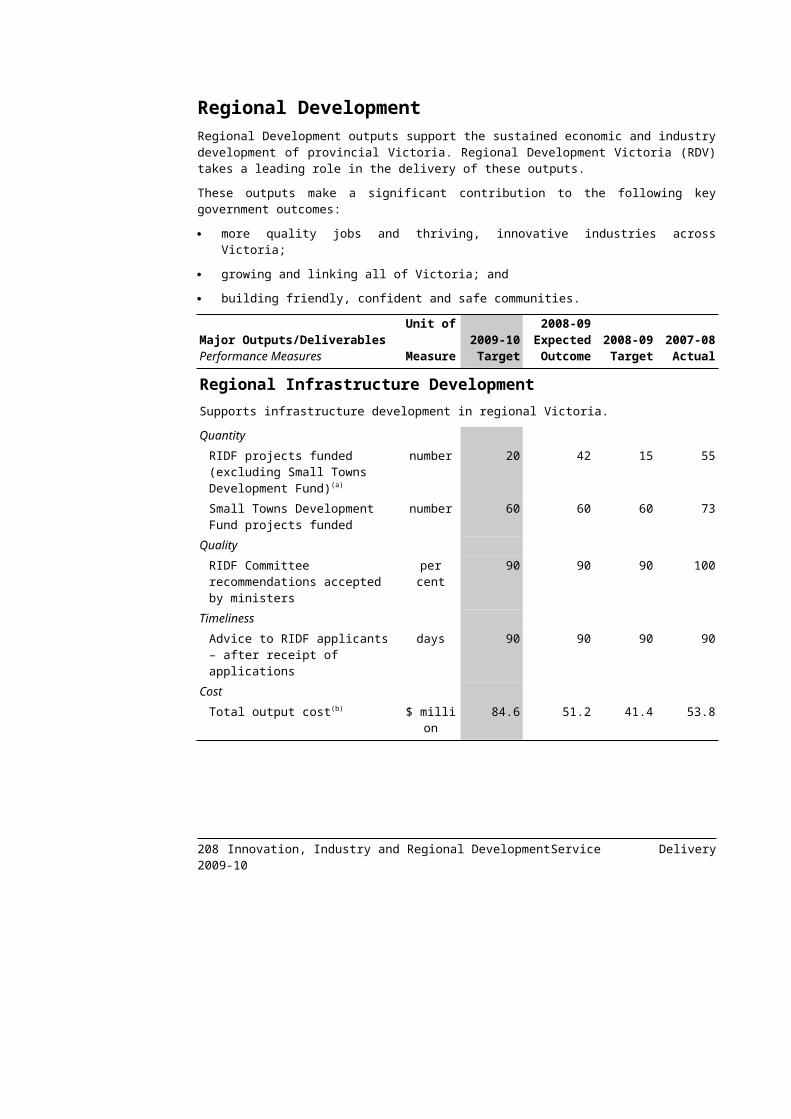
Major Outputs/DeliverablesPerformance Measures
Unit of Measure
2009-10 Target
2008-09 Expected Outcome
2008-09 Target
2007-08 Actual
Enhanced fishing grants: program components meet agreed milestones for delivery(g)
per cent 100 90 100 85
Proportion of minerals and petroleum publications and packages requiring post-release correction or recall
per cent <5 <5 <5 0
Timeliness Evaluation and selection of large-scale demonstration projects for carbon capture and storage and renewable energy under the Future Energy initiative completed by June 2010(h)
per cent 100 nm nm nm
Geophysical interpretation of the offshore Gippsland Basin completed for input to second generation regional carbon sequestration modelling(i)
per cent 100 nm nm nm
Facilitate delivery of milestones in line with grant agreements for the Energy Technology Innovation Strategy large-scale demonstration projects(j)
per cent 100 nm nm nm
Delivery of milestones facilitated in line with grant agreements for the brown coal R&D grants and sustainable energy R&D grants that form part of the Energy Technology Innovation Strategy initiative(k)
per cent 100 nm nm nm
Fisheries management plans actions implemented within agreed timelines
per cent >90 >90 >90 92
Minerals and petroleum input to Environment Effects Statements (EES) completed according to EES panel timelines
per cent 100 100 100 100
Cost Total output cost $ million 51.9 49.7 50.7 62.5
210 Primary Industries Service Delivery 2009-10
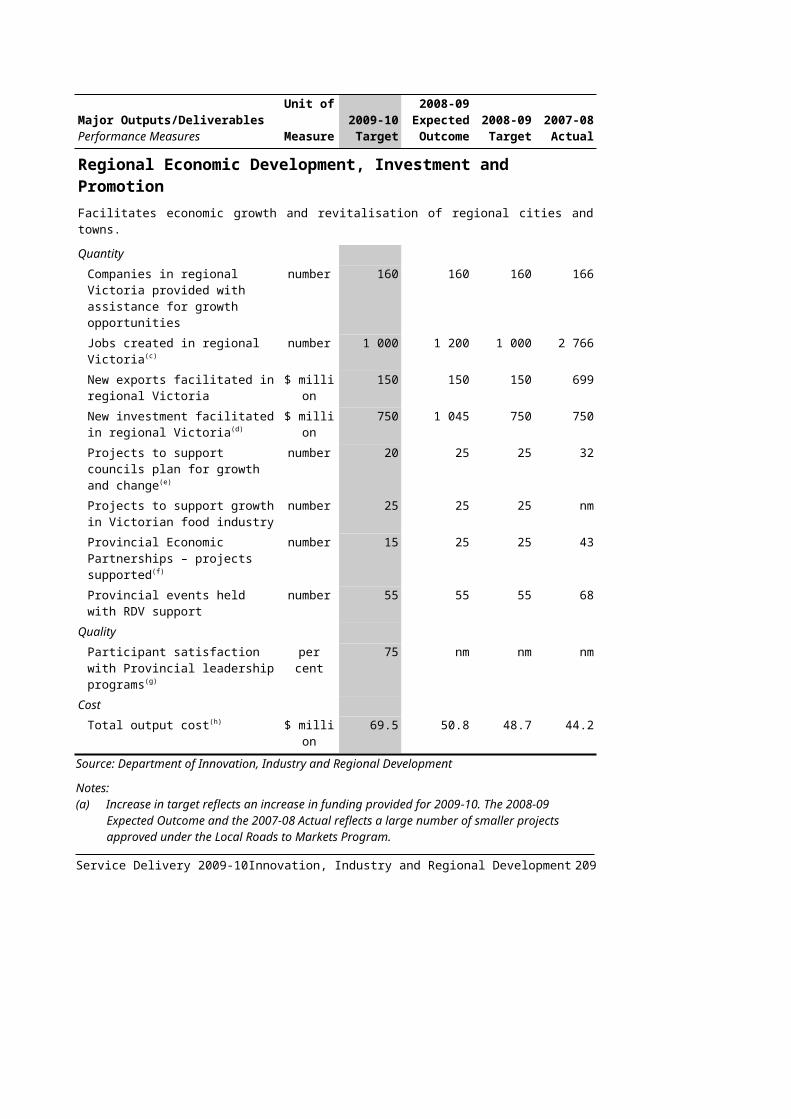
Major Outputs/DeliverablesPerformance Measures
Unit of Measure
2009-10 Target
2008-09 Expected Outcome
2008-09 Target
2007-08 Actual
Regulation and ComplianceProtect the sustainability of Victoria’s primary and energy industries by regulating natural resource use in the public interest. Encourage best practice behaviours through a pro-active approach to self-regulation, while undertaking education, inspection and enforcement services to ensure industry and community compliance with legislation and regulations. Protect the quality and safety of Victoria’s primary products by building and maintaining Victoria’s capability to monitor, detect and respond to disease, pest and residue incidents and outbreaks and other biosecurity threats.
Quantity Animal pest, disease and residue control programs maintained to assist industry to access markets
number 5 5 5 5
Audits completed at mineral and petroleum sites on specific high risk issues(l)
number 100 109 80 84
Environmental and compliance audits of critical minerals and petroleum sites completed
number 60 60 60 nm
Fisheries compliance strategies implemented
number 3 3 3 3
Formal agreements with land managers (public and private) and peak body organisations to undertake agreed pest management practices(m)
number 60 nm nm nm
Landholders complying with pest plant and animal control requirements under the Catchment and Land Protection Act 1994 within agreed timeframes and in targeted areas
per cent 85 85 85 nm
Minerals and petroleum licences, permits and authorities under administration
number 1800 1800 1800 1792
Plant pest, disease and residue control programs maintained to assist industry to access markets
number 6 6 6 6
Properties inspected for invasive plant and animal priority species(n)
number 3800 nm nm nm
State prohibited weeds monitored and where present, treated(o)
per cent 95 nm nm nm
Technical Review Board to complete the review of stability reports for Latrobe Valley coal mines(p)
number 6 nm nm nm
Service Delivery 2009-10 Primary Industries 211

Major Outputs/DeliverablesPerformance Measures
Unit of Measure
2009-10 Target
2008-09 Expected Outcome
2008-09 Target
2007-08 Actual
Quality Compliance with international and national quality assurance standards by meeting certification authorities required performance audits on animal and plant health programs and agriculture/veterinary chemical use
number 3 3 3 3
Compliance with relevant industry standards for animal welfare
per cent >95 >95 >95 96
Enhance or maintain levels of community compliance to achieve sustainability within a fisheries resource and/or area
per cent >90 >90 >90 93
Exploration and mining licences which are not active
per cent <20 <20 <20 21
Levels of compliance are maintained to ensure the sustainability of priority fish species(q)
per cent >90 86.6 >90 91
Timeliness Minerals and petroleum exploration license applications not determined after three months
per cent <5 <5 <5 0
Mining industry work-plans not processed in one month
per cent <5 <5 <5 5.5
Mining licence applications not determined after four months
per cent <5 <5 <5 0
National quality assurance and animal welfare programs implemented within required timelines
per cent >95 >95 >95 100
Response time to animal, pest, disease, residue and disaster incidents
hours <24 <24 <24 <24
Response time to plant pest, disease, residue and disaster incidents
hours <24 <24 <24 <24
Cost Total output cost $ million 97.3 96.4 86.8 101.8
212 Primary Industries Service Delivery 2009-10

Major Outputs/DeliverablesPerformance Measures
Unit of Measure
2009-10 Target
2008-09 Expected Outcome
2008-09 Target
2007-08 Actual
Strategic and Applied Scientific ResearchUse science and innovation to increase the productivity, profitability, sustainability, international competitiveness and export value of primary and energy industries by investing in research and development, new technologies and practices, knowledge and science based tools, and resource information.
Quantity Genetic improvement of dairy cows achieved through breeding contributing to increased milk production and dairy productivity(r)
per cent 1 nm nm nm
Applications for intellectual property protection(s)
number 6 10 10 11
Area of the State for which first generation regional 3D geological models are available(t)
per cent 80 63 63 40
Commercial technology licence agreements finalised(u)
number 20 nm nm nm
International scientific workshops/conferences led/organised by DPI to promote science leadership among peers(v)
number 5 4 4 nm
New key enabling technologies and core science capacity competencies established/upgraded by DPI
number 2 2 2 nm
Postgraduate level PhD students in training by DPI(w)
number 77 72 30 nm
Scientific and technical publications in international and peer review journals that promote productive and sustainable farming (including aquaculture) and fisheries systems(x)
number 375 366 366 352
Value of external (non-state) funding contribution to research projects that support productive and sustainable farming (including aquaculture) and fisheries systems
$ million 38 37.2 37.2 34.3
Timeliness Agrifood, fisheries and natural resource management research and development project milestones and reports completed on time
per cent 85 85 85 83
Service Delivery 2009-10 Primary Industries 213

Major Outputs/DeliverablesPerformance Measures
Unit of Measure
2009-10 Target
2008-09 Expected Outcome
2008-09 Target
2007-08 Actual
Provision of technical advice and diagnostic identification tests on pests and diseases including suspected exotics within agreed timeframes
per cent 90 90 90 92.8
Victorian Initiatives for Minerals and Petroleum (VIMP) data releases meeting timetable
per cent >95 >95 >95 95
Cost Total output cost $ million 211.6 182.3 200.7 168.7
Sustainable Practice ChangeFacilitate the adoption of new ideas and practices, and assist industries and communities to understand, manage and adapt to change driven by economic, social and environmental pressures. Promote trade by enhancing access to markets and securing market opportunities for Victoria.
Quantity Case managed irrigation connections undertaken(y)
number 300 nm nm nm
Existing DPI programs realigned to new programs based on identified needs for farm segments(z)
number 7 3 5 nm
Farm clients facing significant adjustment pressures are case managed to make better informed and more timely decisions(aa)
number 1800 nm nm nm
Farming communities provided with information through Ag Futures Forums about the key drivers of change for agriculture to guide local decision making(ab)
number 10 nm nm nm
Farming families participating in DPI preventative health programs
number 1 000 978 1 000 nm
Practice change and technical publications submitted to conference proceedings and peer review journals(ac)
number 60 70 40 102
Significant customer interactions to facilitate export outcomes(ad)
number 90 80 80 116
Significant stakeholder interactions on climate change, climate variability and emission management(ae)
number 1 500 nm nm nm
Trade barriers identified and strategies developed to overcome them
number 3 3 3 7
214 Primary Industries Service Delivery 2009-10

Major Outputs/DeliverablesPerformance Measures
Unit of Measure
2009-10 Target
2008-09 Expected Outcome
2008-09 Target
2007-08 Actual
Quality Proportion of practice change and technical publications submitted to conference proceedings and peer review journals that are accepted for publication
per cent 90 90 90 92
Satisfaction of clients with services provided
per cent >80 >80 >80 83
Timeliness Evaluation activities completed for key projects
per cent 100 100 100 nm
Project milestone reports completed on-time
per cent 85 85 85 88
Cost Total output cost $ million 163.1 214.7 142.8 280.8
Source: Department of Primary Industries
Notes:(a) The increase in the 2008-09 Expected Outcome is due to an expansion of security supply exercise
activities in 2008 and the number of exercises is expected to be maintained in 2009-10.(b) The decrease in the 2009-10 Target reflects the cessation of funding for the Gold Undercover
program partly offset by information packages to be released through other initiatives.(c) The increase in the 2008-09 Expected Outcome reflects an increase in strategic policy advice relating
to drought and emergency response.(d) The increased 2009-10 Target reflects the development of a number of significant management plans,
such as the Goulburn Broken plan that will specify management arrangements in fire affected areas.(e) The increase in the 2008-09 Expected Outcome is due to multiple applications for smaller-scaled
projects in 2008. The number of approvals is expected to normalise in 2009-10 reflecting larger scale projects.
(f) The 2008-09 Expected Outcome reflects an increased demand for briefings in renewable energy, including large scale solar generation and the feed-in tariff policy. The 2009-10 Target has been increased in line with new funding provided through the 'Reforming of the National Energy Market' initiative.
(g) The 2008-09 Expected Outcome is below target due to staff diversion to emergency response activities during February. This was partially addressed through commissioning of additional staff resources during March. However, three milestones will now be completed in early 2009-10 for completion.
(h) This new measure reflects the next stage of the Future Energy – Energy Technology Innovation Strategy large-scale program scheduled for 2009-10.
(i) This is a new measure for 2009-10 reflecting the progress within the Gippsland Basin dynamic modelling initiative.
(j) This new measure reflects the work program for large-scale demonstration projects within the Energy Technology Innovation Strategy initiative.
(k) This new measure reflects the work program for the R&D grants allocated as part of the Energy Technology Innovation Strategy initiative.
Service Delivery 2009-10 Primary Industries 215
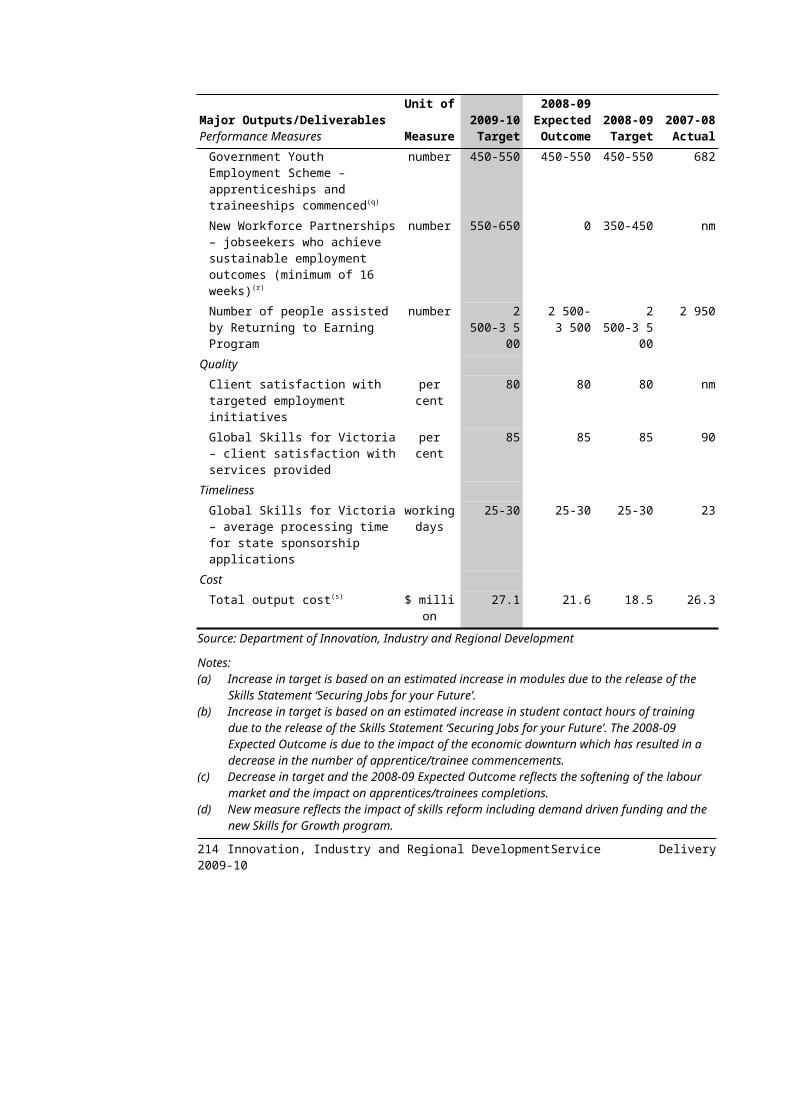
Notes (continued):(l) The increase in the 2008-09 Expected Outcome is due to an expansion of the scope of the audit of
weeds and pests at mine and extractive sites, following identification of a higher number of issues at sites audited during the early phase of the program. This has resulted in a higher number of audits being completed. The scope of the audit program for 2009-10 has been increased in line with the expansion of the audit program achieved in 2008-09 activities.
(m) This new measure replaces two measures: 'Agreements with local government to control pests on roadsides' in the Sustainable Practice Change Output and 'Signed land manager (public and private) agreements to undertake agreed improved land management practices' from the Regulation and Compliance Output.
(n) This is a new measure for 2009-10 which will report on the number of private properties inspected for weeds and rabbits.
(o) This measure replaces the discontinued measure 'Number of state prohibited weed infestations treated'.
(p) This is a new measure for 2009-10 reflecting the establishment of a technical review board to review geotechnical issues associated with the Latrobe Valley coal mines.
(q) The 2008-09 Expected Outcome is slightly below target due to reallocation of fisheries officers to bushfire response and recovery activities which resulted in a reduced presence in the field.
(r) This is a new measure to replace the discontinued measure 'Annual percentage increase in Victorian milk production based on 2007-08 levels'.
(s) The 2009-10 Target has been reduced due DPI's strategy for plant research and development now focussing on the generation of pre-commercial intellectual property which will result in fewer plant breeding rights applications.
(t) The increase in the 2009-10 Target reflects the progress of the 3D program, which forms part of the ‘Rediscover Victoria’ initiative.
(u) This measure will replace the discontinued measure 'Number of commercial technology research and development agreements finalised'.
(v) The 2009-10 Target has been increased due to projected growth as a result of increased funding provided through the Future Farming Strategy in the 2008-09 Budget.
(w) The increased 2008-09 Expected Outcome is mainly due to the availability of new students. The 2009-10 Target is higher due to the consolidation of this measure with the measure 'New Postgraduate students engaged' and has also been increased in line with the expected outcome for 2008-09.
(x) The 2009-10 Target has been increased due to a projected increase in publications associated with the Channel Deepening Project.
(y) This is a new measure aligned to funding provided in the 2008-09 Budget for the Future Farming Strategy action 'Changing irrigation practices'.
(z) The 2008-09 Expected Outcome is expected to be below target due to additional external consultancies being undertaken in the start up phase of the 'State-of-the-Art Services to Farm Businesses' initiative to ensure the service delivery strategy is accurate. The redirection of effort into the planning phase has resulted in a strategy that has been signed off and is now moving to full implementation. The 2009-10 Target has been increased to reflect this and include the deferred activities.
(aa) This is a new measure to replace the existing measure 'Number of targeted areas in which DPI will conduct additional case management for adjustment'.
(ab) This is a new measure to replace the discontinued measure 'Number of regional communities actively supported through structural adjustment programs'.
(ac) The increase in the 2008-09 Expected Outcome and 2009-10 Target is due to wider coverage of staff and additional opportunities to provide papers.
(ad) The increase in the 2009-10 Target is due to an expected gain in delivery efficiencies arising from experience in this field.
(ae) This is a new measure aligned to funding provided in the 2008-09 Budget for the Future Farming strategy action 'Planning for climate change'.
216 Primary Industries Service Delivery 2009-10
DEPARTMENT OF SUSTAINABILITY AND ENVIRONMENT
Departmental mission statementThe Department of Sustainability and Environment (DSE) is Victoria’s primary government agency responsible for promoting and managing the sustainability of the natural environment. The Department is committed to setting the standard for managing the environment and ensuring all Victorians are living sustainably.
The Department’s primary functions are:
water management;
public land fire management;
climate change and greenhouse policy;
nature and biodiversity conservation;
public land stewardship across forests, coasts, alpine resorts, Crown land reserves and parks; and
the promotion of sustainable resource use and management practices by industry and the general community.
Significant challenges facing the Department in the medium termWater scarcity continues to be a key challenge facing the Department. The unprecedented and severe drought has continued to highlight the importance of water to the State’s economy, way of life and the health of the environment. It also highlights the potential for another significant challenge for the Department, severe fire danger and large bushfire outbreaks.
This year has been marked by the devastating February bushfires. In response, the Government has already announced a range of bushfire relief measures and funding commitments, and has also established the Victorian Bushfire Reconstruction and Recovery Authority to oversee and coordinate Victoria’s largest ever recovery and rebuilding program. The rehabilitation of bushfire affected areas will continue to be a priority across government. The Department and its partner agencies will also focus on fire management in an environment increasingly facing larger and more frequent bushfires.
Major policy directions and strategiesIn response to the major challenges and opportunities faced by the State, the Department’s strategic priorities include securing our water resources into the future, responding to the increasing fire threat, promoting new standards for protecting the natural environment and adapting effectively to the impacts of climate change.
Service Delivery 2009-10 Sustainability and Environment 217
In June 2007, the Victorian Government released Our Water Our Future – the Next Stage of the Government’s Plan, which provides long-term solutions to secure Victoria’s water supplies. Major projects announced at that time, worth in excess of $4 billion, remain on track for urgent delivery.
The Department also continues its work in the natural resource area and will release the Land and Biodiversity at a Time of Climate Change Strategy in 2009. This strategy will be a key policy for the Government in determining the direction of land and biodiversity policy and investment in the long term.
These strategic priorities provide the context for service delivery by the Department under the following outcomes:
healthy and productive water systems;
healthy and productive land;
healthy, productive and accessible marine, coastal and estuarine systems;
flourishing biodiversity in healthy ecosystems;
clean air, liveable climate;
less waste, less pollution; and
land information and property information.
Ministerial portfoliosThe Department supports the ministerial portfolios of Water, and Environment and Climate Change.
Changes to the output structure The Department has made changes to its output structure in 2009-10, as shown in the table below.
2009-10 Outputs Reason 2008-09 OutputsForests and Parks New output Relevant performance
indicators transferred from ‘Public Land’ and ‘Natural Resources’ outputs
During 2007-08, the Department undertook an extensive review of its performance measures. Where necessary, performance measures were amended or new performance measures developed to provide greater transparency and accountability in relation to output delivery.
Discontinued performance measures are detailed in Appendix C of this budget paper.
The following table summarises the total output cost. It has been prepared on the basis of the Department’s 2009-10 output structure and therefore allocations may differ from the Department’s previously published budget.
218 Sustainability and Environment Service Delivery 2009-10

Table 3.8: Output Structure($ million)
2008-09 Budget
2008-09 Revised
2009-10 Budget
Variation (a)
%Healthy and Productive Water Systems (b) 277.0 499.0 389.4 40.6Healthy and Productive Land; Healthy,
Productive and Accessible Marine, Coastal and Estuarine Systems; and Flourishing Biodiversity in Healthy Ecosystems
689.9 1 062.8 676.8 -1.9
Less Waste, Less Pollution; and Clean Air, Liveable Climate (c)
210.4 201.8 195.9 -6.9
Land Administration and Property Information 127.6 137.7 125.5 -1.6Total (d) 1 304.9 1 901.3 1 387.6 6.3Source: Department of Sustainability and Environment
Notes:(a) Variation between 2008-09 Budget and 2009-10 Budget.(b) The 2009-10 Budget estimate includes additional funding for water savings projects including the
Northern Victoria Irrigation Renewal Project, Shepparton Irrigation Area Modernisation Project and the Lake Mokoan Water Recovery Project.
(c) The 2009-10 Budget estimate includes a revised level of grants from the Hazardous Waste Fund and additional grants from the Sustainability Fund.
(d) Total output expense may not equate to the total expense reported in Budget Paper No. 4, Chapter 3, Departmental Financial Statements due to additional expenses in Budget Paper No. 4 that are not included in departmental output costs.
The following section provides details of the outputs to be provided to Government, including performance measures and costs for each output. Total expenditure for the Department can be found in Budget Paper No. 4, Chapter 3, Departmental Financial Statements.
Service Delivery 2009-10 Sustainability and Environment 219
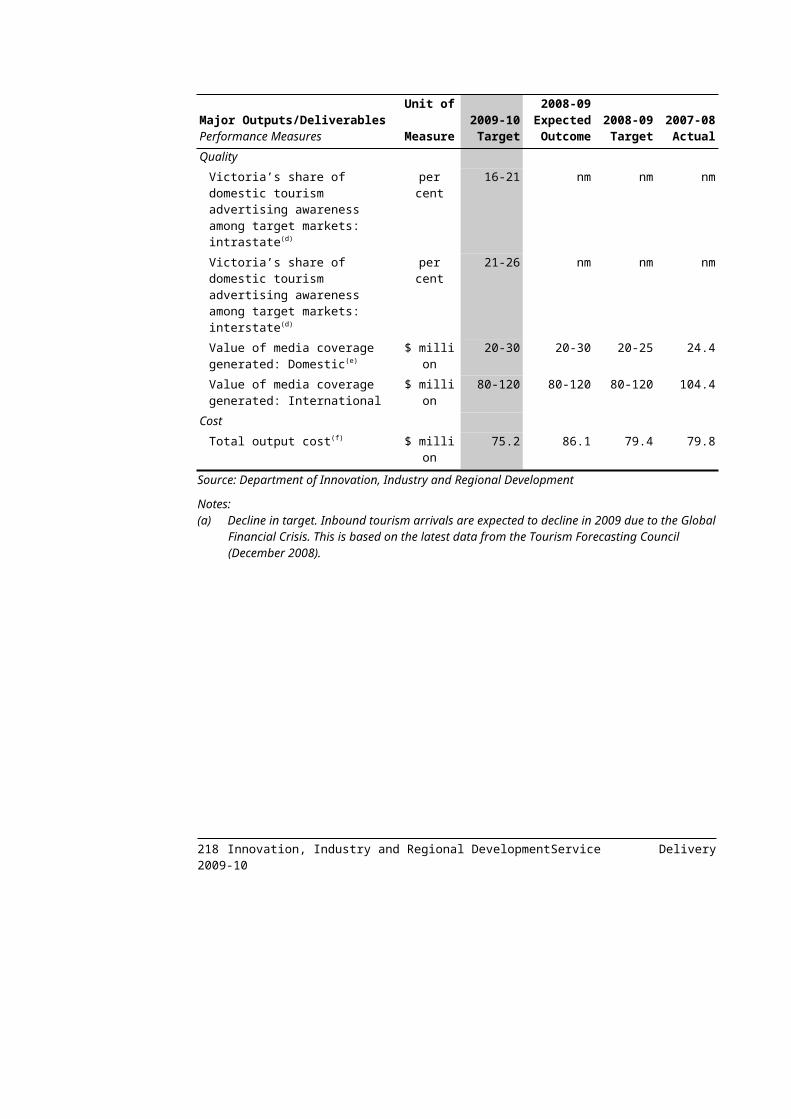
Healthy and Productive Water SystemsEffective management of Victoria’s water supply and its quality is fundamental to our economy, society and environment. Issues requiring continued attention include salinity, the health of rivers and estuaries, reliable water supply for growing urban populations and agricultural sectors, and water quality and pricing.
These issues cannot be addressed and managed in isolation. Strong partnerships and understanding between all levels of government, the community, major users, water authorities, catchment management authorities and private investors are vital to delivery of healthy and productive water systems.
The Department will work with the Victorian community and organisations to deliver Healthy and Productive Water Systems by working toward the following suboutcomes:
effective water management and allocation;
healthy rivers and aquifers;
irrigation water reform;
urban water reform; and
effective governance and pricing.
Major Outputs/DeliverablesPerformance Measures
Unit of Measure
2009-10 Target
2008-09 Expected Outcome
2008-09 Target
2007-08 Actual
Sustainable Water Management and SupplyDevelops policies, provides oversight of, and strategic advice on, regulatory systems and institutional arrangements to drive the sustainable management and efficient use of Victoria's water resources. Key areas within this output include river health, sustainable irrigation, ground and surface water, water reuse and recycling, and water sector agency governance and pricing.
Quantity Compliance with the Murray Darling Basin Agreement to maintain a balance in the Salinity Register such that the total of salinity credits is in excess of, or equal to, the total of salinity debits
number >0 19.35 >0 20.45
Cumulative water savings realised through water recovery projects(a)
mega litres
522 900 369 100 429 600 192 000
Estimated net reduction in total load of nitrogen and phosphorus in urban and rural water systems(b)
number (tonnes)
15.7 14.7 320 nm
Expected water savings through water recovery projects currently being implemented(a)
mega litres
153 800 160 300 210 300 187 000
Length of rivers where works have been undertaken to improve instream health(c)
km 33 32 77 nm
220 Sustainability and Environment Service Delivery 2009-10

Major Outputs/DeliverablesPerformance Measures
Unit of Measure
2009-10 Target
2008-09 Expected Outcome
2008-09 Target
2007-08 Actual
Length of river where works have been undertaken, or river frontage protected, to improve the vegetation in the streamside zone(c)(d)
km 2 274 2 335 582 nm
Length of river where works have been undertaken to stabilise bank erosion(c)
km 63 61 84 nm
Rebates approved to households for improved water efficiency in the house and garden
number 34 000 32 800 32 800 31 877
Rivers with improved environmental flow regimes being delivered
number 20 20 20 20
Unconfirmed water shares on the water register
per cent 5 5.3 6 nm
Upgrade or construction of additional bore sites(e)
number 80 80 42 1
Water information products delivered to support government priorities for sustainable water management
number 5 5 5 nm
Quality Bulk water entitlements / environmental entitlements being complied with to ensure security of supply, environmental flows and compliance with caps
per cent 100 100 100 99
Timeliness Posting of the monthly water report to the Our Water Our Future website within agreed timeframes
per cent 100 100 100 nm
Statutory obligations of Water Corporations complied with, including annual reports and audits, corporate plans, and exercises under the Terrorism (Community Protection) Act 2003
per cent 100 100 100 nm
Urban water reform policy projects completed within agreed timeframes
per cent 90 100 90 nm
Service Delivery 2009-10 Sustainability and Environment 221
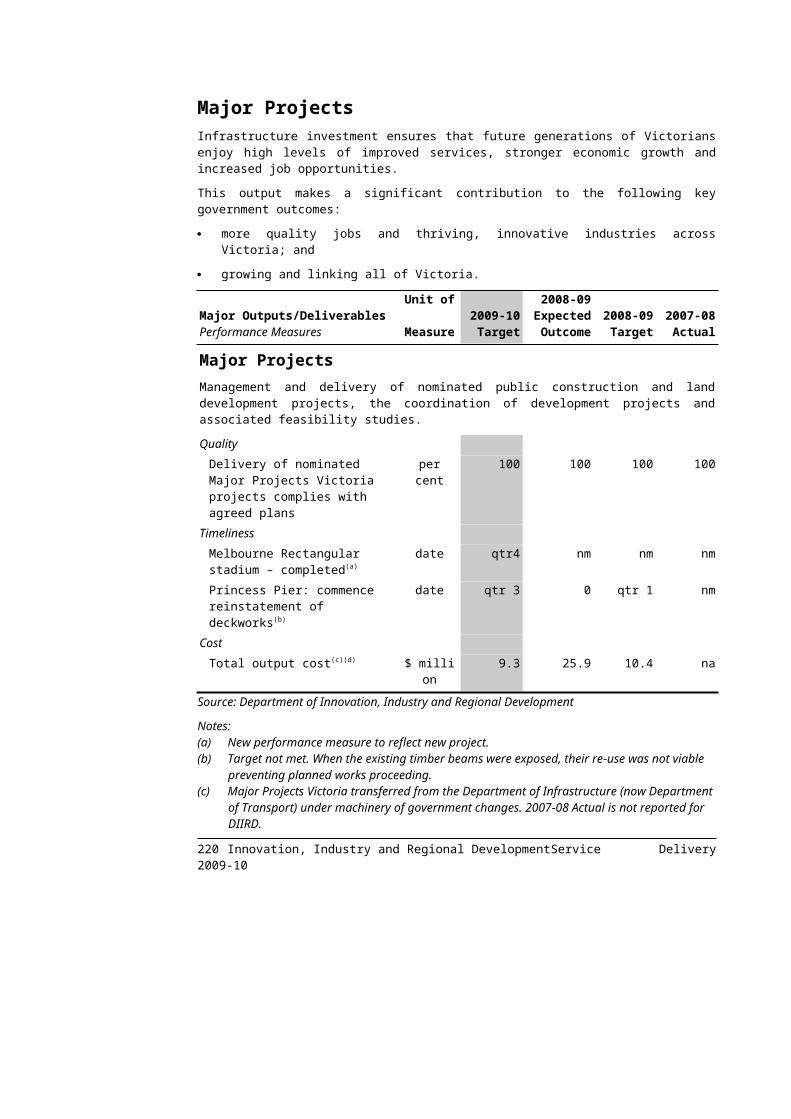
Major Outputs/DeliverablesPerformance Measures
Unit of Measure
2009-10 Target
2008-09 Expected Outcome
2008-09 Target
2007-08 Actual
Water conservation and alternative supply programs implemented, such as water behavioural change, alternative supply, industry recycling, stormwater and urban recycling within agreed timeframes(f)
per cent 100 100 100 nm
Water markets and regulatory reform policy projects completed within agreed timeframes
per cent 90 100 90 nm
Cost Total output cost $ million 389.4 499.0 277.0 359.9
Source: Department of Sustainability and Environment
Notes:(a) The 2008-09 Expected Outcomes are less than the 2008-09 Targets due to minor revisions to the
timing of works, with savings expected in early 2009-10. (b) Following the implementation and measurement of this indicator, it was determined that the 2008-09
Target was overstated. The 2009-10 Target has therefore been amended to more accurately reflect expected actual outcomes.
(c) The 2008-09 Expected Outcome relating to instream health is less than the 2008-09 Target due to ongoing dry conditions. These conditions saw changes in regional works programs which allowed additional focus on vegetation and erosion. As a result, the 2008-09 Expected Outcomes relating to vegetation in the streamside zone and the stabilisation of bank erosion are higher than the 2008-09 Target.
(d) The 2007-08 Actual figure is the collation of actions associated with riparian, instream and bank stabilisation activities. From 2008-09, target descriptions have been revised to provide a more comprehensive outline of the three separate river health program actions.
(e) The 2008-09 Expected Outcome is higher than the 2008-09 Target due to a higher number of new and replacement bores than anticipated in the first half of the year.
(f) This performance measure replaces the 2008-09 performance measure ‘Water Conservation and Alternative Supply programs implemented, such as Water Behavioural Change, Alternative Supply, Industry Recycling, Stormwater and Urban Recycling, within agreed timeframes’. The 2009-10 performance measure reflects changes to project funding.
222 Sustainability and Environment Service Delivery 2009-10
Healthy and Productive Land; Healthy, Productive and Accessible Marine, Coastal and Estuarine Systems; and Flourishing Biodiversity in Healthy EcosystemsThe health of Victoria’s land and marine environments underpins the growth and prosperity of the state, as there is a direct relationship between the health of these environments, and the health of the ecosystems they support. Through this output, the Department contributes to the facilitation of commercial and recreational activities, and the need to maintain an ecologically healthy and sustainable terrestrial and coastal environment.
Through these outcomes, the Department is working towards ensuring:
land is productive and is used profitably within its capacity and sustainable limits;
infrastructure on public land and in coastal environments is appropriate and well managed;
detrimental impacts of fire and other episodic acute events on land and within the community are minimised;
the condition of marine, coastal and estuarine environments is protected, maintained and improved; and
key biodiversity assets, priority habitats and ecological processes are healthy and secure.
Service Delivery 2009-10 Sustainability and Environment 223

Major Outputs/DeliverablesPerformance Measures
Unit of Measure
2009-10 Target(a)
2008-09 Expected
Outcome(a)2008-09
Target2007-08
Actual
Public LandThis output provides for the management of Victoria's crown land, including the coast and marine environment. This output works towards the improved stewardship of natural, built and historic assets, and incorporates management of public land in partnership with statutory agencies, committees and local government. This output recognises the value of a public land estate that can adapt to climate change and cater for community expectations.
Quantity Crown land leases directly managed by the Department of Sustainability and Environment
number 500 500 500 nm
Crown land licenses issued number 40 000 40 000 40 000 nmParticipants in Coast Action / Coastcare activities
number (‘000)
25 25 25 25
Threatened native species and communities for which specifically targeted conservation measures are in place at Royal Botanic Gardens
number 15 15 15 15
Visitors to Zoos Victoria at Melbourne, Werribee and Healesville
number (million)
1.3 1.37 1.37 nm
Quality Beach protection assets repaired number 3 2 2 2Critical local port assets replaced or undergoing major maintenance
per cent 15 15 15 17
Crown land reserves that have appointed delegated managers
per cent 90 90 90 nm
Timeliness Rent reviews of Crown land leases undertaken within specified time frames
per cent 95 95 95 nm
Cost Total output cost(b) $ million 144.4 152.1 259.7 281.0
224 Sustainability and Environment Service Delivery 2009-10

Major Outputs/DeliverablesPerformance Measures
Unit of Measure
2009-10 Target(a)
2008-09 Expected
Outcome(a)2008-09
Target2007-08
Actual
BiodiversityThe Department works with land managers and a range of other organisations to protect, enhance and restore biodiversity assets, maintain ecological assets and provide for the sustainable use of Victoria's flora and fauna. The Department also improves the understanding of ecosystem services to better inform land use decisions, and will conduct terrestrial and freshwater ecological research to support the management and protection of biodiversity assets across the state.
Quantity Land for wildlife properties which include habitat under-represented in the reserve system
per cent 30 37 30 38
Number of Native Vegetation Credit Trading Agreements signed through the BushBroker program
number 45 45 45 nm
Quality Presentations made and scientific publications in peer reviewed journals(c)
number 60 55 60 85
Timeliness Game and Wildlife Licence renewals processed by target dates
per cent 95 95 95 97
Cost Total output cost $ million 51.3 60.4 48.6 42.5
Natural ResourcesThis output leads policy and investment in research for the achievement of highly productive and sustainable landscapes. The output contributes to the national land policy and provides a partnership approach with communities, Catchment Management Authorities, other government agencies and research institutes for improvement in the condition of our state's natural assets through policy implementation, program design, project investment, monitoring and reporting.
Quantity Area covered by the regional landscape change projects
hectares (million)
1.1 1.1 1.1 nm
Community members participating in Landcare activities(d)
number 45 000 26 123 26 123 nm
Regional Catchment Investment Plans proposing natural resources improvement projects submitted, assessed and recommended to responsible minister/s for funding
number 10 10 10 10
Regional landscape change projects being implemented
number 9 9 9 nm
Service Delivery 2009-10 Sustainability and Environment 225

Major Outputs/DeliverablesPerformance Measures
Unit of Measure
2009-10 Target(a)
2008-09 Expected
Outcome(a)2008-09
Target2007-08
ActualQuality
Corporate Plans submitted by Catchment Management Authorities are aligned with ministerial guidelines and template, and meet the requirement of relevant Acts
per cent 100 100 100 nm
Regional Catchment Investment Plans align with Government directions
per cent 100 100 100 nm
Timeliness All Regional Catchment Investment Plans submitted to minister/s for approval by the prescribed date
date Jun 2010
Jun 2009
Jun 2009
nm
Catchment Management Authority Corporate Plans submitted to the minister by the prescribed date
number 10 10 10 nm
Cost Total output cost(b) $ million 126.3 159.5 195.1 199.1
Land and Fire ManagementThis output covers activities under an integrated land and fire management framework, for the effective planning and management of fire across public land. It includes: preparedness activities such as fuel reduction burning which aims to reduce the severity and incidence of bushfires, and maintenance of roads and bridges for ready access during suppression efforts; prevention activities associated with minimising the incidence of bushfires, particularly those caused by human activity through community engagement and education; response activities including the preparation and implementation of processes and procedures to respond to bushfires and other natural emergencies; and recovery activities to manage the health and wellbeing of staff, assess the impact of natural emergencies on the environment and implement a rehabilitation plan to assist the re-establishment of natural communities.
Quantity Bridges and stream crossings replaced or repaired to enable safe access for rapid bushfire response, tourism and commercial operators during the current reporting period(c)
number 80 15 60 nm
Community engagement plans developed and implemented
number 5 5 5 10
Cumulative number of bridges replaced or repaired to enable safe access for rapid bushfire response, tourism and commercial operators(c)
number 95 15 60 nm
226 Sustainability and Environment Service Delivery 2009-10

Major Outputs/DeliverablesPerformance Measures
Unit of Measure
2009-10 Target(a)
2008-09 Expected
Outcome(a)2008-09
Target2007-08
ActualFuel reduction burning completed to protect key assets
hectares 130 000 130 000 130 000 156 473
Personnel with accreditation in a fire role
number 1 500 1 500 1 500 1 664
State Forest bridges (on Category 1 roads) with documented inspections
per cent 100 100 100 nm
State Forests roads (Category 1) with documented inspection and maintenance programs
per cent 100 100 100 nm
Quality Fire controlled at less than five hectares
per cent 75 75 75 90
Proportion of personnel accredited to serve in a senior capacity (level 2 or 3) in a fire role
per cent 15 15 15 15
Timeliness Assessments of standards of cover completed prior to fire season
date Nov 2009
Nov 2008
Nov 2008
Dec 2007
District Fire Operations Plans completed
date Oct 2009
Oct 2008
Oct 2008
Oct 2007
Fires controlled at first attack per cent 75 75 75 72.7Readiness and Response Plans completed prior to fire season
date Dec 2009
Dec 2008
Dec 2008
Dec 2007
Cost Total output cost $ million 198.1 548.3 186.5 223.0
Forests and ParksThis output provides for the management of Victoria's State-run parks and forests. Through this output, the Department manages the balance between development and protection of natural, cultural and community assets for enjoyment and sustainable use. This output works towards the improved stewardship of Victoria's parks and forests and incorporates direct and delegated management of public land. The output recognises the value of the land, and the need to ensure its availability to future generations and present and future sustainable use of our valuable forest resources by overseeing commercial forestry operations conducted on native forests.
Quantity Parks managed by Parks Victoria, assessed as high priority for weeds and pest control(b)(c)
per cent 70 70 80 nm
Total area of estate managed by Parks Victoria(b)
hectares (‘000)
3 970 3 969.5 3 950 nm
Visitors to Parks Victoria managed estate(b)
number (million)
73-76 73-76 73-76 76.1
Service Delivery 2009-10 Sustainability and Environment 227
Major Outputs/DeliverablesPerformance Measures
Unit of Measure
2009-10 Target(a)
2008-09 Expected
Outcome(a)2008-09
Target2007-08
ActualQuality
Bay assets with greater than five years life expectancy(b)(e)
per cent 70-75 70-75 70-75 77
Commercial timber harvesting operations consistent with timber release plans and wood utilisation plans(b)
per cent 100 100 100 nm
Park assets with a life expectancy greater than five years(b)(c)
per cent 75-80 70-75 80-85 nm
Recreational facilities in State Forests with a life expectancy greater than five years(b)
per cent 80 70-75 80 nm
Cost Total output cost(b) $ million 156.7 142.5 0.0 0.0
Source: Department of Sustainability and Environment
Notes: (a) It is anticipated that there may be impacts on 2008-09 Expected Outcomes and potentially 2009-10
Targets from the February 2009 bushfires but the full extent of these impacts will not be known until further evaluation can be undertaken after the current fire season.
228 Sustainability and Environment Service Delivery 2009-10

Notes (continued):(b) These measures have been moved from the Public Land and Natural Resources outputs, to a new
output statement to reflect the creation of a Forests and Parks Division within the Department. No amendments have been made to performance indicator descriptions, targets or expected outcomes. There is also an impact on associated output costs as a result of these movements. The 2007-08 Actual and 2008-09 Budget figures for the Natural Resources and Public Land outputs reflect those published within 2008-09 Budget Paper No. 3 and the Department’s 2007-08 Annual Report. The 2008-09 Revised and 2009-10 Target figures have been revised to take into account the creation of the new Forests and Parks output.
(c) The 2008-09 Expected Outcome is lower than the target due to the impacts of the February 2009 bushfires and the need to divert resources to fire suppression activities.
(d) The 2008-09 Target has increased as this performance measure will also now report on the number of members of other community natural resource management groups supported by the Department as well as Landcare groups.
(e) This performance measure replaces the 2008-09 performance measure ‘Piers and jetties with greater than five years life expectancy’. The measure now includes piers, jetties, breakwaters, and navigational aids in local ports of Port Phillip and Westernport bays.
Service Delivery 2009-10 Sustainability and Environment 229
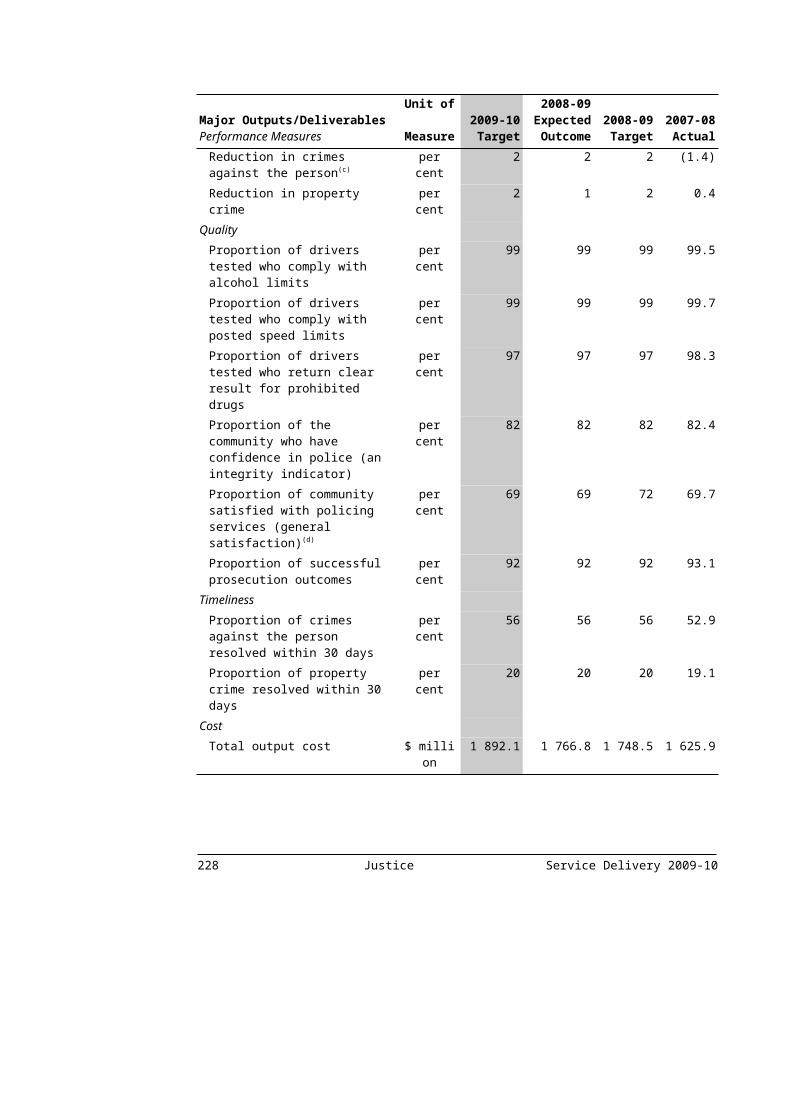
Less Waste, Less Pollution; and Clean Air, Liveable ClimateAir quality is central to the liveability of our cities and towns, and is also vital to our wellbeing. The Department is working toward the delivery of the ‘Clean Air, Liveable Climate’ outcome by working toward ensuring:
net greenhouse gas emissions in Victoria are reduced;
high air quality; and
Victoria’s capacity to adapt to the impacts of climate change is increased.
As our standard of living increases, Victorians are consuming more goods and services, generating waste and putting pressure on our natural environment and its resources. Although there has been a significant increase in recycling activities over the last decade, the amount of waste generated also continues to rise. To address the imbalance, through the ‘Less Waste, Less Pollution’ outcome, the Department is working towards ensuring:
the unnecessary or inefficient use of resources is avoided;
used resources are reused or recycled; and
unusable waste is effectively managed and disposed of safely.
Major Outputs/DeliverablesPerformance Measures
Unit of Measure
2009-10 Target
2008-09 Expected Outcome
2008-09 Target
2007-08 Actual
Environmental Policy and Climate ChangeThrough this output, the Department leads the development and implementation of strategic, whole of government responses to issues around environmental sustainability and climate change.
Quantity Major policy papers, strategy reviews or research papers completed
number 7 7 7 7
Total number of councils participating in the Victorian Local Sustainability Accord(a)
number 69 69 62 nm
Quality Greenhouse response actions managed and administered
per cent 95 95 95 95
Cost Total output cost $ million 77.0 77.1 77.6 44.4
230 Sustainability and Environment Service Delivery 2009-10
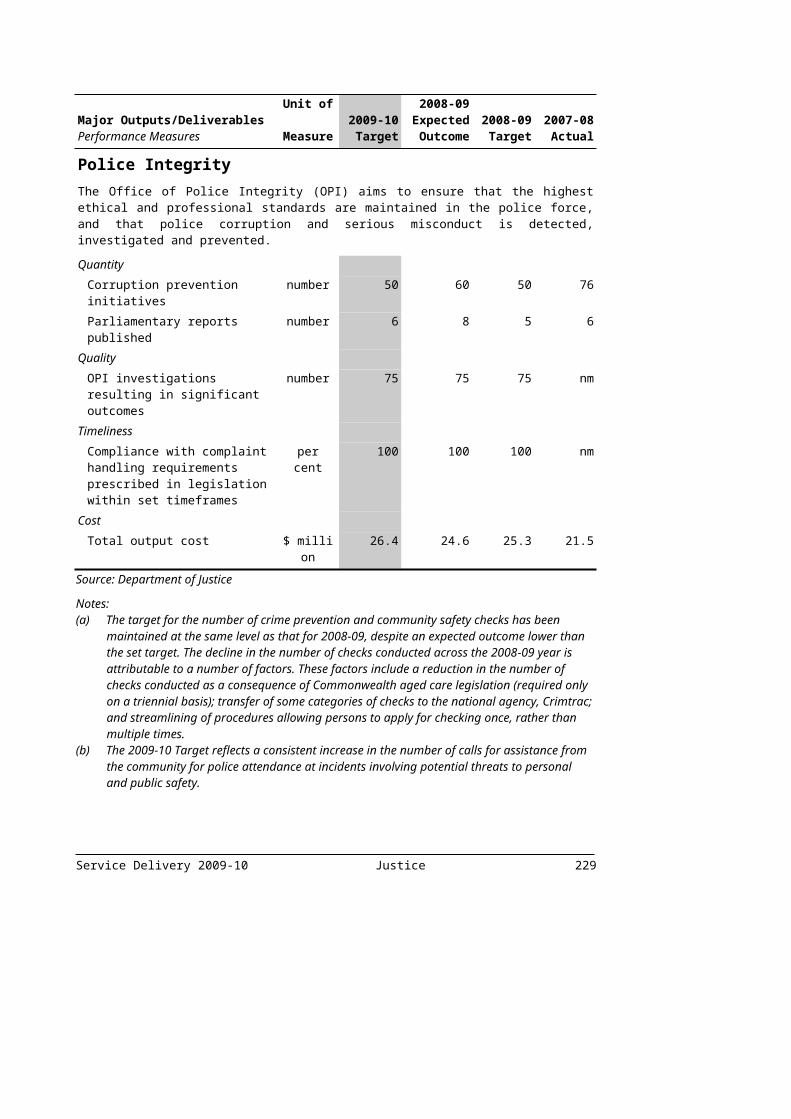
Major Outputs/DeliverablesPerformance Measures
Unit of Measure
2009-10 Target
2008-09 Expected Outcome
2008-09 Target
2007-08 Actual
Statutory Activities and Environment ProtectionThe purpose of this output is to protect, care for and improve beneficial uses of the environment by developing statutory and non-statutory processes, setting and enforcing goals and standards, and undertaking monitoring and research which ensures that: beneficial uses of water are protected; waste reduction, recycling and improved management of residual waste occurs; noise in the community is managed; contamination of land and groundwater is prevented; better management of air quality is promoted, global air quality issues are addressed; and through collaboration, communication and information programs, greater community involvement and ownership of environmental issues are promoted.
Quantity Environmental condition research reports issued, improvement tools, guidelines, policies, systems and plans completed and issued
number 54 50 50 nm
Quality Compliance with statutory requirements, as a proportion of assessments of discharge licences and enforcement notices
per cent 87 85 85 86
Hours during which air quality standards were met, as a proportion of hours in the reporting cycle(b)
per cent 99 98 99 98
Land audits complying with statutory requirements and system guidelines
per cent 90 90 90 91
Timeliness Pollution incident reports acted on within three days
per cent 92 90 90 88
Statutory actions completed within required timelines
per cent 96 95 95 95
Cost Total output cost $ million 118.9 124.7 132.8 102.7
Source: Department of Sustainability and Environment
Notes:(a)The 2008-09 Expected Outcome is higher than the 2008-09 Target due to the work of the Accord
becoming better known.(b) The 2008-09 Expected Outcome is lower than the target due to the impacts of the February 2009
bushfires.
Service Delivery 2009-10 Sustainability and Environment 231
Land Administration and Property InformationEffective property markets are of fundamental importance to economic development in Victoria. Trusted systems and information services ensure confidence and security in ownership, property boundaries and valuation. Emerging markets, such as those relating to water, can capitalise on the systems and infrastructure already established in Victoria for management of land transactions.
232 Sustainability and Environment Service Delivery 2009-10
Major Outputs/DeliverablesPerformance Measures
Unit of Measure
2009-10 Target
2008-09 Expected Outcome
2008-09 Target
2007-08 Actual
Land Administration and Property InformationThrough the ‘Land Administration and Property Information’ outcome, the Department is working towards ensuring: confidence in integrity and efficiency of the property system; accessible and transparent property markets; established and accepted natural resource markets; and comprehensive and accessible spatial information.
Quantity Land dealings registered(a) number
(‘000)640 630 750 779
Maps generated on Land Channel(b)
number (‘000)
11 000 nm nm nm
Planning certificates issued(a) number 30 000 32 000 45 000 40 716Proportion of title searches supplied (remotely) online
per cent 93 93 93 94.4
Reports generated on Land Channel(b)
number (‘000)
900 nm nm nm
Title searches supplied(a) number (‘000)
1 969 1 930 2 100 2 186
Quality Audited Vicmap digital map base not requiring correction
per cent 97 98.5 97 98.5
Properties sold, bought or leased within 10 per cent of valuation
per cent 80 80 80 80
Timeliness Land dealings registered within five days(c)
per cent 93 98.5 93 98.5
New Titles (subdivisions) created within three weeks
per cent 93 95 93 96.2
Update transactions for the Vicmap digital map base processed within the required timeframes(d)
per cent 95 99.9 95 99.8
Cost Total output cost $ million 125.5 137.7 127.6 95.6
Source: Department of Sustainability and Environment
Notes:(a) The 2008-09 Expected Outcome is less than the 2008-09 Target due a reduction in property
transactions. This trend is expected to continue in 2009-10, therefore the 2009-10 Target has been revised downward.
(b) This measure is being introduced for the 2009-10 year, therefore there are no 2007-08 Actual figures or 2008-09 Expected Outcomes to report.
(c) The 2008-09 Expected Outcome is greater than the 2008-09 Target due to productivity improvements in processing.
Service Delivery 2009-10 Sustainability and Environment 233
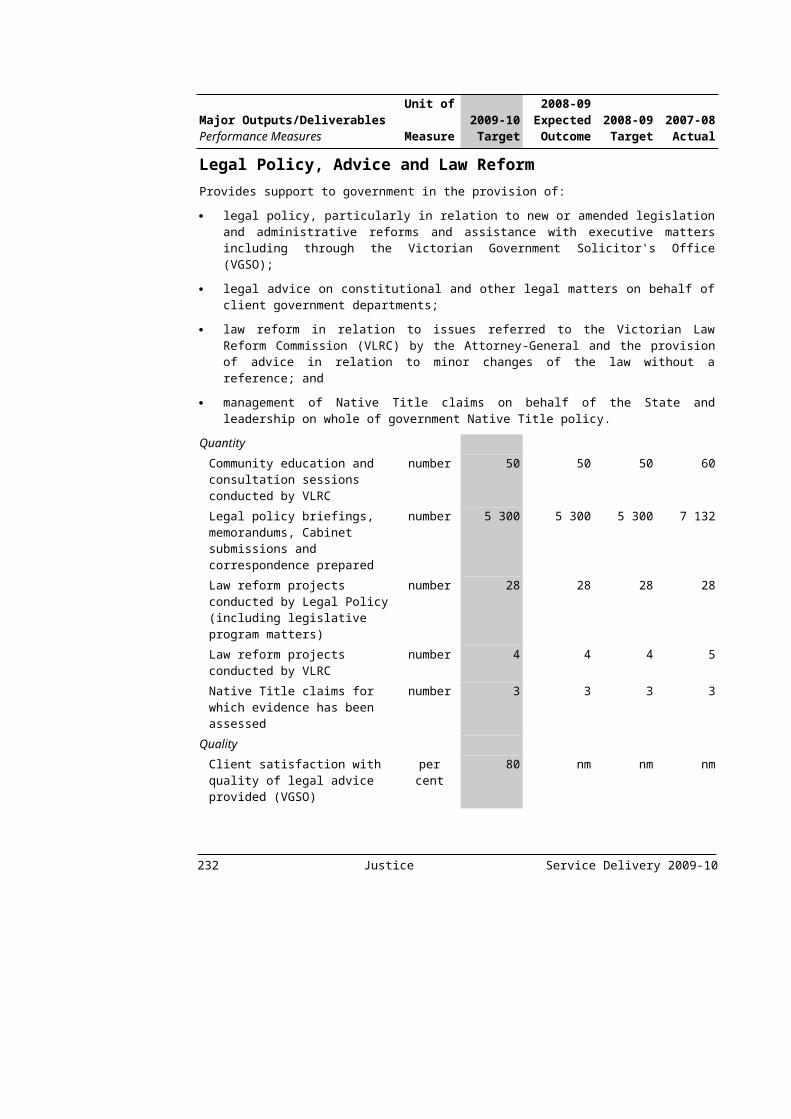
(d) The 2008-09 Expected Outcome is greater than the 2008-09 Target as auditing has confirmed that VicMap property maintenance is being carried out in accordance with contract timeframes and exceeding the minimum requirements.
234 Sustainability and Environment Service Delivery 2009-10

DEPARTMENT OF TRANSPORT
Departmental mission statementThe Department of Transport’s mission is to build a safer, fairer and greener transport system for all Victorians to create a more prosperous and connected community.
The Department will do this by:
integrating transport and land use planning to shape Victoria and link jobs, services and homes;
strengthening the connections between regional, rural and metropolitan Victoria so all parts of the State share in prosperity;
taking practical steps to increase the capacity, frequency, reliability and safety of the public transport network, and move towards a modern metro system;
linking our communities by closing gaps, reducing congestion and improving safety on the road network;
moving towards a sustainable and lower emissions transport system to help Victorians preserve their environment; and
building new links to drive jobs and growth in the economy and build Victoria’s prosperity.
Significant challenges facing the Department in the medium termThe Department’s challenges include:
developing integrated transport and land use policy responses to enhance liveability and support sustainable population growth through metropolitan Melbourne and regional Victoria;
providing people with more services, more often, to manage growing patronage and reduce overcrowding on our trains and trams;
maintaining and building road infrastructure to close gaps in the network, reduce congestion and improve safety;
responding to climate change by enabling housing and employment to be closer together and by providing more transport choice; and
creating jobs to support economic growth through construction of major infrastructure and additions to the public transport fleet.
Major policy decisions and directions Action for Victoria’s Future, the Victorian Transport Plan and Melbourne 2030: a planning update – Melbourne@5 million, emphasise the need to strengthen the transport network both within Melbourne and between regional communities to better link jobs, services and households. In response to the strategic directions in these policy frameworks, the Department of Transport is committed to achieving significant results against the following objectives:
Service Delivery 2009-10 Transport 235

Integrate transport and land-use planningWork in partnership with the Department of Planning and Community Development and other departments and agencies to integrate transport networks and services with plans for the future shape of Melbourne and Victoria, develop legislation that supports transport priorities, and secure strategic land reservations for future transport needs;
Support the Victorian economy with an effective and resilient transport networkContribute to maintaining Victoria’s competitiveness and productivity by delivering an effective and resilient transport system by expanding capacity and improving the system’s efficiency, accessibility and service quality;
Ensure safety for all transport usersImprove actual and public perception of the safety and security of Victoria’s roads, public transport and waterways, and reduce the incidence and severity of accidents;
Position Victoria for sustainable transportMinimise transport’s impact on the environment by promoting more sustainable travel choices and increasing the efficiency of the transport fleet, as well as ensuring that transport infrastructure can withstand the effects of climate change; and
Build a collaborative and effective departmentContinue to transform the culture of the Department to foster open and collaborative work, build the Department’s capacity to engage with stakeholders and ensure that transport infrastructure projects are developed and delivered effectively.
Ministerial portfoliosThe Department supports the ministerial portfolios of Public Transport, and Roads and Ports.
Changes to the output structureThe Department has made some changes to its output structure in 2009-10 as shown in the table below:
2009-10 Outputs Reason 2008-09 OutputsRefer to Department of Innovation, Industry and Regional Development output statements
Machinery of Government
Public Construction and Land Development
Integrated and Sustainable Transport Development
Title Change Integrated Transport Policy and Planning
The Integrated and Sustainable Transport Development output was established to provide a greater focus on integrated transport planning and development of sustainable transport solutions.
Due to a machinery of government change in 2008, the Department is no longer responsible for Major Projects Victoria. This change is reflected in the current output statement.
236 Transport Service Delivery 2009-10
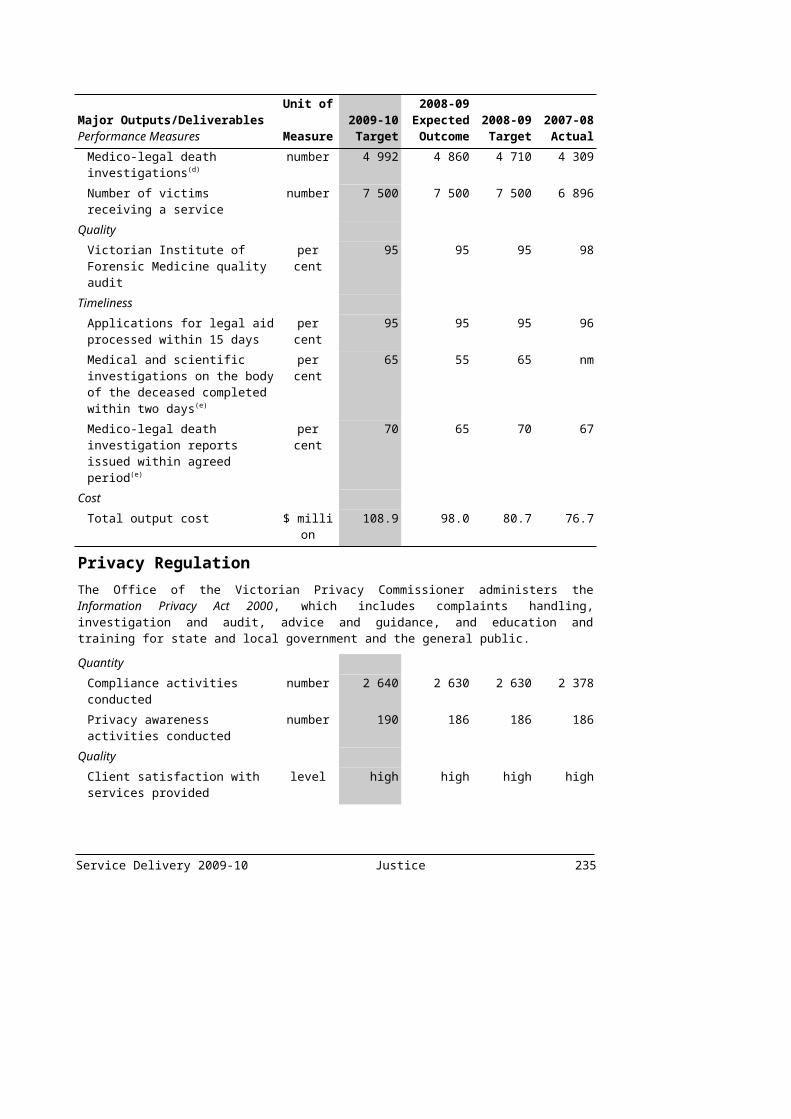
Discontinued performance measures are detailed in Appendix C of this budget paper.
The following table summarises the total output cost. It has been prepared on the basis of the Department’s 2009-10 output structure, therefore allocations may differ from the department’s previously published budget.
Table 3.9: Output Summary ($ million)
2008-09 Budget (a)
2008-09 Revised (a)
2009-10 Budget
Variation (b)
%Public Safety and Security (c) 317.6 363.5 388.6 22.4Public Transport Services 2 773.7 2 795.9 3 015.2 8.7Integrated Transport Planning Delivery and
Management1 246.5 1 264.3 1 364.9 9.5
Total (d) 4 337.8 4 423.7 4 768.7 9.9Source: Department of Transport
Notes:(a) Both the 2008-09 Budget and 2008-09 Revised columns reflect the 2009-10 output structure, adjusted
on a comparative basis for machinery of government changes and other output structure changes. As such, they incorporate changes made to the Department’s output structure in 2009-10, restated for comparative purposes, and will differ from Budget Paper No. 4, Chapter 3, Departmental Financial Statements.
(b) Variation between 2008-09 Budget and 2009-10 Budget.(c) The variation between the 2008-09 and 2009-10 Budget is primarily due to the Road Safety and
Regulation output including additional Safe Road projects under the Federal Nation Building Blackspot programs.
(d) Total output expense may not equate to the total expense reported in Budget Paper No. 4, Chapter 3, Departmental Financial Statements due to additional expenses in Budget Paper No. 4 that are not included in departmental output costs.
The following section provides details of the outputs to be provided to government, including performance measures and costs for each output. Total expenditure for the Department can be found in Budget Paper No. 4, Chapter 3, Departmental Financial Statements.
Service Delivery 2009-10 Transport 237

Public Safety and SecurityThese outputs contribute to the achievement of the key Government outcome of building friendly, confident and safe communities.
This is done by delivering initiatives and regulatory activities that improve safety in public transport, road, and marine sectors and reduce the frequency, severity and cost of incidents and accidents. It also covers activities aimed at maintaining the security of critical infrastructure and the preparedness to respond to emergencies involving this infrastructure.
Reducing the State’s road toll is a high priority for the government. A key measure of its success will be the reduction of serious injuries and deaths related to road crashes. Key departmental activities to achieve this outcome include implementing arrive alive 2008 – 2017 road safety initiatives to change road user behaviour, and improving the safety of road infrastructure through initiatives such as the Safer Road Infrastructure Program.
Strong regulatory frameworks and programs are in place to improve safety on public transport, and on the State’s waterways relating to both commercial and private recreational vessels. The Chief Investigator, Transport and Marine Safety Investigations, conducts independent investigations into public transport and marine safety incidents with the objective of improving the overall safety of the system.
238 Transport Service Delivery 2009-10
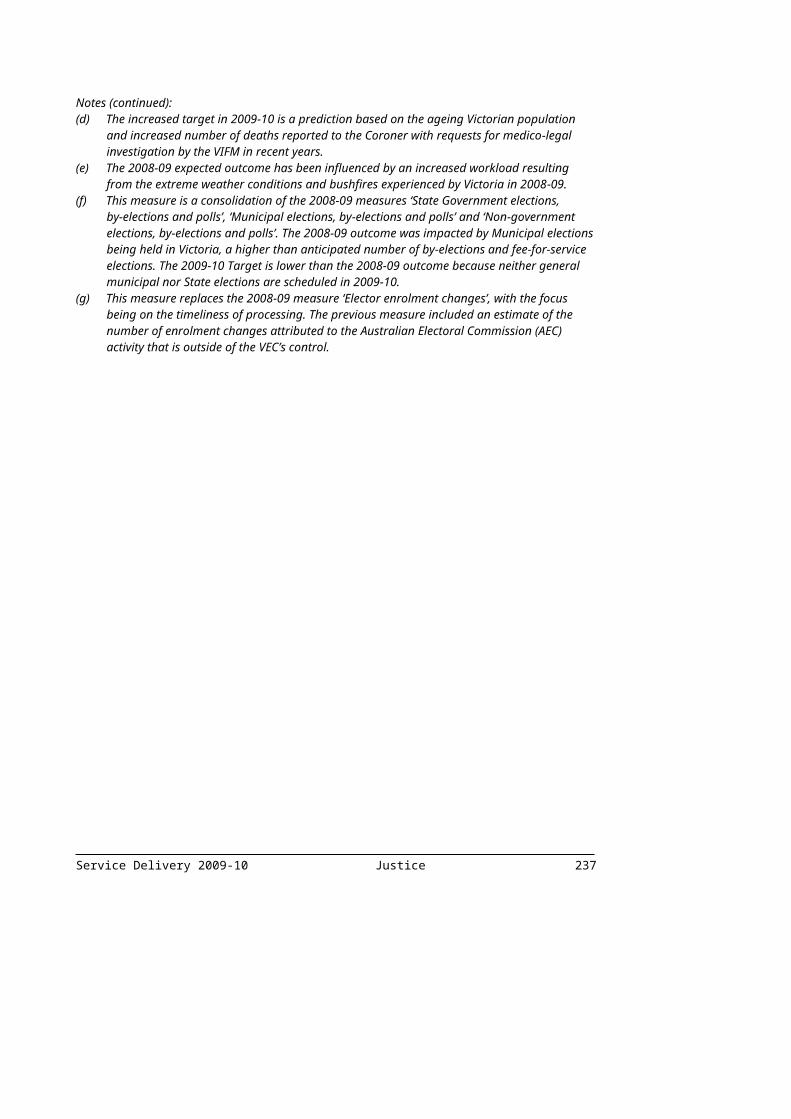
Major Outputs/DeliverablesPerformance Measures
Unit of Measure
2009-10 Target
2008-09 Expected Outcome
2008-09 Target
2007-08 Actual
Public Transport Safety and RegulationWork with industry stakeholders to achieve the highest standards of safety practicable for train, tram and bus services in Victoria. Implement initiatives to achieve the government’s public transport safety objectives. Monitor compliance with public transport safety management systems through rigorous audits and inspections, investigating accidents and incidents, and implement corrective actions.
Quantity Active advance warning signs(a) number 29 nm nm nmAnnual bus safety mechanical inspections
number 50 50 50 53
Bus safety accreditation compliance audits/inspections conducted in accordance with regulatory policy
per cent 100 100 100 nm
Public railway crossings upgraded number 37 45(b) 45(b) 46(b)
Train and tram safety compliance audits/inspections conducted in accordance with legislative requirements
number 50(c) 40 40 nm
Quality Bus safety non-compliance reports addressed within agreed timeframes by accredited operators
per cent 100 100 100 100
Train and tram safety Improvement Notices addressed within agreed timeframes by accredited operators
per cent 100 100 100 100
Timeliness Bus safety accreditations processed on time
per cent 100 100 100 nm
Train and tram accreditations processed on time
per cent 100 100 100 nm
Cost Total output cost $ million 26.0 26.0 23.2 35.8
Service Delivery 2009-10 Transport 239

Major Outputs/DeliverablesPerformance Measures
Unit of Measure
2009-10 Target
2008-09 Expected Outcome
2008-09 Target
2007-08 Actual
Road Safety and RegulationProvide a road safety program that incorporates the 'Safe System' approach. This approach is based on the key components of safer vehicles, safer road infrastructure and safer speeds. Essential supporting elements of the 'Safe System' include controlling admittance to the system, understanding crashes and risk, education and information to support road users, and legislation and enforcement of road rules.
Quantity Road safety projects/initiatives completed:
safe roads number 356(d) 264 258 151 safe road users number 33(e) 48 48 31 safe vehicles number 6(f) 4(f) 1 1
Quality Projects completed within agreed scope and standards
per cent 100 100 100 100
Timeliness Programmed works completed within agreed timeframes
per cent 100 100 100 100
Cost Total output cost $ million 177.7(d) 144.5(g) 114.2 135.1
Vehicle and Driver RegulationProvide a vehicle registration and driver licensing service that contributes to the integrity of the road user environment by ensuring the registration of trained drivers and roadworthy vehicles, and the ability to easily trace missing vehicles. Administer, regulate and monitor taxis, hire cars, special purpose vehicles, tow trucks and the driving instructor industry.
Quantity Commercial passenger vehicles inspected – taxis, hire cars etc
number 14 000 14 000(h) 10 000 11 879
Driver licences renewed number (‘000)
387 396 352 332
New driver licences issued number (‘000)
144(i) 133 150 154
New vehicle registrations issued number (‘000)
496 465(j) 513 488
Vehicle and driver information requests processed
number (‘000)
3 400 3 333(k) 3 091 2 621
Vehicle registrations renewed number (‘000)
4 607 4 507 4 419 4 314
Vehicle registration transfers number (‘000)
830 823(j) 863 844
240 Transport Service Delivery 2009-10

Major Outputs/DeliverablesPerformance Measures
Unit of Measure
2009-10 Target
2008-09 Expected Outcome
2008-09 Target
2007-08 Actual
Quality Currency of registration and licensing records
per cent >99 >99 >99 99
Customer satisfaction index: Taxi services
score 64.0 60.0 >64.4 58.2
Taxis conform to quality standards per cent >80 76 >80 70Taxi service complaints investigated and closed
number 2 800(l) 3 200(l) 2 300 2 557
User satisfaction with registration and licensing
per cent >85 >85 >85 na
Timeliness Calls answered within 30 seconds in VicRoads call centres
per cent 80 70(m) 80 48
Customers served within 10 minutes in VicRoads licensing and registration offices
per cent 80 70(m) 80 70
Taxi service complaints investigated and closed within 30 days of receipt
per cent >60 56(n) >60 44
Cost Total output cost $ million 162.2 170.6 159.7 138.1
Marine Safety and RegulationDevelop and administer the policy and regulatory framework for the safe and efficient operation of commercial and recreational vessels in Victorian waters and implement a range of programs and initiatives designed to achieve the Government’s marine safety objectives.
Quantity All relevant registered training organisations and training providers audited(o)
per cent 100 na na 100
Commercial vessels surveyed annually
per cent 100 100 100 96.4
Safety audits performed on: commercial vessels per cent 15 15 15 39.4 recreational vessels number 4 500(p) 2 850(p) 1 000 nm
Quality Designated waterways audited to assess adequacy of vessel operating and zoning rules(q)
per cent 15 15 15 20.5
Recreational vessel and operator compliance with both registration and licensing requirements(r)
per cent 85 nm nm nm
Service Delivery 2009-10 Transport 241

Major Outputs/DeliverablesPerformance Measures
Unit of Measure
2009-10 Target
2008-09 Expected Outcome
2008-09 Target
2007-08 Actual
Recreational vessel compliance with safety equipment and operational behaviour(s)
per cent 85 nm nm nm
Cost Total output cost $ million 16.3 16.2 14.8 14.2
Transport and Marine Safety InvestigationsConduct independent no-blame safety investigations of public transport and marine accidents and incidents to determine causal factors and identify issues that may require review, monitoring or consideration by stakeholders.
Quantity Proportion of accidents/incidents involving identified multiple safety system failures investigated
per cent 90 100(t) 90 100
Proportion of notified accidents with passenger fatalities and serious passenger injuries investigated
per cent 100 100 100 100
Timeliness Accidents/incidents assessed within two days of notification to determine need for detailed investigation
per cent 100 100 100 100
Completion of investigations measured against benchmark timeframes
index 1 0.97 1 nm
Cost Total output cost $ million 2.6 2.5 1.9 1.8
Infrastructure Security and Emergency ManagementEnsure there is adequate management of security risks and emergencies within the transport sector, including public transport, the road and rail system, ports and marine environments, and to assist the Department of Primary Industries within the energy sector. Provide strategic advice to government and coordinate across these sectors to achieve sufficient capacity and preparedness to respond in emergency situations.
Quantity Contribution to multi-agency exercise management and coordinate DOT portfolio involvement(s)
number 3 nm nm nm
Leadership of, or contribution to, strategic security and emergency management coordination sessions and workshops(u)
number 32 112(v) 32 96(w)
242 Transport Service Delivery 2009-10

Major Outputs/DeliverablesPerformance Measures
Unit of Measure
2009-10 Target
2008-09 Expected Outcome
2008-09 Target
2007-08 Actual
Major infrastructure security and emergency management exercises coordinated by DOT consistent with the required standards(x)
number 2 2 2 1
Minor infrastructure security and emergency management exercises coordinated by DOT consistent with the required standards(y)
number 3 3 3 6
Quality Reported marine pollution incidents responded to and resolved in accordance with the Victorian State Marine Pollution Response Plan
per cent 100 100 100 100
Review of risk management plans of declared essential services for terrorism(z)
per cent cumulative
85 85 85 90
Supervision of exercises to test declared essential services risk management plans for terrorism(aa)
per cent 100 100 100 100
Timeliness Initiation of agreed recommendations in response to infrastructure security and/or emergency management reviews(ab)
per cent 100 100 100 100
Marine pollution response action initiated within four hours of notification of an incident
per cent 100 100 100 100
Provide advice to the portfolio Ministers on policy issues within required timeframes(ac)
per cent 100 nm nm nm
Cost Total output cost $ million 3.8 3.7 3.8 4.5
Source: Department of Transport
Notes:(a) New performance measure for 2009-10 to install active advance warning signs at railway crossings.
At some locations this program is being done in conjunction with upgrades to railway crossings.(b) The higher number of projects completed in 2007-08 and 2008-09 was due to an acceleration of the
level crossing program.(c) Recruitment of additional Transport Safety Officers will increase audits / inspections in 2009-10.(d) The 2009-10 Target includes additional Safe Road projects under the Federal Nation Building
Blackspot Programs.(e) The 2009-10 Target is lower due to projects with increased size and scope.(f) Anticipated increase of Safe Vehicle projects is mainly due to advance technology developments in
vehicles such as Intelligent Speed Assist, the FM interrupter trial, Electronic Stability Control and Head Protection technology.
Service Delivery 2009-10 Transport 243
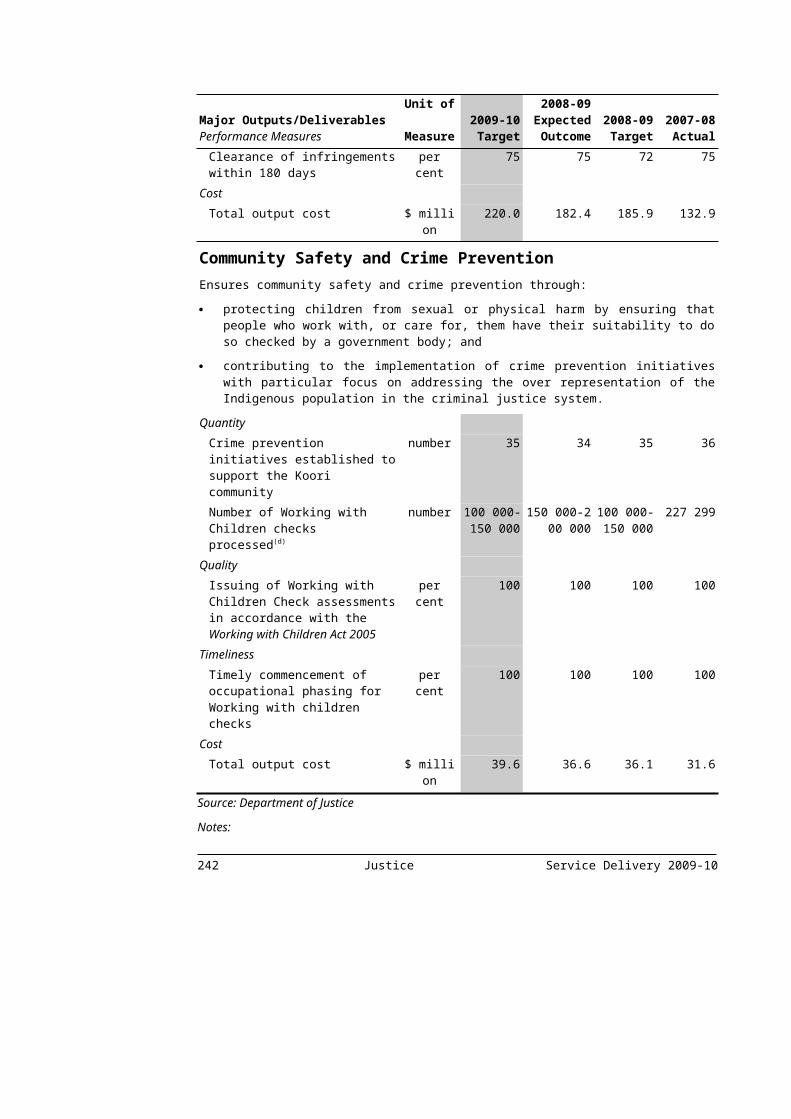
(g) The increase in 2008-09 Expected Outcome cost is due to the acceleration of the Safer Roads Infrastructure Program, and a reclassification of activities between operating and capital.
(h) Expected Outcome significantly exceeds the 2008-09 Target due to the implementation of a specific taxi audit and plate exchange project. The initiative commenced in metropolitan Melbourne in 2008-09 and will extend to regional and rural Victoria in 2009-10.
(i) The 2009-10 Target is higher than 2008-09 Expected Outcome as more learner applicants are expected to complete the required 120 hours driving experience and pass the new Graduated Licensing System drive test.
(j) The 2008-09 Expected Outcome is below target as car sales, both new and used, are lower due to the economic downturn.
(k) The 2008-09 Expected Outcome is higher than target due to increased requests regarding CityLink.(l) The 2008-09 Expected Outcome is higher than target due to increased capacity within the Victorian
Taxi Directorate to investigate and close complaints.(m) VicRoads commenced a three phase program to stabilise, rebuild and transform customer service by
investing in people, systems, processes and providing customers with more transaction options.(n) The 2008-09 Expected Outcome is slightly lower than target due to the higher level of complaints
investigated and closed. Additional staffing resources and improved processes were introduced to manage complaints.
(o) This performance measure replaces the 2008-09 performance measure ‘All accredited training providers audited’. The 2009-10 performance measure is the same as the 2008-09 measure except for changes in wording to better reflect organisations subject to audit, and measures the exact same activity as per performance measure in 2008-09. The audit is undertaken every two years.
(p) The 2009-10 Target and Expected Outcome represents an improvement in measurement involving a larger set of recreational vessel types audited compared to the 2008-09 Target.
(q) This performance measure replaces the 2008-09 performance measure ‘Victorian waterways audited to assess adequacy of vessel operating and zoning rules’. The 2009-10 performance measure is the same as the 2008-09 measure except for changes in wording to better reflect waterways that are subject to audit, and measures the exact same activity as per performance measure in 2008-09.
(r) New performance measures that replaces two 2008-09 performance measures, 'Recreational vessel compliance with registration requirements' and 'Recreational boat operator compliance with licensing requirements', and is based on an improvement in measurement involving a larger set of recreational vessel types audited.
244 Transport Service Delivery 2009-10
Notes (continued):(s) New performance measure reflecting the activities to be undertaken in 2009-10.(t) In 2008-09, 100 per cent of multiple safety system failures are expected to be investigated, due to the
fact that the failures differed in nature. Where a number of accidents have the same multiple safety system failures, a proportion of those accidents are investigated.
(u) This performance measure replaces the 2008-09 performance measure ‘Participation in strategic security and emergency management coordination sessions’. The 2009-10 performance measure is the same as the 2008-09 measure except for the changes in wording to better reflect the activities undertaken, and measures exactly the same activity as per the performance measure in 2008-09.
(v) The 2008-09 Expected Outcome is significantly higher than target due to participation in the response to the Victorian bushfires.
(w) The high level of sessions and workshops in 2007-08 reflects the introduction of increased State/Commonwealth cooperation and the introduction of new legislative requirements.
(x) This performance measure replaces the 2008-09 performance measure ‘Major infrastructure emergency exercises coordinated by DOT consistent with the required standards’. The 2009-10 performance measure is the same as the 2008-09 measure except for changes in wording to better reflect the activities undertaken, and measures exactly the same activity as per the performance measure in 2008-09.
(y) This performance measure replaces the 2008-09 performance measure ‘Minor infrastructure emergency exercises coordinated by DOT consistent with the required standards’. The 2009-10 performance measure is the same as the 2008-09 measure except for changes in wording to better reflect the activities undertaken, and measures exactly the same activity as per the performance measure in 2008-09.
(z) This performance measure replaces the 2008-09 performance measure ‘Review of risk management plans of declared essential services’. The 2009-10 performance measure is the same as the 2008-09 measure except for the changes in wording to better reflect the activities undertaken, and measures exactly the same activity as per the performance measure in 2008-09.
(aa) This performance measure replaces the 2008-09 performance measure ‘Supervise exercises to test declared essential services risk management plans’. The 2009-10 performance measure is the same as the 2008-09 measure except for the changes in wording to better reflect the activities undertaken, and measures exactly the same activity as per the performance measure in 2008-09.
(ab) This performance measure replaces the 2008-09 performance measure ‘Agreed recommendations initiated in response to infrastructure security reviews’. The 2009-10 performance measure is the same as the 2008-09 measure except for the changes in wording to better reflect the activities undertaken, and measures exactly the same activity as per the performance measure in 2008-09.
(ac) New performance measure that replaces the previous performance measure entitled ‘Strategic policy briefings to the portfolio Ministers’ to more accurately reflect activities undertaken.
Service Delivery 2009-10 Transport 245
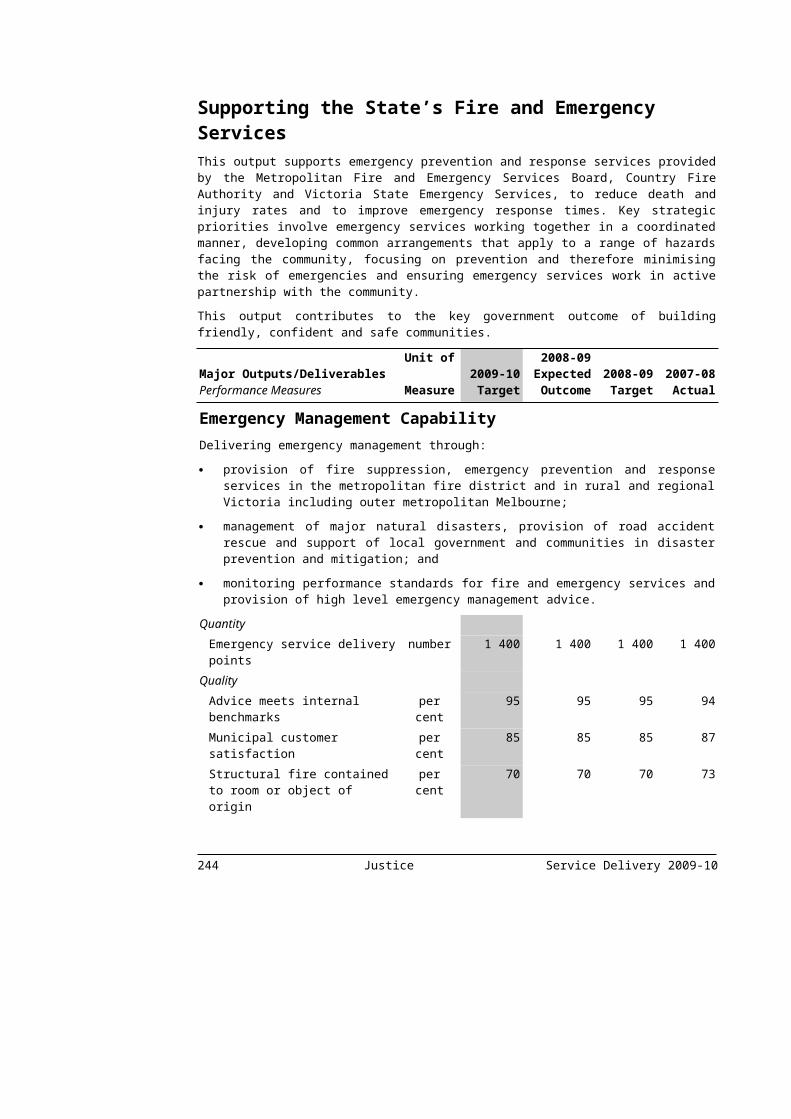
Public Transport ServicesThese outputs contribute to the achievement of the following key government outcomes:
growing and linking all of Victoria;
protecting the environment for future generations; and
sound financial management.
This is done by overseeing the delivery of quality, sustainable and cost effective passenger train, tram and bus services to metropolitan Melbourne and rural and regional Victoria, in partnership with operators and in accordance with contractual arrangements.
These outputs aim to continue the improvement in the delivery of, and access to, public transport services and to increase the overall mobility of Victorians. The outputs help to protect the environment by increasing public transport patronage, thereby reducing the reliance on private motor vehicles. Contracts with operators are managed to ensure that the services provided meet contractually agreed standards and that the committed investment levels for rolling stock and buses are delivered.
These outputs also include the provision of school bus services and managing the Multi Purpose Taxi Program. The program provides subsidised taxi services for people unable to use other forms of public transport.
The 2009-10 targets for the Integrated Metropolitan Public Transport Services performance measures are based on the current metropolitan train and tram operator franchise agreements. These targets will be reviewed in the second half of 2009 once the new operator franchise agreements are in place.
246 Transport Service Delivery 2009-10

Major Outputs/DeliverablesPerformance Measures
Unit of Measure
2009-10 Target
2008-09 Expected Outcome
2008-09 Target
2007-08 Actual
Integrated Metropolitan Public Transport ServicesWork in partnership with private operators to deliver safe, reliable and accessible metropolitan train, tram and bus services in accordance with contractual arrangements.
Quantity Passengers carried:
bus number (million)
104.8 101.2 93.7 91.3
train number (million)
237.4 220.1 218.0 201.2
tram number (million)
181.7 174.0 167.5 158.3
Payments made for: bus services $ million 486(a) 438 441 380 train services $ million 433 398 398 398 tram services $ million 134 127 133 137
Scheduled services delivered: bus per cent 99.8 99.8 99.0 99.9 train per cent 99.2 98.6(b) 99.2 99.0 tram per cent 99.7 99.7 99.5 99.7
Total kilometres scheduled: bus km
(million)104.6(a) 96.6 96 88.4
train km (million)
18.8 18.4 18 18
tram km (million)
23.4 23.3 23.2 23.1
Quality Customer satisfaction index:
bus services score 70.0 68.0 >69.2 66.9 train services score 62.0 58.0(c) >65.4 59.4 tram services score 70.0 68.0 >71.2 67.4
Rolling stock annual plan meets specifications in the Partnership Agreements:
train per cent 100 100 100 100 tram per cent 100 100 100 100
Timeliness Bus services within 5 minutes of timetable
per cent 95 95 95 95
Nominated franchisee capital projects are delivered within scheduled or subsequent quarter:
Service Delivery 2009-10 Transport 247
Major Outputs/DeliverablesPerformance Measures
Unit of Measure
2009-10 Target
2008-09 Expected Outcome
2008-09 Target
2007-08 Actual
train per cent 85 85 85 94.5 tram per cent 85 85 85 82.5
Train services arriving at destination no more than 59 seconds before and less than 5 minutes 59 seconds after timetable
per cent 94 91.5(b) 94 92.3
Tram services departing the 2nd, 3rd
and 4th monitoring points (average) no more than 59 seconds before and less than 5 minutes 59 seconds after timetable
per cent 82.5 82.0 82.5 81.8
Cost Total output cost $ million 2 074.5 1 893.0 1 898.7 1 763.5
Rural and Regional Public Transport ServicesWork in partnership with V/Line and private operators to deliver safe, reliable and accessible train, coach and bus services in and to regional and rural Victoria, in accordance with contractual arrangements.
Quantity Passengers carried:
country bus services number (million)
14.0 13.1(d) 13.7 13.5
V/Line train and coach services
number (million)
14.4 13.1 12.5 11.6
Payments made for: country bus services $ million 97 90 89 80 V/Line train services $ million 289 293 272 262
Scheduled services delivered: country bus per cent 99 99 99 99 V/Line train per cent 99 98.3 99 98.7
Total kilometres scheduled: country bus number
(million)18.4(e) 18.0(f) 22.7 21.3
V/Line train and coach km (million)
21.3(g) 22.9(h) 14.9 14.5
Quality Customer satisfaction index:
V/Line coach services score 80.0 80.4 >80.4 80.3 V/Line train services score 77.0 75.9 >75.9 76.7
Rolling stock annual plan meets specifications in the Rolling Stock Management Plan for V/Line trains(i)
per cent 100 100 100 100
248 Transport Service Delivery 2009-10
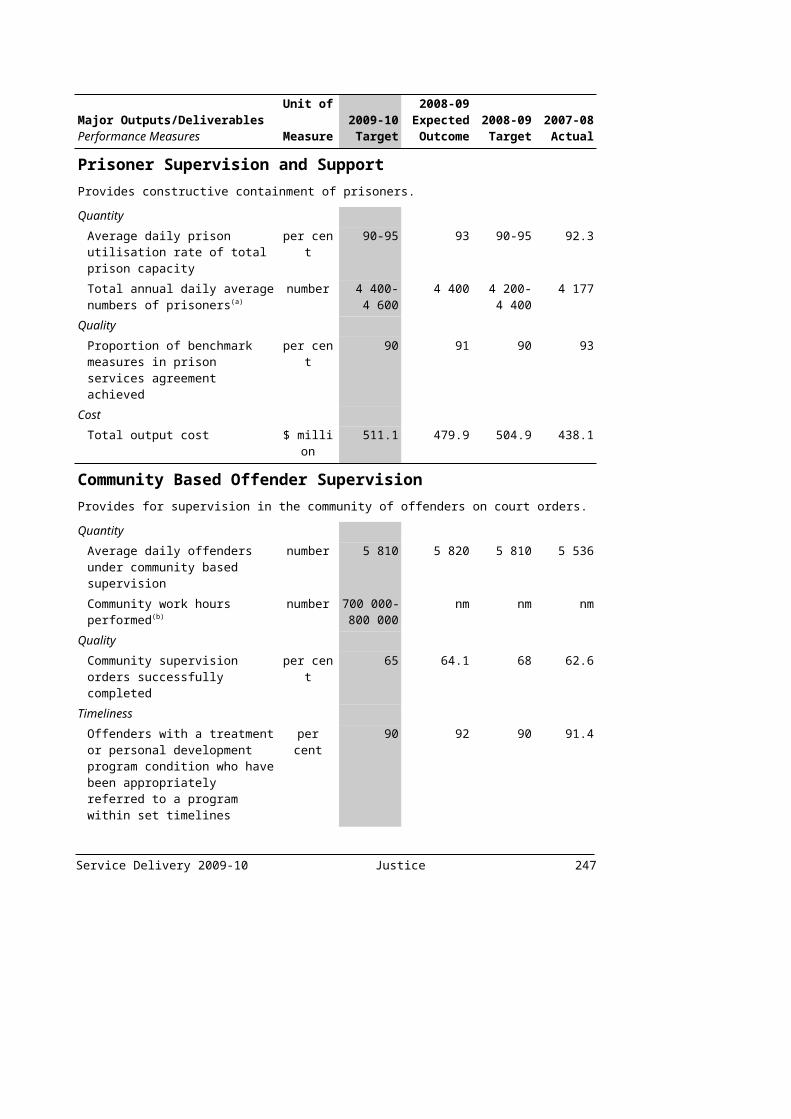
Major Outputs/DeliverablesPerformance Measures
Unit of Measure
2009-10 Target
2008-09 Expected Outcome
2008-09 Target
2007-08 Actual
Timeliness Country bus services within 5 minutes of timetable
per cent 99 99 99 99
Rail services arriving at destination no more than 5 minutes 59 seconds after timetable for short distance services and 10 minutes 59 seconds for long distance services
per cent 92 85(j) 92 86.2
Cost Total output cost $ million 693.0 663.4 639.5 606.2
Specialist Transport ServicesManage contractual arrangements for the provision of school bus services in accordance with contract service standards. Manage the Multi Purpose Taxi Program, which provides subsidised taxi services for those unable to use other forms of public transport, and provide access for people with a disability to transport facilities by meeting obligations under the Disability Discrimination Act 1992 (Commonwealth).
Quantity Disability Discrimination Act (DDA) compliance for public transport infrastructure:
level access tram stops built
number 26(k) 27(l) 52 59
number of accessible bus stops built
number 1 500 1 500 1 500 3 200
upgrades to various access features at metropolitan stations(k)
per cent 6 nm nm nm
upgrades to various access features at regional stations(m)
per cent 6 nm nm nm
Multi Purpose Taxi Program taxi trips:
passenger only number (‘000)
3 786 3 786 3 800 3 865
with wheelchair number (‘000)
660(n) 628 625 598
Scheduled school bus services delivered
per cent 99 99 99 99
Total kilometres scheduled: school bus
km (million)
33.0 33.2 33.7 33.4
Transport access site treatments completed by VicRoads(o)
number 58(p) 101 100 89
Service Delivery 2009-10 Transport 249
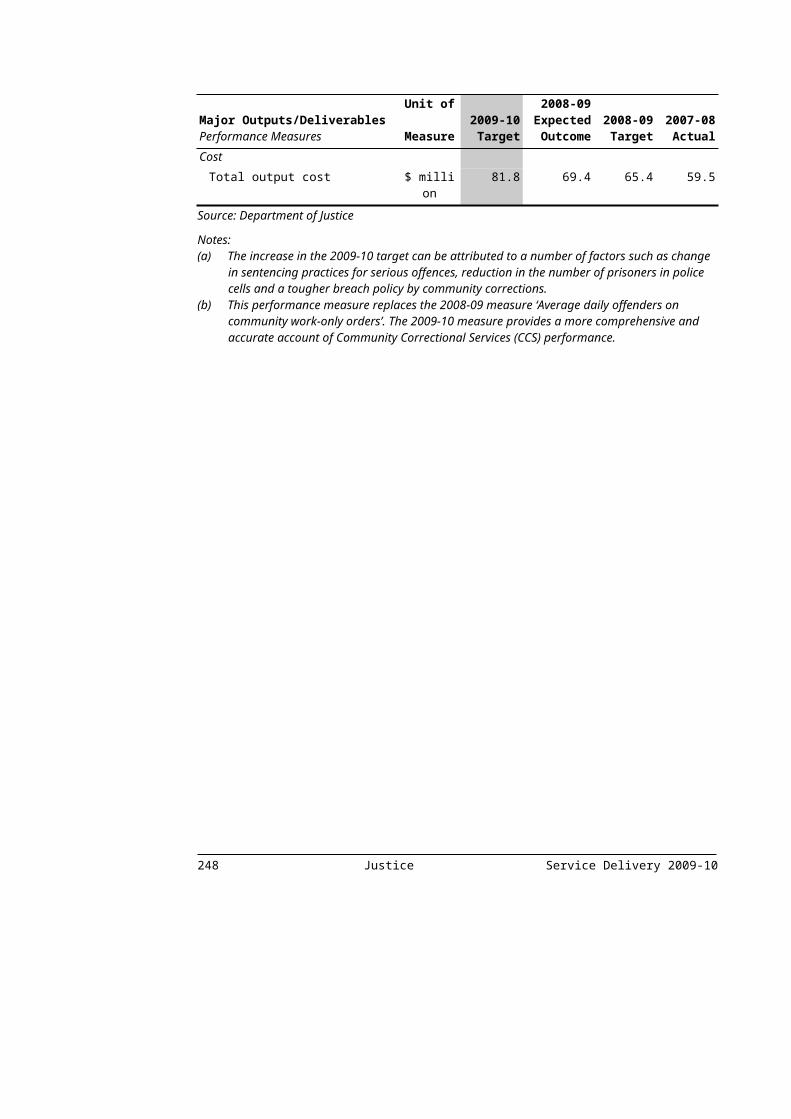
Major Outputs/DeliverablesPerformance Measures
Unit of Measure
2009-10 Target
2008-09 Expected Outcome
2008-09 Target
2007-08 Actual
Quality Transport treatments completed within agreed scope or standards(q)
per cent 100 100 100 100
Timeliness Multi Purpose Taxi Program applications assessed and completed within 10 working days
per cent 90 90 80 53
Programmed transport access works completed within agreed timeframes
per cent 100 100 100 100
School bus services within five minutes of timetable
per cent 99 99 99 99
Cost Total output cost $ million 247.7 239.5 235.5 225.9
Source: Department of Transport
Notes: (a) The 2009-10 Target is higher than 2008-09 due to the implementation of SmartBus Red and Green
services in metropolitan growth areas. (b) The 2008-09 Expected Outcome is lower than target due to a combination of extreme heat, fires,
industrial relations issues and train breaking problems over summer.(c) The main issues noted by customers resulting in a lower 2008-09 Expected Outcome than target are
reliability, crowding and comfort levels, particularly in peak times. Specific events experienced on the network this year that have contributed include the extreme heatwave conditions over summer and infrastructure operational problems on Oaks Day.
(d) The 2008-09 Expected Outcome varies from target due to some country bus services now being included in the V/Line train and coach services.
(e) The 2008-09 Target includes expanded services in Geelong and improved services in Seymour and Shepparton. The service kilometres for the private coaches have been excluded from this measure and included in the V/Line train and coach figures.
(f) The 2008-09 Expected Outcome for country bus services excludes kilometres for the private coach services which have now been included in the V/Line train and coach service kilometres.
(g) The 2009-10 Target includes an estimated increase in regional coach kilometres resulting from service improvements to be delivered over the 2009-10 financial year resulting from the South Gippsland Review. The service kilometres for the private coaches are now included in this measure.
(h) The 2008-09 Expected Outcome is higher than target due to the inclusion of V/Line rail replacement coaches and long distance private coaches, South Gippsland coach services and temporary coaches operating during the North East Rail Revitalisation project. The service kilometres for the private coaches are now included in this measure.
(i) This performance measure replaces the 2008-09 performance measure ‘Rolling stock annual plan meets specifications in the Partnership Agreement: V/Line train’. The 2009-10 performance measure is the same as the 2008-09 measure except for changes in wording to better reflect the activities undertaken, and measures the exact same activity as per performance measure in 2008-09.
(j) The 2008-09 Expected Outcome is lower than target due to a number of issues, including congestion on the network, fleet availability, accidents and incidents, signalling and impact of congestion on the metropolitan rail network. However, it should be noted that reliability of regional rail services is high with over 98 per cent of regional rail services scheduled being delivered.
(k) The 2009-10 Target represents the completion of the level access tram stops program which commenced in 2006-07 and was accelerated in the early years.
250 Transport Service Delivery 2009-10

(l) The 2008-09 Expected Outcome is lower than target due to the increased complexities and cost of longer stops being built to accommodate longer trams.
(m) New performance measure reflecting the activities to be undertaken in 2009-10.(n) The increase in the 2009-10 Target is due to the release of 330 new Wheelchair Accessible Taxi
licences.(o) Treatments ensure Disability Discrimination Act compliance is met.(p) The 2009-10 Target is lower than 2008-09 reflecting completion of much of the priority works in
earlier years. Projects are prioritised on the basis of supporting disabled access to activity centres and transport hubs.
(q) This performance measure replaces the 2008-09 performance measure ‘Transport access projects completed within agreed scope or standards’. The 2009-10 performance measure is the same as the 2008-09 measure except for changes in wording to better reflect the activities undertaken, and measures the exact same activity as per performance measure in 2008-09.
Service Delivery 2009-10 Transport 251

Integrated Transport Planning, Delivery and ManagementThese outputs make a significant contribution to the achievement of the following key government outcomes:
growing and linking all of Victoria;
sound financial management;
more quality jobs and thriving, innovative industries across Victoria;
efficient use of natural resources; and
greater public participation and more accountable government.
These outputs do this by providing the Government with strategic policy and development guidance in relation to integrated transport and land-use planning, development of sustainable transport solutions, implementing targeted industry and community programs and delivering cost effective long term investment and management of transport infrastructure. Implementation of the Victorian Transport Plan is reflected in many of the projects and milestones reported in these outputs.
The Government is committed to building better, more accessible and environmentally sustainable transport links for the State. This includes improving the integration of transport and land use planning, promoting sustainable travel choices, strengthening transport networks that will support concentration of jobs and services close to where people live, increasing the use of public transport and strengthening the connections between our ports, industry and agricultural centres. These outputs deliver a combination of strategic road and rail infrastructure improvements to manage congestion and improve the movement of people and goods throughout Victoria.
252 Transport Service Delivery 2009-10

Major Outputs/DeliverablesPerformance Measures
Unit of Measure
2009-10 Target
2008-09 Expected Outcome
2008-09 Target
2007-08 Actual
Integrated and Sustainable Transport DevelopmentContribute to the development of a sustainable transport system for regional, rural and metropolitan Victoria by working collaboratively across government and within the community on integrated transport and land-use planning, transport planning frameworks, transport infrastructure priorities and implementation processes. Implement programs to support more sustainable forms of transport, improve the environmental efficiency of transport activity and the transport fleet, influence travel behaviour and manage travel demands.
Quantity Carpooling program participants (a)(b) number 26 nm nm nmCycling projects completed(c) number 17 13 12 15Local Area Access Program grant funding committed within agreed timelines
per cent 100 100 100 100
Low Emission Vehicles program: Commercial fleets engaged(a)
number 60 nm nm nm
New TravelSmart programs implemented at workplaces, schools, tertiary education campuses and other organisations
number 35 35 35 35
Pedestrian projects completed(c) number 16 11 12 13Planning and coordination of transport infrastructure projects in Central Activity Districts(a)
number 6 nm nm nm
Quality Carpooling program progressed within agreed scope or standards(a)
per cent 100 nm nm nm
Local Area Access Program assessments, monitoring reports and payments undertaken according to grant agreements
per cent 100 100 100 100
New travel plans developed by schools, workplaces and other organisations participating in TravelSmart programs
per cent 60 60 60 60
TravelSmart program delivered to participating tertiary campuses
per cent 100 100 100 100
Timeliness Local Area Access Program activities completed within agreed timelines
per cent 100 100 100 100
Low Emission Vehicles Program: Establish average government fleet CO2 emissions intensity target(a)
date qtr 4 nm nm nm
Service Delivery 2009-10 Transport 253

Major Outputs/DeliverablesPerformance Measures
Unit of Measure
2009-10 Target
2008-09 Expected Outcome
2008-09 Target
2007-08 Actual
Policy advice including COAG National Reform Agenda provided to agreed timelines
per cent 100 100 100 100
Projects in Central Activities Districts progressed to agreed plans and timeframes(a)
per cent 100 nm nm nm
Public Bicycle Hire Scheme: contract award(a)
date qtr 3 nm nm nm
Strategic integrated transport input into the development of new growth areas is provided within agreed timelines(a)
per cent 100 nm nm nm
TravelSmart activities completed within agreed timelines
per cent 100 100 100 100
Cost Total output cost $ million 50.1 40.9 41.8(d) 46.4
Public Transport Infrastructure DevelopmentEnsure delivery of the Government’s commitment to metropolitan, regional and rural public transport infrastructure development and monitor the quality of rail infrastructure as set out in the contracts with the private operators.
Quantity Dandenong Rail Corridor – Westall station and stabling Upgrade(e)
per cent 50 nm nm nm
Laverton Rail Upgrade(e) per cent 60 nm nm nmProjects continuing: Country rail services: Mildura
number 1 1 1 1
Wodonga Rail Bypass(e) per cent 70 nm nm nmQuality
Projects progressed to agreed plans and timeframes
per cent 100 92(f) 100 75
Timeliness Craigieburn crossovers and signalling:
detailed design completed(g) date qtr 1 nm nm nm early works for construction(g) date qtr 2 nm nm nm
Dandenong Rail Corridor Stage 2 – Westall Rail Upgrade:
complete design(g) date qtr 2 nm nm nm commence construction – station(g)
date qtr 2 nm nm nm
commence construction – stabling(g)
date qtr 3 nm nm nm
254 Transport Service Delivery 2009-10
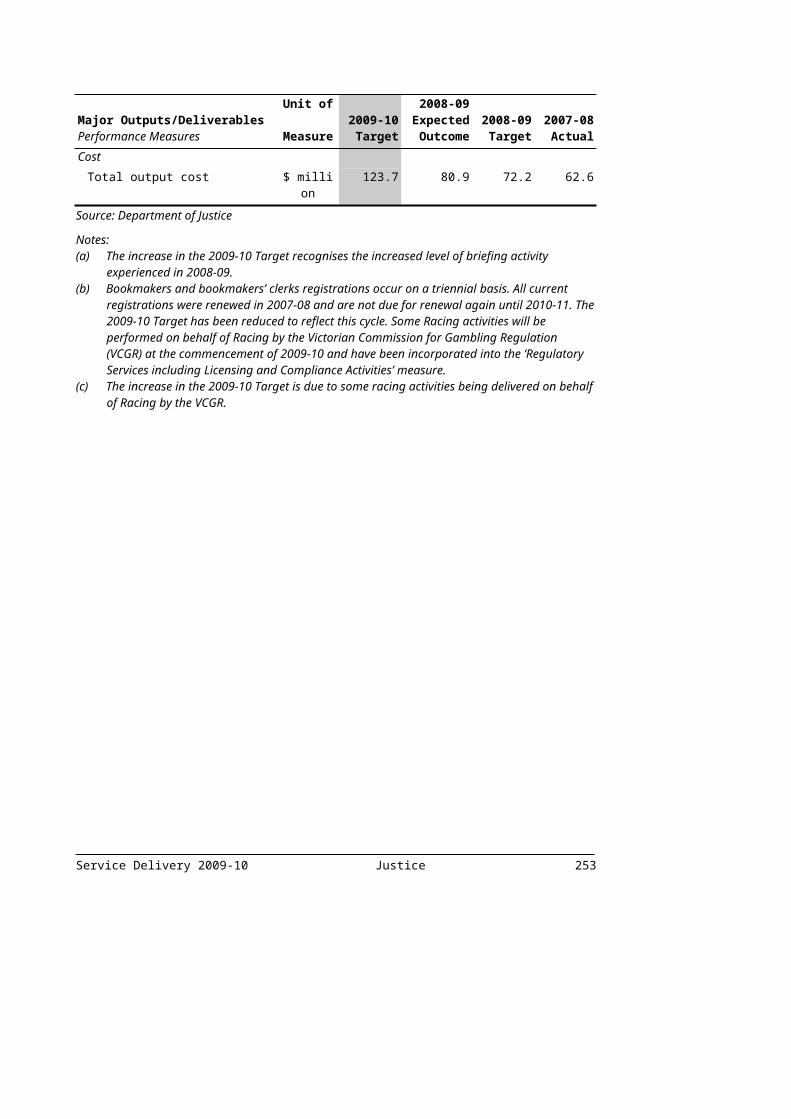
Major Outputs/DeliverablesPerformance Measures
Unit of Measure
2009-10 Target
2008-09 Expected Outcome
2008-09 Target
2007-08 Actual
Development of new integrated public transport ticketing solution:
start metropolitan live operations(g)
date qtr 2 nm nm nm
start regional and coach live operations(g)
date qtr 4 nm nm nm
Doncaster Area Rapid Transit (DART):
design development completed for bus stop upgrades(a)
date qtr 2 nm nm nm
design development completed for bus priority treatments(a)
date qtr 3 nm nm nm
construction works commence for bus stop upgrade works(a)
date qtr 4 nm nm nm
Growth Area Stations Program: complete preliminary design program(a)
date qtr 3 nm nm nm
request for tenders issued(a) date qtr 4 nm nm nmMetrol Replacement: Delivery of simulator (traffic and interlocking simulator available for application data checking) (g)
date qtr 2 nm nm nm
Metropolitan Train Communications System replacement:
trial system acceptance(g) date qtr 2 nm nm nm system infrastructure installed(g)
per cent 50 nm nm nm
North Melbourne Station Interchange Upgrade: complete work on new station building(g)
date qtr 4 nm nm nm
Planned infrastructure asset renewal/maintenance activities are delivered within project timelines:
metropolitan train network per cent cumulative
90 90 90 92
tram network per cent cumulative
90 90 90 90
country passenger rail network
per cent cumulative
90 90 90 90
SmartBus: Green Orbital Stage 2 – Nunawading to Airport West:
Service Delivery 2009-10 Transport 255

Major Outputs/DeliverablesPerformance Measures
Unit of Measure
2009-10 Target
2008-09 Expected Outcome
2008-09 Target
2007-08 Actual
construction works completed for bus stop upgrades works(g)
date qtr 3 nm nm nm
services commence(g) date qtr 4 nm nm nm construction works completed for on-bus road priority treatments(g)
date qtr 4 nm nm nm
SmartBus: Yellow Orbital Stage 2 – Ringwood to Melbourne Airport:
design development completed for bus stop upgrades(a)
date qtr 2 nm nm nm
design development completed for bus priority treatments(a)
date qtr 3 nm nm nm
construction works commence for bus stop upgrade works(a)
date qtr 4 nm nm nm
South Morang Rail Extension: tenders sought for work packages(a)
date qtr 2 nm nm nm
award contract for work packages(a)
date qtr 4 nm nm nm
Sunbury Electrification: tenders sought for works packages(a)
date qtr 2 nm nm nm
award Contract for work packages(a)
date qtr 4 nm nm nm
Train Supervisory Control and Data Acquisition (SCADA) Replacement: complete procurement phase and award contract(a)
date qtr 4 nm nm nm
Tram Automatic Vehicle Monitoring (AVM) System Replacement: complete procurement phase and award contract(a)
date qtr 4 nm nm nm
Vigilance Control and Event Recording System (VICERS):
commence installation on Siemens(h)
date qtr 3 na na na
commence installation on Xtrapolis fleet(h)
date qtr 1 na na na
Cost Total output cost $ million 188.6(i) 115.5 114.6 72.9
256 Transport Service Delivery 2009-10

Major Outputs/DeliverablesPerformance Measures
Unit of Measure
2009-10 Target
2008-09 Expected Outcome
2008-09 Target
2007-08 Actual
Road Network ImprovementsEnhance the performance of Victoria's road network to improve access and efficiency by developing road transport links, lowering transport operating costs and upgrading the quality of roads with respect to safety, and deliver cost effective projects to reduce congestion and improve reliability and travel times for all road users including public transport and the movement of freight.
Quantity Bridge strengthening and replacement projects completed:
metropolitan number 1(j) 4 4 1 regional number 12 12 11 3
Bus/tram route and other high occupancy vehicle improvements
number 23 16(k) 10 nm
Congestion projects completed number 12(l) 15(m) 18 nmLocal road projects completed: regional
number 10(n) 25(o) 18 12
Major road improvement projects completed:
metropolitan number 2 2 2 2 regional number 0(p) 2 2 1
Other road improvement projects completed:
metropolitan number 6 7 6 12 regional number 5 7 6 13
Quality Road projects completed within agreed scope and standards:
metropolitan per cent 98 98 98 98 regional per cent 98 98 98 98
Timeliness Peninsula Link:
expressions of Interest shortlisted(a)
date qtr 1 nm nm nm
contract close(a) date qtr 3 nm nm nmPeninsula Link: major design and construction milestones reviewed and reported(a)
per cent 100 nm nm nm
Programmed works completed within agreed timeframes:
metropolitan per cent 95 95 95 95 regional per cent 95 95 95 95
Service Delivery 2009-10 Transport 257

Major Outputs/DeliverablesPerformance Measures
Unit of Measure
2009-10 Target
2008-09 Expected Outcome
2008-09 Target
2007-08 Actual
Cost Total output cost $ million 682.1 668.7 666.9(d) 629.3
Road Asset ManagementMaintain assets that meet the safety, mobility and access needs of the community.
Quantity Bridges maintained:
metropolitan number 885 870 870 864 regional number 2 205 2 190 2 190 2 183
Pavement resurfaced: metropolitan m2 (‘000) 1 934(p) 1 968(q) 1 583 2 204 regional m2 (‘000) 9 223(r) 10 151(r) 10 959 10 713
Road network maintained: metropolitan lane-km 11 391(s) 11 222(s) 11 802 11 419 regional lane-km 41 480 41 315 41 315 41 744
Quality Bridges that are acceptable for legal load vehicles:
metropolitan per cent 99.4 99.4 99.4 99.5 regional per cent 99.6 99.6 99.6 99.7
Proportion of travel on smooth roads:
metropolitan per cent 90 90 90 91 regional per cent 92 92 92 93
Structures with Level 4 defects:(u)
metropolitan per cent 1.2 1.2 1.2 1.8 regional per cent 3.2 3.2 3.2 3.0
Timeliness Annual maintenance program completed within agreed timeframes:
metropolitan per cent 100 100 100 100 regional per cent 100 100 100 100
Cost Total output cost $ million 382.0 373.9 366.4 357.5
258 Transport Service Delivery 2009-10

Major Outputs/DeliverablesPerformance Measures
Unit of Measure
2009-10 Target
2008-09 Expected Outcome
2008-09 Target
2007-08 Actual
Freight, Logistics, Ports and Marine DevelopmentPlan and deliver policy and infrastructure initiatives to improve efficiency and safety in the freight and logistics sector and the State's ports and marine environment, while reducing environmental and social impacts caused by the movement of freight.
Quantity Altona/Laverton Intermodal Terminal works(e)
per cent 25 nm nm nm
Channel Deepening: Project Implementation
per cent 100 75 70 nm
North East Rail Gauge Standardisation(e)
per cent 100 nm nm nm
Road-based freight accessibility and reliability improvement projects completed
number 5(v) 14 13 5
Quality Road-based freight accessibility and reliability projects completed within specified scope and standards
per cent 100 100 100 100
Timeliness Mildura Rail Corridor Upgrade project: construction completed
per cent 100 90 90 nm
Planned infrastructure asset renewal activities are delivered within project timelines: country freight rail network
per cent cumulative
90 90 90 nm
Road-based freight accessibility and reliability projects completed within agreed timeframes
per cent 100 100 100 100
Cost Total output cost $ million 62.1 65.3 56.8 66.3
Source: Department of Transport
Notes:(a) New performance measure reflecting the activities to be undertaken in 2009-10.(b) Carpooling program participants include employers, schools, and tertiary institutions at individual
sites.(c) Performance measure has been moved from the Road Network Improvements output.(d) The 2008-09 Target differs from that reported in the 2008-09 Budget Paper No. 3 as cycling and
pedestrian projects have been moved from the Road Network Improvements output to the Integrated and Sustainable Transport Development output.
(e) New performance measure reflects progress towards completion.(f) 2008-09 Expected Outcome is lower than target due to delay in one of the projects in this output,
Vigilance Control and Event Recording System (VICERS). (g) New performance measure reflects the next phase of the project.(h) When setting the 2008-09 Budget Output Statements this performance measure was discontinued as it
was expected to be complete by quarter 4 2007-08. Due to the delays noted on page 203 of the
Service Delivery 2009-10 Transport 259
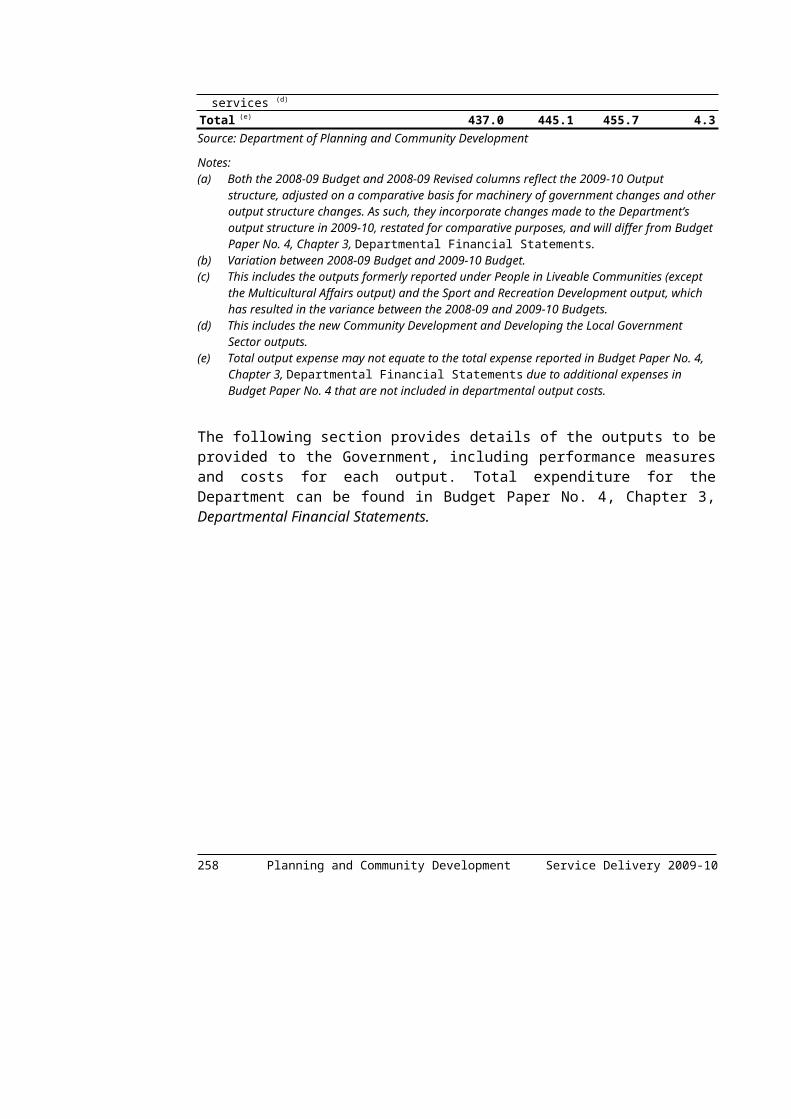
2007-08 Department of Transport Annual Report, this performance measure is targeted for completion in 2009-10.
(i) Increased costs in 2009-10 Target reflect the implementation of the new ticketing system.(j) The 2009-10 Target reflects the works needed to meet the current needs assessment which varies
from year to year.(k) Six projects which were not originally targeted to be completed in 2008-09 are now forecast to be
completed in 2008-09.(l) The 2009-10 Target is lower than 2008-09 reflecting larger and more costly projects being completed
in the later years of the Congestion Improvements Program. This specific initiative is in addition to other ongoing initiatives that are aimed at addressing congestion, including Smartbus, walking and cycling projects, etc.
(m) Three projects which were originally targeted to be completed in 2008-09 are now expected to be completed in 2009-10.
(n) The 2009-10 Target is lower than 2008-09 due to projects of increased complexity and cost.(o) Three projects were originally targeted to be completed in 2007-08 are now expected to be completed
in 2008-09. Four projects which were not originally targeted to be completed in 2008-09 are now forecast to be completed in 2008-09.
(p) The 2009-10 Target reflects that no major regional road improvement projects are currently due for completion. Projects have either been completed in 2008-09 or will be completed in future years.
(q) The increase in pavement resurfaced in the metropolitan area is due to additional projects being included in the program to meet the current needs assessment across the Victorian network.
(r) The 2009-10 Target is lower due to the increased cost of pavement resurfacing treatments and a need to manage high risks relating to other road assets, such as traffic signals.
(s) The reduction in pavement resurfaced in the regional area is a result of a reprioritisation of works due to a higher identified need in other pavement activities in the regional area.
(t) The 2009-10 Target and 2008-09 Expected Outcome reflects a correction to the reporting of lane-kms.
260 Transport Service Delivery 2009-10

Notes (continued):(u) This performance measure replaces the 2008-09 performance measure ‘Bridges with Level 4
defects’. The 2009-10 performance measure is essentially the same as the 2008-09 measure except for changes in wording to better reflect the activities undertaken, and measures the exact same activity as per performance measure in 2008-09. Structures with Level 4 defect are ones in poor condition. Structure components are showing advanced deterioration, are acting differently to their intended purpose or are showing signs of overstress. Load limits may be applied to ensure safe operation of these bridges.
(v) The higher number of projects completed in 2008-09 is primarily due to the number of complex, higher cost projects in 2007-08 which were not completed until 2008-09.
Service Delivery 2009-10 Transport 261

DEPARTMENT OF TREASURY AND FINANCE
Departmental mission statementThe Department of Treasury and Finance’s mission is to provide leadership in economic, financial and resource management reform. This contributes to the Growing Victoria Together goal of sound financial management.
Significant challenges facing the Department in the medium termSignificant challenges facing the Department in the medium term include:
ensuring Victoria is able to respond to the impacts of the Global Financial Crisis; delivering the agenda of national economic and business reform agreed by the
Council of Australian Governments; investing in strategies to mitigate the influence of climate change; facilitating the investment in and delivery of major infrastructure projects; delivering comprehensive financial management reform; delivering government services more efficiently; and improving Victoria’s business cost and tax competitiveness.
Major policy directions and strategiesThe Department has established three objectives, which guide its policy directions to achieve the outcome of sound financial management:
maintain a substantial budget operating surplus that allows for the delivery of the Government’s infrastructure objectives;
guide government actions to best increase living standards for all Victorians through the provision of innovative policy advice; and
champion an integrated whole of government ‘value for money’ approach to ensure optimal service delivery and the provision of world-class infrastructure to benefit all Victorians.
In addition to focusing on the delivery of its objectives during 2009-10, the Department will place additional emphasis on several strategic priorities:
continuing to progress opportunities for economic, financial and resource management reform in the areas of health, education, infrastructure and the environment;
driving frameworks and accountability for delivery of outputs, projects and services;
increasing the efficiency of necessary economic and business regulation reform;
262 Treasury and Finance Service Delivery 2009-10

increasing the use of market-based solutions especially in government services and natural resource industries;
improving the efficiency of administrative services across the public sector; and systematically improving the Department’s processes to ensure high quality advice
to Government.
Ministerial portfoliosThe Department supports the ministerial portfolios of Treasury, Finance, WorkCover and the Transport Accident Commission.
The Department has not made any changes to its output structure in 2009-10.
Discontinued performance measures are detailed in Appendix C of this budget paper.
The following table summarises the total output cost. It has been prepared on the basis of the Department’s 2009-10 output structure and therefore allocations may differ from the Department’s previously published budget.
Table 3.10: Output Summary($ million)
2008-09 Budget
2008-09 Revised
2009-10 Budget
Variation (a)
%Strategic Policy Advice (b) 38.9 34.4 50.7 30.3Financial Management Services 15.8 16.8 17.1 8.2Risk Management Services 19.2 21.7 21.8 13.5Resource Management Services (c) 79.6 78.7 113.5 42.6Regulatory Services (d) 17.8 23.5 20.1 12.9Revenue Management Services (e) 63.2 60.2 72.9 15.3Total (f) 234.5 235.3 296.1 26.3Source: Department of Treasury and Finance
Notes:(a) Variation between 2008-09 Budget and 2009-10 Budget.(b) The 2009-10 Budget includes an increase in funding to deliver the Council of Australian
Government’s National Partnership Agreement to implement the Seamless National Economy National Partnership project.
(c) The 2009-10 Budget includes an increase in funding to deliver implementation of the Efficient Technology Services initiative.
(d) The 2009-10 Revised Budget includes an increase in funding approved by the Government to meet incurred legal costs.
(e) The 2009-10 Budget includes an increase in funding approved by the Government to conduct additional tax compliance activities.
(f) Total output expense may not equate to the total expense reported in Budget Paper No. 4, Chapter 3, Departmental Financial Statements due to additional expenses in Budget Paper No. 4 that are not included in departmental output costs.
The following section provides details of the outputs to be provided to Government, including performance measures and costs for each output. Total expenditure for the Department can be found in Budget Paper No. 4, Chapter 3, Departmental Financial Statements.Service Delivery 2009-10 Treasury and Finance 263

Strategic Policy AdviceThese outputs provide strategic policy advice to Ministers on all aspects of government activity. These include advice on:
the State’s overall financial and aggregate budget strategy;
taxation policy;
the State’s insurance schemes;
accounting policies and performance management;
economic, social and environmental monitoring and analysis;
managing various state-based taxes;
financial accounting and reporting;
strategic research focusing on developing greater understanding of factors affecting long-term living standards for Victorians; and
inter-government financial analysis and advice in relation to the level of Commonwealth funding to the States and Territories.
These outputs contribute to the key government outcome of sound financial management by assisting the Government’s strategic policy decisions.
Major Outputs/DeliverablesPerformance Measures
Unit of Measure
2009-10 Target
2008-09 Expected Outcome
2008-09 Target
2007-08 Actual
Financial and Resource Management FrameworksDevelop and maintain cohesive financial management and compliance assurance frameworks to manage and enhance resource allocation and sound financial management practices and compliance with legislative, authoritative requirements and endorsed reforms in the Victorian Public Sector.
Quantity Annual review of the whole of government compliance framework
number 1 1 1 1
Delivery of updates, guides and newsletters(a)
number 16 23 16 20
Coordinating reporting requirements in relations to GST determinations and Auditor-General reports
number 5 5 5 5
Major resource management policy reviews and refinements
number 2 2 2 1
QualityService provision rating (Ministerial survey data)
per cent 80 80 80 80
264 Treasury and Finance Service Delivery 2009-10
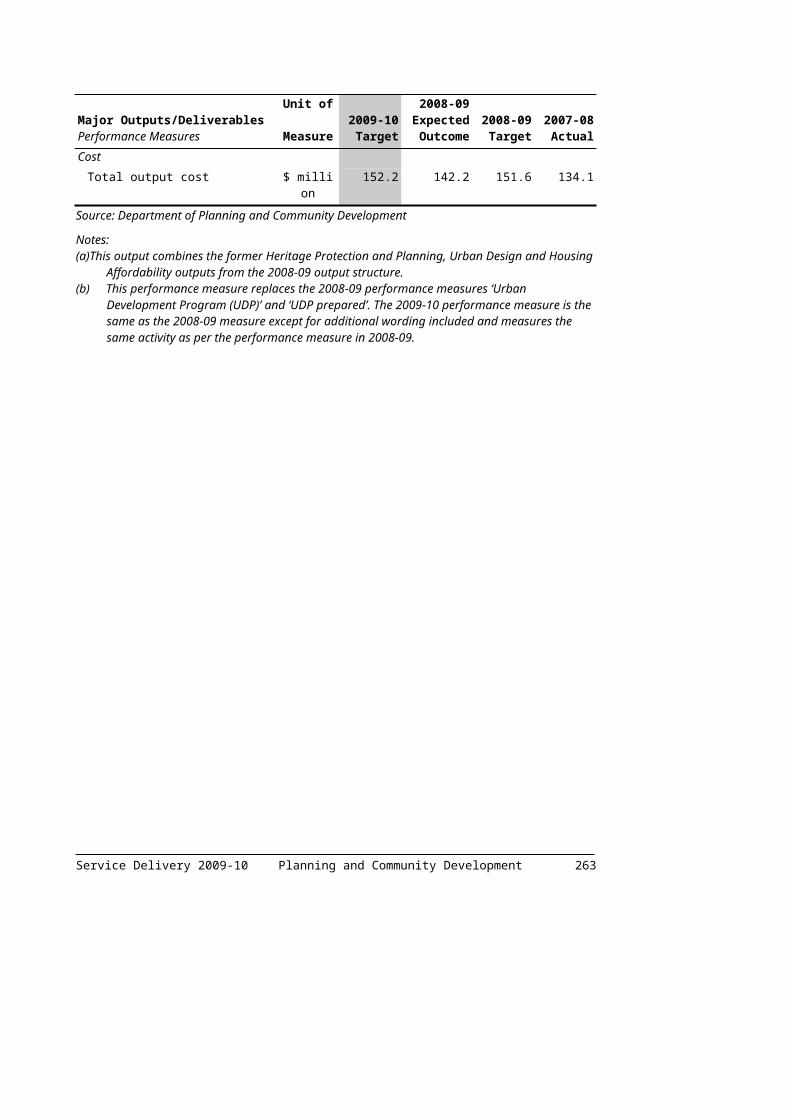
Major Outputs/DeliverablesPerformance Measures
Unit of Measure
2009-10 Target
2008-09 Expected Outcome
2008-09 Target
2007-08 Actual
Material and adverse whole of government issues identified by Victorian Auditor-Generals Office and Australian Taxation Office requiring rectification are addressed
per cent 100 100 100 100
TimelinessCompliance assurance reports report
dateBy end
Aug 2009By end
Feb 2010
30 Aug 2008
28 Feb 2009
By end Aug 2008
By end Feb 2009
13 Aug 2007
12 Feb 2008
Cost Total output cost $ million 3.9 3.6 4.1 4.5
Budget and Financial Policy AdviceProvision of strategic budget and financial analysis and advice to Ministers, Cabinet and Cabinet Sub-Committees regarding:
development of the Government's overall financial strategy and budget decision framework;
the allocation of resources in the annual State Budget, including output purchases, asset investment decisions and other strategic issues considered in the broader budget context; and
departmental financial and output delivery performance, including progress in delivering approved asset investment programs.
Quantity Budget and financial policy advice through Ministerial briefs, Expenditure Review Committee and Cabinet and Sub-Committee briefs
number 1 700 1 700 1 700 1 796
Output evaluation and price reviews(b)
number 3 4 4 5
QualityService provision rating (Ministerial survey data)
per cent 80 80 80 90
TimelinessDelivery of Output Evaluation and Price Review Reports within agreed timeframes
per cent 100 100 100 100
Delivery of output performance and asset investment performance reports within agreed timeframes
per cent 100 100 100 100
Cost Total output cost $ million 12.3 11.2 11.6 11.9
Service Delivery 2009-10 Treasury and Finance 265

Major Outputs/DeliverablesPerformance Measures
Unit of Measure
2009-10 Target
2008-09 Expected Outcome
2008-09 Target
2007-08 Actual
Economic and Financial PolicyProvide advice and analysis to Government on current economic and financial policy issues. Manage and coordinate economic and financial research with a medium to long-term focus.
Quantity Briefings on Cabinet submissions(c)
(d)number 250 346 220 nm
Number of written ministerial briefs(e)(f)
number 400 401 490 nm
Program of long-term research projects completed(g)(h)
number 10 12 5 nm
Quality Accuracy of estimating state taxation revenue
per cent =<5.0 =<5.0 =<5.0 -10.90
Service provision rating (Ministerial survey data)
per cent 80 80 80 nm
Timeliness Briefings on key Australian Bureau of Statistics economic data on day of release
per cent 100 100 100 100
Long-term research projects managed on time
per cent 100 100 100 nm
Meet financial reporting deadlines per cent 100 100 100 100Response to correspondence within agreed deadlines(i)
per cent 80 93 80 96
Cost Total output cost(j) $ million 34.5 19.6 23.2 12.8
Source: Department of Treasury and Finance
Notes:(a) The 2008-09 Expected Outcome exceeds the 2008-09 Target due to a greater than anticipated
workload, including the delivery of six Financial Reporting Directions.(b) The 2009-10 Target is below the 2008-09 Expected Outcome based on the schedule of reviews
forecast in 2009-10.(c) The 2008-09 Expected Outcome exceeds the 2008-09 Target due to greater than anticipated demand
for Cabinet submissions arising from the creation of additional Cabinet Committees in response to the 2009 Victorian Bushfire emergency.
(d) The 2009-10 Target is below the 2008-09 Expected Outcome based on the anticipated demand from the ministerial offices.
(e) This performance measure replaces the 2008-09 performance measure ‘Number of Ministerial briefs’. The 2009-10 performance measure is the same as the 2008-09 measure except for the inclusion of the word ‘written’ to more accurately reflect the nature of the measure.
(f) The 2008-09 Expected Outcome is below the 2008-09 Target due to an increase in the number of verbal briefings requested by the ministerial offices.
(g) The 2008-09 Expected Outcome exceeds the 2008-09 Target due to an increase in previously unscheduled research projects.
266 Treasury and Finance Service Delivery 2009-10

Notes (continued):(h) The 2009-10 Target is below the 2008-09 Expected Outcome reflecting the expected schedule of
research projects for 2009-10.(i) The 2008-09 Expected Outcome exceeds the 2008-09 Target, reflecting more timely responses to
correspondence deadlines. (j) The 2009-10 Target exceeds the 2008-09 Expected Outcome due to an increase in funding to deliver
the Council of Australian Governments’ National Partnership Agreement to implement the Seamless National Economy National Partnership project.
Service Delivery 2009-10 Treasury and Finance 267

Financial Management ServicesThese outputs provide financial management services to departments, agencies and Government Business Enterprises (GBEs). These services include:
managing and forecasting cash balances and central government cash transactions;
the management of the liabilities of Victoria’s public sector superannuation schemes;
monitoring the performance of GBEs;
providing financial risk management and advice to manage the State’s financial risks; and
reviewing and analysing the performance of departments, with a focus on delivering value for money services to the community.
These outputs contribute to the key government outcome of sound financial management by assisting Government to make sound and informed financial management decisions.
Major Outputs/DeliverablesPerformance Measures
Unit of Measure
2009-10 Target
2008-09 Expected Outcome
2008-09 Target
2007-08 Actual
Financial ReportingMaintain integrity of systems and information for financial planning, management, monitoring and reporting of the State of Victoria with respect to:
publication of the State Budget and budget related documents;
reporting, monitoring and publication of financial and non-financial performance in the Victorian Public Sector; and
management of the daily cash requirements including investments and borrowings of the Public Account.
Quantity Acceptable (no material weaknesses in financial systems and reporting) Financial report for the State of Victoria and Estimated Financial Statements audit opinion by the Auditor-General
number 2 2 2 2
Estimates reporting – Budget and Budget Update
number 2 2 2 2
Financial Performance Reporting – Annual Financial Report, Mid Year Financial Report and Quarterly Financial Reports
number 6 6 6 6
Quality Service provision rating (Ministerial survey data)
per cent 80 80 80 90
Timeliness Annual Budget published by date agreed by Treasurer
date May 2010
5 May 2009
May 2009
6 May 2008
Budget Update date 15 Dec 2009
3 Dec 2008
15 Dec 2008
12 Dec 2007
268 Treasury and Finance Service Delivery 2009-10
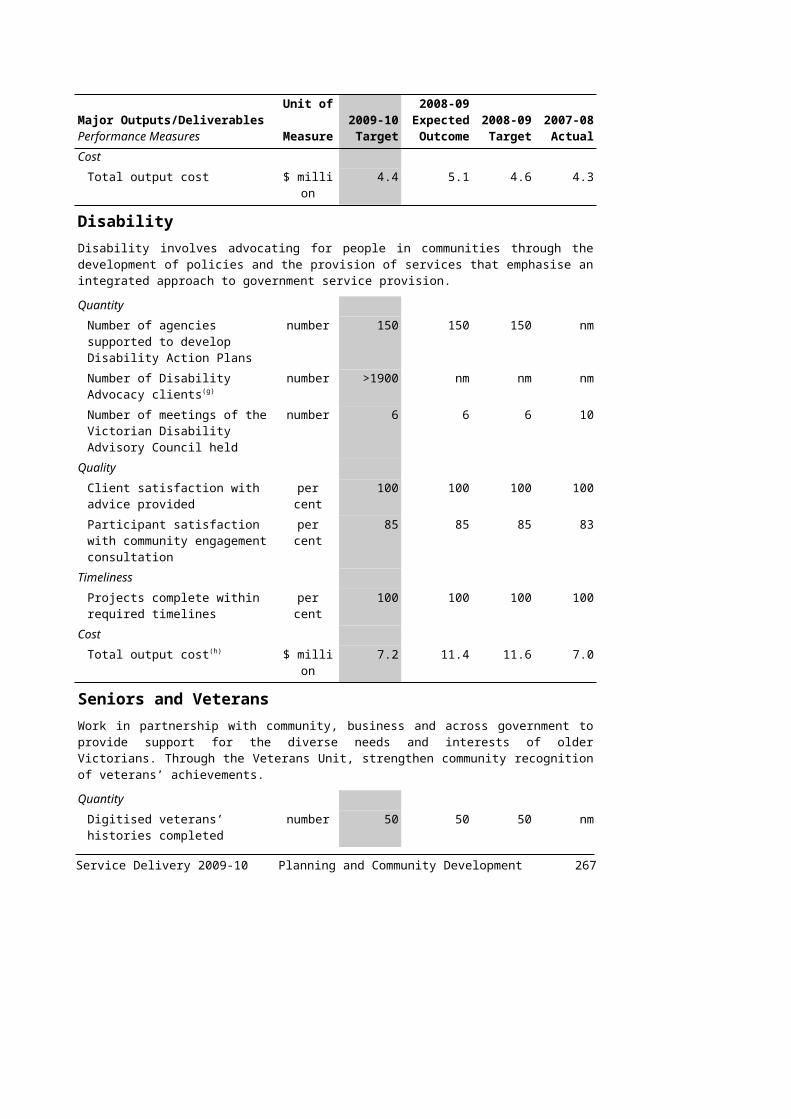
Major Outputs/DeliverablesPerformance Measures
Unit of Measure
2009-10 Target
2008-09 Expected Outcome
2008-09 Target
2007-08 Actual
Daily management of the Public Account bank account and set-off pool balances
daily daily daily daily daily
Financial Report for the State of Victoria
report date
15 Oct 2009
14 Oct 2008
15 Oct 2008
10 Oct 2007
Mid Year Financial Report report date
15 Mar 2010
12 Mar 2009
15 Mar 2009
6 Mar 2008
Quarterly Financial Reports report date
15 Oct 2009
15 Nov 2009
15 Mar 2010
15 May 2010
14 Oct 2008
13 Nov 2008
12 Mar 2009
5 May 2009
15 Oct 2008
15 Nov 2008
15 Mar 2009
15 May 2009
10 Oct 2007
15 Nov 2007
6 Mar 2008
6 May 2008
Cost Total output cost $ million 11.0 11.3 9.5 11.0
GBE Performance Monitoring and Financial Risk ManagementThis output monitors and provides advice on the financial and operational performance of Government Business Enterprises (GBEs). It develops and implements a prudential risk management and reporting framework in respect of Public Financial Corporations (PFCs) and strategies to manage the State’s financial risks. It oversees policy and strategies to manage the State’s investment borrowing and unfunded superannuation obligations and the management of the associated risks.
Quantity Board appointments(a) number 38 99 104 nmCorporate plans reviewed and assessed and analysis of quarterly performance reports(b)
number 198 nm nm nm
Dividends negotiated(c) number 39 59 59 nmManage the review process for the States credit rating
number 2 2 2 1
Provide financial policy advice on borrowings, investments and superannuation issues
number 109 109 109 nm
Provision of Budget sector debt, public authority income and superannuation estimates and analysis and commentary on the PNFC and PFC Sectors for published financial reports
number 7 7 7 6
Review of financial position of trustee companies and business entities
number 65 65 65 nm
Service Delivery 2009-10 Treasury and Finance 269
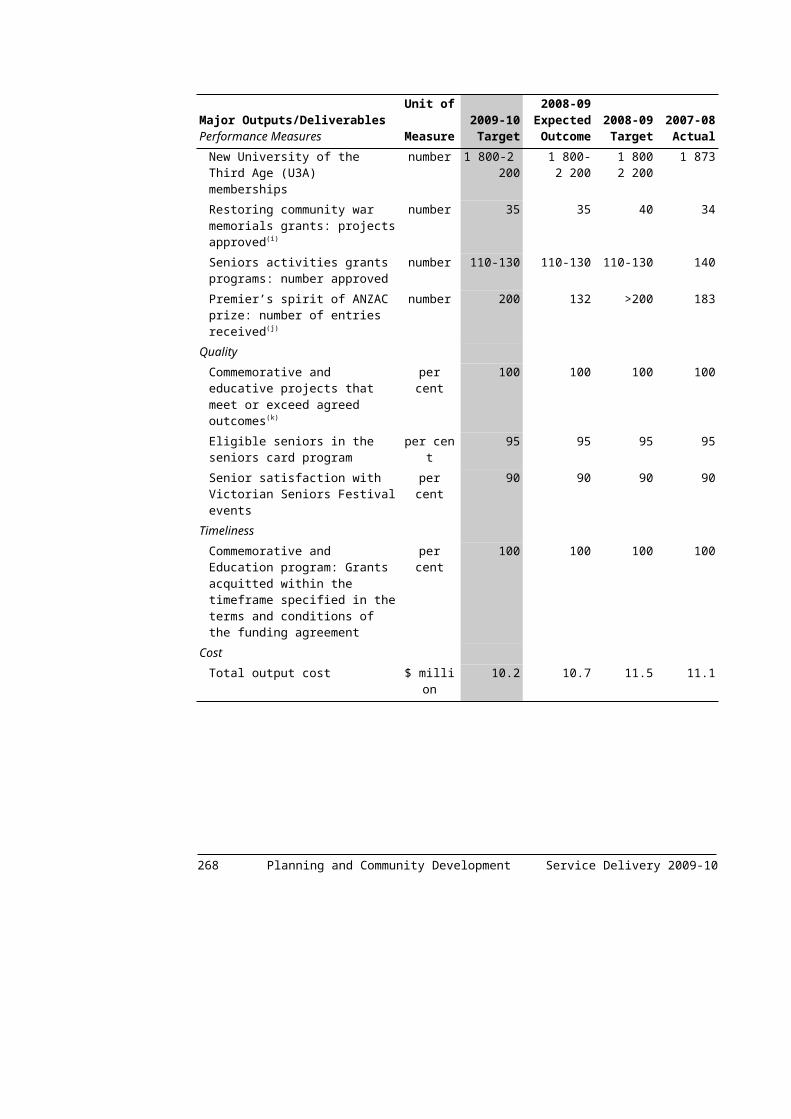
Major Outputs/DeliverablesPerformance Measures
Unit of Measure
2009-10 Target
2008-09 Expected Outcome
2008-09 Target
2007-08 Actual
Quality Service provision rating (Ministerial survey data)
per cent 80 80 80 85
Timeliness Analysis and review of corporate plans, quarterly performance reports to agreed schedule
per cent 90 90 90 nm
Board appointments approved within agreed timelines
per cent 100 100 100 nm
Dates met for dividend payments per cent 100 100 100 nmCost
Total output cost $ million 6.1 5.5 6.3 6.5
Source: Department of Treasury and Finance
Notes:(a) The 2009-10 Target is below the 2008-09 Expected Outcome due to the reduction in the number of
board appointments scheduled to occur in 2009-10. (b) This performance measure replaces the 2008-09 measure ‘Corporate plans reviewed and assessed’
to incorporate the analysis of quarterly performance reports. (c) The 2009-10 Target is below the 2008-09 Expected Outcome due to a majority of rural and regional
water authorities who do not pay an interim dividend. The merging of First Mildura Irrigation Trust with Lower Murray Water has also impacted the 2009-10 Target.
270 Treasury and Finance Service Delivery 2009-10

Risk Management ServicesThis output provides risk management advice, frameworks and information to Ministers, departments, and private infrastructure partners to manage the government’s exposure to commercial and infrastructure project risks.
This output contributes to the key government outcome of sound financial management by providing advice and frameworks to manage commercial and infrastructure project risks.
Major Outputs/DeliverablesPerformance Measures
Unit of Measure
2009-10 Target
2008-09 Expected Outcome
2008-09 Target
2007-08 Actual
Land and Infrastructure Investment ManagementThis covers the provision of advice and assistance to departments, Ministers and senior Department of Treasury and Finance management on:
land purchases, sales and remediation;
feasibility studies, business cases, procurement processes and contractual management of major projects and commercial transactions;
policy to support project delivery; and
medium to long-term asset investment planning and processes for investment decision making.
Quantity Commercial and risk management advice on projects which facilitate infrastructure and which minimise the Government’s exposure to risk(a)(b)
number 300 310 189 365
Promoting the Gateway process to minimise the Government’s exposure to project risks(c)(d)
number 70 112 90 nm
Revenue from sale of surplus Government land including Crown land (DTF portfolio)(e)(f)
$ million 40 35 30 38.9
Services (including policy, procedures and training) which facilitate new infrastructure investment(g)
number 30 38 18 19
Quality Service provision rating (Ministerial survey data)
per cent 80 80 80 nm
Cost Total output cost $ million 21.8 21.7 19.2 22.6
Source: Department of Treasury and Finance
Service Delivery 2009-10 Treasury and Finance 271

Notes:(a) This performance measure replaces the 2008-09 performance measure ‘Commercial and risk
management advice on projects which facilitate new infrastructure and which minimise Government’s exposure to risk’. The 2009-10 performance measure is the same as the 2008-09 measure except for omission of the word ‘new’ to reflect measurement of commercial and risk management advice on new and existing infrastructure.
(b) The 2008-09 Expected Outcome exceeds the 2008-09 Target due to a greater than anticipated workload following the merging of the 2008-09 outputs ‘Commercial and Infrastructure Project Management’ and ‘Government Land and Property Services’.
(c) The 2008-09 Expected Outcome exceeds the 2008-09 Target due to an increase in the number of Gateway reviews, Gateway training and products provided by the Gateway Unit in 2008-09.
(d) The 2009-10 Target is below the 2008-09 Expected Outcome as it will incorporate measurement of Gateway reviews only. The performance measure ‘Services (including policy, procedures and training) which facilitate new infrastructure investment’ will include measurement of other Gateway services including training.
(e) The 2008-09 Expected Outcome exceeds the 2008-09 Target and is based on the number of properties expected to be sold in 2008-09.
(f) The 2009-10 Target reflects an increase in the number of estimated properties likely to be identified as surplus to requirements by departments and agencies.
(g) The 2008-09 Expected Outcome exceeds the 2008-09 Target due to a greater than anticipated workload following the merging of the 2008-09 outputs `Commercial and Infrastructure Project Management’ and ‘Government Land and Property Services’.
272 Treasury and Finance Service Delivery 2009-10

Resource Management ServicesThis output assists the government to administer and co-ordinate its:
land and property portfolio; and
provision of administrative services.
This output contributes to the key government outcome of sound financial management by maximising value in purchasing decisions and providing professional management of substantial government assets.
Major Outputs/DeliverablesPerformance Measures
Unit of Measure
2009-10 Target
2008-09 Expected Outcome
2008-09 Target
2007-08 Actual
Government ServicesDeliver effective and efficient whole of government common services and projects in areas including procurement, fleet, accommodation and information and communications technology. Provide strategic leadership in the implementation of Efficient Government policy and contribute to achieving Growing Victoria Together outcomes.
Quantity Briefs provided on services to Government(a)(b)
number 70 88 60 90
Deliver or renew whole of government policy, standards and guidelines(c)(d)
number 30 34 15 14
Establishment or renewal of whole of government contracts(e)
number 15 18 15 17
Significant projects completed(f)(g) number 15 19 10 9Quality
Products and services meet service commitments(h)
per cent 90 100 90 98
Service provision rating (Ministerial survey data)
per cent 80 80 80 60
Significant projects meet critical success factors
per cent 90 90 90 100
Total accommodation cost(i)(j) $ per square
metre per year
335 322 305 295
Workspace ratio(k)(l) square metre per
FTE
15.5 15.1 15.5 15.1
Timeliness Significant projects delivered within agreed timelines
per cent 90 90 90 100
Whole of government contracts renewed within agreed timelines
per cent 90 90 90 100
Service Delivery 2009-10 Treasury and Finance 273

Major Outputs/DeliverablesPerformance Measures
Unit of Measure
2009-10 Target
2008-09 Expected Outcome
2008-09 Target
2007-08 Actual
Cost Total output cost(m) $ million 113.5 78.7 79.6 68.2
Source: Department of Treasury and Finance
Notes:(a) The 2009-10 Target reflects an increase in anticipated demand in 2009-10.(b) The 2008-09 Expected Outcome exceeds the 2008-09 Target due to a higher than anticipated demand
from the Minister’s office.(c) The 2008-09 Expected Outcome exceeds the 2008-09 Target due to the Government’s approval of the
Efficient Technology Services initiative in December 2008 which is generating an increase in further activity for this performance measure.
(d) The 2009-10 Target reflects an increase in expected activity in 2009-10.(e) The 2008-09 Expected Outcome exceeds the 2008-09 Target due to the Government’s approval of the
Efficient Technology Services initiative in December 2008 which is generating an increase in project activity.
(f) The 2008-09 Expected Outcome exceeds the 2008-09 Target due to the Government’s approval of the Efficient Technology Services initiative in December 2008 which is generating an increase in project activity.
(g) The 2009-10 Target reflects an increase in expected project activity in 2009-10.(h) The 2008-09 Expected Outcome exceeds the 2008-09 Target due to the impact of the delivery of
projects associated with the Efficient Technology Services initiative.(i) The 2008-09 Expected Outcome exceeds the 2008-09 Target based on current accommodation rent
reviews for which increases are anticipated, as supported by advice from the Valuer-General.(j) The 2009-10 Target reflects rental increases where the Government is committed to medium-term
accommodation leases.(k) The 2008-09 Expected Outcome is below the 2008-09 Target due to improved utilisation of
workspace.(l) The 2007-08 Actual is different to the 2007-08 Outcomes disclosed in the 2007-08 Department of
Treasury and Finance Annual report as the Workspace Ratio Audit Report was completed after publication of the Annual Report.
(m) The 2009-10 Target exceeds the 2008-09 Expected Outcome due to an increase in funding to deliver implementation of the Efficient Technology Services initiative.
274 Treasury and Finance Service Delivery 2009-10

Regulatory ServicesThese outputs regulate utilities and other regulated markets in Victoria and provide advice on ways the Government can improve the business environment.
These outputs contribute to the key government outcome of sound financial management by informing Government on ways to create a competitive business environment and by efficiently regulating utilities and other specified markets to protect the long-term interests of Victorian consumers with regard to price, quality and reliability of essential services.
Major Outputs/DeliverablesPerformance Measures
Unit of Measure
2009-10 Target
2008-09 Expected Outcome
2008-09 Target
2007-08 Actual
Economic Regulatory ServicesEconomic regulation of utilities and other specified markets in Victoria to protect the long-term interests of Victorian consumers with regard to price, quality and reliability of essential services.
Quantity Company performance reviews and audits(a)
number 76 30 30 18
Industry performance reports(b)(c) number 4 7 6 5New or revised regulatory instruments
number 2 2 2 nm
Price approvals(d) number 19 25 26 nmRegistration and accreditation decisions/approvals(e)
number 300 50 50 nm
Reviews, investigations or advisory projects(f)
number 1 4 4 nm
Quality Decisions upheld where subject to review, appeal or disallowance
per cent 100 100 100 nm
Timeliness Deadlines met for major milestones
per cent 100 100 100 95
Cost Total output cost $ million 14.3 17.9 12.1 15.7
Business Environment Policy AdviceThis output provides advice on ways the Government can improve the business environment.
Quantity Public inquiries number 3 3 3 3Reviews of Regulatory Impact Statements (RIS) and Business Impact Assessments (BIA) and Standard Cost Model Assessments
number 55 55 55 43
Service Delivery 2009-10 Treasury and Finance 275
Major Outputs/DeliverablesPerformance Measures
Unit of Measure
2009-10 Target
2008-09 Expected Outcome
2008-09 Target
2007-08 Actual
Quality Service provision rating (Commissioner assessment of Secretariat performance)
per cent 80 80 80 88.75
Timeliness Complete the initial assessment phase of BIA within 10 working days of receipt(g)
per cent 90 100 90 100
Complete the initial assessment phase of Regulatory Impact Statements (RIS) within 10 working days of receipt(g)
per cent 90 100 90 96
Complete the initial assessment phase on Standard Cost Model estimates within ten working days of receipt
per cent 90 90 90 75
Completion of inquiry reports by due date
per cent 100 100 100 100
Cost Total output cost $ million 5.8 5.6 5.7 5.8
Source: Department of Treasury and Finance
Notes:(a) The 2009-10 Target reflects an increase in the number of Victorian Renewable Energy Target
Scheme and Victorian Energy Efficiency Target Scheme audit reviews scheduled in 2009-10.(b) The 2008-09 Expected Outcome exceeds the 2008-09 Target due to the completion of an additional
report as requested by the Minister.(c) The 2009-10 Target is lower than the 2008-09 Expected Outcome reflecting the impact of the
Australian Energy Regulator on work previously completed by the Essential Services Commission.(d) The 2009-10 Target is lower than the 2008-09 Expected Outcome reflecting the impact of the
Australian Energy Regulator on work previously completed by the Essential Services Commission.(e) The 2009-10 Target reflects an increase in the number of decisions and approvals scheduled in
2009-10 under the Victorian Renewable Energy Target Scheme and the Victorian Energy Efficiency Target Scheme.
(f) The 2009-10 Target is lower than the 2008-09 Expected Outcome reflecting the impact of the Australian Energy Regulator on work previously completed by the Essential Services Commission.
(g) The 2008-09 Expected Outcome exceeds the 2008-09 Target due to the completion of work ahead of schedule.
276 Treasury and Finance Service Delivery 2009-10
Revenue Management ServicesThis output administers revenue collections of major taxes and duties on behalf of the Government. It also assesses and processes unclaimed moneys applications.
The output contributes to the key government outcome of sound financial management by efficiently delivering revenue management services in Victoria.
Major Outputs/DeliverablesPerformance Measures
Unit of Measure
2009-10 Target
2008-09 Expected Outcome
2008-09 Target
2007-08 Actual
Revenue Management Services to GovernmentThe provision of revenue management services across the various State-based taxes in a fair and efficient manner for the benefit of all Victorians.
Quantity Revenue banked on day of receipt per cent >=99 >=99 >=99 99.66Revenue collected as a percentage of budget target
per cent >=99 >=98 >=99 114
Revenue detected from compliance projects meets estimates
per cent >=90 >=90 >=90 108
Quality Customer satisfaction level per cent >=80 >=80 >=80 89Maintain ISO 9001 & ISO/IEC 20000-1:2005 (ITIL) Certification
number 3 3 3 nm
Ratio of outstanding debt to total revenue
per cent <2 <2 <2 1.32
Timeliness Court timelines met per cent 100 100 100 100Meet Cabinet and Parliamentary time lines
per cent 100 100 100 100
Processing of unclaimed monies within 10 working days
per cent >=95 >=95 >=95 100
Timely handling of objections (within 90 days)
per cent >=80 >=80 >=80 83
Cost Total output cost $ million 72.9 60.2 63.2 68.9
Source: Department of Treasury and Finance
Service Delivery 2009-10 Treasury and Finance 277
PARLIAMENT
Departmental mission statementThe Parliament of Victoria, through its elected representatives, is accountable to the Victorian community for the provision and conduct of representative government in the interests of Victorians.
The Departments of the Parliament of Victoria deliver apolitical, professional and innovative services to the Parliament.
The Departments of the Parliament of Victoria include:
the Department of the Legislative Council; the Department of the Legislative Assembly; and the Department of Parliamentary Services.
The goals of the Departments of the Parliament of Victoria are to:
provide effective corporate governance; ensure excellent service delivery and efficiency of response; and ensure the sustainability of the business processes of Parliament into the future.
Victoria’s Constitution Act 1975 provides that the Auditor-General is an independent officer of Parliament. For budgetary purposes, the Victorian Auditor-General’s Office is included as an output classification within Parliament.
The main purpose of the Victorian Auditor-General’s Office is to provide assurance to Parliament on the accountability and performance of the Victorian public sector.
Significant challenges facing the Parliament in the medium termThe key challenges facing the Parliament, including the Victorian Auditor-General’s Office are:
providing key infrastructure to facilitate regional sittings; continuation of the webcasting of Parliamentary proceedings project; the delivery of the services demanded of the Parliament within existing resources; ensuring that the Parliament House remains a functional working location that is
accessible to the public within security constraints; negotiation of the enterprise agreement with electorate officers and Parliamentary
officers; and recruitment and retention of skilled audit staff in the Victorian Auditor-General’s
Office.
278 Parliament Service Delivery 2009-10
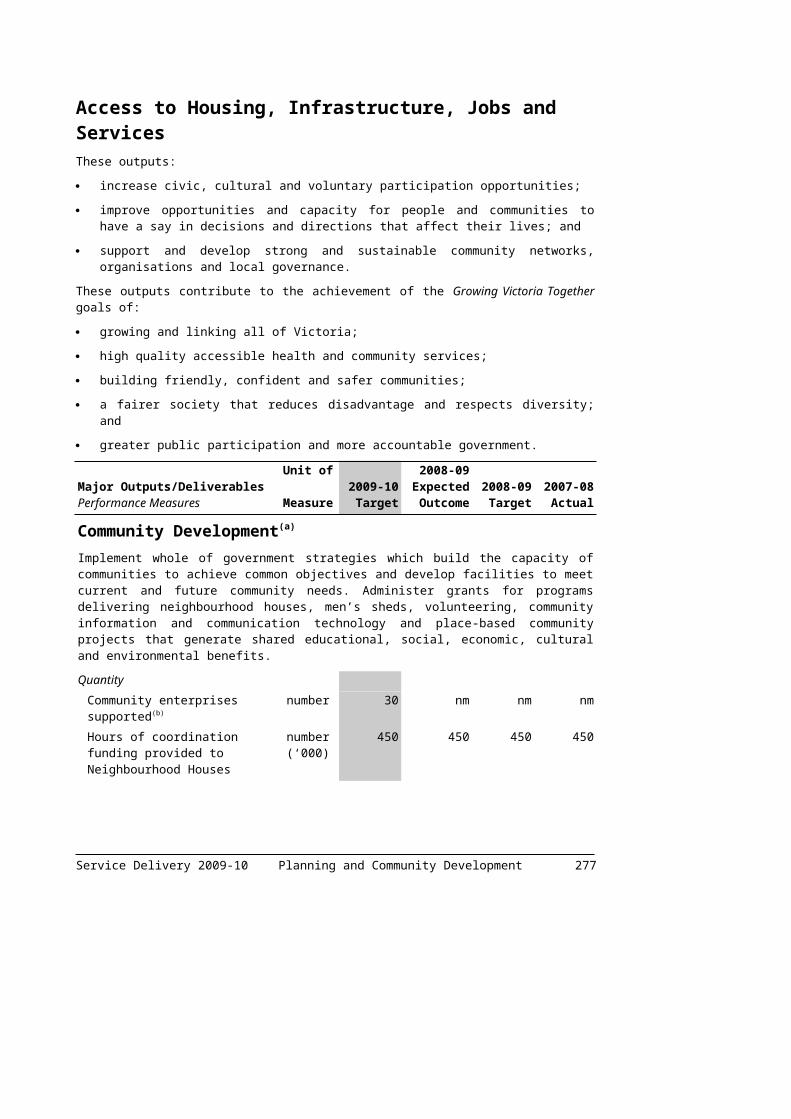
Major policy directions and strategiesThe Parliament is committed to remaining an organisation that:
provides a venue to allow the people’s representatives to participate in the democratic process;
promotes sound financial management; and provides a safe workplace.
Webcasting of Parliamentary proceedings has been a significant ongoing project undertaken by the Parliament. This project allows the Victorian public to have greater access to the proceedings of their Parliament. The Heritage Asset Management Strategy Phase 2 will conclude as a number of significant capital works taking place within the Parliamentary precinct come to an end. This will ensure that Parliament House continues as a safe working environment for members, staff and the public. Parliament will continue to meet regional sitting commitments.
The Department has not made any changes to its output structure in 2009-10.
Discontinued performance measures are detailed in Appendix C of this Budget Paper.
The following table summarises the total output cost. It has been prepared on the basis of the Parliament’s 2009-10 output structure and therefore allocations may differ from the Parliament’s previously published budget.
Table 3.11: Output Summary($ million)
2008-09 Budget
2008-09 Revised
2009-10 Budget
Variation(a)
%Legislative Council(b) 8.8 15.7 15.8 79.5Legislative Assembly(b) 17.8 29.6 29.7 66.9Parliamentary Services(c) 70.7 65.6 74.9 5.9Parliamentary Investigatory Committees 6.3 6.3 6.4 1.6Victorian Auditor-General's Office(d) 27.8 30.7 33.7 21.2Total(e) 131.4 147.9 160.5 22.1Source: Parliament of Victoria
Notes:(a) Variation between 2008-09 Budget and 2009-10 Budget.(b) The total output cost for both the Legislative Council and the Legislative Assembly for the 2009-10
Budget and 2008-09 Revised Budget has increased. This is due to a three year actuarial assessment, required under the Parliamentary Salaries and Superannuation Act, resulting in an expenditure increase.
(c) The total output cost for Parliamentary Services in 2009-10 has increased by 5.9 per cent compared with 2008-09. This is due to Members’ electorate office and communications budget carryover.
(d) The increase in the output expense budget of the Victorian Auditor-General’s Office from 2008-09 to 2009-10 reflects both an increase in the complexity of audit requirements, and market-driven cost pressures on audit service providers.
(e) Total output expense may not equate to the total expense reported in Budget Paper No. 4, Chapter 3, Departmental Financial Statements due to additional expenses in Budget Paper No. 4 that are not included in departmental output costs.
Service Delivery 2009-10 Parliament 279

The following section provides details of the outputs to be provided to government, including performance measures and costs for each output. Total expenditure for the Parliament can be found in Budget Paper No. 4, Chapter 3, Departmental Financial Statements.
280 Parliament Service Delivery 2009-10

Legislative CouncilThis output involves the provision of procedural advice to Members of the Legislative Council including: processing of legislation; preparation of the records of the proceedings and documentation required for the sittings of the Council; provision of assistance to Parliamentary Committees; provision of information relating to the proceedings of the Council; and the enhancement of public awareness of Parliament.
Major Outputs/DeliverablesPerformance Measures
Unit of Measure
2009-10 Target
2008-09 Expected Outcome
2008-09 Target
2007-08 Actual
Procedural Support, Documentation Preparation and Provision of Information For CouncilQuantity
Procedural references updated biannually
number 2 2 2 2
Security audit requirements met a year
number 2 2 2 2
Quality Bills and amendments processed accurately through all relevant stages
per cent 100 100 100 100
Constitutional, parliamentary and statutory requirements met
per cent 100 100 100 100
Member satisfaction with accuracy and timeliness of advice
per cent 80 80 80 80
Visitors satisfaction with service quality in relation to tours of Parliament
per cent 85 85 85 85
Timeliness House documents tabled within time guidelines
per cent 90 90 90 90
Parliamentary documents available one day after sitting day
per cent 98 98 98 98
Cost Total output cost(a) $ million 15.8 15.7 8.8 9.2
Source: Parliament of Victoria
Note:(a) The total output cost for the Legislative Council 2009-10 Target and 2008-09 Expected Outcome has
increased compared with the 2008-09 Target. This is due to a three year actuarial assessment, required under the Parliamentary Salaries and Superannuation Act, resulting in an expenditure increase.
Service Delivery 2009-10 Parliament 281
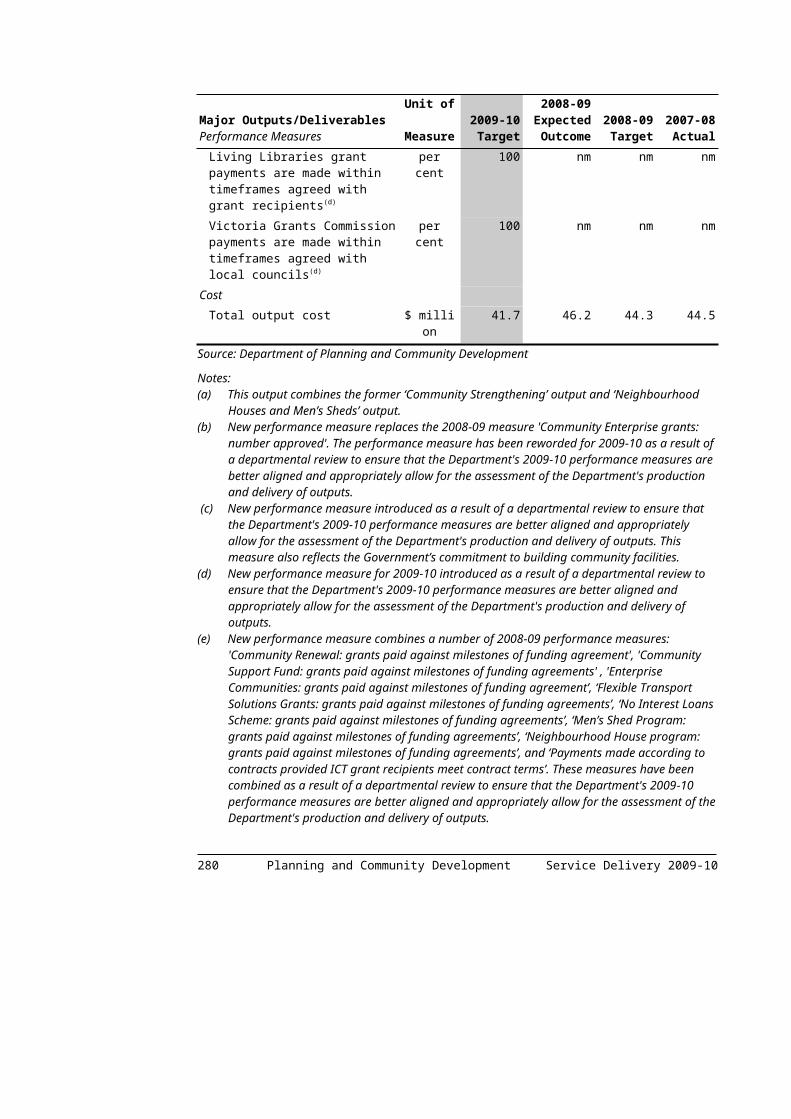
Legislative AssemblyThis output involves the provision of procedural advice to Members of the Legislative Assembly including: processing of legislation; preparation of the records of the proceedings and documentation required for the sittings of the Assembly; provision of assistance to Parliamentary Committees; provision of information relating to the proceedings of the Assembly; and the enhancement of public awareness of Parliament.
Major Outputs/DeliverablesPerformance Measures
Unit of Measure
2009-10 Target
2008-09 Expected Outcome
2008-09 Target
2007-08 Actual
Procedural Support, Documentation Preparation and Provision of Information For AssemblyQuantity
Procedural references updated biannually
number 2 2 2 2
Security audit requirements met a year
number 2 2 2 2
Quality Bills and amendments processed accurately through all relevant stages
per cent 100 100 100 100
Constitutional, parliamentary and statutory requirements met
per cent 100 100 100 100
Member satisfaction with accuracy and timeliness of advice
per cent 80 80 80 93
Visitors satisfaction with service quality in relation to tours of Parliament
per cent 85 85 85 93
Timeliness Documents tabled within time guidelines
per cent 90 90 90 99
House documents available one day after sitting day
per cent 100 100 100 100
Cost Total output cost(a) $ million 29.7 29.6 17.8 16.6
Source: Parliament of Victoria
Note:(a) The total output cost for the Legislative Assembly 2009-10 Target and 2008-09 Expected Outcome
has increased compared with the 2008-09 Target. This is due to a three year actuarial assessment, required under the Parliamentary Salaries and Superannuation Act, resulting in an expenditure increase.
282 Parliament Service Delivery 2009-10

Parliamentary ServicesParliamentary Services provides consultancy, advisory and support services in the areas of library, Hansard, education, human resources, finance, information technology (IT), maintenance, grounds and facilities for the Parliament of Victoria.
Service Delivery 2009-10 Parliament 283

Major Outputs/DeliverablesPerformance Measures
Unit of Measure
2009-10 Target
2008-09 Expected Outcome
2008-09 Target
2007-08 Actual
Provision of Information and Resources to ParliamentQuantity
Briefings provided(a) number 200 200 140 164Items processed for retrieval(a) number 42 000 42 000 27 000 42 981IT system up time per cent 99 99 99 99Parliamentary audio system transmission availability
per cent 99 99 99 99
Provision of fully resourced electorate offices outside the Parliamentary Precinct
number 128 128 128 128
Service requests satisfied(a) number 10 000 10 000 8 500 9 109Uptake of class visits to Parliament House
number 600 600 600 600
Visitor sessions on library intranet site(a)
number 48 000 48 000 40 000 49 467
Quality Accuracy of transcripts, records and reports
per cent 99 99 99 99
Audibility of parliamentary audio transmission
per cent 99 99 99 99
Client Satisfaction with the quality of information provided
per cent 85 85 85 94
Members, staff and officers satisfied or better with the services provided
per cent 80 80 80 89
Timeliness Indexes, records, speeches and transcripts provided within agreed timeframes and in required formats
per cent 99 99 99 99
Members, staff and officers satisfied or better with the time frame of service delivery
per cent 96 96 96 95
Satisfaction with timeliness of information provided
per cent 85 85 85 89
Cost Total output cost(b) $ million 74.9 65.6 70.7 60.4
Source: Parliament of Victoria
Notes:(a) The 2009-10 Target has been revised upwards, based on the 2008-09 Expected Outcome. The
2008-09 Expected Outcome has been increased compared to the 2008-09 Target due to increased demand on the Parliamentary library and research units for reference enquiries both from MPs and electorate officers with regards to newspaper clippings, audio and video clips as well as journal articles, coupled with high quality analysis and advice to MPs. The parliamentary library and
284 Parliament Service Delivery 2009-10

research unit will continue to meet all Parliamentary expectations, leading to a continuation of this level of demand.
(b) The total output cost for Parliamentary Services 2009-10 Target has increased compared with the 2008-09 Target. This is due to Member’s electorate office and communications budget carryover.
Service Delivery 2009-10 Parliament 285
Parliamentary Investigatory CommitteesJoint Investigatory Committees are appointed pursuant to the Parliamentary Committees Act 2003 to inquire into and report on matters referred by either House or the Governor in Council, or which may be self-generated by a Committee.
Major Outputs/DeliverablesPerformance Measures
Unit of Measure
2009-10 Target
2008-09 Expected Outcome
2008-09 Target
2007-08 Actual
Reports tabled and papers publishedQuantity
Discussion/Issues Papers published per annum
number 1 1 1 2
Reports tabled per annum number 28 28 28 27Quality
Committee members satisfied with accuracy and timeliness of procedural, research and administrative advice
per cent 80 80 80 92
Reports produced in compliance with procedural and legislative requirements
per cent 100 100 100 100
Timeliness Reports tabled within procedural and legislative deadlines
per cent 100 100 100 100
Cost Total output cost $ million 6.4 6.3 6.3 6.1
Source: Parliament of Victoria
286 Parliament Service Delivery 2009-10

Victorian Auditor-General's OfficeThe purpose of the Victorian Auditor-General’s Office is to provide assurance to Parliament on the accountability and performance of the Victorian public sector.
Under the Audit Act 1994, the Auditor-General audits financial statements prepared by Victorian public sector agencies and issues audit reports thereon. In addition, the Auditor-General carries out performance audits to determine whether authorities, operations or activities are operating effectively, economically and efficiently in compliance with all relevant Acts.
The outputs of the Victorian Auditor-General’s Office are:
parliamentary reports and services; and
audit reports on financial statements.
Major Outputs/DeliverablesPerformance Measures
Unit of Measure
2009-10 Target
2008-09 Expected Outcome
2008-09 Target
2007-08 Actual
Parliamentary Reports and ServicesQuantity
Auditor-General’s Reports(a)(b) number 34 33 31 33Quality
Overall level of external satisfaction with audits(c)
score 75 80 80 72
Timeliness Inquiries from Members of Parliament and the public responded to within 28 days
per cent 95 95 95 95
Reports completed on time per cent 90 90 90 88Cost
Total output cost(d) $ million 13.9 12.3 12.2 13.9
Audit reports on Financial StatementsQuantity
Audit opinions issued on non-financial performance indicators
number 114 115 115 114
Audit opinions issued on the financial statements of agencies
number 600 607 625 640
Quality Overall level of external satisfaction with audits(c)(e)
score 75 75 80 73
Timeliness Audit opinions issued within statutory deadlines
per cent 98 98 98 96
Management letters and reports to Ministers issued within established timeframes
per cent 90 92 90 90
Service Delivery 2009-10 Parliament 287

Major Outputs/DeliverablesPerformance Measures
Unit of Measure
2009-10 Target
2008-09 Expected Outcome
2008-09 Target
2007-08 Actual
Cost Total output cost(d)(f) $ million 19.8 18.4 15.6 19.2
Source: Parliament of Victoria
Notes:(a) The target for the performance measure ‘Auditor-General's Reports’ has increased from 31 to 34
between 2008-09 and 2009-10. This reflects the disaggregation of results of financial statement audits into sector-specific reports.
(b) The 2008-09 expected outcome for the performance measure ‘Auditor-General’s Reports’ has increased to 33 from a target of 31. This reflects our responsiveness to issues of high priority that emerged during the year.
(c) The target for the performance measure ‘Overall level of external satisfaction with audits’ has decreased from 80 (per cent) to 75 (score) between 2008-09 and 2009-10. This reflects a change in the methodology of measurement, where a given percentage is generally equivalent to a lower score.
(d) The target for the performance measure ‘Total output cost’ for the output ‘Parliamentary reports and services’ has increased from $12.2 million to $13.9 million from 2008-09 to 2009-10. The same target for the output ‘Audit reports on financial statements’ has increased from $15.6 million to $19.8 million from 2008-09 to 2009-10. This reflects both an increase in the complexity of audit requirements, and market-driven cost pressures on audit service providers.
(e) The 2008-09 expected outcome for the performance measure ‘Overall level of external satisfaction with audits’ for the output ‘Audit reports on Financial Statements’ has decreased to 75 (score) from a target of 80 (per cent). This reflects a change in the methodology of measurement, where a given percentage is generally equivalent to a lower score.
(f) The 2008-09 expected outcome for the performance measure ‘Total output cost’ for the output ‘Audit reports on Financial Statements’ has increased to $18.4 million from a target of $15.6 million. This reflects both an increase in the complexity of audit requirements, and market-driven cost pressures on audit service providers.
288 Parliament Service Delivery 2009-10
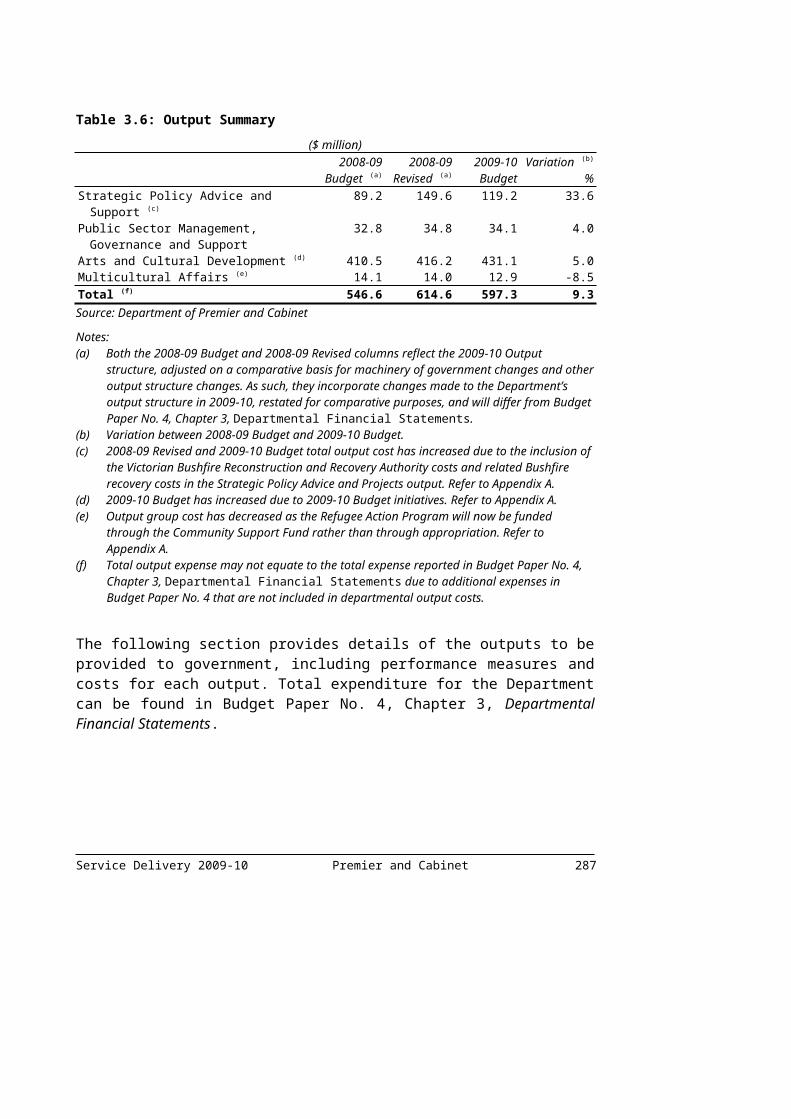
CHAPTER 4 – ELECTION COMMITMENTS IMPLEMENTATION REPORT CARD
The Government, through the 2008-09 Budget, has fully funded its election output commitments and through the 2009-10 Budget makes further substantial progress towards its election asset commitments as outlined in Labor’s Financial Statement 2006.
The remaining total estimated investment for election asset commitments will be funded in next year’s budget.
Labor’s Financial Statement 2006 makes further substantial progress towards the achievement of the Government’s vision and goals articulated in Growing Victoria Together. Growing Victoria Together reflects the Government’s vision to 2010 and beyond, and articulates the priorities the Government has set to build a better society.
The election commitments of Labor’s Financial Statement 2006 renewed the Government’s commitment to achieve the goals set out in Growing Victoria Together with a focus on continuing to rebuild services in health, education and community safety.
An overview of the Government’s cumulative service delivery achievements since 1999 is set out in Chapter 2 of this budget paper. Detailed information about the Government’s progress towards the achievement of its Growing Victoria Together goals is provided in Appendix B of this budget paper.
The Government has fully funded all of the election output commitments outlined in Labor’s Financial Statement 2006 and has approved funding of $2.7 billion for these commitments. A full list of the election output commitments and the funding provided are detailed in 2008-09 Budget Paper No. 3, Service Delivery.
Asset investment initiatives included in Labor’s Financial Statement 2006 cover upgrades of existing facilities and new construction projects that are targeted to maintain high quality and accessible services for communities. Labor’s Financial Statement 2006 estimated the cost of these initiatives at around $3.4 billion total estimated investment (TEI).
In the 2009-10 Budget, the Government approved election asset commitment investments with a TEI of $549 million, building on the $2.5 billion of initiatives previously funded. The remaining asset investment election commitments with a TEI of $429 million will be delivered in next year’s budget.Service Delivery 2009-10 Chapter 4 289
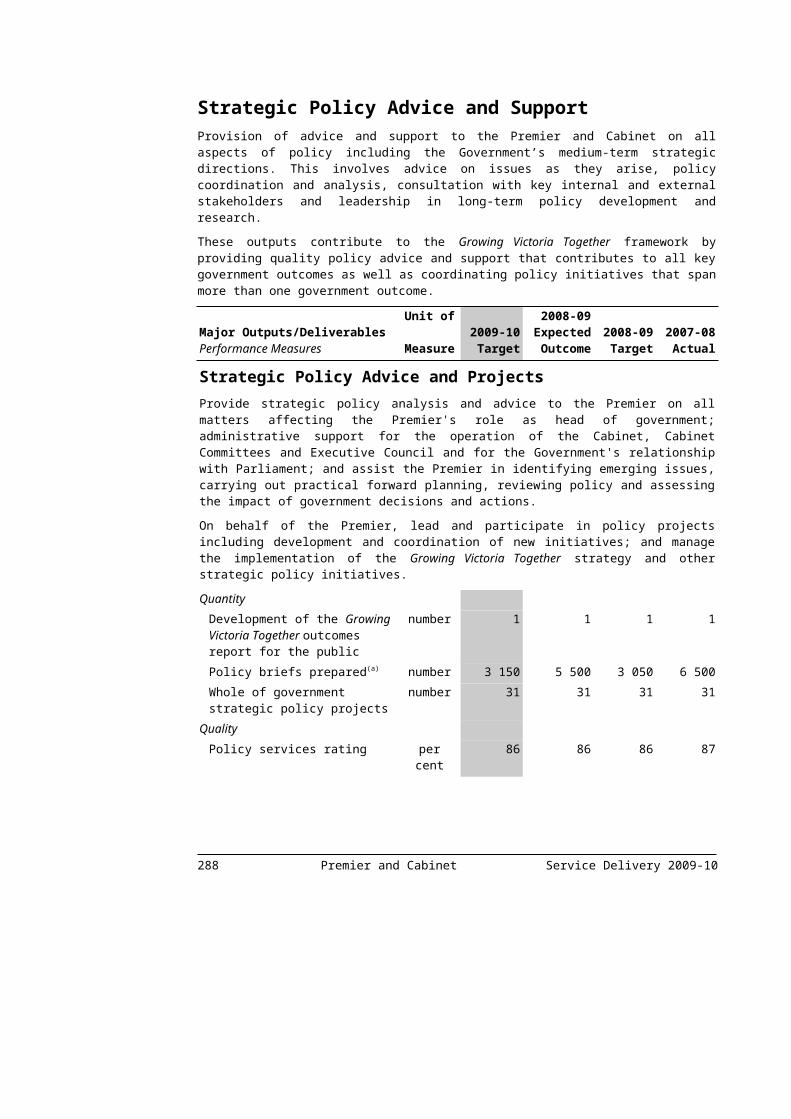
Table 4.1 provides a summary of asset and output funding highlighting Labor’s Financial Statement 2006 total costings and the progress made to date. Table 4.2 provides a full list of Labor’s Financial Statement 2006 asset initiatives, the costings and the funding provided to date.
Table 4.1: Labor’s Financial Statement 2006 – summary of asset and output funding table to date
($ million)Labor's
Financial Statement
costings
Funded prior to
2008-09 Budget
Funded in 2008-09 Budget
Funded in 2009-10 Budget
Yet to be funded
Total funding to date
Funding Approved
to Date (per cent)
OutputLFS output costing (a) 2 566.4 2 270.0 439.0 .. .. 2 709.0 100%Number of initiatives 172 172 .. .. .. 100%AssetLFS asset TEI (b)(c)(d) 3 422.0 1 499.7 952.3 548.8 428.6 3 000.8 88%Number of initiatives 93 78 13 2 .. 100%Source: Department of Treasury and Finance
Notes:(a) Funding for some initiatives have been reclassified from output to asset.(b) Funding for some initiatives have been reclassified from asset to output.(c) Revised figure ‘Funded in 2008-09 Budget’ due to administrative variations.(d) Figure ‘Yet to be Funded’ represents remaining TEI of Labor's Financial Statement 2006 asset
initiatives that are partly funded and are to be considered in next year’s budget.
290 Chapter 4 Service Delivery 2009-10

Table 4.2: Labor’s Financial Statement 2006 asset initiatives($ million)
Funding Approved TEI Funding
Approved to 2008-09 (a)
2009-10 2010-11 2011-12 2012-13 TEI
Education and SkillsTwo select entry high schools (b) 40.0 11.0 20.0 13.0 .. .. 44.0200 Science rooms
redevelopment (b) 50.0 10.1 10.2 9.8 .. .. 30.1
Maribyrnong Sport school (b, c) 10.0 10.0 .. .. .. .. 10.0John Monash Science School (c) 20.0 14.0 6.0 .. .. .. 20.0Three Science Centres (b) 12.0 .. 3.0 9.0 .. .. 12.0Modernisation, regeneration,
replacement schools and other projects (b, d, e)
1 227.0 522.8 287.8 153.3 3.3 .. 967.2
20 new schools in growth corridors (b)
219.0 95.1 111.9 68.3 .. .. 275.4
Ultranet 60.0 42.0 15.5 3.0 .. .. 60.5Computers (b, f) 28.0 14.0 7.0 .. .. .. 21.0Modernise 30 Tech wings at
secondary colleges and renew equipment at all secondary schools
50.0 16.0 16.0 11.0 7.0 .. 50.0
Kangan Batman Docklands - Stage 2
30.0 12.0 15.0 3.0 .. .. 30.0
Gordon Institute - Wool Classing
3.0 3.0 .. .. .. .. 3.0
Nursing Centre of Excellence (Box Hill)
4.5 4.5 .. .. .. .. 4.5
Northern Institute of TAFE (Epping)
10.5 3.0 4.5 3.0 .. .. 10.5
Small rural schools (b) 70.0 17.5 24.7 5.4 .. .. 47.5400 relocatable classrooms (b) 45.0 4.2 16.6 24.2 .. .. 45.0Total Education and Skills 1 879.0 779.1 538.3 302.9 10.3 .. 1 630.6
HealthHealth ServicesAustin Surgery Centre 8.0 8.0 .. .. .. .. 8.0St Vincent's Surgery Centre 7.0 7.0 .. .. .. .. 7.0Emergency Departments -
Short stay units (b) 7.0 4.0 3.0 .. .. .. 7.0
Sunshine Hospital 184.0 32.6 39.4 21.5 .. .. 93.5Royal Victorian Eye and Ear
Hospital 2.0 0.7 0.9 0.4 .. .. 2.0
Frankston Hospital Stage 2A 45.0 19.0 17.0 9.0 .. .. 45.0Dandenong Hospital 25.0 0.9 6.3 14.3 3.5 .. 25.0Sunbury Day Hospital 15.0 2.0 8.0 5.0 .. .. 15.0Monash Medical Centre
Children's Wing 2.0 2.0 .. .. .. .. 2.0
Community Health Centres (b) 23.0 10.7 4.8 1.5 0.5 .. 17.5Ambulance Capital Upgrades
(MAS) 4.7 4.7 .. .. .. .. 4.7
Olivia Newton John Cancer Centre
25.0 5.0 20.0 .. .. .. 25.0
Warrnambool Hospital (b) 90.0 18.5 26.8 36.1 24.9 6.0 112.3
Service Delivery 2009-10 Chapter 4 291

Table 4.2: Labor’s Financial Statement 2006 asset initiatives (continued)($ million)
Funding Approved TEI Funding
Approved to 2008-09 (a)
2009-10 2010-11 2011-12 2012-13 TEI
Ballarat Hospital 10.0 3.0 7.0 .. .. .. 10.0Bendigo Health - design 2.0 1.5 0.5 .. .. .. 2.0Bendigo Health - Stella
Anderson 12.0 2.5 9.5 1.6 .. .. 13.6
Barwon Health - Geelong Hospital planning
2.0 2.0 .. .. .. .. 2.0
Alexandra and District Hospital (b, g)
15.0 1.0 7.3 11.7 .. .. 20.0
Nathalia Aged Care 18.0 7.9 8.6 1.5 .. .. 18.0Leongatha Aged Care 10.0 9.5 0.5 .. .. .. 10.0Trentham Aged Care 8.0 3.0 4.4 0.6 .. .. 8.0Latrobe Community Health
Centre - Morwell 21.0 2.0 9.0 10.0 .. .. 21.0
Stawell Community Health Centre
20.0 14.5 5.5 .. .. .. 20.0
Rural ambulance capital upgrades
11.4 5.5 2.9 3.5 .. .. 11.9
BreastScreen Digitalisation (b) 10.0 .. 2.5 5.0 2.5 .. 10.0Mental HealthDandenong Hospital (b, h) 69.0 2.0 5.0 17.1 18.9 16.8 69.1Northern Hospital 16.0 4.3 10.7 1.0 .. .. 16.0Prevention and Recovery Care
(PARCS) 20.0 10.6 7.5 1.9 .. .. 20.0
Active SeniorsLand Bank (b) 12.5 7.0 3.0 .. .. .. 10.0Total Health 694.6 191.4 210.1 141.7 50.3 22.8 625.6
JusticeCommunity SafetyPolice Stations 85.5 42.3 43.2 .. .. .. 85.5Facial recognition technology 2.5 2.6 .. .. .. .. 2.6Police cars (i) 3.9 1.0 1.0 0.4 .. .. 2.4Tablet computers for detectives 0.7 0.7 .. .. .. .. 0.7Forensic equipment 1.7 1.7 .. .. .. .. 1.7Weapons fund (i) 10.0 3.2 3.2 3.2 .. .. 9.7Equipment vests and thigh
holsters (f) 3.9 .. .. .. .. .. ..
Ready for any EmergencyNew and replacement
CFA/MFB stations, AVCG facility and protective clothing (i)
17.8 6.1 1.7 2.1 .. .. 9.9
New and replacement SES Units and training facilities
7.5 5.6 2.4 .. .. .. 8.0
Total Justice 133.5 63.2 51.5 5.7 .. .. 120.5
292 Chapter 4 Service Delivery 2009-10

Table 4.2: Labor’s Financial Statement 2006 asset initiatives (continued)($ million)
Funding Approved
TEI Funding Approved to
2008-09 (a)
2009-10 2010-11 2011-12 2012-13 TEI
Water, Environment and Climate Change
Water grid
Campaspe pipeline to Waranga Channel
2.5 2.6 .. .. .. .. 2.6
Making Every Drop Count
Continue Werribee Vision (j) .. 3.5 3.0 3.5 .. .. 10.0
Tackling Climate Change
Solar Panels at schools (j) .. 2.6 1.3 1.3 .. .. 5.2
National Parks and Biodiversity
Tourism assets in East Gippsland
1.8 0.8 1.0 .. .. .. 1.8
Piers and jetties 8.0 3.0 5.0 .. .. .. 8.0
Protection of beaches and foreshores
8.0 1.0 3.0 4.0 .. .. 8.0
Point Nepean and walking track (b)
10.6 0.6 10.0 .. .. .. 10.6
Urban Parks and bike paths (i, k) 37.1 4.9 1.9 1.1 .. .. 7.9
Total water, environment and climate change
68.0 19.0 25.2 9.9 .. .. 54.1
A Fairer Victoria
Addressing disadvantage
Supported accommodation 15.0 11.8 3.3 .. .. .. 15.1
Support for young people (f) 6.3 .. .. .. .. .. ..
Out of home Care accommodation
14.2 13.0 1.2 .. .. .. 14.2
Giving Children the Best Start in Life
Neonatal hearing tests 1.2 1.2 .. .. .. .. 1.2
Total A Fairer Victoria 36.7 26.0 4.5 .. .. .. 30.5
Housing Affordability
Affordable Housing (f) 60.0 .. .. .. .. .. ..
Total Housing Affordability 60.0 .. .. .. .. .. ..
Victorian Communities
Respecting Victorian Veterans
Service Delivery 2009-10 Chapter 4 293

Funding Approved
TEI Funding Approved to
2008-09 (a)
2009-10 2010-11 2011-12 2012-13 TEI
Mental health facility at Austin Health
10.0 8.8 8.2 .. .. .. 17.0
Total Victorian Communities 10.0 8.8 8.2 .. .. .. 17.0
Culture and Recreation
Recreational Fishing and Boating
New recreational fishing in Westernport (f)
5.0 .. .. .. .. .. ..
Establish a new fish hatchery in Northern Victoria
1.3 1.3 .. .. .. .. 1.3
Rebuild Flinders pier in Westernport Bay
2.0 2.1 .. .. .. .. 2.1
294 Chapter 4 Service Delivery 2009-10
Table 4.2: Labor’s Financial Statement 2006 asset initiatives (continued)($ million)
Funding Approved
TEI Funding Approved to
2008-09 (a)
2009-10 2010-11 2011-12 2012-13 TEI
Arts
City of Literature 8.0 8.0 .. .. .. .. 8.0
Arts Centre precinct 5.0 5.0 .. .. .. .. 5.0
Australian Centre for the Moving Image (ACMI)
5.8 5.9 .. .. .. .. 5.9
Total Culture and Recreation 27.1 22.3 .. .. .. .. 22.3
Transport and Liveability
Linking Victoria
Pacific National Buyback 133.8 133.8 .. .. .. .. 133.8
Geelong Bypass - Stage 4 (Geelong Ring Rd to Anglesea Rd, Geelong)
62.5 62.5 .. .. .. .. 62.5
Duplication of Thompsons Road - Cranbourne
22.0 14.5 7.5 .. .. .. 22.0
Duplication of Thompson Road - Carrum Downs
30.0 17.5 13.0 .. .. .. 30.5
Vineyard Road 25.0 19.1 5.9 .. .. .. 25.0
Ferntree Gully Road - widening 32.0 20.3 11.7 .. .. .. 32.0
Frankston Intersections (l) 20.0 5.5 .. .. .. .. 5.5
Traffic signals - Springvale 3.0 3.0 .. .. .. .. 3.0
Frankston Bypass EES 5.0 5.0 .. .. .. .. 5.0
Glenelg Highway passing lanes
3.0 3.0 .. .. .. .. 3.0
Signalisation Lower Dandenong Road/Boundary Road
5.0 5.1 .. .. .. .. 5.1
Hallam Station Park and Ride 2.0 3.0 .. .. .. .. 3.0
Coolaroo Station 36.0 10.0 26.0 .. .. .. 36.0
Yarra Glen Truck Bypass 9.0 .. 5.5 3.5 .. .. 9.0
Prahran and Windsor station upgrades
3.0 1.0 2.0 .. .. .. 3.0
Local Transport Initiatives 12.9 11.1 1.8 .. .. .. 12.9
Total Transport and Liveability
404.2 314.4 73.4 3.5 .. .. 391.3
Industry and Regional Development
Tourism
Service Delivery 2009-10 Chapter 4 295

Funding Approved
TEI Funding Approved to
2008-09 (a)
2009-10 2010-11 2011-12 2012-13 TEI
National Park camping facilities - Wilsons Promontory and Grampians
6.5 4.4 2.1 .. .. .. 6.5
Visitor facilities at Loch Ard and 12 Apostles
3.2 1.7 1.6 .. .. .. 3.3
Cranbourne Australian Garden 21.0 11.1 7.9 1.9 .. .. 20.9
New Regional Dental School Chairs
13.0 4.3 8.7 .. .. .. 13.0
296 Chapter 4 Service Delivery 2009-10

Table 4.2: Labor’s Financial Statement 2006 asset initiatives (continued)($ million)
Funding Approved TEI Funding
Approved to 2008-09 (a)
2009-10 2010-11 2011-12 2012-13 TEI
Provincial VictoriaNew VLocity Trains - Meeting
Our Transport Challenges reserve
65.2 51.6 13.6 .. .. .. 65.2
Total Industry and Regional Development
108.9 73.1 33.9 1.9 .. .. 108.9
Total Capital Investment 3 422.0 1 497.3 945.1 465.6 60.6 22.8 3 000.8Total Asset Investments to be considered in next year's budget 428.6Source: Department of Treasury and Finance
Notes:(a) Funding Approved to 2008-09, includes all funding provided in 2006-07, 2007-08 and 2008-09.(b) This initiative has received funding as part of the 2009-10 Budget. Refer to Appendix A for further
information.(c) Announced as Sir John Monash Science School and Maribyrnong Sport school.(d) Funding approved excludes science rooms redevelopment as science rooms are separately identified
in this table. Appendix A incorporates science rooms in modernisation, regeneration and replacement schools funding.
(e) Funding approved includes $15.5 million for Wodonga TAFE – National Logistics and Driver Training Centre which was not explicitly identified within the Victorian Schools Plan LFS commitment.
(f) The funding for this initiative has been reclassified from asset to output.(g) Additional funding has been provided for increased project scope, refer to Appendix A description. (h) The TEI for this initiative includes funding of $9.1 million beyond 2012-13.(i) Funding for part of this initiative has been reclassified from asset to output.(j) The funding for this initiative has been reclassified from output to asset.(k) A further $1.1 million in output funding was provided in the 2008-09 Budget for bike paths in
addition to the $7.3 million provided as part of the 2007-08 Budget.(l) The commitment to Peninsula Link will replace the need for the proposed overpass
Cranbourne-Frankston Road / Moorooduc Highway intersection.
Service Delivery 2009-10 Chapter 4 297
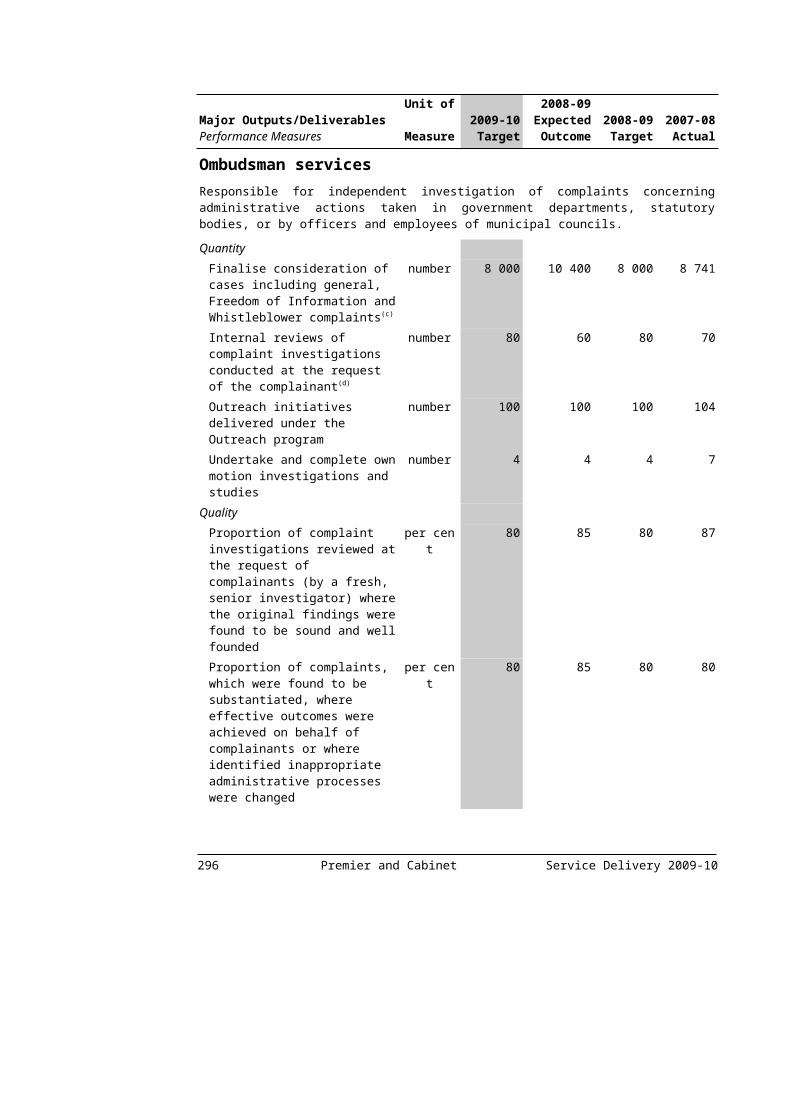
298 Chapter 4 Service Delivery 2009-10
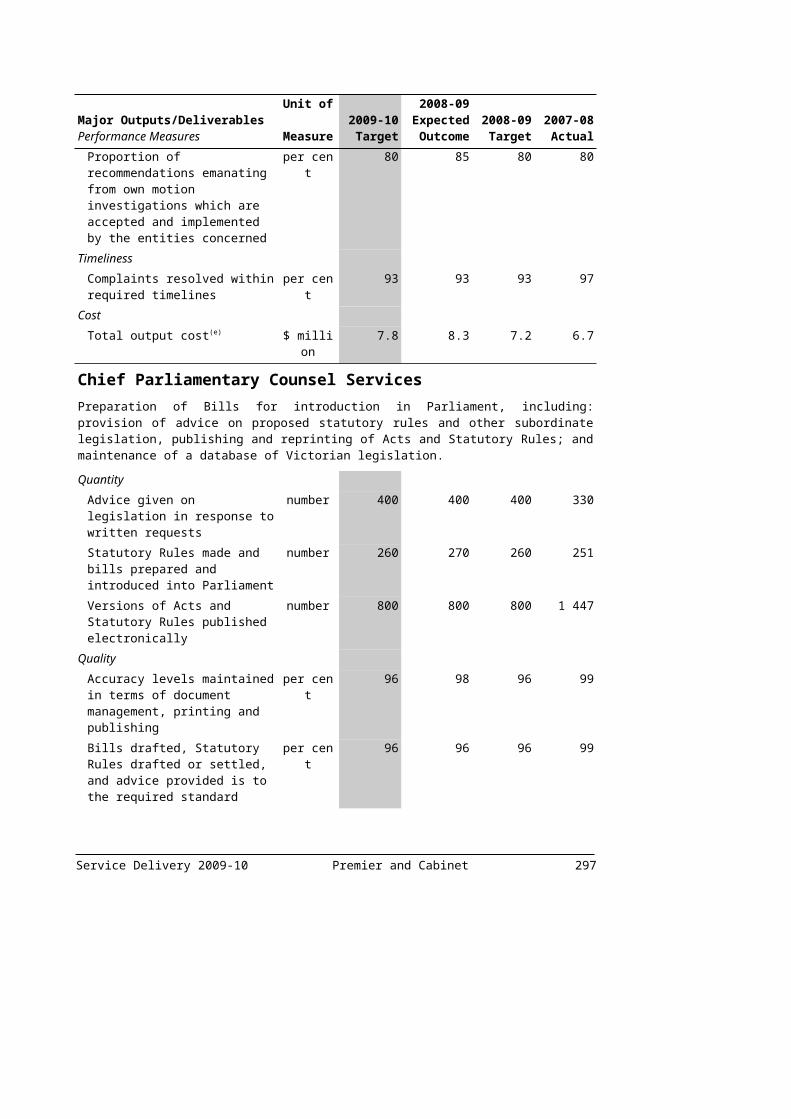
APPENDIX A – OUTPUT, ASSET INVESTMENT, AND REVENUE INITIATIVES
Appendix A includes the output, infrastructure and revenue initiatives approved and announced since the 2008-09 Budget. Government-wide initiatives are shown first followed by each government department’s initiatives.
The funding amounts are provided in the output and asset tables. Except where specified, figures indicate the total (gross) cost of initiatives. Funding from reprioritisation, contingencies and other existing funding sources has not been deducted from the total cost of the initiatives. Funding provided by the Commonwealth Government has been included.
Following the tables are descriptions of each initiative. Each initiative also has a cross reference to its relevant departmental output(s), which indicates the impact of policy decisions on relevant portfolios and reinforces the Government’s commitment to greater transparency and accountability in the budget papers.
The budget incorporates the impact of significant new policy measures, including additional output funding since the 2008-09 Budget of $2.2 billion in 2009-10, averaging $1.0 billion a year over the forward estimates period. The budget also provides for new asset investment, with total estimated investment (TEI) of $9.4 billion.
Appendix A includes initiatives funded by the Commonwealth Government’s Nation Building – Economic Stimulus Plan. This includes Building the Education Revolution initiatives, and Social and Community Housing initiatives.
Revenue initiatives and aggregate efficiencies to be realised by government departments are presented at the end of Appendix A.
GOVERNMENT-WIDE INITIATIVES
Output initiativesThe Government-wide output and infrastructure initiatives are shown in this section, including 2009 Victorian Bushfire Response and Recovery initiatives.
The funding amounts in these Government-wide tables are also shown in the departmental tables next to the ‘Government-wide initiatives’ heading in order to show correct totals in the departmental tables.
Service Delivery 2009-10 Appendix A 299
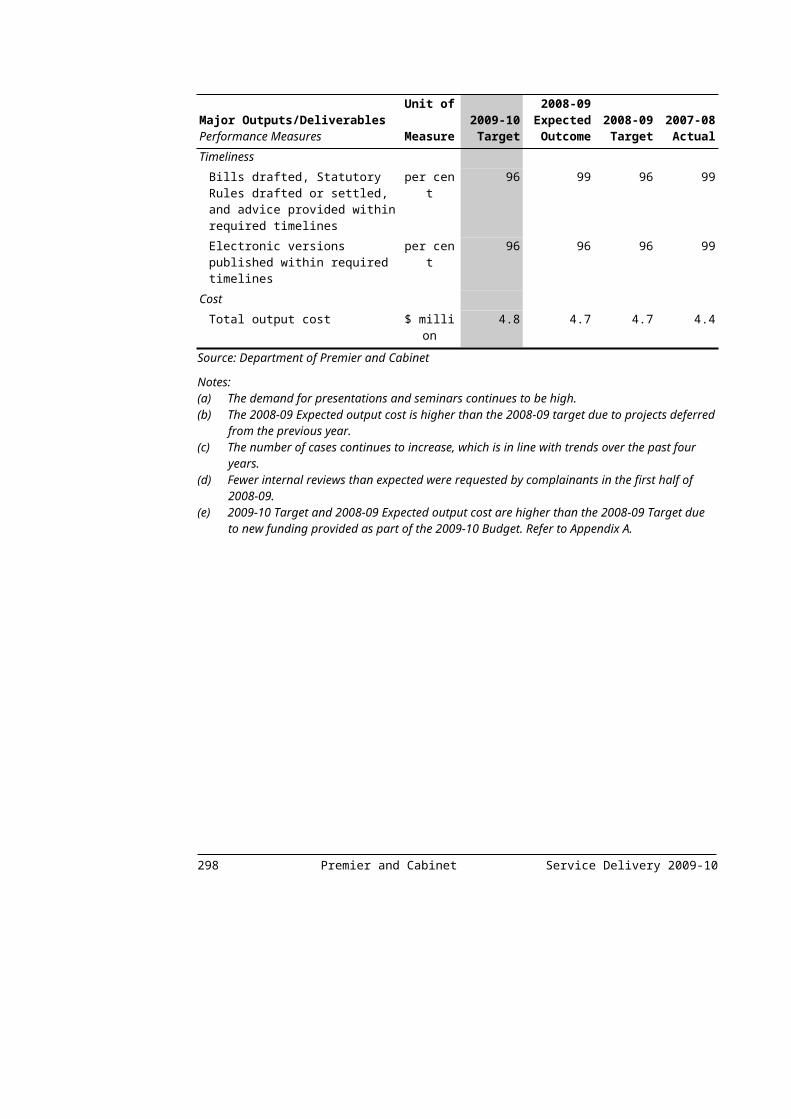
Table A.1: Output initiatives – Government-wide($ million)
2008-09 2009-10 2010-11 2011-12 2012-132009 Victorian Bushfire Response and Recovery (a)
Department of Education and Early Childhood DevelopmentKindergarten Services and Clean-Up 0.6 .. .. .. ..Student Wellbeing and Support 2.5 .. .. .. ..Support to Schools 1.7 .. .. .. ..Department of Human ServicesCase Management Program 15.1 55.0 .. .. ..Grants to Individuals and Housing
Support 19.7 .. .. .. ..
Health and Wellbeing 7.6 .. .. .. ..State Coordination and Regional
Response and Recovery 6.5 .. .. .. ..
Department of Innovation, Industry and Regional DevelopmentBusiness Assistance Package (f) 0.4 .. .. .. ..Improving Information to Regional Areas 0.2 .. .. .. ..Support for Regional Redevelopment 1.2 0.2 .. .. ..Tourism Bushfire Recovery Package 2.0 8.0 .. .. ..Department of Justice Coronial Hearings and Victim
Identification Services 6.5 .. .. .. ..
Counselling Services 0.9 .. .. .. ..Country Fire Authority Fleet
Replacement.. 0.9 0.9 0.9 0.9
Country Fire Authority – Funding for Operations Positions (b)
6.0 3.6 3.7 3.8 3.9
Country Fire Authority Ultra Light Tankers
.. 1.2 1.2 1.3 1.3
Emergency Communications Blackspots .. 1.8 5.6 5.7 5.9Expansion of the Victorian Bushfire
Information Line (c).. 0.2 0.1 0.1 ..
Police Emergency Services 24.4 .. .. .. ..Project 000 Response .. 31.3 25.4 23.2 18.9Victoria State Emergency Service Critical
Asset Replacement Program.. 0.9 0.9 0.9 0.9
Victoria State Emergency Service Volunteer Unit Operating Costs (d)
.. 1.6 1.7 1.7 1.8
Volunteer Recruitment and Recognition 3.9 .. .. .. ..Department of Planning and Community DevelopmentBushfire Building Standards 1.0 .. .. .. ..Bushfire Memorial Service 0.4 .. .. .. ..Community Building and Neighbourhood
Houses 0.9 .. .. .. ..
Grants to Volunteers 1.7 .. .. .. ..Department of Premier and CabinetBushfire Memorial Service 0.7 .. .. .. ..Clean-up and Demolition Program 34.2 12.0 .. .. ..Community Recovery Fund 10.0 .. .. .. ..Distribution of Donated Goods 4.0 .. .. .. ..Housing and Temporary Villages 1.6 .. .. .. ..
300 Appendix A Service Delivery 2009-10
Table A.1: Output initiatives – Government-wide (continued)($ million)
2008-09 2009-10 2010-11 2011-12 2012-13Victorian Bushfire Appeal Fund Donation 2.0 .. .. .. ..Victorian Bushfire Reconstruction and
Recovery Authority 9.2 12.0 .. .. ..
Victorian Bushfire Royal Commission 15.0 25.0 .. .. ..Department of Primary IndustriesAnimal Welfare and Emergency Fodder 4.0 .. .. .. ..Bushfire Suppression and Recovery 5.9 .. .. .. ..Soil Conservation Program 0.1 .. .. .. ..Support for Replacement of Fences by
Volunteers 1.0 .. .. .. ..
Department of Sustainability and EnvironmentBushfire Emergency Stabilisation Works 5.6 .. .. .. ..Bushfire Impact Research 0.5 .. .. .. ..Bushfire Preparedness (e) 10.0 10.3 10.5 10.8 11.1Fire Suppression 338.1 .. .. .. ..Project 000 Response .. 0.2 0.9 0.8 0.8Department of TransportPublic Transport Services 5.8 .. .. .. ..Road Repairs and Services 9.3 .. .. .. ..Department of Treasury and FinanceBushfire Funeral Expenses 3.0 .. .. .. ..Business Assistance Package (f) 10.0 5.0 .. .. ..Natural Disaster Relief Arrangements 16.0 .. .. .. ..VicForest Salvage Harvesting 4.0 .. .. .. ..Assisted Reproductive TreatmentAssisted Reproductive Treatment Act
2008 Implementation 0.7 2.0 1.6 1.7 1.7
Donor Register Transfer of Births, Deaths and Marriages
0.5 0.7 0.3 0.4 0.4
Autism State PlanAction for Children with an Autism
Spectrum Disorder.. 0.9 1.0 1.1 1.1
Mental Health Service Enhancement .. 1.0 1.0 1.1 1.1Channel Deepening Support Package (g)
Facilities Improvement Program 0.7 0.7 0.7 .. ..Grants for Business Support 1.0 1.0 .. .. ..Mordialloc Structure Plan 0.3 .. .. .. ..Multi-Stage Tourism Marketing
Campaign 0.2 0.2 0.2 .. ..
Small Business Education 0.3 0.3 .. .. ..Creating Liveable Neighbourhoods and CommunitiesCommunity Renewal .. 1.4 2.8 3.8 1.0Neighbourhood Renewal .. 9.3 5.7 1.1 1.1Drought ResponseCatchment Management Authority
Drought Employment Program (g) 10.0 .. .. .. ..
Community Drought Communications (g) 0.4 .. .. .. ..Drought Apprenticeship Retention
Bonus III (g) 1.9 .. .. .. ..
Drought Extension Support (g) 2.2 .. .. .. ..Service Delivery 2009-10 Appendix A 301

Table A.1: Output initiatives – Government-wide (continued)($ million)
2008-09 2009-10 2010-11 2011-12 2012-13Drought Health Services and Community
Support (g) 2.8 .. .. .. ..
Drought Response for Community Sport and Recreation Program 2009 (g)
2.2 2.2 .. .. ..
Extending the Case Management Approach to Supporting Farmers through Drought and Adjustment (g)
0.5 0.5 .. .. ..
Increased Demand for Exceptional Circumstances Drought Assistance (h)
30.0 .. .. .. ..
Municipal Rates Subsidy (g) 15.0 .. .. .. ..On-Farm Productivity Improvement
Grants (g) 6.0 .. .. .. ..
Regional Infrastructure Development Fund – Small Towns Development Fund (g)
10.0 .. .. .. ..
Regionally Significant Synthetic Surfaces Program (g)
1.9 1.9 .. .. ..
Water Rate Rebates for Irrigators (g) 57.8 .. .. .. ..Enhancing Disability Services and Outcomes0-18 System Reform – Cross-Sectoral
Planning and Common Assessment Approach (i)
.. 3.8 0.2 0.0 ..
Early Childhood Intervention Reform (j) .. 1.1 1.9 1.9 0.0Expand Individual Support Package
Capacity.. 7.0 7.2 7.6 8.2
Reorient Day Services to Individualised Support and Capability Building
.. 3.0 3.1 3.2 3.2
Strengthen Transition to Employment Support
.. 3.9 4.0 4.2 4.6
Mental Health Reform StrategyBuilding Forensic Mental Health Capacity
in Community Based Mental Health Services
.. 1.5 1.6 1.6 1.7
Building the Foundations for Recovery and Participation for People with a Mental Illness – Housing and Support
.. 3.8 3.9 4.0 4.0
Care Coordination for People with a Severe Mental Illness and Multiple Needs
.. 2.0 2.1 2.1 2.2
Early in Life : Improving Mental Health Outcomes for Children, Young People and Their Families
.. 3.4 5.8 6.0 6.1
Mental Health List Pilot .. 2.0 3.9 4.0 3.9Pathways to Mental Health Care:
Enhance Psychiatric Triage (Stage 2).. 1.5 3.1 3.2 3.3
Reducing Inequalities in Aboriginal Mental Health
.. 0.2 0.2 0.2 0.2
Strengthening the Mental Health Workforce and Local Mental Health Service System Development
.. 1.5 1.6 1.7 1.7
302 Appendix A Service Delivery 2009-10

Table A.1: Output initiatives – Government-wide (continued)($ million)
2008-09 2009-10 2010-11 2011-12 2012-13National Partnership on Indigenous Early Childhood DevelopmentAntenatal, Pre-pregnancy, Teenage
Health.. 0.8 1.0 1.2 1.2
Children and Family Centres (k) 1.0 4.2 3.9 3.1 2.2Victorian Alcohol Action Plan (g)
Accelerated Implementation of the Compliance Directorate
1.2 3.5 0.4 .. ..
Alcohol and Violence Campaign 2.0 .. .. .. ..Victorian Innovation Strategy (g)
Biotechnology Strategic Development Plan
5.0 5.0 5.0 5.0 ..
Boosting Highly Innovative Small and Medium Enterprises
7.0 16.0 12.0 5.0 ..
Information and Communication Technology Capability
4.0 12.5 12.5 6.0 ..
Victoria’s Science Agenda Investment Fund
22.0 41.0 46.0 36.0 ..
Victorian Advanced Resource Recovery Initiative
10.0 .. .. .. ..
Major Events (g) 6.7 10.6 29.5 42.0 ..Securing Jobs for Your Future – Skills for
Victoria (g) 20.8 40.0 78.3 127.0 ..
Total output initiatives 817.1 359.4 291.6 323.2 94.5Source: Department of Treasury and Finance
Numbers have been rounded to the nearest $100 000 for presentation purposes.Notes:(a) Includes Commonwealth funding agreed or under consideration through the Natural Disaster Relief
and Recovery Arrangements.(b) The net funding for this initiative was previously announced in the 2008-09 Budget Update. This did
not include insurance industry contributions.(c) Two thirds of the total funding is provided to the Department of Sustainability and Environment.(d) Includes local government funding.(e) This initiative was previously reported in the 2008-09 Budget Update as Fire Suppression initiative.(f) Funding included for operating impact of grant payments and interest rate subsidies only, and does
not reflect capital component of concessional loans.(g) These initiatives were previously reported in the 2008-09 Budget Update.(h) This initiative includes Commonwealth funding.(i) This initiative has funding of $21 000 in 2011-12. For presentation purposes, this figure has been
rounded to the nearest $100 000.(j) This initiative has funding of $43 000 in 2012-13. For presentation purposes, this figure has been
rounded to the nearest $100 000.(k) This initiative has funding of $2.2 million in 2013-14.
Service Delivery 2009-10 Appendix A 303

2009 Victorian Bushfire Response and Recovery
Department of Education and Early Childhood DevelopmentKindergarten Services and Clean-UpFunding is provided to manage the clean-up of kindergarten sites damaged or destroyed by the bushfires. Short-term fee support is also provided to families, kindergartens, and early childhood services.
This initiative contributes to the Department of Education and Early Childhood Development’s Early Childhood Education and Care output.
Student Wellbeing and SupportSupport is being provided to students through the provision of case managers and resources and materials to enable students to resume their studies with minimal delays and disruption.
This initiative contributes to the Department of Education and Early Childhood Development’s Early Years (schools), Middle Years (schools) and Later Years and Youth Transitions outputs.
Support to SchoolsFunding is provided for a range of initiatives to enable schools to resume classes as soon as possible after the fires. This includes clean-up of school sites, supplying relocatable classrooms, providing IT supplies and equipment and relief teachers.
This initiative contributes to the Department of Education and Early Childhood Development’s Early Years (schools), Middle Years (schools) and Later Years and Youth Transitions outputs.
Department of Human ServicesCase Management ProgramCase managers have been deployed across the State to work with Victorians affected by the bushfires to provide support to families as they make significant decisions regarding their future lives and homes, and to assist them to identify and access services and funding assistance.
This initiative contributes to the Department of Human Services’ Community Health Care output.
Grants to Individuals and Housing SupportIndividuals whose homes were destroyed or rendered uninhabitable by the bushfires were provided with a range of grants, including Personal Hardship and Distress Grants, to ensure that homeless individuals and families had access to temporary accommodation.
This initiative contributes to the Department of Human Services’ Community Health Care and Homelessness Assistance outputs.
304 Appendix A Service Delivery 2009-10

Health and WellbeingFunding has been provided for emergency health and medical services at relief centres and hospitals. These services include the expansion of the Nurse-on-Call service to attend to bushfire related queries and to support the operations of emergency centres, such as the burns unit at the Alfred Hospital, and ambulances.
Funding is also provided for counselling and support services to assist bushfire survivors in recovering from the psychological impact of the bushfires, including the employment of counsellors at relief centres and the deployment of mental health teams.
This initiative contributes to a range of Department of Human Services outputs.
State Coordination and Regional Response and RecoveryFunding is provided to support the management of delivery of a range of additional bushfire relief and recovery services, such as Community Hubs, regional recovery managers and emergency water provision.
This initiative contributes to the Department of Human Services’ Community Health Care output.
Department of Innovation, Industry and Regional DevelopmentBusiness Assistance PackageThis initiative, delivered jointly by DTF and DIIRD, provides for grants of up to $25 000 to farm and non-farm businesses, and the cost of subsidising interest payments on a concessional loan scheme for small business and primary producers. Access to free, independent business advice is also provided, to assist in responding to the impact of the bushfires on their business. This funding represents the operating costs associated with the $51 million package announced by the Government following the February 2009 Bushfires.
This initiative contributes to:
the Department of Innovation, Industry and Regional Development’s Small Business output; and
the Department of Treasury and Finance’s Economic and Financial Policy output.
Improving Information to Regional AreasFunding is provided for temporary expansions to call centres and websites to coordinate the provision of regionally specific information from a number of agencies, including government departments and the Royal Commission.
This initiative contributes to the Department of Innovation, Industry and Regional Development’s Small Business output.
Support for Regional RedevelopmentFunding is provided to support the recovery and redevelopment of regional communities through a range of initiatives. Local councils are being assisted by Regional Development Victoria staff and business recovery officers, an expanded Service Delivery 2009-10 Appendix A 305

Business Victoria call centre and various industry grants to assist businesses with advice and financial assistance.
This initiative contributes to the Department of Innovation, Industry and Regional Development’s Regional Economic Development, Investment and Promotion output.
Tourism Bushfire Recovery PackageThis marketing campaign will support regions and tourism operators in fire affected areas by encouraging increased visitation to Victoria’s high country, Gippsland, Yarra Valley and the Dandenong Ranges. Funding is provided for a cooperative marketing and brand rebuilding program and to re-develop tourism and visitor facility infrastructure in national and state parks.
This initiative contributes to the:
Department of Innovation, Industry and Regional Development’s Tourism output; and
Department of Sustainability and Environment’s Land and Fire Management output.
Department of Justice Coronial Hearings and Victim Identification ServicesFunding is provided to support additional coronial hearings and victim identification functions required following bushfire related deaths.
This initiative contributes to the Department of Justice’s Court Matters and Dispute Resolution; and Supporting the Judicial Process outputs.
Counselling ServicesFunding is provided for a range of financial, grief and trauma counselling services being offered to bushfire survivors and their families, and volunteer and emergency services personnel to assist them in dealing with the effects of the bushfires.
This initiative contributes to the Department of Justice’s Supporting the Judicial Process output.
Country Fire Authority Fleet ReplacementFunding is provided to replace Country Fire Authority infrastructure, including pumper trucks, tankers and operational support vehicles.
This initiative contributes to the Department of Justice’s Emergency Management Capability output.
Country Fire Authority – Funding for Operations Positions Funding is provided to the Country Fire Authority for the creation of an additional 25 positions for operation officers and managers who provide support and leadership to the Country Fire Authority’s volunteer workforce.
306 Appendix A Service Delivery 2009-10

This initiative contributes to the Department of Justice’s Emergency Management Capability output.
Country Fire Authority Ultra Light TankersFunding is provided to procure 42 additional ultra light tankers to enhance the Country Fire Authority’s ability to manage major fires. These tankers will support rapid deployment in difficult terrain and the installation of containment lines to control the spread of fires.
This initiative contributes to the Department of Justice’s Emergency Management Capability output.
Emergency Communications BlackspotsThis initiative will improve radio coverage in metropolitan and regional areas experiencing black spots. This will improve the communications capability of emergency services organisations to respond to incidents in these areas.
This initiative contributes to the Department of Justice’s Emergency Management Capability output.
Expansion of the Victorian Bushfire Information LineFunding is provided to expand the existing Victorian Bushfire Information Line to improve advice for emergency information calls. Two thirds of the funding for this initiative is allocated to the Department of Sustainability and Environment.
This initiative contributes to the Department of Justice’s Emergency Management Capability output.
Police Emergency ServicesFunding is provided to cover the costs of Victorian, Federal and inter jurisdictional police (New South Wales and South Australia) who assisted with a range of emergency fire management activities, including manning road blocks and securing hazardous sites.
This initiative contributes to the Department of Justice’s Policing Services output.
Project 000 ResponseThis initiative will maintain and improve emergency services communications for the public and between emergency services organisations, including the Emergency Services Telecommunications Authority, Victoria State Emergency Service, Country Fire Authority, Department of Sustainability and Environment and Ambulance Victoria.
Funding is provided to the Emergency Services Telecommunications Authority for emergency call taking and dispatch for metropolitan Melbourne and regional Victoria. Funding is also provided for new radios for the Victoria State Emergency Service and new radios and pagers for the Department of Sustainability and Environment’s fire fighters.
This initiative contributes to the:
Department of Justice’s Emergency Management Capability output; and
Service Delivery 2009-10 Appendix A 307
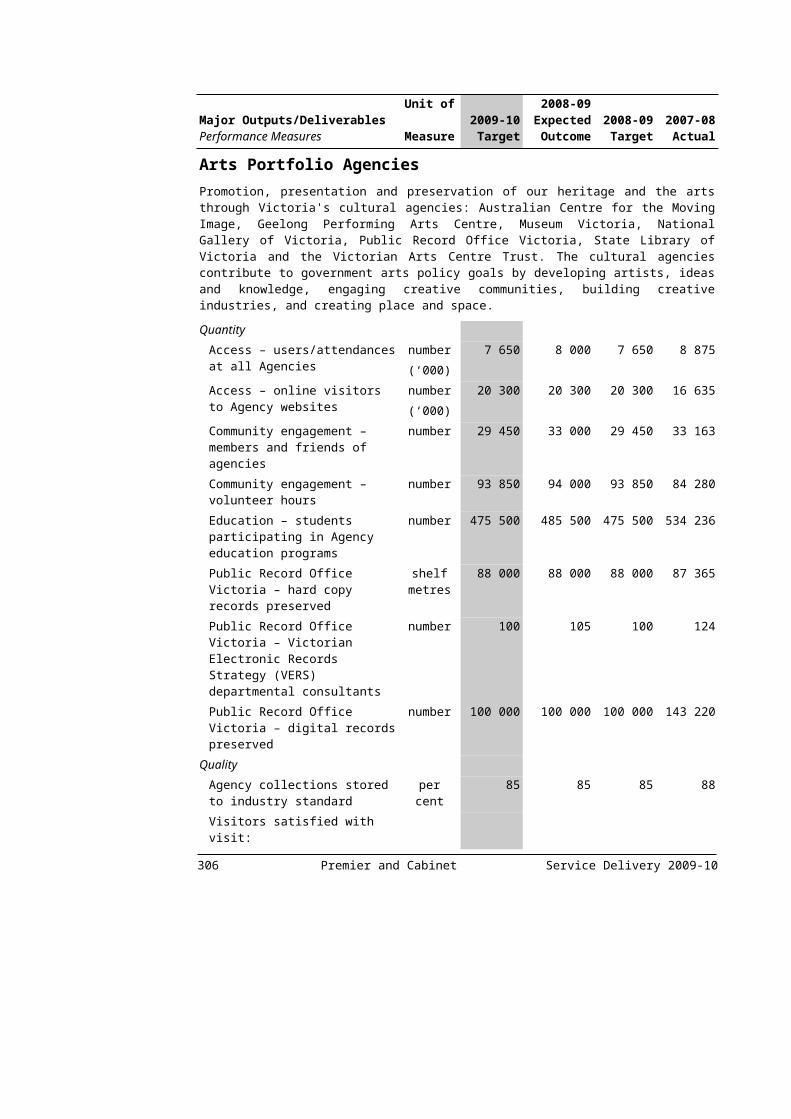
Department of Sustainability and Environment’s Land and Fire Management output.
Victoria State Emergency Service Critical Asset Replacement ProgramThis initiative will replace Victoria State Emergency Services’ infrastructure, such as rescue trucks, boats and trailers, 4WD trucks, road accident kits and computers.
This initiative contributes to the Department of Justice’s Emergency Management Capability output.
Victoria State Emergency Service Volunteer Unit Operating CostsAdditional funding is provided to the Victoria State Emergency Service for operating costs of volunteer units. This will further assist maintaining motor vehicles and emergency response equipment, purchasing office equipment, training and recruitment.
This initiative contributes to the Department of Justice’s Emergency Management Capability output.
Volunteer Recruitment and RecognitionFunding is provided for an initiative to retain and recruit emergency services volunteers and recognise the efforts of volunteer organisations that supported the Government’s response to the 2009 Victorian bushfires.
This initiative contributes to the Department of Justice’s Emergency Management Capability output.
Department of Planning and Community Development Bushfire Building StandardsFunding is provided for communication and training materials to support the implementation of new residential building standards.
This initiative contributes to the Department of Planning and Community Development’s Planning output.
Bushfire Memorial Service Funding is provided to support community development activities, including the coordination and staging of the national day of mourning – Together for Victoria.
This initiative contributes to the:
Department of Planning and Community Development’s Community Development output; and
Department of Premier and Cabinet’s Strategic Policy Advice and Projects output.
Community Building and Neighbourhood Houses Funding is provided to support the work of councils and community organisations through bushfire community recovery officers. Funding will also support the role of neighbourhood houses in assisting with emergency and relief operations.
308 Appendix A Service Delivery 2009-10

This initiative contributes to the Department of Planning and Community Development’s Community Development output.
Grants to VolunteersThe Government is supporting the contribution of volunteer organisations by providing a range of grants that will assist them in meeting significantly increased costs, including training, equipment replacement and volunteer expenses.
This initiative contributes to the Department of Planning and Community Development’s Community Development output.
Department of Premier and CabinetBushfire Memorial ServiceRefer to the Department of Planning and Community Development output initiative for a description.
Clean-Up and Demolition Program The State Government is coordinating a voluntary program to safely remove hazardous debris from damaged or destroyed properties in bushfire affected areas, to protect public safety and provide a first step in the rebuilding process.
This initiative contributes to the Department of Premier and Cabinet’s Strategic Policy Advice and Projects output.
Community Recovery Fund The State and Commonwealth Governments have jointly established a $10 million Community Recovery Fund to fund various recovery activities, including grants to sporting clubs, community events and other community facilities.
This initiative contributes to the Department of Premier and Cabinet’s Strategic Policy Advice and Projects output.
Distribution of Donated GoodsA generous quantity of goods has been donated to bushfire survivors. Funding is provided to ensure that these goods are distributed to those that need it most in an efficient, transparent and equitable way.
This initiative contributes to the Department of Premier and Cabinet’s Strategic Policy Advice and Projects output.
Housing and Temporary VillagesFunding is available to provide housing for those who have lost or needed to leave their homes. Temporary villages are being established in three of the most severely bushfire affected areas. Output and capital funding is being used for the installation of relocation units and caravans on cleared blocks, re-establishment of power and village amenities.
This initiative contributes to the Department of Premier and Cabinet’s Strategic Policy Advice and Projects output.
Service Delivery 2009-10 Appendix A 309
Victorian Bushfire Appeal Fund DonationThe State Government has donated $2 million to the Red Cross Bushfire Appeal Fund, which was matched by the Commonwealth Government.
This initiative contributes to the Department of Premier and Cabinet’s Strategic Policy Advice and Projects output.
Victorian Bushfire Reconstruction and Recovery AuthorityThe Commonwealth and Victorian Governments established the Victorian Bushfire Reconstruction and Recovery Authority to work in partnership with communities to oversee and coordinate the community recovery and rebuilding program in bushfire affected areas.
This initiative contributes to the Department of Premier and Cabinet’s Strategic Policy Advice and Projects output.
Victorian Bushfire Royal CommissionA Royal Commission into Victoria’s February 2009 bushfires has been established by the Government to investigate the causes and responses to the bushfires and to make recommendations on bushfire prevention, response policy and practices. Funding will support three commissioners to provide an interim report to the Government by 17 August 2009 and a final report by 31 July 2010.
Department of Primary IndustriesAnimal Welfare and Emergency FodderFunding is provided to support regional staff to inspect livestock for burns, and assess losses of fodder, water and shelter. In addition, the Department of Primary Industries worked with the Victorian Farmers Federation to collect and distribute fodder to stranded and abandoned livestock.
This initiative contributes to the Department of Primary Industries’ Sustainable Practice Change output.
Bushfire Suppression and RecoveryIn addition to providing personnel and material contributions to the bushfire suppression effort, the Department of Primary Industries has established a recovery program to support primary producers in reestablishing their farms or choosing to relocate.
This initiative contributes to the Department of Primary Industries’ Sustainable Practice Change output.
Soil Conservation ProgramThe Department of Primary Industries is investigating the impact of heat on soil composition and fertility. Stock containment yards have been constructed to minimise the impact of livestock on burnt and exposed ground.
This initiative contributes to the Department of Primary Industries’ Sustainable Practice Change output.
310 Appendix A Service Delivery 2009-10

Support for Replacement of Fences by VolunteersFinancial assistance was provided to the Victorian Farmers Federation to support their efforts in coordinating volunteers to repair or replace fences damaged or destroyed in the bushfires.
This initiative contributes to the Department of Primary Industries’ Sustainable Practice Change output.
Department of Sustainability and EnvironmentBushfire Emergency Stabilisation WorksThe Department of Sustainability and Environment is implementing a range of remedial works to stabilise waterways, treat exposed contamination sites and address sedimentary issues.
This initiative contributes to the Department of Sustainability and Environment’s Land and Fire Management output.
Bushfire Impact ResearchThe Government is funding research into fire behaviour, the impact on catchments and buildings, and the development of future policies and Australian rapid assessment teams.
This initiative contributes to the Department of Sustainability and Environment’s Land and Fire Management output.
Bushfire PreparednessFunding is provided for additional fire management resources to boost prevention and suppression capacity to meet future bushfire challenges.
This initiative contributes to the Department of Sustainability and Environment’s Land and Fire Management output.
Fire SuppressionCombating the February 2009 bushfires required a fire-fighting and containment effort of unprecedented scale. The state-wide operation was coordinated by the Department of Sustainability and Environment, with assistance from other agencies, including the Country Fire Authority, Victoria State Emergency Service, Metropolitan Fire Brigade and inter-jurisdictional organisations. Funding is provided for various fire suppression activities, including aerial measures and containment line restoration.
This initiative contributes to the Department of Sustainability and Environment’s Land and Fire Management output.
Project 000 ResponseRefer to the output initiative under the Department of Justice for a description of this initiative.
Service Delivery 2009-10 Appendix A 311

Department of TransportPublic Transport ServicesFunding is provided for the replacement of burnt bus stops and signalling on the Wandong, Warrnambool and Belgrave lines, and replacement buses to ensure the maintenance of services.
This initiative contributes to the Department of Transport’s Rural and Regional Transport Services; and Integrated Metropolitan Public Transport Services outputs.
Road Repairs and ServicesFunding is provided for repairs to road surfaces, the replacement of line markings, guard rails and signs and removing debris such as fallen trees.
This initiative contributes to the Department of Transport’s Asset Management output.
Department of Treasury and FinanceBushfire Funeral ExpensesThe State Government is contributing funding for funeral expenses to ensure that all those who perished in the bushfire can be given an appropriate burial.
This initiative contributes to the Department of Treasury and Finance’s Economic and Financial Policy output.
Business Assistance PackageRefer to the output initiative under the Department of Innovation, Industry and Regional Development for a description of this initiative.
Natural Disaster Relief ArrangementsIn order to support local councils to recover and rebuild communities affected by the bushfires, the Government has provided funding that will be used to meet eligible costs, including the establishment of Municipal Emergency Coordination Centres, Relief Centres and repair and restoration of council infrastructure.
This initiative contributes to the Department of Treasury and Finance’s Economic and Financial Policy output.
VicForests Salvage HarvestingFunding is being provided to VicForests to commence salvage operations in the burnt and damaged central highlands forest estate. Works include assessing the damage, salvaging stock and replanting.
This initiative contributes to the Department of Treasury and Finance’s Land and Infrastructure Investment Management output.
312 Appendix A Service Delivery 2009-10

Assisted Reproductive TreatmentThis initiative implements the Assisted Reproductive Treatment Act 2008. Funding is provided to ensure Victoria’s assisted reproductive treatment (ART) laws are consistent with Commonwealth discrimination law and reflect new advances in ART technology. The initiative will also improve the efficiency of ART regulation and promote the interests of children born through ART in Victoria.
This initiative contributes to:
The Department of Human Services’ Acute Health Services output; and
The Department of Justice’s Protecting Community Rights output.
Autism State PlanAction for Children with an Autism Spectrum DisorderThis funding is to improve regional coordination and support teachers to complete postgraduate study in Autism. It will also strengthen ASD expertise of practitioners working with young children.
This initiative contributes to the Department of Education and Early Childhood Development's Early Years (schools); Middle Years (schools); Later Years and Youth Transitions; and Early Childhood Intervention Services.
Mental Health Service EnhancementThis funding is to increase the number of children and young people with complex presentations of autism spectrum disorder (ASD) being assessed, diagnosed and, where appropriate, treated. The enhanced service will provide increased clinical capacity; improved coordination and strengthen the ASD expertise in the workforce.
This initiative contributes to the Department of Human Services’ Mental Health output.
Channel Deepening Support Package Funding is provided for a range of initiatives to assist businesses develop appropriate strategies to adapt to changes as a result of the Channel Deepening Project, as well as additional initiatives designed to improve the accessibility, amenity, environmental and recreational values of the Port Phillip Bay and its beaches.
Facilities Improvement Program Funding is provided to improve facilities used by small business operators and recreational anglers in the Port Phillip and Westernport bays.
This initiative contributes to the Department of Transport’s Freight, Logistics, Ports and Marine Development output.
Service Delivery 2009-10 Appendix A 313
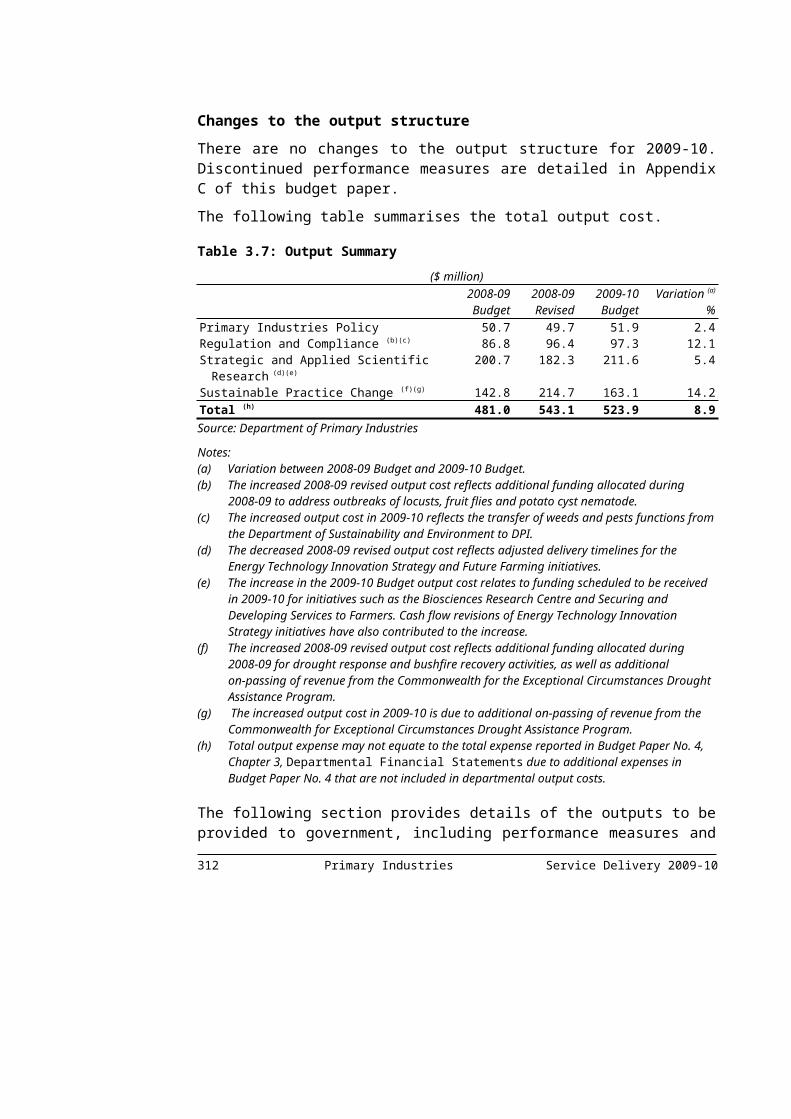
Grants for Business Support Funding is provided for financial support for companies who face temporary additional adjustment and operating costs as a result of the Channel Deepening Project.
This initiative contributes to the Department of Innovation, Industry and Regional Development’s Small Business output.
Mordialloc Structure Plan Funding is provided to contribute to the preparation of the Mordialloc Structure Plan, which will develop a concept plan for new works and improvements to existing infrastructure in the vicinity of the Mordialloc Pier and the Mordialloc Creek.
This initiative contributes to the Department of Sustainability and Environment’s Public Land output.
Multi-Stage Tourism Marketing CampaignFunding is provided to build on the public relations and marketing campaign to provide a full tourism marketing strategy for the Port Phillip Bay area.
This initiative contributes to the Department of Innovation, Industry and Regional Development’s Tourism output.
Small Business Education Funding is provided for business consultancy and advisory services to assist businesses develop appropriate strategies to adapt to temporary changes as a result of the Channel Deepening Project.
This initiative contributes to the Department of Innovation, Industry and Regional Development’s Small Business output.
Creating Liveable Neighbourhoods and CommunitiesFunding is provided to enable the gains made to date in Victoria’s place based renewal programs to be consolidated, and to implement appropriate exit arrangements to achieve sustainability of these gains beyond the formal investment period. Funding will extend eight community renewal sites to six years duration ($8.9 million over four years) as well as extending 19 existing neighbourhood renewal sites for up to a further two years ($13 million over two years). Two new neighbourhood renewal sites will also be established with funding for four years duration ($4.1 million over four years).
This initiative contributes to:
The Department of Human Services’ Long Term Housing Assistance output; and
The Department of Planning and Community Development’s Community Development output.
314 Appendix A Service Delivery 2009-10
Drought ResponseFunding is provided for a range of initiatives designed to provide further assistance to Victorian farmers, rural communities and businesses in drought affected regions.
Catchment Management Authority Drought Employment Program Funding is provided to employ people directly affected by the drought, to undertake works to protect and sustain important environment infrastructure on public or private land.
This initiative contributes to the Department of Sustainability and Environment’s Natural Resources output.
Community Drought Communications Funding is provided to inform farmers, individuals and communities about available drought assistance and to facilitate access to programs and services. The initiative will also promote the ways in which affected communities are successfully dealing with drought related problems.
This initiative contributes to the Department of Primary Industries’ Sustainable Practice Change output.
Drought Apprenticeship Retention Bonus III Funding is provided to continue grants of $1 500 for each apprentice to businesses in Exceptional Circumstances declared areas that directly provide services to the farming industry. This program supports rural towns and communities by helping businesses retain rural apprentices.
This initiative contributes to the Department of Primary Industries’ Sustainable Practice Change output.
Drought Extension Support Funding is provided for additional advice and tools to assist farm businesses and rural communities to make informed decisions about the future. The initiative will also provide additional coordination and support to assist farmers and communities manage the changing environment.
This initiative contributes to the Department of Primary Industries’ Sustainable Practice Change output.
Drought Health Services and Community Support Funding has been provided to build on the health service system and workforce developments achieved by the 2006-07 and 2007-08 drought programs by integrating good practice into the mainstream service system and developing a more sustainable response to the needs of communities affected by drought and rural change.
Service Delivery 2009-10 Appendix A 315

Emergency relief assistance in the form of food relief, Christmas hampers and toys will be provided to support families at Christmas time and assistance with back to school costs will be provided at the commencement of the new school year.
This initiative contributes to the Department of Human Services’ Community Health Care output.
Drought Response for Community Sport and Recreation Program 2009 Funding is provided to help communities maintain local sports grounds and other sport and recreation facilities through developing sustainable approaches to water management.
This initiative contributes to the Department of Planning and Community Development’s Sport and Recreation Development output.
Extending the Case Management Approach to Supporting Farmers through Drought and Adjustment Funding is provided to extend case management services to support farmers as they adjust to drought and plan for the future. This includes assistance to those from culturally and linguistically diverse backgrounds to access adjustment and drought support services.
This initiative contributes to the Department of Primary Industries’ Sustainable Practice Change output.
Increased Demand for Exceptional Circumstances Drought AssistanceFunding is allocated to continue drought assistance in the form of interest rate subsidies for farmers and small businesses in Exceptional Circumstances declared areas.
This initiative contributes to the Department of Primary Industries’ Sustainable Practice Change output.
Municipal Rates Subsidy Funding is provided for a subsidy of up to 50 per cent on municipal rates and charges payable by eligible farmers who are assessed to be in Exceptional Circumstances and who receive Emergency Payments or Exceptional Circumstances Relief Payments from Centrelink.
This initiative contributes to the Department of Primary Industries’ Sustainable Practice Change output.
On-Farm Productivity Improvement Grants Funding is provided to extend the 2007-08 program to assist farmers in regions most affected by drought to introduce on-farm infrastructure improvements that enhance drought proofing and increase productivity.
This initiative contributes to the Department of Primary Industries’ Sustainable Practice Change output.
316 Appendix A Service Delivery 2009-10
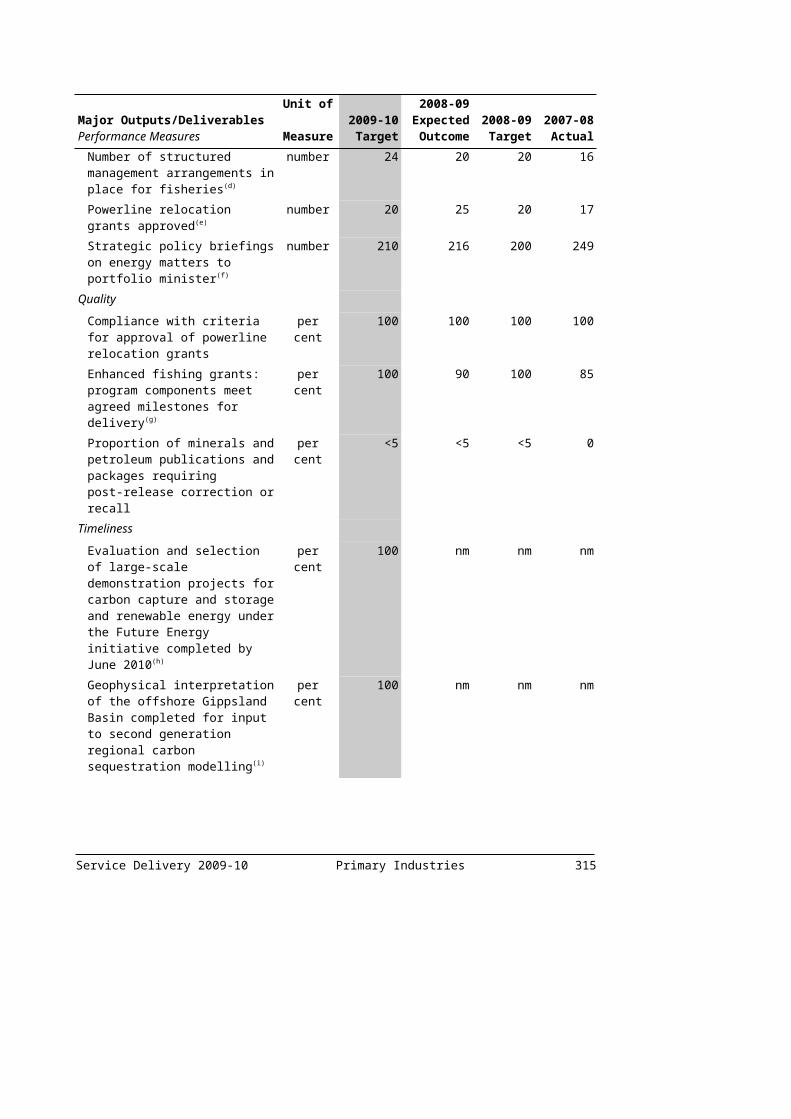
Regional Infrastructure Development Fund – Small Towns Development Fund Funding is provided to invest in infrastructure and to boost jobs in small regional towns affected by drought.
This initiative contributes to the Department of Innovation, Industry and Regional Development’s Regional Infrastructure Development output.
Regionally Significant Synthetic Surfaces Program Funding is provided for councils and sports clubs for several drought proof playing and training surfaces to be placed throughout Victoria to allow sporting competitions to continue regardless of the availability of water.
This initiative contributes to the Department of Planning and Community Development’s Sport and Recreation Development output.
Water Rate Rebates for Irrigators Funding has been provided by the Government to offset the first $1 000 of the fixed charge component of water bills for all irrigators and stock and domestic farmers who are receiving less than 30 per cent of their water entitlements as of 1 December 2008. In addition, those irrigators whose water bill is more than $1 000 will receive an additional 50 per cent rebate on the balance of their bills.
This initiative contributes to the Department of Sustainability and Environment’s Sustainable Water Management and Supply output.
Enhancing Disability Services and OutcomesFunding is provided to improve services and outcomes for people with a disability and their families. Disability programs will be enhanced with a focus on early intervention to build and sustain lifelong capabilities for more independent living. Work will continue to increase the cohesiveness of the disability support system throughout the lifecycle with integrated assessment and planning approaches across programs at central and regional levels. Support for the non-government sector in implementing reform through organisational and sector change and capacity building will also be provided.
This initiative contributes to:
The Department of Human Services’ Disability Services output; and
The Department of Education and Early Childhood Development's Early Childhood Intervention Services output.
Mental Health Reform StrategyFunding is provided to continue the implementation of Because Mental Health Matters: Victorian Mental Health Reform Strategy 2009-2019. The strategy provides an effective and coordinated health and social care approach that will enable people with mental health problems to live independently, through a strong focus on early intervention – in life, illness and episode.
Service Delivery 2009-10 Appendix A 317
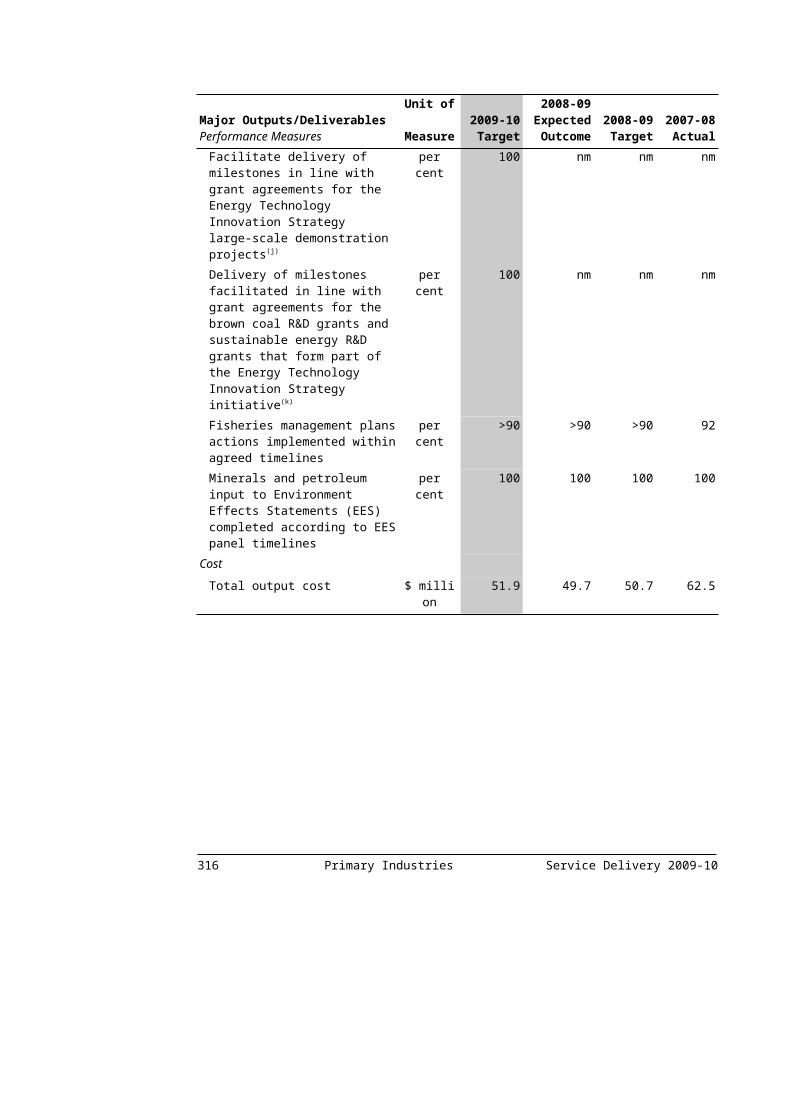
The reform measures in this next stage focus on early intervention and treatment for children and young people, including psychiatric triage, coordination of care for people with multiple needs, supported housing, court support services pilot, the mental health of Aboriginal people and the specialist mental health workforce.
This initiative contributes to:
The Department of Human Services’ Mental Health output; and
The Department of Justice’s Court Matters and Dispute Resolution output.
National Partnership on Indigenous Early Childhood DevelopmentThis initiative addresses the high levels of disadvantage experienced by Indigenous children in Victoria and provides funding for two Children and Family Centres, additional maternal and child health services, antenatal care services for Indigenous women under 20 and teenage reproductive and sexual health programs. The initiative is part of the Council of Australian Governments’ five year National Partnership on Indigenous Early Childhood Development.
This initiative contributes to:
The Department of Human Services’ Non-Admitted Services and Health Protection outputs; and
This initiative contributes to the Department of Education and Early Childhood Development’s Child Health and Support Services and Early Childhood Education and Care outputs.
Victorian Alcohol Action PlanFunding is provided to reduce alcohol-related harm to individuals, families and the community, through enhancing the Victorian Alcohol Action Plan which consists of law enforcement and health measures targeting awareness, prevention, treatment, enforcement and safety.
Accelerated Implementation of the Compliance Directorate Funding is provided to accelerate the compliance directorate component of the Victorian Alcohol Action Plan, enabling enforcement operations to commence in 2009, 12 months ahead of the original schedule.
This initiative contributes to the Department of Justice’s Promoting and Protecting Consumer Interests output.
Alcohol and Violence Campaign Funding has been provided to increase awareness of the link between alcohol and violence and promote personal responsibility for choices made under the influence of alcohol.
This initiative contributes to the Department of Human Services’ Drug Prevention and Control Output.318 Appendix A Service Delivery 2009-10

Victorian Innovation StrategyFunding is provided for a range of initiatives to enhance and build Victoria’s innovation capabilities to support the ageing population and associated health needs, respond to the climate change challenge, and ensure ongoing capacity for long-term growth and to compete internationally.
Biotechnology Strategic Development Plan Funding is provided to stimulate further growth in the Victorian biotechnology sector. These grants will be used to support the establishment of strategic international alliances, to create a better regulatory environment for product development within the industry, and to invest in infrastructure and skills to boost transformative capacity.
This initiative contributes to the Department of Innovation, Industry and Regional Development’s Science and Technology output.
Boosting Highly Innovative Small and Medium Enterprises Funding is provided for a new grants program to facilitate the development of solutions to the particular challenges faced by small and medium enterprises (SMEs) in the Victorian technology and manufacturing sectors during their establishment and development. The program consists of a number of interrelated actions that will assist innovative SMEs to access research and development skills and services, optimise linkages between industry and innovative Victorian SMEs, and stimulate and encourage research and development and technology product development amongst Victoria’s SMEs.
This initiative contributes to the Department of Innovation, Industry and Regional Development’s Innovation output.
Information and Communication Technology Capability Funding is provided for two programs to enhance Victoria’s information and communication technology capabilities. The Collaborative Internet Innovation Fund will support leading innovators using new technology to develop new ways of working. The VicFibreLINKS initiative will facilitate co-investment with the telecommunications industry to roll out high quality, affordable broadband infrastructure across the State.
This initiative contributes to the Department of Innovation, Industry and Regional Development’s Innovation output.
Victoria’s Science Agenda Investment Fund Funding is provided for a new grants program to strengthen Victoria’s research precincts through co-investment in research and development infrastructure and platforms, research partnerships and skills. Building on the success of the Government’s previous science, technology and innovation initiatives, the new program will focus on supporting research in priority areas, including climate change, energy and health.
This initiative contributes to the Department of Innovation, Industry and Regional Development’s Science and Technology output.
Service Delivery 2009-10 Appendix A 319
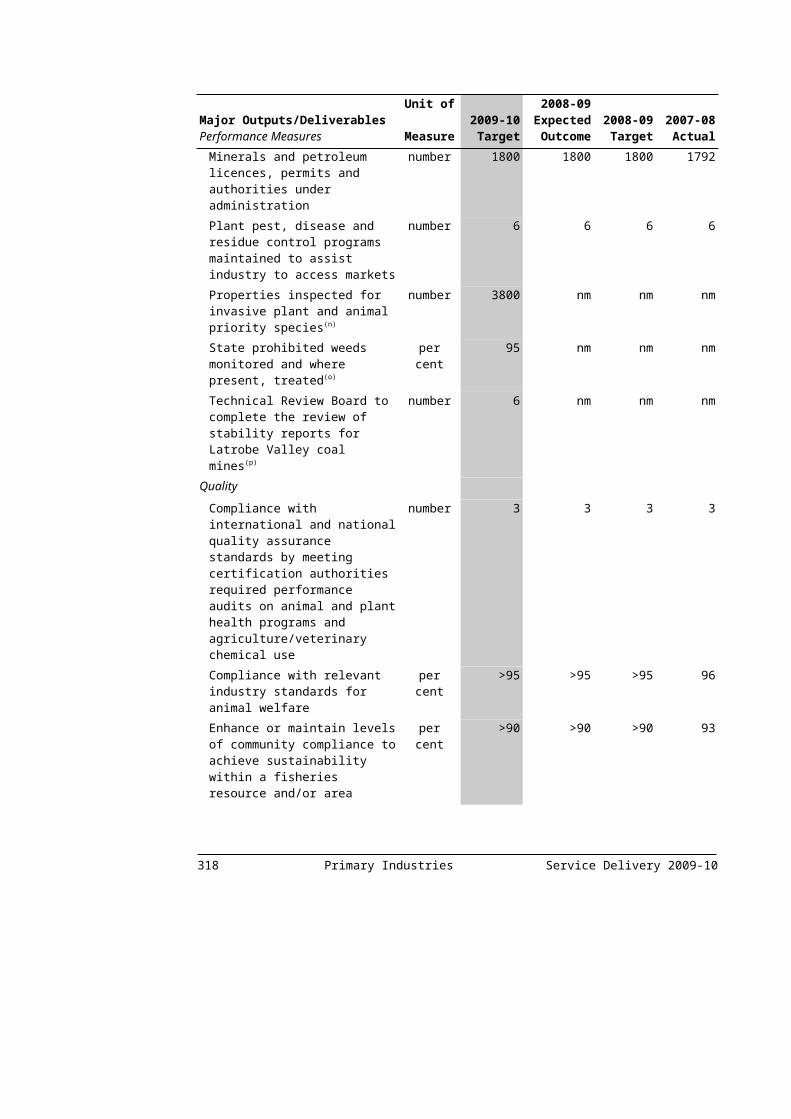
Victorian Advanced Resource Recovery Initiative Funding is provided to explore the provision of new waste recovery technology for metropolitan Melbourne. The establishment of new high-tech waste facilities for processing organic waste will reduce greenhouse emissions produced by landfill.
This initiative contributes to the Department of Sustainability and Environment’s Environmental Policy and Climate Change output.
Other Government-wide initiativesMajor Events Funding is provided to expand the Government’s support of major sporting and cultural events in Victoria.
This initiative contributes to the Department of Innovation, Industry and Regional Development’s Tourism output.
Securing Jobs for Your Future – Skills for Victoria Funding is provided under Securing Jobs for Your Future to create over 170 000 new training places and deliver more flexibility for individuals, employers and training providers.
This initiative contributes to:
the Department of Innovation, Industry and Regional Development’s Skills output;
the Department of Education and Early Childhood Development’s Policy and Regulation output; and
the Department of Planning and Community Development’s Adult Community Education output.
Asset initiatives
Table A.2: Asset initiatives – Government-wide($ million)
2008-09 2009-10 2010-11 2011-12 2012-13 TEI2009 Victorian Bushfire Response and RecoveryDepartment of JusticeCountry Fire Authority Fleet
Replacement.. 17.5 .. .. .. 17.5
Country Fire Authority Ultra Light Tankers
.. 5.3 .. .. .. 5.3
Emergency Communications Blackspots
.. 1.3 .. .. .. 1.3
Project 000 Response .. 7.7 6.7 .. .. 14.4Victoria State Emergency
Service Critical Asset Replacement Program
.. 6.6 .. .. .. 6.6
Department of Premier and CabinetHousing and Temporary Villages 2.8 .. .. .. .. 2.8
320 Appendix A Service Delivery 2009-10

Table A.2: Asset initiatives – Government-wide (continued)($ million)
2008-09 2009-10 2010-11 2011-12 2012-13 TEIDepartment of Sustainability and EnvironmentProject 000 Response .. 3.0 15.0 12.5 .. 30.5Channel Deepening Support Package (a)
Beach Renourishment and Coastal Risk Mitigation
1.0 1.0 1.0 1.0 .. 4.0
Securing Jobs for Your Future – Skills for Victoria (a)
3.2 5.0 8.3 8.3 .. 24.8
Total asset initiatives 7.0 47.3 31.0 21.8 .. 107.1Source: Department of Treasury and Finance.
Numbers have been rounded to the nearest $100 000 for presentation purposes.Note:(a) These initiatives were previously reported in the 2008-09 Budget Update.
2009 Victorian Bushfire Response and Recovery
Department of JusticeCountry Fire Authority Fleet ReplacementRefer to the output initiative for a description of this initiative.
Country Fire Authority Ultra Light TankersRefer to the output initiative for a description of this initiative.
Emergency Communications BlackspotsRefer to the output initiative for a description of this initiative.
Project 000 ResponseRefer to the output initiative for a description of this initiative.
Victoria State Emergency Service Critical Asset Replacement ProgramRefer to the output initiative for a description of this initiative.
Department of Premier and CabinetHousing and Temporary VillagesRefer to the output initiative for a description of this initiative.
Department of Sustainability and EnvironmentProject 000 ResponseRefer to the output initiative for a description of this initiative.
Channel Deepening Support Package Refer to the output initiative for a description of this initiative.
Service Delivery 2009-10 Appendix A 321
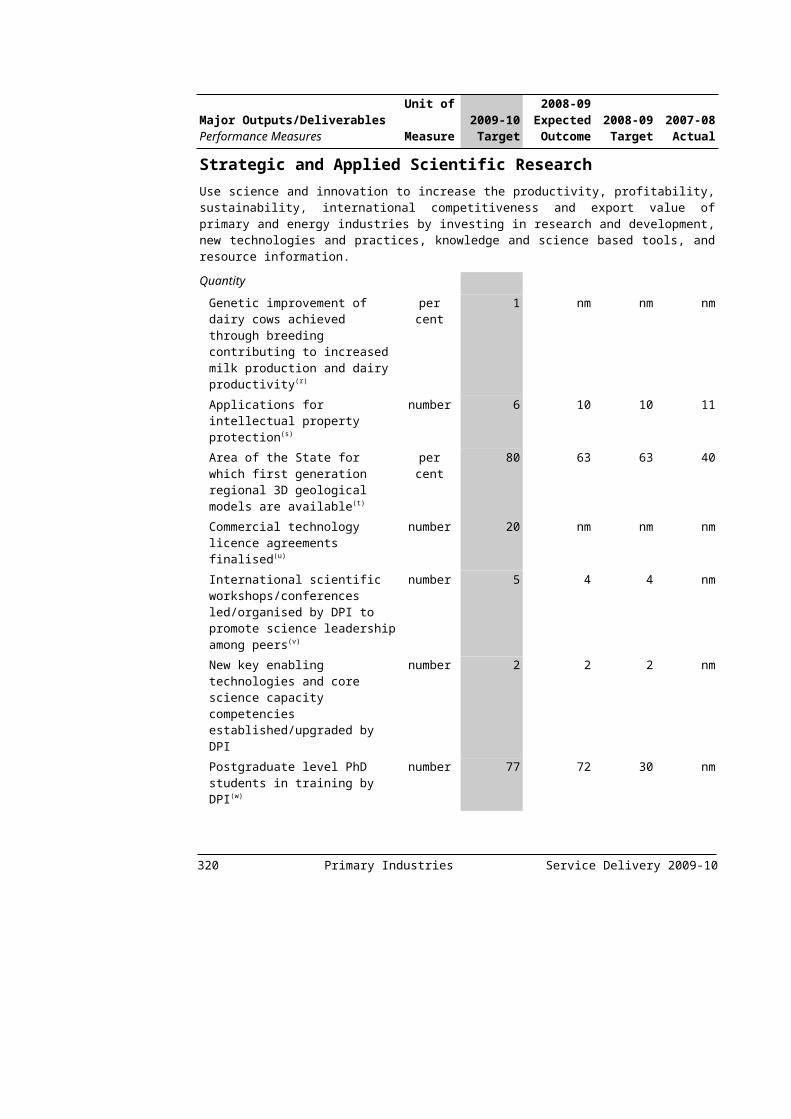
Beach Renourishment and Coastal Risk Mitigation Funding will be provided to escalate works to protect coastal infrastructure and address the loss of sand at beaches around the Port Phillip Bay, including Portarlington and North Aspendale.
This initiative contributes to the Department of Sustainability and Environment’s Public Land output.
Other Government-wide initiativesSecuring Jobs for Your Future – Skills for Victoria Funding is provided to improve TAFE communication infrastructure, including improving access to information and TAFE broadband in key regions of Victoria.
DEPARTMENTAL INITIATIVES
Education and Early Childhood Development
Output initiatives
Table A.3: Output initiatives – Education and Early Childhood Development ($ million)
2008-09 2009-10 2010-11 2011-12 2012-13Community Engagement Project .. 2.5 .. .. ..Increase Access to Computers .. 7.0 .. .. ..Meeting Increased Demand for
Kindergarten Enrolments 8.0 5.7 .. .. ..
National Partnership on Early Childhood Education (a)
7.4 15.3 19.3 59.1 109.5
National Partnership on Improving Teacher Quality (a)
1.6 3.4 8.7 10.3 ..
National Partnership on Literacy and Numeracy (a)
12.5 14.3 .. .. ..
National Partnership on Low Socio-Economic Status School Communities (a)(b)
2.1 27.9 37.6 68.8 66.7
National Secondary School Computer Fund (a)(c)
83.5 196.1 86.6 74.7 67.2
Non-Government Schools Capital Grants (d) 33.6 19.9 .. .. ..Targeted Investment to Achieve National
Partnership Objectives.. 13.6 7.8 10.0 6.5
Teaching and Learning and Ultranet Coaches
.. 13.9 29.0 14.7 ..
Vocational Education and Training in Schools
.. 7.5 7.7 .. ..
Building the Education Revolution (e)
Government Schools: National School Pride Program
62.8 146.6 .. .. ..
Sub-total output initiatives 211.5 473.8 196.8 237.7 249.9
322 Appendix A Service Delivery 2009-10

Table A.3: Output initiatives – Education and Early Childhood Development (continued)
($ million) 2008-09 2009-10 2010-11 2011-12 2012-13Government-wide initiatives 5.8 10.1 7.0 6.2 3.3EfficienciesGeneral efficiencies .. - 9.5 - 28.7 - 62.6 - 63.7Drought Savings - 10.0 .. .. .. ..Total output initiatives 207.3 474.4 175.1 181.2 189.6Source: Department of Treasury and Finance.
Numbers have been rounded to the nearest $100 000 for presentation purposes.Notes:(a) These initiatives are funded by the Commonwealth.(b) Commonwealth funding of $40.9 million in 2013-14 and $31.2 million in 2014-15 is also anticipated.(c) This initiative includes State funding that was previously announced in the 2008-09 Budget Update
under the title of Digital Education Revolution.(d) This initiative was previously announced in the 2008-09 Budget Update.(e) Building the Education Revolution initiatives reflect funding provided by the Commonwealth.
Community Engagement ProjectFunding is provided to develop local and state-wide information for families and communities on 21st century approaches to learning and teaching, including changes to school configurations, new forms of curriculum, and the role of technology in the classroom.
This initiative contributes to the Department of Education and Early Childhood Development’s Early Years (schools), Middle Years (schools) and Later Years and Youth Transitions outputs.
Increase Access to ComputersThis initiative will enable up to 7 000 new or replacement computers to be purchased by government schools.
This initiative contributes to the Department of Education and Early Childhood Development’s Early Years (schools), Middle Years (schools) and Later Years and Youth Transitions outputs.
Meeting Increased Demand for Kindergarten EnrolmentsThis initiative provides funding for additional kindergarten places in 2009 to meet increased demand following the recent growth in the birth rate.
This initiative contributes to the Department of Education and Early Childhood Development’s Early Childhood Education and Care output.
Service Delivery 2009-10 Appendix A 323

National Partnership on Early Childhood EducationFunding is provided to assist Victoria to work towards the Council of Australian Governments’ target of access to 15 hours of early childhood education per week for all children in the year before school by 2013.
This initiative contributes to the Department of Education and Early Childhood Development’s Early Childhood Education and Care output.
National Partnership on Improving Teacher QualityFunding is provided for a range of systematic reforms to improve the quality of teaching and leadership in Victorian schools, improve educational outcomes and reduce educational inequities, as part of the Council of Australian Governments’ National Partnership Agreement on Improving Teacher Quality.
This initiative contributes to the Department of Education and Early Childhood Development’s Early Years (schools), Middle Years (schools), and Later Years and Youth Transitions outputs.
National Partnership on Literacy and NumeracyFunding is provided for a range of initiatives designed to improve Literacy and Numeracy outcomes for Victorian school students as part of the Council of Australian Governments’ National Partnership Agreement on Literacy and Numeracy.
This initiative contributes to the Department of Education and Early Childhood Development’s Early Years (schools), Middle Years (schools), and Later Years and Youth Transitions outputs.
National Partnership on Low Socio-Economic Status School CommunitiesThis initiative supports a suite of school and community reforms designed to provide high quality teaching for participating schools, increase flexibility for principals, strengthen school accountability, and improve partnerships between schools and the community, as part of the Council of Australian Governments’ National Partnership Agreement on Low Socio-Economic Status School Communities.
This initiative contributes to the Department of Education and Early Childhood Development’s Early Years (schools), Middle Years (schools), and Later Years and Youth Transitions outputs.
National Secondary School Computer FundFunding is provided to government and non-government schools for the purchase and deployment of computers under the Commonwealth Government’s National Secondary School Computer Fund, part of the Digital Education Revolution election commitment. Additional funding to help government schools meet the operating costs associated with computers purchased in the first round of funding was provided in the 2008-09 Budget Update.
This initiative contributes to the Department of Education and Early Childhood Development’s Middle Years (schools), and Later Years and Youth Transitions outputs.
324 Appendix A Service Delivery 2009-10

Non-Government Schools Capital GrantsFunding is provided for capital grants to non-government schools in need. Funding will be available for planning and upgrading or replacement of education facilities to assist in improving student outcomes at these schools.
This initiative contributes to the Department of Education and Early Childhood Development’s Early Years (schools), Middle Years (schools), and Later Years and Youth Transitions outputs.
Targeted Investment to Achieve National Partnership ObjectivesThis initiative provides for additional early investment by Victoria in targeted reforms that will support the implementation of National Partnership goals. The funding is to ensure Victoria achieves Council of Australian Governments’ targets across a range of key education areas such as teacher quality and literacy and numeracy.
This initiative contributes to the Department of Education and Early Childhood Development’s Early Years (schools), Middle Years (schools), and Later Years and Youth Transitions outputs.
Teaching and Learning and Ultranet CoachesFunding is provided to continue to employ 200 teaching and learning coaches, who work with teachers in selected schools to build their capacity to improve student learning outcomes, particularly in maths and science. Funding is also provided to continue 50 Ultranet coaches to work with schools to build teachers ICT capacity and assist in the implementation of the Ultranet.
This initiative contributes to the Department of Education and Early Childhood Development’s Early Years (schools), Middle Years (schools), and Later Years and Youth Transitions outputs.
Vocational Education and Training in SchoolsFunding is provided to increase the number of young Victorians completing Year 12 or its equivalent by improving access for government school students to nationally accredited vocational subjects as part of their VCE and Victorian Certificate of Applied Learning programs. This funding will ensure students have greater access to Vocational Education and Training in Schools subjects.
This initiative contributes to the Department of Education and Early Childhood Development’s Later Years and Youth Transitions output.
Building the Education RevolutionGovernment Schools: National School Pride ProgramFunding is provided as part of the Commonwealth Government’s $42 billion Nation Building – Economic Stimulus Plan. The Commonwealth Government funding that forms part of the Nation Building – Economic Stimulus Plan will be used collaboratively with the State Government Victorian Schools Plan funding to ensure that the opportunities provided to schools are maximised. These investments recognise
Service Delivery 2009-10 Appendix A 325
that high quality school infrastructure is critical to delivering excellent educational outcomes and demonstrates the commitment of the Commonwealth and State governments in working together to ensure immediate construction activity to stimulate the economy and create jobs. The funding will enable Government schools to undertake construction of small scale infrastructure and/or minor refurbishment projects.
This initiative contributes to the Department of Education and Early Childhood Development’s Early Years (schools), Middle Years (schools), and Later Years and Youth Transitions outputs.
Asset initiativesTable A.4: Asset initiatives – Education and Early Childhood Development
($ million) 2008-09 2009-10 2010-11 2011-12 2012-13 TEIVictorian Schools PlanBetter Schools Today Program .. 7.6 .. .. .. 7.6Land Acquisition .. 31.0 .. .. .. 31.0Maths and Science Specialist
Centres.. 3.0 9.0 .. .. 12.0
Modernisation (a) 5.5 49.3 71.2 2.1 .. 128.0New Schools in Growth Areas .. 6.4 18.7 .. .. 25.1Regeneration .. 29.8 62.3 .. .. 92.1Relocatable Classroom Renewal .. 5.7 13.3 .. .. 19.0Replacement Schools (b) .. 27.7 18.4 1.2 .. 47.3Secure the Future of Small
Rural Schools.. 10.7 5.4 .. .. 16.0
Select Entry Schools .. 11.0 13.0 .. .. 24.0Building the Education Revolution (c)
Government Schools: Primary Schools for the 21st Century
97.6 1 074.3 848.0 .. .. 2 019.9
Government Schools: Science and Language Centres (d)
.. 140.6 .. .. .. 140.6
New School – Epping Views Primary School (e)
1.4 .. .. .. .. 1.4
Trade Training Centres – Government Schools (d)
68.8 77.6 .. .. .. 146.4
Victorian Institute of Educational Leadership (f)
1.5 8.3 .. .. .. 9.8
Sub-total asset initiatives 174.8 1 482.9 1 059.2 3.3 .. 2 720.2Government-wide initiatives .. .. .. .. .. ..Total asset initiatives 174.8 1 482.9 1 059.2 3.3 .. 2 720.2Source: Department of Treasury and FinanceNumbers have been rounded to the nearest $100 000 for presentation purposes.Notes:(a) This initiative includes funding of $5.3 million for modernisation projects announced in the 2008-09
Budget Update.(b) Includes $28 million of funding for replacement schools announced in the 2008-09 Budget Update.(c) Building the Education Revolution initiatives reflects funding provided by the Commonwealth.(d) Funding is based on an estimate of the possible Victorian share of Commonwealth funding, the
actual share may vary and is yet to be determined.(e) This school is a pre-Victorian Schools Plan commitment. (f) This initiative was previously announced in the 2008-09 Budget Update.326 Appendix A Service Delivery 2009-10
Victorian Schools PlanBetter Schools Today ProgramFunding is provided to the Better Schools Today program which funds renovations to modernise or upgrade schools.
This initiative contributes to the Department of Education and Early Childhood Development’s Early Years (schools); Middle Years (schools); and Later Years and Youth Transitions output.
Land AcquisitionFunding is provided to acquire land for building new and replacement schools. This will enable the provision of additional government schools in Melbourne’s growth corridors in the future.
This initiative contributes to the Department of Education and Early Childhood Development’s Early Years (schools); Middle Years (schools); and Later Years and Youth Transitions outputs.
Maths and Science Specialist CentresFunding is provided for three Maths and Science Specialist Centres. These facilities will broaden options by providing high level science opportunities as well as providing a centre of excellence for other local students and teachers to access specialised facilities and expertise.
This initiative contributes to the Department of Education and Early Childhood Development’s Middle Years (schools); and Later Years and Youth Transitions outputs.
ModernisationFunding is provided to modernise schools and will improve educational outcomes through the provision of contemporary classrooms and technology, including priority upgrades of science rooms and technical wings. The funding includes announcements made in the 2008-09 Budget Update. The modernisations will reduce both maintenance costs and energy consumption through improved building techniques.
This initiative contributes to the Department of Education and Early Childhood Development’s Early Years (schools); Middle Years (schools); and Later Years and Youth Transitions outputs.
New Schools in Growth AreasFunding is provided to start construction at Timbarra 7-9 and for continued work on three schools: Mount Ridley P-12 College (Stage 3); Point Cook Secondary College (Stage 3); and Manor Lakes P-12 Specialist College (Stage 3).
This initiative contributes to the Department of Education and Early Childhood Development’s Early Years (schools); Middle Years (schools); and Later Years and Youth Transitions outputs.
Service Delivery 2009-10 Appendix A 327

RegenerationFunding is provided for major precinct developments through the continuation of regeneration of facilities and education projects at: Altona/Bayside; Bendigo; Broadmeadows; Wodonga; Wangaratta; and new regeneration projects at: Heidelberg; Keysborough – Springvale; and Maroondah.
This initiative contributes to the Department of Education and Early Childhood Development’s Early Years (schools); Middle Years (schools); and Later Years and Youth Transitions outputs.
Relocatable Classroom RenewalFunding is provided to build new relocatable classrooms. Relocatable classrooms help the Victorian school system cope with fluctuations in student numbers during capital works and emergencies, such as fires. New relocatable classrooms will be environmentally friendly and energy efficient, as well as providing flexible solutions to the changing accommodation needs of schools.
This initiative contributes to the Department of Education and Early Childhood Development’s Early Years (schools); Middle Years (schools); and Later Years and Youth Transitions outputs.
Replacement SchoolsFunding is provided for priority projects including a replacement school at Glenroy Specialist School. As announced in the 2008-09 Budget Update, funding is also provided under the replacement schools program for the construction of a replacement school for Western Autistic School, and to meet costs associated with the relocation of the Albert Park childcare facility, site remediation and construction of the new Albert Park secondary college.
This initiative contributes to the Department of Education and Early Childhood Development’s Early Years (schools); Middle Years (schools); and Later Years and Youth Transitions outputs.
Secure the Future of Small Rural SchoolsFunding is provided to replace relocatable buildings in rural primary schools, consistent with the government’s commitment to replace relocatable buildings with modern permanent facilities in rural schools.
This initiative contributes to the Department of Education and Early Childhood Development’s Early Years (schools); and Middle Years (schools) outputs.
Select Entry SchoolsFunding is provided to continue the building of two new select entry co-educational schools in the growth areas of Berwick in Melbourne’s south east, and Melbourne’s west. These schools will provide innovative and specialist programs in key academic areas of study for highly able students.
This initiative contributes to the Department of Education and Early Childhood Development’s Middle Years (schools); and Later Years and Youth Transitions outputs.328 Appendix A Service Delivery 2009-10

Building the Education RevolutionGovernment Schools: Primary Schools for the 21st CenturyFunding is provided as part of the Commonwealth Government’s $42 billion Nation Building – Economic Stimulus Plan. The Commonwealth Government funding that forms part of the Nation Building – Economic Stimulus Plan will be used collaboratively with the State Government Victorian Schools Plan funding to ensure that the opportunities provided to schools are maximised. These investments recognise that high quality school infrastructure is critical to delivering excellent educational outcomes and demonstrates the commitment of the Commonwealth and State governments in working together to ensure immediate construction activity to stimulate the economy and create jobs. The funding will enable the building of major new infrastructure for government primary schools and special schools. Buildings that will be funded include new facilities such as libraries, multipurpose halls, classrooms or the upgrade of existing facilities.
This initiative contributes to the Department of Education and Early Childhood Development’s Early Years (schools); and Middle Years (schools) outputs.
Government Schools: Science and Language CentresFunding is provided as part of the Commonwealth Government’s $42 billion Nation Building – Economic Stimulus Plan. The Commonwealth Government funding that forms part of the Nation Building – Economic Stimulus Plan will be used collaboratively with the State Government Victorian Schools Plan funding to ensure that the opportunities provided to schools are maximised. These investments recognise that high quality school infrastructure is critical to delivering excellent educational outcomes and demonstrates the commitment of the Commonwealth and State governments in working together to ensure immediate construction activity to stimulate the economy and create jobs. Funding will be on a contestable basis and is available for science and language centres in government secondary schools. It is intended that funding will flow to those government Victorian secondary schools that have the greatest need as well as a demonstrated capacity to be able to build the facilities within the 2009-10 financial year.
This initiative contributes to the Department of Education and Early Childhood Development’s Middle Years (schools); and Later Years and Youth Transitions outputs.
Other Education and Early Childhood Development InitiativesNew School – Epping Views Primary SchoolFunding is provided for the continuation of work on Stage 2 of the Epping Views Primary School.
This initiative contributes to the Department of Education and Early Childhood Development’s Early Years (schools) output.
Service Delivery 2009-10 Appendix A 329
Trade Training Centres – Government SchoolsFunding is provided as part of the Commonwealth Government’s Trade Training Centres in Schools program. The Trade Training Centres are being established to help increase the proportion of students achieving Year 12 or an equivalent qualification and help address skill shortages in traditional trades and emerging industries. Government schools will have an opportunity to apply for Commonwealth funding to build new, or upgrade existing, trade or vocational education and training facilities.
This initiative contributes to the Department of Education and Early Childhood Development’s Middle Years (schools); and Later Years and Youth Transitions outputs.
Victorian Institute of Educational LeadershipFunding is provided for the establishment of the Victorian Institute of Educational Leadership which will provide high quality leadership development to Victorian school principals, Regional Network Leaders, coaches, support staff and early childhood workers. This initiative was announced in the 2008-09 Budget Update.
This initiative contributes to the Department of Education and Early Childhood Development’s Middle Years (schools); and Later Years and Youth Transitions outputs.
Human Services
Output initiatives
Table A.5: Output initiatives – Human Services($ million)
2008-09 2009-10 2010-11 2011-12 2012-13Sustaining Health Services Capacity (a) 66.5 175.0 177.5 179.8 182.2Out of Home Care Reform .. 26.7 29.8 34.7 33.3Community Based Aged Care Services .. 12.7 13.4 14.4 15.1Elective Surgery .. 45.0 .. .. ..Increase in the Water and Sewerage
Concession Cap.. 12.5 10.4 10.6 10.9
Support for Public Hospitals .. 25.0 .. .. ..Improving Access to Dental Care .. 4.2 6.7 5.1 5.2Public Health Governance and
Regulation Reform.. 4.0 4.9 5.0 5.3
After Hours Child Protection Emergency and Crisis Response Services
.. 3.5 3.6 3.7 3.8
Sexual Assault Counselling Services for Children
.. 2.2 2.5 2.8 3.0
Disease Prevention .. 2.0 3.8 1.0 1.0Paediatric Intensive Care (b) 3.5 .. .. .. ..Improving Victoria's Response to
Vulnerable Aboriginal Children and Families
.. 0.3 0.3 0.3 0.3
330 Appendix A Service Delivery 2009-10

Table A.5: Output initiatives – Human Services (continued)($ million)
2008-09 2009-10 2010-11 2011-12 2012-13National Partnerships – HealthHospital and Health Workforce Reform –
Securing our Health Workforce.. 2.1 21.3 22.8 26.1
Closing the Gap in Indigenous Health Outcomes
.. 11.7 13.6 11.0 11.1
Hospital and Health Workforce Reform – Activity Based Funding (a)
.. 4.7 5.0 11.0 14.7
National E-health Transition Authority's Core Operations
.. 7.1 9.7 10.1 ..
Preventive Health – Chronic Disease Prevention in Victoria (a)
.. 0.6 2.1 .. ..
National Partnerships – Social Housing and Homelessness (a)
Nation Building – Economic Stimulus Plan – New Construction Stage 2 (a)(c)
.. 391.0 210.4 37.6 ..
Homelessness National Partnership (a) .. 16.1 23.3 28.8 36.6Nation Building – Economic Stimulus
Plan – Repairs and Maintenance 49.6 49.6 .. .. ..
Nation Building – Economic Stimulus Plan – New Construction Stage 1 (a)(c)
7.0 73.5 .. .. ..
Social Housing National Partnership (c) 31.6 40.7 .. .. ..A Place to Call Home (a) 4.9 4.9 4.9 4.9 10.1Indigenous Housing National Partnership 5.8 4.5 2.5 2.5 2.5Sub-total output initiatives 168.8 919.4 545.7 386.1 361.2Government-wide initiatives 54.4 95.8 42.0 38.7 40.3EfficienciesGeneral efficiencies .. - 23.0 - 34.5 - 46.0 - 46.0Drought Savings - 10.0 .. .. .. ..Total output initiatives 213.2 992.2 553.2 378.7 355.5Source: Department of Treasury and Finance
Numbers have been rounded to the nearest $100 000 for presentation purposes.Note:(a) Includes Commonwealth funding.(b) This initiative was previously reported in the 2008-09 Budget Update.(c) Refer to the asset initiative for the balance of funding for this initiative.
Sustaining Health Services CapacityFunding is provided to meet growing demand for acute health services including additional emergency and inpatient capacity, increased medical services including renal dialysis, chemotherapy and radiotherapy, a boost for sub acute and critical care services and improved access to outpatient appointments.
This initiative contributes to the Department of Human Services’ Acute Health; Mental Health; and Small Rural Services – Acute Health outputs.
Service Delivery 2009-10 Appendix A 331

Out of Home Care ReformFunding is provided to continue reform of Victoria’s Out of Home Care System which provides assistance to children who have experienced abuse or neglect so serious that they have been, or are at risk of being, removed from their home and placed in alternative care. The investment increases placement capacity, expands placement prevention and reunification services in recognition of the importance of keeping children in their family's care where appropriate, and introduces home based professional care to reduce the reliance on staffed residential facilities. The package also includes improvements to placement quality including expanded psychological and behavioural treatment services, increased cultural competency of placement services to better meet the needs of aboriginal children, their families and communities, as well as the introduction of a community mentor program for children in residential care.
This initiative contributes to the Department of Human Services’ Placement and Support Services output.
Community Based Aged Care ServicesFunding is provided to address the sustainability of community based services to support older people in the community through the Victorian Government’s contribution to growth funding for Home and Community Care (HACC) services (jointly funded with the Commonwealth Government) and expanding the Personal Alert Victoria program.
This initiative contributes to the Department of Human Services’ Aged Support Services; Primary Health; and Community Care and Support outputs.
Elective Surgery Funding is provided for an elective surgery blitz in 2009-10 in Victoria’s public hospitals.
This initiative contributes to the Department of Human Services’ Admitted Services and Non-Admitted Services outputs.
Increase in the Water and Sewerage Concession CapFunding is provided to increase the water and sewerage concession cap for 2009-10 in order to assist low income households with water price increases expected on 1 July 2009. The concession provides a 50 per cent discount on water and sewerage bills up to a maximum cap. The maximum cap will increase from $187.90 in 2008-09 to $216.60 in 2009-10, an increase of 14.2 per cent.
Additional funding in 2009-10 has also been directed to the Water Wise Program, which assists low income households to reduce their water usage by providing eligible households with a free water audit, and enables retro fitting of efficient water regulation aids and appliances.
This initiative contributes to the Department of Human Services’ Concessions to Pensioners and Beneficiaries output.
332 Appendix A Service Delivery 2009-10
Support for Public HospitalsFunding is provided to support clinical practice improvements, new technologies and a range of cost control reforms to better manage medical and pharmaceutical supplies and develop new strategies for managing hospital resources.
This initiative contributes to a range of Department of Human Services’ outputs.
Improving Access to Dental CareFunding is provided for service delivery in the new dental clinic in Wodonga and dental training clinic at the rural dental school in Bendigo to provide clinical training capacity for students. Funding will also deliver 20 000 additional courses of dental care over two years, targeted to those with greatest need and the longest waiting lists, including Ballarat, Geelong and Moe.
This initiative contributes to the Department of Human Services’ Dental Services output.
Public Health Governance and Regulation ReformFunding is provided to respond to new legislative and regulatory obligations in respect of public health reform. This includes the management of the implementation of the Public Health and Wellbeing Act 2008 and regulatory reforms associated with the Cemeteries and Crematoria (Amendment) Act 2009 and the Food Act 1984.
This contributes to the Department of Human Services’ Health Protection output.
After Hours Child Protection Emergency and Crisis Response ServicesFunding is provided to address the increase in demand for after hours child protection emergency and crisis response services by increasing the capacity of After Hours Child Protection Emergency Services, the Streetworks Outreach Service and the Central After Hours Assessment and Bail Placement Service.
This initiative contributes to the Department of Human Services’ Statutory Child Protection Services; and the Youth Justice and Community Based Services outputs.
Sexual Assault Counselling Services for ChildrenFunding is provided to meet the increased demand for sexual assault counselling services for children, and also to allow waiting times to be reduced.
This initiative contributes to the Department of Human Services’ Family and Community Services output.
Disease PreventionThis initiative will modernise the information management system for infectious diseases and improve prevention and screening initiatives for tuberculosis.
This initiative contributes to the Department of Human Services’ Health Protection output.
Service Delivery 2009-10 Appendix A 333
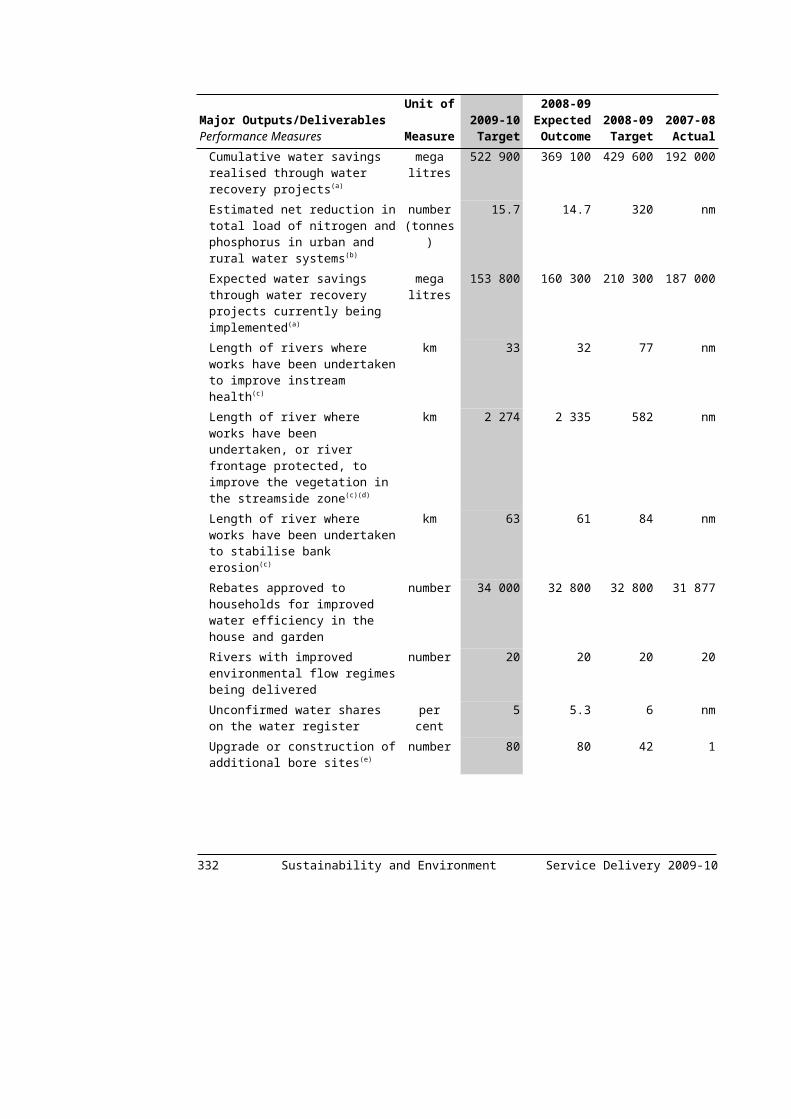
Paediatric Intensive CareFunding is provided for a new strategy to better manage the State’s paediatric and neo-natal intensive care demand at the Royal Children’s Hospital.
This initiative contributes to the Department of Human Services’ Admitted Services Output.
Improving Victoria's Response to Vulnerable Aboriginal Children and FamiliesFunding is provided to strengthen the network of programs available to support vulnerable Indigenous children and families in three sites, Darebin, Greater Bendigo and Mildura. Funding will provide Koori Maternal Services in each of these areas and assist vulnerable women to access the Maternal and Child Health Service provided through the Department of Education and Early Childhood Development.
This initiative contributes to the Department of Human Services’ Community Based Services output.
National Partnerships – HealthHospital and Health Workforce Reform – Securing our Health WorkforceFunding is provided to implement workforce reform commitments agreed to by the Council of Australian Governments that include Victoria’s contribution to increase medical clinical training and implement national registration and accreditation schemes. Funding is also provided for competitive workforce recruitment and retention initiatives that will boost the size and distribution of the health workforce.
This contributes to the Department of Human Services’ Acute Training and Development output.
Closing the Gap in Indigenous Health OutcomesFunding is provided to reduce Indigenous chronic disease through targeted health care services in a variety of settings. This initiative will promote healthy lifestyle choices for Indigenous Victorians, such as smoking cessation and healthy transitions to adulthood, and better access to health care for vulnerable children and families. Cultural competency frameworks in universal health services and a clinical workforce training component in Aboriginal Community Controlled Organisations and Community Health Services will also be undertaken.
This initiative contributes to a range of Department of Human Services’ outputs.
Hospital and Health Workforce Reform – Activity Based FundingFunding is provided to meet Victoria’s commitment under the Council of Australian Governments to introduce a nationally consistent activity based funding approach to improve efficiency in public hospitals.
This initiative contributes to the Department of Human Services’ Acute Health Services outputs.
334 Appendix A Service Delivery 2009-10

National E-Health Transition Authority’s Core OperationsFunding is provided to support Victoria’s contribution to the National E-Health Transition Authority (NEHTA) for foundation work agreed to by the Council of Australian Governments. Funding will support identifier and authentication services to allow the development of a National Individual Electronic Health Record (IEHR) system.
This initiative contributes to the Department of Human Services’ Acute Health Services outputs.
Preventive Health – Chronic Disease Prevention in VictoriaThe National Partnership on Preventive Health will fund a range of measures aimed at promoting healthy behaviours and addressing lifestyle related chronic diseases. The initial focus will include development of an implementation plan, prior to significant investment commencing in 2011-12.
This initiative contributes to the Department of Human Services’ Health Advancement output.
National Partnerships – Social Housing and HomelessnessNation Building – Economic Stimulus Plan – New Construction Stage 2Victoria is working with the Commonwealth on Stage 2 proposals for the construction of around 4 300 new social housing dwellings. It is anticipated that the approval of these proposals will be confirmed by the Commonwealth by the end of August 2009.
This initiative contributes to the Department of Human Services’ Long Term Housing Assistance output.
Homelessness National PartnershipFunding is provided to facilitate the delivery of a package of cross-government initiatives under the Council of Australian Governments’ Homelessness National Partnership (NP) Agreement to help people who are homeless or at risk of homelessness achieve sustainable housing and social inclusion. Additional assistance will also be provided through the Mental Health Reform Strategy and the Court Integrated Services Program initiatives, elements of which will contribute to Victoria’s matching contribution to the Homelessness NP.
This initiative contributes to the Department of Human Services’ Homelessness Assistance output.
Nation Building – Economic Stimulus Plan – Repairs and MaintenanceFunding is provided for the refurbishment of existing social housing stock that will increase the usable life of properties and improve amenity for tenants. It will also enable the retention of at least 1 600 social housing properties that would otherwise be unsuitable for occupancy without this additional work taking place.
This initiative contributes to the Department of Human Services’ Long Term Housing Assistance output.Service Delivery 2009-10 Appendix A 335
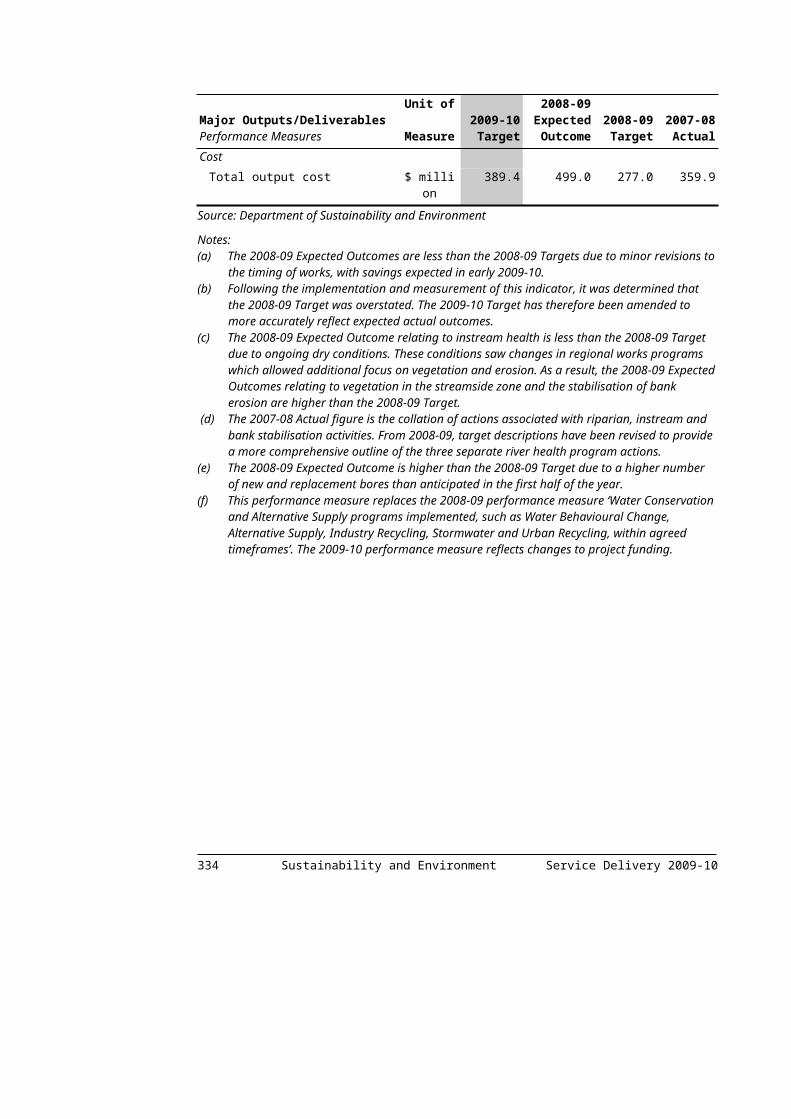
Nation Building – Economic Stimulus Plan – New Construction Stage 1Funding is provided for the construction of 667 new social housing dwellings. It is anticipated that a significant proportion of these properties will be delivered and managed by the not-for-profit housing association sector.
This initiative contributes to the Department of Human Services’ Long Term Housing Assistance output.
Social Housing National PartnershipFunding is provided for the construction of approximately 488 new social housing dwellings, which will enable more disadvantaged households and homeless people to access safe and secure housing. It is anticipated that a significant proportion of these properties will be delivered and managed by the not-for-profit housing association sector.
This initiative contributes to the Department of Human Services’ Long Term Housing Assistance output.
A Place to Call HomeFunding is provided to deliver 68 new units of crisis accommodation for the chronically homeless, in partnership with the Commonwealth Government.
This initiative contributes to the Department of Human Services’ Homelessness Assistance output.
Indigenous Housing National PartnershipFunding is provided to facilitate the transfer of responsibility for approximately 500 Indigenous Community Housing properties from the Commonwealth Government to the Victorian Government, as agreed under the Council of Australian Governments’ Indigenous Housing National Partnership Agreement.
This initiative contributes to the Department of Human Services’ Long Term Housing Assistance output.
Asset initiatives
Table A.6: Asset initiatives – Human Services($ million
2008-09 2009-10 2010-11 2011-12 2012-13 TEINational Partnerships – Social Housing (a)
Nation Building – Economic Stimulus Plan – New Construction Stage 2
.. 412.3 221.9 39.7 .. 673.9
Nation Building – Economic Stimulus Plan – New Construction Stage 1
7.9 83.1 .. .. .. 91.0
Social Housing National Partnership
18.0 8.9 .. .. .. 26.9
336 Appendix A Service Delivery 2009-10

Table A.6: Asset initiatives – Human Services (continued)($ million)
2008-09 2009-10 2010-11 2011-12 2012-13 TEIDandenong Hospital Mental
Health Redevelopment and Expansion (b)
.. 4.0 17.1 18.9 16.8 66.0
Bendigo Hospital Stage 1 – Enabling Works
.. 17.0 24.4 10.0 3.6 55.0
Geelong Hospital – Enhanced Capacity Works
.. 2.1 11.5 14.0 2.4 30.0
Warrnambool Hospital Redevelopment – Stage 1C
.. 0.3 1.1 18.8 6.0 26.2
Ballarat Base Hospital Redevelopment
.. 0.6 2.0 12.0 5.4 20.0
Alexandra District Hospital and Ambulance Station Redevelopment (c)
.. 7.3 11.7 .. .. 19.0
My Future My Choice (MFMC) Stage 2 (d)
.. 0.7 6.4 6.4 0.3 13.8
Breastscreen Victoria's Digital Technology Rollout
.. 2.5 5.0 2.5 .. 10.0
Out of Home Care – Upgrading Existing Residential Care Facilities
.. 3.0 4.0 3.0 .. 10.0
Youth Prevention and Recovery Care Services
.. 0.4 6.0 1.6 .. 8.0
Sunbury Day Hospital Stage 2 .. 2.0 4.0 0.4 .. 6.4Redevelopment of Community
Facilities (Building Inclusive Communities)
.. 1.0 2.5 1.5 .. 5.0
Rosebud Community Health Centre
.. 3.1 .. .. .. 3.1
Aged Care Land Bank – Stage 4 .. 3.0 .. .. .. 3.0Short Stay Units, Day Treatment
Centres and Medi-Hotels.. 3.0 .. .. .. 3.0
Monashlink Community Health Centre Oakleigh
.. 0.5 1.5 0.5 .. 2.5
The Alfred Burns Unit .. 1.1 .. .. .. 1.1Critical Care Service Expansion .. 1.0 .. .. .. 1.0Sub-total asset initiatives 25.9 556.9 319.2 129.3 34.4 1 074.9Government-wide initiatives .. .. .. .. .. ..Total asset initiatives 25.9 556.9 319.2 129.3 34.4 1 074.9Source: Department of Treasury and Finance
Numbers have been rounded to the nearest $100 000 for presentation purposes.Notes:(a) The TEI for this initiative includes funding of $9.1 million beyond 2012-13.(b) Includes capital contributions of $3.7 million from agencies.(c) Includes $7.0 million from asset sales.
Service Delivery 2009-10 Appendix A 337

Labor’s Financial Statement InitiativesThe following initiatives contribute towards meeting Labor’s Financial Statement 2006 commitments:
Aged Care Land Bank – Stage 4; Alexandra District Hospital and Ambulance Station Redevelopment; BreastScreen Victoria's Digital Technology Rollout; Dandenong Hospital Mental Health Redevelopment and Expansion; MonashLink Community Health Centre Oakleigh; Short Stay Units, Day Treatment Centres and Medi-Hotels; and Warrnambool Hospital Redevelopment – Stage 1C.
Nation Building – Economic Stimulus Plan – New Construction Stage 2Refer to the output initiative for a description of this initiative.
Nation Building – Economic Stimulus Plan – New Construction Stage 1Refer to the output initiative for a description of this initiative.
Social Housing National PartnershipRefer to the output initiative for a description of this initiative.
Dandenong Hospital Mental Health Redevelopment and ExpansionFunding is provided to redevelop and expand mental health facilities provided by Dandenong Hospital, improving the quality of care and addressing demand growth for mental health services in the south-eastern suburbs of Melbourne.
This initiative contributes to the Department of Human Services’ Mental Health output.
Bendigo Hospital Stage 1 – Enabling WorksFunding is provided for the first stage of redevelopment of the Bendigo Hospital, in advance of the planned longer-term redevelopment. The first stage will relocate the ambulance station and allow demolition of existing buildings, making way for the redevelopment stages to follow. The initiative will provide for detailed planning for the major redevelopment, critical infrastructure works including upgrades of mechanical, electrical and fire safety services, an expansion of the ambulance bay and resuscitation bay, emergency department x-ray equipment, and a new eight bed ward. This proposal includes the expansion of the existing Primary Care Clinic to establish the new Bendigo Primary Health Centre. This will compliment a $5 million contribution from the Commonwealth Government to establish a GP super clinic at the Bendigo Hospital.
This initiative contributes to the Department of Human Services’ Admitted Services output.
338 Appendix A Service Delivery 2009-10

Geelong Hospital – Enhanced Capacity WorksFunding is provided to expand services at Geelong Hospital including an additional 24 bed surgical ward, fit out of a second operating theatre and associated infrastructure upgrades, eight additional mental health beds, and reconfiguration of clinical service areas. Funding for additional planning works for the hospital is also provided.
This initiative contributes to the Department of Human Services’ Admitted Services output.
Warrnambool Hospital Redevelopment – Stage 1CFunding is provided for a new Integrated Care Centre which will include allied health, rehabilitation, mental health and primary care services. This will enable the consolidation of services that are currently delivered from a number of locations across the city.
This initiative contributes to the Department of Human Services’ Admitted Services output.
Ballarat Base Hospital Redevelopment This initiative will expand and redevelop facilities at Ballarat Hospital. The hospital’s coronary services capacity will be enhanced with the development of a Coronary Catheterisation Laboratory and six day beds, while the hospital’s Special Care Nursery will also be expanded to meet projected demand growth from births in the region. The hospital’s administration and offices will also be refurbished and centralised.
This initiative contributes to the Department of Human Services’ Admitted Services output.
Alexandra District Hospital and Ambulance Station RedevelopmentThis initiative will provide a new, integrated hospital and community health service including acute beds, emergency stabilisation, operating suite, and day stay facilities. The redevelopment will also incorporate new facilities for Alexandra's ambulance service which will be relocated to the new hospital from its existing site.
This initiative contributes to the Department of Human Services’ Admitted Services output.
My Future My Choice – Stage 2Funding is provided to develop 13 purpose-built, age appropriate community-based accommodation options for 58 younger people with high support needs who are living in, or at risk of entering, residential aged care.
This initiative contributes to the Department of Human Services’ Residential Accommodation Support output.
Service Delivery 2009-10 Appendix A 339

BreastScreen Victoria’s Digital Technology RolloutFunding is provided to expand digital mammography screening technology in BreastScreen Victoria services. The rollout will upgrade analogue mammography equipment in BreastScreen Victoria assessment services, allowing improvements in timeliness and efficiency to be achieved through the replacement of paper and film based processes, improving the early detection of breast cancer.
This initiative contributes to the Department of Human Services’ Health Protection output.
Out of Home Care – Upgrading Existing Residential Care FacilitiesFunding is provided to continue the State’s program of renovation and redevelopment of residential care facilities for children and young persons in Out of Home Care. The initiative will address geographic distribution factors so that more children are able to remain in communities of origin and maintain their links with family, friends and school and ensure building design best meets the needs of children and young people.
This initiative contributes to the Department of Human Services’ Placement and Support Services output.
Youth Prevention and Recovery Care ServicesFunding is provided for two, eight-bed purpose built mental health facilities (at Bendigo and Frankston) for Youth Prevention and Recovery Care Services (YPARCS), providing a transitional step down/step up service between acute in-patient and community-based services for young people (18-25 years old). The services focus on those recovering from acute illness who need additional support to be successfully managed in the community.
This initiative contributes to the Department of Human Services’ Mental Health output.
Sunbury Day Hospital Stage 2This initiative provides for a new operating theatre suite with operating and recovery services to provide minor same-day surgery services for patients with low complexity at the Sunbury Day Hospital.
This initiative contributes to the Department of Human Services’ Admitted Services output.
Redevelopment of Community Facilities (Building Inclusive Communities)Funding is provided to establish community based, co-located facilities where disability supports are integrated with other community services. This initiative aims to improve accessibility to mainstream community facilities for people with disabilities and offer opportunities for them to participate in their local communities. Funding will be provided in the form of capital grants to community partners for a minimum of eight community infrastructure projects.
This initiative contributes to the Department of Human Services’ Individual Support output.
340 Appendix A Service Delivery 2009-10
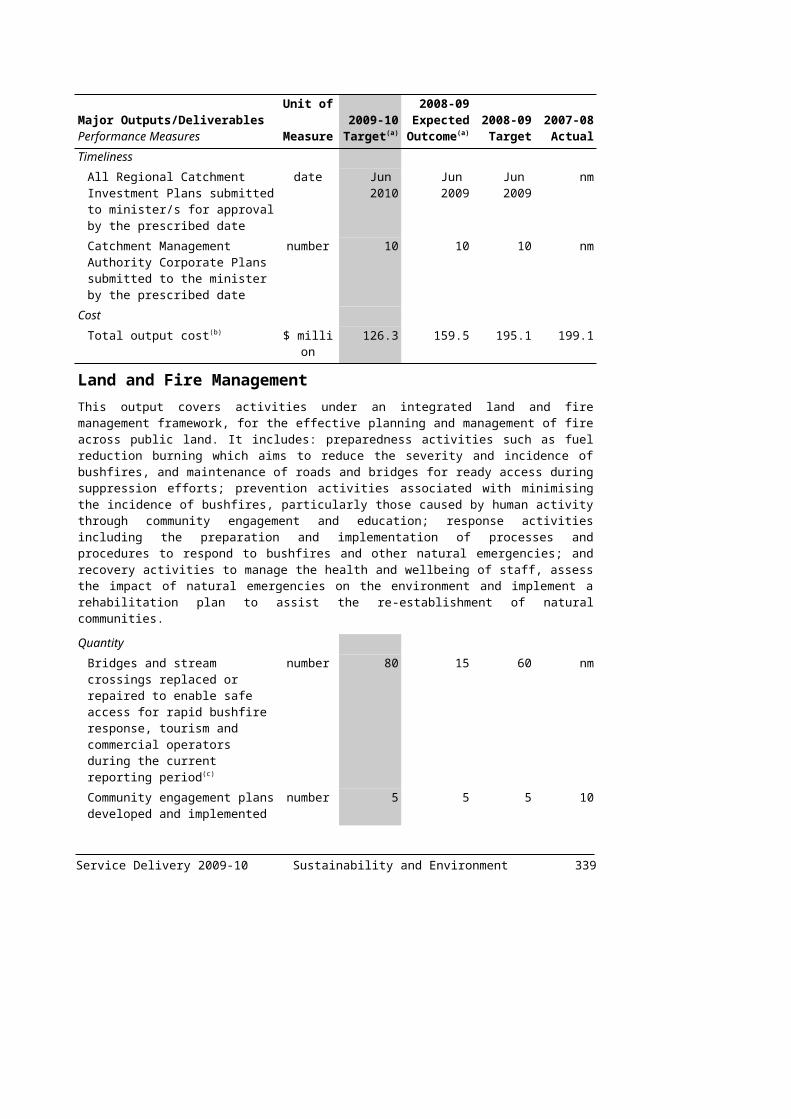
Rosebud Community Health CentreFunding is provided to develop accommodation for Peninsula Health’s Rosebud Community Health Centre (RCHC), after fire destroyed the RCHC’s premises in March 2008.
This initiative contributes to the Department of Human Services’ Community Health Care output.
Aged Care Land Bank – Stage 4This initiative continues the Aged Care Land Bank Program to provide land to not-for-profit aged care providers for the development of residential aged care services in the inner and middle suburbs of Melbourne.
This initiative contributes to the Department of Human Services’ Aged Support Services output.
Short Stay Units, Day Treatment Centres and Medi-HotelsFunding is provided to fulfil the Labor’s Financial Statement 2006 commitment for the expansion of facilities to support access and timely treatment for people presenting to emergency departments including short stay units, day treatment centres and medi-hotels.
This initiative contributes to the Department of Human Services’ Acute Health output.
MonashLink Community Health Centre OakleighThis initiative will enable MonashLink Community Health Centre Oakleigh to better meet the health service needs of the community. The development will deliver modern, purpose built facilities with a focus on adolescent health services and will house existing Early Intervention in Chronic Disease and Hospital Admission Risk Program staff.
This initiative contributes to the Department of Human Services’ Community Health Care output.
The Alfred Burns UnitFunding is provided to undertake an upgrade of the Burns Unit at the Alfred Hospital, improving infection control, patient amenity and to support early rehabilitation through the development of a dedicated gym on the ward.
This initiative contributes to the Department of Human Services’ Admitted Services output.
Critical Care Service ExpansionFunding is provided to expand critical care services throughout both Metropolitan and Regional Victoria, by providing enhanced intensive care, neo-natal intensive care and special care nursery services throughout Victoria.
This initiative contributes to the Department of Human Services’ Admitted Services output.
Service Delivery 2009-10 Appendix A 341

Innovation, Industry and Regional Development
Output initiatives
Table A.7: Output initiatives – Innovation, Industry and Regional Development($ million)
2008-09 2009-10 2010-11 2011-12 2012-132008 Commonwealth TAFE Projects .. .. 0.3 0.6 0.6Additional 15 000 Purchased Places .. 8.5 24.9 16.4 ..Apprentice/Trainee Completion Bonus .. 25.0 .. .. ..Defence Industry Acceleration Program (a) 2.0 2.0 2.0 2.0 ..Export Clusters Program (a) 0.8 0.8 1.3 1.3 ..Fee Waivers for Job-Seekers .. 1.4 1.9 4.2 6.4Financial Services Initiative (a) 0.3 0.3 0.3 0.3 ..Income Contingent Loans 22.4 .. .. .. ..Transport Infrastructure Manufacturing
Scheme.. 0.6 0.6 .. ..
Industry Transition Fund (a) 25.0 25.0 .. .. ..Koori Business Network – Supporting the
Victorian Indigenous Business Development
.. 1.0 .. .. ..
Leveraging Global Opportunities Program (a)
1.5 1.5 2.5 2.5 ..
Melbourne Convention and Visitors Bureau and the Business Events Cap (a)
2.5 5.6 10.0 10.2 ..
New Workforce Partnerships .. 4.7 5.5 .. ..Otways Timber Assistance Program 3.8 .. .. .. ..Princes Pier Restoration .. .. 0.2 0.3 0.3Skills Reform Changes to Eligibility
Criteria.. 0.2 1.1 2.3 2.2
Skills to Transition Program .. 6.9 6.9 .. ..Victorian Automotive Manufacturing
Action Plan (a) 0.9 1.6 2.1 2.2 ..
Victorian Government Business Office – New Commissioners for Victoria
.. 0.8 0.8 0.8 0.8
Victorian Government Expo Centre .. 0.5 0.5 0.5 0.5Victorian Transport PlanLocal Roads to Markets .. 7.5 .. .. ..Rail Trails and Cycling Paths 4.0 6.0 .. .. ..Upgrading Regional Airports 9.0 11.0 .. .. ..Sub-total output initiatives 72.2 110.8 60.9 43.6 10.9Government-wide initiatives 59.9 94.7 105.2 94.0 ..EfficienciesGeneral efficiencies .. - 6.0 - 9.0 - 12.0 - 12.0Drought Savings - 3.3 .. .. .. ..Total output initiatives 128.8 199.5 157.1 125.6 - 1.1Source: Department of Treasury and Finance
Numbers have been rounded to the nearest $100 000 for presentation purposes.Note:(a) These initiatives were previously reported in the 2008-09 Budget Update.
342 Appendix A Service Delivery 2009-10

2008 Commonwealth TAFE ProjectsFunding is provided to cover the ongoing operating costs of eleven TAFE projects that were approved under the 2008 Commonwealth TAFE Annual Infrastructure Plan.
The initiative contributes to the Department of Innovation, Industry and Regional Development’s Skills output.
Additional 15 000 Purchased PlacesVictoria will provide vocational education and training places as part of the Commonwealth’s Productivity Places Program. In order to meet a shortfall in projected places, funding for an additional 5 000 training places in 2009 and 10 000 places in 2010 is provided to ensure the Productivity Places Program targets are met.
This initiative contributes to the Department of Innovation, Industry and Regional Development’s Skills output.
Apprentice/Trainee Completion BonusFunding is provided to extend the current completion bonus scheme to encourage employers to support young apprentices and trainees to complete their training and qualifications.
This initiative contributes to the Department of Innovation, Industry and Regional Development’s Skills output.
Defence Industry Acceleration ProgramThis initiative will assist innovative Victorian defence industries to realise commercialisation opportunities, to encourage industry, defence and academia to work on complex systems integration and engineering requirements and to provide strategic leadership that links government with industry and informs government on defence-related issues and major defence projects.
This initiative contributes to the Department of Innovation, Industry and Regional Development’s Investment Attraction and Facilitation output.
Export Clusters ProgramFunding is provided to enable companies in related areas to build international bargaining power, assist the formation of consortia across a range of industry sectors and to support entry into export markets.
This initiative contributes to the Department of Innovation, Industry and Regional Development’s Exports output.
Fee Waivers for Job-SeekersFunding is provided to enable training providers to waive fees for job-seekers who meet certain criteria, in order for Victoria to meet its commitments to the Commonwealth under the Intergovernmental Agreement for additional training delivery in Victoria under the Productivity Places Program.
This initiative contributes to the Department of Innovation, Industry and Regional Development’s Skills output. Service Delivery 2009-10 Appendix A 343

Financial Services Initiative This initiative supports and attracts financial services events to Melbourne, promotes Victoria’s research innovation, teaching and training capabilities to industry, establishes stronger international linkages, boosts Victoria’s profile in specialist financial services, and charts and promotes the capabilities and successes of the sector across Victoria.
This initiative contributes to the Department of Innovation, Industry and Regional Development’s Sector Development output.
Income Contingent LoansFunding is provided for Victoria’s contribution to the costs of the Income Contingent Loans Scheme which will enable the implementation of the Government’s Securing Jobs for Your Future statement. The Income Contingent Loans scheme will enable students in government subsidised places at Diploma and Advanced Diploma Level to defer the payment of tuition fees until they reach a specified income threshold.
This initiative contributes to the Department of Innovation, Industry and Regional Development’s Skills output.
Transport Infrastructure Manufacturing SchemeFunding has been provided to assist Victorian manufacturers maximise Australian and international transport infrastructure business opportunities. To be facilitated by the Australian Industry Group, the scheme will maximise opportunities for local manufacturers to build capacity to compete for rolling stock and bus contracts. The Transport Infrastructure Manufacturing Scheme will provide practical assistance to local manufacturers and complement the work of a national taskforce.
This initiative contributes to the Department of Innovation, Industry and Regional Development’s Investment Attraction and Facilitation output.
Industry Transition FundFunding is provided to invest in plant and equipment that will increase productivity; to assist firms to move to the next-generation of products; and to support mergers and acquisitions that create sustainable growth-orientated entities. This initiative will assist companies that may not survive on a stand alone basis and are experiencing difficulties in the current economic climate to retain skills and assist industries in transition that underpin the economic viability of local communities, especially in regional Victoria.
This initiative contributes to the Department of Innovation, Industry and Regional Development’s Investment Attraction and Facilitation output.
Koori Business Network – Supporting the Victorian Indigenous Business Development This initiative will support Indigenous business operators through business advice, support services and promoting Koori business links and networks.
This initiative contributes to the Department of Innovation, Industry and Regional Development’s Small Business output.
344 Appendix A Service Delivery 2009-10
Leveraging Global Opportunities ProgramFunding is provided to gather market intelligence, target potential investors in strategically significant sectors, investigate trade and investment opportunities in emerging markets, promote major Victorian projects and develop strategic partnerships with other investments promotion agencies.
This initiative contributes to the Department of Innovation, Industry and Regional Development’s Investment Attraction and Facilitation output.
Melbourne Convention and Visitors Bureau and the Business Events CapFunding is provided for the Melbourne Convention and Visitors Bureau’s operating costs and the delivery of international business event marketing for the new Melbourne Convention Centre.
This initiative contributes to the Department of Innovation, Industry and Regional Development’s Tourism output.
New Workforce Partnerships Funding is provided to continue the New Workforce Partnerships program for disadvantaged job seekers. This program establishes partnerships with employers in key industry sectors and links Victorian jobseekers facing persistent labour market disadvantage to jobs in those industries.
This initiative contributes to the Department of Innovation, Industry and Regional Development’s Workforce Participation output.
Otways Timber Assistance ProgramFunding is provided to further support timber workers to transition to alternative employment opportunities, as a result of the cessation of timber harvesting in the Otways.
This initiative contributes to the Department of Innovation, Industry and Regional Development’s Workforce Participation output.
Princes Pier Restoration Funding is provided to fulfil the Government’s commitment to complete the restoration of Princes Pier, including the partial reconstruction of the deck and restoration of the Gatehouse.
The initiative contributes to the Department of Innovation, Industry and Regional Development’s Major Project output.
Skills Reform Changes to Eligibility CriteriaFunding is provided to extend government funded training eligibility to holders of special category visas; and to include Vocational Graduate Certificates and Vocational Graduate Diplomas in the list of courses eligible for government funded Vocational Education and Training places.
This initiative contributes to the Department of Innovation, Industry and Regional Development’s Skills output. Service Delivery 2009-10 Appendix A 345

Skills to Transition ProgramThe Skills to Transition program will be offered for two years from 1 January 2010 to meet anticipated increased demand for training resulting from the Global Financial Crisis. Funding will create 6 431 demand driven places for targeted groups to undertake training at Certificate I to IV level ahead of the full implementation of skills reform in 2011.
This initiative contributes to the Department of Innovation, Industry and Regional Development’s Skills output.
Victorian Automotive Manufacturing Action PlanFunding is provided for a business program to develop the international competitiveness of companies at all levels of the supply chain, investments in new technologies, including hybrids and alternative fuels, and identification of opportunities and facilitation of access by Victorian firms into global supply chains.
This initiative contributes to the Department of Innovation, Industry and Regional Development’s Investment Attraction and Facilitation output.
Victorian Government Business Office – New Commissioners for VictoriaFunding is provided to upgrade the Victorian Government Business Office – Frankfurt post to Commissioner level, and to establish a new investment manager position in London.
This initiative contributes to the Department of Innovation, Industry and Regional Development’s Investment Attraction and Facilitation output.
Victorian Government Expo Centre Funding has been provided to continue to conduct the Victorian Government Expo at the Royal Melbourne Show.
This initiative contributes to the Department of Innovation, Industry and Regional Development’s Marketing Victoria output.
Victorian Transport Plan Local Roads to MarketsFunding is provided to continue to upgrade local roads, improving the links between local industries, including grain, dairy, livestock, horticultural, seafood and timber sectors in regional Victoria.
This is a Victorian Transport Plan initiative and contributes to the Department of Innovation, Industry and Regional Development’s Regional Infrastructure Development output.
346 Appendix A Service Delivery 2009-10
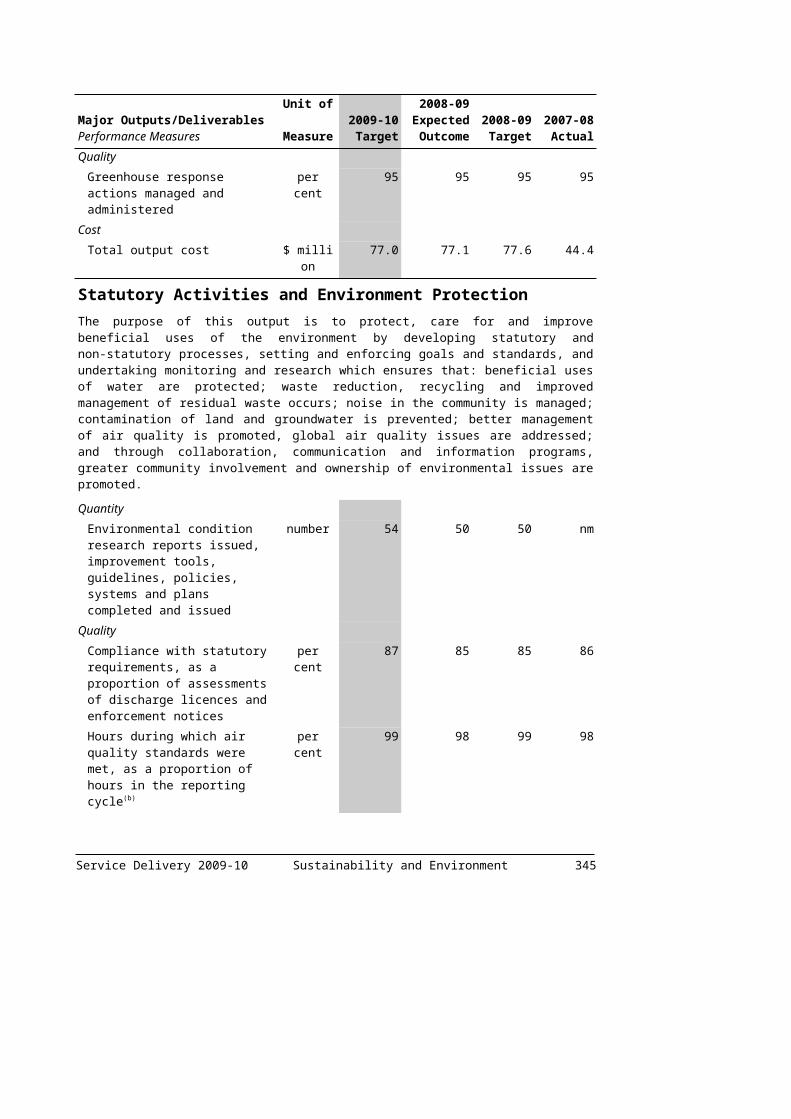
Rail Trails and Cycling PathsFunding is provided to improve rail trails and off-road walking and cycling paths in regional Victoria.
This is a Victorian Transport Plan initiative and contributes to the Department of Innovation, Industry and Regional Development’s Regional Infrastructure Development output.
Upgrading Regional AirportsFunding is provided to improve transport infrastructure in regional Victoria through the improvement of regional airports.
This is a Victorian Transport Plan initiative and contributes to the Department of Innovation, Industry and Regional Development’s Regional Infrastructure Development output.
Asset initiatives
Table A.8: Asset initiatives – Innovation, Industry and Regional Development($ million)
2008-09 2009-10 2010-11 2011-12 2012-13 TEIAviation Training Academy –
Centre of Excellence.. 3.0 .. .. .. 3.0
E-Gate Redevelopment Planning
.. 2.0 .. .. .. 2.0
Film and Television Studios (a) 15.0 0.8 .. .. .. 15.8Princes Pier Restoration .. 10.0 10.0 .. .. 20.0Royal Melbourne Institute of
Technology – Advanced Manufacturing Precinct (b)
0.7 5.0 1.4 .. .. 7.0
TAFE Institutes – Student Management Solution (c)
.. 15.8 19.8 13.3 9.5 66.9
Sub-total asset initiatives 15.7 36.6 31.2 13.3 9.5 114.7Government-wide initiatives .. .. .. .. .. ..Total asset initiatives 15.7 36.6 31.2 13.3 9.5 114.7Source: Department of Treasury and Finance
Numbers have been rounded to the nearest $100 000 for presentation purposes.Notes:(a) Part of this initiative was previously reported in the 2008-09 Budget Update.(b) This initiative was previously reported in the 2008-09 Budget Update.(c) The TEI for this initiative includes funding of $8.6 million beyond 2012-13.
Aviation Training Academy – Centre of ExcellenceFunding is provided to develop a business case for the design and planning of an integrated Aviation Training Academy.
The initiative contributes to the Department of Innovation, Industry and Regional Development’s Skills output.
Service Delivery 2009-10 Appendix A 347
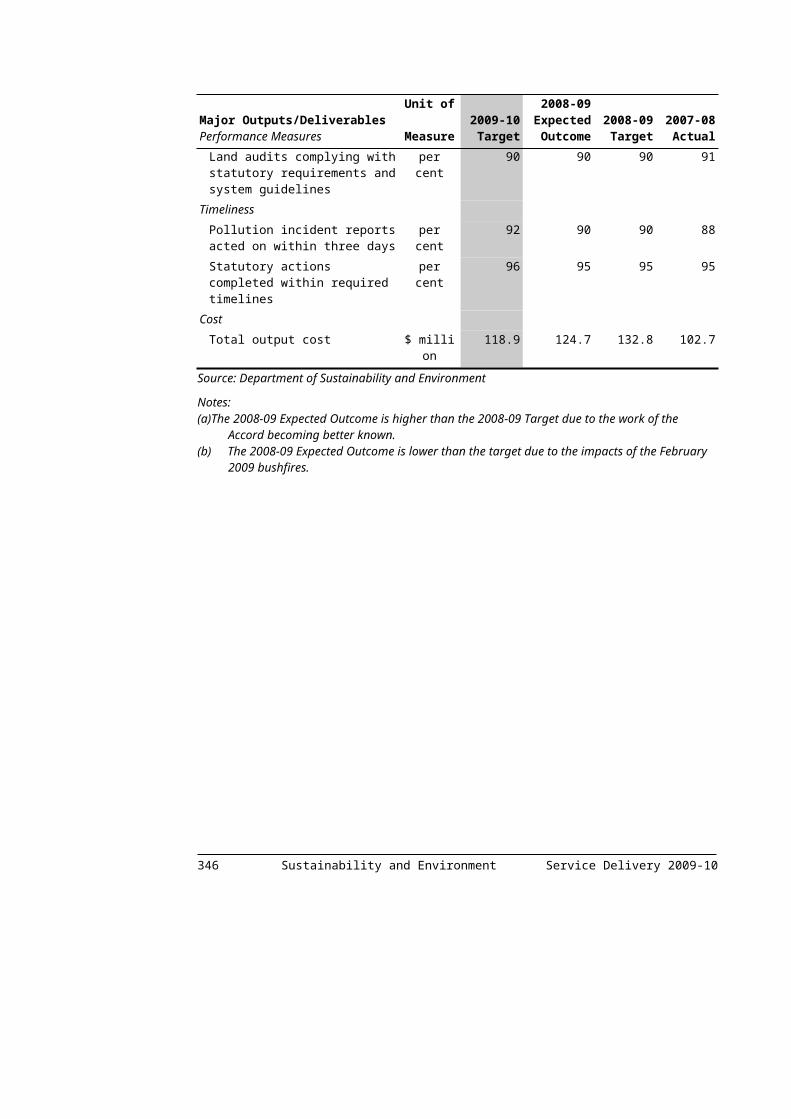
E-Gate Redevelopment Planning Funding is provided to develop a business case to inform future use and a redevelopment delivery strategy for land at the E-Gate site located between North Melbourne train station and Footscray Road in West Melbourne.
This initiative contributes to the Department of Innovation, Industry and Regional Development’s Major Projects output.
Film and Television StudiosFunding is provided to support the management of the Melbourne Film and Television Studio and to conduct an options analysis and develop a business case to determine the viability of constructing additional sound stages and production office facilities at the Melbourne Central City Studios.
This initiative contributes to the Department of Innovation, Industry and Regional Development’s Sector Development output.
Princes Pier RestorationRefer to the output initiative for a description of this initiative.
Royal Melbourne Institute of Technology – Advanced Manufacturing Precinct Funding is provided to develop an advanced manufacturing precinct that will offer practical training experience for the design, development, production, marketing and management specialisations found in the advanced manufacturing sectors.
This initiative contributes to the Department of Innovation, Industry and Regional Development’s Skills output.
TAFE Institutes – Student Management SolutionFunding has been provided towards a new Student Management Solution that will replace the outdated existing systems, provide a co-ordinated integrated state-wide system for the majority of TAFE institutes and assist in delivering skills reform.
This initiative contributes to the Department of Innovation, Industry and Regional Development’s Skills output.
348 Appendix A Service Delivery 2009-10
Justice
Output initiatives
Table A.9: Output initiatives – Justice($ million)
2008-09 2009-10 2010-11 2011-12 2012-13Corrections Demand Management
Strategy.. 2.5 8.9 12.3 12.8
Court Integrated Services Program .. 5.2 5.3 .. ..Gambling Licences Review .. 15.6 4.5 4.6 3.7Graffiti Prevention and Removal Strategy .. 2.2 2.3 .. ..Investing in Victoria's Asset Confiscation
Scheme .. 3.4 3.5 3.6 3.7
Multicultural Water Safety Program .. 0.3 0.3 .. ..Neighbourhood Justice Centre .. 6.3 6.5 6.6 6.8Reducing Court Delays – Supreme Court
Accelerated Appointment of Judges (a) 0.8 2.5 0.8 - 0.1 ..
Road Safety Initiatives .. 20.9 33.5 35.6 36.5Sentencing Advisory Council .. 1.8 1.9 1.9 1.9Supporting Courts to Address Family
Violence.. 2.6 2.7 2.7 2.8
Victoria Legal Aid .. 24.7 .. .. ..Victoria Police Accommodation
Refurbishment.. 4.0 12.0 .. ..
Victoria Police Physical Assets Building – Regional Police Stations Program
.. 0.4 0.8 1.5 2.1
Victoria Police – Safe Streets (a) 2.0 5.0 4.0 .. ..Victorian Electoral Commission – State
By-Elections 2008-09 (a) 0.3 .. .. .. ..
Victorian Racing Industry – Regional and Rural Infrastructure Funding (a)
10.0 23.0 10.0 2.0 ..
Victorian Transport PlanTransit Safety Initiative .. 4.6 4.7 4.8 5.0Sub-total output initiatives 13.1 125.1 101.7 75.8 75.4Government-wide initiatives 43.4 47.5 44.1 42.0 37.9EfficienciesGeneral efficiencies .. - 15.0 - 22.5 - 30.0 - 30.0Drought Savings - 5.0 .. .. .. ..Total output initiatives 51.5 157.6 123.3 87.8 83.4Source: Department of Treasury and Finance
Numbers have been rounded to the nearest $100 000 for presentation purposes.Note:(a) These initiatives were previously reported in the 2008-09 Budget Update.
Corrections Demand Management Strategy Funding is provided to expand the home detention program which is currently in a pilot phase and has shown to be a useful option within the corrections system. The expansion will allow judges to use home detention as a ‘front end’ sentence for appropriate offenders to lower re-offending rates while still providing an effective deterrent. Service Delivery 2009-10 Appendix A 349
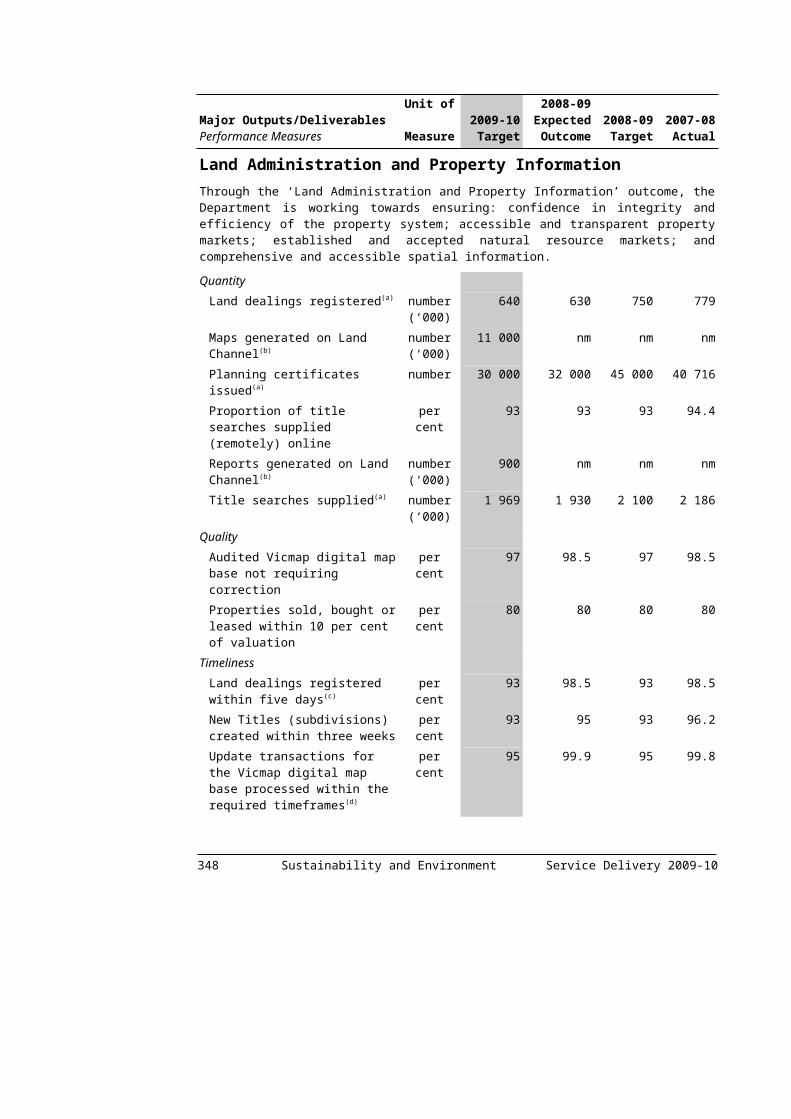
In addition, funding is provided for an additional 100 temporary beds across the prison system. These beds will provide additional capacity in the prison system prior to and following the opening of the new prison at Ararat. Funds are also committed to refurbish existing double bunks and temporary accommodation in the prison system to extend their life.
This initiative contributes to the Department of Justice’s Prisoner Supervision and Support output.
Court Integrated Services ProgramFunding is provided to continue reform of court processes at Melbourne, Sunshine and Latrobe Valley (Morwell) Magistrates’ courts, to better respond to defendants with multiple and complex problems. The program focuses on early intervention and diversion to reduce re-offending through targeted intervention, priority access to treatment and support services and case management services.
This initiative contributes to the Department of Justice’s Court Matters and Dispute Resolution output.
Gambling Licences ReviewFunding is provided to award new keno, wagering and gaming machine venue and monitoring licences, and for the transition to the new venue operated gaming machine model by 1 July 2012. This will ensure an open and transparent awarding of the licences in early 2010, and allow for adequate supervision, regulation and education of venue operators during the transition phase.
This initiative contributes to the Department of Justice’s Gaming and Racing Management and Regulation output.
Graffiti Prevention and Removal Strategy This initiative will continue and build on the Government’s Graffiti Prevention and Removal Strategy, through a range of graffiti clean up and prevention programs.
This initiative contributes to the Department of Justice’s Community Safety and Crime Prevention output.
Investing in Victoria’s Asset Confiscation SchemeFunding is provided for the continuation of the Asset Confiscation Scheme, which provides for the confiscation of proceeds of crime. This will contribute to the disruption, disabling and deterrence of serious and organised crime.
This initiative contributes to the Department of Justice’s Policing Services output.
350 Appendix A Service Delivery 2009-10

Multicultural Water Safety ProgramThe partnership between the Government, Life Saving Victoria and the community on water safety issues has demonstrated considerable success with Victoria having the lowest drowning toll per 100 000 head of population for any state in Australia. Despite this success, there have been a number of recent drowning incidents involving culturally and linguistically diverse communities. This initiative will continue water safety awareness programs aimed at multi cultural communities, to prevent future tragedies.
This initiative contributes to the Department of Justice’s Emergency Management Capability output.
Neighbourhood Justice CentreThis initiative will continue the Neighbourhood Justice Centre at Collingwood, including its restorative justice, mediation, and crime prevention programs. The Neighbourhood Justice Centre trials new approaches to delivering justice to disadvantaged communities and will contribute to reform in the Victorian justice system.
This initiative contributes to the Department of Justice’s Court Matters and Dispute Resolution output.
Reducing Court Delays – Supreme Court Accelerated Appointment of Judges Funding is provided for the Supreme Court of Victoria to accelerate the appointment of three additional judicial officers, in order to reduce trial delays. The revised profiling will effectively bring forward these appointments by one year.
This initiative contributes to the Department of Justice’s Public Prosecutions, Court Matters and Dispute Resolution, Prisoner Supervision and Support outputs.
Road Safety Initiatives Funding is provided for road safety initiatives to assist in reducing the impact of road trauma on the Victorian community. Initiatives include enhanced enforcement of speed restrictions, including the extension of moving mode radar technology, increasing the number of drug driving tests by 20 000 a year, renewal of breathalyser equipment, extending the vehicle impoundment scheme, and continued funding for the investigation of major collisions and drink driving testing. These initiatives will assist in reducing road trauma, as set out in Victoria’s road safety strategy, Arrive Alive 2.
These initiatives contribute to the Department of Justice’s Policing Services and Infringement and Orders Management outputs.
Sentencing Advisory CouncilFunding is provided for continuation of the Sentencing Advisory Council which provides advice, research, education and information to Government, the Attorney-General, the community and the courts in sentencing matters.
This initiative contributes to the Department of Justice’s Court Matters and Dispute Resolution output.
Service Delivery 2009-10 Appendix A 351

Supporting Courts to Address Family ViolenceThis initiative will continue the Family Violence Court Divisions operating at the Ballarat and Heidelberg Magistrates’ Court. This will continue the Government’s commitment to an integrated service system response to address family violence in Victoria.
This initiative contributes to the Department of Justice’s Court Matters and Dispute Resolution output.
Victoria Legal AidThis initiative will support Victoria Legal Aid to provide accessible legal representation and duty lawyer services to the community.
This initiative contributes to the Department of Justice’s Supporting the Judicial Process output.
Victoria Police Accommodation RefurbishmentFunding is provided for refurbishment of Victoria Police accommodation at the World Trade Centre.
This initiative contributes to the Department of Justice’s Policing Services output.
Victoria Police Physical Assets Building – Regional Police Stations ProgramFunding is provided for the replacement or upgrade of 10 police stations in rural and regional Victoria. This includes facilities at Castlemaine, Axedale, Buninyong, Koo Wee Rup, Pyalong, Balmoral, Riddells Creek, Korumburra, Lara, Mortlake and seed funding for South Melbourne and Prahran.
This initiative contributes to the Department of Justice’s Policing Services output.
Victoria Police – Safe Streets Funding is provided for Victoria Police to enhance the presence of operational police in the city of Melbourne on Friday and Saturday nights. This will accelerate recruitment of 50 new police officers provided for in the 2007-08 Budget.
This initiative contributes to the Department of Justice’s Policing Services output.
Victorian Electoral Commission – State By-Elections 2008-09Funding is provided to the Victorian Electoral Commission to support the Kororoit State by election.
This initiative contributes to the Department of Justice’s State Electoral Roll and Elections output.
352 Appendix A Service Delivery 2009-10

Victorian Racing Industry – Regional and Rural Infrastructure FundingFunding is provided to improve race tracks across Victoria in order to assist in securing the long term future of Victoria's racing industry. The infrastructure improvements will be spread across a number of rural and regional tracks, focusing on the areas of occupational health and safety, water saving and racing infrastructure development.
This initiative contributes to the Department of Justice’s Gaming and Racing Management and Regulation output.
Victorian Transport PlanTransit Safety InitiativeFunding is provided to boost safety on the public transport network by providing for an additional 50 transit police. This funding is aimed at making travel on trains and trams safer, especially at night, and will allow for increased security and more targeted patrols, and operations.
This is a Victorian Transport Plan initiative and contributes to the Department of Justice’s Policing Services output.
Asset initiatives
Table A.10: Asset initiatives – Justice($ million)
2008-09 2009-10 2010-11 2011-12 2012-13 TEICorrections Demand
Management Strategy.. 6.0 14.0 4.5 .. 24.5
Road Safety Initiatives .. 24.9 1.6 1.6 .. 28.2Victoria Police Physical Assets
Building – Regional Police Stations Program
.. 7.8 6.0 10.0 3.7 27.5
Sub-total asset initiatives .. 38.7 21.6 16.1 3.7 80.2Government-wide initiatives .. 38.4 6.7 .. .. 45.1Total asset initiatives .. 77.1 28.3 16.1 3.7 125.3Source: Department of Treasury and Finance
Numbers have been rounded to the nearest $100 000 for presentation purposes.
Corrections Demand Management Strategy Refer to the output initiative for a description of this initiative.
Road Safety InitiativesRefer to the output initiative for a description of this initiative.
Victoria Police Physical Assets Building – Regional Police Stations ProgramRefer to the output initiative for a description of this initiative.
Service Delivery 2009-10 Appendix A 353

Planning and Community Development
Output initiatives
Table A.11: Output initiatives – Planning and Community Development($ million)
2008-09 2009-10 2010-11 2011-12 2012-13Aboriginal Land and Economic
Development Program.. 0.8 .. .. ..
Broadmeadows Central Activities District – Main St Extension
0.5 .. .. .. ..
Community Facilities: Supporting Growing Communities
.. 3.5 8.1 .. ..
Country Football and Netball Grants .. 0.6 0.6 .. ..Creating Better Places and Expert
Assistance Programs.. 3.6 2.2 .. ..
Development Assessment Committees .. 1.0 1.0 .. ..Development Facilitation for Strategic
Priority Projects.. 1.0 1.0 0.7 0.6
Diamond Creek Multipurpose Stadium .. 1.0 .. .. ..Extension of Coordination Hours for
Neighbourhood Houses.. 0.8 0.9 1.0 1.0
Facilitating Planning Approval for Projects Involving Aboriginal Heritage Issues
.. 0.5 0.5 .. ..
Improving Major Sports Precincts (Albert Park and Royal Park)
.. 1.5 1.5 1.5 ..
Improving Soccer Facilities .. 2.1 2.1 1.5 ..Indigenous Leadership and Capacity
Building.. 0.7 .. .. ..
Men's Sheds .. 1.0 1.0 .. ..Our Club, Our Future Sporting Uniform
Grants.. 0.8 0.8 .. ..
Ringwood Central Activities District – Stage 1 (a)
0.2 0.4 0.6 .. ..
Rural Women's Network .. 0.3 0.3 .. ..Services to Stolen Generations Members .. 1.5 1.5 1.6 1.6Shrine of Remembrance .. 0.8 0.8 0.8 0.8Statewide Electronic Planning
Applications Online.. 0.8 0.9 0.9 0.9
Targeted Urban Renewal Program (a) 2.0 3.0 .. .. ..Victoria's Heritage – Strengthening our
Communities.. 1.0 .. .. ..
Victorian Veterans Sector Study – Government Response
.. 0.4 0.4 0.4 0.4
Volunteering – Active and Engaged Young People and Communities
.. 4.1 5.3 .. ..
Werribee Employment Precinct 0.4 .. .. .. ..Women's Leadership Program (b) .. 0.3 0.3 .. ..Victorian Transport PlanBroadmeadows Central Activities District .. .. 3.7 .. ..Sub-total output initiatives 3.1 31.4 33.4 8.3 5.2
354 Appendix A Service Delivery 2009-10
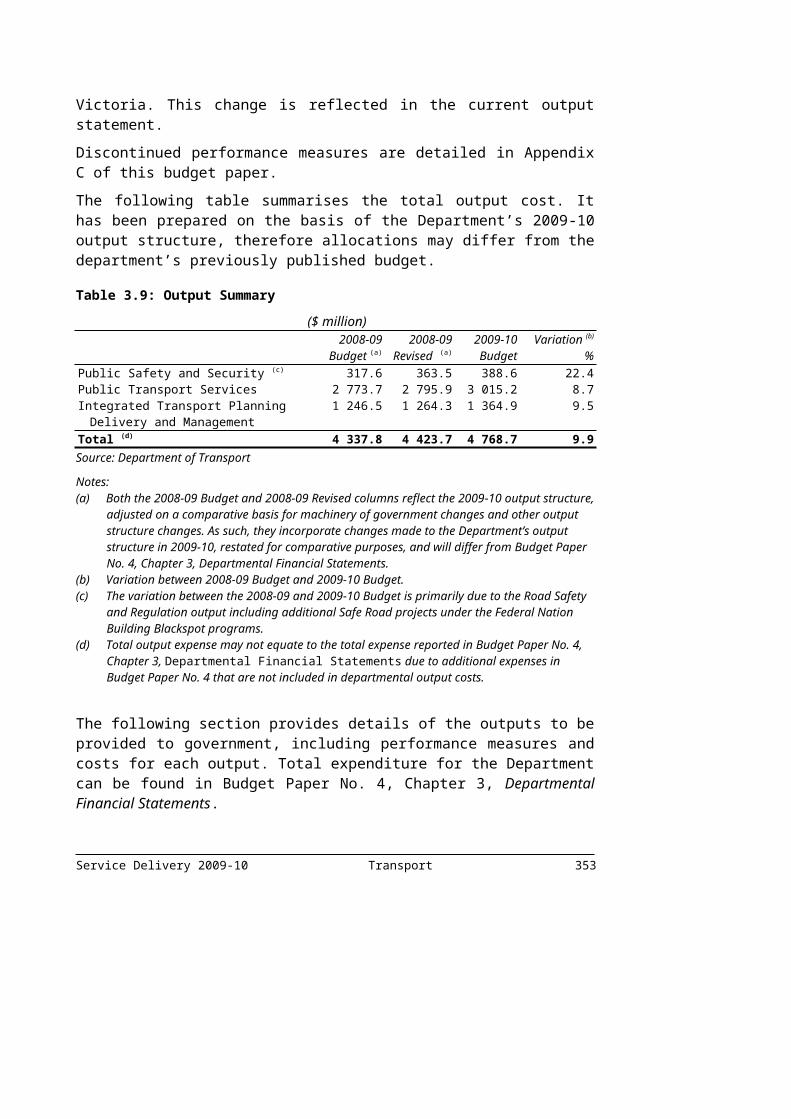
Government-wide initiatives 8.0 5.5 2.8 3.8 1.0
Service Delivery 2009-10 Appendix A 355
Table A.11: Output initiatives – Planning and Community Development (continued)
($ million) 2008-09 2009-10 2010-11 2011-12 2012-13EfficienciesGeneral efficiencies .. - 3.0 - 4.5 - 6.0 - 6.0Drought Savings - 3.3 .. .. .. ..Total output initiatives 7.8 33.9 31.6 6.1 0.2Source: Department of Treasury and Finance
Numbers have been rounded to the nearest $100 000 for presentation purposes.Notes:(a) These initiatives were previously reported in the 2008-09 Budget Update.(b) Funding for this initiative is $0.25 million in 2009-10 and 2010-11. The figures reported in the table
are rounded to one decimal place.
Aboriginal Land and Economic Development Program Funding is provided for the continuation of the Aboriginal Land and Economic Development Program. The program aims to increase Indigenous involvement in the economy through the development of community enterprises and other initiatives.
The Government is preparing the Victorian Indigenous Economic Development Strategy and this will inform future activities across Government.
This initiative contributes to the Department of Planning and Community Development’s Indigenous Community and Cultural Development output.
Broadmeadows Central Activities District – Main St ExtensionFunding is provided for an access road to the new senior campus of the Hume Central Secondary College. The access road will extend Main Street between Dimboola Avenue and Pearcedale Parade, Broadmeadows.
This initiative contributes to the Department of Planning and Community Development's Planning output.
Community Facilities: Supporting Growing CommunitiesFunding is provided to address the demand for community facilities including bushfire affected communities and those facing rapid population growth. Funding extends existing grant programs to provide community amenities and infrastructure comprised of Community Facilities (such as Libraries, Neighbourhood Houses, and Community Centres).
This initiative contributes to the Department of Planning and Community Development’s Community Development output.
356 Appendix A Service Delivery 2009-10
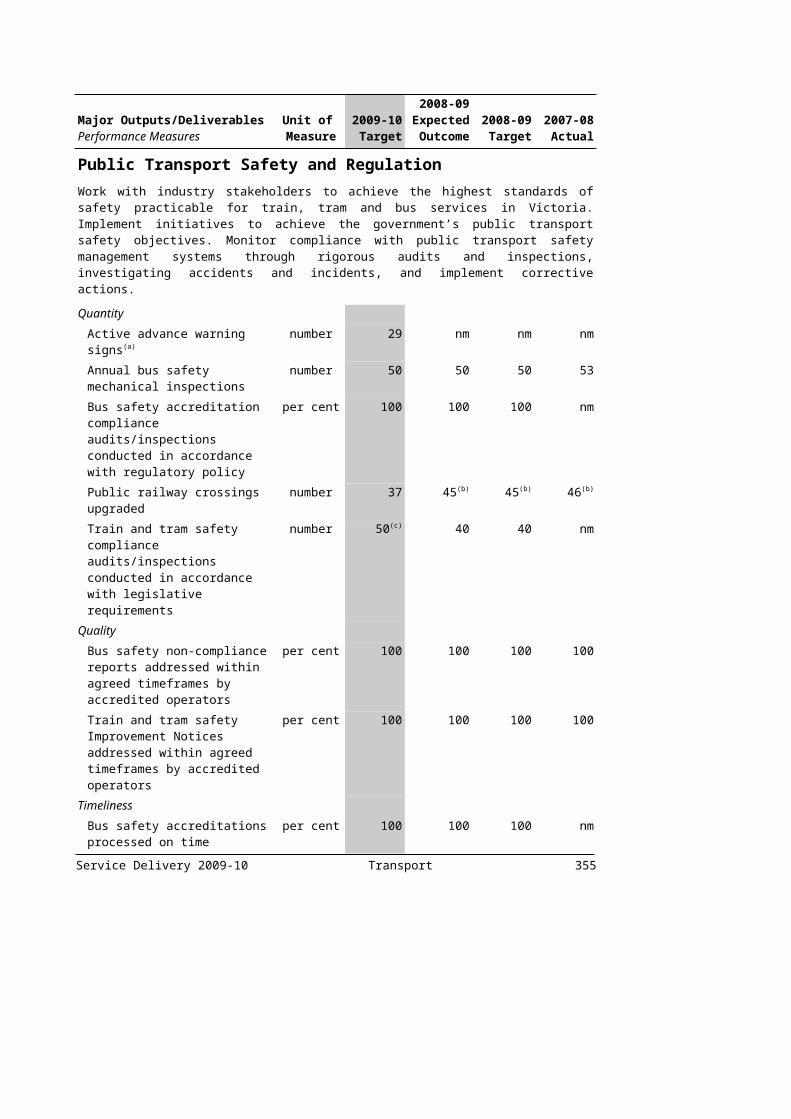
Country Football and Netball GrantsThis initiative seeks to increase the level of support to country football and netball clubs and umpiring organisations to develop facilities.
This initiative contributes to the Department of Planning and Community Development’s Sport and Recreation Development output.
Creating Better Places and Expert Assistance ProgramsFunding is provided to directly assist local councils in the planning and development of metropolitan activity centres and certain regional centres and towns. Funding is also provided for capital works projects as well as assistance to complete structure plans and the employment of place managers.
This initiative contributes to the Department of Planning and Community Development’s Planning output.
Development Assessment CommitteesFunding is provided to establish Development Assessment Committees (DACs), which will provide a decision-making process where State and local governments make collective planning decisions in areas and matters of shared State, regional, metropolitan and local government significance.
This initiative contributes to the Department of Planning and Community Development’s Planning output.
Development Facilitation for Strategic Priority ProjectsThis initiative provides funding to support the Department of Planning and Community Development to facilitate projects of state and regional significance and to introduce reforms to fast-track key building projects.
This initiative contributes to the Department of Planning and Community Development’s Planning output.
Diamond Creek Multipurpose StadiumAdditional funding to support the development of the Diamond Creek Multipurpose Stadium.
This initiative contributes to the Department of Planning and Community Development’s Sport and Recreation Development output.
Extension of Coordination Hours for Neighbourhood HousesFunding is provided for additional coordination hours for Neighbourhood Houses and the Neighbourhood House Networks to deliver additional training, planning and operational support within each region. In addition, 33 new Neighbourhood Houses will be funded to ensure that they can sustain their work in the local communities.
This initiative contributes to the Department of Planning and Community Development’s Community Development output.
Service Delivery 2009-10 Appendix A 357
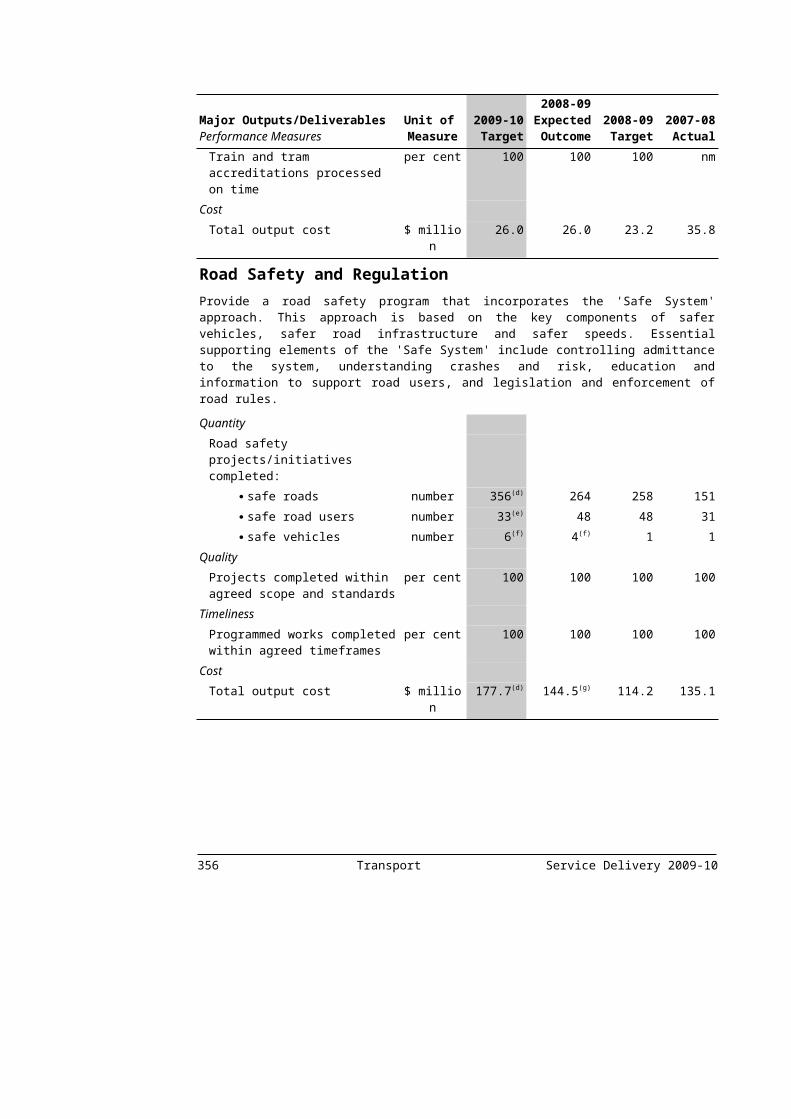
Facilitating Planning Approval for Projects Involving Aboriginal Heritage IssuesThis initiative will enhance the efficiencies gained under the Aboriginal Heritage Act 2006 by building the statutory capabilities of key Indigenous organisations, improving critical government management systems and creating positive partnerships with key stakeholders.
This initiative contributes to the Department of Planning and Community Development’s Indigenous Community and Cultural Development output.
Improving Major Sports Precincts (Albert Park and Royal Park)Funding is provided for the Melbourne Sports and Aquatic Centre and the State Netball and Hockey Centre to ensure that these facilities will continue to host major national and international sporting events.
This initiative contributes to the Department of Planning and Community Development’s Sport and Recreation Development output.
Improving Soccer FacilitiesFunding is provided to local communities to develop and upgrade soccer facilities, including pitches to cater for increased soccer participation in the community.
This initiative contributes to the Department of Planning and Community Development’s Sport and Recreation Development output.
Indigenous Leadership and Capacity BuildingFunding is provided for the continuation of the governance arrangements at Lake Tyers and the continuation of priority community leadership projects. The Government is preparing the Victorian Indigenous Leadership and Capacity Building Strategy, which will inform future Indigenous leadership and capacity building activities across government.
This initiative contributes to the Department of Planning and Community Development’s Indigenous Community and Cultural Development output.
Men’s ShedsThis initiative provides funding to expand the capital grants funding program for the construction of new Men’s Sheds. Grants are provided on an application basis to local community groups and organisations.
This initiative contributes to the Department of Planning and Community Development’s Community Development output.
Our Club, Our Future Sporting Uniform GrantsFunding is provided to allow one-off sporting uniform grants of up to $1 000 for grassroots sport and recreation clubs for a wide range of sporting uniforms and footwear.
This initiative contributes to the Department of Planning and Community Development’s Sport and Recreation Development output.
358 Appendix A Service Delivery 2009-10

Ringwood Central Activities District – Stage 1Funding is provided for the revitalisation of Ringwood’s town centre through the completion of a new town square, improved safety and pedestrian linkages around the Maroondah Highway including a new pedestrian crossing, a new bus interchange at the Ringwood railway station and further work to attract additional investment to the area.
This initiative contributes to the Department of Planning and Community Development’s Planning output.
Rural Women’s NetworkFunding is provided to ensure existing rural women’s community networks continue to operate and project workers are available to support a variety of programs.
This initiative contributes to the Department of Planning and Community Development’s Women’s Policy output.
Services to Stolen Generations MembersThis initiative provides funding to extend Stolen Generation Victoria. This includes support groups, referral to services such as counselling and working with mainstream agencies to improve coordination of services. Funding will also enable the Public Record Office Victoria to continue improving access to records and enable the Koori Heritage Trust to continue delivering the Koori Family History Service.
This initiative contributes to the Department of Planning and Community Development’s Indigenous Community and Cultural Development output.
Shrine of RemembranceFunding is provided to further support the ongoing operating costs for the Shrine of Remembrance, especially in respect to schools programs.
This initiative contributes to the Department of Planning and Community Development’s Seniors and Veterans output.
Statewide Electronic Planning Applications OnlineThis initiative will provide funding to make current paper-based planning applications in Victoria electronic and available online in order to reduce the time taken to process planning permits, and improve the clarity and certainty of the application process.
This initiative contributes to the Department of Planning and Community Development’s Planning output.
Targeted Urban Renewal Program Funding is provided for urban renewal activities, private investment facilitation, urban amenity improvements in market ready activity centres, and planning projects.
This initiative contributes to the Department of Planning and Community Development’s Planning output.
Service Delivery 2009-10 Appendix A 359

Victoria's Heritage – Strengthening Our CommunitiesFunding is provided for the implementation of the final year of the Government’s heritage strategy and grants program.
This initiative contributes to the Department of Planning and Community Development’s Planning output.
Victorian Veterans Sector Study – Government ResponseFunding is provided to act upon the recommendations of the Veterans Sector Study 2008, and develop resources to support ex-service organisations (ESOs) to respond to change, improve protection and conservation of veteran-related heritage, and enhance school education programs about Australia’s war-time history.
This initiative contributes to the Department of Planning and Community Development’s Seniors and Veterans output.
Volunteering – Active and Engaged Young People and CommunitiesFunding is provided to implement actions which will increase levels of formal and informal volunteering, targeting young people within a broader volunteering strategy and promote volunteering and participation as a way for young people to make a difference in their communities.
This initiative contributes to the Department of Planning and Community Development’s Community Development output.
Werribee Employment PrecinctFunding is provided for a Development Strategy that will outline the vision, potential governance options and identify a staged approach to development.
This initiative contributes to the Department of Planning and Community Development's Planning output.
Women’s Leadership ProgramFunding is provided to support women’s leadership and promote the participation of Victorian women in political and civic life.
This initiative contributes to the Department of Planning and Community Development’s Women’s Policy output.
Victorian Transport PlanBroadmeadows Central Activities District Funding is provided to accelerate the revitalisation of Broadmeadows’ Central Activities District by facilitating the development of affordable housing; undertaking feasibility studies; creation of a pedestrian and bike path; contributing to improved leisure facilities; and undertaking mobility and access improvements.
This is a Victorian Transport Plan initiative and contributes to the Department of Planning and Community Development’s Planning output.
360 Appendix A Service Delivery 2009-10
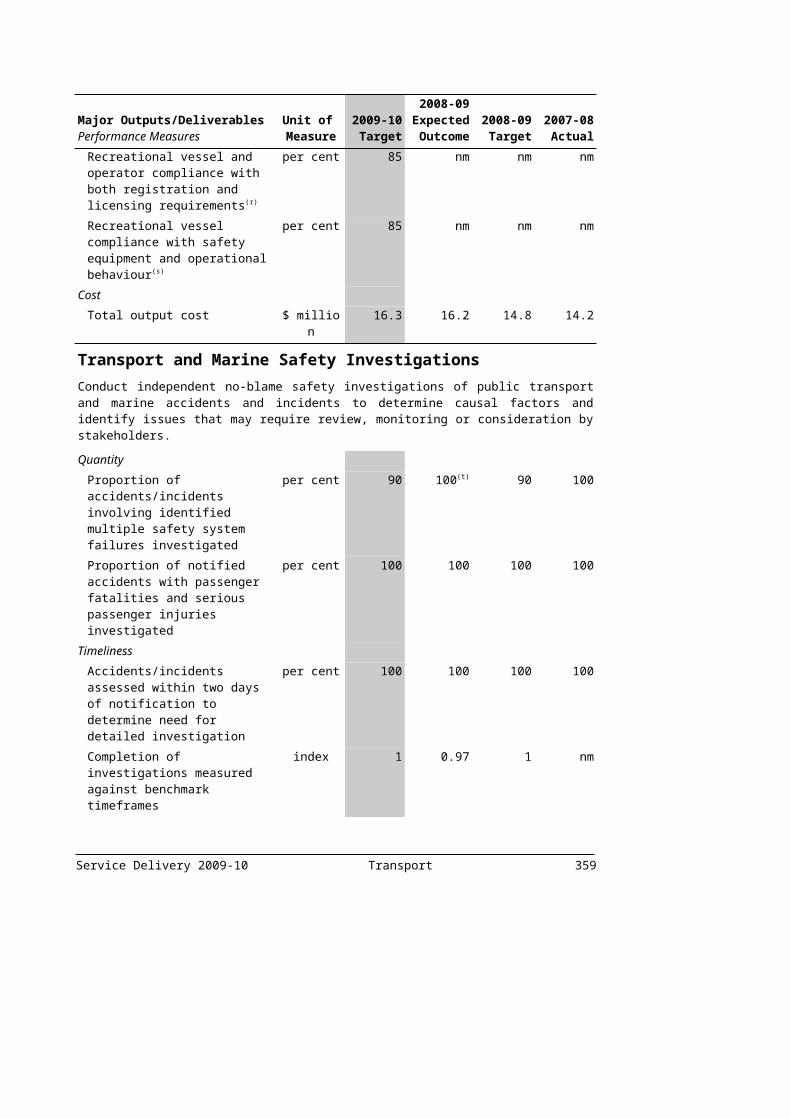
Asset initiatives
Table A.12: Asset initiatives – Planning and Community Development($ million)
2008-09 2009-10 2010-11 2011-12 2012-13 TEIAdult Community and Further
Education Building Maintenance Program
.. 0.5 0.5 0.5 0.5 2.0
Broadmeadows Central Activities District: Government Services Building
.. 0.4 8.5 6.8 1.7 17.4
Improving Major Sports Precincts (Albert Park and Royal Park)
.. 1.0 0.2 .. .. 1.2
Melbourne and Olympic Park Redevelopment
.. 5.0 .. .. .. 5.0
Ringwood Central Activities District – Stage 1 (a)
11.9 12.0 14.0 .. .. 37.9
State Basketball Centre .. 1.0 6.0 .. .. 7.0Statewide Electronic Planning
Applications Online.. 1.6 1.8 1.8 1.8 7.0
Victorian Transport PlanBroadmeadows Central
Activities District (b).. 2.5 9.5 17.6 18.7 59.2
Central Activities Districts and Employment Corridors
.. 1.1 8.0 5.6 4.9 19.7
Sub-total asset initiatives 11.9 25.1 48.5 32.3 27.6 156.4Government-wide initiatives .. .. .. .. .. ..Total asset initiatives 11.9 25.1 48.5 32.3 27.6 156.4Source: Department of Treasury and Finance
Numbers have been rounded to the nearest $100 000 for presentation purposes.Notes:(a) These initiatives were previously reported in the 2008-09 Budget Update.(b) The TEI for this initiative includes funding of $11.0 million beyond 2012-13.
Adult Community and Further Education Building Maintenance ProgramThis initiative provides funding for urgent capital upgrades to government-owned properties that are managed by Adult Community and Further Education (ACFE) and are leased to community-based providers for the delivery of adult education and training programs.
This initiative contributes to the Department of Planning and Community Development’s Adult and Community Further Education output.
Service Delivery 2009-10 Appendix A 361

Broadmeadows Central Activities District: Government Services BuildingFunding is provided for fitout costs for an office building and service centre in central Broadmeadows. The departments of Human Services, Justice and Education and Early Childhood Development will be co-located in the new building along with Centrelink to provide improved access to government services in the area.
This initiative contributes to the Department of Planning and Community Development’s Planning output.
Improving Major Sports Precincts (Albert Park and Royal Park)Refer to the output initiative for a description of this initiative.
Melbourne and Olympic Park RedevelopmentFunding is provided for further design work on the Melbourne Park Masterplan, to upgrade existing facilities and cater for increasing spectator growth, player needs, and broadcast and media requirements.
This initiative contributes to the Department of Planning and Community Development’s Sport and Recreation Development output.
Ringwood Central Activities District – Stage 1Refer to the output initiative for a description of this initiative.
State Basketball CentreFunding is provided to construct the State Basketball Centre at Knox. The new facility will become the new home of Basketball Victoria.
This initiative contributes to the Department of Planning and Community Development’s Sport and Recreation Development output.
Statewide Electronic Planning Applications OnlineRefer to the output initiative for a description of this initiative.
Victorian Transport PlanBroadmeadows Central Activities District Refer to the output initiative for a description of this initiative.
Central Activities Districts and Employment CorridorsFunding is provided for urban development strategies and scoping work for urban improvement projects in designated Central Activities Districts (Box Hill, Broadmeadows, Dandenong, Footscray, Frankston and Ringwood). Work will also be undertaken to increase employment opportunities along priority corridors linking the Central Activities Districts (CADs) with universities, research, technology and medical precincts and areas of high employment.
This is a Victorian Transport Plan initiative and contributes to the Department of Planning and Community Development’s Planning output.
362 Appendix A Service Delivery 2009-10

Premier and Cabinet
Output initiatives
Table A.13: Output initiatives – Premier and Cabinet($ million)
2008-09 2009-10 2010-11 2011-12 2012-13Arts Audience Expansion .. 0.3 0.3 .. ..Boosting Victoria’s Multicultural
Advantage – Community Harmony (a).. 1.0 1.0 .. ..
Maintaining the Strength of Victoria’s Cultural Agencies
.. 1.0 10.2 12.4 12.7
Office of Climate Change .. 1.9 2.0 .. ..Ombudsman Victoria Additional
Resources 0.5 0.5 0.5 0.5 0.5
Physical Theatre Development .. 0.5 .. .. ..Planning for the Restoration of Queen's
Hall, State Library of Victoria.. 1.0 .. .. ..
Public Record Office Victoria Support Plan
.. 0.8 0.8 0.8 0.9
Refugee Action Program (a) .. 1.0 1.0 .. ..Securing a Future for Victorian Opera .. 1.5 1.5 1.6 1.6Sub-total output initiatives 0.5 9.4 17.3 15.3 15.7Government-wide initiatives 76.7 49.0 .. .. ..EfficienciesGeneral efficiencies .. - 3.0 - 4.5 - 6.0 - 6.0Drought Savings - 3.3 .. .. .. ..Total output initiatives 73.8 55.4 12.8 9.3 9.7Source: Department of Treasury and Finance
Numbers have been rounded to the nearest $100 000 for presentation purposes.Note:(a) Includes funding from the Community Support Fund.
Arts Audience ExpansionFunding is provided to encourage new audiences to access arts and cultural events through marketing programs such as Test Drive the Arts and the Theatre Alive website.
This initiative contributes to the Department of Premier and Cabinet’s Arts Development and Access output.
Boosting Victoria’s Multicultural Advantage – Community Harmony
Funding is provided to continue a range of projects, including grants, aimed at harmonious relationships within the culturally diverse Victorian population. These include community education, training and mentoring for faith communities, women and youth, as well as further developing strategic partnerships with a range of organisations.
This initiative contributes to the Department of Premier and Cabinet’s Multicultural Affairs output.
Service Delivery 2009-10 Appendix A 363
Maintaining the Strength of Victoria’s Cultural Agencies Funding is provided to further enhance the strength and viability of Victoria’s arts and cultural agencies. This will include additional support for the State Library of Victoria, for the renewal of exhibitions at the three Museum Victoria campuses and maintenance and programming at the Victorian Arts Centre.
This initiative contributes to the Department of Premier and Cabinet’s Arts Portfolio Agencies output.
Office of Climate Change Funding is provided for the Office of Climate Change to continue the provision of strategic policy advice and projects in relation to climate change.
This initiative contributes to the Department of Premier and Cabinet’s Strategic Policy Advice and Projects output.
Ombudsman Victoria Additional Resources Increased funding for the Office of the Ombudsman will support additional in-house capacity to handle a higher level of complaints and public inquiries.
This initiative contributes to the Department of Premier and Cabinet’s Ombudsman Services output.
Physical Theatre DevelopmentFunding is provided to build on Victoria’s international reputation for innovative physical theatre.
This initiative contributes to the Department of Premier and Cabinet’s Arts Development and Access output.
Planning for the Restoration of Queen’s Hall, State Library of Victoria Funding will enable the completion of a detailed Master Plan for the restoration and future use of Queen’s Hall. The Master Plan will address specialist heritage, architectural and engineering requirements and include an updated business case.
This initiative contributes to the Department of Premier and Cabinet’s Arts Portfolio Agencies output.
Public Record Office Victoria Support Plan Funding is provided for the continued operation, maintenance and renewal of essential infrastructure at the Public Record Office Victoria, in North Melbourne. This includes asset and digital archive maintenance.
This initiative contributes to the Department of Premier and Cabinet’s Arts Portfolio Agencies output.
364 Appendix A Service Delivery 2009-10

Refugee Action ProgramFunding will continue the Refugee Action Program which aims to improve refugee access to mainstream services. Funding is also provided for a continued contribution to the Refugee Nursing Program.
This initiative contributes to the Department of Premier and Cabinet’s Multicultural Affairs output.Securing a Future for Victorian OperaThe increased funding will provide for an additional Victorian opera production, ensuring there are four locally produced professional opera productions per year.
This initiative contributes to the Department of Premier and Cabinet’s Arts Development and Access output.
Asset initiatives
Table A.14: Asset initiatives – Premier and Cabinet($ million)
2008-09 2009-10 2010-11 2011-12 2012-13 TEICultural Asset Maintenance
Fund 1.5 5.0 5.0 5.0 5.0 21.5
Geelong Performing Arts Centre Refurbishment
.. 2.0 1.0 .. .. 3.0
Government House Energy Management
.. 0.3 .. .. .. 0.3
Public Record Office Victoria Support Plan
.. 2.2 1.6 1.6 1.6 7.1
Southbank Cultural Precinct Redevelopment (a)
5.5 18.0 65.0 40.0 .. 128.5
Victorian Archive Centre Remedial Works (a)
1.4 2.0 .. .. .. 3.4
Sub-total asset initiatives 8.3 29.5 72.6 46.6 6.6 163.8Government-wide initiatives 2.8 .. .. .. .. 2.8Total asset initiatives 11.1 29.5 72.6 46.6 6.6 166.6Source: Department of Treasury and Finance
Numbers have been rounded to the nearest $100 000 for presentation purposes.Notes:(a) This initiative was previously reported in the 2008-09 Budget Update.
Cultural Asset Maintenance Fund Funding will continue for asset replacement and renewal costs of the State’s cultural facilities for special maintenance requirements. Funding will ensure that the cultural agencies continue to provide a safe and accessible environment for the delivery of cultural activities while preserving Victoria’s cultural heritage.
Service Delivery 2009-10 Appendix A 365
This initiative incorporates funding for critical works at the State Library of Victoria, the Royal Exhibition Building, the Immigration Museum and the Australian Centre for the Moving Image.
This initiative contributes to the Department of Premier and Cabinet’s Creating Place and Space output.
Geelong Performing Arts Centre RefurbishmentFunding is provided to upgrade and improve facilities of the Ford Theatre, the main performing space, and associated rehearsal spaces, at the Geelong Performing Arts Centre.
This initiative contributes to the Department of Premier and Cabinet’s Creating Place and Space output.
Government House Energy ManagementFunding is provided for roof insulation at Victoria’s Government House to reduce the energy consumption and improve the thermal performance of the building.
This initiative contributes to the Department of Premier and Cabinet’s Advice and Support to the Governor output.
Public Record Office Victoria Support Plan Refer to the output initiative for a further description of this initiative.
Southbank Cultural Precinct Redevelopment Funding is provided for the refurbishment of Hamer Hall – Victorian Arts Centre, including improved acoustics, staging systems and new auditorium seating as well as new and expanded foyer spaces, improved access to the Yarra River and more sustainable power generation and waste management.
This funding contributes to the Department of Premier and Cabinet’s Creating Place and Space output.
Victorian Archive Centre Remedial Works Funding is provided to remediate and repair the Victorian Archive Centre, North Melbourne, which houses Victoria’s archive and arts collection. The works will address flaws in the building structure and its sprinkler systems.
This initiative contributes to the Department of Premier and Cabinet’s Arts Portfolio Agencies output.
366 Appendix A Service Delivery 2009-10
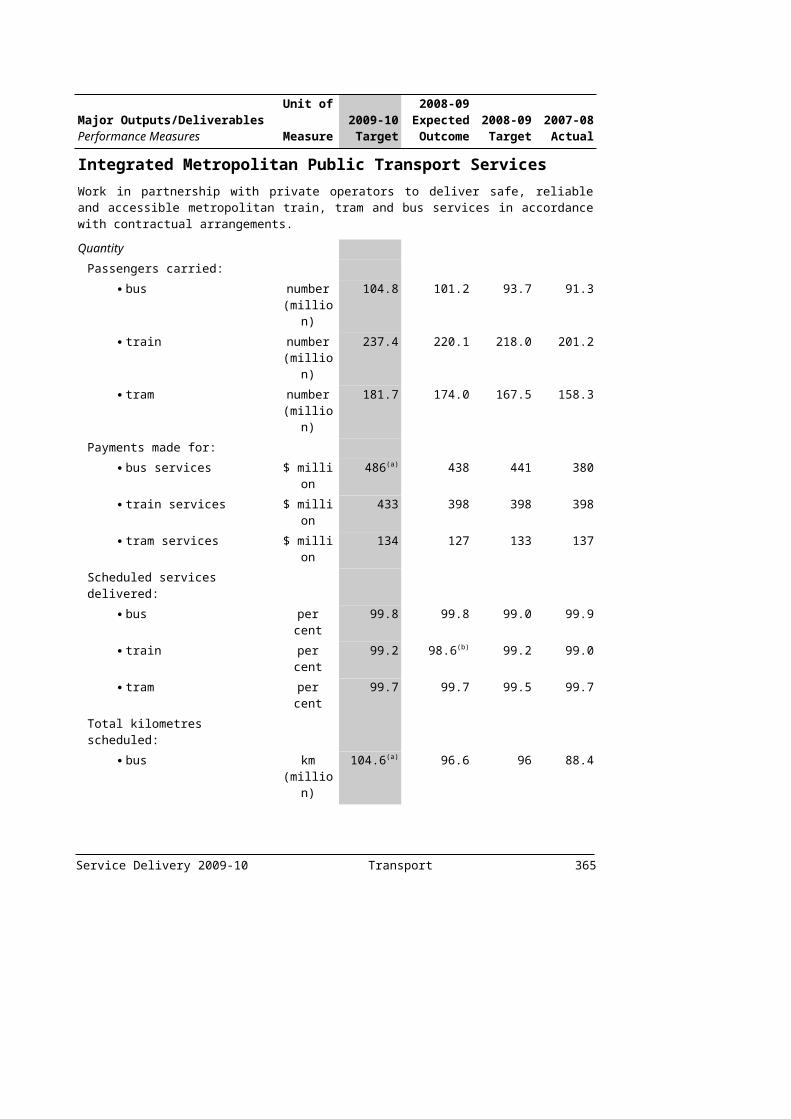
Primary Industries
Output initiatives
Table A.15: Output initiatives – Primary Industries($ million)
2008-09 2009-10 2010-11 2011-12 2012-13Fruit Fly Eradication (a) 3.5 .. .. .. ..Government Response to the Mining
Warden Inquiry into the Yallourn Mine Batter Failure
0.7 2.5 2.6 2.6 2.7
Large-Scale Solar Energy Generation (b) .. 0.6 0.4 .. ..Locust Control (a) 7.2 .. .. .. ..Management of Potato Cyst Nematode 1.9 .. .. .. ..National Energy Market Reform 0.3 1.9 2.0 2.2 2.4Victorian Transport PlanGippsland Regional Infrastructure
Development.. 1.0 .. .. ..
Sub-total output initiatives 13.6 6.0 5.0 4.8 5.1Government-wide initiatives 67.0 0.5 .. .. ..EfficienciesGeneral efficiencies .. - 3.0 - 4.5 - 6.0 - 6.0Drought Savings - 3.3 .. .. .. ..Total output initiatives 77.3 3.5 0.5 - 1.2 - 0.9Source: Department of Treasury and Finance
Numbers have been rounded to the nearest $100 000 for presentation purposes.Notes:(a) These initiatives were previously reported in the 2008-09 Budget Update.(b) Total funding for this initiative is $100 million net present value, to be allocated beyond 2012-13.
Fruit Fly EradicationFunding is provided to implement fruit fly monitoring, fruit tree inspection, spraying, baiting, fruit stripping and ground treatment to eradicate fruit fly outbreaks in northern Victoria and metropolitan Melbourne.
This initiative contributes to the Department of Primary Industries’ Regulation and Compliance output.
Government Response to the Mining Warden Inquiry into the Yallourn Mine Batter FailureFunding is provided to implement initiatives to improve the level of geotechnical expertise within the mining industry, as outlined in the Government Response to the Mining Warden Inquiry into the Yallourn Mine Batter Failure.
This initiative contributes to the Department of Primary Industries’ Regulation and Compliance output.
Service Delivery 2009-10 Appendix A 367
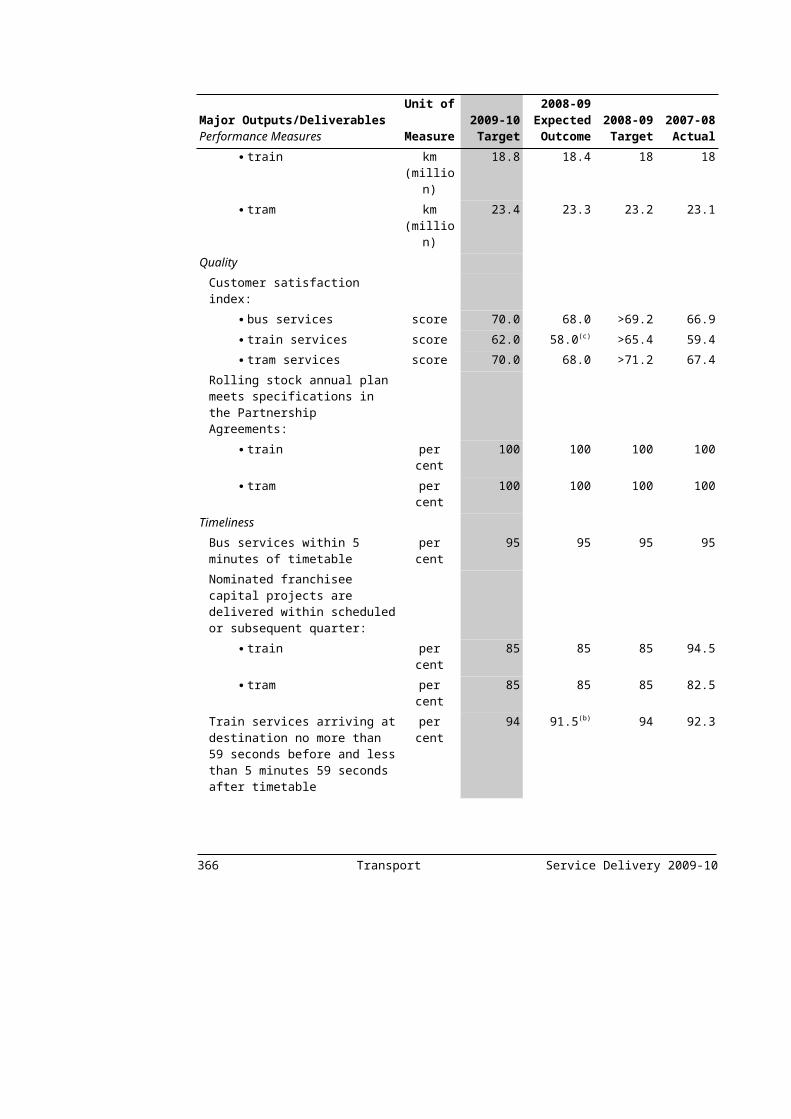
Large-Scale Solar Energy GenerationFunding is provided to facilitate the development of a new large-scale solar power station in Victoria subject to a matching contribution from the Commonwealth Government’s Renewable Energy Demonstration Program. The project will deliver low emissions electricity to run up to 50 000 homes and diversify Victoria’s renewable energy supply. Funding allocated in the short-term will enable DPI to undertake project management activities, including a tender evaluation process.
This initiative contributes to the Department of Primary Industries’ Primary Industries Policy output.
Locust ControlFunding is provided for locust control activities in northern Victoria to minimise damage to pastures, cereal and horticulture crops.
This initiative contributes to the Department of Primary Industries’ Regulation and Compliance output.
Management of Potato Cyst NematodeFunding is allocated to conduct extensive soil sampling and establish controls to limit the spread of potato cyst nematode following its detection during routine testing near Thorpdale in October 2008. Potato cyst nematode is a microscopic, worm-like organism that feeds on the roots of potatoes, tomatoes and other plants of the Solanaceae family.
This initiative contributes to the Department of Primary Industries’ Regulation and Compliance output.
National Energy Market ReformFunding is provided to meet Victoria’s share of the operating costs of the Australian Energy Market Commission and to support the work of the Council of Australian Governments’ Ministerial Council on Energy.
This initiative contributes to the Department of Primary Industries’ Primary Industries Policy output.
Victorian Transport PlanGippsland Regional Infrastructure DevelopmentFunding is provided to identify road, rail and port infrastructure investments required to support the growth of major coal-based industries in regional Victoria. This will position Victoria to capitalise on future opportunities from coal, including significant capital investment, export returns and regional employment.
This is a Victorian Transport Plan initiative and contributes to the Department of Primary Industries’ Primary Industries Policy output.
368 Appendix A Service Delivery 2009-10
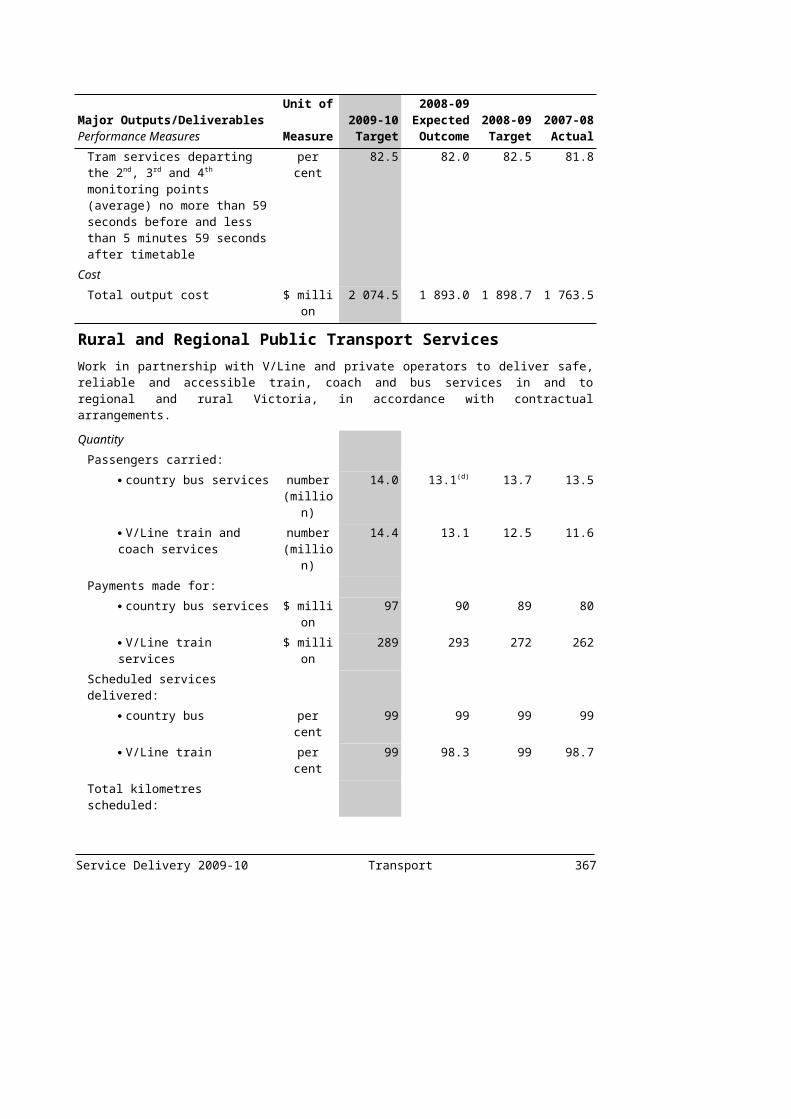
Sustainability and Environment
Output initiatives
Table A.17: Output initiatives – Sustainability and Environment($ million)
2008-09 2009-10 2010-11 2011-12 2012-13Murray-Darling Basin Authority .. 0.3 .. .. ..Point Nepean Quarantine Station .. 1.0 1.0 1.0 1.0River Red Gums .. 7.7 8.6 8.8 6.9Wildlife Shelter Capital Grants 0.4 0.3 0.3 .. ..Yarra Bend Park .. 0.5 0.5 0.5 0.5Sub-total output initiatives 0.4 9.8 10.4 10.3 8.4Government-wide initiatives 432.3 10.6 11.5 11.7 11.9EfficienciesGeneral efficiencies .. - 6.0 - 9.0 - 12.0 - 12.0Drought Savings - 3.3 .. .. .. ..Total output initiatives 429.3 14.4 12.8 9.9 8.3Source: Department of Treasury and Finance
Numbers have been rounded to the nearest $100 000 for presentation purposes.
Murray-Darling Basin AuthorityFunding is provided to meet Victoria’s contribution towards works commissioned by the Murray-Darling Basin Authority to promote and coordinate effective planning and management for the equitable, efficient and sustainable use of water, land and other environmental resources of the Murray-Darling Basin.
This initiative contributes to the Department of Sustainability and Environment’s Sustainable Water Management and Supply output.
Point Nepean Quarantine StationFunding is provided for works following the integration of the Point Nepean Quarantine Station into the Point Nepean National Park. The works will open the site of the Quarantine Station to the community, providing recreational and tourism benefits for Victoria.
This initiative contributes to the Department of Sustainability and Environment’s Forests and Parks output.
River Red GumsThis initiative provides funding for the establishment of four new National Parks and the expansion of existing National Parks for the purpose of protecting stressed River Red Gum forests. These parks will ensure that a total of 160 000 hectares of River Red Gum forest will be protected in Victoria’s Murray, Goulburn and Ovens Rivers corridor.
This initiative contributes to the Department of Sustainability and Environment’s Forests and Parks output.
Service Delivery 2009-10 Appendix A 369

Wildlife Shelter Capital GrantsFunding is provided to continue the successful Wildlife Shelter grants program for a further two years. This program assists accredited wildlife carers and shelters to cover the cost of infrastructure and caring for injured wildlife.
This initiative contributes to the Department of Sustainability and Environment's Biodiversity output.
Yarra Bend ParkThis initiative will maintain and improve Yarra Bend Park’s existing infrastructure and conservation areas, and assist with implementing the long term strategy plan for the Park which is currently being developed. This initiative will ensure the Park’s long term sustainability and the availability of this important Melbourne asset to the public.
This initiative contributes to the Department of Sustainability and Environment’s Forest and Parks output.
Asset initiatives
Table A.18: Asset initiatives – Sustainability and Environment($ million)
2008-09 2009-10 2010-11 2011-12 2012-13 TEIBays and Maritime Capital Works
Program.. 2.0 2.0 .. .. 4.0
Frankston Reservoir Park / Dingley Chain of Parks – Extension of Trail
.. 1.0 1.0 .. .. 2.0
New Outer Urban Parks .. 1.0 1.0 .. .. 2.0Point Nepean Quarantine Station .. 10.0 .. .. .. 10.0River Red Gums .. .. 0.3 2.4 3.8 6.5Sub-total asset initiatives .. 14.0 4.3 2.4 3.8 24.5Government-wide initiatives 1.0 4.0 16.0 13.5 .. 34.5Total asset initiatives 1.0 18.0 20.3 15.9 3.8 59.0Source: Department of Treasury and Finance
Numbers have been rounded to the nearest $100 000 for presentation purposes.
Bays and Maritime Capital Works ProgramThis initiative will continue a capital works program around Port Phillip Bay which will upgrade piers, jetties and other infrastructure to extend their useful lives, enhance community access and improve environmental outcomes.
This initiative contributes to the Department of Sustainability and Environment’s Forests and Parks output.
370 Appendix A Service Delivery 2009-10

Frankston Reservoir Park / Dingley Chain of Parks – Extension of TrailFunding is provided to undertake additional works at the Frankston Reservoir park following the completion of a management plan in late 2009. This initiative will also advance the linking of Braeside and Karkarook parks by establishing a bike trail.
This initiative contributes to the Department of Sustainability and Environment’s Forest and Parks output.
New Outer Urban ParksFunding is provided to undertake priority works at six outer urban parks including Tarneit, Melton, Yan Yean and Narre Warren, creating new recreational opportunities for the community.
This initiative contributes to the Department of Sustainability and Environment’s Forest and Parks output.
Point Nepean Quarantine StationRefer to the output initiative for a description of this initiative.
River Red GumsRefer to the output initiative for a description of this initiative.
Transport
Output initiatives
Table A.19: Output initiatives – Transport($ million)
2008-09 2009-10 2010-11 2011-12 2012-13Victorian Transport PlanBetter Roads – Regional Victoria
Development.. .. .. 0.1 0.1
Carpooling Initiatives .. 1.5 1.5 1.2 1.2Dingley Arterial .. .. .. .. 0.4Doncaster Area Rapid Transit .. .. 15.0 27.2 28.4Greater Geelong Enhanced Bus
Improvement Package .. 2.9 3.8 4.7 5.7
Improving Train Operations – Rail Service Efficiencies
.. 3.8 3.9 5.3 7.5
Increased Utilisation of Low Emission Vehicles
.. 0.5 1.5 1.1 1.1
Maintenance Funding for Roads .. 22.6 .. .. ..Maryborough Rail Services .. .. 2.8 2.8 2.9Metropolitan Bus Improvements Program .. 9.0 14.6 15.2 15.9Metropolitan Station and Modal
Interchange Upgrade Program.. 0.3 0.5 0.8 1.1
Nation Building Program (Auslink II) – Roads
.. .. 0.2 0.3 0.6
New Stations in Growth Areas .. .. .. 0.2 1.6New X’trapolis Trains .. 0.4 8.7 15.8 16.2Noise Walls .. .. .. 1.1 1.1Service Delivery 2009-10 Appendix A 371
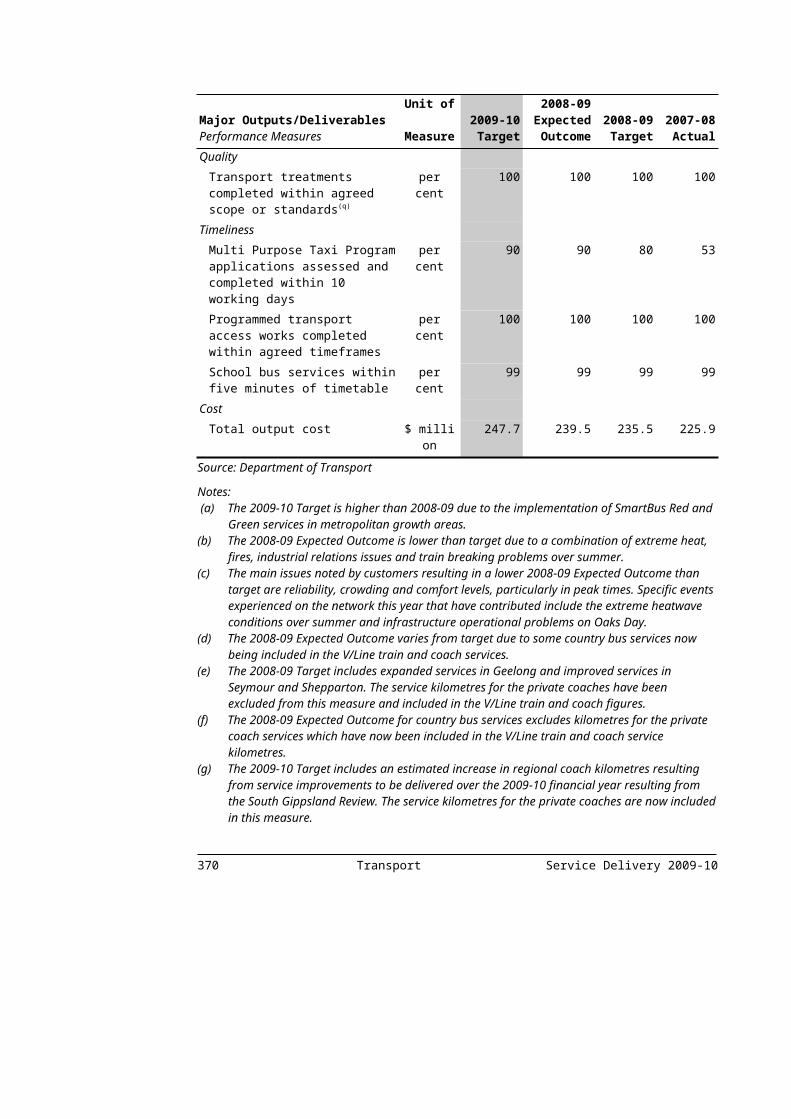
Table A.19: Output initiatives – Transport (continued)($ million)
2008-09 2009-10 2010-11 2011-12 2012-13Outer Suburban Arterial Roads Program .. .. .. .. 0.2Peninsula Link .. .. .. .. 2.6Public Bicycle Hire Scheme .. 0.7 1.4 1.4 1.5Regional Rail Freight Network Program .. 11.7 12.0 12.3 12.6Regional Station and Modal Interchange
Upgrade Program.. .. .. .. 0.1
Separating Road and Rail Lines .. .. 0.2 0.3 0.3SmartBus – Yellow Orbital Stage 2 .. .. 10.2 18.5 19.3South Morang Rail Extension .. .. .. .. 3.2Sunbury Electrification .. .. .. 3.2 7.0Nation Building – Economic Stimulus
Plan – Transport (a) 11.0 34.2 .. .. ..
New Ticketing Solution (b) 13.7 49.9 45.8 11.1 ..North East Rail Revitalisation (b) 13.9 6.0 5.2 5.4 5.5Regional Rolling Stock (b) .. .. 2.5 7.4 11.1Sub-total output initiatives 38.6 143.5 129.9 135.3 147.1Government-wide initiatives 15.7 0.7 0.7 .. ..EfficienciesGeneral efficiencies .. - 15.0 - 22.5 - 30.0 - 30.0Drought Savings - 5.0 .. .. .. ..Total output initiatives 49.3 129.2 108.1 105.3 117.1Source: Department of Treasury and Finance
Numbers have been rounded to the nearest $100 000 for presentation purposes.Notes:(a) Funding is announced for Victoria as part of the Commonwealth's Nation Building – Economic
Stimulus Plan.(b) These initiatives were previously reported in the 2008-09 Budget Update.
Victorian Transport PlanBetter Roads – Regional Victoria DevelopmentFunding is provided to improve road conditions and capacity in regional Victoria.
This is a Victorian Transport Plan initiative and contributes to the Department of Transport’s Road Network Improvements output.
Carpooling InitiativesFunding is provided to implement a program of initiatives to encourage changes in travel behaviour.
This is a Victorian Transport Plan initiative and contributes to the Department of Transport’s Integrated and Sustainable Transport Development output.
372 Appendix A Service Delivery 2009-10
Dingley ArterialThis initiative will construct a new 3.5 kilometre arterial road between Perry Road and Springvale Road to link new residential growth areas to employment opportunities, and serve as an east-west route for motorists and freight operators.
This is a Victorian Transport Plan initiative and contributes to the Department of Transport’s Road Network Improvements output.
Doncaster Area Rapid TransitFunding is provided to deliver a premium bus service between Manningham and Melbourne’s Central Business District. The Doncaster Area Rapid Transit project will upgrade four existing bus routes providing bus priority treatments, upgraded bus stops, improved service frequency and an increased span of operational hours, in order to improve access to public transport in this region.
This is a Victorian Transport Plan initiative and contributes to the Department of Transport’s Integrated Metropolitan Public Transport Services output.
Greater Geelong Enhanced Bus Improvement PackageFunding is provided to expand bus services in Greater Geelong and the Bellarine Peninsula. The package will increase bus operating hours and frequency, and additional services will be added to growth areas. A new bus interchange will be built in the Geelong CBD to improve amenity and interconnections.
This is a Victorian Transport Plan initiative and contributes to the Department of Transport’s Rural and Regional Public Transport Services output.
Improving Train Operations – Rail Service EfficienciesFunding is provided for a program to continuously improve the reliability and capacity of rail services across Melbourne, including the upgrading of train and tram control and monitoring systems.
This is a Victorian Transport Plan initiative and contributes to the Department of Transport’s Integrated Metropolitan Public Transport Services, Rural and Regional Public Transport Services and Public Transport Infrastructure Development outputs.
Increased Utilisation of Low Emission VehiclesFunding is provided to increase the utilisation of low emission vehicles in Victoria through mandatory carbon emissions targets for government fleets and supporting corporate fleets to reduce their carbon intensity.
This is a Victorian Transport Plan initiative and contributes to the Department of Transport’s Integrated and Sustainable Transport Development output.
Maintenance Funding for RoadsFunding is provided to repair and maintain Victoria’s road infrastructure.
This is a Victorian Transport Plan initiative and contributes to the Department of Transport’s Road Asset Management output.
Service Delivery 2009-10 Appendix A 373

Maryborough Rail ServicesThis initiative provides funding for the introduction of a rail passenger service to Maryborough. The rail service will provide a daily service from Maryborough/Creswick to Ballarat and Melbourne and return.
This is a Victorian Transport Plan initiative and contributes to the Department of Transport’s Rural and Regional Public Transport Services output.
Metropolitan Bus Improvements ProgramFunding is provided for expanded bus services in metropolitan Melbourne. The first stage of this initiative focuses on new and improved bus services in urban growth areas.
This is a Victorian Transport Plan initiative and contributes to the Department of Transport’s Integrated Metropolitan Public Transport Services output.
Metropolitan Station and Modal Interchange Upgrade ProgramFunding is provided to upgrade train stations around metropolitan Melbourne. Upgrades will include improvements to customer amenities, improved bus interchanges and expanded taxi and car park facilities. Priority upgrades include Clifton Hill, Hoppers Crossing, Lilydale, Oakleigh and St Albans.
This is a Victorian Transport Plan initiative and contributes to the Department of Transport’s Integrated Metropolitan Public Transport Services output.
Nation Building Program (AusLink II) – RoadsFunding is allocated to road projects of national importance that are part funded by the Commonwealth Government under its Nation Building Program.
This is a Victorian Transport Plan initiative and contributes to the Department of Transport’s Road Network Improvements output.
New Stations in Growth AreasThis initiative provides funding to construct and operate new stations at Williams Landing, Lynbrook and Caroline Springs. Williams Landing will be a Premium Station.
This is a Victorian Transport Plan initiative and contributes to the Department of Transport’s Public Transport Infrastructure Development output.
New X’trapolis TrainsThis initiative will purchase a further 20 new X’trapolis trains for the metropolitan network. Funding has also been provided to construct new maintenance and stabling facilities to accommodate the new trains.
This is a Victorian Transport Plan initiative and contributes to the Department of Transport’s Integrated Metropolitan Public Transport Services output.
374 Appendix A Service Delivery 2009-10

Noise WallsThis initiative will retrofit sections of freeways and arterial roads with sound barriers to protect neighbouring homes from the noise created by passing vehicles.
This is a Victorian Transport Plan initiative and contributes to the Department of Transport’s Road Network Improvements output.
Outer Suburban Arterial Roads ProgramFunding is provided to improve the capacity and safety of roads in outer metropolitan Melbourne.
This is a Victorian Transport Plan initiative and contributes to the Department of Transport’s Road Network Improvements output.
Peninsula LinkThis initiative will construct a 25 kilometre four-lane connection between EastLink at Carrum Downs to the Mornington Peninsula Freeway at Mount Martha. It will unblock congestion in the Frankston area, while reducing the amount of traffic that needs to travel through Frankston City and other Peninsula towns, making these areas more attractive to pedestrians and cyclists, and allow development of Frankston as a Central Activities District. The project includes a walking and cycling path alongside the roadway.
Peninsula Link has a budgeted cost of $750 million under the Victorian Transport Plan. The State Government continues to work cooperatively with the Commonwealth Government to secure a funding contribution to deliver this initiative in partnership.
This is a Victorian Transport Plan initiative and contributes to the Department of Transport’s Road Network Improvements output.
Public Bicycle Hire SchemeFunding is provided for a public bicycle hire system in inner Melbourne. The scheme will involve around 50 bicycle stations, with approximately 600 bicycles for public hire. The stations will be situated around Melbourne’s key attractions, including Southbank and St Kilda Road.
This is a Victorian Transport Plan initiative and contributes to the Department of Transport’s Integrated and Sustainable Transport Development output.
Regional Rail Freight Network ProgramThis initiative provides funding for a program of annual recurrent maintenance and capital investment to ensure that the rehabilitated regional rail network can be maintained in a safe and efficient condition on an ongoing basis.
This is a Victorian Transport Plan initiative and contributes to the Department of Transport’s Freight, Logistics, Ports and Marine Development output.
Service Delivery 2009-10 Appendix A 375
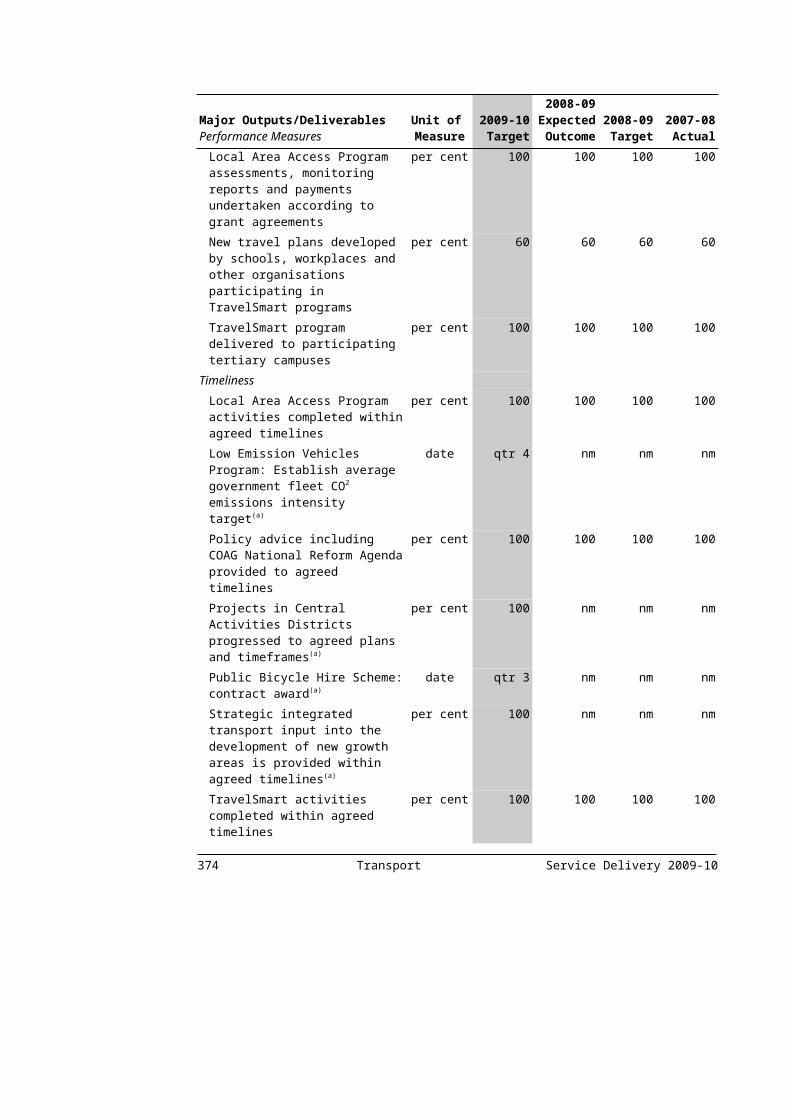
Regional Station and Modal Interchange Upgrade ProgramFunding is provided to upgrade regional railway stations across Victoria. Upgrades will include development of car parks, bike storage facilities, and safety improvements. Nominated priority sites include Marshall Station, South Geelong, Bairnsdale and Riddells Creek.
This is a Victorian Transport Plan initiative and contributes to the Department of Transport’s Rural and Regional Public Transport Services output.
Separating Road and Rail LinesFunding is provided in partnership with the Commonwealth to lower the railway line and build a new road crossing over it to allow the smooth flow of traffic and trains at Springvale Road, Nunawading, where 50 000 vehicles and 218 trains cross every day. Construction of a new railway station at Nunawading will replace the existing station. In addition, funding is provided for the planning of future grade separation projects.
This is a Victorian Transport Plan initiative and contributes to the Department of Transport’s Road Network Improvements output.
SmartBus – Yellow Orbital Stage 2Funding is provided to complete the rollout of the Yellow Orbital SmartBus (route 901) between Ringwood and Melbourne Airport via Blackburn, Templestowe, Greensborough, South Morang, Epping and Roxburgh Park. This route extension will incorporate bus priority treatments, upgraded bus stops, and SmartBus service frequency and span of operating hours.
This is a Victorian Transport Plan initiative and contributes to the Department of Transport’s Integrated Metropolitan Public Transport Services output.
South Morang Rail ExtensionThis initiative will extend the metropolitan rail network by 3.5 kilometres from Epping to South Morang, including the construction of a new premium station at South Morang. In addition, this initiative will duplicate five kilometres of track between Keon Park and Epping to provide sufficient capacity for the new South Morang services.
This is a Victorian Transport Plan initiative and contributes to the Department of Transport’s Integrated Metropolitan Public Transport Services and Public Transport Infrastructure Development outputs.
Sunbury ElectrificationThis initiative will extend the metropolitan train network by 15 kilometres through the electrification of the track between Watergardens and Sunbury. This will allow V/Line trains to be substituted with higher-capacity metropolitan trains and enable approximately 1 800 more people each hour to commute along the Sunbury rail corridor.
This is a Victorian Transport Plan initiative and contributes to the Department of Transport’s Integrated Metropolitan Public Transport Services and Public Transport Infrastructure Development outputs.376 Appendix A Service Delivery 2009-10

Other Transport InitiativesNation Building – Economic Stimulus Plan – TransportFunding is provided by the Commonwealth Government to repair regional roads and black spots, and install boom gates at rail crossings to support jobs and invest in future long term economic growth.
This initiative contributes to the Department of Transport’s Road Safety and Regulation, Road Asset Management and Public Transport Safety and Regulation outputs.
New Ticketing SolutionFunding is provided for the New Ticketing Solution project to aid in the further development, management and implementation of the myki initiative.
This initiative contributes to the Department of Transport’s Public Transport Infrastructure Development output.
North East Rail RevitalisationFunding is provided to convert 200 kilometres of broad gauge track to standard gauge, delivering a first-class passenger and rail freight link between Australia’s economic hubs, Melbourne and Sydney, and improved passenger rail services between Melbourne and Albury-Wodonga.
This initiative contributes to the Department of Transport’s Public Transport Infrastructure Development output.
Regional Rolling StockFunding is provided to purchase 28 additional regional rolling stock carriages and undertake associated works including the expansion of stabling facilities, boosting maintenance and increasing the staffing level. These additional carriages will add more than 2 000 extra seats across the regional network. This initiative will reduce congestion on regional rail lines by increasing capacity in the Regional Fast Rail corridors.
This initiative contributes to the Department of Transport’s Rural and Regional Public Transport Services output.
Service Delivery 2009-10 Appendix A 377

Asset initiatives
Table A.20: Asset initiatives – Transport($ million)
2008-09 2009-10 2010-11 2011-12 2012-13 TEIVictorian Transport PlanBetter Roads – Regional Victoria
Development.. 5.5 29.9 57.5 9.6 102.4
Cycling Package .. 6.0 7.2 .. .. 13.2Dingley Arterial .. 9.5 31.0 29.0 5.1 74.6Doncaster Area Rapid Transit .. 15.3 20.9 5.3 .. 41.5Greater Geelong Enhanced Bus
Improvement Package (a).. 1.8 3.8 0.1 0.1 5.9
Hoddle Street Engineering Investigation
.. 1.3 3.7 .. .. 5.0
Improving Train Operations – Rail Service Efficiencies
2.5 13.2 31.5 49.0 15.4 111.6
Maryborough Rail Services .. 19.1 .. .. .. 19.1Metropolitan Bus Improvements
Program.. 0.9 0.9 .. .. 1.8
Metropolitan Station and Modal Interchange Upgrade Program
.. 2.0 2.1 2.2 2.4 8.7
Nation Building Program (Auslink II) – Altona/Laverton Intermodal Terminal (b)
.. 16.0 17.0 6.0 1.0 40.0
Nation Building Program (Auslink II) – Roads (b)(c)
46.6 356.4 425.6 481.3 368.9 1 850.6
New Stations in Growth Areas 1.5 16.4 36.2 65.6 31.1 150.8New Trams .. 5.0 .. .. .. 5.0New X’trapolis Trains (d) 163.2 104.8 176.0 88.5 67.0 609.5Noise Walls .. 3.8 8.2 0.8 0.5 13.3Outer Suburban Arterial Roads
Program.. 4.7 16.6 7.5 0.2 29.0
Peninsula Link (e) 5.2 72.7 119.9 114.5 42.1 354.3Regional Rail Freight Network
Program.. 6.5 .. .. .. 6.5
Regional Station and Modal Interchange Upgrade Program
.. 2.0 2.1 2.2 2.4 8.7
Separating Road and Rail Lines 2.0 133.5 5.5 0.5 0.5 142.0SmartBus – Yellow Orbital
Stage 2.. 17.0 20.9 .. .. 37.9
South Morang Rail Extension (f) .. 20.0 80.6 200.2 139.9 559.1Sunbury Electrification 0.5 30.7 97.7 65.6 .. 194.5Urban Road Management
Systems.. 1.0 .. .. .. 1.0
City Loop Works 5.0 15.0 .. .. .. 20.0Country Rail Freight Network (g)(h) 25.6 13.1 .. .. .. 38.7Dynon Port Rail Link (g) 24.6 5.6 .. .. .. 30.3Nation Building – Economic
Stimulus Plan – Transport (i) 10.1 20.2 .. .. .. 30.3
New Ticketing Solution (g)(j) 79.4 52.6 32.7 .. .. 177.7
378 Appendix A Service Delivery 2009-10

Table A.20: Asset initiatives – Transport (continued)($ million)
2008-09 2009-10 2010-11 2011-12 2012-13 TEINorth East Rail Revitalisation (g)(k) .. 5.4 .. .. .. 5.4Port of Melbourne Rail Access
Improvement Package (g).. 33.5 .. .. .. 33.5
Regional Rolling Stock (g) 62.6 27.0 56.6 61.1 7.7 215.0Taxi Rank Safety Program .. 1.0 1.0 1.0 1.0 4.0Wodonga Rail Bypass (g)(l) .. 16.5 10.0 .. .. 26.5Sub-total asset initiatives 428.9 1 055.0 1 237.5 1 237.8 694.8 4 967.3Government-wide initiatives .. .. .. .. .. ..Total asset initiatives 428.9 1 055.0 1 237.5 1 237.8 694.8 4 967.3Source: Department of Treasury and Finance
Numbers have been rounded to the nearest $100 000 for presentation purposes.Notes:(a) The TEI includes $0.1 million in 2013-2014.(b) Funding is based on an estimated aggregate of Victorian and Commonwealth funding, the actual
amount has not been finalised and may vary.(c) The TEI includes funding of $171.8 million beyond 2012-13.(d) The TEI includes funding of $10.0 million in 2013-14.(e) The funding reported for this initiative represents the State contribution only, as the Commonwealth
is yet to finalise decisions in relation to contributions from the Building Australia Fund.(f) The TEI includes $118.4 million in 2013-2014.(g) These initiatives were previously reported in the 2008-09 Budget Update.(h) The TEI of $38.7 million is part funded from savings available from the upgrade of Gold Lines of
$5.3 million. (i) Funding as announced for Victoria as part of the Commonwealth's Nation Building – Economic
Stimulus Plan.(j) The TEI includes funding in the 2007-08 year.(k) The TEI for this project is $59.8 million including funding previously approved for Rail Gauge
Standardisation.(l) The total State contibution to the Wodonga Rail Bypass is $111.5 million.
Victorian Transport PlanBetter Roads – Regional Victoria DevelopmentRefer to the output initiative for a description of this initiative.
Cycling PackageFunding is provided to increase and improve cycling infrastructure in and around inner metropolitan Melbourne, including extension of the Federation Trail between Millers Road and Williamstown Road.
This is a Victorian Transport Plan initiative and contributes to the Department of Transport’s Road Network Improvements output.
Dingley ArterialRefer to the output initiative for a description of this initiative.
Service Delivery 2009-10 Appendix A 379
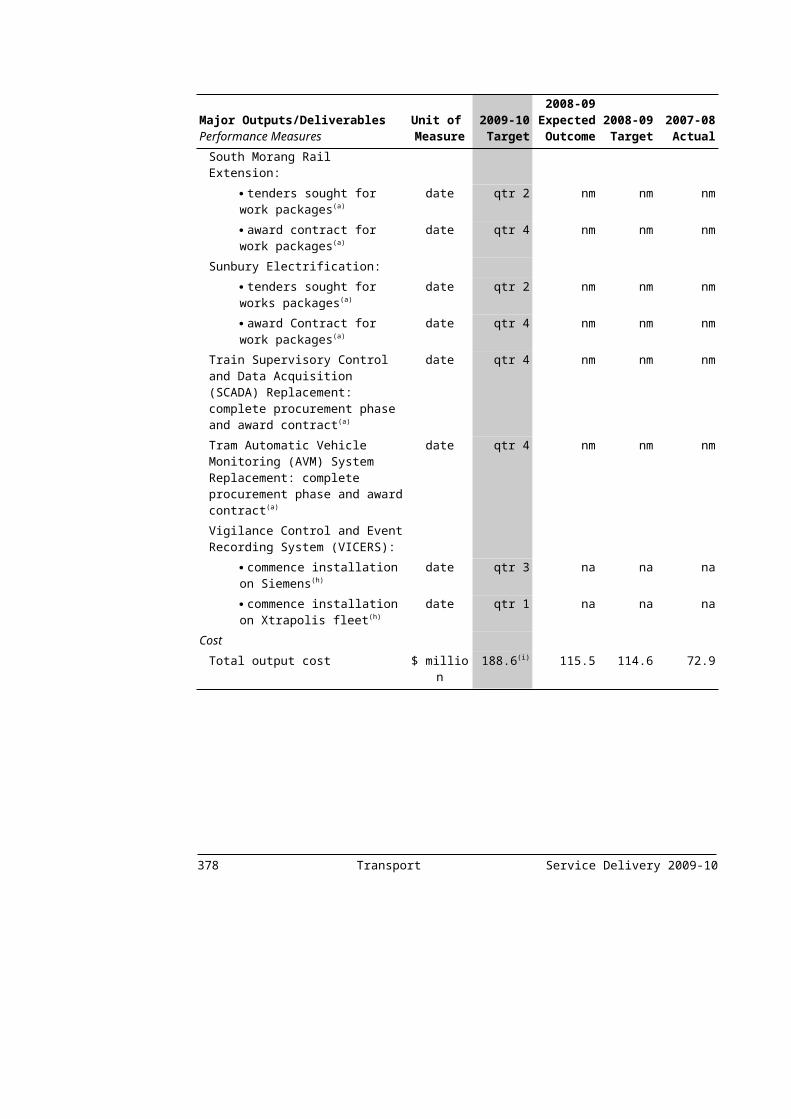
Doncaster Area Rapid TransitRefer to the output initiative for a description of this initiative.
Greater Geelong Enhanced Bus Improvement PackageRefer to the output initiative for a description of this initiative.
Hoddle Street Engineering InvestigationFunding is allocated to commence engineering investigations to determine the feasibility of grade separating key junctions on Hoddle Street to improve the operation of Melbourne’s central road system for cars, trams, buses and commercial vehicles.
This is a Victorian Transport Plan initiative and contributes to the Department of Transport’s Road Network Improvements output.
Improving Train Operations – Rail Service EfficienciesRefer to the output initiative for a description of this initiative.
Maryborough Rail ServicesRefer to the output initiative for a description of this initiative.
Metropolitan Bus Improvements ProgramRefer to the output initiative for a description of this initiative.
Metropolitan Station and Modal Interchange Upgrade ProgramRefer to the output initiative for a description of this initiative.
Nation Building Program (AusLink II) – Altona/Laverton Intermodal TerminalThis initiative is to be jointly funded with the Commonwealth Government and provides funding to improve rail access and capacity in the Altona/Laverton Intermodal complex.
This is a Victorian Transport Plan initiative and contributes to the Department of Transport’s Freight, Logistics, Ports and Marine Development output.
Nation Building Program (AusLink II) – RoadsRefer to the output initiative for a description of this initiative.
New Stations in Growth AreasRefer to the output initiative for a description of this initiative.
New TramsFunding is provided to commence planning for the procurement of up to 50 new low floor trams, upgrade of power supply works, and an upgrade to the Preston workshop site.
This is a Victorian Transport Plan initiative and contributes to the Department of Transport’s Integrated Metropolitan Public Transport Services output.
New X’trapolis TrainsRefer to the output initiative for a description of this initiative.
380 Appendix A Service Delivery 2009-10
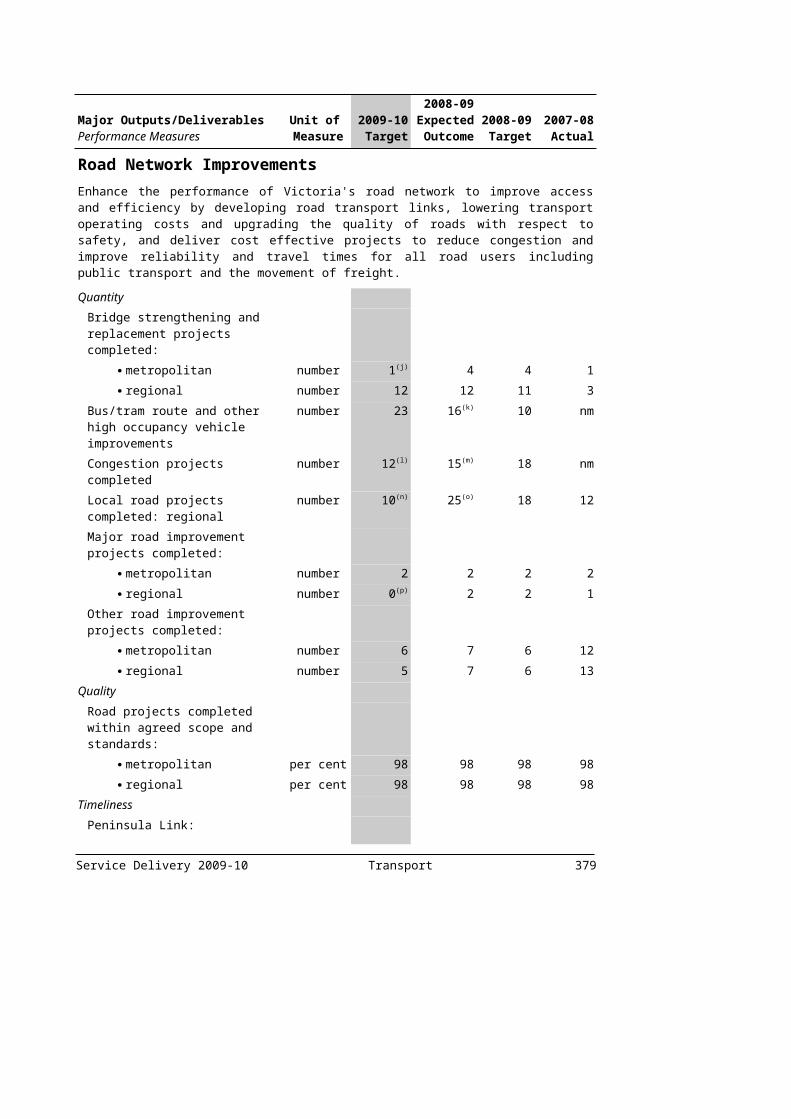
Noise WallsRefer to the output initiative for a description of this initiative.
Outer Suburban Arterial Roads ProgramRefer to the output initiative for a description of this initiative.
Peninsula LinkRefer to the output initiative for a description of this initiative.
Regional Rail Freight Network ProgramRefer to the output initiative for a description of this initiative.
Regional Station and Modal Interchange Upgrade ProgramRefer to the output initiative for a description of this initiative.
Separating Road and Rail LinesRefer to the output initiative for a description of this initiative.
SmartBus – Yellow Orbital Stage 2Refer to the output initiative for a description of this initiative.
South Morang Rail ExtensionRefer to the output initiative for a description of this initiative.
Sunbury ElectrificationRefer to the output initiative for a description of this initiative.
Urban Road Management SystemsFunding is provided for the planning and development of ways to reduce congestion on the urban road network.
This is a Victorian Transport Plan initiative and contributes to the Department of Transport’s Road Network Improvements output.
Other Transport InitiativesCity Loop WorksFunding is allocated for upgrade works in the Melbourne City Loop System including escalators.
This initiative contributes to the Department of Transport’s Public Transport Infrastructure Development output.
Country Rail Freight NetworkFunding is provided to upgrade rail lines identified as Silver Lines under the Rail Freight Network Review. These lines include Benalla-Oaklands, Quambatook-Manangatang, Charlton-Sealake, Warracknabeal-Hopetoun and Ouyen-Murrayville. This will increase the speed and efficiency of the rail freight network.
Service Delivery 2009-10 Appendix A 381
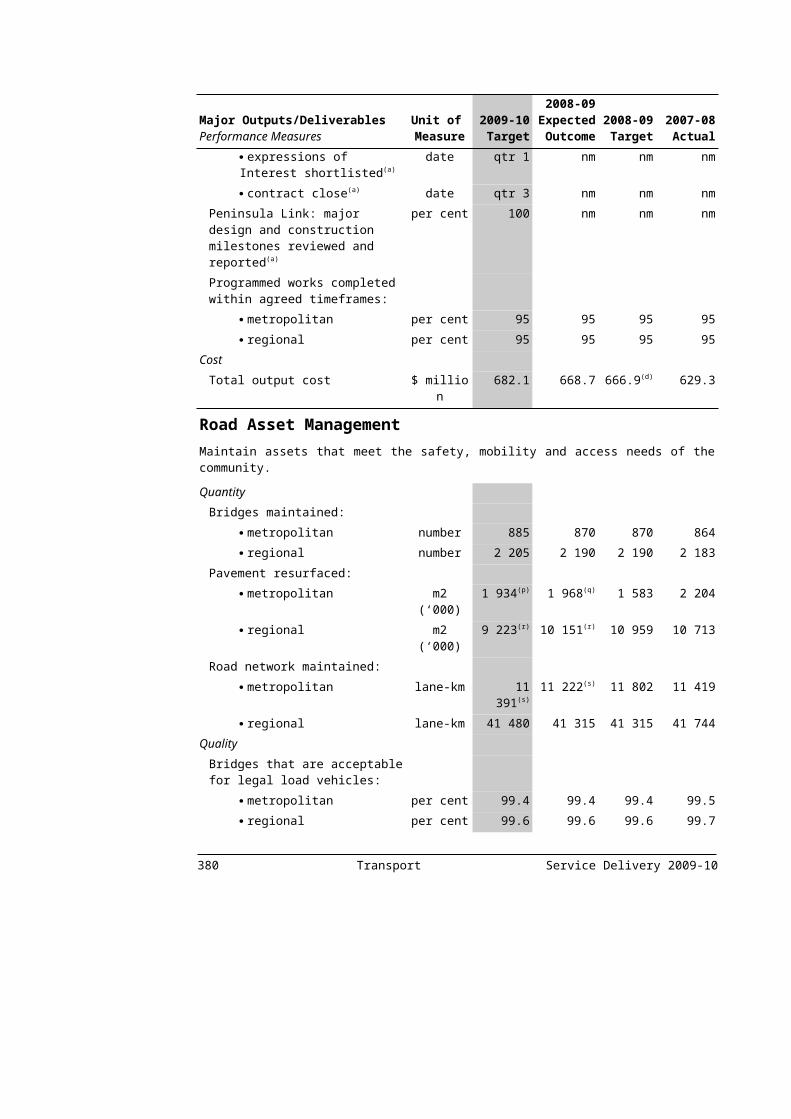
This is a Victorian Transport Plan initiative and contributes to the Department of Transport’s Public Transport Infrastructure Development output.
Dynon Port Rail LinkFunding is provided to ensure that environmental and rail operator standards are met.
This is a Victorian Transport Plan initiative and contributes to the Department of Transport’s Freight, Logistics, Ports and Marine Development output.
Nation Building – Economic Stimulus Plan Package – TransportRefer to the output initiative for a description of this initiative.
New Ticketing SolutionRefer to the output initiative for a description of this initiative.
North East Rail RevitalisationRefer to the output initiative for a description of this initiative.
Port of Melbourne Rail Access Improvement PackageFunding is provided in conjunction with the Commonwealth Government to construct rail tracks between the Port of Melbourne and the Dynon/North Dynon terminals, as well as Melbourne’s south-east. This initiative will improve the movement of freight trains and containers in and out of Port Melbourne.
This initiative contributes to the Department of Transport’s Public Transport Infrastructure Development output.
Regional Rolling StockRefer to the output initiative for a description of this initiative.
Taxi Rank Safety ProgramThis program establishes a grants scheme for local government to install and upgrade taxi rank infrastructure at highly patronised taxi ranks to improve safety, amenity and service quality for passengers and drivers.
This initiative contributes to the Department of Transport’s Vehicle and Driver Regulation output.
Wodonga Rail BypassFunding is provided to remove the rail line from the centre of Wodonga. This initiative will improve the passenger and rail freight link between Melbourne and Sydney, and passenger rail services between Melbourne and Albury Wodonga.
This initiative contributes to the Department of Transport’s Public Transport Infrastructure Development output.
382 Appendix A Service Delivery 2009-10

Treasury and Finance
Output initiatives
Table A.21: Output initiatives – Treasury and Finance($ million)
2008-09 2009-10 2010-11 2011-12 2012-13Efficient Technology Services 3.0 40.3 23.0 .. ..Extension of the First Home Bonus TBD TBD TBD TBD TBDSeamless National Economy – National
Partnership Payment .. 14.8 10.0 .. ..
State Revenue Office – Compliance and e-Sys
.. 3.5 4.0 4.2 0.3
Sub-total output initiatives 3.0 58.6 37.0 4.2 0.3Government-wide initiatives 33.0 5.0 .. .. ..EfficienciesGeneral efficiencies .. - 3.0 - 4.5 - 6.0 - 6.0Drought Savings - 3.3 .. .. .. ..Total output initiatives 32.7 60.6 32.5 - 1.8 - 5.7Source: Department of Treasury and FinanceNumbers have been rounded to the nearest $100 000 for presentation purposes.
Efficient Technology ServicesFunding is provided to improve government productivity and efficiency by delivering standardised core information communications technology across government. The program includes joining-up government information systems and using common infrastructure to establish a secure core desktop and common trusted network. The program also mandates a consistent approach by establishing one government service centre and hosting service.
This initiative contributes to the Department of Treasury and Finance’s Government Services output.
Extension of the First Home BonusProvision is made in the 2009-10 Budget for the extension of the First Home Bonus initiative.
This initiative contributes to the Department of Treasury and Finance’s Revenue Management Services to Government output.
Seamless National Economy – National Partnership PaymentFunding is provided by the Commonwealth to Victoria through the Council of Australian Governments’ National Partnership Agreement for implementation of the Seamless National Economy National Partnership. Under this National Partnership Agreement, the Commonwealth has committed to provide funding over two years to Victoria to facilitate the implementation of reform priorities in the areas of deregulation, competition and regulatory reform.
Service Delivery 2009-10 Appendix A 383
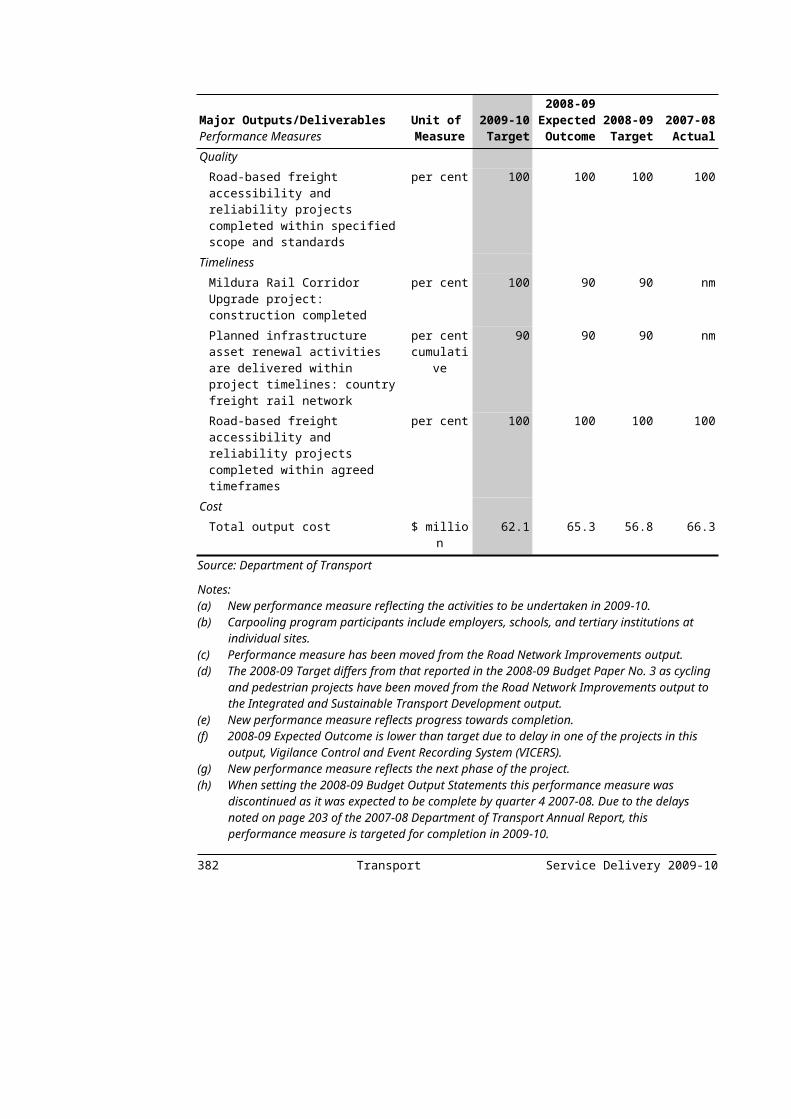
This initiative contributes to the Department of Treasury and Finance’s Economic and Financial Policy output.
State Revenue Office – Compliance and e-SysFunding is provided to expand the taxpayer compliance activities of the State Revenue Office, in targeted audit, investigation and detection of taxpayer non-compliance. In addition, funding is also provided to support the upgrade and extension of the State Revenue Office’s core revenue management system, e-Sys.
This initiative contributes to the Department of Treasury and Finance’s Revenue Management Services to Government output.
Asset initiatives
Table A.22: Asset initiatives – Treasury and Finance($ million)
2008-09 2009-10 2010-11 2011-12 2012-13 TEIEfficient Technology Services 1.6 22.7 4.5 .. .. 28.8State Revenue Management
System – e-Sys (a).. .. 2.5 2.6 2.6 10.4
Sub-total asset initiatives 1.6 22.7 7.0 2.6 2.6 39.2Government-wide initiatives .. .. .. .. .. ..Total asset initiatives 1.6 22.7 7.0 2.6 2.6 39.2Source: Department of Treasury and Finance
Numbers have been rounded to the nearest $100 000 for presentation purposes.Note:(a) The TEI includes funding of $2.7 million beyond 2012-13.
Efficient Technology ServicesRefer to the output initiative for a description of this initiative.
State Revenue Management System – e-SysThis initiative will enable the State Revenue Office to progressively upgrade and extend the life of its core revenue management system (e-Sys). This system is used to manage all revenue administration and collection activities administered by the State Revenue Office.
This initiative contributes to the Department of Treasury and Finance’s Revenue Management Services to Government output.
384 Appendix A Service Delivery 2009-10

Parliament
Output initiatives
Table A.23: Output initiatives – Parliament($ million)
2008-09 2009-10 2010-11 2011-12 2012-13The Victorian Auditor-General’s Office .. 2.3 .. .. ..Sub-total output initiatives .. 2.3 .. .. ..Government-wide initiatives .. .. .. .. ..EfficienciesGeneral efficiencies .. .. .. .. ..Total output initiatives .. 2.3 .. .. ..Source: Department of Treasury and Finance
Numbers have been rounded to the nearest $100 000 for presentation purposes.
The Victorian Auditor-General’s Office Funding is provided to assure Parliament and the Victorian community on the accountability and performance of the Victorian Public Sector.
This initiative contributes to the Parliament’s Parliamentary Reports and Services, and Audit reports on Financial Statements outputs.
EFFICIENCIES
Table A.25: Efficiencies initiatives($ million)
2008-09 2009-10 2010-11 2011-12 2012-13Efficiency InitiativesGeneral Efficiencies .. 86.5 144.2 216.6 217.7Drought Savings 50.0 .. .. .. ..Total Government efficiencies 50.0 86.5 144.2 216.6 217.7Source: Department of Treasury and Finance
Numbers have been rounded to the nearest $100 000 for presentation purposes.
Service Delivery 2009-10 Appendix A 385
REVENUE INITIATIVES
Table A.26: Revenue initiatives($ million)
2008-09 2009-10 2010-11 2011-12 2012-13 TotalGrowth Areas Development
Fund (a).. 42.3 25.7 23.4 23.4 114.8
Growth Areas Infrastructure Contribution (a)
.. 42.4 25.6 23.4 23.4 114.8
Land Transfer Duty Avoidance (b) 1.0 2.0 2.0 2.0 2.0 9.0Taxi Licences – Conventional
and Wheelchair Accessible (b).. 146.0 47.4 .. .. 193.4
Total revenue initiatives 1.0 232.7 100.7 48.8 48.8 432.0Source: Department of Treasury and Finance
Numbers have been rounded to the nearest $100 000 for presentation purposes.Notes:(a) These initiatives were previously announced in the 2008-09 Budget Update as the Growth Areas
Infrastructure Contribution initiative.(b) These initiatives were previously announced in the 2008-09 Budget Update.
Growth Areas Development FundThe Fund will provide financial assistance for capital works in growth areas with a focus on projects that support economic and community infrastructure.
Growth Areas Infrastructure ContributionThe implementation of the November 2005 decision on infrastructure funding for growth areas. The Growth Areas Infrastructure Contribution will partly fund the provision of infrastructure in growth areas and enable a more timely provision of facilities and services.
Land Transfer Duty Avoidance The Government has introduced legislation to close a loophole to counter schemes or arrangements which were deliberately structured in ways to avoid paying stamp duty. The practice typically involved large commercial transactions for leases of sometimes up to 199 years, with large upfront payments and nominal rent. These contractual arrangements, for all intents and purposes, result in a transfer of rights that are analogous to a sale and purchase transaction. The loophole arose as a result of Victoria meeting its obligations to abolish lease duty in 2001 as part of the transition to the GST. These changes are anti-avoidance in nature and not expected to lead to significant additional duty being collected.
Taxi Licences – Conventional and Wheelchair AccessibleGreater assistance will be provided to those who rely on wheelchair taxi services, with the release of a further 330 wheelchair accessible taxi licences and a doubling of the Multi Purpose Taxi Program’s trip and annual caps. This will reduce waiting times and increase the availability of taxis.386 Appendix A Service Delivery 2009-10

An additional 200 conventional taxi licences into the greater Melbourne area have also been released to address the undersupply of taxis, particularly at peak times.
These reforms are due in part to the Government’s response to the Essential Services Commission’s Taxi Fare Review 2007-08.
Service Delivery 2009-10 Appendix A 387
APPENDIX B – GROWING VICTORIA TOGETHER PROGRESS REPORT
Growing Victoria Together is a vision for Victoria to 2010 and beyond. It articulates the issues that are important to Victorians, and the priorities the Government has set to make Victoria a better place in which to live, work and raise a family.
Growing Victoria Together commits to regular reporting on the progress the Government has made towards the Growing Victoria Together vision and goals. This is the seventh report in line with this commitment. Each year, new information is included as it becomes available and where it will provide a more meaningful assessment of progress towards the Growing Victoria Together goals.
Further information about the Government’s priorities, strategies and initiatives directed towards achieving Growing Victoria Together is provided in Budget Paper No. 3. Further information about Growing Victoria Together, including the original Growing Victoria Together 2001, the Update from 2005 and previous annual progress reports are available at www.growingvictoria.vic.gov.au.
Table B.1: Growing Victoria Together: A Vision for Victoria to 2010 and BeyondVision Goals
THRIVING ECONOMY
More quality jobs and thriving, innovative industries across Victoria
Growing and linking all of Victoria
QUALITY HEALTH AND EDUCATION
High quality, accessible health and community services
High quality education and training for lifelong learning
HEALTHY ENVIRONMENT
Protecting the environment for future generations
Efficient use of natural resources
CARING COMMUNITIES
Building friendly, confident and safe communities
A fairer society that reduces disadvantage and respects diversity
Service Delivery 2009-10 Appendix B 389

VIBRANT DEMOCRACY
Greater public participation and more accountable government
Sound financial management
390 Appendix B Service Delivery 2008-09
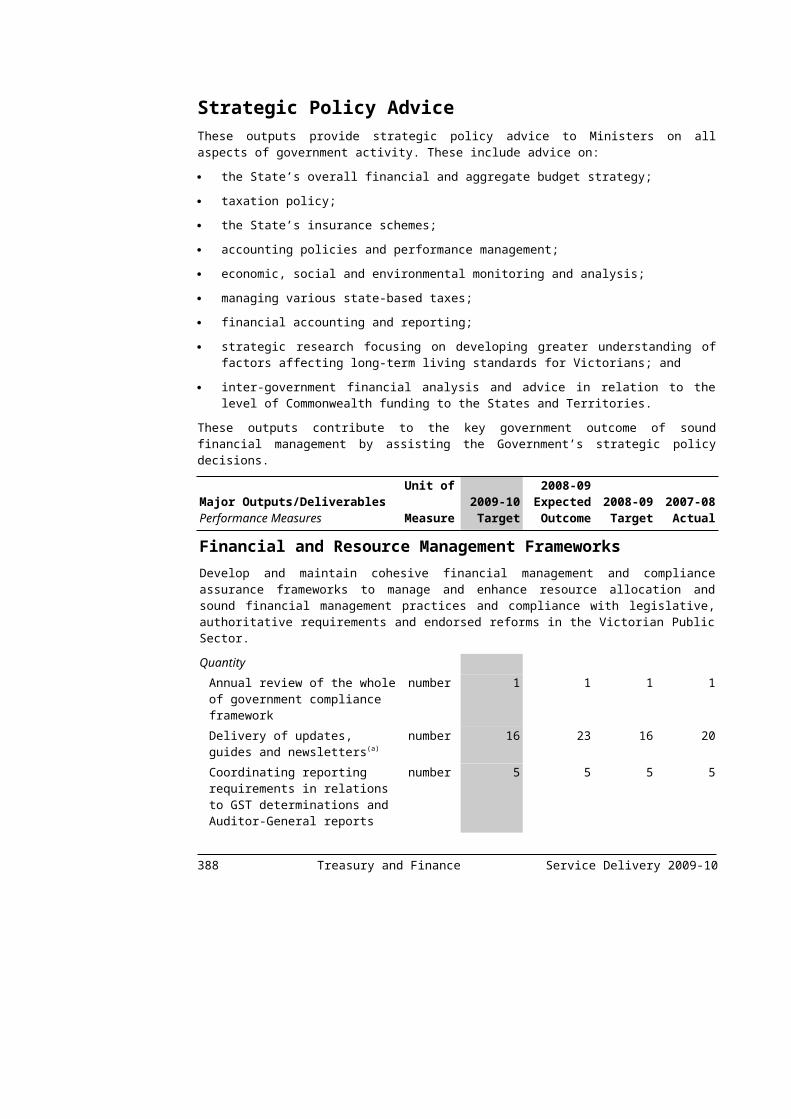
THRIVING ECONOMY
More quality jobs and thriving, innovative industries across Victoria
Improved living standards and opportunities for all Victorians will be built on a thriving and adaptive industry base that creates rewarding jobs. Economic growth is not an end in itself. It is important because it creates good jobs, which, in turn, generate improved living standards and opportunities.
There will be more and better jobs across VictoriaImprovement over time in the quality and number of jobs available in Victoria can be measured by growth in employment and occupation types.
Employment growthOver the period from 1999-2000 to 2007-08, Victoria averaged annual employment growth of 2.4 per cent (see Chart B.1). In 2007-08, annual employment growth was 2.7 per cent.
Chart B.1: Annual employment growth in Victoria(a)
0
1
2
3
4
1999-00 2000-01 2001-02 2002-03 2003-04 2004-05 2005-06 2006-07 2007-08
per c
ent
annual employment growth average annual growth rate
Source: Australian Bureau of Statistics (Cat. No. 6291.0.55.001)
Note:(a) Percentage change from the previous year’s annual average employment.
Service Delivery 2009-10 Appendix B 391

Strong employment growth has contributed to a rise in the employment rate (the employed proportion of the working age population). In 2007-08 the average annual employment rate was 62.3 per cent, higher than the 61.7 per cent in 2006-07 and higher than the 58.5 per cent in 1999-2000. From October 1999 to March 2009, Victorian employment has risen by 460 200 persons, or 21.0 per cent.
UnderemploymentUnderemployment is defined as the proportion of employed persons in the labour force who want, and are available for, more hours of work than they currently have. Victoria’s underemployment rate increased from 6.3 per cent in February 2008 to 7.5 per cent in February 2009 (Chart B.2). The Australian Bureau of Statistics (ABS) has changed its methodology for calculating underemployment and these figures are not comparable to previous budget papers. The unemployment rate has decreased from 6.6 per cent in 1999-2000 to 4.5 per cent in 2007-08. However, due to the Global Financial Crisis the unemployment rate has started to increase.
Chart B.2: Underemployment rate in Victoria and Australia(a)(b)
0
2
4
6
8
10
2002 2003 2004 2005 2006 2007 2008 2009
per c
ent
Victoria Australia
Source: Australian Bureau of Statistics (Cat. Nos. 6265.0 and 6202.0)
Notes:(a) Underemployment is at February each year.(b) The ABS has changed its methodology for calculating underemployment and these figures are not
comparable to previous Budget Papers.
392 Appendix B Service Delivery 2008-09
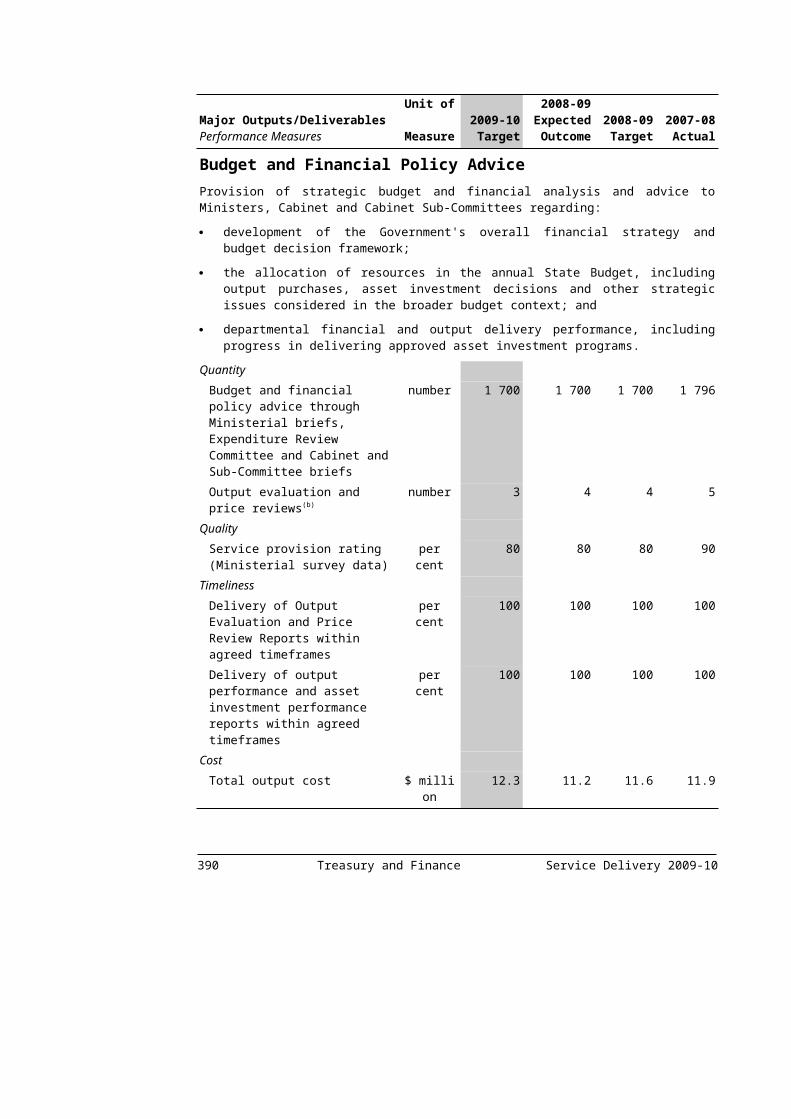
Employment in regional VictoriaEmployment in regional Victoria (the area outside Melbourne Statistical Division) grew steadily from 1999 to 2008, although since December 2008 the number of people employed has decreased. Regional Victoria’s share of total Victorian employment has averaged 25 per cent since 2000.
Chart B.3: Employment in regional Victoria(a)(b)
480
510
540
570
600
630
660
690
720
Feb-99 Feb-00 Feb-01 Feb-02 Feb-03 Feb-04 Feb-05 Feb-06 Feb-07 Feb-08 Feb-09
pers
ons
('000
)
Source: Australian Bureau of Statistics (Cat. No. 6291.0.55.001) and Department of Innovation, Industry and Regional Development
Notes:(a) The number of persons employed in regional Victoria differs from previous GVT reports due to the
Australian Bureau of Statistics’ revision of labour force estimates for the period June 2001 to January 2009, where the 2006 Census population benchmark have been used.
(b) Three monthly moving average data.
Employment growth by industryHealth Care and Social Assistance experienced the greatest increase in employment numbers between 1999-2009, increasing by 84 300 workers, followed by Construction (78 100), Education and Training (62 800) and Professional, Scientific and Technical Services (47 300). Mining experienced the greatest level of growth over the period, with employment in the industry increasing by 29 per cent, although the actual number of people employed in the industry is very small. Rental, Hiring and Real Estate (16 per cent) and Electrical, Gas, Water and Waste Services (13 per cent) experienced the
Service Delivery 2009-10 Appendix B 393
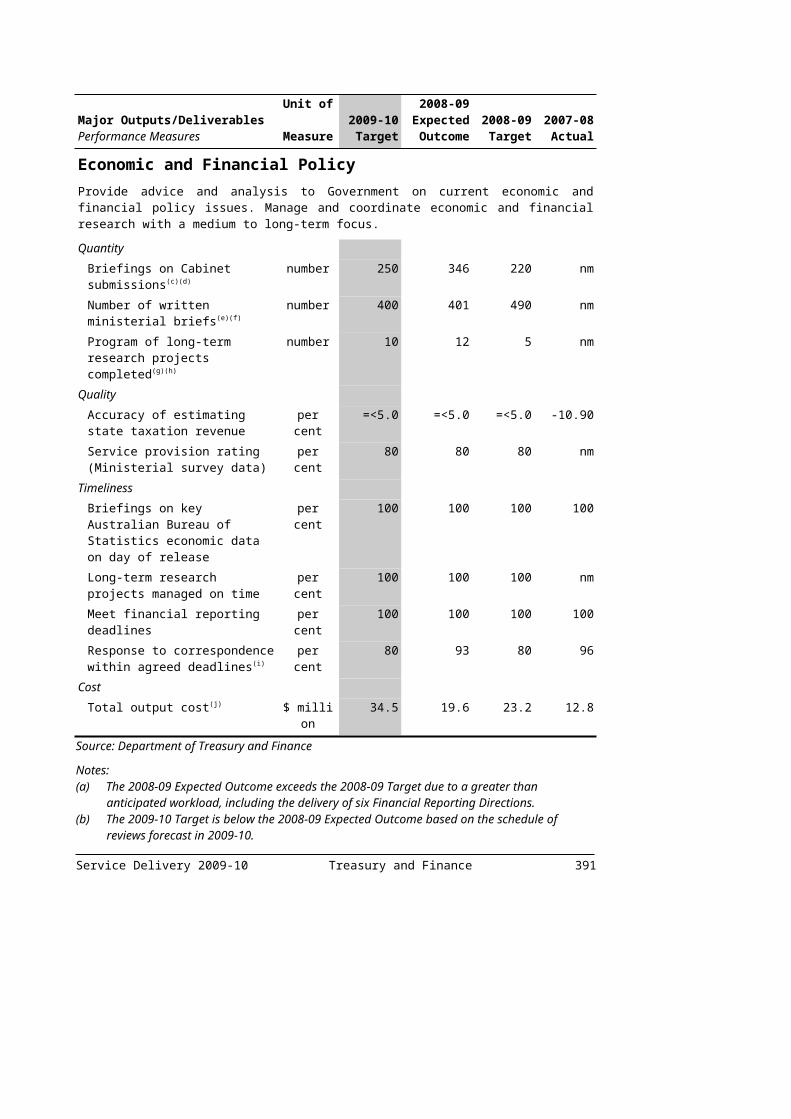
fastest rate of growth in employment, after Mining, between 1999 to 2009. Manufacturing employment declined between 1999-2009 although it remained Victoria’s largest employing industry (320 000 people), followed by Retail Trade (287 000 people) and Health Care and Social Assistance (282 000 people).
Chart B.4: Employment growth by industry(a)(b)
0
50
100
150
200
250
300
350
Agric
ultu
re
Min
ing
Man
ufac
turin
g
Elec
trici
ty, G
as &
Wat
er
Con
stru
ctio
n
Who
lesa
le T
rade
Ret
ail T
rade
Acco
mm
odat
ion
&Fo
od
Tran
spor
t & P
osta
l
Med
ia &
Tele
com
mun
icat
ions
Fina
ncia
l Ser
vice
s
Ren
tal &
Rea
l Est
ate
Prof
essi
onal
Serv
ices
Ad
min
istra
tive
Serv
ices
Pu
blic
Adm
inis
tratio
n
Educ
atio
n
Hea
lth C
are
Arts
& R
ecre
atio
nSe
rvic
es
Oth
er S
ervi
ces
No.
of w
orke
rs ('
000s
)
-5
0
5
10
15
20
25
30
35
per c
ent g
row
th
2009 (LHS) % of growth from 1999-2009 (RHS)
Source: Australian Bureau of Statistics (Cat. No. 6291.0.55.003) and Department of Innovation, Industry and Regional Development
Notes:(a) Number employed based on annual average employment, year ending February 1999 to year ending
February 2009.(b) Percentage change in employment growth based on annual average employment, year ending
February 1999 to year ending February 2009.
394 Appendix B Service Delivery 2008-09

Average weekly earningsVictorians’ average weekly earnings increased by 3.1 per cent in 2008 and have been increasing steadily since 1999. Male earnings have grown by an annual average rate of 4.4 per cent between 1999 and 2008, while female earnings have increased by an average of 4.1 per cent per annum over the same period (see Chart B.5).
Chart B.5: Average nominal weekly earnings of Victorians(a)
400
500
600
700
800
900
1000
1100
1999 2000 2001 2002 2003 2004 2005 2006 2007 2008
$ pe
r wee
k
Males Females Persons
Source: Australian Bureau of Statistics (Cat. No. 6302.0)
Notes:(a) Total average nominal weekly earnings, all employees including both part-time and full-time.
Average real weekly earnings for Victorians (in 2008 prices) have also been increasing steadily, with average annual growth of 0.9 per cent over the period 1999 to 2008.
Service Delivery 2009-10 Appendix B 395
Chart B.6: Average real weekly earnings of Victorians(a)
400
500
600
700
800
900
1000
1100
1999 2000 2001 2002 2003 2004 2005 2006 2007 2008
$ pe
r wee
k
Males Females Persons
Source: Australian Bureau of Statistics (Cat. Nos. 6302.0 and 6401.0)
Note:(a) Total average real weekly earnings, all employees. Includes both part-time and full-time employees
and is in 2008 prices.
Victoria’s productivity and competitiveness will increase One of the drivers of a modern and flexible economy is a productive workforce. In Australia, a state’s productivity is usually measured by gross state product (GSP) per employed person or per hour worked. GSP is defined as the total economic output of the state, including all value that is added by industries in that state.
Gross state product per employed personReal GSP per employed person provides a measure of the value added by each worker in the Victorian economy. Real GSP per employed person increased 0.5 per cent in 2007-08 and has increased from $93 100 to $96 500 since 1999-2000 as measured in 2006-07 dollars (see Chart B.7).
396 Appendix B Service Delivery 2008-09

Chart B.7: Real gross state product per employed person in Victoria(a)(b)
86
88
90
92
94
96
98
1999-00 2000-01 2001-02 2002-03 2003-04 2004-05 2005-06 2006-07 2007-08
$ th
ousa
nds
-3
-2
-1
0
1
2
3
per c
ent
GSP per employed person (LHS) Growth in GSP per employed person (RHS)
Source: Australian Bureau of Statistics (Cat. Nos. 5220.0 and 6202.0)
Notes:(a) Chain volume measure, 2006-07 prices.(b) Annual average employed persons.
Gross state product per hour worked
Real GSP per hour worked provides a measure of the value added by each hour that Victorians work. It gives a more accurate picture of Victoria’s productivity, as it accounts for the effects of changes in the hours of work for part-time and casual employees. Victoria recorded real GSP of $56.52 per hour worked in 2007-08, down 1.2 per cent from 2006-07 but up 8.4 per cent from 1999-2000. National real gross domestic product per hour worked increased 10.3 per cent from 1999-2000 to 2007-08, but declined 1.4 per cent between 2006-07 and 2007-08. Due to data revisions, the history of these series is different from that reported in last year’s budget.
Service Delivery 2009-10 Appendix B 397

Extent and quality of business regulationRegulation can impose unnecessary burdens on businesses and not-for-profit organisations. This adds to the cost of hiring workers, reducing competitiveness, increasing prices and restricting job growth. These burdens can also distort business decisions and become an impediment to productivity growth. To remove these impediments, the Victorian Government (in the 2006-07 Budget) introduced the Reducing the Regulatory Burden (RRB) initiative.
The RRB initiative has set targets for cutting unnecessary regulatory burden on businesses and not-for-profit organisations of 15 per cent ($154 million) by July 2009 and 25 per cent by July 2011. The Victorian Standard Cost Model has been developed to provide a transparent methodology for measuring changes in the burden. The model is based on a methodology originally developed by the Dutch Government, and subsequently adopted by more than 20 European countries, including the United Kingdom, Germany and Austria. Progress towards achieving these targets is encouraging, with the net reduction in the administrative burden based on current initiatives estimated to be $162 million (16 per cent) per annum since July 2006.
A greater share of national business investment will be in Victoria Business investment is central to future productivity growth, as it increases the quantity and quality of resources available to the workforce. For example, investment in machinery and equipment allows for adoption of the latest technologies, and investment in research and development leads to new products and services. This Progress Report uses private business investment and its components to establish progress against this measure.
Private business investment and investment in machinery and equipmentBoth private business investment and investment in machinery and equipment have grown strongly between 1999-2000 and 2007-08. Total private business investment increased from $20 billion in 1999-2000 to $41 billion in 2007-08. Investment in machinery and equipment grew from $9.7 billion in 1999-2000 to $20.6 billion in 2007-08. Total private business investment grew by 13 per cent between 2006-07 and 2007-08, compared to the 2 per cent increase the previous financial year. Investment in machinery and equipment grew by 8 per cent between the 2006-07 and 2007-08 financial years.
398 Appendix B Service Delivery 2008-09
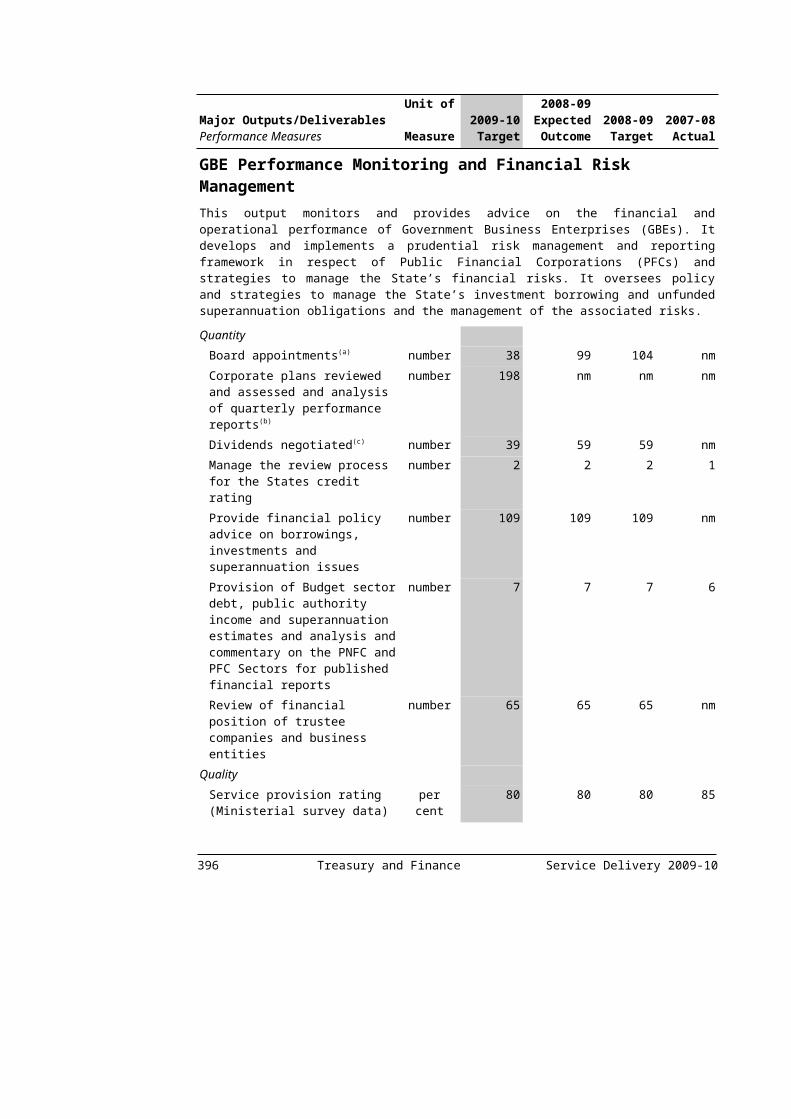
Chart B.8: Business investment in Victoria(a)
0
5
10
15
20
25
30
35
40
45
1999-00 2000-01 2001-02 2002-03 2003-04 2004-05 2005-06 2006-07 2007-08
$ bi
llion
Total private business investment Investment in machinery and equipment
Source: Australian Bureau of Statistics (Cat. No. 5220.0) and Department of Innovation, Industry and Regional Development
Note:(a) Chain volume measure, 2005-06 prices.
Victoria’s share of national private business investment averaged 24.4 per cent between 1999-2000 and 2007-08 and was above Victoria’s share of the national economy for the same period, 23.9 per cent. Victoria’s share of national business investment has declined in the past year, due to the terms of trade boom boosting investment in the resource-rich states. The terms of trade have now started to ease. This is expected to narrow the growth differentials among the states, which should see Victoria’s share of national business investment return to historical levels.
Service Delivery 2009-10 Appendix B 399

Chart B.9: Business investment in Victoria as a share of national business investment
20
21
22
23
24
25
26
27
1999-00 2000-01 2001-02 2002-03 2003-04 2004-05 2005-06 2006-07 2007-08
shar
e (p
er c
ent)
Machinery and equipment Total private business investment
Source: Australian Bureau of Statistics (Cat. No. 5220.0) and Department of Innovation, Industry and Regional Development
400 Appendix B Service Delivery 2008-09
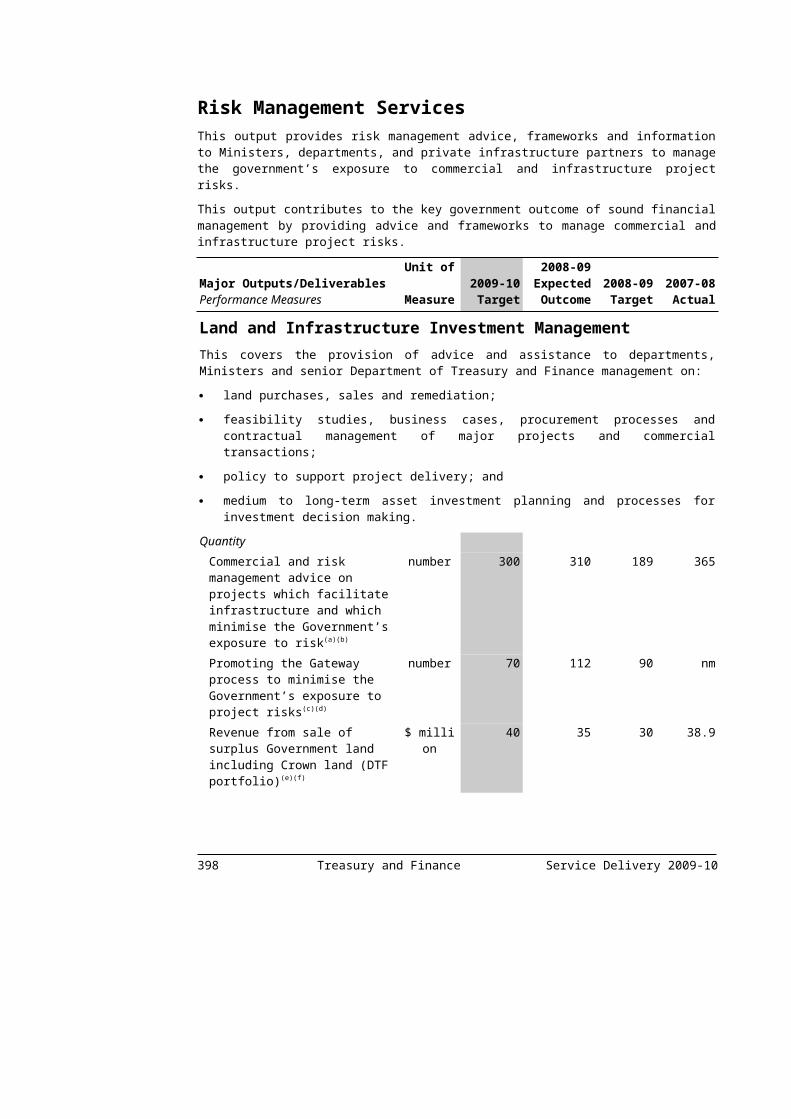
Business investment in research and developmentVictorian business expenditure on research and development grew from $1.5 billion in 1999-2000 to $3.3 billion in 2006-07, an increase of over 100 per cent. The proportion of GSP that Victorian businesses spent on research and development increased from 0.9 per cent in 1999-2000 to 1.3 per cent in 2006-07. Victoria’s share of total Australian business expenditure on research and development is 27.6 per cent, which compares favourably with Victoria’s share of the national economy (23.6 per cent).
Chart B.10: Business expenditure on research and development in Victoria(a)
0
0.5
1
1.5
2
2.5
3
3.5
1999-00 2000-01 2001-02 2002-03 2003-04 2004-05 2005-06 2006-07
$ bi
llion
0
0.5
1
1.5
2
2.5
3
3.5
per c
ent
Business expenditure on R&D (LHS) Share of GSP (RHS)
Source: Australian Bureau of Statistics (Cat. No. 8104.0 plus unpublished data) and Department of Innovation, Industry and Regional Development
Note:(a) Measured at current prices.
Service Delivery 2009-10 Appendix B 401
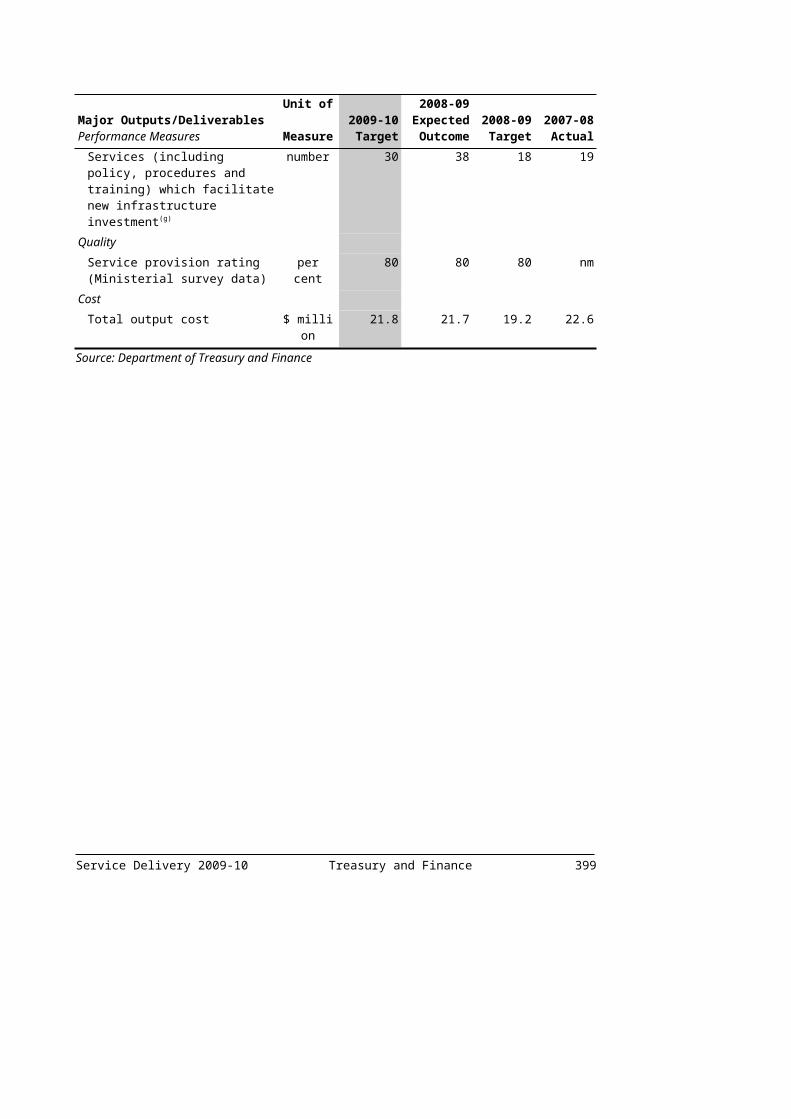
Victoria will increase exports to $30 billion by 2010 Victoria’s exports of goods and services grew from just over $26 billion in 1999-2000 to $33.5 billion in 2007-08. Partly as a result of the drought, exports decreased between 2000-01 and 2002-03 but are now rebounding strongly largely as a result of an increase in services exports. Education services, now Victoria’s largest export, were worth $4.45 billion in 2007-08, more than triple the value in 2000.
Chart B.11: Total Victorian exports
22
24
26
28
30
32
34
1999-00 2000-01 2001-02 2002-03 2003-04 2004-05 2005-06 2006-07 2007-08
$bill
ion
-14
-7
0
7
14
21
per c
ent
Total exports (LHS) Annual per cent change (RHS)
Source: Australian Bureau of Statistics (Cat. Nos. 5432.0 and 5220.0) and Department of Industry, Innovation and Regional Development
402 Appendix B Service Delivery 2008-09
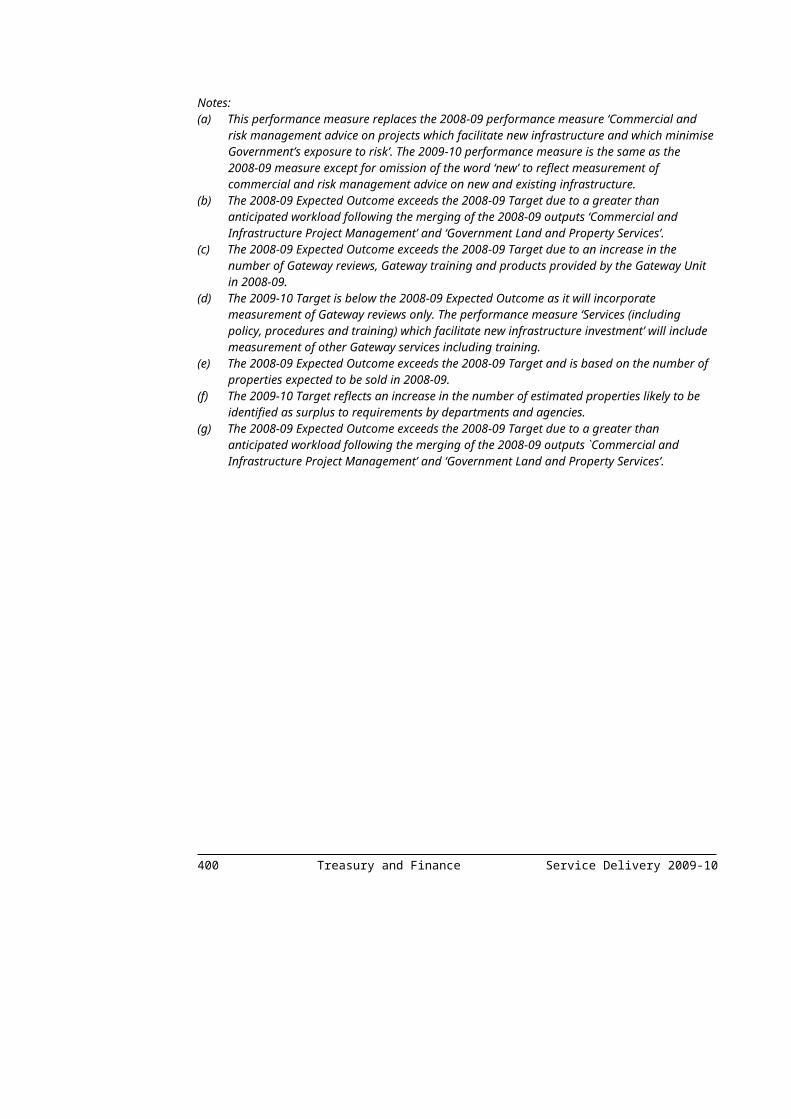
THRIVING ECONOMY
Growing and linking all of Victoria
Population growth underpins economic growth, sustains regional revitalisation and further strengthens the diversity that is the heart of Victoria. Transport and communications infrastructure links people and businesses across Victoria and links the regions to Melbourne and the world.
Victoria’s total population will reach six million people by 2025, and regional population growth will increase to 1.25 per cent annually by 2006
Victoria’s total populationVictoria’s total population growth, including regional population growth, is a key medium and long-term progress indicator. Victoria’s population grew by 13.6 per cent between September 1999 and September 2008, and by 1.85 per cent over the year to September 2008, to reach 5.3 million people.
Regional population growthPopulation in regional Victoria, defined as the area outside the Melbourne Statistical Division, grew by 8.8 per cent between 1999 and 2008, to reach 1.4 million persons. Victoria’s regional population grew by 1.4 per cent (revised) in 2006-07 and by 1.3 per cent in 2007-08. These have been the highest growth rates since 1990.
Chart B.12: Population growth for regional Victoria and metropolitan Melbourne
0.0
0.5
1.0
1.5
2.0
2.5
1999 2000 2001 2002 2003 2004 2005 2006 2007 2008
per c
ent
Melbourne Regional
Source: Australian Bureau of Statistics, Regional Population Growth, Australia (Cat. No. 3218.0)
Service Delivery 2009-10 Appendix B 403

Population projectionsVictoria’s population is expected to reach 6 million in 2017 and 7 million in 2030.
Regional rail services will be available to more VictoriansThe number of regional rail services increased by 3.4 per cent in 2007-08, reaching 1 462 services per week. Regional rail passenger trips rose 23.8 per cent in the year to 2007-08, reaching 222 000 passenger trips per week.
Chart B.13: Regional rail services and passenger trips in Victoria(a)
0
50
100
150
200
250
300
1999-00 2000-01 2001-02 2002-03 2003-04 2004-05 2005-06 2006-07 2007-08
pass
enge
r trip
s pe
r wee
k ('0
00)
0
400
800
1200
1600
serv
ices
per
wee
k
Passenger trips (LHS) Services (RHS)
Source: Department of Transport
Note: (a) This chart has been expressed this year as ‘services per week’ and ‘passenger trips per week’ for
consistency with the metropolitan public transport indicators.
The proportion of freight transported to and from ports by rail will increase from 10 per cent to 30 per cent by 2010Rail’s share of freight transported to and from Victoria’s commercial ports declined from 13 per cent in 2006-07 to 12.3 per cent in 2007-08. While the total volume of freight transported to and from the ports increased from 40.2 million tonnes to 45.7 million tonnes in 2007-08, the volume of freight carried on rail increased by a smaller amount, from 5.2 million tonnes to 5.6 million tonnes.
The main factor contributing to the decline in the proportion of freight carried on rail is lower grain exports and exports of containerised agricultural products due to the drought. The volume of grain carried by rail has declined in 2007-08 by about 50 per cent, from approximately 1.3 million tonnes to 0.6 million tonnes. 404 Appendix B Service Delivery 2008-09

Freight Futures was released in December 2008 and is the Victorian Government’s long-term strategy to shape an efficient and sustainable freight network for Victoria that supports the prosperity and liveability of the State. The Government has committed to promoting rail freight by moving to establish a Metropolitan Freight Terminal Network to move more freight on rail between the Port of Melbourne and freight terminals in key industrial zones in Melbourne.
Chart B.14: Proportion of freight transported by rail to and from Victoria’s commercial ports (Melbourne, Geelong and Portland)(a)
0
5
10
15
20
25
2000-01 2001-02 2002-03 2003-04 2004-05 2005-06 2006-07 2007-08
per c
ent
Source: Department of Transport
Note: (a) The 2006-07 rail share of freight transport has been adjusted from what was reported last year, from
15 per cent to 13 per cent. The adjustment was due to a change in total freight being transported to and from the ports. The 2006-07 data collection process was revised in 2008 and found to be incomplete. More tonnage data from freight operators was collected and a revised series produced. The total freight transported was adjusted to 40.2 million tonnes.
Service Delivery 2009-10 Appendix B 405

Public transport use in Melbourne as a proportion of trips taken by motorised means will increase from 11 per cent in 2002 to 20 per cent by 2020Mode share is calculated by measuring the number of trips taken on public transport in metropolitan Melbourne against the total number of personal motorised trips taken. Total public transport patronage increased by 7.7 per cent in 2007-08. Since 2005-06, public transport patronage has increased by 16.2 per cent.
In 2007-08, an estimated 13 per cent of all personal motorised trips in metropolitan Melbourne were taken on public transport. The Victoria Transport Plan, released in December 2008, includes $38 billion in new transport investments.
Chart B.15: Public transport use as a proportion of trips taken by motorised means in Melbourne(a)(b)(c)
0
5
10
15
20
1999-00 2000-01 2001-02 2002-03 2003-04 2004-05 2005-06 2006-07 2007-08
per c
ent
VATS VISTA 07 mode share estimate
Source: Department of TransportNotes: (a) In 2001 the Victorian Activity and Travel Survey (VATS) was used to set the mode share target of
20 per cent by 2020. The last VATS survey yielded a mode share for 2001-02 of 10.7 per cent.(b) Following the discontinuation of VATS in 2002, mode share was estimated using a model developed
by the Bureau of Infrastructure, Transport and Regional Economics (BITRE). The major input of this model was an estimate of vehicle kilometres travelled from the ABS Survey of Motor Vehicle Use. There were a number of limitations to the methodology that have affected the accuracy and reliability of the results. The Department of Transport considers the BITRE model unreliable for reporting against this measure, and has not included its data here.
(c) The Victorian Integrated Survey of Travel and Activity (VISTA 07) replaced the BITRE model to estimate mode share in 2008. VISTA 07 is aimed at providing detailed information about daily travel and activity patterns. VISTA 07 shares a similar methodology as VATS, and reports a more accurate mode share estimate of personal travel than was previously reported by the BITRE model.
406 Appendix B Service Delivery 2008-09

Public transport patronage and servicesThe number of metropolitan public transport services increased by 5.0 per cent in 2007-08, reaching 136 864 services per week. Metropolitan public transport patronage rose 7.7 per cent in the year to 2007-08, reaching 8.67 million passenger trips per week. This represents the highest level of public transport passenger trips for over four decades.
Chart B.16: Public transport services and passenger trips per week
7.0
7.5
8.0
8.5
9.0
2005-06 2006-07 2007-08
pass
enge
r trip
s pe
r wee
k (m
illio
n)
100 000
105 000
110 000
115 000
120 000
125 000
130 000
135 000
140 000
serv
ices
per
wee
k
Passenger trips (LHS) Services scheduled (RHS)
Source: Department of Transport
Service Delivery 2009-10 Appendix B 407

QUALITY HEALTH AND EDUCATION
High quality, accessible health and community services
Health greatly influences quality of life. High quality health and community services need to be available to all Victorians when they need them to preserve and restore good health. Better access to hospital, community health, dental, aged care, mental health, disability, alcohol and drug, and children’s and family support services, particularly in rural and regional communities, is crucial.
The health of Victorians will improve Long-term improvements in the health of Victorians can be measured through average life expectancy and the quality of life during those years. Quality of life is measured by indicators of physical and mental wellbeing as perceived by Victorians.
Self-rated health statusThe Department of Human Services’ Victorian Population Health Survey (VPHS) collects data on the self-rated health status of Victorians, which is a strong predictor of morbidity and mortality trends, as well as health care use. The proportion of adult Victorians reporting their health as ‘excellent’, ‘very good’ or ‘good’ has remained above 80 per cent for both males and females since 2001 (see Chart B.17). The difference between rural/ regional and urban responses is not substantial and is consistent with previous years.
Chart B.17: Self rated health status, percentage of respondents reporting ‘excellent’, ‘very good’ and ‘good’
50
60
70
80
90
100
2001 2002 2003 2004 2005 2006 2007 2008
per c
ent
Males Females
50
60
70
80
90
100
2001 2002 2003 2004 2005 2006 2007 2008
per c
ent
Urban Rural
408 Appendix B Service Delivery 2008-09

Source: Department of Human Services’ Victorian Population Health Survey
Psychological distressThe VPHS collects data on a measure of psychological distress – the Kessler 10. The Kessler 10 is a set of ten questions designed to categorise levels of psychological distress over a four-week period. It cannot be used to determine the prevalence of major mental illnesses (such as psychosis) but, like self-rated health status, is closely correlated with medical diagnoses of anxiety, depression and worry (psychological distress). The proportion of Victorians reporting no or low levels of psychological distress (falling into the ‘low risk’ category of the Kessler 10) has increased since 2001 (see Chart B.18). A lower proportion of females report no or low levels of psychological distress than males. There are a higher proportion of persons living in rural/regional areas reporting no or low levels of psychological distress than those living in urban areas.
Chart B.18: Psychological distress, percentage of respondents reporting no or low levels of psychological distress
50
60
70
80
90
100
2001 2002 2003 2004 2005 2006 2007 2008
per c
ent
Urban Rural
50
60
70
80
90
100
2001 2002 2003 2004 2005 2006 2007 2008
per c
ent
Males Females
Source: Department of Human Services’ Victorian Population Health Survey
Life expectancyIn line with the above self-reported health measures, Victorians enjoy a long life expectancy that has been consistently above the Australian average. In 2007, the Victorian male average life expectancy was 79.5 years and the female life expectancy was 83.8 years.
Service Delivery 2009-10 Appendix B 409
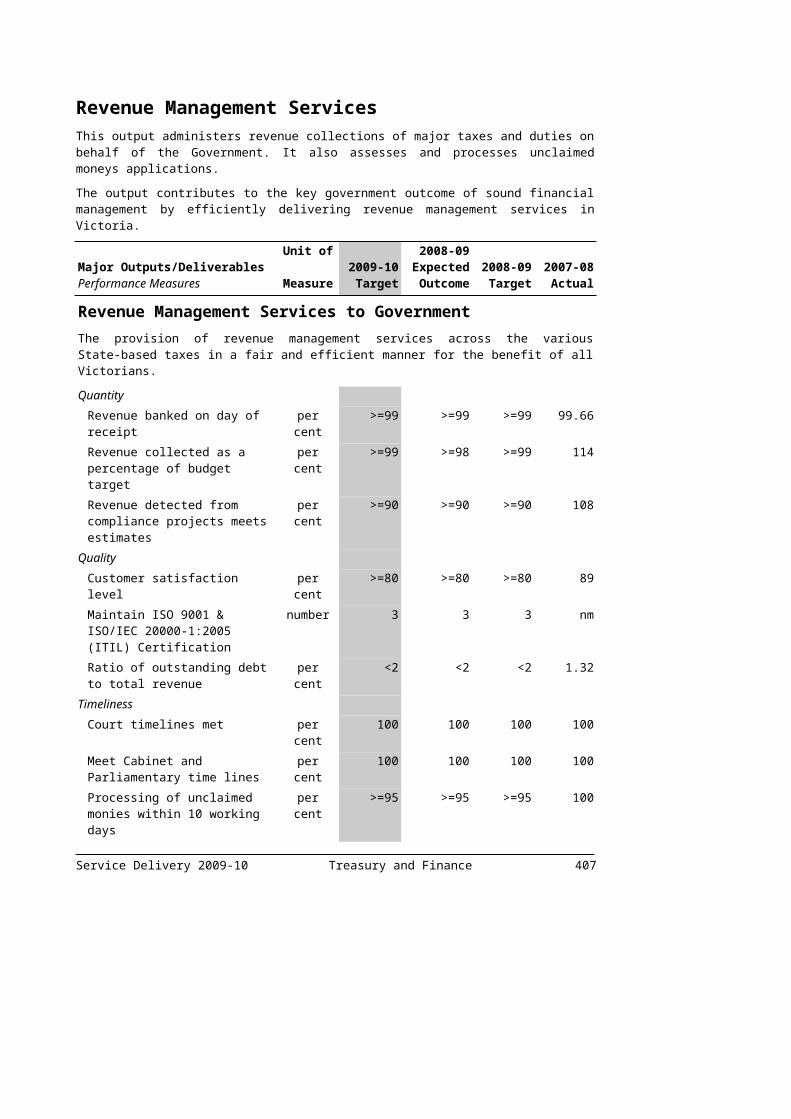
These are average figures for all Victorians, and do not represent estimated average life expectancy for certain populations within the State. The Australian Bureau of Statistics (ABS) does not currently provide annual updates of Indigenous life expectancy, however the recognised life expectancy for Indigenous Victorians is considerably less than the Victorian average. Indigenous life expectancy, based on deaths in Victoria, New South Wales, ACT and Tasmania combined between 1996 and 2001, was estimated at 60.0 years for males, and 65.1 years for females.
Victoria has committed to the COAG targets on Indigenous health and life expectancy and is working with all other States, Territories and the Commonwealth to develop datasets and supplementary indicators to use in addition to five year census data.
410 Appendix B Service Delivery 2008-09

ABS has recently released a discussion paper with experimental Indigenous life expectancy estimates derived using a different statistical method. Life expectancy estimates using this method will differ from those previously published. ABS is to advise on the timing of the release of these experimental Indigenous life tables and life expectancy estimates.
Chart B.19: Average life expectancy at birth in Victoria(a)
50
55
60
65
70
75
80
85
90
1999 2000 2001 2002 2003 2004 2005 2006 2007
aver
age
life
expe
ctan
cy (y
ears
)
Victorian Males Victorian Females
Source: Australian Bureau of Statistics (Cat. Nos. 3105.0.65.001 for years 1999 to 2001 and 3302.2.55.001 for years 2002 to 2005)
Note: (a) According to ABS convention each year’s life expectancy estimate is the average of the prior three
year period.
The wellbeing of young children will improve Improving the wellbeing of young children can overcome disadvantage and substantially improve their quality of life as adults.
BreastfeedingBreastfeeding has a range of positive effects on the survival, development and growth of babies. Breastfeeding also contributes to the health and well-being of mothers, including some protection against breast cancer (Australian Institute of Health and Welfare 2005). As shown in Chart B.20 the proportion of Victorian infants fully breastfed in 2007-08 is at the same level as the previous year. At three months, over half of Victorian infants are still breastfed and the downwards trend up to 2004 has been reversed. By six months, this proportion is reduced to less than 40 per cent.
Service Delivery 2009-10 Appendix B 411

Chart B.20 Breastfeeding rates at 3 and 6 months
0
20
40
60
80
100
1999-00 2000-01 2001-02 2002-03 2003-04 2004-05 2005-06 2006-07 2007-08
per c
ent
3 months 6 months
Source: Maternal and child health services, Department of Human Services
ImmunisationImmunisation against communicable diseases has been shown to reduce morbidity and mortality from a range of childhood diseases. Immunisation offers protection for individual children and also reduces the rate at which these diseases circulate within the broader community. Evidence suggests that a minimum of 90 per cent vaccination coverage is required to interrupt the ongoing transmission of diseases (Australian Institute of Health and Welfare 2005).
A child is considered fully immunised according to the Australian Childhood Immunisation Register (ACIR) if they have had the following vaccines at the measured ages:
At 12-<15 months they have had all scheduled vaccine doses of diphtheria, tetanus and pertussis (DTP), poliomyelitis, Haemophilus influenzae type b (HIB) and Hepatitis B;
At 24-<27 months they have had all scheduled vaccine doses of DTP, poliomyelitis, HIB, Hepatitis B, measles, mumps and rubella (MMR); and
At 60-<63 months (previously 72-<75 months) they have had all scheduled vaccine doses of DTP, poliomyelitis, HIB, Hepatitis B and MMR vaccines.
412 Appendix B Service Delivery 2008-09

As shown in Chart B.21, Victorian immunisation rates for children have increased steadily since 1999. They have exceeded 90 per cent for children aged 12-<15 months since 2000, for children aged 24-<27 months since 2003 and for children aged 72-<75 months since 2007. Maintaining vaccine coverage of 90 per cent and greater in all three cohorts during periods of complicated changes to the childhood vaccine schedule is challenging.
Chart B.21: Proportion of Victorian children fully immunised
50
60
70
80
90
100
1999 2000 2001 2002 2003 2004 2005 2006 2007 2008
fully
imm
unis
ed (p
er c
ent)
12-<15 Months 24-<27 Months 60-<63 Months
Source: Australian Childhood Immunisation Register
Service Delivery 2009-10 Appendix B 413

Kindergarten attendanceEducational and social outcomes are also important when measuring the wellbeing of young children. Attendance at kindergarten by four year olds in Victoria is used as a proxy measure for these outcomes in this report. Since 1999, participation rates have remained consistently over 90 per cent (see Chart B.22). Participation figures are based on the number of four year old children enrolled in their first year of state-funded kindergarten by the ABS estimated resident population of children. The participation rate was 92.4 per cent in 2008, an increase compared to 91.8 per cent in 2007.
Chart B.22 Rate of four year olds participating in kindergarten in Victoria(a)
0
20
40
60
80
100
1999 2000 2001 2002 2003 2004 2005 2006 2007 2008
per c
ent
Source: Department of Education and Early Childhood Development and Australian Bureau of Statistics (Cat. No. 3101.0)
Note: (a) Participation rate is calculated in July each year using the latest available population estimates from
the Australian Bureau of Statistics.
Waiting times (emergency, elective and dental) will be reduced The Department of Human Services collects a range of data about the performance of Victoria’s public hospital system, including the number of patients in emergency departments and the number of patients waiting for elective surgery that are treated within ideal times.
414 Appendix B Service Delivery 2008-09

Emergency waiting timesSince 2000, 100 per cent of Triage Category 1 emergency patients (those requiring resuscitation) were seen immediately. In 2007-08, 78 per cent of Triage Category 2 emergency patients (emergency) were seen within the ideal time, below the target of 80 per cent. For Triage Category 3 emergency patients (urgent), 68 per cent were seen within the ideal time, below the target of 75 per cent (see Chart B.23).
Growth in emergency department activity, up 3.6 per cent from 2006-07 to 2007-08, continues to present a challenge for emergency access performance. The increase in emergency presentations has been accompanied by a 6.3 per cent increase in Triage Categories 1 to 3 presentations from 2006-07 to 2007-08.
Chart B.23: Emergency treatment within ideal times in Victorian hospitals(a)
-
20
40
60
80
100
1999-00 2000-01 2001-02 2002-03 2003-04 2004-05 2005-06 2006-07 2007-08
patie
nts
(per
cen
t)
Emergency - Resuscitation Emergency - Emergency Emergency - Urgent
Source: Department of Human Services, Victorian Emergency Minimum Dataset
Notes:(a) Emergency-resuscitation: Triage Category 1 (desirable to be treated immediately);
Emergency-emergency: Triage Category 2 (desirable to be treated within 10 minutes);Emergency-urgent: Triage Category 3 (desirable to be treated within 30 minutes).
Elective surgery time to treatmentFor patients requiring elective surgery over the past nine years, 100 per cent of urgent patients (Category 1) were treated within 30 days (see Chart B.24). In 2007-08, 70 per cent of semi-urgent (Category 2) patients were treated within 90 days. The number of semi-urgent patients treated has increased from 56 000 in 1999-2000 to 62 000 in 2007-08. The median time to treat urgent and semi-urgent patients in 2007-08 was seven days and 53 days respectively. Service Delivery 2009-10 Appendix B 415
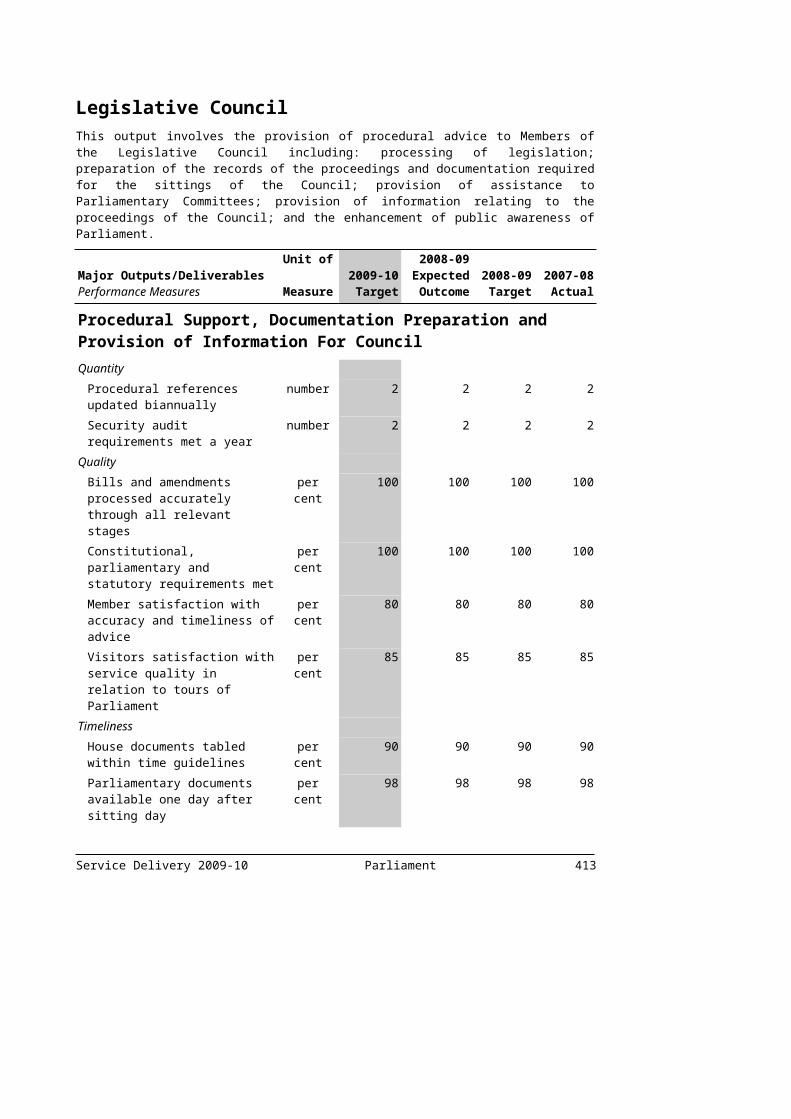
In 2008, the Victorian and Commonwealth Government provided an additional $60 million dollars for elective surgery to Victoria’s public hospitals. This additional funding resulted in more than 13 400 additional elective surgery procedures than in 2007. Victoria’s public hospitals treated 143 817 elective surgery patients in 2008 compared to 130 340 elective surgery patients treated in 2007.
Chart B.24 Elective treatment within ideal times in Victorian hospitals(a)
-
20
40
60
80
100
1999-00 2000-01 2001-02 2002-03 2003-04 2004-05 2005-06 2006-07 2007-08
patie
nts
(per
cen
t)
Elective - Urgent Elective - Semi-urgent
Source: Department of Human Services, Elective Surgery Information System
Note:(a) Elective–urgent: Category 1 (desirable to be admitted within 30 days); and Elective-semi urgent:
Category 2 (desirable to be admitted within 90 days).
Timeliness of dental health servicesThe Department of Human Services collects data on waiting times for dental treatments in the public system. Chart B.25 shows that waiting times have reduced significantly for priority dentures and non-urgent general and denture care. Clients with urgent dental needs are assessed within 24 hours.
416 Appendix B Service Delivery 2008-09
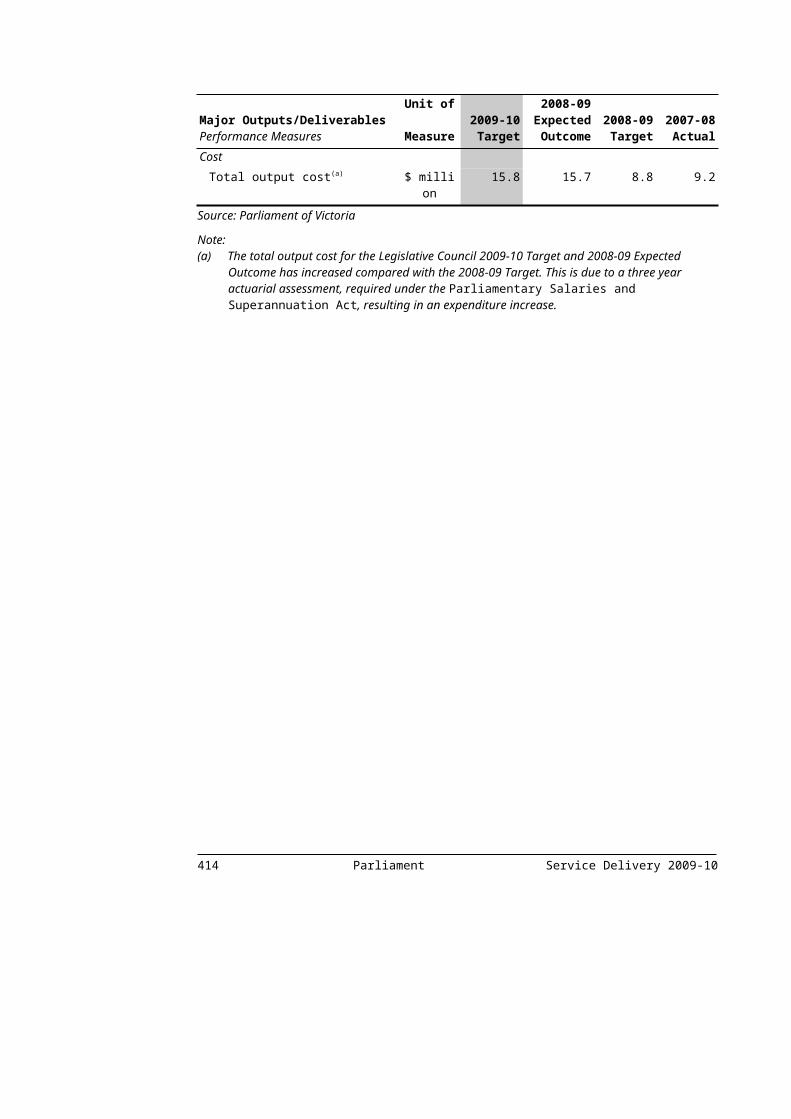
Chart B.25 Average public dental waiting times in Victoria
0
5
10
15
20
25
30
35
40
1999-00 2000–01 2001–02 2002–03 2003–04 2004-05 2005-06 2006-07 2007-08
mon
ths
Priority Denture General Care Denture Care
Source: Department of Human Services, Dental Health Services Victoria, Community Dental program
Levels of confidence in health and community services will increase The quality and accessibility of health and community services can be judged by the level of confidence Victorians have in those services. The VPHS covers satisfaction rates with selected health services, including public hospitals, community health centres, home nursing, kindergartens, and maternal and child health centres. Satisfaction with the surveyed range of Victorian health and community services remains high (see Chart B.26). Rural/regional respondents were generally more satisfied with the three services surveyed than urban respondents.
In 2008, of those persons who had used the services, the proportion who were ‘very satisfied’ or ‘satisfied’ were:
84.2 per cent of rural/regional respondents and 78.7 per cent of urban respondents who had used public health services;
91.1 per cent of rural/regional respondents and 89.3 per cent of urban respondents who had kindergarten or preschool services; and
89.4 per cent of rural/regional respondents and 87.3 per cent of urban respondents who had used maternal/child health services.
Service Delivery 2009-10 Appendix B 417

Chart B.26: Victorians’ satisfaction with health and community services(a)
0
10
20
30
40
50
60
70
80
90
100
2001
2002
2003
2004
2005
2006
2007
2008
2001
2002
2003
2004
2005
2006
2007
2008
2001
2002
2003
2004
2005
2006
2007
2008
Public Hospital Kindergarten/ pre-school Maternal/ Child health centre
per c
ent
Source: The Department of Human Services Victorian Population Health Survey
Note:(a) An extra category was added from 2004 onwards to enable respondents to answer ‘no response.’ This
category is included in the calculation of satisfaction rate.
418 Appendix B Service Delivery 2008-09

QUALITY HEALTH AND EDUCATION
High quality education and training for lifelong learning
Education is the key to creating a dynamic, successful community and improving the opportunities in life for all Victorians. Victoria must be a place where children get the best possible start to their education and where people of all ages are motivated to keep learning.
The proportion of Victorian primary students achieving the national benchmark levels for reading, writing and numeracy will be at or above the national average. Developing strong literacy and numeracy skills in primary school is the basis for later achievement in education and training, and for full social and economic participation.
The Victorian Curriculum and Assessment Authority administers national literacy and numeracy tests annually to assess the literacy and numeracy standards of Victorian primary school students. In previous years, the State’s literacy and numeracy performance was measured and reported against national benchmarks. However, in 2008 a new data set and methodology was established to measure national and literacy standards against national minimum standards. The minimum standard is calculated at a national level by the Ministerial Council on Education, Employment, Training and Youth Affairs (MCEETYA). Results for 2008 were released through MCEETYA in December 2008. Previously reported national benchmark data are not comparable to the new national minimum standard results.
The percentage of year three and year five Victorian students achieving the national literacy and numeracy minimum standards in 2008 was above the national average. In 2008 more than 95 per cent of Victorian year three students achieved the national minimum standard in reading, writing and numeracy (see Chart B.27). At year five, more than 94 per cent of Victorian students achieved the national minimum standard in numeracy and more than 93 per cent achieved the national minimum standard in reading and writing. Generally a higher proportion of female than male students achieved national minimum standards for year three and year three in Victoria and Australia.
Service Delivery 2009-10 Appendix B 419
Chart B.27: Percentage of Year 3 and Year 5 primary students achieving national minimum standards in 2008(a)
40
50
60
70
80
90
100
Year 3 Year 5 Year 3 Year 5 Year 3 Year 5
Reading Writing Numeracy
per c
ent
Victoria Australia
Source: 2008 National Assessment Program, Literacy and Numeracy (NAPLAN) data
Note:(a) The ‘whisker’ at the top of the bar shows the margin of error. There is a 95 per cent statistical
confidence that the true percentage of students achieving the national benchmark lies within this range.
The proportion of Indigenous primary students in Victoria and the whole of Australia achieving national minimum standards was substantially below that for the respective cohort for all students in reading, writing and numeracy. However, Victorian Indigenous primary students performed well above the national Indigenous average (see Chart B.28).
420 Appendix B Service Delivery 2008-09

Chart B.28: Percentage of Year 3 and Year 5 Indigenous primary students achieving national minimum standards in 2008(a)
40
50
60
70
80
90
100
Year 3 Year 5 Year 3 Year 5 Year 3 Year 5
Reading Writing Numeracy
per c
ent
Victoria Australia
Source: 2008 National Assessment Program, Literacy and Numeracy (NAPLAN) data
Note:(a) The ‘whisker’ at the top of the bar shows the margin of error. There is a 95 per cent statistical
confidence that the true percentage of students achieving the national benchmark lies within this range.
By 2010, 90 per cent of young people in Victoria will successfully complete year 12 or its educational equivalent The completion of year 12 or its equivalent qualification, such as an apprenticeship or traineeship, is a foundation for stable and rewarding employment. This measure uses data from the ABS Survey of Education and Work to estimate the number of Victorians aged 20 to 24 who have attained Year 12 or a vocational certificate at the Australian Qualifications Framework Level Two or above. The ABS has recently changed the method for the calculation of this measure resulting in historical data being revised. Use of the new methodology has resulted in an approximate 1 per cent reduction in previously reported figures from 2002 to 2006 on a state and national basis.
In 2008, 88.7 per cent of Victorians aged 20 to 24 had completed year 12 or its educational equivalent. This has increased from 81.8 per cent in 2000 and was above the 2008 national average of 84.2 per cent.
Service Delivery 2009-10 Appendix B 421
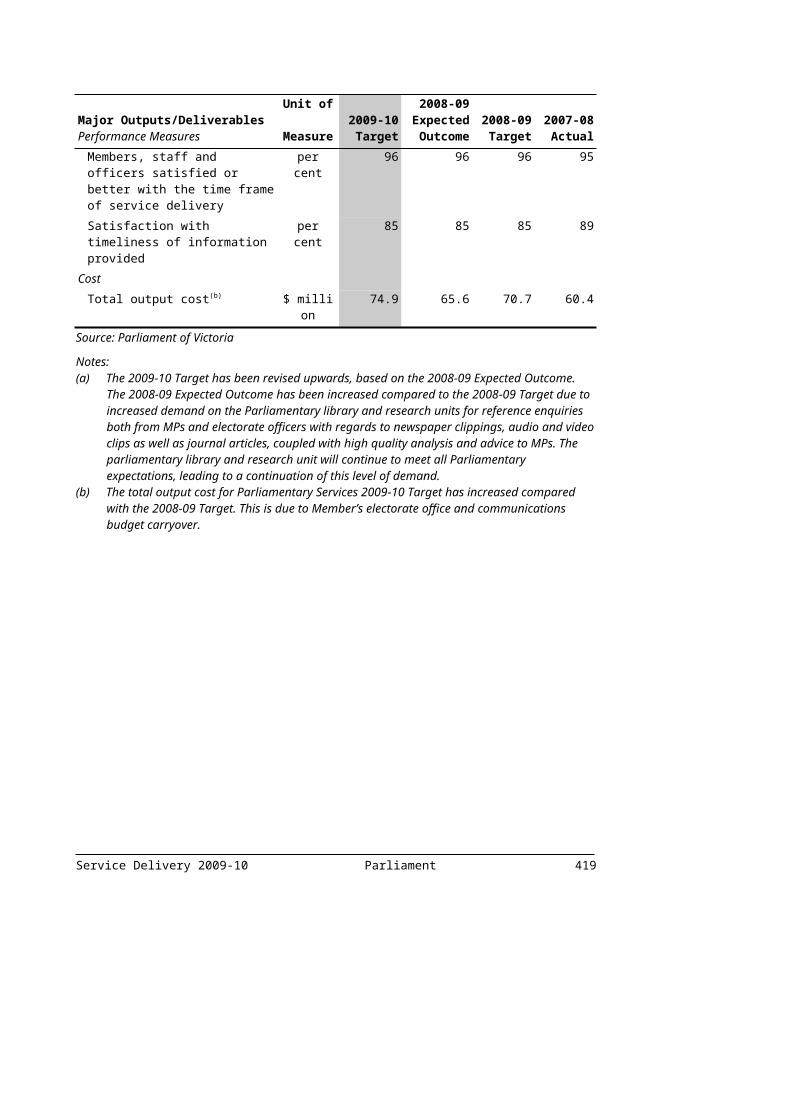
Chart B.29: Percentage of 20-24 year olds who attained year 12 or its educational equivalent
50
55
60
65
70
75
80
85
90
95
100
1999 2000 2001 2002 2003 2004 2005 2006 2007 2008
per c
ent
Victoria Australia
Source: ABS Survey of Education and Work
The level of participation in vocational education and training of adults aged 25 to 64 years will increaseTo participate in the modern economy, more adult Victorians need to increase their skills through further education and training. Skills Victoria collects data on the number of 25 to 64 year olds participating in vocational and education programs.
Number of studentsFrom 1999, Victorian Education and Training (VET) student numbers among 25 to 64 year olds trended upwards peaking at almost 307 000 students in 2003. This number declined to just over 264 000 in 2006, and grew again to more than 274 000 students in 2007.
It is likely the decline between 2003 and 2006 was due to a number of factors including the strength of the Victorian labour market, shifting patterns of participation towards courses of longer duration and a decline of 32 per cent in student numbers in the Adult and Community Education (ACE) sector.
422 Appendix B Service Delivery 2008-09

Chart B.30: Number of 25 to 64 year olds who participated in a vocational education and training program in Victoria(a)
20
25
30
35
40
45
50
55
60
1999 2000 2001 2002 2003 2004 2005 2006 2007
stud
ent c
onta
ct h
ours
('00
0,00
0)
Source: Skills Victoria Student Statistical Collection, 1999-2007
Note: (a) Figures represent numbers over the whole year and include all students irrespective of the source of
funding
Student contact hoursVET student contact hours among 25 to 64 year olds increased from just over 40 million in 1999 to more than 53 million in 2007. However, student contact hours were broadly stable over 2004 to 2006, broadly reflecting student numbers in this age group over this period.
The overall growth in student contact hours can be attributed to a number of factors including:
an increase in training at higher qualification levels in courses of longer duration;
the shift of students away from shorter non accredited training into accredited training; and
Skills Victoria actively purchasing student contact hours through the establishment of funding agreements with VET providers in order to target priority areas.
Service Delivery 2009-10 Appendix B 423

Chart B.31: Contact hours of 25 to 64 year olds who participated in a vocational education and training program in Victoria(a)(b)(c)
0
50
100
150
200
250
300
350
400
1999 2000 2001 2002 2003 2004 2005 2006 2007
num
ber o
f stu
dent
s ('0
00)
Source: Skills Victoria Student Statistical Data Collection, 1999-2007
Notes: (a) Figures are for the calendar year and are based on all funding sources.(b) Student Contact Hours (SCH) is a key measure designed to enable the reported quantum of VET
activity in Victoria to be reliably measured each year and to enable comparisons to be made against previous years.
(c) Student Contact Hours collected by Skills Victoria refers to the hours of teaching activity (including assessment times) that the provider schedules for a module or unit of competency enrolment.
424 Appendix B Service Delivery 2008-09
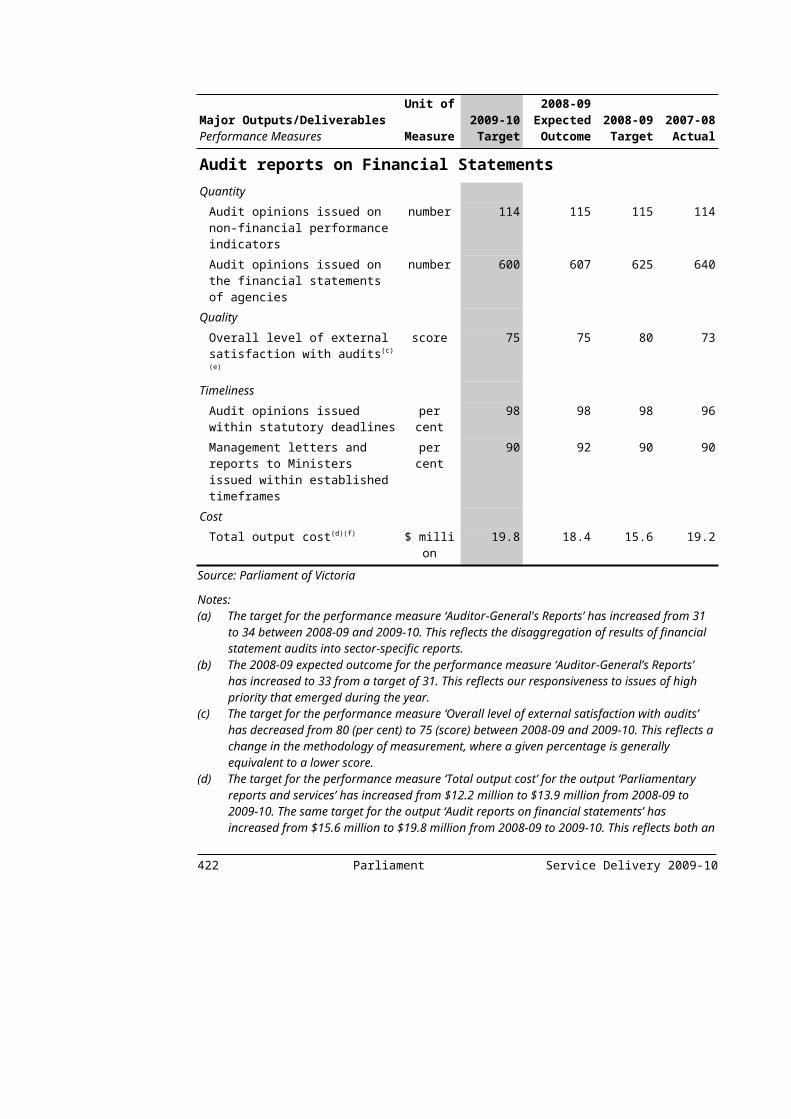
HEALTHY ENVIRONMENT
Protecting the environment for future generations
The natural environment sustains every aspect of our lives. Victoria must actively conserve and manage it in order to achieve our social and economic goals. The State has magnificent alpine, desert, rainforest, grassland, wetland, marine and coastal environments – all of which are critical for the survival of our precious native plants and animals and must be preserved for future generations to enjoy.
The health of Victoria’s rivers will improve significantly by 2010. In particular, the Snowy River will be returned to 21 per cent of its original flow by 2011, and 28 per cent over time.
Waterway healthRiver health in Victoria is measured using an integrated monitoring tool known as the Statewide Index of Stream Condition (ISC). The ISC assessment was conducted in 1999 and 2004 and found that deterioration in stream condition appears to have been controlled, with approximately 21 per cent of major rivers and tributaries in good or excellent condition. The ISC program occurs every five years to assess the long-term effectiveness of the river health rehabilitation programs in Victoria. The next ISC is scheduled for 2010.
Snowy RiverUnder the Snowy Intergovernmental Agreement the progressive target for the Snowy River is for a long-term average annual flow of 142 000 megalitres (equivalent to 15 per cent of its original flow) to be returned immediately below Lake Jindabyne by June 2009 and 212 000 megalitres (equivalent to 21 per cent of its original flow) by June 2012. As of June 2008, the total contribution of water entitlement towards the target for the Snowy River was 101 254 megalitres, jointly met by Victoria (23 496 megalitres) and New South Wales (77 758 megalitres).
The Snowy River’s environmental allocation for the 2008-09 water year was 57 877 megalitres. Under the Snowy Intergovernmental Agreement, water is provided at the reliability of its source based on allocations in the source valley in the previous year. As such, the allocation for environmental flow was less than the total entitlement due to current drought conditions. The volume available for release to the Snowy River from Lake Jindabyne for the 2008-09 water year was equivalent to 5 per cent of the long-term annual natural flow.
Service Delivery 2009-10 Appendix B 425
The quality of air and drinking water will improve
Air qualityThe Air Quality Index produced by the Environment Protection Authority (EPA) Victoria indicated an overall improvement in air quality in 2008 compared to 2006 and 2007, and this is mainly a reflection of the absence of major bushfires that year. Non-urban issues, however, continue to have an impact on air quality across Victoria and have led to numerous days of ‘poor’ quality (2008 was affected by dust storms and increased levels of planned burning to help mitigate the effects of uncontrolled bushfires). Despite these events, air quality in Central Melbourne, Geelong and the Latrobe Valley was rated ‘good’ to ‘very good’ on the great majority of days (Chart B.32).
Chart B.32: Percentage of days with ‘good’ to ‘very good’ air quality in Central Melbourne, Geelong and the Latrobe Valley
0
20
40
60
80
100
1999 2000 2001 2002 2003 2004 2005 2006 2007 2008
perc
enta
ge o
f day
s
Central Melbourne Geelong Latrobe Valley
Source: EPA Victoria Air Quality Index
Drinking waterThe quality of drinking water is usually determined by measuring the incidence of the faecal indicator bacterium Escherichia coli (E. coli). This is a direct indicator of the public health risk associated with drinking water. Performance is measured by looking at the percentage of water sampling localities that complied with the State’s water quality standard for E. coli. In July 2005 the Safe Drinking Water Regulations commenced, which require that at least 98 per cent of drinking water samples collected over any 12 month period in each water sampling locality be free of E. coli.
426 Appendix B Service Delivery 2008-09

In the 2007-08 reporting period compliance across the State's 484 water sampling localities with the E. coli water quality standard improved from 99.0 per cent to 99.2 per cent (in 2005-06 reporting period, 95.5 per cent of 493 localities where drinking water was supplied met the standard).
Chart B.33 illustrates the proportion of compliant water localities over the last three reporting periods and illustrates a gradual improvement in compliance over time.
Chart B.33: Escherichia coli compliance 2004-05 to 2007-08
50
60
70
80
90
100
2004-05 2005-06 2006-07 2007-08
wat
er w
ithou
t E. c
oli (
per c
ent)
Source: Department of Human Services, Drinking Water Regulation Program
The extent and quality of native vegetation will increaseThe Department of Sustainability and Environment (DSE) 2008 Native Vegetation Net Gain Accounting: First Approximation Report provided the baseline (as at 2005-06) from which estimates of the net average annual rate of change in native vegetation extent and quality will be measured. These baseline data indicated the situation on both public and private land, and the relative contributions of various sources of loss and gain, as summarised in Table B.2.
Table B.2: Baseline data of the net average annual rate of change in native vegetation extent and qualityAverage annual rates of change Public Land Private LandGains sub total +8,760 Habitat Ha /yr +4,560 Habitat Ha /yrLosses sub total 2,860 Habitat Ha /yr 14,550 Habitat Ha /yrNet Outcomes 2005 06 +5,900 Habitat Ha /yr (a) 9,990 Habitat Ha /yr (a)
Source: DSE (2008) Native Vegetation Net Gain Accounting: first approximation report
Service Delivery 2009-10 Appendix B 427

Given the inherently fluctuating dynamics of vegetation quality, the relatively slow underlying rate of change, and the cost of acquiring and processing field data and satellite imagery, a realistic period between statewide assessments is in the order of five years. However, some components of the accounting are recorded annually and broadly indicate the trend for clearing of remnants/forest is stable, and for improvements of private land remnants through government incentives is positive (see Table B.3).
Table B.3: Annually reported components, Net Gain AccountingFor remnant vegetation clearing applications processed by DSE
For incentives to improve private land remnants (through BushTender and
related projects)2005-06 Not reported ~ 12 100 ha yielding
~ 200 Habitat Ha /yr improvement (as reported in DSE 2008)
2006-07 ~ 260 ha lost through approved clearing~ 1 500 ha improved through offsets (as
reported in DSE 2008)
~ 14 300 ha yielding~ 440 Habitat Ha /yr improvement
2007-08 ~ 290 ha lost through approved clearing ~ 1 780 ha improved through offsets
~ 21 800 ha yielding~ 720 Habitat Ha /yr improvement
Source: DSE (2008) Native Vegetation Net Gain Accounting: first approximation report, Native Vegetation Programs, Biodiversity and Ecosystem Services Division, DSE and Statewide Services, DSE.
The condition of our land will improve as the impact of salinity and soil degradation is reducedMeasuring changes in the condition of Victoria’s land is a major challenge. The Land and Biodiversity at a Time of Climate Change Green Paper (a discussion paper), released on 6 April 2008, proposed a set of headline indicators. One of those indicators is the land health index. This index brings together different measures of the condition of soil and land (e.g. erosion, invasive plants and animals, land management). It will be used to detect changes in land condition over a relatively short time period (a few years). This means it will be useful for measuring progress towards goals like decreasing the impact of salinity and soil degradation, which tend to operate in much longer time frames. Trials of the index will be completed to coincide with the release of the Land and Biodiversity at a Time of Climate Change White Paper (a policy paper), which is due to be released in 2009.
428 Appendix B Service Delivery 2008-09
Soil erosion is particularly important to land condition because it poses a threat to both farmland and native flora and fauna. For example, soil erosion is an imminent threat to important natural assets like Mallee and Wimmera farmland (wind erosion), the Ovens River (gully erosion), the Mitchell River and the Gippsland Lakes (tunnel erosion). Across the State there are at least 17 large scale projects working with landholders to specifically prevent and manage soil erosion.
One example of this work is the East Gippsland tunnel erosion project in the Bairnsdale foothills. Around 15 000 hectares in the area north-west of Bairnsdale are prone to a form of soil erosion called tunnel erosion, which can severely damage land, sometimes rendering it unusable for farming or any other use.
Over the last four years, the Department of Sustainability and Environment, the Department of Primary Industries and the East Gippsland Catchment Management Authority have worked with local landowners to develop a viable long term treatment. Using earth works, soil treatments (like gypsum), pasture replanting and revegetation with locally indigenous plants, they have now rehabilitated some 445 hectares, built 37 kilometres of fences and planted some 10 500 native trees. The real value of this work to the community is that it has prevented approximately 712 tonnes of soil from entering the Mitchell River and the Gippsland Lakes. The land was out of production for at least a year, but it is now a picturesque mix of healthy productive pastures and native vegetation.
Service Delivery 2009-10 Appendix B 429

HEALTHY ENVIRONMENT
Efficient use of natural resources
A better quality of life for Victorians now and in the future relies upon the community’s ability to use Victoria’s natural resources, such as water, coal, timber and gas, wisely and effectively. Protecting the environment and the long-term health and prosperity of the Victorian community depends on efficient and sustainable use of natural resources.
Greenhouse gas emissions from the production and use of energy will be reduced
Greenhouse gas emissionsVictoria’s greenhouse gas inventory is compiled on an annual basis by the Commonwealth Department of Climate Change (previously the Australian Greenhouse Office). Total Victorian greenhouse gas emissions are measured by CO2 (carbon dioxide) equivalent released into the atmosphere, enabling comparisons of emissions of various greenhouse gases by their global warming potential. During 2007, total greenhouse gas emissions in Victoria were 119.16 mega tonnes of CO2 equivalent, a 3 per cent increase since 1999, but a 2.3 per cent decrease from the previous year’s level. The energy industries sub sector is the largest contributor of the total Victorian greenhouse gas emissions. The greenhouse gas emissions intensity of the Victorian economy can be determined by relating total emissions to the value of GSP. The emissions intensity of the Victorian economy declined 18 per cent between 1999 and 2007. That is, for each dollar of GSP created, less greenhouse gases were emitted across this period.
430 Appendix B Service Delivery 2008-09
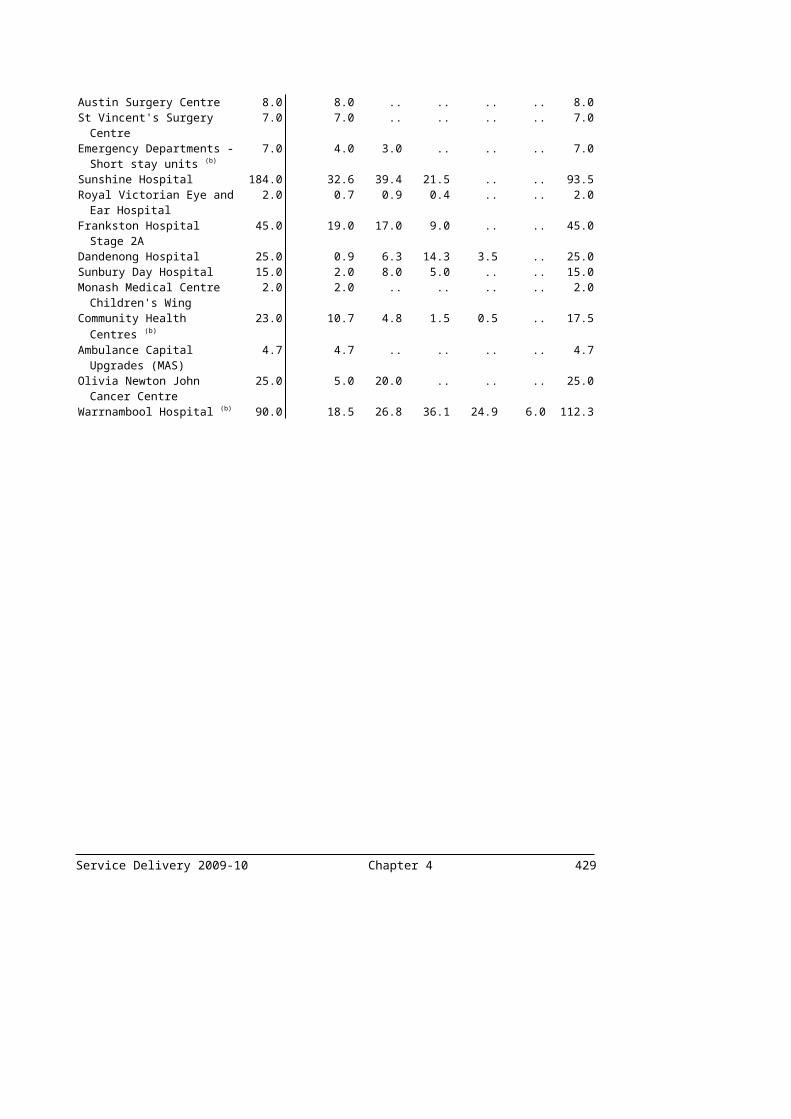
Chart B.34: Victorian greenhouse gas emissions(a)
85
90
95
100
105
110
115
120
125
1999 2000 2001 2002 2003 2004 2005 2006 2007
meg
aton
nes
(CO
2 eq
uiva
lent
)
400
450
500
550
600
650
700
750
800
tonn
es p
er m
illio
n G
SP
Total Net emissions (LHS) Emissions intensity (RHS)
Source: Department of Climate Change
Note:(a) Department of Climate Change has advised that the emissions data are preliminary and subject to
change when the final data is released in mid 2009.
Stationary energy greenhouse gas emissionsIn 2007, stationary energy (total energy minus transport energy) contributed to 67 per cent (79.85 million tonnes) of Victoria’s total net greenhouse gas emissions. Stationary energy emissions increased by 2.03 million tonnes between 1999 and 2007. The stationary emissions intensity of the Victorian economy declined 18.5 per cent between 1999 and 2007. That is, for each dollar of GSP created, fewer stationary energy related greenhouse gases were emitted across this period.
Service Delivery 2009-10 Appendix B 431
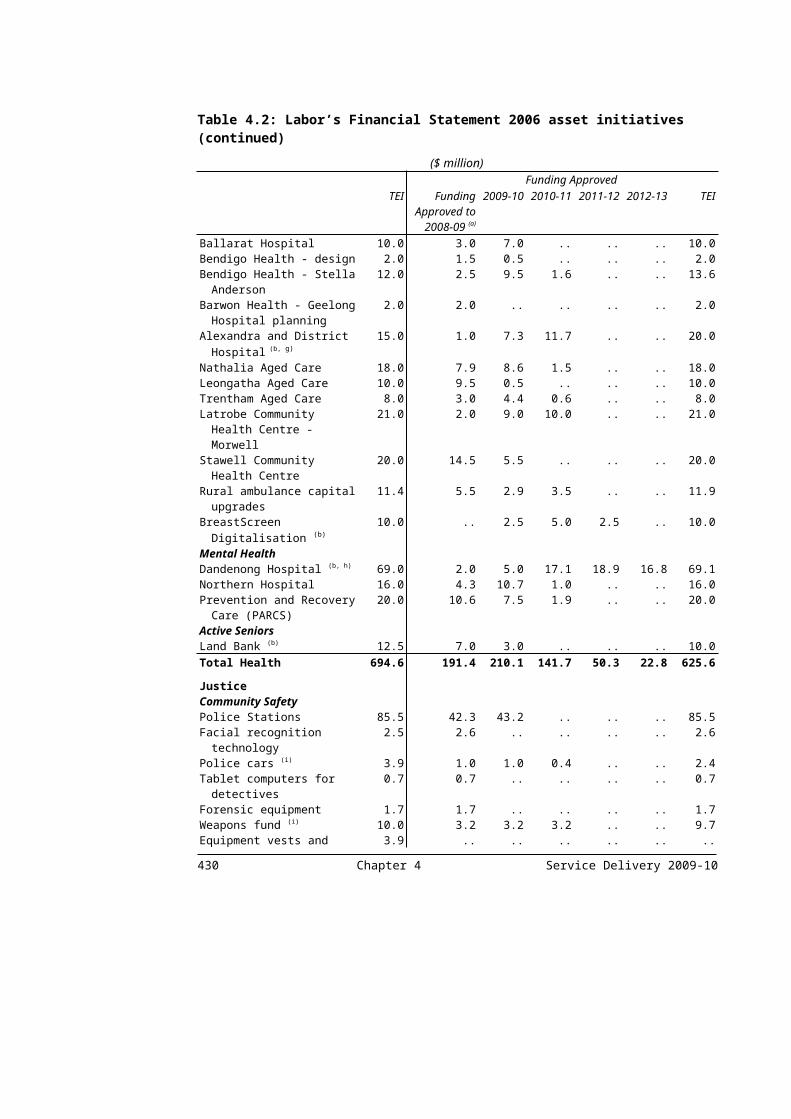
Chart B.35: Stationary energy greenhouse gas emissions per unit of GSP(a)
65
70
75
80
85
1999 2000 2001 2002 2003 2004 2005 2006 2007
meg
aton
nes
(CO
2 eq
uiva
lent
)
160
180
200
220
240
260
280
300
320
340
360
380
400
tonn
es p
er m
illio
n G
SP
Stationary energy emissions (LHS) Stationary energy emissions intensity (RHS)
Source: Department of Climate Change
Note:(a) Department of Climate Change has advised that the emissions data are preliminary and subject to
change when the final data is released in mid-2009.
More efficient use of water in agricultureEfficiency in the use of water in Victorian agriculture can be measured by examining both the water delivery systems and the on-farm water use.
Delivery system efficiencyChart B.36 shows the delivery system per cent efficiency against the gross water supply available. The variations in 2006-07 and 2007-08 can be attributed to the significant change in available water for these two years. As fixed losses in delivery systems remain constant from year to year, lower percentage efficiency is expected in years of low allocations. Efficiency of delivery systems is expected to improve in the next four years as government initiatives such as the Northern Victorian Irrigation Renewal Project are completed.
432 Appendix B Service Delivery 2008-09
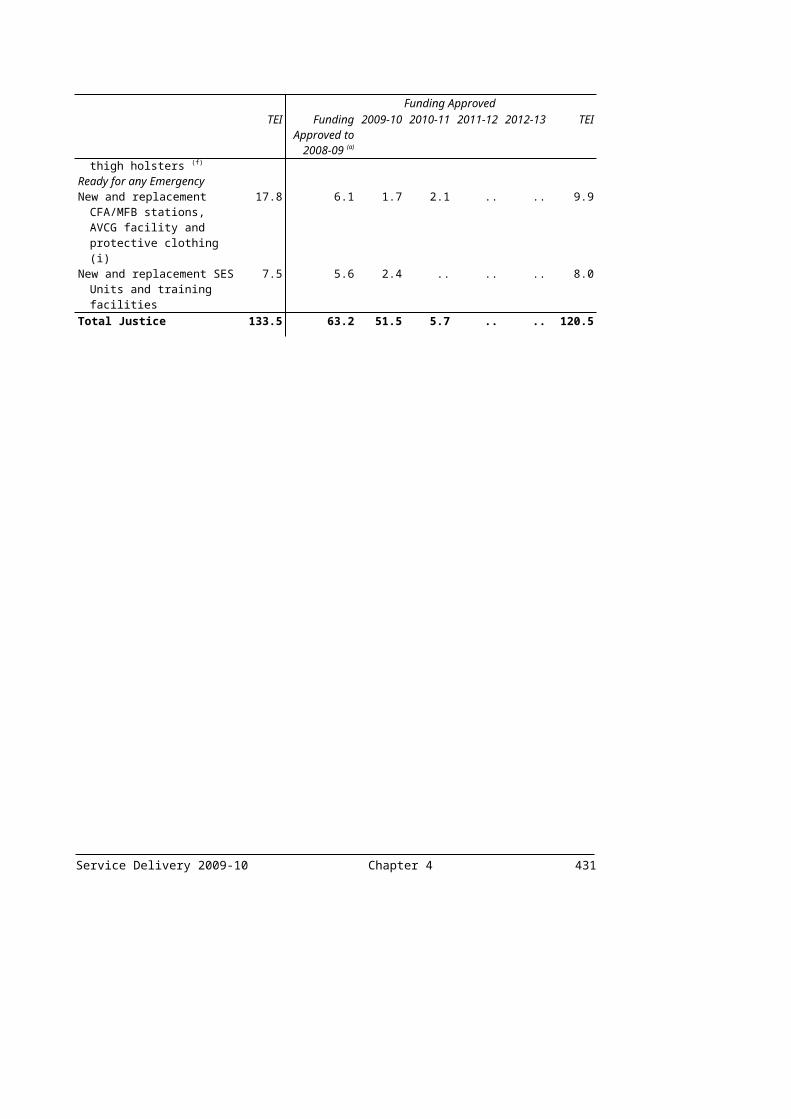
Chart B.36: Delivery system efficiency(a)
0
0.5
1
1.5
2
2.5
3
3.5
1999-00 2000-01 2001-02 2002-03 2003-04 2004-05 2005-06 2006-07 2007-08
ML
(mill
ions
)
50
55
60
65
70
75
80
per c
ent
Total Supply Delivery efficiency
Source: Annual report of water corporations, Goulburn Murray Water, First Mildura Irrigation Trust and Lower Murray Water for irrigation systems and Grampians Wimmera Mallee Water for domestic and stock system in the Wimmera Mallee district
Note:(a) Goulburn Murray Water systems exclude any losses incurred through harvesting to Waranga Basin.
On-farm water useThe irrigation areas benchmarked to date demonstrate that, in most cases, Victorian farming enterprises are conservative water users in relation to the commodities being irrigated.
The majority of dairy properties in the Nambrok-Denison Area supplied total water (excluding diversions) equivalent to or less than the pasture water requirement for both the 2000-01 and the 2005-06 irrigation seasons. Similarly, a reduction in irrigation intensity was observed over the same period as was the amount of water applied to dairy pastures.
Horticulture properties assessed in the Shepparton Irrigation Region are depicted as largely supplying water at or above the crop water (median – 1.1) requirement. No trend data are available.
Horticulture properties assessed in the Red Cliffs area depict water supply in excess of water requirement for most properties, with a drying trend over time. However, these results should be used with caution due to significant data limitations.
Service Delivery 2009-10 Appendix B 433

Table B.4: Median values of farm indicators for four irrigation areas in Victoria(a)(b)(c)
Efficiency of irrigated dairy and horticultural industries
measuring whether more or less water is applied to a crop than is
required for maximum yield if significantly greater than 1, water
has been applied in excess of crop requirement (megalitres per
megalitre)(b)
Irrigation intensity the amount of water applied to
a crop per area of land sowed with that crop
(megalitres per hectare)(c)
Central Goulburn Irrigation Area (dairy only)
1996-970.9
2003-040.6
1996-979.1
2003-047.1
Red Cliffs Irrigation District (horticulture and viticulture)
1996-971.8
2002-031.4
1996-9710
2002-038.9
Macalister Irrigation District (Nambrok-Denison Area) (dairy only)
2000-010.9
2005-060.6
2000-017.4
2005-066.3
Shepparton Irrigation Region (horticulture)
2003-041.1
2003-046.9
Source: 'Irrigation Water Use Efficiency Benchmarking-Final Report (Draft for Comment)’ Department of Primary Industries, Victoria
Note:(a) During 2006-07 the efficiency of on-farm water use was reported for the first time and provided
benchmark data for future three-yearly reports.(b) Efficiency of irrigated industries (ML/ML): the Red Cliffs indicator values have changed from those
previously reported to GVT due to modifications in the way crop water use estimates were derived.(c) Irrigation intensity (ML/ha): pers. comm. Andy McAllister DPI Project Manager for the Irrigation
Water Use Efficiency Benchmarking Project.
Melbourne’s water usage will be reduced by 15 per cent on a per capita basis from the 1990s’ average by 2010A reduction of 15 per cent in water usage on a per capita basis from the 1990s’ average consumption requires a permanent reduction from 423 to 360 litres per person per day. In the year ending June 2008, Melburnians consumed an average of 269 litres of water per person per day, a 35 per cent reduction in consumption on a per capita basis from the 1990s' average (Chart B.37).
434 Appendix B Service Delivery 2008-09
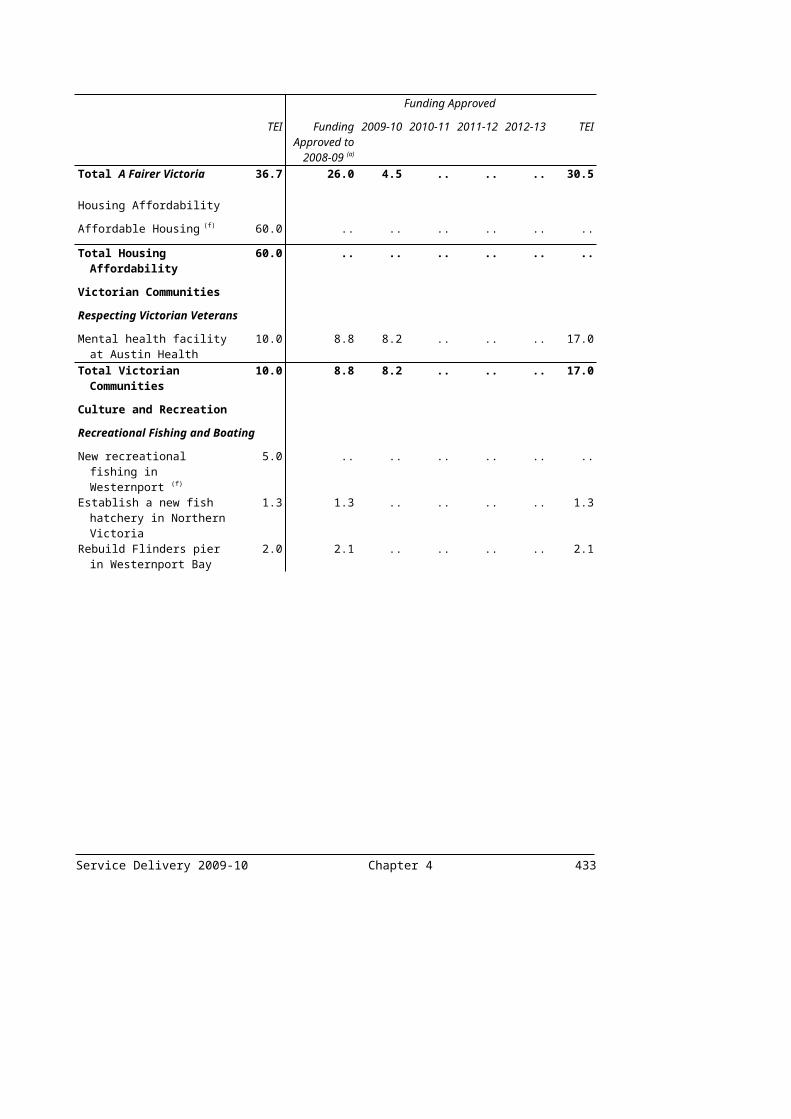
Chart B.37: Melbourne’s water consumption per capita per day
0
50
100
150
200
250
300
350
400
450
1999-00 2000-01 2000-02 2002-03 2003-04 2004-05 2005-06 2006-07 2007-08billing year
litre
s pe
r per
per
son
per d
ay
0
50
100
150
200
250
300
350
400
450
GL
per y
ear
Litres per person per day 1990s' average
Source: Melbourne Water
The quantity of solid waste generated will be reduced, and the amount recovered for reuse, recycling and energy generation will increaseTotal solid waste generated in Victoria includes waste that goes to landfill and materials recovered via recycling. Total waste generated in 2006-07 was 10.28 million tonnes which is an increase of 0.7 per cent from the previous year (10.2 million tonnes). However, despite the increase in the overall volume of waste generated, the Victorian economy is actually producing less waste per unit of GSP (46 tonnes per $ million GSP in 1999-2000 down to 42 tonnes per $ million GSP in 2006-07).
Service Delivery 2009-10 Appendix B 435

Waste generation per capita continues to increase over the long term. On average Victorians generated just over two tonnes of waste per person in 2006-07, a marginal increase of 9 kilo grams per person on 2005-06. The amount of material recovered from the solid waste stream in Victoria has steadily increased from 43 per cent in 1999-2000 to 62 per cent in 2006-07 (Chart B.38).
Chart B.38: Total waste production and waste generated per $ million GSP(a)
0
2
4
6
8
10
12
1999-00 2000-01 2001-02 2002-03 2003-04 2004-05 2005-06 2006-07
mill
ion
tonn
es
38
40
42
44
46
48
50
tonn
es p
er m
illio
n $G
SP
Waste recovered (LHS) Waste to landfill (LHS)Waste generated per $million GSP (RHS)
Source: Sustainability Victoria and ABS Cat 3218
436 Appendix B Service Delivery 2008-09

CARING COMMUNITIES
Building friendly, confident and safe communities
Friendly and confident communities have strong support networks, services and infrastructure to meet the needs of the people who live and work in them. Safety in communities depends on good communication, excellent policing and emergency services, and effective measures to address the causes of crime.
Crime will be reduced by 5 per cent from 2003 to 2008, and Victorians will feel saferProgress towards increased community safety is measured by both reported crime rates and Victorians’ sense of personal safety. This report uses a selected set of crime statistics and surveys of people’s perceptions of crime to determine progress against this measure.
Rates of crimeVictoria Police collects a range of statistics on recorded crime that are used to analyse trends (in rates per 100 000 population) for 27 broad offence categories. These statistics indicate that the actual total reported rate of crime has fallen by 16.5 per cent during the period 2003 to 2008, against a targeted reduction in the rate of crime of 5 per cent during the same period. Since 2000-01, Victoria’s crime rate has reduced by 24.5 per cent.
Chart B.39 focuses on trends in recorded rates of crime against the person (including the subcategories of assault, sex (non rape), rape, robbery and motor vehicle theft) between 2000-01 and 2007-08.
Service Delivery 2009-10 Appendix B 437
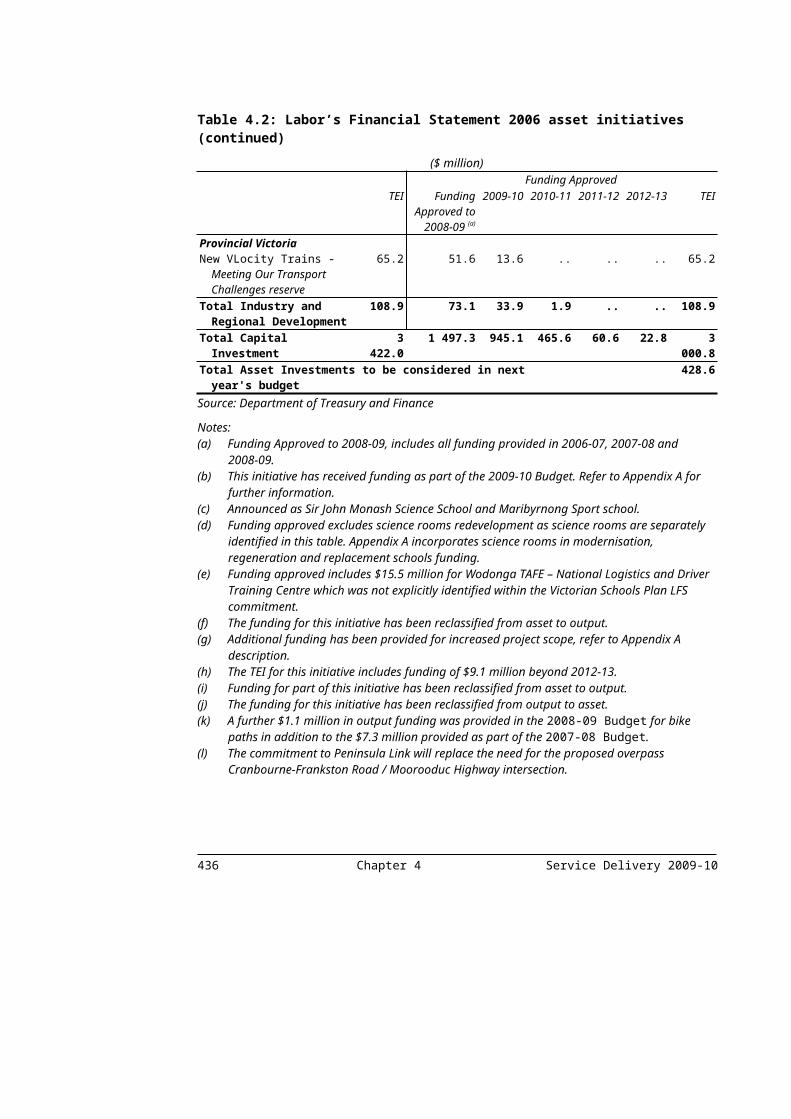
Chart B.39: Rates of recorded crime in Victoria
0
200
400
600
800
1000
1200
1400
1600
1800
2000-01 2001-02 2002-03 2003-04 2004-05 2005-06 2006-07 2007-08
offe
nces
per
100
000
peo
ple
Motor Vehicle Theft Assault Sex: non-rape Rape Robbery
Source: Victoria Police ‘Crime Statistics’ 2000-01 to 2007-08
The chart shows a declining trend in several crime categories over the period 2000-01 to 2007-08. The rate of reported motor vehicle theft has declined by 61.4 per cent, the rate of reported robbery has declined by 30.1 per cent, and the rate of reported sex (non rape) offences has declined by 11.2 percent.
Relative to 2006-07, the rate of reported rape has decreased by 9.6 per cent; however, there has been an increase of 14.3 per cent over the period 2000-01 to 2007-08.
Similarly, relative to 2006-07 the rate of reported assault has decreased by 0.8 per cent; however, over the period 2000-01 to 2007-08, the rate of reported assault has increased by 32 per cent. In August 2004, the Victoria Police Code of Practice for the Investigation of Family Violence was implemented. Since the introduction of the Code of Practice, assaults attributed to family violence have risen from 15 per cent to 23.7 per cent of the total rate of assault, as reported in the Victoria Police Annual Report.
The rate of reported robbery, down by 30.1 per cent relative to 2000-01, has increased by 13.9 per cent relative to 2006-07. Cash monies still remain the most recorded property type stolen during robberies. Young people are often the victims and offenders. In 2007-08, 18.3 per cent of reported robbery victims were under 18 years of age, while 48.2 per cent of alleged offenders were under 18 years of age.
Homicide offences occur at a much lower rate than the other categories of crime included in this report and are not included in the above chart. Over the period 2000-01 to 2007-08, the rate of homicide has decreased by 26.1 per cent.
438 Appendix B Service Delivery 2008-09

Perceptions of safetyPeople’s perceptions of personal safety do not always reflect recorded crime rates, and as such are treated separately in this report. The Department of Justice conducts a Perceptions of Justice Survey to gather information on community perceptions of personal safety and fear of crime. The survey commenced in April 2002 and continued until December 2005. During 2006, the survey was revised and implemented in October 2006. Due to changes in the survey methodology, any comparisons or analysis of trends between the two surveys should be treated with caution. Chart B.40 shows a summary of results for the period June 2003 to December 2008. It shows that Victorians’ feelings of personal safety remained at high levels, with most people feeling ‘safe’ or ‘very safe’ throughout 2008.
Chart B.40: Victorians’ feelings of personal safety
50
60
70
80
90
100
Jun-03 Jun-04 Jun-05 Dec-05 Dec-07 Dec-08
per c
ent
going about normal daily activities at home in the street where they normally go in their daily activities
Source: Department of Justice, Perceptions of Justice Survey, June 2003, December 2008
The closest comparative results from the previous survey, (June 2003 to June 2005) also show consistently high levels of feelings of personal safety.
The Perceptions of Justice Survey also reports on the community’s level of worry about being a victim of crime. Generally, these results are consistent with the high levels of feelings of personal safety reported above. The closest comparative results for the period June 2003 to December 2005 against results from 2007 and 2008 show that fewer Victorians are worried about being victims of crime.
Service Delivery 2009-10 Appendix B 439

Chart B.41: Community’s level of worry about being a victim of crime
0
10
20
30
40
Jun-03 Jun-04 Jun-05 Dec-05 Dec-07 Dec-08
per c
ent
house break-ins motor vehicle theft physical assault or robbery sexual assault
Source: Department of Justice, Perceptions of Justice Survey June 2003, December 2008
Reported crime on the Victorian train networkThe number of reported incidents of crime against the person (including robbery and assault offences) on the Victorian train network increased to 1 395 reported incidents in 2007-08. The increase in reported crime by 19.8 per cent should be viewed in the context of a surge in patronage across the metropolitan train network of 12.7 per cent over the same period. Other factors that may have contributed to this increase in reported crime include the increased staff at stations resulting in more incidents being reported, and longer operating hours for the train network including at night and on weekends.
440 Appendix B Service Delivery 2008-09
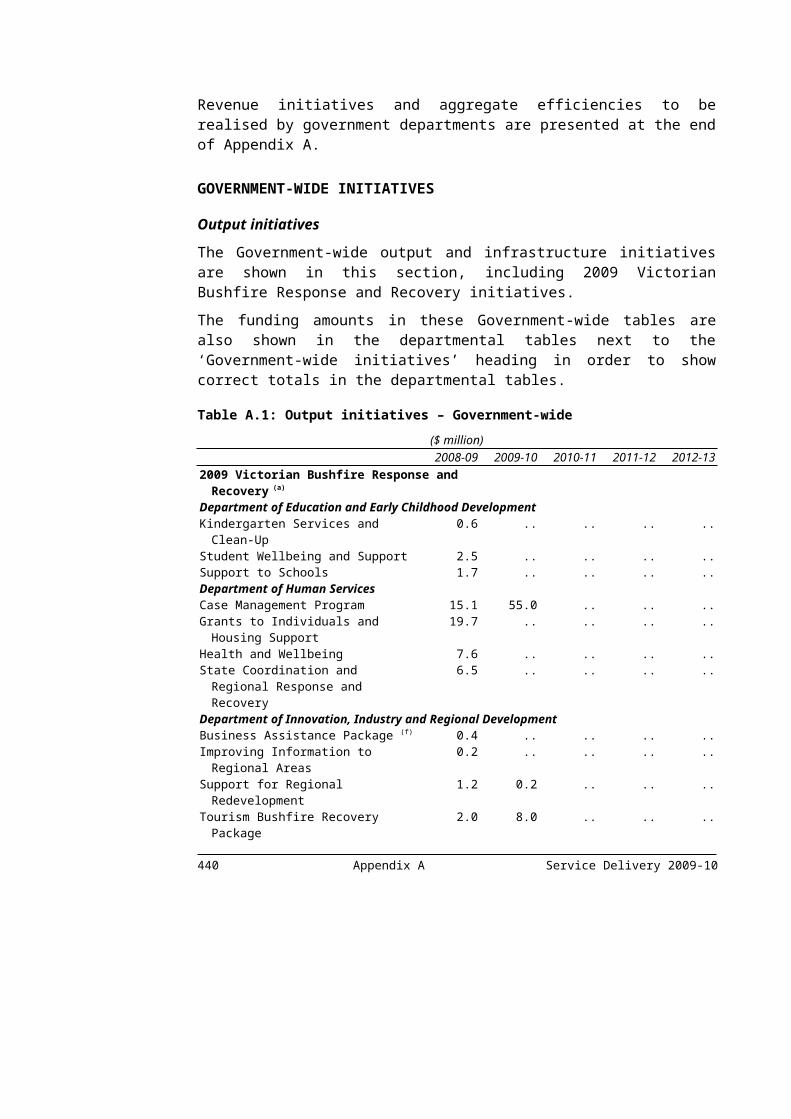
Chart B.42: Reported crime against the person on the Victorian train network
0
200
400
600
800
1 000
1 200
1 400
1 600
1999-00 2000-01 2001-02 2002-03 2003-04 2004-05 2005-06 2006-07 2007-08
num
ber o
f inc
iden
ts
Train station Train Railway carpark
Source: Victoria Police
Satisfaction concerning personal safety on public transportPerceptions of safety on public transport are measured by the Department of Transport through the Customer Satisfaction Index. Satisfaction concerning personal safety on public transport has remained relatively stable since 1999-2000.
Service Delivery 2009-10 Appendix B 441

Chart B.43: Customer Satisfaction Index – satisfaction concerning personal safety on V/Line passenger trains and coaches, metropolitan trains, trams and buses
0
20
40
60
80
100
1999-00 2000-01 2001-02 2002-03 2003-04 2004-05 2005-06 2006-07 2007-08
V/Line Passenger (train & coach) Metro Trains Metro Trams Metro Buses
Totally satisfied
Very satisfied
Somewhat satisfied
Somewhat dissatisfied
Very dissatisfied
Totally dissatisfied
Source: Department of Transport
Annual deaths and serious injuries from road crashes will be reduced by 20 per cent over the period 2002 to 2007The annual road toll decreased by 25 per cent between 2001 and 2007. In 2001, the road toll was 444, compared with 332 in 2007.
Road safety encompasses not only road deaths, but also the serious injuries sustained in road crashes. The road toll in 2008 was 303, of which 166 deaths were in metropolitan Melbourne and 137 deaths in regional Victoria. The 2008 road toll was the lowest road toll since comprehensive records began in 1951. The 2008 road toll represents a decrease of 10 per cent from the three year average of 338 fatalities recorded between 2005 and 2007 which is the baseline for the 30 per cent reduction target in arrive alive 2.
442 Appendix B Service Delivery 2008-09

Chart B.44: Fatalities in Victoria from road crashes
0
50
100
150
200
250
300
350
400
450
500
2000 2001 2002 2003 2004 2005 2006 2007 2008
num
ber o
f fat
aliti
es
Fatalities (Total) Fatalities (Metropolitan) Fatalities (Regional)
Source: VicRoads
A serious injury is defined as an injury which requires a person to be admitted to a hospital for at least one night. In 2007 there were 7 840 serious injuries. Of these, 2 230 occurred in regional Victoria and 5 610 occurred in metropolitan Melbourne. Serious injury data for 2008 are not yet available. Since 2006, serious injury data has been sourced from the Traffic Incident System (TIS). Data prior to 2006 is not directly comparable with data for 2006 and beyond.
The extent and diversity of participation in community, cultural and recreational organisations will increaseActive, confident and resilient communities show greater participation in community activities. The VPHS collects information on volunteering and participation across a range of community organisations.
Chart B.45 shows the proportion of Victorians who answered ‘definitely’ or ‘sometimes’ to the questions ‘Have you attended a local community event in the past six months?’ and ‘Do you help out a local group as a volunteer?’ Participation in community events and volunteering is substantially higher among rural/regional
Service Delivery 2009-10 Appendix B 443
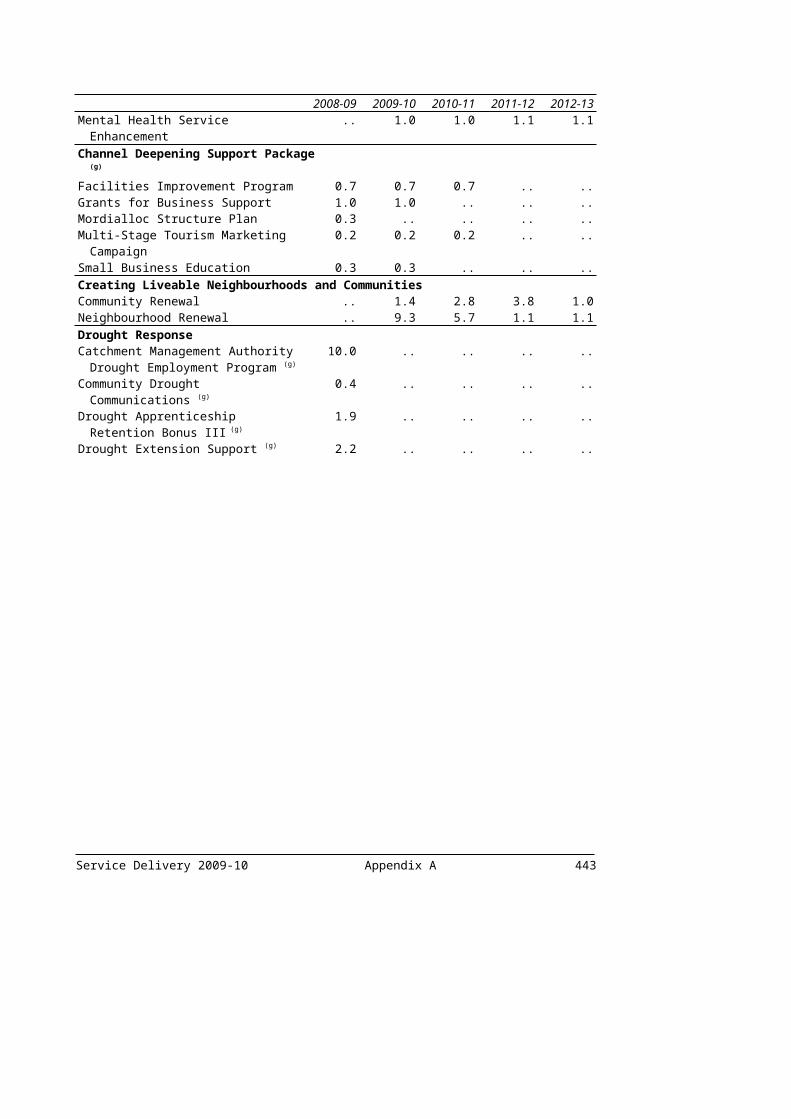
respondents. Community participation has risen since the survey started in 2001 and volunteering has increased across all groups since 2001 (see Chart B.45). Since 2002, the survey has also asked respondents about groups and organisations in which they participate. Between 2002 and 2008, participation in:
professional/academic groups (21.2 to 22.3 per cent) and sporting groups (28.9 to 26.2 per cent) has remained relatively constant; and
schools (15.1 per cent to 11.3 per cent), church groups (18.7 per cent to 16.4 per cent) and community or action groups (25 per cent to 19.1 per cent) has declined.
Chart B.45: Levels of community participation and volunteering in Victoria
0
10
20
30
40
50
60
70
80
90
100
2001 2002 2003 2004 2005 2006 2007 2008 2001 2002 2003 2004 2005 2006 2007 2008
Attended a local community event in past 6months
Help out a local group as a volunteer
per c
ent
Urban Rural
Source: Department of Human Services Victorian Population Health Survey
More Victorians will be able to get help from friends, family or neighbours when they need it Strong social networks are vital to assist those Victorians who feel socially isolated or lack adequate support networks. The VPHS includes the question: ‘Can you get help from friends/family/neighbours when you need it?’ The proportion of respondents answering ‘yes, definitely’ or ‘sometimes’ has remained relatively stable between 2001 and 2008. In 2008:
94.4 per cent of respondents reported that they could get help from family;
94.4 per cent of respondents reported that they could get help from friends; and
71.9 per cent of respondents reported that they could get help from neighbours.
444 Appendix B Service Delivery 2008-09

While rural/regional respondents reported similar levels of support from family and friends as urban respondents, they were more likely to answer ‘yes, definitely’ or ‘sometimes’ when asked if they could get help from neighbours (see Chart B.46).
Chart B.46: Proportion of Victorians who can get help from neighbours when needed
0
20
40
60
80
100
2001 2002 2003 2004 2005 2006 2007 2008
per c
ent
Urban Rural
Source: Department of Human Services Victorian Population Health Survey
Service Delivery 2009-10 Appendix B 445

CARING COMMUNITIES
A fairer society that reduces disadvantage and respects diversity
Two of Victoria’s great strengths are its commitment to giving everyone a fair go, and its rich cultural and social diversity. Opportunities in education, health and housing are not currently distributed evenly throughout the community – and for children and young people lack of opportunity in any of these areas can have serious repercussions throughout life.
Disadvantage in health, education and housing among communities will be reducedProgress towards this goal will be seen through improved outcomes for disadvantaged groups and communities in areas such as health, education and housing. Improvement in outcomes for disadvantaged Victorians can be gauged by looking at key risk factors for different groups in our community such as low birth weight, non-completion of year 12 or equivalent, housing stress, and imprisonment rates.
Self-rated health statusThe self-rated health status and the level of psychological distress of Victorians vary according to socio-economic disadvantage. The ABS defines areas of high socio-economic status as locations where the population is the least disadvantaged. Conversely, populations which are most disadvantaged are defined as having low socio-economic status. According to the Victorian Population and Health Survey, over the period 2001 to 2008, a higher percentage of Victorians living in high socio-economic status areas reported their health status as ‘excellent’, ‘very good’ or ‘good’ compared to Victorians living in areas of low socio-economic status (see Chart B.47).
Psychological distressSimilarly, a higher proportion of Victorians living in high socio-economic status areas report their level of psychological distress (Kessler 10) as ‘no or low risk’ rather than ‘middle’ or ‘high risk’ compared to low socio-economic status areas. However the gap between the two groups decreased between 2007 and 2008 (see Chart B.47).
446 Appendix B Service Delivery 2008-09
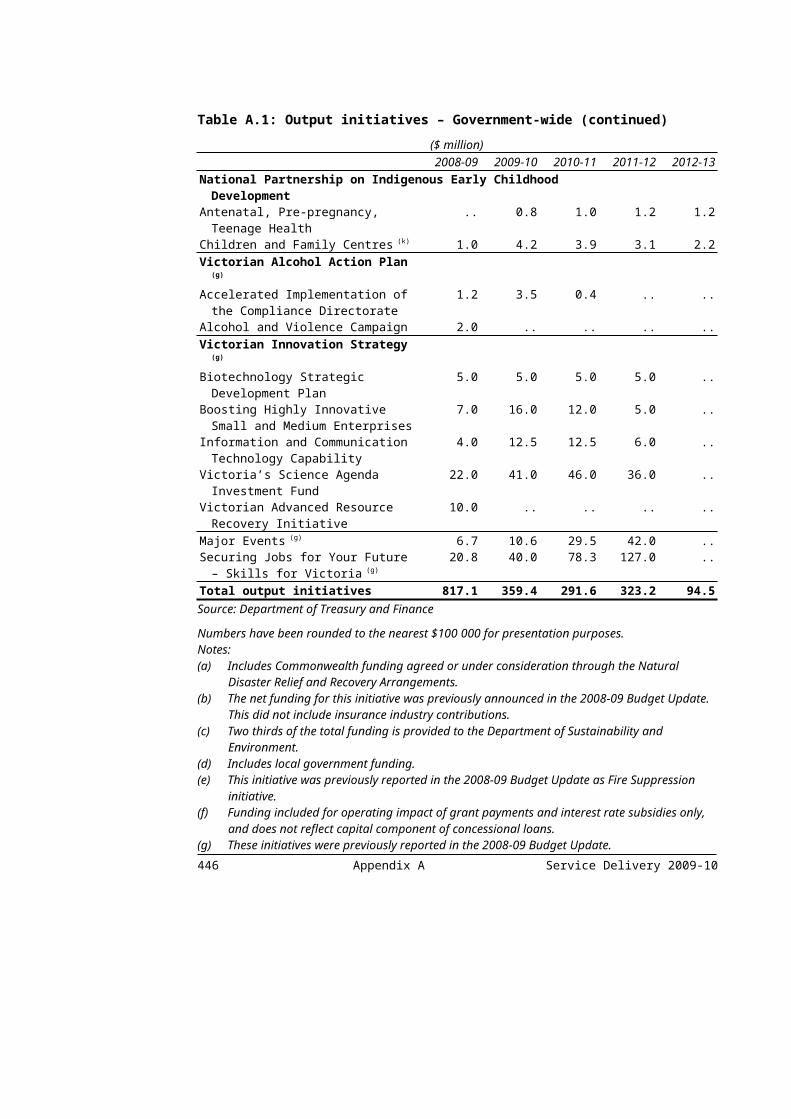
Chart B.47: Self-rated health status and psychological distress (Kessler 10) scores by socio economic status
50
55
60
65
70
75
80
85
90
95
100
2001 2002 2003 2004 2005 2006 2007 2008 2001 2002 2003 2004 2005 2006 2007 2008
Self-rated health status - excellent, very goodor good
No or low risk of psychological distress
per c
ent
Most disadvantaged Least disadvantaged
Source: Department of Human Services Victorian Population Health Survey and Australian Bureau of Statistics (Cat. No. 2033.2.30.001)
Birth weightLow birth weight (less than 2 500g) is an important indicator of health and wellbeing in both infancy and later life. It is a risk factor not only for infant mortality and morbidity, but also for adult development of cardiac disease, diabetes and kidney failure. The Department of Human Services records the number of low birth weight babies born in Victoria. The proportion of low birth weight babies born to non-Indigenous mothers has varied little since 1999, and was 6.5 per cent in 2007. Because of the small number of Indigenous mothers, the proportion of low birth weight babies varies from year to year but is on average approximately twice the rate to non-Indigenous mothers. It was 12.5 per cent in 2007.
Service Delivery 2009-10 Appendix B 447
Chart B.48: Percentage of babies with low birth weight, 1999-2007 (<2 500 grams)
0
2
4
6
8
10
12
14
16
18
20
1999 2000 2001 2002 2003 2004 2005 2006 2007
low
birt
h w
eigh
t (pe
r cen
t)
Indigenous Non-Indigenous
Source: Department of Human Services, Perinatal Data Collection Unit
Housing affordability
The biannual ABS Survey of Income and Housing defines low income households that spend 30 per cent or more of their gross household income on housing costs as experiencing housing stress. The proportion of households experiencing housing stress was 7.3 per cent in 2005-06. Statistics for 2007-08 will be released in late 2009.
Social housingThe provision of affordable social housing plays an important role in the reduction of housing stress. Increasing the total number of social housing properties enables a greater number of people to live in affordable housing. This is measured by the total number of social housing stock provided for low income Victorians. Chart B.49 shows that social housing stock numbers have been steadily rising since 1999.
448 Appendix B Service Delivery 2008-09

Chart B.49: Total social housing stock numbers
70000
71000
72000
73000
74000
75000
76000
77000
78000
79000
80000
1999-00 2000-01 2001-02 2002-03 2003-04 2004-05 2005-06 2006-07 2007-08
stoc
k nu
mbe
rs
Source: Department of Human Services, Summary of Housing Assistance 2007-08
Housing allocationsWith large numbers of Victorians trying to access public housing, it is necessary to identify people that are most disadvantaged and target allocations towards this group. This is done via a segmented waiting list that prioritises applicants in greatest need first. The Chart B.50 shows that the proportion of allocations to people in greatest need has reached around 70 per cent in 2002-03 and has since remained broadly stable since 2002-03.
Service Delivery 2009-10 Appendix B 449
Chart B.50: Proportion of public housing allocations to clients in greatest need(a)
0
10
20
30
40
50
60
70
80
90
100
1999-00 2000-01 2001-02 2002-03 2003-04 2004-05 2005-06 2006-07 2007-08
perc
enta
ge o
f allo
catio
ns
Source: Department of Human Services, Summary of Housing Assistance 2007-08
Note:(a) The Commonwealth-State Housing Agreement defines greatest need as low income households that at
the time of allocation were subject to one or more of the following circumstances: they were homeless, their life or safety was at risk in their accommodation, their health condition was aggravated by their housing, their housing was inappropriate to their needs and/or they had very high rental housing cost.
People who are homelessPeople who are homeless or at risk of homelessness are among the most disadvantaged in Victoria. Availability of services to this group is necessary in reducing disadvantage and increasing opportunity. Provision of these services has been historically provided through the Supported Accommodation Assistance Program (SAAP), which from 1 January 2009 has been incorporated into the National Affordable Housing Agreement. This measure is the total number of clients who have been assisted by homelessness support services (formerly known as SAAP services). Chart B.51 shows that the number of clients assisted with homelessness support has increased from 1999 to 2006-07.
450 Appendix B Service Delivery 2008-09
Chart B.51: Number of clients assisted with homelessness support(a)
0
5,000
10,000
15,000
20,000
25,000
30,000
35,000
40,000
1999-00 2000-01 2001-02 2002-03 2003-04 2004-05 2005-06 2006-07
num
ber o
f clie
nts
Source: Department of Human Services, Summary of Housing Assistance 2006-07
Note: (a) The National Data Collection Agency has discontinued reporting on the measure ‘support periods of
more than one day’ (Chart B.48 in the 2008-09 Budget Papers). An appropriate substitute is to use the total number of homeless clients assisted with homelessness support as per the above graph.
The number of early school leavers who are unemployed after six months will declineEarly school leavers, particularly those from disadvantaged groups, are a difficult cohort to measure. The most suitable data currently available is collected through an annual telephone survey of school leavers known as On Track, conducted by the Department of Education and Early Childhood Development. Early school leavers are defined as students who have left the school system prior to completing year 12.
The number of early leavers included in the sample varies from year to year. The sample of early school leavers includes only those young people who could be identified, contacted and consented to participate in the study. Therefore, while the results provide an indication of the proportion of young people who reported that they were not in any form of education or training and were looking for work at the time of the survey, it should be treated with care.
Service Delivery 2009-10 Appendix B 451

Table B.5: Number and proportion of early school leavers who were looking for work at the time of survey
Number of early school leavers who
were looking for workProportion of early school leavers who were looking for work (per cent)
2003 590 18.52004 696 15.02005 683 14.32006 593 14.62007 683 15.32008 638 14.0Source: Department of Education and Early Childhood Development, On Track Early Leaver Surveys 2003-08.
Research confirms the value that a year 12 or equivalent qualification has in providing young people with a good foundation to engage in work or further education. The Department of Education and Early Childhood Development On Track Survey provides a snapshot of destinations of school leavers in Victoria.
Chart B.52: Year 12 completer destinations 2003-08(a)(b)
0
10
20
30
40
50
60
70
80
90
100
2003 2004 2005 2006 2007 2008
Looking for work Employed Part Time Employed Full Time Apprentice/Trainee TAFE/VET University
Source: On Track Year 12 Completer Surveys 2003-08, Department of Education and Early Childhood Development
Notes: (a) Year 12 or equivalent completion is defined as completion of the Victorian Certificate of Education,
the International Baccalaureate or the Victorian Certificate of Applied Learning Intermediate or above.
(b) Students who deferred a tertiary offer have been attributed to their destination at the time of the interview.
452 Appendix B Service Delivery 2008-09
The prison population will not grow as quickly and reoffending will be reducedWhen measuring disadvantage, improved outcomes of the Victorian criminal justice system such as reduced imprisonment and recidivism rates are important, as people from disadvantaged backgrounds are over-represented. Previously, Victoria’s prison rates were presented in calendar years; however, since 2005-06 Corrections Victoria has preferred to report daily average prisoner numbers over a full financial year wherever possible.
Victoria’s imprisonment rate increased from 92 prisoners per 100 000 adult population in 2004-05, to 93.7 in 2005-06, 101.6 in 2006-07, and 103.2 in 2007-08. The growth in the prison population can be attributed to a number of factors such as population growth, changes in sentencing practices for serious offences, and a tougher breach policy within community corrections.
Imprisonment rate by genderThe average daily prison population for 2007-08 was 4 177. Relative to 2006-07, the male prisoner population has increased, while the female prisoner population has decreased.
In 2007-08, males continue to make up the overwhelming majority, with an imprisonment rate of 198.5 per 100 000 adult male population compared to the female rate of 11.8 per 100 000 adult female population (see Chart B.53).
Service Delivery 2009-10 Appendix B 453
Chart B.53: Imprisonment rate by gender(a)
0
50
100
150
200
250
1999-00 2000-01 2001-02 2002-03 2003-04 2004-05 2005-06 2006-07 2007-08
rate
per
100
000
adu
lt po
pula
tion
Male Prisoners Female Prisoners Total Prisoners
Source: Report on Government Services (Productivity Commission)
Note:(a) The annual daily average best reflects prisoner numbers over the entire reporting period, and
because the 30 June figures do not always accord with the annual daily average, imprisonment rates (wherever possible) are calculated using annual daily average data.
Imprisonment of disadvantaged peopleA point-in-time ‘snapshot’ of prisoners from the Corrections Victoria prisoner database is used to measure the proportion of prisoners with two or more characteristics of disadvantage.
At 29 January 2009, 50.4 per cent of prisoners had two or more characteristics of serious disadvantage. The characteristics of ‘serious disadvantage’ are where the prisoner is (or was prior to admission): unemployed; homeless; their ethnicity is Aboriginal, Torres Strait Islander, or both; drug/alcohol status is abuse/offend/support; they have an intellectual disability or are flagged as having had a psychiatric admission. This percentage is down from the January 2008 figure of 54 per cent and the January 2007 figure of approximately 52 per cent.
454 Appendix B Service Delivery 2008-09
Imprisonment of Indigenous peopleThe Indigenous imprisonment rate remains significantly higher than the overall Victorian imprisonment rate, with Indigenous persons being 13 times more likely to be imprisoned than non-Indigenous persons. As with the non-Indigenous prisoner population, males comprise the vast majority of Indigenous prisoners, and the gender proportional difference between male and female rates of imprisonment is broadly similar for both Indigenous and non-Indigenous Victorians.
ReoffendingThe Department of Justice records the rate at which Victorian prisoners return to prison, as an indicator of the rate of recidivism. The proportion of Victorian prisoners who return to prison within two years of being released has been decreasing since 2002-03 (see Chart B.54). As this measures the period for two years from prisoner discharge, the most recent data are for prisoners discharged from prison in 2005-06 who had returned to prison by the end of 2007-08.
Chart B.54: Percentage of Victorian prisoners released who returned to prison under sentence within two years(a)
0
10
20
30
40
50
2002-03 2003-04 2004-05 2005-06 2006-07 2007-08
reporting period
per c
ent
Source: Report on Government Services 2008 (Justice Preface)
Note:(a) Figure relates to all sentenced prisoner discharges, including those discharged to parole.
Service Delivery 2009-10 Appendix B 455

The appreciation of diverse neighbourhoods and communities will increase The VPHS collects information on the proportion of Victorians who think that multiculturalism makes life in their area better, and the proportion that enjoy living among people of different lifestyles.
More than 75 per cent of respondents think that multiculturalism makes life in their area better. Chart B.55 shows that urban areas consistently report a more positive response to this question than rural/regional areas. However a higher percentage of rural/regional respondents, (18.5 per cent compared to 4 per cent of urban respondents) selected the ‘not applicable’ option indicating that they did not believe the question to be relevant to the area they were living in. Current trends show a small decline, in respondents who think that multiculturalism makes life better in their area, from 79.9 per cent in 2005 to 76.3 per cent in 2008.
Chart B.55: Proportion of Victorians who think multiculturalism makes life better(a)
0
20
40
60
80
100
2001 2002 2003 2004 2005 2006 2007 2008
per c
ent
Urban Rural
Source: Department of Human Services Victorian Population Health Survey
Note:(a) An extra category was added from 2005 onwards to enable respondents to answer ‘not applicable’ if
they felt that was the more appropriate response, for example, that multiculturalism was not a feature of their area.
456 Appendix B Service Delivery 2008-09
VIBRANT DEMOCRACY
Greater public participation and more accountable government
Open and accountable Government is one of the fundamental commitments the Government made to the people of Victoria. It is the right of all Victorians.
More Victorians from all backgrounds will have the opportunity to have a say on issues that matter to them Greater involvement in decision making signifies growing democratic participation. The VPHS records the proportion of Victorians who feel that there are opportunities to have a real say on issues that are important to them. The proportion who feel they have a say remained fairly constant between 2001 and 2007 but increased slightly to 74.2 per cent in 2008 (see Chart B.56). Females responded positively more often between 2001 and 2007. In 2008, the gap between the sexes decreased with 73.1 per cent of males and 75.1 per cent of females responding positively. Rural/regional respondents have slightly higher levels at 76.6 per cent than urban respondents at 73.3 per cent.
The VPHS also collects information about the proportion of Victorians who feel valued by society. The proportion who feel valued by society has remained stable since 2001 (see Chart B.56) and was 81.7 per cent in 2008. Similar levels of males and females report feeling valued by society at 81.6 per cent and 81.9 per cent respectively. Rural/regional respondents also had similar levels to urban respondents (82.2 per cent versus 81.6 per cent respectively).
Service Delivery 2009-10 Appendix B 457
Chart B.56: Proportion of Victorians that feel there are opportunities to have a real say on issues that are important to them and feel valued by society
0
20
40
60
80
100
2001 2002 2003 2004 2005 2006 2007 2008 2001 2002 2003 2004 2005 2006 2007 2008
Feel there are opportunities to have a real sayon issues that are important to you
Feel valued by society
per c
ent
Source: Department of Human Services Victorian Population Health Survey
There will be regular reports on progress in improving the quality of life for all Victorians and their communitiesOne important demonstration of accountability is the continued publication of regular reports on progress against the ten goals outlined in Growing Victoria Together. This is the seventh report to Victorians and is in line with this commitment.
458 Appendix B Service Delivery 2008-09
VIBRANT DEMOCRACY
Sound financial management
Victoria’s ability to attract people, investment and new jobs, to provide better services, and to protect the environment, depends on a strong and secure financial base.
An annual budget surplus of at least $100 millionContinued sound financial management can be illustrated by the budget bottom line. The 2009-10 estimated budget surplus is $165 million.
Victoria’s triple-A credit rating will be maintainedThe State’s credit rating provides an independent assessment of the State’s financial position against international benchmarks. It is an indicator of the Government’s financial management performance.
The State of Victoria is rated by two international rating agencies (Standard & Poor’s and Moody’s Investors Service). Both rating agencies conduct an annual review of the State’s financial performance and outlook, balance sheet positions, liquidity and debt management strategy, and the fiscal outlook and strategy given the State’s economic structure and prospects.
Victoria’s triple-A local and foreign currency debt ratings were reaffirmed by Standard & Poor’s in November 2008 and Moody’s Investors Service in January 2009.
Victoria’s taxes will remain competitive with the Australian averageThe competitiveness of Victoria’s tax regime plays an important role in underpinning economic growth and investment. Consistent with the Government’s strategic priority of promoting growth across the whole of the State, the Government aims to ensure that Victoria’s taxes remain competitive with the Australian average.
The Government’s preferred measure of tax competitiveness is state taxation expressed as a share of Gross State Product which relates the level of taxation revenue to economic capacity. In 2007-08, the latest full year for which actual data are available, Victoria’s taxation revenue was 4.80 per cent of nominal GSP. This ratio is above the Australian average of 4.69 per cent, and between New South Wales’ ratio of 5.16 per cent and Queensland’s 4.46 per cent.
Service Delivery 2009-10 Appendix B 459
APPENDIX C – DISCONTINUED OUTPUTS AND/OR MEASURES
Consistent with the Government’s ongoing commitment to improve accountability and the basis for departmental revenue certification, outputs and performance measures are assessed annually for their continuing relevance and robustness. Changes to individual departments’ output structures are outlined and explained in Chapter 3, Departmental Output Statements. This appendix sets out the 2008-09 departmental outputs and performance measures that will no longer be reported on from 2009-10. A complete listing of 2009-10 outputs and performance measures is also provided in Chapter 3, Departmental Output Statements.
Service Delivery 2009-10 Appendix C 461

Department of Education and Early Childhood Development – discontinued performance measuresMajor Outputs/DeliverablesPerformance Measures(a)
Unit of Measure
2008-09 Expected Outcome
2008-09 Target
2007-08 Actual
Early Years (schools)Quantity
Indigenous educators employed(b) number 15 15 16Indigenous home school liaison officers employed(b)
number 6 6 8
Year 1 cohort assessing one-to-one literacy intervention programs(c)
per cent 20 20 20
Quality Percentage of Year 3 Indigenous students reaching national benchmarks in reading(d)
per cent 74 74 na
Percentage of Year 3 students reaching national benchmarks in reading(d)
per cent 92 92 na
Percentage of Year 3 Indigenous students reaching national benchmarks in numeracy(d)
per cent 82 82 na
Percentage of Year 3 students reaching national benchmarks in numeracy(d)
per cent 95 95 na
Primary schools identified as performing at or above expected levels(e)
per cent 92 92 90
Middle Years (schools)Quality
Percentage of Year 5 Indigenous students reaching national benchmarks in reading(d)
per cent 75 75 na
Percentage of Year 5 students reaching national benchmarks in reading(d)
per cent 92 92 na
Percentage of Year 5 Indigenous students reaching national benchmarks in numeracy(d)
per cent 85 85 na
Percentage of Year 5 students reaching national benchmarks in numeracy(d)
per cent 95 95 na
Secondary schools identified as performing at or above expected levels(f)
per cent 90 90 90
Services to StudentsQuantity
Eligible school students applying for and receiving the Education Maintenance Allowance (EMA)(g)
per cent 100 100 100
Quality Student Drug Education Learning Outcomes Index(h)
number (1-100)
77 77 na
462 Appendix C Service Delivery 2009-10

Major Outputs/DeliverablesPerformance Measures(a)
Unit of Measure
2008-09 Expected Outcome
2008-09 Target
2007-08 Actual
Timeliness Student transport payments made according to published schedule(i)
per cent 100 100 100
Adolescent Health Services (schools)Quality
Secondary school annual action plans completed(j)
per cent 100 100 100
Child Health and Support ServicesQuality
Primary school aged students with completed care plans receiving follow-up care(k)
per cent 100 100 100
Proportion of prep aged students assessed by school nurses(l)
per cent 90 90 89.6
Later Years and Youth TransitionsQuantity
Number of school providers offering Victorian Certificate of Applied Learning(m)
number 350 350 nm
Quality Proportion of students leaving Government schools after Year 9 but before completing Year 12 who were tracked by a school six months after exiting(n)
per cent 77.5(q) 60 78.6
Policy and RegulationQuantity
Overseas students recruited to study in Victorian Government schools in the year(o)
number 1 000 1 000 1 699
Timeliness Percentage of responses to items of Ministerial correspondence that are provided within 14 days(p)
per cent 95 95 92
Source: Department of Education and Early Childhood Development
Notes:(a) 2008-09 Expected outcomes and targets refer to the 2008 calendar year unless otherwise explicitly
indicated. 2007-08 Actuals refer to the 2007 calendar year unless otherwise explicitly indicated. 2007-08 Actuals reflect those published in the Department’s 2007-08 Annual Report and explanations for significant variances from 2007-08 Targets may be found in that Report. 2008-09 Expected outcomes reflect 2008-09 Targets unless 2008-09 results were available at 31 December 2008.
(b) This measure has been deleted as it is not an output measure but counts the number of staff employed.
Service Delivery 2009-10 Appendix C 463

Notes (continued):(c) Funding has been mainstreamed. Schools are required to provide one-to-one literacy intervention as
required. Information is not collected on all the various forms of literacy intervention provided by schools.
(d) This measure is no longer calculated and has been replaced by the National Assessment Program – Literacy and Numeracy (NAPLAN) measures.
(e) This measure has been deleted as its calculation is based on many data sets which tend to change from year to year. It will be difficult, if not impossible to compare annual results and targets. Changes include the replacement of discontinued Curriculum and Standards Framework data with Victorian Essential Learning Standards data and the replacement of discontinued headcount data with full-time equivalent student absence data. National Assessment Program – Literacy and Numeracy (NAPLAN) data will also replace Achievement Improvement Monitor (AIM) data. This measure has been replaced by NAPLAN measures.
(f) This measure has been deleted as its calculation is based on many data sets which tend to change from year to year. It will be difficult, if not impossible to compare annual results and targets. Changes include the replacement of discontinued Curriculum and Standards Framework data with Victorian Essential Learning Standards data, the replacement of discontinued headcount data with full-time equivalent student absence data and the introduction of Year 9 AIM data for every school. National Assessment Program – Literacy and Numeracy (NAPLAN) data will also replace Achievement Improvement Monitor (AIM) data. This measure has been replaced by NAPLAN measures.
(g) Refers to financial year. All eligible school students who apply for the Education Maintenance Allowance will receive it.
(h) This measure was introduced in 2005 to assess the initial implementation of the Drug Education Evaluation and Monitoring (DEEM) project. The ongoing project has been successfully implemented, and this measure is no longer required nor assessed.
(i) Refers to financial year. Eligible transport payments are automatically paid according to the published schedule.
(j) All secondary school action plans that are developed are completed.(k) This measure has been deleted as all primary school students with completed care plans will receive
follow up care.(l) This measure has been deleted as all prep aged students are offered a health assessment by school
nurses, but not all parents consent and take up the offer. There is a better existing measure that examines the number of ‘Prep aged students assessed by school nurses’.
(m) This measure has been deleted as it was used to monitor the introduction of VCAL which occurred many years ago. Therefore it is no longer relevant to determine the success of the introduction of VCAL many years ago.
(n) All eligible students are followed up based on contact details they provided. However, actual contact may not occur as details may be out-of-date, the former student may not be contactable (e.g. overseas) or may wish to decline contact.
(o) It reflects fluctuating overseas demand and marketing by off-shore agents. The program is funded from revenue generated from the fees paid by international students, not from appropriation.
(p) Refers to financial year. Replies to all ministerial correspondence are provided as soon as possible.(q) Result as at end of December 2008.
464 Appendix C Service Delivery 2009-10
Department of Human Services – discontinued performance measuresMajor Outputs/DeliverablesPerformance Measures
Unit of Measure
2008-09 Expected Outcome
2008-09 Target
2007-08 Actual
Community Health CareQuantity
Better Health Channel internet enquiries (page impressions)(a)
number (‘000)
28 000 28 000 26 800
Quality Better Health Channel managed content (pages)(a)
number 4 750 4 000 6 115
Timeliness Better Health Channel accessible 24 hours a day(a)
per cent 100 100 100
Statutory Child Protection ServicesQuality
Compliance with requirement to formally review each child subject to more than two reports in a 12 month period(b)
per cent 95 95 95
Child Protection Specialist Services(c)
Quantity Total number of clients receiving a specialist assessment and treatment service(d)
number 2 110 2 110 2 076
Number of children and young people receiving stability packages(d)
number 422 422 1 047
Quality Clients referred by Department of Human Services Child Protection to the Intensive Therapeutic Service more than once in a 12 month period(d)
per cent 1 1 3
Placement and Support Services(e)
Quantity Number of young people receiving a leaving care support response(f)
number 450 450 324
Quality Family and placement services subject to a quality audit and review(g)
number (‘000)
50 50 96
Family and Community ServicesQuantity
Number of operational Family Support Innovation projects(h)
number 79 79 79
Service Delivery 2009-10 Appendix C 465
Major Outputs/DeliverablesPerformance Measures
Unit of Measure
2008-09 Expected Outcome
2008-09 Target
2007-08 Actual
Number of operational Child FIRST sites(i) number 24 24 16
Homelessness Assistance Quantity
SAAP support episodes (occasions of service)(j)
number 38 900 38 900 35 000
Source: Department of Human Services
Notes:(a) This measure is discontinued to align the reporting of Better Health Channel (BHC) statistics with
whole of government practice.(b) Discontinuance of this measure is as a result of the merging of the output groups: ‘Child Protection
Specialist Services’ and ‘Placement and Support Services’. The cumulative harm measure was introduced to reflect the Children, Youth and Families Act (2005), however an assessment of the concept of cumulative harm is complex and other options for measuring cumulative harm is being reviewed.
(c) This output has been merged with ‘Placement and Support Services’, with the new output being Specialist Support and Placement Services. This is in line with current model of placement and service delivery models.
(d) Proposed discontinued output and performance measure for 2009-10 – output deactivated and activities merged with ‘Placement and Support Services’ output into new output ‘Specialist Support and Placement Services’.
(e) This output has been merged with ‘Child Protection Specialist Services’, with the new output titled ‘Specialist Support and Placement Services’. This is in line with current model of placement and service delivery models.
(f) Proposed discontinued output and performance measure for 2009-10 – output deactivated and activities merged with ‘Child Protection Specialist Services’ output in to a new output titled ‘Specialist Support and Placement Services’.
(g) Measure discontinued in 2009-10 and will be replaced with the new performance measure ‘Percentage of community service organisations who have successfully completed a scheduled external review against the registration standards under the Children, Youth and Families Act (2005) , which more accurately reflect implementation of internal and external reviews against the standards.
(h) Proposed discontinued output and performance measure for 2009-10 as Family Services Innovations projects are fully rolled out.
(i) Proposed discontinued output and performance measure for 2009-10 as ChildFIRST sites have been fully rolled out.
(j) Measure is discontinued following changes to national data collection. This indicator is no longer available and is more appropriately replaced by the number of clients. In addition, following decisions at Council of Australian Governments which alter the funding basis of housing assistance, projections are being revised.
466 Appendix C Service Delivery 2009-10
Department of Innovation, Industry and Regional Development – discontinued performance measures
Service Delivery 2009-10 Appendix C 467
Major Outputs/DeliverablesPerformance Measures
Unit of Measure
2008-09 Expected Outcome
2008-09 Target
2007-08 Actual
Strategic PolicyQuantity
Development of whole of government information and service access strategic directions relating to improvements in service performance and greater public participation(a)
number 1 1 1
SkillsQuantity
Government funded student contact hours of training and further education provided to 15-24 year olds(b)
number (million)
48.3 44 46.3
Quality Participation rate of 15-19 year olds in training and further education in Victoria: all Victoria(c)
per cent 29.3 27.3 26.9
Persons aged 15-64 participating in TAFE programs as proportion of population(d)
per cent 12.6 12.7 12.5
Sector DevelopmentQuantity
Companies participating in Innovation Insights Visits program(e)
number 80 200 205
Small BusinessQuantity
Businesses participating in the My Business My People program(f)
number 225 300 325
InnovationQuantity
Design Sector Initiative: case studies completed(g)
number 12 12 12
Design Sector Initiative: lectures, seminars and workshops held(h)
number 40 25 45
Develop information resource products, standards and guidelines in response to identified government requirements(i)
per cent 90 90 90
Victoria Online: increase in usage(j) per cent 10 20 58.1Quality
Assessment of quarterly monitoring reports for grant agreements undertaken(k)
per cent 100 100 nm
Timeliness Payments made according to contracts, provided grant recipients meet contract terms(k)
per cent 100 100 nm
468 Appendix C Service Delivery 2009-10
Major Outputs/DeliverablesPerformance Measures
Unit of Measure
2008-09 Expected Outcome
2008-09 Target
2007-08 Actual
Science and TechnologyQuality
Assessment of quarterly monitoring reports for grant agreements undertaken(k)
per cent 100 100 nm
Timeliness Payments made according to contracts, provided grant recipients meet contract terms(k)
per cent 100 100 nm
ExportsQuantity
Number of firms participating in individual export specific programs(l)
number 800 800 1 167
Industrial RelationsQuantity
Workplace Rights Advocate: information sessions provided(m)
number 18 30 56
Regional Economic Development, Investment and PromotionQuantity
Delivery of Leadership programs in Provincial Victoria(n)
number per region
1 1 1
Enquiries to provincial Councils about living, working and/or investing in their region(o)
number 250 500 483
Quality Regional councils satisfied with RDV’s delivery of promotion and development programs(p)
per cent 75 75 100
Timeliness Regional councils satisfied with timeliness of RDVs response to queries and funding applications(p)
per cent 75 75 92
Major ProjectsQuality
Parkville Gardens: commence stage one construction of 650 apartments(q)`
date 0 qtr 2 nm
TourismQuality
Target market awareness of advertising about holidays in Victoria: interstate(r)
per cent 15 16-21 15.6
Target market awareness of advertising about holidays in Victoria: interstate(r)
per cent 15 14-19 14.1
Source: Department of Innovation, Industry and Regional DevelopmentService Delivery 2009-10 Appendix C 469

Notes:(a) Measure is now integrated with the existing measure ICT Projects and programs underway.(b) Measure has been replaced by the quality measure ‘Participation rate of 15-24 year olds in training
and further education in Victoria: all Victoria’.(c) Measure has been replaced by a new, more relevant quality measure ‘Participation rate of 15-24
year olds in training and further education in Victoria: all Victoria’.(d) Measure has been replaced by a new, more relevant quality measure ‘Participation rate of 25-64
year olds in training and further education in Victoria: all Victoria’.(e) This measure has been discontinued and replaced with a quality measure, ‘Innovation Insights’
program: Percentage of companies that intend to implement new best practice tools and methodologies as a result of participating in the ‘Innovation Insights’ program. The 2008-09 Expected Outcome is due to the effects of economic downturn and program delay in the first half of the year.
(f) Measure has been replaced by two new performance measures capturing the ‘Skills for Growth’ Program, ‘Skills for Growth – Business Assisted’ and ‘Skills for Growth – Training Placements’.
(g) Measure has been replaced with the new measure ‘Design Sector Initiative: Business immersions completed’.
(h) Measure has been consolidated with ‘Design Sector Initiative: People participating in lectures, seminars and workshops’. The consolidated measure is considered as more effective in measuring the impact of the relevant activities.
(i) This measure has been discontinued and replaced by a quality measure entitled ‘Customer satisfaction with information services from Information Victoria’.
(j) This measure has now been replaced with ‘Average number of monthly visits to Victoria Online. The discontinued measure has been in place for several reporting cycles. For an information only website/portal such as www.vic.gov.au, there is a time when saturation point is reached. The compounding nature of percentage increases, year after year, means that in real terms the numbers of visitors required to achieve the target quickly becomes very high. In the longer term, a measure of success that relies on a continual increase in usage is unrealistic. There are no plans to add major content to Victoria Online. Until such time as a whole of government web strategy is in place, and without significant addition of new content, large increases in usage are unlikely.
(k) This measure has been discontinued as the activity is deemed as being part of core administration.(l) This measure has been discontinued and consolidated with ‘Companies provided with export
assistance’.(m) Measure discontinued due to cessation of the Workplace Rights Advocate.(n) Measure discontinued and replaced with ‘Participant satisfaction with Provincial Leadership
Program’.(o) Performance measure discontinued as the current program is in the final stages of delivery. The
2008-09 target is not expected to be met due to the current global economic conditions.(p) Performance measure discontinued. As current programs encompassed in this measure are in the
final stages of delivery, this measure will no longer be applied.
470 Appendix C Service Delivery 2009-10

Notes (continued):(q) Performance measure has been discontinued as the construction of the freeway apartments has been
transferred to a private sector developer.(r) Performance measure has been discontinued and replaced with new measures that include a number
of new media channels such as the internet.
Service Delivery 2009-10 Appendix C 471

Department of Justice – discontinued performance measuresMajor Outputs/DeliverablesPerformance Measures
Unit of Measure
2008-09 Expected Outcome
2008-09 Target
2007-08 Actual
State Electoral Roll and ElectionsQuantity
Elector enrolment changes(a) number 440 000 440 000 648 844Municipal elections, by elections and polls(b) number 82 79 12Non-government elections, by elections and polls(b)
number 14 10 10
State Government elections, by elections and polls(b)
number 1 1 3
Training programs conducted for election officials(c)
number 22 22 34
Timeliness Post election implementation review reports provided within agreed timeframes(d)
per cent 100 100 100
Public ProsecutionsQuantity
Number of witness assistance case referrals(e) number 1 500 1 150 nmQuality
Guilty pleas as a percentage of case disposals(f)
per cent 68 68 nm
Timeliness Number of adjournments sought by the Crown in County Court and Magistrates Court on the grounds of insufficient time to prepare(g)
number 20 <40 5
Community Based Offender SupervisionQuantity
Average daily offenders on community work only orders(h)
number 2 180 2 490 2 369
Legal Policy, Advice and Law ReformQuantity
Capacity to provide client legal services (VGSO)(i)
hours 75 000 60 000 64 967
Quality Client satisfaction with quality of legal advice provided (VGSO)(j)
level high high high
Timeliness Client satisfaction with timeliness of legal advice provided (VGSO)(k)
level high high high
472 Appendix C Service Delivery 2009-10

Major Outputs/DeliverablesPerformance Measures
Unit of Measure
2008-09 Expected Outcome
2008-09 Target
2007-08 Actual
Supporting the Judicial ProcessQuantity
Legal representation to clients(l) number 95 000 70 000 90 256
Source: Department of Justice
Notes:(a) This measure has been amended to become a timeliness measure. The number of elector enrolment
changes attributed to the Australian Electoral Commission (AEC) activity, which was previously included in this measure, is outside of Victorian Electoral Commission’s (VEC) control.
(b) This measure has been consolidated into the 2009-10 measure ‘State Government, Municipal and non-government elections, by elections and polls’.
(c) This measure has been discontinued as it is an administrative function of the VEC. The existing quality measure ‘Challenges to VEC conduct upheld in court’ will highlight any deficiencies in the administration of elections or polls.
(d) This measure has been discontinued, as it is an administrative requirement to be performed as part of an election conducted. The new 2009-10 timeliness measure ‘Elector enrolment changes and new enrolments processed within set timelines’ is a better reflection of the timely management of the VEC’s electoral roll management function.
(e) This measure has been replaced by the 2009-10 measure ‘Number of victim and witness consultations’. The 2009-10 measure captures a broader range of services provided by the Office of Public Prosecutions to victims and witnesses.
(f) This performance measure has been replaced in 2009-10 by the measure ‘Guilty outcomes (guilty pleas and trial convictions) as a percentage of case completions’. The 2009-10 performance measure is a more comprehensive quality measure as it reflects outcomes of both pre trial and trial activities.
(g) This performance measure has been replaced by the 2009-10 performance measure ‘Proportion of trials listed which did not proceed to adjournment on application of the Crown’. The 2009-10 performance measure is a more comprehensive timeliness measure as it refers to all adjournments sought by the Crown.
(h) This measure has been replaced by the 2009-10 measure ‘Number of community work hours performed’. The 2009-10 measure provides a more accurate account of Community Correctional Services (CCS) performance and addresses issues associated with the discontinued measure.
(i) This measure is discontinued as it is an input determined by the level of demand for Victorian Government Solicitor’s Office (VGSO) services.
(j) This measure has been discontinued as there has been an improvement in the method of data collection used to measure client satisfaction with the quality of legal advice provided by VGSO.
(k) This measure has been discontinued as there has been an improvement in the method of data collection used to measure client satisfaction with the timeliness of legal advice provided by VGSO.
(l) This measure is comprised of the 2009-10 quantity measures ‘Duty lawyer services’ and ‘Grants of Assistance’. The 2009-10 measures replace the 2008-09 measure in recognition of the different levels of resource intensity of these activities.
Service Delivery 2009-10 Appendix C 473
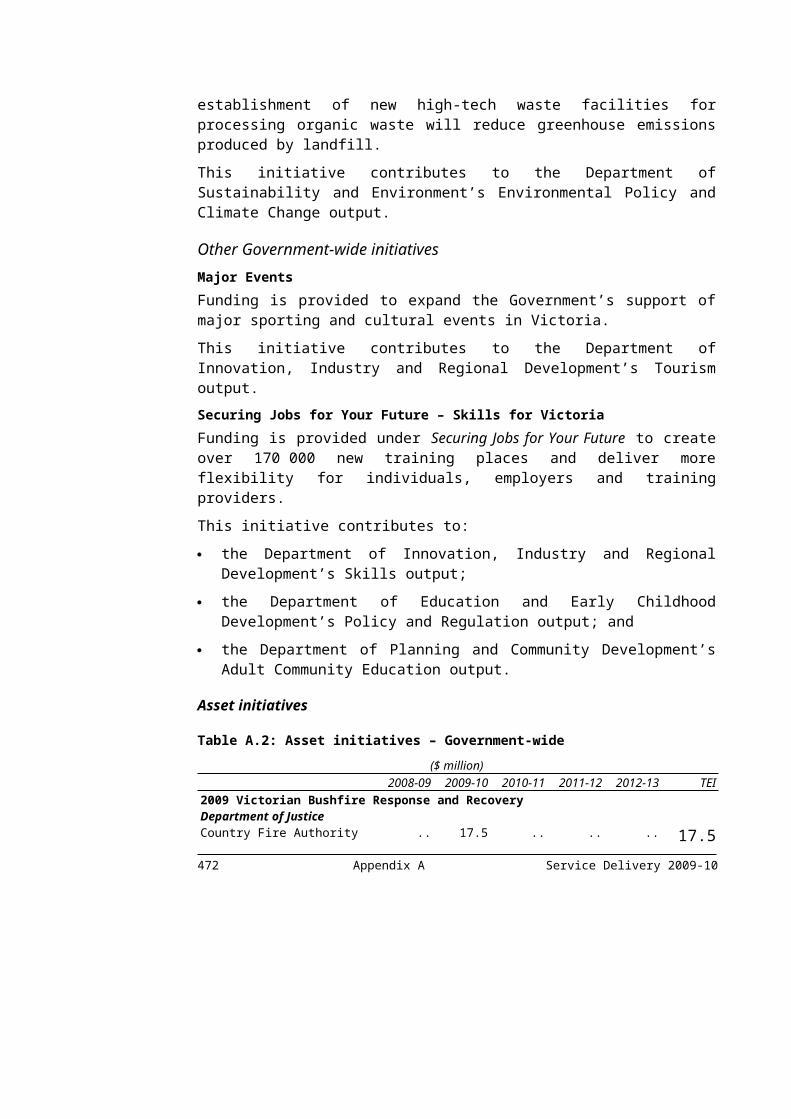
Department of Planning and Community Development – discontinued performance measures
474 Appendix C Service Delivery 2009-10
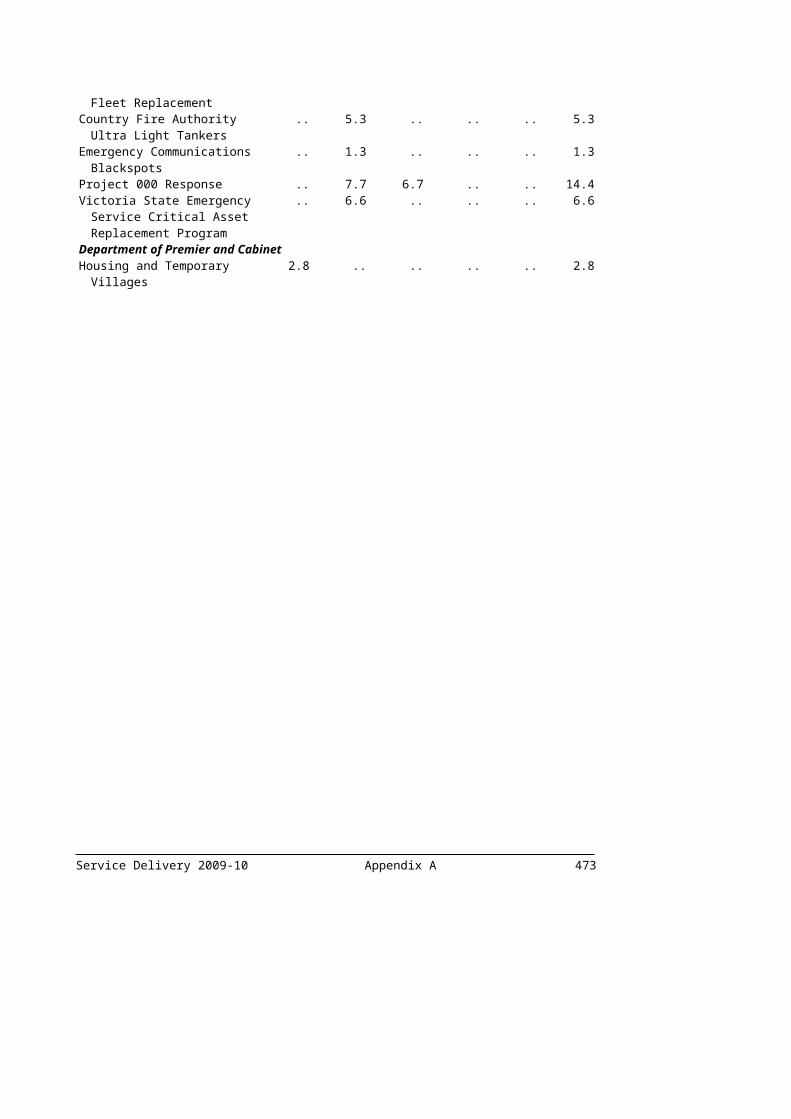
Major Outputs/DeliverablesPerformance Measures
Unit of Measure
2008-09 Expected Outcome
2008-09 Target
2007-08 Actual
Planning, Urban Design and Housing AffordabilityQuantity
Development facilitation of priority projects(a) number 40 40 40Housing lots with zoning completed within Growth Areas(b)
number 20 660 20 660 nm
Metropolitan councils housing growth requirements established(c)
per cent 100 100 nm
Number of property transactions assessed by the government land monitor for compliance with government policy(d)
number (‘000)
950 950 1 064
Number of transit cities in which project/works are being undertaken(e)
number 13 13 13
Produce annual permit activity report(f) number 1 1 1Research bulletins published(g) number 8 8 13Urban Development Program(b) number 1 1 1
Quality 10 year zoned land supply available within the urban growth boundary for residential and employment purposes(b)
per cent 100 100 nm
Government property transactions comply with Government policy(h)
per cent 100 100 100
Planning for sustaining communities meets councils’ infrastructure programming requirements(i)
per cent 70 90 nm
Planning for sustaining communities meets councils’ strategic planning performance requirements(i)
per cent 80 90 nm
Proportion of precinct structure plans (PSPs) completed in accordance with adopted process(b)
per cent 100 100 nm
Transit cities project/works delivered in accordance with agreed plans(e)
per cent 80 80 80
User satisfaction with training and development under the PLANET program(d)
per cent 80 90 92.5
Timeliness Advice to Government on policy issues to facilitate informed decision making – response within required timeframe(d)
per cent 100 100 nm
Approved amendments gazetted within eight working days of approval(d)
per cent 100 100 100
Completion of analysis of residential and industrial land stocks for UDP (Urban Development Report)(j)
date Jun2009
Jun2009
Jun2008
Service Delivery 2009-10 Appendix C 475

Major Outputs/DeliverablesPerformance Measures
Unit of Measure
2008-09 Expected Outcome
2008-09 Target
2007-08 Actual
Establish regional housing targets for regions and for local governments within regions(k)
date Jun2009
Jun2009
nm
Negotiation with remaining local council to implement housing supply capacity targets(k)
date Jun2009
Jun2009
nm
Planning permits issued within statutory timelines(l)
per cent 98 98 47
PSPs completed in accordance with agreed timetable(b)
number 9 9 nm
Strategic planning program in place on agreed time frame(h)
per cent 100 100 nm
Transit cities projects progressed in accordance with agreed timelines(e)
per cent 80 80 80
UDP prepared (b) date Dec2008
Dec2008
Mar2008
Heritage ProtectionQuantity
Heritage permit approvals (including exemption approvals)(m)
number 626 550 555
Number of heritage studies published or disseminated within the community(n)
number 38 40 80
Number of local authorities providing a heritage advisory service to the community(n)
number 64 64 64
Number of volunteer projects undertaken on heritage places or collections(o)
number 80 26 26
Quality Non-contested heritage place listings(n) per cent 83 85 93
Timeliness Funding for heritage restoration projects committed against agreed budgets(n)
per cent 100 100 100
Heritage advisor program meets agreed budget timelines(n)
per cent 100 100 100
Youth AffairsQuantity
FReeZA metropolitan grants: number approved(p)
number 32 32 32
FReeZA rural and regional grants: number approved(p)
number 37 37 37
Regional youth affairs networks(p) number 15 15 15Schools participating in the Advance Youth Development Program(p)
number 400-410 400-410 403
Youth participation and access program grants(n)
number 90-100 90-100 100
476 Appendix C Service Delivery 2009-10

Major Outputs/DeliverablesPerformance Measures
Unit of Measure
2008-09 Expected Outcome
2008-09 Target
2007-08 Actual
Quality Youth participation and access program: grants paid against milestones of funding agreements(n)
per cent 100 >90 100
Women’s PolicyQuantity
Number of consultations held(n) number 4-6 4-6 11Quality
Client satisfaction with advice provided(n) per cent 100 100 100Timeliness
Women’s safety strategy delivered against performance target(q)
per cent 80 80 80
Seniors and VeteransQuantity
Number of Veteran community events(n) number 5 5 5Quality
Funded projects for which satisfactory reports have been received(n)
per cent 100 100 100
Indigenous Community and Cultural DevelopmentQuantity
Formal consultations with Indigenous communities concerning community building and cultural heritage management activities and government issues(n)
number 80 80 102
Governance training programs supported(r) number 7 7 8Heritage projects jointly developed and carried out with Aboriginal communities(s)
number 8 8 8
Heritage training activities addressing community identified priority issues(s)
number 10 10 10
Verified records added to heritage data base(o) number 800-1 000 800-1 000 901Quality
Increase in board members undertaking governance training(v)
per cent 10 10 10
Local Indigenous groups developing local plans(w)
per cent 80 80 100
Timeliness High priority cyclical building maintenance works completed within stipulated time frames(n)
per cent 100 100 100
Lake Tyers projects: completed within set timeframes(n)
per cent 85 85 85
Service Delivery 2009-10 Appendix C 477

Major Outputs/DeliverablesPerformance Measures
Unit of Measure
2008-09 Expected Outcome
2008-09 Target
2007-08 Actual
Proportion of community infrastructure feasibility studies completed within agreed time(n)
per cent 85 >80 80
Adult and Community EducationQuantity
Student contact hours government funded through the ACFEB to 16 to 24 year olds – ACE organisations and adult education institutions(x)
number (million)
1.56 1.4 nm
Timeliness Adult community education equipment grants: grants acquitted within the timeframes specified in the terms and conditions of the funding agreement(y)
per cent 100 100 100
Sport and Recreation DevelopmentQuantity
Community sport and recreation organisations undertaking projects/ activities(z)
number 80 80 80
Community sporting facility grants: number approved(aa)
number 150 >120 308
Country football/netball grants: number approved(aa)
number 27 25-35 55
Key industry organisations providing strategic advice to government(z)
number 5 5 5
Number of VFL ground projects commenced(ab) number 6 6 nmState level facilities: under design or construction(ac)
number 6 6 6
State level facilities: under investigation(ac) number 4 4 3Quality
Completion of ongoing operational and budget reports for each event(ad)
per cent 100 100 100
Delivery of an approved business plan for each event incorporating appropriate operational, marketing plan and financial information(ad)
per cent 100 100 100
Timeliness Commencement of MCG concourse extension works(ae)
date qtr 2 qtr 2 nm
Completion of business case for the refurbishment of Melbourne Park(af)
date qtr 3 qtr 3 nm
Rectangular sports stadium – Completion of structural work and commencement of seating works(ag)
date Jun 2008 Jun 2009 nm
478 Appendix C Service Delivery 2009-10
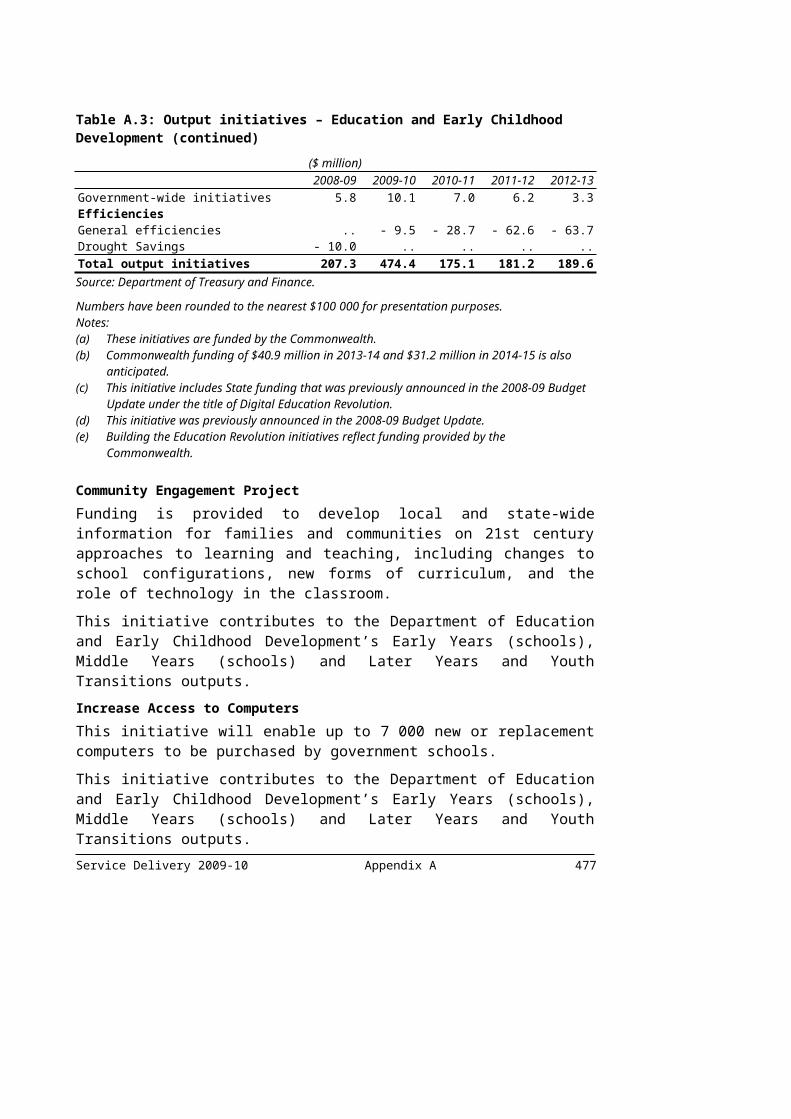
Major Outputs/DeliverablesPerformance Measures
Unit of Measure
2008-09 Expected Outcome
2008-09 Target
2007-08 Actual
Site establishment works commenced at Lakeside Oval(ah)
date qtr 4 qtr 4 nm
Community StrengtheningQuantity
Community bus investments provided(n) number 6 6 4Community enterprise grants: number approved(ai)
number 32 10 5
Community Foundations: Sites established(n) number 3 3 nmEnterprising Communities: operations community enterprise catalyst(n)
number 1 1 nm
ICT projects and programs underway(n) number 7 7 7Volunteering small grants: number approved(aj) number 300-330 60-90 215
QualityCommunity renewal: grants paid against milestones of funding agreement(ak)
per cent 100 100 100
Community services workforce Capability Framework: developed in consultation with and endorsed by community sector(t)
per cent 100 100 nm
Community support fund: grant paid against milestones of funding agreements(ak)
per cent 100 100 100
Enterprising communities: grants paid against milestones of funding agreement(ak)
per cent 100 100 nm
Flexible transport solutions grants: grants paid against milestones of funding agreements(ak)
per cent 100 100 100
ICT project quarterly monitoring reports are assessed(n)
per cent 100 100 100
No interest loans scheme (NILS): grants paid against milestones of funding agreements(ak)
per cent 100 100 100
TimelinessCommunity renewal: grants acquitted within the timeframe specified in the terms and conditions of the funding agreement(al)
per cent 100 100 100
Community support fund: grants acquitted within the timeframe specified in the terms and conditions of the funding agreement(al)
per cent 90 90 100
Community support fund: grant payments assessed and approved within seven working days(n)
per cent 90 90 97
Office for the community sector established(am) date qtr 1 qtr 1 nmPayments made according to contracts provided ICT grant recipients meet contract terms(ak)
per cent 100 100 100
Service Delivery 2009-10 Appendix C 479

Major Outputs/DeliverablesPerformance Measures
Unit of Measure
2008-09 Expected Outcome
2008-09 Target
2007-08 Actual
Local Government Sector DevelopmentQuantity
Inter-library loans supplied by public library services to other libraries(n)
number 18 000 18 000 nm
Library branches with computer safety measures in place(n)
per cent 75 75 nm
Library construction or refurbishment grants: number completed(n)
number 12 12 10
Living libraries program grants: number approved(an)
number 15 15 15
Public library services: grants paid against milestones of funding agreements(ao)
per cent 100 100 100
QualityCouncils meet performance measurement and management reporting system requirements(n)
per cent 100 100 100
Future of local government program: initiatives funded meet milestones(ap)
per cent 100 100 44
Victoria Grants Commission: program components meet milestones for performance agreements(aq)
per cent 100 100 100
Timeliness Council annual reports lodged within statutory timeframes(ar)
per cent 94 100 94
Premiers reading challenge book fund: Proportion of funds allocated within agreed timelines(ao)
per cent 100 100 100
Neighbourhood Houses and Men’s ShedsQuantity
Hours of activities funded through the Neighbourhood House Coordination program(n)
number 900 000 900 000 90 000
Men’s Shed Program grants: number approved(n)
number 15 15 25
Neighbourhood House capital grants: number approved(n)
number 100 100 134
Quality Men’s Shed program: grants paid against milestones of funding agreements(ak)
per cent 100 100 100
Neighbourhood House program: grants paid against milestones of funding agreements(ak)
per cent 100 100 100
Source: Department of Planning and Community Development
Notes:(a) This performance measure has been replaced by the new 2009-10 measure 'Development Facilitation
priority projects considered' as a result of a departmental review.
480 Appendix C Service Delivery 2009-10

(b) This performance measure has been discontinued as a result of a departmental review to ensure that the Department's 2009-10 performance measures are better aligned and appropriately allow for the assessment of the department's production and delivery of outputs. The performance measure is currently reported on annually in the UDP Report.
(c) This performance measure has been replaced by the new 2009-10 measure 'Development of model to support housing growth requirements in Metropolitan region' as a result of a departmental review.
(d) PLAnning NETwork is a training program run by DPCD. This performance measure has been discontinued as a result of a departmental review to ensure that the Department's 2009-10 performance measures are better aligned and appropriately allow for the assessment of the Department's production and delivery of outputs. The service is currently monitored and reported on via internal performance management processes.
(e) This performance measure has been discontinued as it is no longer appropriate due to the designation of Central Activity Districts in Melbourne@5 million.
(f) This performance measure has been discontinued as a result of a departmental review to ensure that the Department's 2009-10 performance measures are better aligned and appropriately allow for the assessment of the department's production and delivery of outputs. The service is currently reported on annually and posted on the DPCD website.
(g) This performance measure has been replaced by the new 2009-10 measure 'Research bulletins on population projections and residential land published' as a result of a departmental review.
(h) This performance measure has been discontinued as the current and ongoing performance measures adequately measure planning efficiency.
(i) The 2008-09 Expected Outcome is lower than the Target as the alignment of strategic planning initiatives has not always been possible with every council's infrastructure programming and strategic planning requirements. This performance measure has been discontinued as the current and ongoing performance measures adequately measure planning efficiency.
(j) This performance measure has been discontinued as the service is currently reported on annually in the UDP Report.
(k) This performance measure is no longer relevant as the target was annual and was met in 2008-09.(l) This performance measure has been discontinued as the service is currently reported on annually in
the Planning Permit Activity Report.(m) This performance measure has been discontinued as a result of a departmental review to ensure that
the Department's 2009-10 performance measures are better aligned and appropriately allow for the assessment of the department's production and delivery of outputs. The service is currently monitored and reported on via internal performance management processes. The 2008-09 Expected Outcome is higher than the Target due to a higher than anticipated number of applications in 2008-09.
(n) This performance measure has been discontinued as a result of a departmental review to ensure that the Department's 2009-10 performance measures are better aligned and appropriately allow for the assessment of the department's production and delivery of outputs.
Service Delivery 2009-10 Appendix C 481

Notes (continued):(o) This 2009-10 performance measures are better aligned and appropriately allow for the assessment of
the Department's production and delivery of outputs. The service is currently monitored and reported on via internal performance management processes. The 2008-09 Expected Outcome is higher than the Target due to a higher than anticipated interest in volunteer projects in 2008-09.
(p) This performance measure has been deleted as a result of a departmental review to ensure that the Department’s 2009-10 performance measures are better aligned and appropriately allow for the assessment of the department’s production and delivery of outputs. It is reported on the Annual Youth Report.
(q) This performance measure has been discontinued as the Women’s Safety Strategy 2002-07 has now concluded. A State Plan to prevent violence against women is currently being developed.
(r) This performance measure has been replaced by the new 2009-10 measure 'Governance training programs implemented'. It has been reworded to replace 'supported' with 'implemented'.
(s) This performance measure has been replaced by the new 2009-10 measure 'Cultural heritage management capacity building activities undertaken with community groups'. It has been replaced to better describe the focus of these activities.
(t) This performance measure has been deleted as it is now complete.(u) This performance measure has been discontinued as a result of a departmental review to ensure that
the Department’s 2009-10 performance measures are better aligned and appropriately allow for the assessment of the department’s production and delivery of outputs. The 2008-09 Expected Outcome has exceeded the Target as the Aboriginal Heritage Council experienced a greater than anticipated workload resulting in the need for extra meetings to progress Registered Aboriginal Party appointments.
(v) This performance measure has been replaced by the new 2009-10 measure 'Governance training initiatives – participant completion rate' as a result of a departmental review.
(w) This performance measure has been replaced by the new 2009-10 measure 'Local Indigenous representation groups completed stage one of community plans'. It has been reworded to reflect the completion of stage one of the three stage community planning process undertaken by the Local Indigenous Networks.
(x) This performance measure has been replaced by the amended 2009-10 measure 'Student contact hours Government funded through the ACFEB to 15 to 24 year olds – ACE organisations and AEI’s'. It has been amended to include 15 year olds because of the inclusion of 15 year olds in the ACE Youth Guarantee program.
(y) This performance measure has been discontinued as the final program allocation was in the 2008-09 Budget.
(z) This performance measure has been consolidated and replaced by the new 2009-10 measure 'Key Sport and Recreation organisations undertaking projects or activities, or providing services or strategic advice' as a result of a departmental review.
(aa) This performance measure has been consolidated and replaced by the new 2009-10 measure 'Community Facility Grants: number approved' as a result of a departmental review.
(ab) This performance measure has been discontinued as VFL projects have commenced.(ac) This performance measure has been consolidated and replaced by the new 2009-10 measure
'Projects related to state level facilities in progress' as a result of a departmental review.(ad) This performance measure has been consolidated and replaced by the new 2009-10 measure
'Completion of an approved business plan and ongoing operational and budget reports for each event' as a result of a departmental review.
(ae) This performance measure has been discontinued as the extension works have been completed.(af) This performance measure has been discontinued as the business case is completed.(ag) This performance measure has been replaced by 'Rectangular Pitch Stadium Completion of works'
which better reflects the progress of works.(ah) This performance measure has been replaced by 'Construction continuing at the State sports facility
project in Albert Park' which better reflects the progress of this project.
482 Appendix C Service Delivery 2009-10

Notes (continued):(ai) This performance measure has been reworded and replaced by the 2009-10 performance measure
'Community enterprises supported'. It has been reworded as a result of a departmental review. This performance measure will exceed the 2008-09 Target as the target reflects the maximum available amount of $50 000 but the average grant amount was $26 000, allowing for a greater number of grant approvals within the original allocation. The remaining funds have been set aside to provide additional support to the 17 new enterprises receiving grants, and to support additional enterprise proposals to 2010-11. Program delivery efficiencies have also contributed to the greater number of grants made.
(aj) This performance measure has been discontinued as a result of a departmental review to ensure that the department's 2009-10 performance measures are better aligned and appropriately allow for the assessment of the Department's production and delivery of outputs. This performance measure is exceeding is 2008-09 Target and exceeded its 2007-08 Target as the average grant amount approved was less than the maximum available, allowing for a greater number of grant approvals within the original allocation. In addition program delivery efficiencies have contributed to the greater numbers. In 2008-09 the Bushfire volunteering grants are also being funded within this program.
(ak) This performance measure has been combined with other grant related measures in the new 2009-10 measure 'Grant payments paid against completion of funding agreement milestones' as a result of a departmental review.
(al) This performance measure is being discontinued and is replaced by the 2009-10 measure 'Grants acquitted within the timeframe specified in the terms and conditions of the funding agreement' which measures a combined number of grant programs.
(am) This performance measure is completed as the Office for the Community Sector was established in 2008.
(an) This performance measure has been replaced by the new 2009-10 measure ‘Living Libraries grants provided to improve public library services in partnership with local councils’ as a result of a departmental review.
(ao) This performance measure has been replaced by the new 2009-10 measure ‘Funding for Public Library Services grants and Premier’s reading challenge book fund paid against milestones of funding agreements’ as a result of a departmental review.
(ap) This performance measure has been discontinued as a result of a departmental review. The bulk of Future of Local Government program funding has been allocated for implementation of projects commencing in 2008-09 by the Councils Reforming Business Steering Committee.
(aq) This performance measure has been replaced by the new 2009-10 measure 'Victorian Grants Commission payments are made within timeframes agreed with local councils’ as a result of a departmental review.
(ar) This performance measure has been discontinued as a result of a departmental review to ensure that the Department's 2009-10 performance measures are better aligned and appropriately allow for the assessment of the department's production and delivery of outputs. The 2008-09 Target has not been achieved as five Councils failed to lodge reports within statutory timeframes.
Service Delivery 2009-10 Appendix C 483
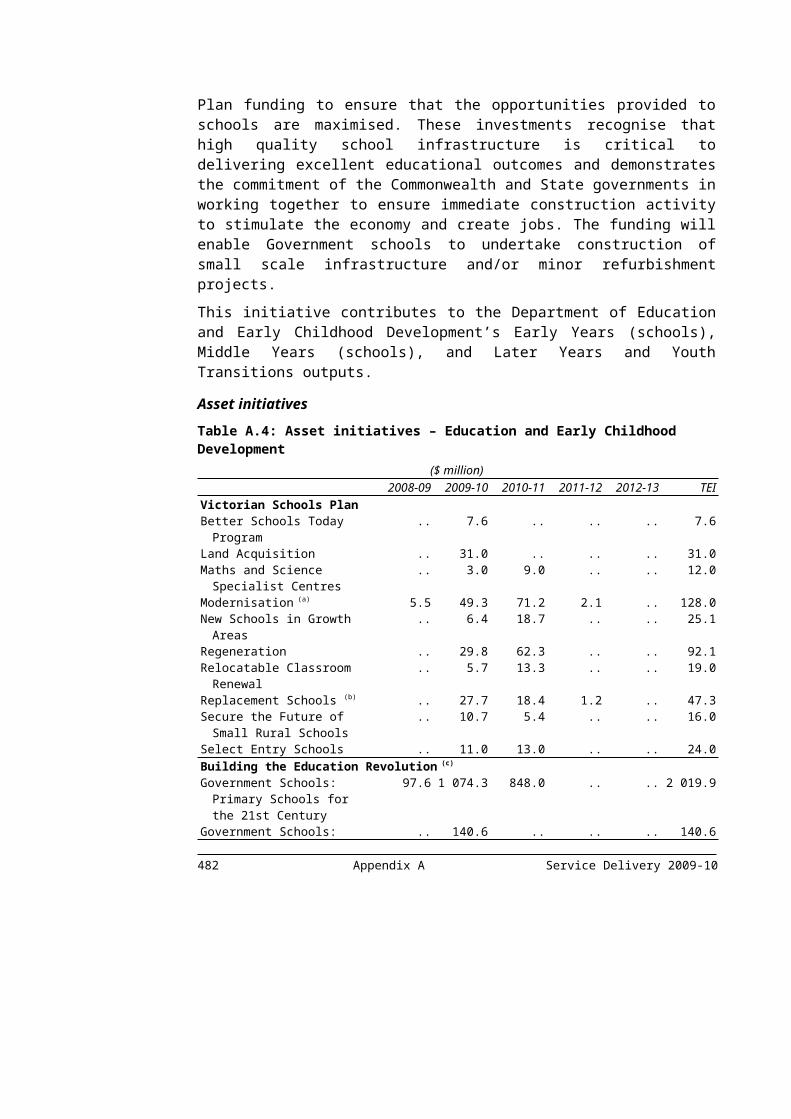
Department of Premier and Cabinet – discontinued performance measuresMajor Outputs/DeliverablesPerformance Measures
Unit of Measure
2008-09 Expected Outcome
2008-09 Target
2007-08 Actual
Strategic Policy ProjectsQuality
Policy services rating(a) per cent 86 86 89
Arts Development and AccessTimeliness
Performance and grant agreements acquitted within 90 days of project(b)
per cent 80 80 86
Creating Place and SpaceQuantity
Major projects managed(c) number 2 2 2
Multicultural AffairsTimeliness
Multilingual technology strategy developed(d) date June 2009
June 2009
nm
State Services AuthorityQuality
Satisfaction of public sector standards commissioner with the application of the employment principles across the sector – large employers(e)
per cent 90 90 86
Satisfaction of public sector standards commissioner with the application of the employment principles across the sector – small employers(e)
per cent 80 80 80
Source: Department of Premier and Cabinet
Notes:(a) This measure was replicated in the new ‘Strategic policy advice and projects’ output.(b) This measure was amended to better align it with statutory requirements for grant recipients.(c) This measure has been replaced by ‘State owned facilities maintained to meet service and statutory
needs’ to better reflect the work undertaken by Arts Victoria.(d) This measure has been discontinued as the project has been completed.(e) This measure has been discontinued and a new survey of public sector bodies is expected to produce
more meaningful data for continuous improvement in this area, and also assist in the development of a new output measure in 2010-11.
484 Appendix C Service Delivery 2009-10
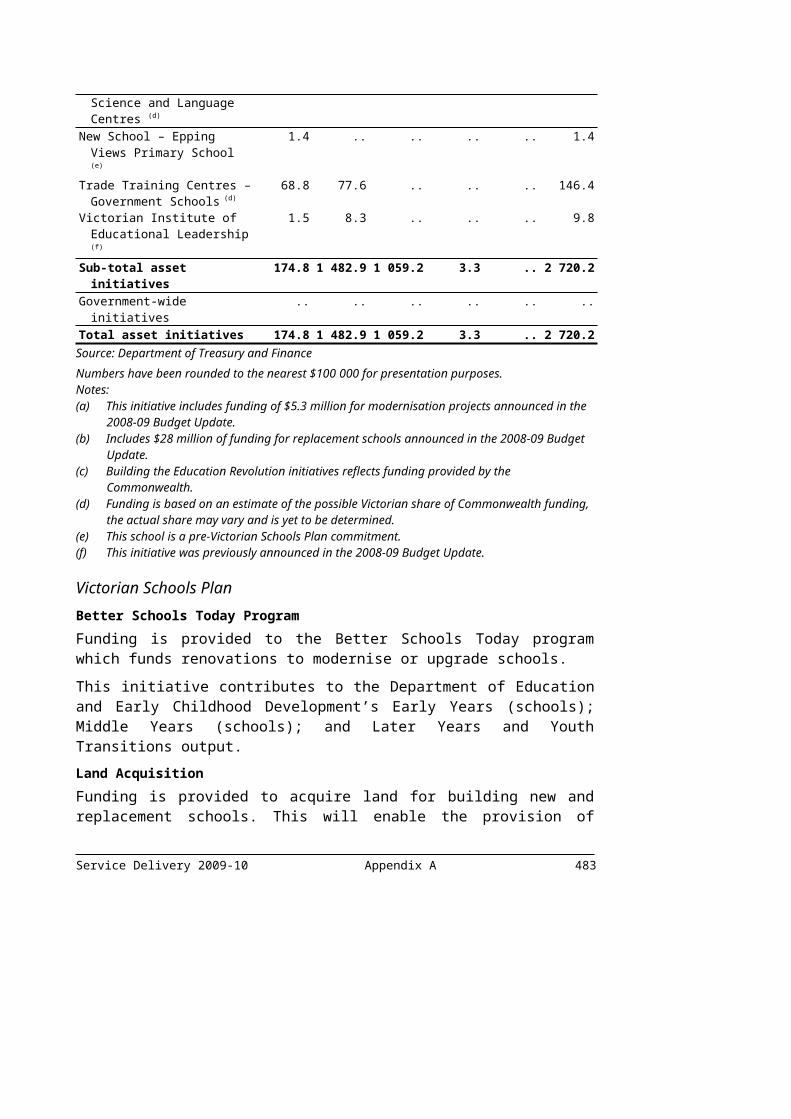
Department of Primary Industries – discontinued performance measures
Service Delivery 2009-10 Appendix C 485

Major Outputs/DeliverablesPerformance Measures
Unit of Measure
2008-09 Expected Outcome
2008-09 Target
2007-08 Actual
Strategic and Applied Scientific ResearchQuantity
Annual percentage increase in Victorian milk production based on 2007-08 levels(a)
per cent 1 1 nm
New post graduate students engaged(b) number 6 6 nmNumber of commercial technology research and development agreements finalised(c)
number 77 77 70
Sustainable Practice ChangeQuantity
Agreements with local government to control pests on roadsides(d)
number 60 30 nm
Number of regional communities actively supported through structural adjustment programs(e)
number 10 10 nm
Number of targeted areas in which DPI will conduct additional case management for adjustment(f)
number 5 2 nm
Primary Industries PolicyQuality
Percentage of key management performance indicators for the relevant stage of current fisheries management plans that are measured and reported(g)
per cent >90 >90 92
Timeliness Develop governance structure, marketing strategy and request for proposals guidelines for the Future Energy Technology Innovation Strategy large scale demonstration project grant rounds(h)
per cent 100 100 nm
Percentage of first generation regional Gippsland Basin fluid flow model completed(i)
per cent 100 100 nm
Regulation and ComplianceQuantity
Signed land manager (public and private) agreements to undertake agreed improved land management practices(j)
number 60 9 nm
Number of state prohibited weed infestations treated(j)
number 246 130 130
Source: Department of Primary Industries
Notes:(a) This measure will be replaced by the new measure ‘Genetic improvement of dairy cows achieved
through breeding contributing to increased milk production and dairy productivity’.486 Appendix C Service Delivery 2009-10

(b) This measure will be discontinued due to its similarity to the existing measure 'Number of Postgraduate level PhD students in training by DPI'.
(c) This measure will be replaced by the new measure ‘Commercial technology licence agreements finalised’.
(d) This measure will be replaced by the new measure 'Formal agreements with land managers (public and private) and peak body organisations to undertake agreed pest management practices' which will be reported via the ‘Regulation and compliance’ Output.
(e) This measure will be replaced by the new measure 'Farming communities provided with information through AgFutures Forums about the key drivers of change for agriculture to guide local decision making'.
(f) This measure will be replaced by the new measure 'Farm clients facing significant adjustment pressures are case managed to make better informed and more timely decisions'.
(g) This measure has been discontinued as the measurement of fisheries management plans is captured within the current measure 'Fisheries management plans actions implemented within agreed timelines'.
(h) This measure only applies to the first phase of the Future Energy – Energy Technology Innovation Strategy (ETIS) large-scale program, which was completed in 2008-09. It has been replaced by three new measures relating to the ETIS initiative.
(i) This measure has been replaced with a new measure for 2009-10 reflecting the progress within the Gippsland Basin dynamic modelling initiative.
(j) This measure has been replaced by the new measure 'Formal agreements with land managers (public and private) and peak body organisations to undertake agreed pest management practices'. The higher 2008-09 Expected Outcome reflects involvement of public land managers to treat regionally prohibited weeds under the Future Farming strategy.
Service Delivery 2009-10 Appendix C 487
Department of Sustainability and Environment – discontinued performance measuresMajor Outputs/DeliverablesPerformance Measures
Unit of Measure
2008-09 Expected Outcome
2008-09 Target
2007-08 Actual
Sustainable Water Management and SupplyQuantity
Schools participating in the schools water efficiency improvement program(a)
number 650 300 300
Natural ResourcesQuality
Farmers with environmental management systems(b)
number 2 000 2 000 2 000
Land Administration and Property InformationQuantity
Land channel page impressions(c) number (‘000)
16 000 5 000 11 815
Source: Department of Sustainability and Environment
Notes:(a) Participation in the School Water Efficiency Program (SWEP) is significantly above the 2008-09
Target as the Department of Education and Early Childhood Development mandated that all public schools undertake the program. As a result this performance measure is no longer required.
(b) The responsibility for farmers’ use of environmental management systems will be transferred to Department of Primary Industries as of July 2009.
(c) This measure has been replaced by two new measures – ‘Maps generated on land channel’ and ‘Reports generated on land channel’, which will more accurately report on these outcomes.
488 Appendix C Service Delivery 2009-10

Department of Transport (formerly Department of Infrastructure) – discontinued performance measures
Service Delivery 2009-10 Appendix C 489
Major Outputs/DeliverablesPerformance Measures
Unit of Measure
2008-09 Expected Outcome
2008-09 Target
2007-08 Actual
Marine Safety and RegulationQuantity
Recreational vessel compliance with registration requirements(a)
per cent 96 96 95.8
Quality Recreational boat operator compliance with licensing requirements(a)
per cent 100 100 97.2
Road Network ImprovementsQuantity
EastLink Project: concession deed identified, project groups and other concession management committees meet at agreed frequency(b)
per cent 100 100 100
Quality Design and construction issues for EastLink progressively identified and resolved with Concessionaire(b)
per cent 100 100 100
Operating and service delivery issues for EastLink progressively identified with the Concessionaire(b)
per cent 100 100 nm
Southern and Eastern Integrated Transport Authority’s (SEITA) risk management plan reviewed and mitigation strategies in place(b)
number of reviews
4 4 4
Timeliness Major design and construction milestones for EastLink reviewed and reported(b)
per cent 100 100 100
Infrastructure Security and Emergency ManagementQuantity
Strategic policy briefings to the portfolio Ministers(c)
number 30 30 30
Public Transport Infrastructure DevelopmentQuantity
Projects continuing: Wodonga rail bypass(d) number 1 1 1Track duplication – Clifton Hill to Westgarth: main works packages(e)
per cent 100 80 20
Timeliness Craigieburn crossovers and signalling: concept design completed(f)
date qtr 4 qtr 4 nm
Dandenong Rail corridor stage 2 – Westall rail upgrade: award contract(f)
date qtr 4 qtr 4 nm
490 Appendix C Service Delivery 2009-10

Major Outputs/DeliverablesPerformance Measures
Unit of Measure
2008-09 Expected Outcome
2008-09 Target
2007-08 Actual
Development of new integrated public transport ticketing solution : customer involvement in regional bus pilot(f)
date qtr 2 qtr 2 nm
Laverton rail upgrade: award contract(f) date qtr 3 qtr 3 nmMetrol Replacement: interface demonstrations completed for core Metrol systems(f)
date qtr 2 qtr 3 nm
Metropolitan Train Communications System replacement: detailed system design completed(f)
date qtr 4 qtr 4 nm
North Melbourne station interchange upgrade: completion of works on concourse(f)
date qtr 4 qtr 4 nm
SmartBus: Green Orbital Stage 2 – Nunawading to Airport West(f):
construction works commence on road priority treatments
date qtr 1 qtr 2 nm
construction works commence on bus stop upgrade works
date qtr 4 qtr 4 nm
SmartBus: Red Orbital – Box Hill to Altona(f): construction works completed for on road priority treatments
date qtr 4 qtr 4 nm
construction works completed for bus stop upgrade works
date qtr 2 qtr 3 nm
services commence date qtr 4 qtr 3 nmVigilance control and event recording system (VICERS): completion of commissioning of VICERS on Comeng fleet(f)
date qtr 4 qtr 2 nm
Freight, Logistics, Ports and Marine DevelopmentQuantity
Dynon Port rail link: design and construction of bridge, road and rail works (excluding signalling) (f)
per cent 100 90 44
Geelong Port rail access: planning and construction(f)
per cent 100 100 30
Projects continuing: rail gauge Standardisation(g)
number 1 1 1
Timeliness Dynon Port rail link: complete Appleton Dock Road(f)
date qtr 1 qtr 1 na
Dynon Port rail link: complete Customs Access Road(f)
date qtr 1 qtr 1 na
Source: Department of Transport
Notes:
Service Delivery 2009-10 Appendix C 491

(a) This output measure is replaced by two new measures ‘Recreational vessel and operator compliance with both registration and licensing requirements’ and ‘Recreational vessel compliance with safety equipment and operational behaviour’.
(b) The EastLink project has been constructed and was opened in June 2008 to the public five months ahead of schedule.
(c) This output measure is replaced by a new measure ‘Provide advice to the portfolio Ministers on policy issues within required timeframes’ to more accurately reflect activities undertaken.
(d) This output measure is replaced by a new quantity measure ‘Wodonga rail bypass’ to measure the progress of the project.
(e) Main works will be completed in 2008-09, with practical completion in the fourth quarter. Landscaping and property disposal scheduled for 2009-10.
(f) This measure is expected to be completed in 2008-09.(g) Rail gauge standardisation is being progressed on a project by project basis. A new 2009-10
performance measure for ‘North East rail gauge standardisation’ has been introduced.
492 Appendix C Service Delivery 2009-10

Department of Treasury and Finance – discontinued performance measuresMajor Outputs/DeliverablesPerformance Measures
Unit of Measure
2008-09 Expected Outcome
2008-09 Target
2007-08 Actual
Economic Regulatory ServicesQuantity
Price determinations(a) number 1 0 24
GBE Performance Monitoring and Financial Risk ManagementQuantity
Corporate plans reviewed and assessed(b) number 187 187 nm
Source: Department of Treasury and Finance
Notes:(a) This measure has been discontinued as there are no price determinations scheduled for 2009-10.(b) This discontinued measure has been replaced by the 2009-10 measure ‘Corporate plans reviewed
and assessed and analysis of quarterly performance reports.’
Service Delivery 2009-10 Appendix C 493

494 Appendix C Service Delivery 2009-10
APPENDIX D – LOCAL GOVERNMENT FINANCIAL RELATIONS
This section provides an overview of the local government sector in Victoria and highlights the 2009-10 Budget initiatives that involve councils.
Local government is an essential tier of government in Australia, enshrined in the State Constitution. Victoria has 79 councils providing a wide range of services. Many state government programs are either delivered by, or in conjunction with, local government. State government programs may operate in a specific local government area, with in kind support and in collaboration with local government.
In response to the 2009 Victorian bushfires, the State Government has taken decisive action to enable people to get their lives back on track and for communities to begin the rebuilding process. The Victorian Bushfire Reconstruction and Recovery Authority is working closely with local councils to help rebuild communities affected by the bushfires. Local governments are being engaged in the deployment of community bushfire recovery officers and the communication of new building standards. This is in addition to the funding provided under Victorian Natural Disaster Relief Arrangements (NDRA) for emergency response measures and asset restoration work undertaken by local councils in response to the bushfires. Further bushfire related initiatives that will be implemented in partnership with local government are outlined in this chapter.
The State Government has introduced administrative changes to simplify and speed up the claim and assessment process for councils receiving NDRA funding. In addition to these administrative arrangements, the Office of the Emergency Services Commissioner is undertaking a review of the Municipal Emergency Management Guidelines and the manner in which financial assistance is provided to councils following a natural disaster.
The State Government is working with local government on making councils more transparent and accountable, improving their financial sustainability and creating liveable communities. Current initiatives include:
Transparent and Accountable Government: The State Government is reforming legislation to support better local governance and improved councillor conduct. The State has introduced the Local Government Amendment (Councillor Conduct and Other Matters) Act 2008, which received Royal Assent on 18 November 2008. The new legislation defines the standards of conduct expected of councillors and gives Councillor Conduct Panels and Victorian Civil Appeals Tribunal powers to
Service Delivery 2009-10 Appendix D 495

discipline councillors who fail to meet those standards. The legislation also redefines conflict of interest to better represent contemporary public expectations. The Government provided $600 000 in the 2008-09 Budget for Councillor induction training. The resource kit, Supporting and Promoting Accountability and Responsibility for Councillors (SPARC), has been developed, and local government peak bodies have received funding to include SPARC content in their councillor training. Councillors from smaller councils are being assisted to attend this training;
Financial sustainability and performance reporting: The State assists councils to improve their financial sustainability through the collection and analysis of comparative data which identifies councils in need of assistance and provides an evidence base for further action. Model financial reports, best practice guides and training are provided to councils to support their financial and asset management. In addition, performance reporting guidelines are currently being developed which will assist councils to enhance their selection and application of performance measures;
Creating Liveable Communities: The Living Libraries Program will continue to provide funding to councils and regional libraries to rejuvenate library facilities across Victoria ($15 million to councils and local libraries over four years to 2010-11); and
Local government is a key partner in the implementation of Melbourne 2030 and state planning initiatives. New planning structures such as the Development Assessment Committees as well as the Creating Better Places and Expert Assistance programs enable state and local governments to partner in the planning and development of metropolitan activity centres and regional centres. The Planning and Environment Act 1987 is also being reviewed and opportunities will be provided for key stakeholders, including local governments, to comment on the improvements to the Act’s operation.
LOCAL GOVERNMENT IN VICTORIAThe Victorian local government sector spends around $5.2 billion a year and in 2007-08 (most current Victorian Grants Commission data) comprised around 2 per cent of Victoria’s gross state product. Councils deliver vital services to their communities, including community services, local roads, waste management, recreation and cultural activities.
Around 72 per cent of recurrent local government revenue is obtained from rates and charges levied by councils. Around 8 per cent of council recurrent revenue is provided through the Victorian Grants Commission as general revenue assistance and for local roads. Other recurrent Commonwealth and Victorian grants comprise approximately a further 9 per cent of council recurrent revenues. Most State Government funds provided to local governments are used to subsidise libraries, community assets, sporting facilities and other specific services.
The State Government also provides land and payroll tax exemptions to local government, which benefit Victorian councils by more than $200 million a year (refer to 496 Appendix D Service Delivery 2009-10

Tables 5.2 and 5.4 in Budget Paper No. 4). Local government also provides some rate exemptions to the State Government.
Table D.1: Grants and Transfers to Local Government ($ thousand)
2008-09 Budget
2008-09 Revised
2009-10 Budget
Department of Education and Early Childhood Development (a) 50.0 50.0 50.0Department of Human Services (b) .. .. ..Department of Innovation, Industry and Regional Development 23 485.0 33 779.0 64 457.7Department of Justice 1 021.0 1 101.0 1 040.0 Country Fire Authority 710.7 726.3 762.6Department of Planning and Community Development 511 253.8 526 687.6 540 803.5Department of Premier and Cabinet 6 791.0 10 141.0 8 073.0Department of Primary Industries 11 457.9 11 383.9 9 364.7Department of Sustainability and Environment 18 849.8 21 573.8 16 304.6 Parks Victoria 264.0 1 070.8 1 090.5 Catchment Management Authorities 765.0 765.0 765.0 Other Environment Agencies 28.0 28.0 28.0Department of Transport 9 000.0 8 000.0 10 000.0Department of Treasury and Finance 6 000.0 3 920.0 6 000.0Total grants 589 676.2 619 226.3 658 739.6Source: Department of Treasury and Finance.
Notes:(a) Excludes funds provided to local government under the Maternal and Child Health Care program as
these are for service delivery rather than provided as a grant.(b) Excludes funds provided to local government under the Home and Community Care program as these
are for service delivery rather than provided as a grant.
As shown in Table D.1, total grants and transfers to local government are expected to increase by 11.7 per cent, from $590 million in the 2008-09 Budget to $659 million in the 2009-10 Budget. Grants and transfers to local government in 2009-10 are expected to be higher than budgeted, due to additional funds being provided to local government and communities to manage bushfire and drought responses and other initiatives.
The Department of Planning and Community Development (DPCD) provides the majority of funds to assist local government. Most of these funds are Commonwealth financial assistance and road grants that are passed on to local government (around 80 per cent). DPCD also provides grants to local government for sporting and community assets, libraries and planning activities. Grants to local government from DPCD in 2008-09 are expected to be higher than budgeted primarily due to the Victorian Government providing additional funding to local government for bushfire and drought initiatives such as the Community Building Grants for Bushfire Affected Communities and Relief for Community Sport and Recreation program. Additional funding is being provided to local government in the 2009-10 Budget for new initiatives such as the Community Facilities: Supporting Growing Communities and continuation of the Drought Relief for Community Sport and Recreation and Synthetic Surfaces programs.
Service Delivery 2009-10 Appendix D 497
Payments by the Department of Innovation, Industry and Regional Development to local government are expected to increase from the 2008-09 Budget allocation of $23 million to a revised $34 million due to initiatives for drought response delivered through the Regional Infrastructure Development Fund (RIDF) and the Victorian Transport Plan. The variance in grants to local government in 2009-10 from 2008-09 is primarily due to an increase in funding relating to the Victorian Transport Plan and an expected increase in funding to local government for projects under the Provincial Victoria Growth Fund and RIDF.
The Department of Transport is to provide an estimated $10 million in grants to local government in 2009-10 which is largely due to the TravelSmart, Local Area Access and Boating Facilities programs. The variance in grants to local government in 2009-10 from 2008-09 reflects rescheduling of the TravelSmart and Local Area Access grants.
The Department of Justice grants to local government principally take the form of annual subsidies paid to municipal councils for Victoria State Emergency Service units.
Grants and transfers provided by the Department of Primary Industries to local government are expected to decrease to $9.4 million in 2009-10. This is due to a projected reduction in the subscription of grants for powerline relocation works in 2009-10 compared to 2008-09.
Grants made to local government by the Department of Sustainability and Environment are expected to change from the original $19 million allocated in the 2008-09 Budget to a revised $22 million. This variation is mainly due to increased funding for Environment Protection Authority activities. The variation in grants to local government in 2009-10 is due to reduced funding being provided for the Unbundling of Water Rights initiative.
The Department of Treasury and Finance administers the NDRA, which provides financial assistance to councils affected by natural disasters, such as bushfires, floods and severe storms. This funding is used to reimburse costs incurred by local councils in emergency protection and asset restoration works, such as the clean-up and repair of roads and infrastructure. Actual expenditure fluctuates each year depending on the number and magnitude of natural disasters that have occurred and the funding needs of councils.
In recognition of the unprecedented severity of the 2009 Victorian bushfires, in 2008-09 local councils will receive financial assistance for the standard relief and recovery measures under the NDRA, as well as for other measures approved by the government. Funding is now available to local councils for the establishment and operation of Municipal Emergency Coordination Centres, Relief Centres and Recovery Centres, the provision of direct material assistance to residents, such as food and accommodation and to support those councils who have chosen to waive rates and selected fees and charges.
498 Appendix D Service Delivery 2009-10
The Department of Premier and Cabinet, through Arts Victoria, provides funds to local government to contribute to provincial arts centres, theatres and galleries. The increase in payments to local government in 2008-09 reflects the activities of the Victorian Multicultural Commission, which moved to the Department of Premier and Cabinet under a machinery of government change in January 2009. This increase is offset in 2009-10 by a reduction in projected local government funding under the Arts in the Suburbs program.
Community Support FundThe Government funds a range of initiatives through the Community Support Fund (CSF). Table D.1 does not include all funds provided to local government by the CSF as allocations to local government cannot always be estimated until grant programs are completed.
During 2008-09, CSF approved funding for a number of local governments to undertake community infrastructure and planning projects. Examples from the 2008-09 financial year include:
funding of $195 000 to Pyrenees Shire Council as part of a $695 000 project to redevelop the existing Moonambel Pavilion. This initiative delivers a community hub to meet local needs and will support regional development opportunities for Moonambel and surrounding towns. The redevelopment will incorporate a large multi-purpose space, small meeting room, kitchen, accessible toilets, a community office and storage space;
funding of $400 000 to the City of Greater Dandenong as part of a $878 000 project for a Youth Inclusion Strategy for disadvantaged as well as culturally and linguistically diverse young people;
funding of $2.5 million to the City of Whittlesea for the Thomastown Recreation and Aquatic Centre Redevelopment. This initiative will create a 25 metre lap pool, a warm water exercise pool and an enlarged toddlers pool as well as spa and new change room facilities. The redeveloped complex will also feature a new cafe and child care area; and
funding of $500 000 to the Manningham City Council for the construction of the new Doncaster Library. This state of-the-art library facility forms part of the Civic Hill Precinct and will include increased information technology facilities as well as a learning technology hub. The new library will also include activity spaces for reader development and youth programs, and community program space.
Service Delivery 2009-10 Appendix D 499

2009-10 BUDGET INITIATIVESThis section outlines the key 2009-10 Budget initiatives by department that will be undertaken in partnership with local government. This section includes initiatives where local government is the recipient of grants and transfers and other initiatives which broadly impact local government. State Government funding details for each of these initiatives are provided in Appendix A of this Budget Paper.
Department of Education and Early Childhood DevelopmentLocal governments enter into joint use agreements with schools to contribute to the building of new schools and school facilities (such as libraries and sports facilities) to enable broader use by the community. In addition, many local governments provide or facilitate kindergartens and child care services, so they are involved, not only as planners, but also as providers and facilitators of community based services. The Department of Education and Early Childhood Development 2009-10 Budget initiatives that affect local government are:
National Partnership on Early Childhood Education;
Building the Education Revolution; and
Meeting Increased Demand for Kindergarten Enrolments.
Department of Human ServicesThe Department of Human Services partners with local government in a number of areas including Home and Community Care, and assisting in delivering public health services including immunisation programs. The Department of Human Services 2009-10 Budget initiatives that affect local government are:
Public Health Governance and Regulation Reform;
National Partnership: Preventative Health Chronic Disease Prevention in Victoria;
Community Based Aged Care Services;
Improving Victoria’s Response to Vulnerable Aboriginal Children and Families; and
Redevelopment of Community Facilities (Building Inclusive Communities).
Department of Innovation, Industry and Regional DevelopmentThe Department of Innovation, Industry and Regional Development administers RIDF which has provided significant funding to councils and communities across Victoria. In addition, the Department provides grants, and works with local government in a range of areas including tourism, marketing and industry and business development.
500 Appendix D Service Delivery 2009-10

The Department’s 2009-10 Budget initiatives that affect local government are:
Princes Pier Restoration – Port Melbourne;
Victorian Transport Plan: Local Roads to Markets;
Victorian Transport Plan: Rail Trails and Cycling Paths; and
Victorian Transport Plan: Upgrading Regional Airports.
Department of JusticeThe Department of Justice works with local government in a range of ways such as providing funding to local government for volunteer units of the Victoria State Emergency Service, partnering to deliver the Dispute Settlement Centre of Victoria, and supporting the Department’s Victims Assistance and Counselling program. In addition, Victoria Police work with local government on a range of programs, such as the Neighbourhood Justice Centre with the City of Yarra. Consumer Affairs Victoria coordinates the delivery of some of its programs with local government.
The Department of Justice 2009-10 Budget initiatives that affect local government are:
Continuation of Neighbourhood Justice Centre;
Graffiti Prevention and Removal Strategy; and
Victorian State Emergency Services Volunteer Unit Operating Costs.
Department of Planning and Community DevelopmentThe Department of Planning and Community Development provides a range of grants to local government for libraries, sporting and community assets and provides support for planning. The Department operates programs across Victoria and provides in kind and collaborative support to these programs. The Department of Planning and Community Development 2009-10 Budget initiatives that affect local government are:
Adult, Community and Further Education Building Maintenance program; Community Renewal: (Extension from three to six years); Development Assessment Committees; Community Facilities: Supporting Growing Communities; Creating Better Places and Expert Assistance programs; Volunteering-Active and Engaged Young People and Communities; Extension of Coordination Hours for Neighbourhood Houses; Men’s Sheds; State-wide Electronic Planning Applications Online; Improvement of Soccer Facilities; and Country Football and Netball Program.
Service Delivery 2009-10 Appendix D 501

Department of Sustainability and EnvironmentMany of the Department of Sustainability and Environment’s programs are jointly managed and delivered by local government. In addition, the Department provides a range of materials and information to help assist local government in undertaking its responsibilities, for example, building environmental sustainability through Victoria’s Environmental Sustainability Framework.
Department of TransportThe Department of Transport as the provider of essential public transport, roads and ports infrastructure in Victoria, works closely with local government to deliver the broad range of infrastructure initiatives that benefit Victorian communities. Local government contributes to the Department’s activities by receiving funding, delivering projects, providing in kind support and consulting with the State. The Department of Transport 2009-10 Budget initiatives that affect local government are:
Cycling Package;
Public Bicycle Hire Scheme; and
Taxi Rank Safety.
Government-wide InitiativesThere are a range of 2009-10 Budget initiatives which transcend departmental boundaries, and are managed on a government-wide basis and affect local government:
2009 Victorian Bushfire Response and Recovery;
Drought Response;
National Partnership on Indigenous Early Childhood Development; and
Creating Liveable Neighbourhoods and Communities.
502 Appendix D Service Delivery 2009-10
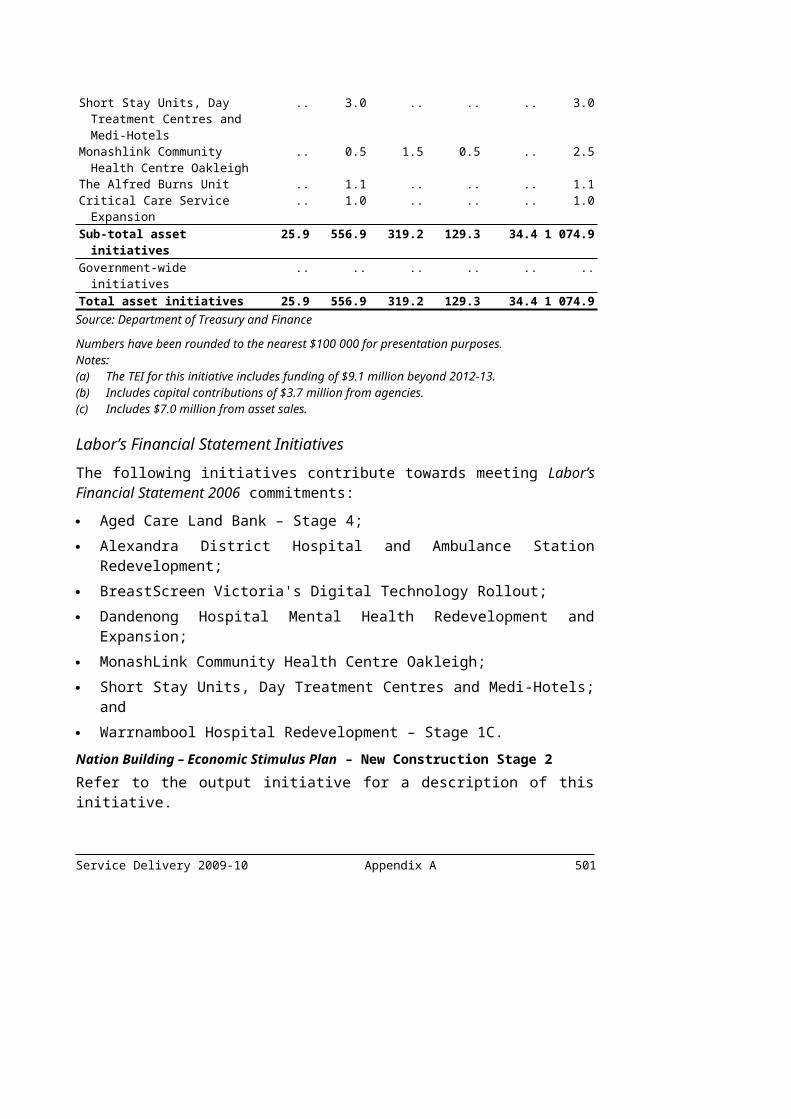
APPENDIX E – VICTORIAN TRANSPORT PLAN
In December 2008 the Government released its $38 billion Victorian Transport Plan (VTP) to transform Victoria’s transport network and provide the best road, train, tram and bus services in Australia.
The VTP provides short, medium and long-term investments to build a transport system that enables Victorians to move in and between our cities and towns, drives job creation and economic growth, and supports environmentally sustainable transport options.
The VTP builds on the $10.5 billion investment in Victoria’s transport system provided for in Meeting Our Transport Challenges (MOTC). All of the MOTC initiatives announced to date will be delivered and will provide important enhancements to transport services and infrastructure. All remaining MOTC funding has been used to fund the VTP.
The 2009-10 Budget has funded 34 VTP initiatives at a total estimated investment (TEI) of $4.5 billion with $433 million in output funding across the forward estimates.
Table E.1 shows the VTP initiatives funded as part of this budget against the commitments outlined in the VTP. Some initiatives are to be delivered in partnership with the Commonwealth Government and the commencement and funding of these projects will be announced once agreement with the Commonwealth has been reached.
Service Delivery 2009-10 Appendix E 503

Table E.1: Victorian Transport Plan output and asset initiatives($ million)
VTP Allocation (a)
2008-09
2009-10
2010-11
2011-12
2012-13
TEI
State Prioritised ProjectsBetter Roads – Regional
Victoria Development1 200 capital .. 5.5 29.9 57.5 9.6 102.4
operating .. .. .. 0.1 0.1Carpooling Initiatives 6 capital .. .. .. .. .. ..
operating .. 1.5 1.5 1.2 1.2 ..Central Activities Districts and
Major Employment Corridors (b) (c)
110 capital .. 3.6 17.5 23.2 23.6 78.9operating .. .. 3.7 .. .. ..
Cycling Package 100 capital .. 6.0 7.2 .. .. 13.2operating .. .. .. .. .. ..
Dingley Arterial 80 capital .. 9.5 31.0 29.0 5.1 74.6operating .. .. .. .. 0.4 ..
Doncaster Area Rapid Transit 360 capital .. 15.3 20.9 5.3 .. 41.5operating .. .. 15.0 27.2 28.4 ..
Gippsland Regional Infrastructure Development
5 capital .. .. .. .. .. ..operating .. 1.0 .. .. .. ..
Greater Geelong Enhanced Bus Improvement Package
80 capital .. 1.8 3.8 0.1 0.1 5.9operating .. 2.9 3.8 4.7 5.7 ..
Hoddle Street Engineering Investigation
5 capital .. 1.3 3.7 .. .. 5.0operating .. .. .. .. ..
Improving Train Operations – Rail Service Efficiencies
200 capital 2.5 13.2 31.5 49.0 15.4 111.6operating .. 3.8 3.9 5.3 7.5 ..
Increased Utilisation of Low Emission Vehicles
5 capital .. .. .. .. .. ..operating .. 0.5 1.5 1.1 1.1 ..
Local Roads to Markets 8 capital .. .. .. .. .. ..operating .. 7.5 .. .. .. ..
Maintenance Funding for Roads
240 capital .. .. .. .. .. ..operating .. 22.6 .. .. .. ..
Maryborough Rail Services 50 capital .. 19.1 .. .. .. 19.1operating .. .. 2.8 2.8 2.9 ..
Metropolitan Bus Improvements Program
500 capital .. 0.9 0.9 .. .. 1.8operating .. 9.0 14.6 15.2 15.9 ..
Metropolitan Station and Modal Interchange Upgrade Program
50 capital .. 2.0 2.1 2.2 2.4 8.7operating .. 0.3 0.5 0.8 1.1 ..
New Stations in Growth Areas 220 capital 1.5 16.4 36.2 65.6 31.1 150.8operating .. .. .. 0.2 1.6 ..
New Trams 1 000 capital .. 5.0 .. .. .. 5.0operating .. .. .. .. .. ..
New X’trapolis Trains (d) 650 capital 163.2 104.8 176.0 88.5 67.0 609.5operating .. 0.4 8.7 15.8 16.2 ..
Noise Walls 100 capital .. 3.8 8.2 0.8 0.5 13.3operating .. .. .. 1.1 1.1 ..
Outer Suburban Arterial Roads Program
1 900 capital .. 4.7 16.6 7.5 0.2 29.0operating .. .. .. .. 0.2 ..
Public Bicycle Hire Scheme 5 capital .. .. .. .. .. ..operating .. 0.7 1.4 1.4 1.5 ..
504 Appendix E Service Delivery 2009-10

Table E.1: Victorian Transport Plan output and asset initiatives($ million)
VTP Allocation (a)
2008-09
2009-10
2010-11
2011-12
2012-13
TEI
Rail Trails and Cycling Paths 10 capital .. .. .. .. .. ..operating 4.0 6.0 .. .. .. ..
Regional Rail Freight Network Program
180 capital .. 6.5 .. .. .. 6.5operating .. 11.7 12.0 12.3 12.6 ..
Regional Station and Modal Interchange Upgrade Program
30 capital .. 2.0 2.1 2.2 2.4 8.7operating .. .. .. .. 0.1 ..
SmartBus – Yellow Orbital Stage 2
290 capital .. 17.0 20.9 .. .. 37.9operating .. .. 10.2 18.5 19.3 ..
South Morang Rail Extension (e)
650 capital .. 20.0 80.6 200.2 139.9 559.1operating .. .. .. .. 3.2 ..
Sunbury Electrification 270 capital 0.5 30.7 97.7 65.6 .. 194.5operating .. .. .. 3.2 7.0 ..
Transit Safety Initiaitve 30 capital .. .. .. .. .. ..operating .. 4.6 4.7 4.8 5.0 ..
Upgrading Regional Airports 20 capital .. .. .. .. .. ..operating 9.0 11.0 .. .. .. ..
Urban Road Management Systems
60 capital .. 1.0 .. .. .. 1.0operating .. .. .. .. .. ..
Nation Building Projects
Nation Building Program (AusLink II – Road and Rail) (f) (g)
4 000 capital 46.6 372.4 442.6 487.3 369.9 1 890.6operating .. .. 0.2 0.3 0.6 ..
Peninsula Link 750 capital 5.2 72.7 119.9 114.5 42.1 354.3operating .. .. .. .. 2.6 ..
Separating Road and Rail Lines
440 capital 2.0 133.5 5.5 0.5 0.5 142.0operating .. .. 0.2 0.3 0.3
Sub-total initiatives 13 604 capital 221.5 868.7 1 154.7 1 198.9 709.7 4 464.9operating 13.0 83.5 84.9 116.2 135.4 ..
Notes:(a) Remaining State contributions for capital projects will be sourced from Unallocated Capital.(b) This item combines the Central Activities Districts and Employment Corridors and Targeted Urban
Renewal: Broadmeadows Central Activities District initiatives listed in 2009-10 Budget Paper No. 3, Appendix A.
(c) The TEI for this initiative includes funding of $11.0 million beyond 2012-13.(d) The TEI includes funding of $10.0 million in 2013-14.(e) The TEI includes $118.4 million in 2013-2014.(f) This item combines the Nation Building Program (AusLink II) – Altona/Laverton Intermodal
Terminal and Nation Building Program (AusLink II) – Roads initiatives listed in 2009-10 Budget Paper No. 3, Appendix A.
(g) The TEI includes funding of $171.8 million beyond 2012-13.
Service Delivery 2009-10 Appendix E 505
506 Appendix E Service Delivery 2009-10
ABBREVIATIONS AND ACRONYMS
AAA Access for All AbilitiesAAS Australian Accounting Standards AASB Australian Accounting Standards BoardAAV Aboriginal Affairs VictoriaABS Australian Bureau of StatisticsABS Australian Bureau of StatisticsACAS Aged care assessment serviceACE Adult and Community EducationACFEB Adult and Community Further Education BoardACIR Australian Childhood Immunisation RegisterACT Australian Capital TerritoryAEC Australian Electoral CommissionAEI Adult Education InstitutionAEMO Australian Energy Market OperatorAIFRS Australian equivalents to International Financial Reporting Standards AIM Achievement Improvement MonitorANZ ANZ BankART Assisted reproductive treatment ASD Autism spectrum disorderATNAB Addition to Net Asset Base AVM Tram Automatic Vehicle Monitoring
BER Building the Education RevolutionBHC Better Health ChannelBIS Business Impact Statement BITRE Bureau of Infrastructure, Transport and Regional EconomicsBRC Biosciences Research Centre
CAC Capital assets chargeCAD Central Activities DistrictCALD Culturally and Linguistically Diverse CAYPINS Children and Young Persons Infringement Notice SystemCCS Community Correctional ServicesCERT Community Emergency Response TeamsCFA Country Fire AuthorityCGC Commonwealth Grants Commission Service Delivery 2009-10 Abbreviations and Aconyms 507

CIRA Competition and Infrastructure Reform Agreement COAG Council of Australian GovernmentsCPI Consumer Price IndexCPRS Carbon Pollution Reduction SchemeCRC Council of Australian Governments Reform CouncilCSF Community Support Fund CSS Community Correctional Service
DAC Development Assessment CommitteeDART Doncaster Area Rapid TransitDDA Disability Discrimination ActDEECD Department of Education and Early Childhood DevelopmentDEEM Drug Education Evaluation and MonitoringDHS Department of Human Services DIIRD Department of Innovation, Industry and Regional Development DPC Department of Premier and CabinetDPCD Department of Planning and Community Development DPI Department of Primary Industries DSE Department of Sustainability and Environment DTF Department of Treasury and FinanceDTPa Diptheria, tetanus and perttussis
E.coli Escherichia coliECT Electro convulsive therapyEES Environmental Effects StatementEGM Electronic Gaming MachineESOs Ex service organisationETIS Eergy Technology Innovation SchemeETS Emissions trading scheme
FAL Financial Accommodation Levy FM FM interuptertrialFMA Financial Management Act 1994 FRS Financial Reporting StandardFTE Full time equivalent
GAAP Generally Accepted Accounting PrinciplesGAIC Growth Areas Infrastructure Contribution GBE Government Business EnterpriseGCRG Government Communications Review GroupGDP Gross Domestic ProductGFS Government Finance StatisticsGG General governmentGGS General government sector GP General Practitioner508 Abbreviations and Aconyms Service Delivery 2009-10

GSP Gross State ProductGST Goods and Services TaxGVT Growing Victoria Together
HACC Home and Community CareHIH HIH Insurance Group
ICT Information and communication technologyIEHR National Individual Electronic Health RecordIMF International Monetary FundIPSASB International Public Sector Accounting Standards Board ISC Index of Stream ConditionsISO International Standards OrganisationIT Information technologyITEs Income Tax Equivalents
LCA Loan Council Allocation
MCG Melbourne Cricket GroundMFMC My Future My ChoiceMMR Measles, mumps and rubellaMOTC Meeting Our Transport Challenges MP Member of ParliamentMTC Melbourne Theatre Company
NAPLAN National Assessment Program Literacy and NumeracyNDRA Natural Disaster Relief ArrangementsNECA National Electricity Code AdministratorNEHTA National E Health Transition AuthorityNFPC Non-financial public sectorNFPS Non financial Public Sector NILS No Interest Loan SchemeNP National PartnershipsNSSCF National Secondary School Computer Fund NSW New South WalesNTER National Tax Equivalent Regime NVIRP Northern VVictoria Infrastructure Renewal Project
OPI Office of Police IntegrityOPP Office of Public Prosecutions
Service Delivery 2009-10 Abbreviations and Aconyms 509
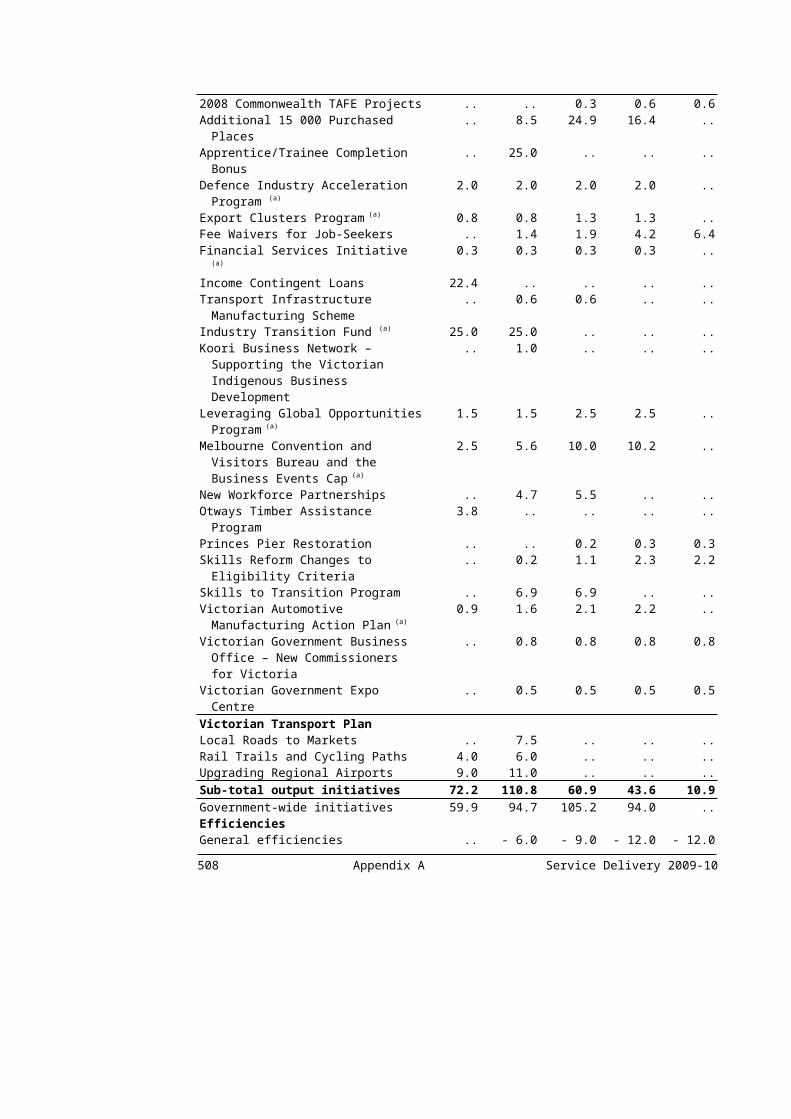
PDRSS Psychiatric Disability Rehabilitation and Support ServicesPFC Public Financial CorporationPFIO Performance from Insurance OperationsPLANET PLAnning NETworkPNFC Public Non Financial CorporationPPP Public Private Partnerships PPPs Public -private partnershipsPSP Precinct Structure PlanPV Partnerships Victoria
QLD Queensland
R&D Research and DevelopmentRAS Royal Agricultural Society RBA Reserve Bank of AustraliaRCHC Rosebud Community Health CentreRDV Regional Development VictoriaRIDF Regional Infrastructure Development FundRIS Regulatory Impact StatementRLUP Regional land Use PlansRRB Reducing the Regulatory Burden
S&P Standard & Poor'sSAAP Supported accommodation assistance program SCADA Train Supervisory Control and Data AcquisitionSCH Student Contact HoursSECV State Electricity Commission of VictoriaSEITA Southern and Eastern Integrated Transport AuthoritySEV Standard equivalent value unitsSME Small/medium enterpriseSPARC Supporting and Promoting Accountability and Responsibility for
CouncillorsSPPs Specific purpose paymentsSRO State Revenue OfficeSWEP School water Efficiency Program
TABCORP TABCORP Holdings Limited TAC Transport Accident CommissionTAFE Technical and Further EducationTCV Treasury Corporation of VictoriaTEI Total Estimated Investment
510 Abbreviations and Aconyms Service Delivery 2009-10

U3A University of the Third AgeUDP Urban Development ProgramUPF Uniform Presentation FrameworkUS United States of America
VACS Victorian Ambulatory Classification and Funding SystemVAGO Victorian Auditor General’s Office VATS Victorian Activity and Travel SurveyVCAL Victorian Certificate of Applied LearningVCE Victorian Certificate of EducationVCEC Victorian Competition and Efficiency CommissionVCGR Victorian Commission for Gambling RegulationVEC Victorian Electoral CommissionVENCorp Victorian Energy Networks Corporation VEOHRC Victorian Equal Opportunity and Human Rights CommissionVERS Victorian Electronic Records StrategyVET Victorian Education and TrainingVET Vocational Education and TrainingVFL Victorian Football LeagueVFMC Victorian Funds Management CorporationVGC Victorian Grants CommissionVGSO Victorian Government Solicitor's OfficeVIC VictoriaVICERS Vigilance Control and Event Recording SystemVICNISS Victorian Hospital Acquired Infection Surveillance SystemVIFM Victorian Institute of Forensic MedicineVIMP Victorian Initiatives for Minerals and PetroleumVIS Victorian Institute of SportVISTA Victorian Integrated Survey of Travel and ActivityVLRC Victorian Law reform CommissionVMC Victorian Multicultural Commission VMIA Victorian Managed Insurance Authority VPHS Victorian Population Health SurveyVSA Victorian Science agendaVTP Victorian Transport Plan VWA Victorian Workcover Authority
WEIS Weighted Inlier Equivalent Separations
YPARCS Youth Prevention and Recovery Care Services
Service Delivery 2009-10 Abbreviations and Aconyms 511
512 Abbreviations and Aconyms Service Delivery 2009-10
STYLE CONVENTIONS
Figures in the tables and in the text have been rounded. Discrepancies in tables between totals and sums of components reflect rounding. percentage changes in all tables are based on the underlying unrounded amounts.
The notation used in the tables and charts is as follows:
LHS left-hand-side
RHS right-hand-side
s.a. seasonally adjusted
n.a. or na not available or not applicable
Cat. No. catalogue number
1 billion 1 000 million
1 basis point 0.01 per cent
nm new measure
.. zero, or rounded to zero
tbd to be determined
ongoing continuing output, program, project etc.
(xxx.x) negative numbers
Service Delivery 2009-10 Style Conventions 513

514 Style Conventions Service Delivery 2009-10

INDEX
AA Fairer Victoria, 37, 85, 163Aboriginal. See IndigenousAged care, 25, 39Alcohol, 141Arts, 36, 475, See also Department of Premier and
Cabinet
BBiosecurity, 31Building the Education Revolution
Asset initiatives, 309–10Output initiatives, 309–10
Bushfire response, 9–13, 84, 141, 183, 186, 209, 471, 473Asset initiatives, 304–5Output initiatives, 283–301
Bushfires, 35Business and industry, 11, 16, 17, 40, See also
Department of Innovation, Industry and Regional Development
CCaring Communities, 58–61, 417–37Channel Deepening, 9Climate change, 210, See also EnvironmentCommonwealth Government
Nation Building – Economic Stimulus Plan, 5, 6, 9, 13, 15, 18, 37, 38
National partnerships, 13, 21, 22, 27, 28, 39Commonwealth-State relations, 13–14, 473Communities, 12, See also Department of Planning
and Community DevelopmentCommunity and social housing, 37–38Community organisations, 12, 13–14Community Support Fund, 475Corrections, 34Country Fire Authority, 10, 35
Crime and violence prevention, 33
DDepartment of Education and Early Childhood
DevelopmentAdolescent Health Services (schools), 82Asset initiatives, 310–14Compulsory Years, 74–77Discontinued performance measures, 442–44Early Childhood Services, 71–73Later Years and Youth Transitions, 78–79Local government financial relations, 476Output initiatives, 306–10Policy and Regulation, 83Services to Students, 80–81
Department of Human ServicesAcute Health Services, 89–92Aged and Home Care, 97–99Ambulance Services, 93–94Asset initiatives, 320–25Child Protection and Family Services, 112–14Concessions to Pensioners and Beneficiaries,
117–18Disability Services, 109–11Discontinued performance measures, 445–46Drug Services, 107–8Housing Assistance, 119–22Local government financial relations, 476Mental Health, 95–96Output initiatives, 314–20Primary and Dental Health, 100–101Public Health, 104–6Youth Services and Youth Justice, 115–16
Service Delivery 2009-10 Index 515

Department of Innovation, Industry and Regional DevelopmentAsset initiatives, 331–32Discontinued performance measures, 447–50Industries and Innovation, 126–29Investment and Trade, 130–31Local government financial relations, 476Major Projects, 140Marketing Victoria, 138–39Output initiatives, 326–31Regional Development, 132–33Skills and Workforce, 134–37Victorian Transport Plan, 330–31
Department of JusticeAsset initiatives, 337Community Operations, 154–55Discontinued performance measures, 451–52Dispensing Justice, 152–53Enforcing Correctional Orders, 157–58Legal support to government and protecting the
rights of Victorians, 147–51Local government financial relations, 477Output initiatives, 332–37Protecting Consumers, 159–60Providing a Safe and Secure Society, 144–46Regulating Gaming and Racing, 161–62Supporting the State’s Fire and Emergency
Services, 156Victorian Transport Plan, 337
Department of Planning and Community DevelopmentAccess to Housing, Infrastructure, Jobs and
Services, 178–81Asset initiatives, 344–45Discontinued performance measures, 453–61Local government financial relations, 477Opportunities for Participation, 170–77Output initiatives, 338–43Planning for liveable communities, 166–69Victorian Transport Plan, 343, 345
Department of Premier and CabinetArts and Cultural Development, 194–97Asset initiatives, 348–49Discontinued performance measures, 462Multicultural Affairs, 192–93Output initiatives, 346–48Public Sector Management, Governance and
Support, 188–91Strategic Policy Advice and Support, 185–87
Department of Primary IndustriesDiscontinued performance measures, 463–64Output initiatives, 349–51Sustainable Development of Primary and Energy
Industries, 201–8Victorian Transport Plan, 351
Department of Sustainability and EnvironmentAsset initiatives, 353–54Discontinued performance measures, 465Healthy and Productive Land; Healthy,
Productive and Accessible Marine, Coastal and Estuarine Systems; and Flourishing Biodiversity in Healthy Ecosystems, 215–20
Healthy and Productive Water Systems, 212–14Land Administration and Property Information,
223–24Less Waste, Less Pollution; and Clean Air,
Liveable Climate, 221–22Local government financial relations, 478Output initiatives, 352–53
Department of TransportAsset initiatives, 360–65Discontinued performance measures, 466–68Integrated Transport Planning, Delivery and
Management, 240–48Local government financial relations, 478Output initiatives, 354–60Public Safety and Security, 228–34Public Transport Services, 235–39Victorian Transport Plan, 355–59, 362–64
Department of Treasury and FinanceAsset initiatives, 367Discontinued performance measures, 469Financial Management Services, 255–57Output initiatives, 366–67Regulatory Services, 262–63Resource Management Services, 260–61Revenue Management Services, 264Risk Management Services, 258–59Strategic Policy Advice, 251–54
Disability services, 38–39
EEarly childhood services, 25, 27Education, 15, 25–29, See also Department of
Education and Early Childhood DevelopmentBlueprint for Education and Early Childhood
Development, 68Continuing to rebuild schools, 9Victorian Schools Plan, 5, 25, 26
Efficiencies, 42, 368Election commitments. See Labor’s Financial
StatementEmergency services, 10, 12, 35, 34–35Employment. See JobsEnvironment, 20, 29–30, See also Departtment of
Sustainability and Environment, Department of Primary IndustriesNatural Resources, 30Water, 29
516 Index Service Delivery 2009-10

FFarming, 11
Agriculture, 31Financial management, 43–44, 472Freight, 18
GGovernment-wide initiatives
Asset initiatives, 304–6Output initiatives, 283–304
Growing Victoria Together, 6–8, 45, 371
HHealth, 21–25, See also Department of Human
ServicesAged care, 21Chronic disease, 22Health care facilities, 9, 21, 23Hospitals, 22, 23Mental health, 22, 24, 32, 38
Healthy Environment, 55–57, 405–17Homelessness, 38Hospitals, 9, 24Housing, 37
Homelessness, 38Social, 9
IIndigenous, 39–40, 142Infrastructure, 479Infrastructure investment, 8, 9, 13, 14, 26Innovation, 17, 16–17, 123
JJobs, 14, 15–16Justice, 31–33, 141, See also Department of Justice
KKoorie. See Indigenous
LLabor’s Financial Statement 2006, 8, 29Local government, 12, 476
Arts, 475Bushfire response, 471, 473Commonwealth-State relations, 473Communities, 477Community Support Fund, 475Environment, 478Financial management, 472Improving lives of Indigenous Victorians, 476Infrastructure investment, 476Land and Biodiversity, 478Planning, 472, 477Preventative health, 476Public health, 476Public transport, 476, 478Safety and Crime Prevention, 477Schools, 476Senior Victorians, 476Sport and Recreation, 477Taxes, 472Victorian Transport Plan, 474Water, 474
Local government financial relations2009-10 Budget initiatives, 475–78Local Government in Victoria, 472–75
MMeeting Our Transport Challenges, 479Melbourne 2030, 163, 225, See also PlanningMental health. See HealthMulticultural affairs. See Department of Premier and
CabinetMulticultural Affairs, 3
NNational partnerships. See Commonwealth
Government
OOut of Home Care Reform, 40
Asset initiatives, 324Output initiatives, 315–16
Service Delivery 2009-10 Index 517
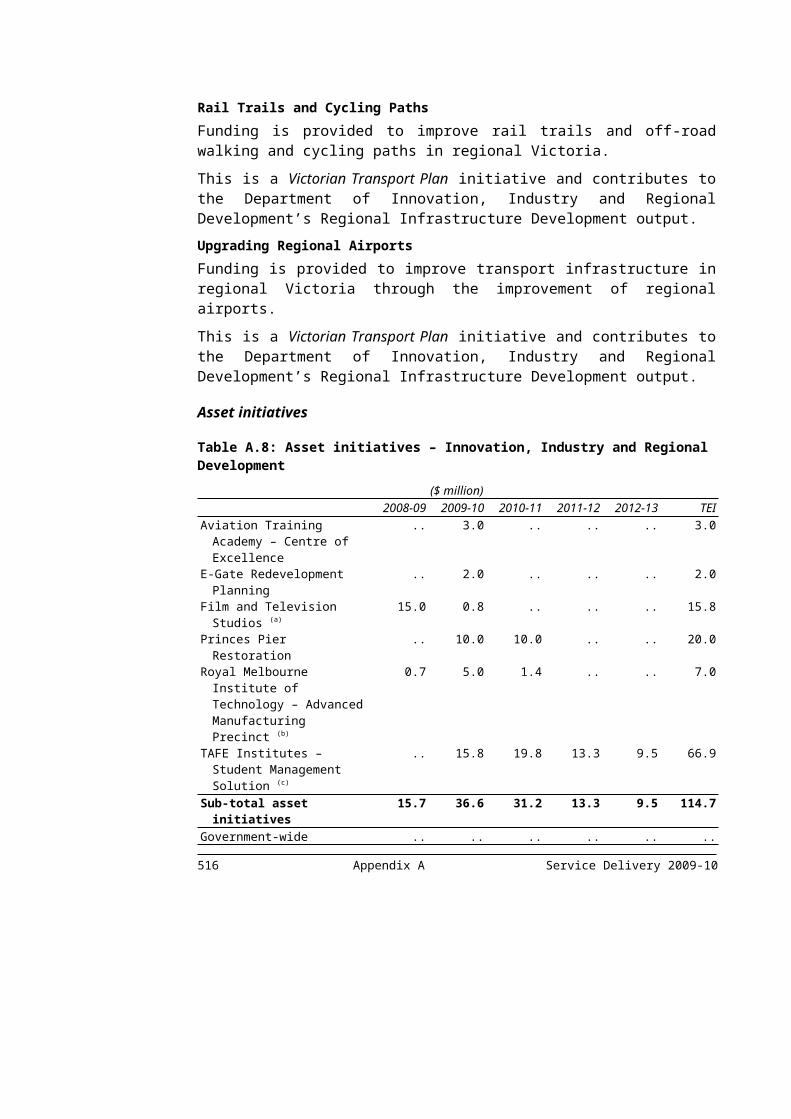
PParks, 29, See also EnvironmentParliament
Legislative Assembly, 269Legislative Council, 268Output initiatives, 368Parliamentary Investigatory Committees, 272Parliamentary Services, 270–71Victorian Auditor-General's Office, 273–74
Planning, 16, 13–14, 472, See also Department of Planning and Community Development
Police, 33, See also JusticePrisons. See CorrectionsPublic health. See HealthPublic transport, 33, See also Transport
QQuality Health and Education, 51–54, 388–99
RRail services, 17, 19–20, 20Refugees. See CommunitiesRegulatory reform, 14Roads, 12, 18, 19, 33–34
SSchools. See also EducationSecurity. See JusticeSenior Victorians. See Aged careSkills, 14–15, 16, See also Education and JobsSocial housing and homelessness
Asset initiatives, 322Output initiatives, 318–20
Sport and recreation, 36–37
TTaxes, 11, 472, See also Financial managementThriving Economy, 47–50, 372–88Tourism, 11, 123, See also Business and industryTraining, 25, See SkillsTrains. See Rail ServicesTrams, 20Transport, 12, 17–21, 479, See also Department of
TransportVictorian Transport Plan, 125
VVibrant Democracy, 64, 437–40Victoria Police. See PoliceVictorian Industry Manufacturing Statement, 123Victorian Schools Plan, 5, 25, 26, See also
EducationAsset initiatives, 311–12
Victorian Transport Plan, 6, 9, 17, 225, 240, 474, 479
Vocational education and training, 14, 15
WWater, 9, 210, 474, See also Environment and see
also Department of Sustainability and Environment
Water management, 29
518 Index Service Delivery 2009-10