service level benchmarking of urban transport for a medium & small sized city
DESCRIPTION
This Research was done during 2010-2011 on the city of Patiala. This paper was probably the First Publication on Service Level Benchmarking of a city as a whole. Also MoUD's SLB's were modified and made adoptable to all the medium & small sized cities in India.TRANSCRIPT
INTERNATIONAL CONFERENCE on
Indian Institute of Technology Bombay, India 12-14 December, 2012
Transportation Systems Engineering Group
Department of Civil Engineering
IIT Bombay, Powai, Mumbai - 400 076, INDIA.
Tel. : +91 22 2576 4348/7308/7329
Fax : +91 22 25767302
Email : [email protected]
Website : http://www.civil.iitb.ac.in/tpmdc
TRANSPORTATION PLANNING & IMPLEMENTATION METHODOLOGIES FOR DEVELOPING COUNTRIES:
TPMDC 2012
1st November 2012.
Acceptance Letter
Dear Mr.Pradeep Chaitanya Jasti,
We are glad to inform you that your paper with following details has been accepted for the
presentation at the International Conference on Transportation Planning and Implementation
Methodologies for Developing Countries (TPMDC) being organized by the Transportation
Systems Engineering Group at Indian Institute of Technology Bombay, Mumbai during 12-14
December 2012.
Paper ID: 72
Paper Title: Service Level Benchmarking of Urban Transportation System for a Medium Sized
City
We are inviting you to attend the conference and present your paper. For more details, including
registration, accommodation, and program, please visits http://www.civil.iitb.ac.in/tpmdc/.
We hope that you will join us at IIT Bombay in December to participate in this international event
and help us to make this three-day deliberation meaningful and enjoyable.
Thanking you,
Prof. S L Dhingra Prof. K V Krishna Rao Prof. Tom V. Mathew (Patron, TPMDC-2012) (Chairman, TPMDC-2012) (Vice-Chairman, TPMDC-2012)

SERVICE LEVEL BENCHMARKING OF URBAN TRANSPORTATION SYSTEM FOR
LARGE AND MEDIUM SIZED CITIES
Pradeep Chaitanya Jasti
Deputy Transport Planner
Transport & Communications Division
Mumbai Metropolitan Region Development Authority (MMRDA).
Phone Number: +91-9908743745
Email ID: [email protected]
Number of Figures: 02
Number of Tables: 08
Number of Words: 7,498
Pradeep Chaitanya Jasti 1
Abstract
India Being a Developing Country the Travel Demand keeps on Increasing Day by Day, So in
order to meet the demand of the existing scenario of road traffic particularly in urban areas, one
need to evaluate the performance of the existing transportation system of a city. Every sector has
some few key Performance indicators, similarly in Urban Transport Sector too. This
phenomenon of identifying these key performance indicators and evaluating the performance of
Urban Transportation for any City is known as Service Level Benchmarking, which can also be
defined as “The process of determining how effectively and efficiently the present
Transportation system is performing in the existing situation”. The concept of Benchmarking is
relatively new which enables the performance measurement and also helps in understanding the
lacunae in the existing system.
In the present study the benchmarking has been done for the city of Patiala based on the
Service Level Benchmarks given by Ministry of Urban Development in the year 2010 in which a
total number of Ten Key performance indicators have been taken such as Public Transport
Facilities, Pedestrian Facilities , Travel speeds along the major corridors, Usage of Intelligent
Transportation System etc… and finally a “Performance Report Card” for Patiala City has been
derived which shows that the current city is lacking in Public Transport facilities, usage of
Intelligent Transportation System, Non Motorized Transport, Road safety etc… and performing
in a better way in the areas of Speeds along the Corridors. The short, medium & long term
measures have been suggested to improve its performance in urban transport sector keeping in
view the future development of Patiala city for next twenty years.
Pradeep Chaitanya Jasti 2
INTRODUCTION AND NEED FOR SERVICE LEVEL BENCHMARKING
Road traffic in India has been growing at a tremendous pace due to the combined effect of
population growth, increase in vehicle ownership and individual mobility which results in
congestion, delays, accidents etc. In order to control these problems one need to understand the
Urban Transportation System of the city clearly by evaluating it’s performance by creating some
Key Performance Indicators (KPI’s) followed by Fixing the targets to achieve for each and every
KPI for next two or three Decades. In this way an Urban Local Body (ULB) will have a Clear
Idea of the Infrastructure Demand by Time for their City. The Whole Sequence is named as
Service Level Benchmarking (SLB)
In order to make available data on a standardized framework for performance monitoring
of basic urban services, MoUD (Ministry of Urban Development) has brought out a Handbook
of Service Level Benchmarks. But, some drawbacks has been identified in these service level
benchmarking (SLB) process for which an attempt has been made to fix and make these SLB’s
more effective in rating the performance of urban transportation and make it suitable for all
medium and large sized cities in India. Benchmarking is now well recognized as an important
mechanism for introducing accountability in service delivery. It can help Urban Local Bodies
(ULBs) in identifying performance gaps, ultimately resulting in better services to people.
The SLB can be defined as “The process of determining how effectively and efficiently
the present Transportation system is performing in the existing situation” or simply “The
quantification of qualitative aspects in urban transportation” Benchmarking basically helps us to
understand how our transportation system is performing as a whole and in which sectors it was
lagging along with its severity, so that we can have a clear plan for the future development.
India’s urban population is expected to increase from 286 million in 2001 to 534 million in 2026
(38%).The present transportation infrastructure is inadequate to cater to the increasing traffic,
hence forming a gap between demand and supply. So, benchmarking of urban transport has to be
made as an Integral part of CTTS (Comprehensive Traffic and Transportation Studies) or CMP
(Comprehensive Mobility Plan) and to be considered while suggesting the future action plan or
long term measures. One such attempt has been made on the city of Patiala making the
modification to the existing SLB’s issued by MoUD. It’s a structured approach to identify
actions that lead to superior performance.
LITERATURE REVIEW
The process of benchmarking is in the initiation stage in India. So, the Benchmarking process
suggested by MoUD has been reviewed thoroughly and identified the drawbacks of it. With the
help of the HCM (Highway Capacity Manual 2000) and grouping few other qualitative
performance judging techniques, a new SLB’s have been developed, strengthening the
Benchmarking process and making it more flexible.
OBJECTIVE AND METHODOLOGY
The ultimate objective of this work is to make the SLB process more flexible in such a way that
it is also applicable to all medium sized cities which has to be concentrated most in order to
avoid the future problems. Despite of the huge projects like CMP’s and CTTS’s benchmarking
can give a clear picture of the cities performance in various sectors of urban transportation. So
it’s a better option for all ULB’s to get an understanding on their cities transportation
performance in a short time and less cost. Keeping this as key objective an attempt was made to
develop these benchmarks such that, they can be applied directly to all large & medium sized
cities in India.

Pradeep Chaitanya Jasti 3
Methodology serving all the objectives of the study has been shown in Figure No.1
FIGURE 1: Flow chart showing the methodology of the current study.
Detailing of Methodology
The Detailing of the present study has been presented below segment wise.
Review of Conventional SLB’s suggested by MoUD
MoUD had released the SLB’s in December 2009 for the first time in India and later modified the
same in December 2010. The concept of benchmarking is completely concentration upon the
Developed cities rather that Developing cities and the present process was not at all suitable to
evaluate the performance of medium or small sized city. So it’s clear that the SLB’s are not tailor
made for all the cities and needs to be altered for each and every city individually. So here is an
attempt made to minimize the effort by making more flexible and easily adaptable SLB’s by
altering the KPI’s.
Identifying Limitations & Drawbacks of Conventional SLB’s
Service Level Benchmarking is biased towards metro cities and may not be a right approach for
medium-sized cities for the performance monitoring. Drawbacks of the conventional
benchmarking process have been listed as below in the Table No. 1

Pradeep Chaitanya Jasti 4
TABLE 1 Drawbacks of Conventional Service Level Benchmarking
No. Segment Drawback
1 Public Transportation System Almost absent in most of the Indian
cities.
2 Pedestrian Facilities Foot over bridges (FOB’s) were not
at all considered,
Pedestrian delay judged based on
the signal phase which exists very
rarely.
3 Non Motorized Vehicles (NMV) Almost absent in most of the Indian
cities.
4 Usage of ITS Almost absent in most of the Indian
cities.
5 Intermediate Public Transport
(IPT)
Not at all considered, being
predominant mode of travel in all
the Indian cities.
6 Parking Spaces Strictly encourages on street paid
Parking.
7 Financial Sustainability of Public
Transport by Bus
Most of the cities don’t have a
public transportation facility; hence
it has to be made flexible for
consideration.
8 Delay at Intersections Not at all considered.
9 Pavement Condition Not at all considered.
Study Area Identification
The study area has been identified by Punjab Municipal Infrastructure Development Company
(PMIDC) for the preparation of Comprehensive Mobility Plan. Patiala with its population of 6,
58,667 is the fourth largest city of Punjab, and also it is one of the counter magnets considered
outside National Capital Region (NCR). The total area of Patiala Municipal Corporation is
50.11sq.km. With a population of 4,07,951 as per the latest census. city as this study is about
urban transportation benchmarking.
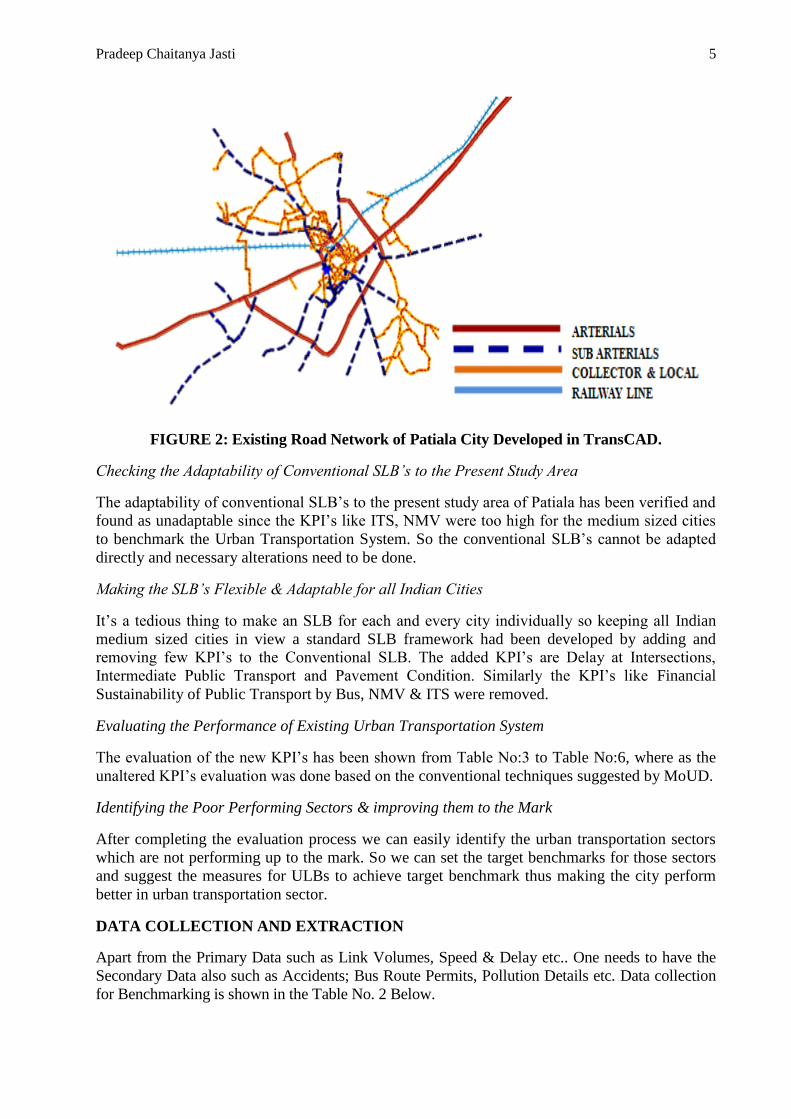
The Existing Road Network for the City of Patiala has been developed in TransCAD with
the help of supporting tools like Open Street Map and Global Mapper etc and it was clearly
understandable that the city’s road network was Radial as shown in the Figure 2 below.
Pradeep Chaitanya Jasti 5
FIGURE 2: Existing Road Network of Patiala City Developed in TransCAD.
Checking the Adaptability of Conventional SLB’s to the Present Study Area
The adaptability of conventional SLB’s to the present study area of Patiala has been verified and
found as unadaptable since the KPI’s like ITS, NMV were too high for the medium sized cities
to benchmark the Urban Transportation System. So the conventional SLB’s cannot be adapted
directly and necessary alterations need to be done.
Making the SLB’s Flexible & Adaptable for all Indian Cities
It’s a tedious thing to make an SLB for each and every city individually so keeping all Indian
medium sized cities in view a standard SLB framework had been developed by adding and
removing few KPI’s to the Conventional SLB. The added KPI’s are Delay at Intersections,
Intermediate Public Transport and Pavement Condition. Similarly the KPI’s like Financial
Sustainability of Public Transport by Bus, NMV & ITS were removed.
Evaluating the Performance of Existing Urban Transportation System
The evaluation of the new KPI’s has been shown from Table No:3 to Table No:6, where as the
unaltered KPI’s evaluation was done based on the conventional techniques suggested by MoUD.
Identifying the Poor Performing Sectors & improving them to the Mark
After completing the evaluation process we can easily identify the urban transportation sectors
which are not performing up to the mark. So we can set the target benchmarks for those sectors
and suggest the measures for ULBs to achieve target benchmark thus making the city perform
better in urban transportation sector.
DATA COLLECTION AND EXTRACTION
Apart from the Primary Data such as Link Volumes, Speed & Delay etc.. One needs to have the
Secondary Data also such as Accidents; Bus Route Permits, Pollution Details etc. Data collection
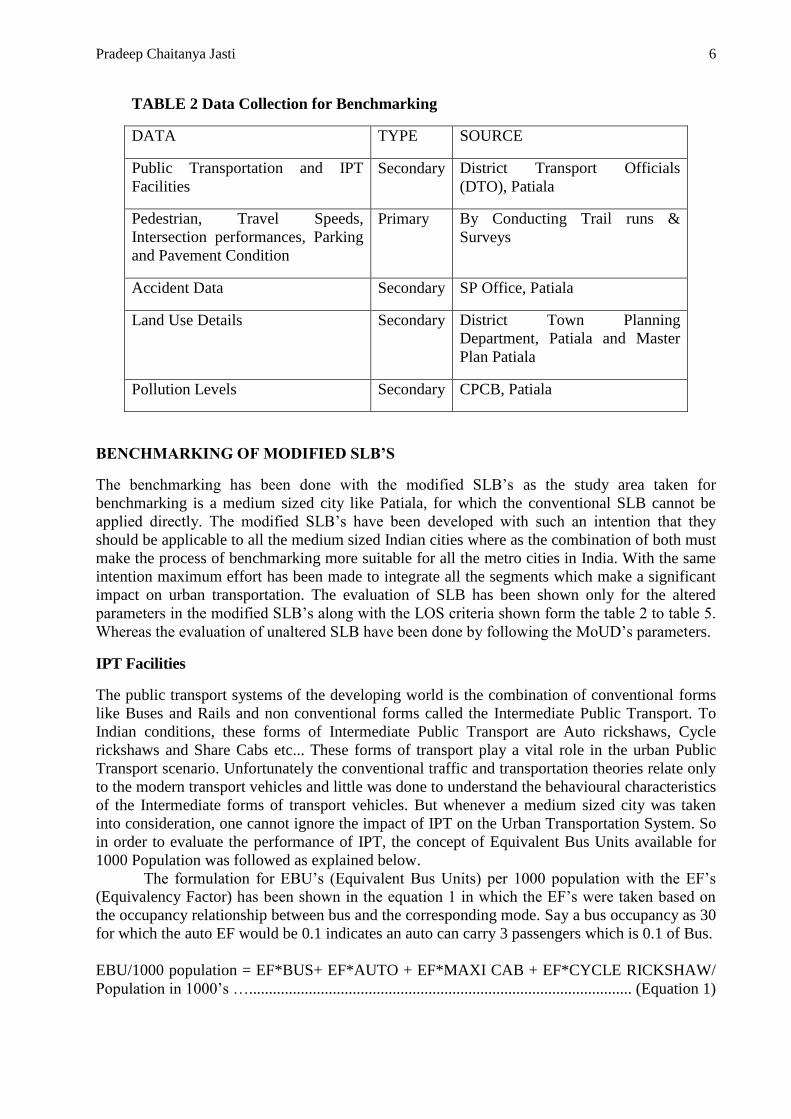
for Benchmarking is shown in the Table No. 2 Below.
Pradeep Chaitanya Jasti 6
TABLE 2 Data Collection for Benchmarking
DATA TYPE SOURCE
Public Transportation and IPT
Facilities
Secondary District Transport Officials
(DTO), Patiala
Pedestrian, Travel Speeds,
Intersection performances, Parking
and Pavement Condition
Primary By Conducting Trail runs &
Surveys
Accident Data Secondary SP Office, Patiala
Land Use Details Secondary District Town Planning
Department, Patiala and Master
Plan Patiala
Pollution Levels Secondary CPCB, Patiala
BENCHMARKING OF MODIFIED SLB’S
The benchmarking has been done with the modified SLB’s as the study area taken for
benchmarking is a medium sized city like Patiala, for which the conventional SLB cannot be
applied directly. The modified SLB’s have been developed with such an intention that they
should be applicable to all the medium sized Indian cities where as the combination of both must
make the process of benchmarking more suitable for all the metro cities in India. With the same
intention maximum effort has been made to integrate all the segments which make a significant
impact on urban transportation. The evaluation of SLB has been shown only for the altered
parameters in the modified SLB’s along with the LOS criteria shown form the table 2 to table 5.
Whereas the evaluation of unaltered SLB have been done by following the MoUD’s parameters.
IPT Facilities
The public transport systems of the developing world is the combination of conventional forms
like Buses and Rails and non conventional forms called the Intermediate Public Transport. To
Indian conditions, these forms of Intermediate Public Transport are Auto rickshaws, Cycle
rickshaws and Share Cabs etc... These forms of transport play a vital role in the urban Public
Transport scenario. Unfortunately the conventional traffic and transportation theories relate only
to the modern transport vehicles and little was done to understand the behavioural characteristics
of the Intermediate forms of transport vehicles. But whenever a medium sized city was taken
into consideration, one cannot ignore the impact of IPT on the Urban Transportation System. So
in order to evaluate the performance of IPT, the concept of Equivalent Bus Units available for
1000 Population was followed as explained below.
The formulation for EBU’s (Equivalent Bus Units) per 1000 population with the EF’s
(Equivalency Factor) has been shown in the equation 1 in which the EF’s were taken based on
the occupancy relationship between bus and the corresponding mode. Say a bus occupancy as 30
for which the auto EF would be 0.1 indicates an auto can carry 3 passengers which is 0.1 of Bus.
EBU/1000 population = EF*BUS+ EF*AUTO + EF*MAXI CAB + EF*CYCLE RICKSHAW/
Population in 1000’s …................................................................................................ (Equation 1)
Pradeep Chaitanya Jasti 7
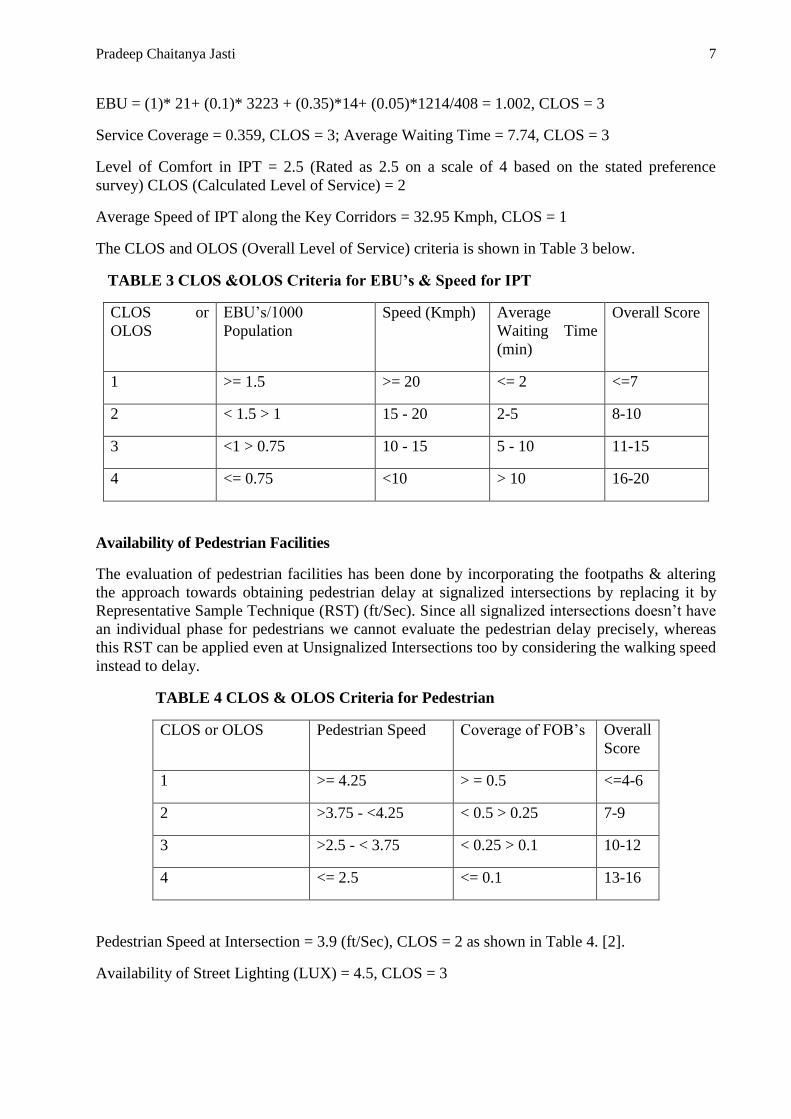
EBU = (1)* 21+ (0.1)* 3223 + (0.35)*14+ (0.05)*1214/408 = 1.002, CLOS = 3
Service Coverage = 0.359, CLOS = 3; Average Waiting Time = 7.74, CLOS = 3
Level of Comfort in IPT = 2.5 (Rated as 2.5 on a scale of 4 based on the stated preference
survey) CLOS (Calculated Level of Service) = 2
Average Speed of IPT along the Key Corridors = 32.95 Kmph, CLOS = 1
The CLOS and OLOS (Overall Level of Service) criteria is shown in Table 3 below.
TABLE 3 CLOS &OLOS Criteria for EBU’s & Speed for IPT
CLOS or
OLOS
EBU’s/1000
Population
Speed (Kmph) Average
Waiting Time
(min)
Overall Score
1 >= 1.5 >= 20 <= 2 <=7
2 < 1.5 > 1 15 - 20 2-5 8-10
3 <1 > 0.75 10 - 15 5 - 10 11-15
4 <= 0.75 <10 > 10 16-20
Availability of Pedestrian Facilities
The evaluation of pedestrian facilities has been done by incorporating the footpaths & altering
the approach towards obtaining pedestrian delay at signalized intersections by replacing it by
Representative Sample Technique (RST) (ft/Sec). Since all signalized intersections doesn’t have
an individual phase for pedestrians we cannot evaluate the pedestrian delay precisely, whereas
this RST can be applied even at Unsignalized Intersections too by considering the walking speed
instead to delay.
TABLE 4 CLOS & OLOS Criteria for Pedestrian
CLOS or OLOS Pedestrian Speed Coverage of FOB’s Overall
Score
1 >= 4.25 > = 0.5 <=4-6
2 >3.75 - <4.25 < 0.5 > 0.25 7-9
3 >2.5 - < 3.75 < 0.25 > 0.1 10-12
4 <= 2.5 <= 0.1 13-16
Pedestrian Speed at Intersection = 3.9 (ft/Sec), CLOS = 2 as shown in Table 4. [2].
Availability of Street Lighting (LUX) = 4.5, CLOS = 3

Pradeep Chaitanya Jasti 8
Percentage of city covered with Foot Paths = 33.11%, CLOS = 3
Extent of Coverage of FOB’s (No’s/Road Network in Km) = 0.0224, CLOS = 4
Performance of Intersections
Delays at intersections have to be taken into consideration, since it would have an impact on the
travel time of all the corridors which are approaching that intersection.
Signalized Intersections to Intersections ratio = 18/27 = 0.6667 CLOS = 3
Avg. Controlled Delay at Unsignalized Intersections = 43 Sec (HCM 2000) CLOS = 3
Avg. Controlled Delay at Signalized Intersections = 28 Sec (HCM 2000) CLOS = 2
CLOS and OLOS criteria for intersection performance have been shown in the Table 5.
TABLE 5 CLOS &OLOS Criteria for Intersection Performance
CLOS or OLOS Ratio Avg Controlled Delay at
Unsignalized Xn
Avg Controlled Delay
at Signalized Xn
Overall
Score
1 <= 2 >= 1.5 >= 20 <=7
2 2-5 < 1.5 > 1 15 - 20 8-10
3 5 - 10 <1 > 0.75 10 - 15 11-15
4 > 10 <= 0.75 <10 16-20
Pavement Condition along the Major Corridors
The pavement condition along the major corridors is a crucial aspect affecting the mobility. It
was evaluated based on the Pavement Quality Index (PQI) as shown below.
The PQI is calculated from the RQI (Road Quality Index) and SR (Surface Rating) as
shown in the equation 2 and the CLOS & OLOS criteria has been shown in the Table 6.
PQI = √RQI *SR……….............................................................................................. (Equation 2)
TABLE 6 CLOS &OLOS Criteria for Pavement Quality Index
CLOS or OLOS RQI SR PQI Rating (Score)
1 0 – 1.5 0 – 1.5 = 1
2 1.6 – 2.5 1.6 – 2.5 >1 – <2
3 2.6 – 4.0 2.6 – 4.0 >2 – <3
4 4.1 – 5.0 4.1 – 5.0 >= 4

Pradeep Chaitanya Jasti 9
COMPARISON OF CONVENTIONAL AND MODIFIED BENCHMARKING METHODOLOGY OF SLB
The comparison between the conventional & modified benchmarking along with the formulation & CLOS (Calculated LOS) has been shown in
the below table 7. The calculation and the LOS criteria have been followed as per the MoUD’s benchmarking procedure except for those who
were added additionally for the modified benchmarking.
TABLE 7 Comparison and results of SLB’s for the city of Patiala
Segment
No.
Conventional SLB’s Modified SLB’s Quantification of KPI’s Formulation Result CLOS
1.) Public Transportation
Facilities
Public Transportation Facilities
Presence of Organized
Public Transport System
-------------------------
Extent of Availability of
Public Transport per 1000
population
Extent of Availability of
Public Transport per 1000
population
A = No of Buses/ train coaches
available in a city on any day
B = Total Population of the city
(A/B) to
Compute LOS
1
0.25 3
Service Coverage (route
Kms / sq. km)
Service Coverage (route
Kms / sq. km)
A = Total length in route kms of
the corridors on which public
transport systems ply in the city
B = Area of the urban limits of the
city (sq. kms )
(A/B) to
Compute LOS
2
0.757 2
Average waiting time for
Public Transport users
Average waiting time for
Public Transport users
Calculate the average waiting time
(In min) of passengers for each
route
Compute LOS
3 by Avg.
waiting time
6.3 3
Level of Comfort in
Public Transport
Level of Comfort in Public
Transport
A= Passenger count on bus at key
identified routes
(A/B) to
Compute LOS
1.75 2

Pradeep Chaitanya Jasti 10
B= Seats available in the bus 4
% of Fleet as per Urban
Bus Specifications
% of Fleet as per Urban Bus
Specifications
A= Total number of buses in the
city
B= Total number of buses as per
urban bus specifications in the city
(A/B)*100 to
Compute LOS
5
16.66 4
CLOS1 + CLOS2 + CLOS3 + CLOS4 + CLOS5 = 14 OLOS =3
2.) Availability of Pedestrian
Facilities
Availability of Pedestrian Facilities
Signalized intersections
Delay (%)
Signalized intersections
Delay by Representative
Sample Technique
(ft/Sec)
5 No. of trails has to be taken by
representative sampling technique
in which the time taken to cross a
major and a minor leg is measured
Compute LOS
1 based on
Avg. time
taken to cross
an intersection
3.9
ft/Sec
2
Availability of Street
Lighting
Availability of Street
Lighting
Calculate lux level
(10 samples /km)
Compute LOS
2 based on lux
4.5 3
Percentage of city covered Percentage of city covered
with Pedestrian Facilities
A= Total length of road network
B = Total length of footpath in the
city
(B/A)*100 to
Compute LOS
3
33.2 3
Extent of Coverage of
Foot Over Bridges
(No’s/Km)
A = Total no. of Foot over Bridges
B = Total length of road network
(A/B)* to
Compute LOS
4
0.022 4
CLOS1 + CLOS2 + CLOS3 + CLOS4 = 12 OLOS =3
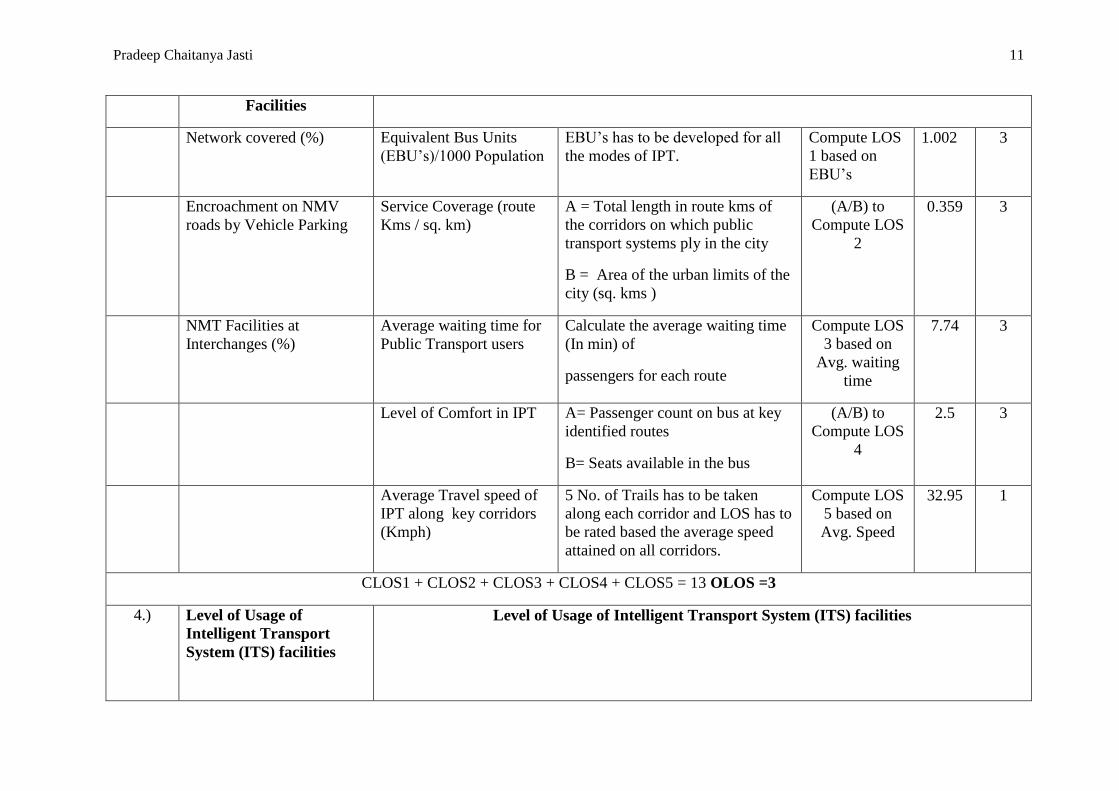
3.) Availability of NMV IPT Facilities
Pradeep Chaitanya Jasti 11
Facilities
Network covered (%) Equivalent Bus Units
(EBU’s)/1000 Population
EBU’s has to be developed for all
the modes of IPT.
Compute LOS
1 based on
EBU’s
1.002 3
Encroachment on NMV
roads by Vehicle Parking
Service Coverage (route
Kms / sq. km)
A = Total length in route kms of
the corridors on which public
transport systems ply in the city
B = Area of the urban limits of the
city (sq. kms )
(A/B) to
Compute LOS
2
0.359 3
NMT Facilities at
Interchanges (%)
Average waiting time for
Public Transport users
Calculate the average waiting time
(In min) of
passengers for each route
Compute LOS
3 based on
Avg. waiting
time
7.74 3
Level of Comfort in IPT A= Passenger count on bus at key
identified routes
B= Seats available in the bus
(A/B) to
Compute LOS
4
2.5 3
Average Travel speed of
IPT along key corridors
(Kmph)
5 No. of Trails has to be taken
along each corridor and LOS has to
be rated based the average speed
attained on all corridors.
Compute LOS
5 based on
Avg. Speed
32.95 1
CLOS1 + CLOS2 + CLOS3 + CLOS4 + CLOS5 = 13 OLOS =3
4.) Level of Usage of
Intelligent Transport
System (ITS) facilities
Level of Usage of Intelligent Transport System (ITS) facilities
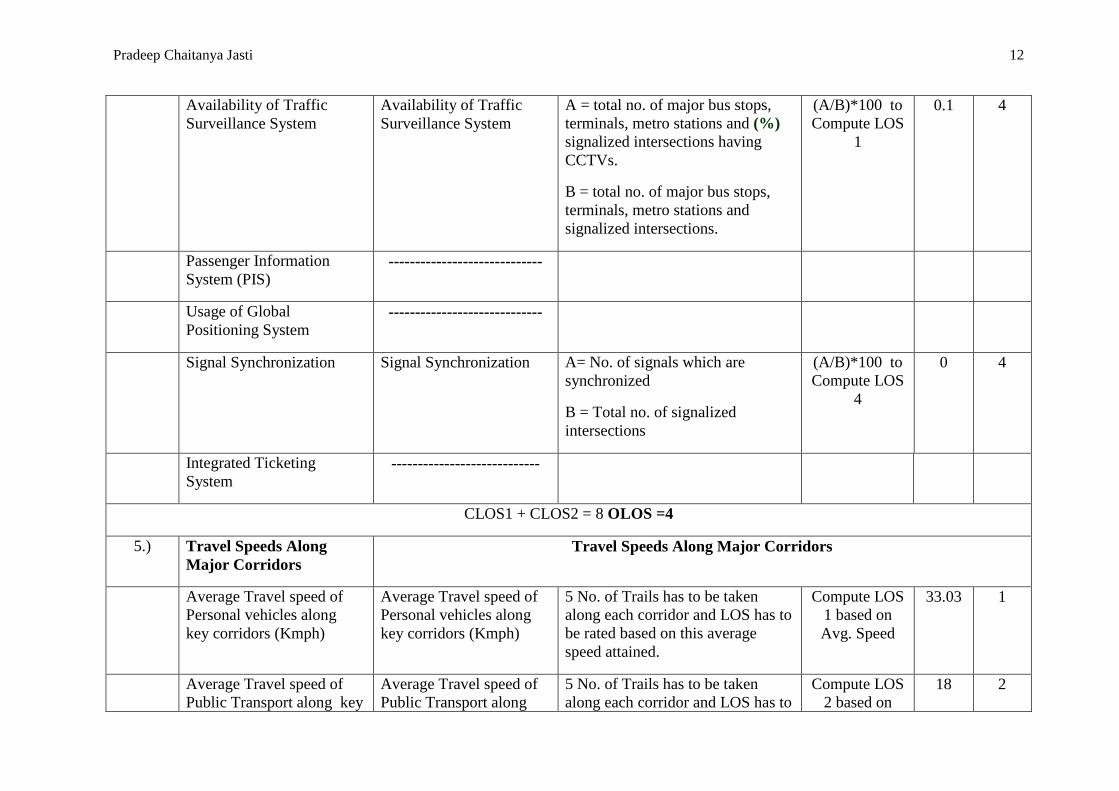
Pradeep Chaitanya Jasti 12
Availability of Traffic
Surveillance System
Availability of Traffic
Surveillance System
A = total no. of major bus stops,
terminals, metro stations and (%)
signalized intersections having
CCTVs.
B = total no. of major bus stops,
terminals, metro stations and
signalized intersections.
(A/B)*100 to
Compute LOS
1
0.1 4
Passenger Information
System (PIS) -----------------------------
Usage of Global
Positioning System -----------------------------
Signal Synchronization Signal Synchronization A= No. of signals which are
synchronized
B = Total no. of signalized
intersections
(A/B)*100 to
Compute LOS
4
0 4
Integrated Ticketing
System ----------------------------
CLOS1 + CLOS2 = 8 OLOS =4
5.) Travel Speeds Along
Major Corridors
Travel Speeds Along Major Corridors
Average Travel speed of
Personal vehicles along
key corridors (Kmph)
Average Travel speed of
Personal vehicles along
key corridors (Kmph)
5 No. of Trails has to be taken
along each corridor and LOS has to
be rated based on this average
speed attained.
Compute LOS
1 based on
Avg. Speed
33.03 1
Average Travel speed of
Public Transport along key
Average Travel speed of
Public Transport along
5 No. of Trails has to be taken
along each corridor and LOS has to
Compute LOS
2 based on
18 2

Pradeep Chaitanya Jasti 13
corridors (Kmph)
key corridors (Kmph)
be rated based on this average
speed attained.
Avg. Speed
CLOS1 + CLOS2 = 3 OLOS =2
6.) Availability of Parking
Spaces
Availability of Parking Spaces
Availability of on street
paid public parking spaces
Availability of on street
paid public parking spaces
Total no. of paid ECS has to be
obtained within the city.
Compute LOS
1 based on
paid parking
slots
12.75 4
Difference in Maximum
and Minimum Parking Fee
in the City
Ratio to On street and Off
Street Parking
A = ECS of off Street
B = ECS of on-Street
(A/B) to
Compute LOS
2
0.16 4
CLOS1 + CLOS2 = 8 OLOS =4
7.) Road Safety Road Safety
Fatality rate per lakh
population
Fatality rate per lakh
population
A= Total number of fatalities
recorded within city limits in the
given calendar year
B= Population of the urban
agglomeration in that year
(A*100,000/B)
to compute
LOS 1
27 4
Fatality rate for pedestrian
and NMT (%)
Fatality rate for pedestrian
and NMT (%)
A= Total number of pedestrian &
NMT fatalities recorded within city
limits in the given calendar year
B= Total number of fatalities
recorded in road accidents within
city limits in the given calendar
(A/B)* 100 to
compute LOS
2
32.43 2

Pradeep Chaitanya Jasti 14
year
CLOS1 + CLOS2 = 6 OLOS =3
8.) Pollution Levels Pollution Levels
Annual Mean
Concentration Range
(μg/m3)
Annual Mean
Concentration Range
(μg/m3)
Obtain the Annual Mean
Concentration Range from CPCB
Rate LOS
based on
annual mean
concentration
range
SO2+
NO2+
SPM+
RSPM
8
SO2 + NO2 + SPM +RSPM = CLOS1 + CLOS2 + CLOS3 + CLOS4 = 4+2+1+1 = 8 OLOS = 2
9.) Integrated Landuse-
Transport System
Integrated Landuse-Transport System
Population Density Population Density A = Area of the city in Hact
B = Population of current year
(B/A) to
compute LOS1
44.03 4
Mixed Land-use Zoning
along the Transit Corridors
Mixed Land-use Zoning
along the Major Corridors
A = Total developed area
B = Total non residential area
(B/A)*100 to
compute LOS
2
28 2
Intensity of Development –
Citywide
Intensity of Development
– Citywide
Obtain the FSI of outer growth
from the master plan
Compute LOS
3
1.75
2
Intensity of Development
along Transit Corridors
Intensity of Development
along Major Corridors
A = FSI along major corridors
B = FSI of the city
(B/A) to
compute LOS
4
1.5 3
Road network Pattern and Road network Pattern and Based on existing & proposed
network recognize/identify major
Compute LOS
based on the
Some
what
3
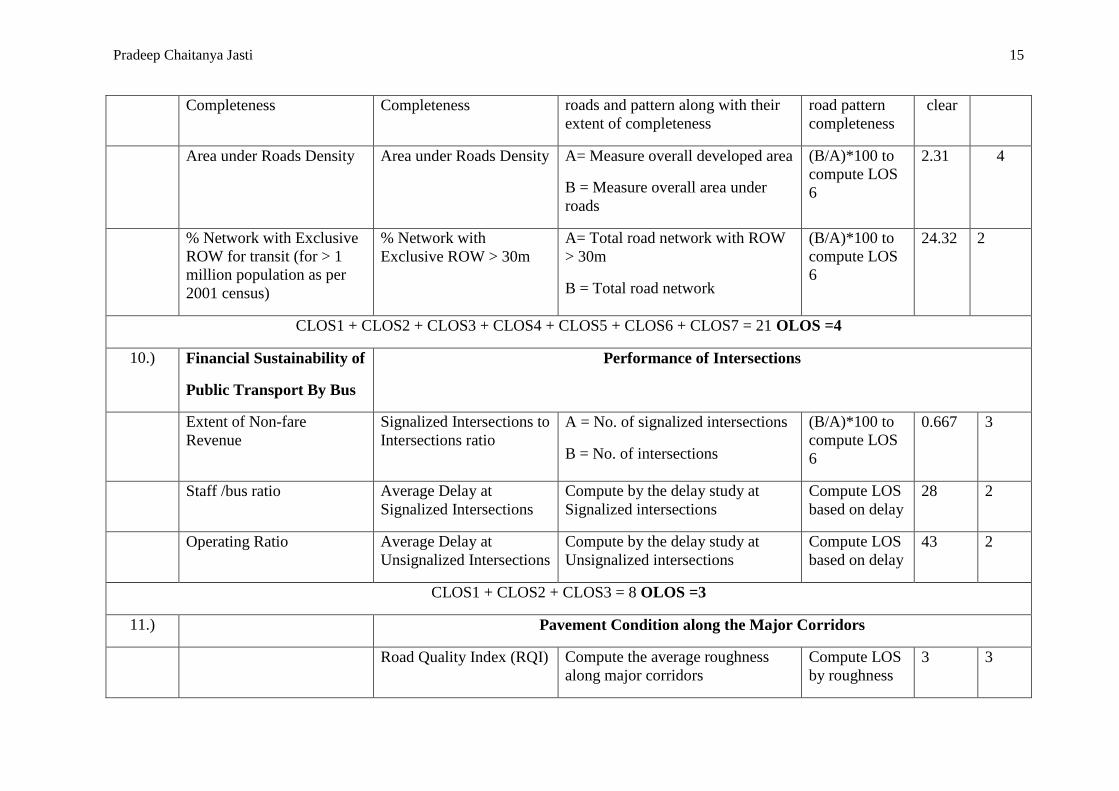
Pradeep Chaitanya Jasti 15
Completeness Completeness roads and pattern along with their
extent of completeness
road pattern
completeness
clear
Area under Roads Density Area under Roads Density A= Measure overall developed area
B = Measure overall area under
roads
(B/A)*100 to
compute LOS
6
2.31 4
% Network with Exclusive
ROW for transit (for > 1
million population as per
2001 census)
% Network with
Exclusive ROW > 30m
A= Total road network with ROW
> 30m
B = Total road network
(B/A)*100 to
compute LOS
6
24.32 2
CLOS1 + CLOS2 + CLOS3 + CLOS4 + CLOS5 + CLOS6 + CLOS7 = 21 OLOS =4
10.) Financial Sustainability of
Public Transport By Bus
Performance of Intersections
Extent of Non-fare
Revenue
Signalized Intersections to
Intersections ratio
A = No. of signalized intersections
B = No. of intersections
(B/A)*100 to
compute LOS
6
0.667 3
Staff /bus ratio Average Delay at
Signalized Intersections
Compute by the delay study at
Signalized intersections
Compute LOS
based on delay
28 2
Operating Ratio Average Delay at
Unsignalized Intersections
Compute by the delay study at
Unsignalized intersections
Compute LOS
based on delay
43 2
CLOS1 + CLOS2 + CLOS3 = 8 OLOS =3
11.) Pavement Condition along the Major Corridors
Road Quality Index (RQI) Compute the average roughness
along major corridors
Compute LOS
by roughness
3 3
Pradeep Chaitanya Jasti 16
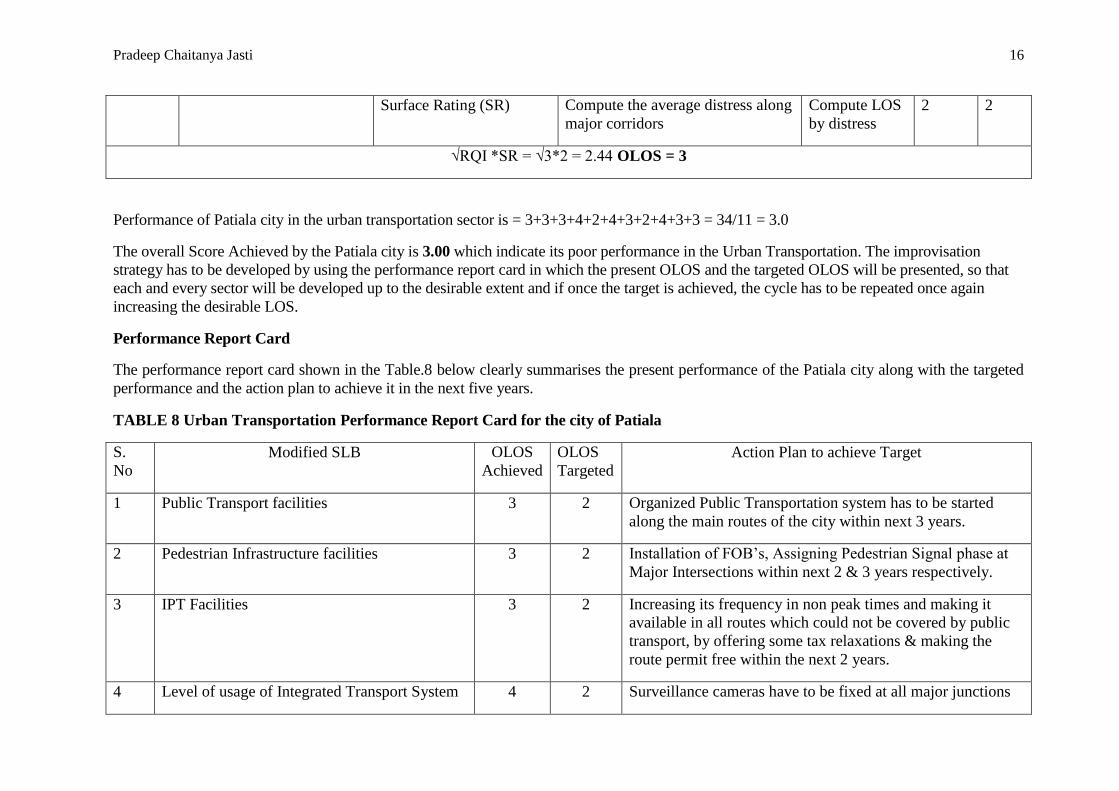
Surface Rating (SR) Compute the average distress along
major corridors
Compute LOS
by distress
2 2
√RQI *SR = √3*2 = 2.44 OLOS = 3
Performance of Patiala city in the urban transportation sector is = 3+3+3+4+2+4+3+2+4+3+3 = 34/11 = 3.0
The overall Score Achieved by the Patiala city is 3.00 which indicate its poor performance in the Urban Transportation. The improvisation
strategy has to be developed by using the performance report card in which the present OLOS and the targeted OLOS will be presented, so that
each and every sector will be developed up to the desirable extent and if once the target is achieved, the cycle has to be repeated once again
increasing the desirable LOS.
Performance Report Card
The performance report card shown in the Table.8 below clearly summarises the present performance of the Patiala city along with the targeted
performance and the action plan to achieve it in the next five years.
TABLE 8 Urban Transportation Performance Report Card for the city of Patiala
S.
No
Modified SLB OLOS
Achieved
OLOS
Targeted
Action Plan to achieve Target
1 Public Transport facilities 3 2 Organized Public Transportation system has to be started
along the main routes of the city within next 3 years.
2 Pedestrian Infrastructure facilities 3 2 Installation of FOB’s, Assigning Pedestrian Signal phase at
Major Intersections within next 2 & 3 years respectively.
3 IPT Facilities 3 2 Increasing its frequency in non peak times and making it
available in all routes which could not be covered by public
transport, by offering some tax relaxations & making the
route permit free within the next 2 years.
4 Level of usage of Integrated Transport System 4 2 Surveillance cameras have to be fixed at all major junctions

Pradeep Chaitanya Jasti 17
(ITS) facilities within next 2 years.
All signals along the major corridor have to be Synchronized
with in next 2 years.
5 Travel speed along major corridors 2 1 Utmost care has to be taken such that the improvisation of PT
& IPT facilities must not make any negative impact on
private transport.
6 Availability of Parking facilities 4 2 Off street parking needs to be encouraged rather than On
street.
Multi level parking needs to be introduced at Dharampura
Bazaar within next 5 years.
7 Road Safety 3 2 Black spots within the city needs to be identified and
geometrically improved within next 5 years.
Road Safety Audit (RSA) has to be carried out throughout
the city and road marking & signages have to be improved
within the next 2 years.
8 Pollution levels 2 1 Pollution levels have to be dropped down by decreasing the
NO2 level in the city within next 5 years.
9 Land Use Transport Integration 4 2 Town planning department has to be made as one of the
approver for all the traffic &transportation studies.
10 Performance of Intersections 3 1 Major intersections have to be signalized within next 1 years
11 Pavement Condition along the Major Corridors 3 2 Regular maintenance of pavement must be made mandatory
prior and after the monsoon within next 1 year.
Pradeep Chaitanya Jasti 18
CONCLUSIONS
The study concludes the following:
There are few drawbacks in the SLB’s proposed by MoUD such as Pedestrian Facilities, NMV, ITS etc. Which cannot be considered for
Benchmarking of Medium Sized Cities. MoUD had not considered the aspects such as IPT, Delay at Intersections and Pavement Condition etc. which were the Key parameters in
rating the Urban Transportation System.
New SLB’s have been created by counter acting the drawbacks of conventional SLB’s and also making the concept of SLB more flexible
and adaptable for all Large & Medium sized Indian Cities.
The city of Patiala is performing very poor in the segments such as Land Use Transport Integration, Level of usage of Integrated Transport
System, Availability of Parking facilities.
Similarly Patiala is performing Good in the Segments such as Travel speed along major corridors, Pollution Levels. The process of SLB has to be made mandatory in all CMP’s and CTTS’s as it determines how effectively and efficiently the present
Transportation system is performing in the existing situation and in which sectors its lagging behind, so that it can be improved easily
with the future targeted LOS
REFERENCES
1. Service level benchmarks for urban transport at a glance, released by MoUD, Urban mobility India conference 2009.
2. Singh k, Methods of assessing pedestrian level of service, Journal of Engineering Research and Studies, Vol. II, 2011, pp.116-124.
3. http://www.dot.state.mn.us/materials/pvmtmgmtdocs/Rating_Overview_State.pdf, last accessed August 31, 2011.
4. Inception Report, CMP Patiala submitted by M/s Egis India Consulting Engineers Pvt. Ltd to PMIDC, November 2010.