service life management system of concrete structures in ... · service life management system of...
TRANSCRIPT
VTT PU
BLICA
TION
S 648Service life m
anagement system
of concrete structures in nuclear power plants
Erkki Vesikari
ESPOO 2007ESPOO 2007ESPOO 2007ESPOO 2007ESPOO 2007 VTT PUBLICATIONS 648
Erkki Vesikari
Service life management system ofconcrete structures in nuclearpower plants
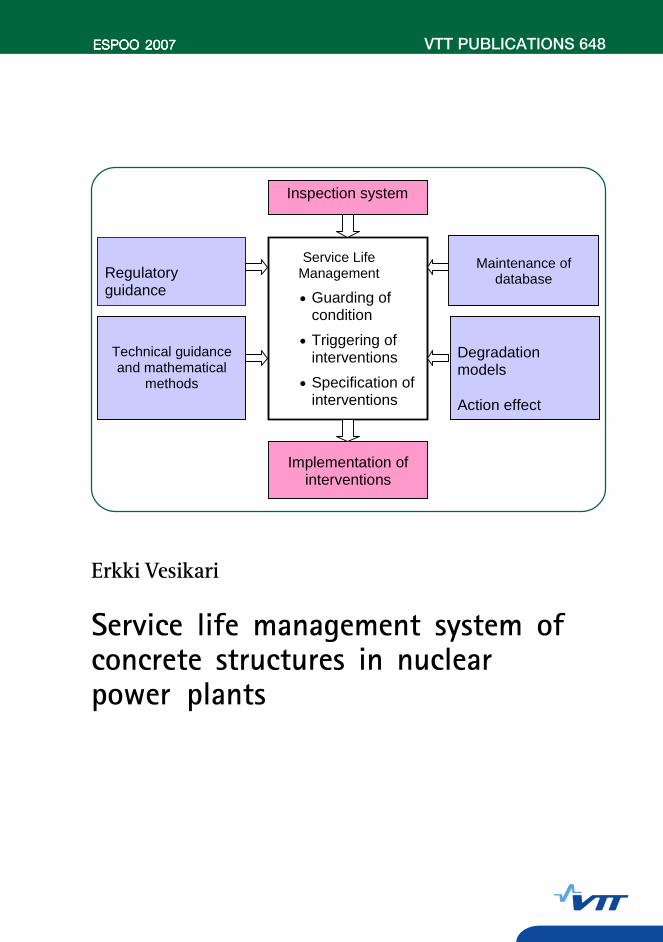
The Service Life Management System (SLMS) is a tool for predicting thecondition of structures over a long design period, planning and organisingall interventions related to the upkeep of structures and evaluating thecosts and environmental impacts of interventions over the design period.The interventions include maintenance and repairs and in special casesrehabilitation and renewal. The inspection of structures and the upkeep ofa database are interlinked with the SLMS. A life cycle cost (LCC) analysis,including annual costs, and a life cycle assessment (LCA) are performedfor the whole design period. Other features such as structural analyses,qualitative and quantitative risk analyses, and MADA (Multiple AttributeDecision making Aids) can also be added to the system.
Inspection system
Service Life Management
• Guarding of condition
• Triggering of interventions
• Specification of interventions
Implementation of interventions
Technical guidance and mathematical
methods
Regulatory guidance
Degradation models
Action effect
Maintenance of database
ISBN 978-951-38-7032-4 (URL: http://www.vtt.fi/publications/index.jsp)ISSN 1455-0849 (URL: http://www.vtt.fi/publications/index.jsp)
Julkaisu on saatavana Publikationen distribueras av This publication is available from
VTT VTT VTTPL 1000 PB 1000 P.O. Box 1000
02044 VTT 02044 VTT FI-02044 VTT, FinlandPuh. 020 722 4404 Tel. 020 722 4404 Phone internat. + 358 20 722 4404Faksi 020 722 4374 Fax 020 722 4374 Fax + 358 20 722 4374


VTT PUBLICATIONS 648
Service life management system of concrete structures in nuclear
power plants
Erkki Vesikari

ISBN 978-951-38-7032-4 (URL: http://www.vtt.fi/publications/index.jsp) ISSN 1455-0849 (URL: http://www.vtt.fi/publications/index.jsp)
Copyright © VTT Technical Research Centre of Finland 2007
JULKAISIJA � UTGIVARE � PUBLISHER
VTT, Vuorimiehentie 3, PL 1000, 02044 VTT puh. vaihde 020 722 111, faksi 020 722 4374
VTT, Bergsmansvägen 3, PB 1000, 02044 VTT tel. växel 020 722 111, fax 020 722 4374
VTT Technical Research Centre of Finland, Vuorimiehentie 3, P.O.Box 1000, FI-02044 VTT, Finland phone internat. +358 20 722 111, fax + 358 20 722 4374
VTT, Lämpömiehenkuja 2, PL 1000, 02044 VTT puh. vaihde 020 722 111, faksi 020 722 7060
VTT, Värmemansgränden 2, PB 1000, 02044 VTT tel. växel 020 722 111, fax 020 722 7060
VTT Technical Research Centre of Finland, Lämpömiehenkuja 2, P.O. Box 1000, FI-02044 VTT, Finland phone internat. +358 20 722 111, fax +358 20 722 7060
Technical editing Maini Manninen
3
Vesikari, Erkki. Service life management system of concrete structures in nuclear power plants[Ydinvoimaloiden betonirakenteiden käyttöiän hallintajärjestelmä]. Espoo 2007. VTT Publications 648. 73 p.
Keywords Inspection systems, service life management, concrete structures, nuclear powerplants, nuclear safety, condition monitoring, service life, modelling,maintenance, life cycle costs
Abstract The Service Life Management System (SLMS) is a tool for predicting the condition of structures over a long design period, planning and organising all interventions related to the upkeep of structures and evaluating the costs and environmental impacts of interventions over the design period. The interventions include maintenance and repairs and in special cases rehabilitation and renewal. The inspection of structures and the upkeep of a database are interlinked with the SLMS. A life cycle cost (LCC) analysis, including annual costs, and a life cycle assessment (LCA) are performed for the whole design period. Other features such as structural analyses, qualitative and quantitative risk analyses, and MADA (Multiple Attribute Decision making Aids) can also be added to the system.
The system characterizes the utility of a plant with the following information: • present condition state of structures, • predicted condition of structures over the licensed operating time, • predicted service life of structures, • predicted maintenance and repairs and their timings during the whole
operating time, and • the costs of maintenance and repairs.
Using the SLMS, the administration of a nuclear power plant (NPP) can convince and persuade authorities that the concrete structures in the NPP fulfil all the requirements of performance and safety. The upkeep of structures can be designed in a way that the requirements will be fulfilled during the licensed operating time. For maintenance staff and designers, the SLMS specifies and schedules all the maintenance and repairs throughout the operating time so that they can be systematically taken into account in the annual action and resource plans.
4
Vesikari, Erkki. Service life management system of concrete structures in nuclear power plants[Ydinvoimaloiden betonirakenteiden käyttöiän hallintajärjestelmä].Espoo 2007. VTT Publications 648. 73 s.
Avainsanat Inspection systems, service life management, concrete structures, nuclear powerplants, nuclear safety, condition monitoring, service life, modelling, maintenance, life cycle costs
Tiivistelmä Käyttöiänhallintajärjestelmä on rakenteiden ylläpidon suunnittelun ja seurannan väline, jolla voidaan ennakoida rakenteiden käyttöikä sekä suunnitella ja organisoida kaikkia rakenteiden ylläpitoon liittyviä toimintoja, joita ovat ennakkohuolto- ja korjaustyöt sekä erityistapauksissa perusparantaminen ja uusiminen. Käyttöiän-hallintajärjestelmään liittyvät läheisesti rakenteiden tarkastusjärjestelmä ja rakenteiden tietokannan ylläpidon järjestelmä.
Käyttöiänhallintajärjestelmä on yhdenmukainen viranomaismääräyksen YVL 1.1:n kanssa, jonka mukaan laitoksen on esitettävä �suunnitelma siitä, kuinka laitteiden ja rakenteiden suunnittelu ja kelpoistaminen, käyttö ja käyttökokemusten hyödyntäminen, määräaikaistarkastukset ja -testaukset ja kunnossapito integroidaan kokonaisvaltaiseksi ikääntymisen hallintaohjelmaksi�. Käyttöiän hallintajärjestelmä yksilöi kaikki merkitykselliset turmeltumismekanismit sekä potentiaaliset turmeltumisvaikutukset.
Käyttöiänhallintajärjestelmä antaa laitoksesta mm. seuraavia tietoja: • rakenteiden nykykuntotila • ennusteet rakenteiden kuntotilasta laitoksen käyttöajan aikana • rakenteiden ennakoitu käyttöikä • ennakoidut huolto- ja korjaustoimenpiteet • toimenpiteistä johtuvat elinkaarikustannukset.
Ydinvoimaloiden käyttöiänhallintajärjestelmä on sekä ydinvoimalan johdolle että huolto- ja korjaustöistä vastaavalle henkilökunnalle tarkoitettu työkalu. Sen avulla organisaation johto voi itse vakuuttua ja vakuuttaa viranomaisille, että rakenteet täyttävät niille asetetut toimivuus- ja turvallisuusvaatimukset sekä ennustaa rakenteiden käyttökelpoisuus myös tulevaisuudessa niin pitkälle kuin voimalalle suunnitellaan käyttöaikaa. Kunnossapito- ja korjaustöistä vastaaville suunnittelijoille ja toteuttajille käyttöiänhallintajärjestelmä määrittelee ja ajoittaa voimalarakenteiden rakenneosien toimenpiteet etukäteen siten, että ne voidaan ottaa suunnitelmallisesti huomioon vuosittaisissa toimenpideohjelmissa sekä laskee toimenpiteistä johtuvat kustannukset.
5
Preface This report was written as a result of the project CONSAFE under the auspices of the research programme SAFIR in 2003�2006. The project CONSAFE was directed towards a safety management system of concrete structures in nuclear power plants. CONSAFE started in 2005 and continued in 2006 as a subtask in the project CONTECH. A description and an implementation plan for the safety management system was prepared.
The ad-hoc group of the project consisted of the following persons: Juha Riihimäki, TVO Oy Vesa Hiltunen, TVO Oy Jari Puttonen, Fortum Oy/TKK Heikki Saarikoski, STUK Tarja Häkkinen, VTT
6
Contents
Abstract ................................................................................................................. 3
Tiivistelmä ............................................................................................................ 4
Preface .................................................................................................................. 5
1. Background and objectives............................................................................. 9 1.1 Purpose of SLMS .................................................................................. 9 1.2 Regulatory guides on nuclear safety (YVL)........................................ 10
1.2.1 General guides......................................................................... 10 1.2.2 Guides for concrete structures in nuclear facilities (YVL 4.1)13
1.3 International activity............................................................................ 15 1.3.1 IAEA ....................................................................................... 15 1.3.2 OECD-NEA ............................................................................ 18 1.3.3 RILEM .................................................................................... 20
2. SLMS............................................................................................................ 22 2.1 General ................................................................................................ 22 2.2 Principles of the SLMS ....................................................................... 23 2.3 Properties of the SLMS ....................................................................... 24 2.4 The structure and process of SLMS .................................................... 26 2.5 Subsystems of the SLMS..................................................................... 29
2.5.1 In-service inspection ............................................................... 29 2.5.2 Regulatory and administrative guidelines ............................... 30 2.5.3 Technical guiding methods and supplementary analyses........ 31 2.5.4 Database .................................................................................. 32 2.5.5 Implementation of actions....................................................... 33 2.5.6 Models..................................................................................... 33 2.5.7 Process of service life management ........................................ 34
3. Inpection system ........................................................................................... 35 3.1 General ................................................................................................ 35 3.2 In-service inspections .......................................................................... 35
3.2.1 Visual on-site inspections ....................................................... 36 3.2.2 Monitoring and measurements ................................................ 36
3.3 Special inspections .............................................................................. 37

7
3.4 Modulation of structures...................................................................... 38
4. Evaluation of future condition and service life............................................. 39 4.1 General ................................................................................................ 39 4.2 Modelling of degradation and service life ........................................... 39
4.2.1 Degradation models ................................................................ 40 4.2.2 Service life models.................................................................. 41
4.3 Stochastic modelling of degradation ................................................... 42 4.3.1 Principles of the analytic method ............................................ 43 4.3.2 Principles of the Markov Chain Method ................................. 46
4.4 Condition controlled life cycle cost analysis ....................................... 53
5. Implementation plan of the SLMS................................................................ 58 5.1 Tasks of the preliminary research project............................................ 59
5.1.1 Identification of structures and modules and FMEA analyses 59 5.1.2 Preliminary database for structures and modules.................... 59 5.1.3 Preliminary database for interventions.................................... 60 5.1.4 Preliminary degradation and damage models ......................... 61 5.1.5 Preliminary condition analysis based on Markov Chain......... 61 5.1.6 Preliminary results tables and paper reports ........................... 63
5.2 Tasks of the actual research project..................................................... 64 5.2.1 Development of the final databases for structures, modules and
interventions............................................................................ 64 5.2.2 Development of the module specific degradation and damage
models, calibration systems of models and inspection instructions .............................................................................. 64
5.2.3 Development of the manual system for life cycle design and automatic steering systems of the process (decision trees etc.)65
5.2.4 Development and combining of the cost and environmental impact analyses with the condition analysis and implementing the annual resource planning................................................... 65
5.2.5 Development of structural degradation analyses .................... 67 5.2.6 Development and attachment of risk analyses to the SLMS.. 67
6. Summary....................................................................................................... 69
References........................................................................................................... 71


9
1. Background and objectives
1.1 Purpose of SLMS
The service life of concrete structures in nuclear power plants (NPPs) has risen as a prime issue in recent years. This is a consequence of the expiration of original operating licences of NPPs and the forthcoming renewal of those licenses. In order to be able to justify an extension to the operating licence the NPP, utilities have to prepare intervention plans aimed at ensuring structures will work reliably during the prolonged operating period. Accordingly, it is important for utilities to manage the condition of NPP structures � not only to understand the current condition of them but also to predict the behaviour of structures during the prolonged operating time.
For structures and equipment in NPPs, a characterization of concrete structures is especially important in the operating license renewal process. While many systems, structures and equipment made of other materials may be replaced without causing extensive breaks in the operation of a NPP and at a reasonable cost, this is not the case for the replacement and repair of massive concrete structures. Specifically, concrete containment structures are not designed to be renewed and they cannot be economically renovated. Accordingly, the final service life of a NPP may be dependent on the service life of its concrete parts.
A Service Life Management System (SLMS) involves the practice of recording the condition of structures as a function of management interventions including predicted maintenance and repairs during the planned operational time of a NPP. The predicted condition and service life estimates are based on a special condition analyses made for each structural part (module) using the best available degradation models. Using the degradation models, degradation is evaluated as a function of time and material, structural and environmental factors. Also, the maximum allowable degree of degradation is defined so that the service life can be explicitly determined using the degradation models and considering that sometimes more than one degradation mechanism may have to be considered.
10
The degradation models can be calibrated by the observed degradation during the in-service inspections. The results of in-service inspections can be combined with the process of service life prediction and timing of maintenance and repairs in the SLMS. As a result an improved service life prediction can be obtained. The determinations of degradation are made visually on-site or from small samples which are taken from structures for a laboratory study. However, in a NPP it may be difficult to take samples from all structural components because of high activity or difficult accessibility.
When the degradation mechanisms and the most relevant material, structural and environmental parameters affecting the degradation mechanisms have been identified, the degradation progress can be predicted and the interventions can be planned for the whole operating time. The interventions can be e.g. applications of protection systems, such as coatings, tilings, and protective concrete layers. In special cases, non-mechanical repair methods such as realkalisation and electrochemical chloride removal can be considered. In the case of steel corrosion, cathodic protection can be applied to reduce the rate of corrosion. As a special corrosion protection method, it is also possible to change the gas atmosphere of a special type of containment into a oxygen free atmosphere.
Massive mechanical repairs should be avoided in concrete NPP structures. However, local repairs are possible to do even by traditional mechanical repair methods.
1.2 Regulatory guides on nuclear safety (YVL)
1.2.1 General guides
In Finland the Finnish Centre for Radiation and Nuclear Safety (STUK) issues detailed regulations concerning the safety of NPPs in YVL Guides. YVL Guides are rules that an individual licensee or any other organisation concerned shall comply with, unless STUK has been presented with some other acceptable procedure or solution by which the safety level set forth in the YVL Guides is achieved /1/.

11
In accordance with the Nuclear Energy Act, the use of nuclear energy constitutes operations subject to licence. A Government resolution, a construction licence, an operating licence and renewal of the operating licence are applied for from the Government /2/.
The licence applicant shall submit a preliminary description of the principles of managing the aging of the facility. The description shall take into account all significant aging and wear mechanisms, and potential degradation owing to aging. The following information, i.e., shall be provided in the report:
• the general aging management strategy for the facility and the prerequisites for its implementation
• provision for sufficient margins in designing the systems, structures and components important to safety to ensure that the systems, structures and components will be capable of fulfilling all the necessary safety functions throughout their operating lives
• how the facility layout ensures accessibility to the systems, structures and components to enable their inspection, maintenance and repair
• how the suitability and reliability of the systems, structures and components for all design basis operating and accident conditions are ensured during their acquisition
• how the availability of sufficient reference data on the systems, components and structures and on their operating conditions is ensured during construction and commissioning (testing)
• how the availability of knowledge related to aging management and the expertise of the facility personnel are ensured during the design, construction and commissioning (testing) of the facility.
For the aging of the facility, a plan shall be presented for how the design and qualification of the components and structures, their operation and operating experience, in-service inspections and tests, and maintenance are integrated to form a comprehensive aging management programme. All significant aging and wear mechanisms and potential degradation owing to aging shall be identified to provide a basis for the plan. In addition, the following information shall be provided to support the plan /2/.
In applying for renewal of the operating licence for a nuclear facility that is being operated, the procedure to be followed is in general the same as in

12
applying for an operating licence for a new nuclear facility. The renewal of the operating licence always involves a periodic safety review of the facility /2/.
The Finnish Radiation and Nuclear Safety Authority (STUK) controls the safety of nuclear facilities in Finland. This control encompasses on one hand the evaluation of plant safety on the basis of plans and analyses pertaining to the plant and on the other hand the inspection of plant structures, systems and components as well as of operational activity. STUK also monitors plant operational experience feedback and technical developments in the field, as well as the development of safety research and takes the necessary measures on their basis /3/.
Definitions /4/:
Modification A modification denotes the alteration of a system, component or structure in such a way that it no longer meets all the requirements set for earlier designs.
Repair A repair denotes making operable a failed component or structure by restoring it to a state which conforms to original design.
Urgent repair An urgent repair denotes a repair carried out to create preconditions for the restoration of the plant to a safe state, and repairs by which the plant's status is made to correspond to the Technical Specifications after it has deviated from them.
Preventive maintenance Preventive maintenance denotes measures carried out according to a pre-determined maintenance programme that are aimed at preventing any operational incidents or failures of a component or a structure.
Failure Failure is an event during which a component's or structure's functional deficiency or structural weakness has exceeded established limit values or has brought about a deviation from the component's or structure's designed functioning.

13
Mechanical components and structures Mechanical components and structures denote pressure vessels, pumps, fans, filters, valves, cranes, auxiliary hoisting equipment, fuel handling machines, pool linings etc. and structural materials and test pieces required in their manufacturing.
Inspection of the repairs and modifications of steel and concrete structures is carried out in compliance with Guide YVL 4.1 and Guide YVL 4.2, where applicable /5, 6/.
Repair and modification plans for Safety Class 1, 2 and 3 concrete and steel structures shall be submitted to STUK for approval. Work may be started after STUK's approval of the plans in question has been obtained. Upon completion of work, STUK's inspector conducts a combined construction and commissioning inspection.
1.2.2 Guides for concrete structures in nuclear facilities (YVL 4.1)
Inspection Plan The in-service inspection plan contains the inspections to be conducted on structures at specified intervals during plant operation, the manner of performance of the inspections and the criteria for assessment and recording of the inspection results.
The plan for the in-service inspection of containment building concrete structures shall include the following information:
• inspection of structural deformations at specified intervals and in conjunction with leakage and pressure tests
• inspection of the condition of post-tensioned concrete containment tendons and anchorages at specified intervals
• inspection of structures essential for the containment function by test loading or by other reliable methods, if necessary.
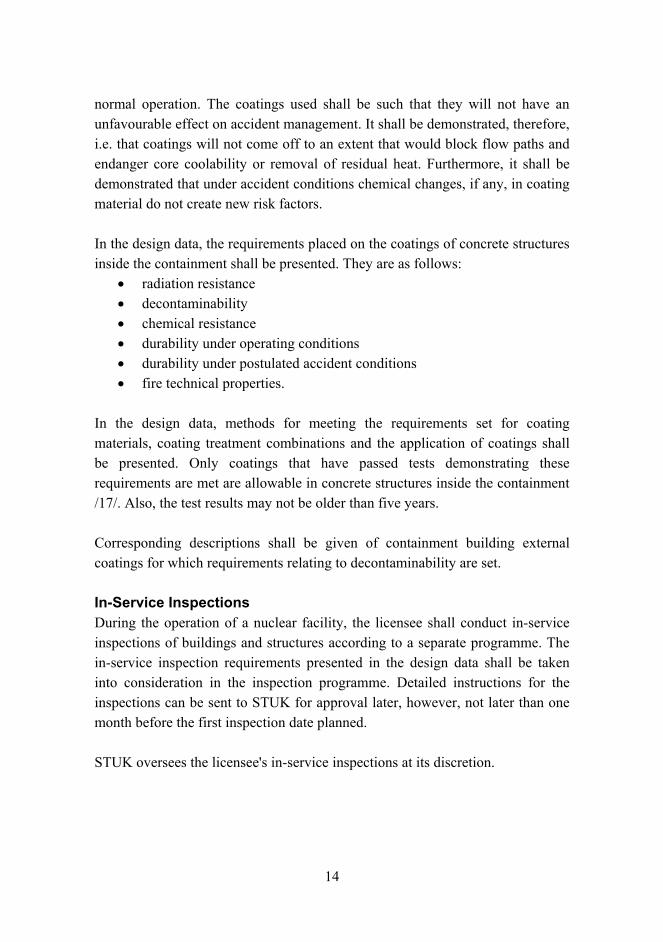
Coatings Under accident conditions, the coatings of containment internal structures will be subjected to loads which deviate essentially from those encountered during
14
normal operation. The coatings used shall be such that they will not have an unfavourable effect on accident management. It shall be demonstrated, therefore, i.e. that coatings will not come off to an extent that would block flow paths and endanger core coolability or removal of residual heat. Furthermore, it shall be demonstrated that under accident conditions chemical changes, if any, in coating material do not create new risk factors.
In the design data, the requirements placed on the coatings of concrete structures inside the containment shall be presented. They are as follows:
• radiation resistance • decontaminability • chemical resistance • durability under operating conditions • durability under postulated accident conditions • fire technical properties.
In the design data, methods for meeting the requirements set for coating materials, coating treatment combinations and the application of coatings shall be presented. Only coatings that have passed tests demonstrating these requirements are met are allowable in concrete structures inside the containment /17/. Also, the test results may not be older than five years.
Corresponding descriptions shall be given of containment building external coatings for which requirements relating to decontaminability are set.
In-Service Inspections During the operation of a nuclear facility, the licensee shall conduct in-service inspections of buildings and structures according to a separate programme. The in-service inspection requirements presented in the design data shall be taken into consideration in the inspection programme. Detailed instructions for the inspections can be sent to STUK for approval later, however, not later than one month before the first inspection date planned.
STUK oversees the licensee's in-service inspections at its discretion.

15
Repairs and modifications The guide YVL 4.1 is to be applied, to the extent appropriate, when concrete structures are repaired or modified during operation of nuclear facilities. All design documentation is subject to STUK's approval before the work phase in question is started.
1.3 International activity
The principal organisations currently or recently involved in the examination of aging effects in NPPs are the International Atomic Energy Agency (IAEA), Organisation for Economic Co-operation and Development Atomic Energy Agency (OECD-NEA), and Réunion Internationale des Laboratoires d�Essais et de Recherches sur les Matériaux (RILEM). A brief résumé of activities of these organisations concerning especially aging of concrete structures in NPPs is given below /14, 19/.
1.3.1 IAEA
To assist the member states of IAEA in understanding the aging of systems, structures and components important to safety, the IAEA started in 1989 a project on the safety aspects of NPP aging. The project included a programme of pilot studies on aging management of NPP components that included concrete containment building. Phase 1 of the studies assessed the current state of knowledge on age-related degradation, its detection and mitigation. This led to a second phase, the Co-ordinated Research Programme (CRP) on Management of Aging of Concrete Containment Buildings, which addressed current practices and techniques for assessing fitness-for-service and the inspection, monitoring and mitigation of aging degradation of concrete containment buildings. The original objectives of the CRP, with particular application to concrete containment buildings, were to /19/:
• produce a summary of current national aging management practices and experiences for concrete containment structures,
• compile a state-of-the-art report on concrete repair techniques and materials specifically applicable to nuclear containment structures,

16
• develop crack mapping and acceptance/repair guidelines applicable to nuclear containment structures, and to
• develop a set of practical condition indicators and associated guidelines for monitoring concrete containment aging.
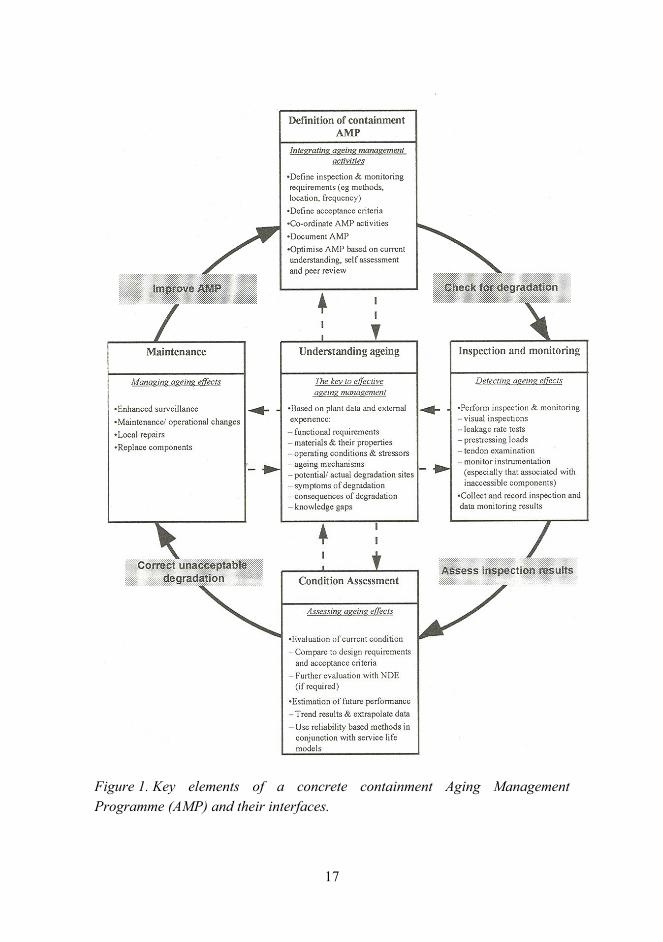
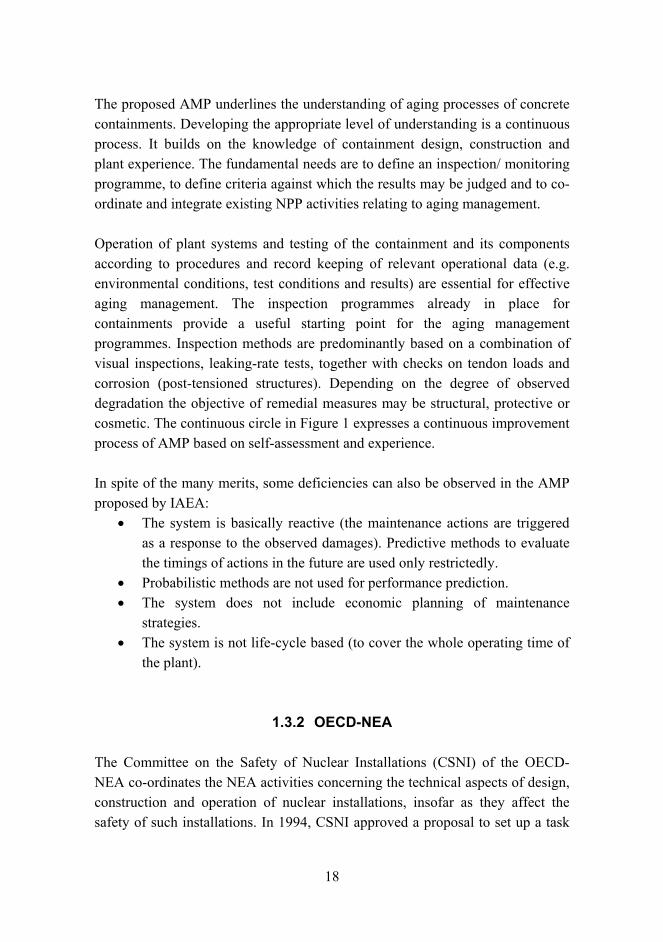
As a result of the projects, IAEA reported on potential aging mechanisms, age-related degradation and aging management for concrete, reinforcement steel, prestressing systems, penetrations, liner systems, waterstops, seals, gaskets and protective coatings in concrete containment buildings. As part of the IAEA Co-ordinated Research Programme a generic framework for aging management of concrete containments in NPPs was developed. Figure 1 presents schematically the proposed aging management programme /20/.
17
Figure 1. Key elements of a concrete containment Aging Management Programme (AMP) and their interfaces.
18
The proposed AMP underlines the understanding of aging processes of concrete containments. Developing the appropriate level of understanding is a continuous process. It builds on the knowledge of containment design, construction and plant experience. The fundamental needs are to define an inspection/ monitoring programme, to define criteria against which the results may be judged and to co-ordinate and integrate existing NPP activities relating to aging management.
Operation of plant systems and testing of the containment and its components according to procedures and record keeping of relevant operational data (e.g. environmental conditions, test conditions and results) are essential for effective aging management. The inspection programmes already in place for containments provide a useful starting point for the aging management programmes. Inspection methods are predominantly based on a combination of visual inspections, leaking-rate tests, together with checks on tendon loads and corrosion (post-tensioned structures). Depending on the degree of observed degradation the objective of remedial measures may be structural, protective or cosmetic. The continuous circle in Figure 1 expresses a continuous improvement process of AMP based on self-assessment and experience.
In spite of the many merits, some deficiencies can also be observed in the AMP proposed by IAEA:
• The system is basically reactive (the maintenance actions are triggered as a response to the observed damages). Predictive methods to evaluate the timings of actions in the future are used only restrictedly.
• Probabilistic methods are not used for performance prediction. • The system does not include economic planning of maintenance
strategies. • The system is not life-cycle based (to cover the whole operating time of
the plant).
1.3.2 OECD-NEA
The Committee on the Safety of Nuclear Installations (CSNI) of the OECD-NEA co-ordinates the NEA activities concerning the technical aspects of design, construction and operation of nuclear installations, insofar as they affect the safety of such installations. In 1994, CSNI approved a proposal to set up a task
19
group under its Principal Working Group 3 to study the need for a programme of international activities in the area of concrete structural integrity and aging and how such a programme could be organised. As a result the international task group proposed a series of workshops to address specific technical issues in three levels of priority /14/:
Priority • Loss of prestressing force in tendons of post-tensioned concrete
structures • In-service inspection techniques for reinforced concrete structures
having thick sections and areas not directly accessible for inspection
Priority • Viability of development of a performance based database • Response of degraded structures (including finite element analysis
techniques)
Priority • Instrumentation and monitoring • Repair method • Criteria for condition assessment
After the approval of CSNI the task group started implementing the programme. The following international workshops were arranged by the OECD-NEA.

20
Table 1. Workshops organised by OECD-NEA for solving aging problems of concrete structures in NPPs.
Workshop topic Year Location OECD Report Loss of Prestressing Force in Tendons NDE (Non-Destructive-Evaluation) of Concrete Structures FE Analysis of Degraded Concrete Structures Instrumentation and Monitoring Repair Methods and Criteria for Repair
1997 1997 1998 2000 2002
Poitiers, France Risley, England New York, USA Brussels, Belgium Berlin, Germany
NEA/CSNI/R(97)9 NEA/CSNI/R(97)28 NEA/CSNI/R(99)1 NEA/CSNI/R(2000)15 NEA/CSNI/R(2002)7
In addition to papers presented in workshops, a special report contains a summarisation of conclusions drawn from these workshops as well as recommendations to provide an improved understanding of the long-term behaviour of concrete structures /21/.
1.3.3 RILEM
In 1994 the RILEM General Council established a committee to examine the methodology for life prediction of concrete structures in NPPs (TC160-MLN). The committee was created to review the present state of aging management procedures for safety related concrete structures in NPPs and to investigate how this work could be developed to allow prediction of service life of these structures. The committee comprised representatives from thirteen countries and co-ordinated a five-year programme of activities that included the following issues:

21
• Review existing guidelines/procedures for monitoring/evaluating concrete nuclear structures.
• Develop guidelines/standards for performance monitoring and assessment criteria of existing nuclear structures.
• Develop guidelines/standards for performance monitoring of concrete nuclear structures.
RILEM organised two international conferences with the title �Life Prediction and Aging Management of Concrete Structures�. The first one was held in Bratislava, Slovakia in 1999 /15/ and the other in Cannes, France in 2000 / 16/.

22
2. SLMS
2.1 General
The SLMS is a tool for both the administrative and maintenance staff of a NPP. The tool encompasses periodic inspections, prediction of condition, guarding of safety limits, timing of necessary maintenance and repairs, and the evaluation of costs. By the SLMS it is possible to predict the condition and service life of structures over a long design period, to plan and organise all interventions related to the upkeep of structures and to evaluate the costs of the interventions over the design period. The interventions include maintenance and repairs and in special cases rehabilitation and renewal. The inspection of structures and the upkeep of a database are interlinked with the SLMS. A life cycle cost (LCC) analysis, including annual costs, and a life cycle assessment (LCA) are performed for the whole design period. Other features such as structural analyses, qualitative and quantitative risk analyses, and automatic decision making aids can also be added to the system /10/. The process and the methodological basis of the management system were developed in the European Union research project LIFECON (GIRD-CT-2000-00378) in the years 2001�2003. /12, 13/.
A plan developed using the SLMS fulfils the requirements presented in the Finnish Regulatory guide YVL 1.1, which states that �a plan shall be presented for how the design and qualification of the components and structures, their operation and operating experience, in-service inspections and tests, and maintenance are integrated so as to form a comprehensive aging management programme.� The system identifies all significant aging and wear mechanisms and potential degradation owing to aging /2/.
The system characterizes a plant with the following information /11/: • present condition state of structures, • predicted condition of structures over the licensed operating time, • predicted service life of structures, • predicted maintenance and repairs and their timings during the whole
operating time, and • costs of maintenance and repairs.

23
Using the SLMS, the upkeep of structures can be designed in a way that the requirements will be fulfilled during the licensed operating time. For maintenance staff and designers, the SLMS specifies and schedules all the maintenance and repairs throughout the operating time so that they can be systematically taken into account in the annual action and resource plans.
2.2 Principles of the SLMS
The ultimate objective of a SLMS is to guarantee a safe and continuous operation for the NPP insofar as it depends on concrete structures. Possible unintended breaks in the operation of a NPP would be extremely expensive and they should be avoided by all means. The SLMS helps to produce maintenance and repair plans so that the maintenance, repair, and rehabilitation (MR&R) actions can be performed during planned shutdowns.
As a rule, every structure is provided with a service life evaluation and a maintenance plan over the defined design period. The SLMS evaluates the service life of structures by using degradation models and condition observations from inspections. Degradation models and inspection data also establish the basis for maintenance and repair planning over a long design period (Figure 2). The SLMS can give answers to the following questions: What is the present condition state of structures? What is the predicted service life of a structure? What maintenance and repairs should be performed in order that the structure should fulfil the performance requirements during the design time? When should the actions be implemented? What are the costs for the maintenance and repairs? etc.

24
Figure 2. The service life management process between the inspection of structures and the execution of interventions /11/.
Within the SLMS, structures are divided into structural modules which work as the units of analyses and planning. The system includes the tools, techniques and methods for analyses and intervention planning. The system includes also the calculation of maintenance and repair costs which are determined using the principles of investment calculus.
2.3 Properties of the SLMS
The SLMS in this report can be characterised with the following terms /11/: • predictive, • probabilistic, • integrated, • life cycle based, • optimising and • risk-informed.
Inspection and condition assessment of structures
Database of structures Database of MR&R actions Degradation models Supplementary analyses
Service Life Management
Process
Execution of interventions
25
The attribute "predictive" means that the condition of structures is predicted over the design period and the financial needs for MR&R activities are predicted by the system. Most management systems working so far are �reactive� in the sense that the repairs are performed as a reaction to the degradation and damages observed in structures during inspections. The possibilities of preplanning are limited with a reactive management system. A predictive system enables life cycle planning with alternative technical strategies and long- and short-term scenarios on the financial needs for MR&R activity.
�Probabilistic� means that the condition analysis of the system is performed using stochastic degradation and action effect models. A �probabilistic� approach is needed when dealing with uncertainty and risks. Probabilistic models make it possible to apply the reliability theory in the timing of maintenance and repairs.
The term "integrated" means consideration of many attributes i.e. requirements or aspects at the same process of planning. The aspects to be considered throughout the management system are safety, condition, costs, and possibly environmental impacts.
The system works on the "life-cycle principle". This means that the condition of the structure, costs and environmental impacts of interventions are determined from a pre-defined life cycle that is called the design period. In a NPP the design period is usually the whole planned operating time.
The attribute "optimising" means that the system seeks to find the optimal methods for the upkeep of structures during a chosen design period. This is achieved with the help of life cycle cost analyses, by which it is possible to select the most cost-effective and otherwise optimally appropriate life cycle action profiles (LCAP) for structures. LCAP is a set of actions or activities that will be undertaken during a chosen design period.
The term �risk-informed� means that structural risks related to the aging of structures are considered. The risks are evaluated using suitable risk-analysis methods and structural analysis methods. Based on such risk-analyses the risks are mitigated by correct timing of actions and by choosing risk-free MR&R methods.

26
The SLMS is adapted specifically for each NPP unit by taking into account the specific needs of the unit. Accordingly, as an addition to the list of properties we could mention �flexibility� and �openness�, which mean the adaptability of the management system to different kinds of modifications that are necessary to meet the demands of each specific NPP unit.
The SLMS is able to respond to the following needs of the plant:
Administration: • Guarding safety and continuing use of structures, • Justifying service life and maintenance strategy for authorities, • Planning of the MR&R activities over the licensed operating time and
possibly over a prolonged operating time. • Developing and analyzing long and short term scenarios on the
maintenance and repair costs for the upkeep of NPP structures.
Staff responsible for maintenance and repair activity: • Developing well organised and self-serving inspection system of
structures, • Timing and specifying MR&R actions taking into account the specific
needs of structures within the management system, • Predicting costs for maintenance and repairs.
2.4 The structure and process of SLMS
The SLMS consists of several subsystems which work logically together. The subsystems are:
• Regulatory and administrative guidelines for the inspection and upkeep of structures,
• Technical guiding systems, decision making support and supplementary analyses,
• Inspection and condition assessment system, • Database management system, • Upkeep of models (degradation, action effect and cost models), • Execution of actions.

27
The subsystems form together the informational and methodological bases, on which the system is built. The system can be described as presented in Figure 3 /11/.
Figure 3. Subsystems of the SLMS.
The Service Life Management Process is the core subsystem in the SLMS. It is located between the inspection of structures and the execution of interventions and its purpose is to prepare the plans for the execution interventions. The Process consists of (1) predicting and guarding of condition structures, (2) planning of interventions (specification and timing), and (3) planning of costs and resources. The Service Life Management Process is presented in more detail in Figure 4, in which the levels of planning are presented in different columns. In Table 2 the contents of planning levels are described.
Inspection System
Service Life Management Process
• Predicting and guarding of condition
• Planning of actions • Planning of
resources
Execution of Interventions
Technical guiding methods,
Supplementary analysis methods
Regulatory and Administrational
Guidelines
Updating Models: • Degradation
models • Action effect
models • Cost models
Upkeep of Database
28
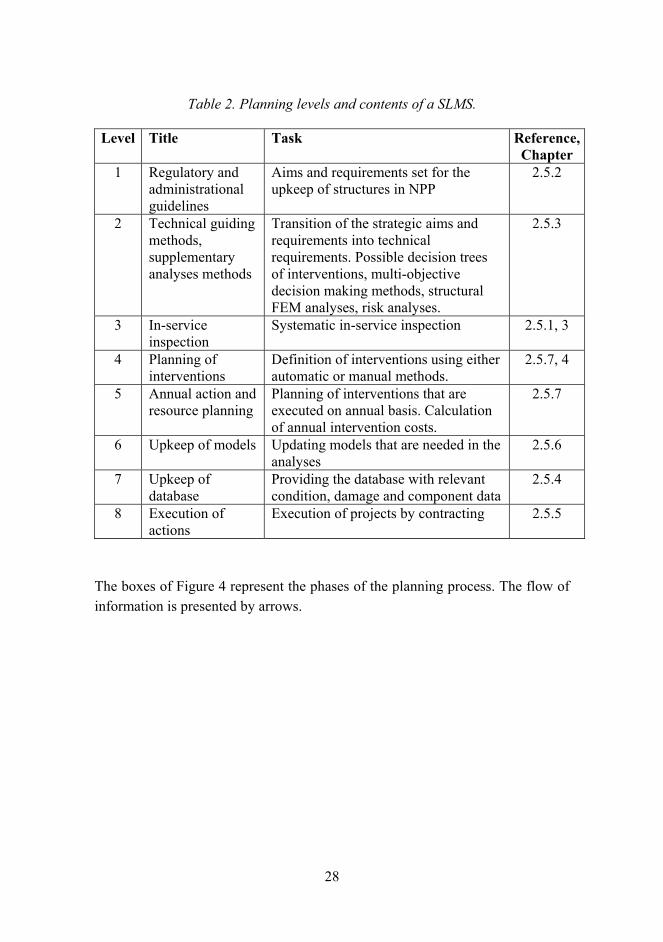
Table 2. Planning levels and contents of a SLMS.
Level Title Task Reference, Chapter
1 Regulatory and administrational guidelines
Aims and requirements set for the upkeep of structures in NPP
2.5.2
2 Technical guiding methods, supplementary analyses methods
Transition of the strategic aims and requirements into technical requirements. Possible decision trees of interventions, multi-objective decision making methods, structural FEM analyses, risk analyses.
2.5.3
3 In-service inspection
Systematic in-service inspection
2.5.1, 3
4 Planning of interventions
Definition of interventions using either automatic or manual methods.
2.5.7, 4
5 Annual action and resource planning
Planning of interventions that are executed on annual basis. Calculation of annual intervention costs.
2.5.7
6 Upkeep of models Updating models that are needed in the analyses
2.5.6
7 Upkeep of database
Providing the database with relevant condition, damage and component data
2.5.4
8 Execution of actions
Execution of projects by contracting 2.5.5
The boxes of Figure 4 represent the phases of the planning process. The flow of information is presented by arrows.

29
Regulatory and adminitrational guidelines
Technical guiding and supplementary analyses
Planning of MR&R actions
Resources planning
Upkeep of models
Upkeep of database
Life Cycle Management Process
Guiding ofactions
Automatic and
manual planning of MR&R
actions
Annual action and re-
sources planning
Final action planning
Inspection of structures
Models of degrad- ation,
actions and costs
Definition
of strategies and aims
Execution of MR&R actions
Link for
inspection data
Link for
action cost data
Priorisat-ion and structural
analyses
Figure 4. Flow chart of the Service Life Management Process.
2.5 Subsystems of the SLMS
2.5.1 In-service inspection
The inspection of structures is based on the certified �Plan for the In-service Inspection�, which contains the specification of periodic inspections for NPP
30
structures, the methods of inspection, the criteria of evaluating the results of inspection and the storing of the outcomes of inspection. According to YVL 4.12 the plan for the in-service inspection of containment building concrete structures shall include the following information:
• The results of the inspection of structural deformations at specified intervals and in conjunction with leakage and pressure tests
• The results of the inspection of the condition of post-tensioned concrete containment tendons and anchorages at specified intervals
• The results of the inspection of structures essential for the containment function by test loading or by other reliable methods, if necessary.
• Identification of inspection actions, which aim at degradation model validation with samples used for the determination of the present condition state of structures by microscopy.
The inspection system is based on plant specific inspection plans which are approved by the regulatory authority. The inspection system is presented more closely in Chapter 3.
2.5.2 Regulatory and administrative guidelines
The regulatory authority (STUK) and the administration of the plant issue guidelines for the inspection and upkeep of structures. The general regulatory guidelines are given in YVL Guides. However STUK also supervises the inspection and maintenance of structures in practice and may give detailed orders for inspection and maintenance. The administration of the NPP unit prepares plant specific plans for the upkeep of structures and defines the strategic aims of this activity including the requirements, criteria and weights of criteria in the decision making related to maintenance and repair. The most important criteria are the safety and performance but also economic and environmental criteria may have to be considered.
The authority (STUK) approves of the whole SLMS. In the process of approval of the system STUK may specify which structures will be involved in the Management system, which maintenance and repairs are allowed in the system,

31
how and when the actions have to be implemented, which safety level should be used in the timing system of actions which risks should be considered and which structures have to be submitted to special structural analyses. In this sense �STUK also monitors plant operational experience feedback and technical developments in the field, as well as the development of safety research and takes the necessary measures on their basis� / 3/.
2.5.3 Technical guiding methods and supplementary analyses
Technical guiding methods and supplementary analyses are designed to promote the strategic aims specified by the administration of the NPP (ref Chapter 2.5.2).
At the level of intervention planning, technical guiding methods may be special computer modules in the Service Life Management Process. They may be decision tree programmes which help or automate decision making for interventions for each specific case. Such decision trees take into account the material and structural properties of the treated structural module, its condition and environmental exposure and define the optimal action profile for the module. In an automatic planning system, the decision making for interventions is based on such decision trees. However, even in an automatic system, the designer is provided with the possibility to manually revise the prepared plans.
If there are only a few modules included in the SLMS, specific action profiles can be planned for the modules without decision trees. In this case the action profile is stored in the database. During the condition analysis the system gives timings for the specified actions.
At the level of annual resource planning the interventions are scheduled for implementation. The preliminary implementation plans are prepared and the costs are evaluated.
The designer may sometimes encounter a problem with cost management when the costs of interventions scheduled for a specific year exceed the budget. Then the designer should be able to rank the interventions, in the order of urgency, so that the more urgent actions are included in the plan and the others are postponed to later years when appropriate. In these situations, the designer can
32
apply analyses such as the MADA methods (MADA = Multiple Attribute Decision Aid) and QFD-methods (QFD = Quality Function Deployment).
The basic programme of the SLMS may not be able to manage the structural effects of material degradation with the precision that is required by the regulatory authority or the administration of the NPP. Then supplementary structural analyses are required by using other computer programmes. Such analyses would be e.g. 3-dimensional analyses in various loading situations carried out by FEM-programmes. The supplementary structural analyses also include risk analyses which are conducted for evaluating the risks of different kinds of accidents.
2.5.4 Database
Data in the system database must contribute to the objectives of the system and be consistent with the data input in the analyses. The decision making in the SLMS is based on specific component level data including information on materials, structural features, environmental stresses, condition and damages. The condition and damage data are collected during inspections of the structures.
A system database is the central data storage in a management system. The database involves a collection of inventory, administrative, structural, material, historical, and condition data of structures. A relational database with a hierarchical data structuring is required. Recommended features are:
• interactive data input and editing • advanced reporting capability • a mechanism for producing statistics from a selected data subset.
Data in the system database must be consistent with the parameters of the degradation and cost models. The information of the database must support the chosen module division of the NPP structures. The quality of information obtained as an output from the system is directly dependent on the quality of the data in the database. That is why all things that may possibly cause uncertainty in the inspection of structures should be given attention.

33
The consistency of the inspection system with the computer aided management system can be best guaranteed when the inspection blank-forms are output as a report of the system. Also the inspectors should be provided with written inspection instructions in which the most usual degradation types and damage types are described with the applied rankings and limit states.
2.5.5 Implementation of actions
The Process of the SLMS produces preliminary plans for interventions which are implemented by normal contracting practices. The final plans and contract documents are prepared by a structural designer.
2.5.6 Models
Models are a critical part of a SLMS. The reliability of the results of the system is much dependent on the models of the system. Three kinds of models are used in the processes of the System:
• Degradation models • Action effect models • Cost models
By degradation models the degradation rate of the structures and possible protections of structures are evaluated. Service life models can also be used in the evaluation of degradation rate and they can be considered as optional types of models for degradation models (ref. Chapter 4.2).
By action effect models the condition related effects of interventions are evaluated. These include both immediate effects of a intervention on the condition state and the effects on the rate of degradation after the intervention. The action effect models are specific to each intervention.
Cost models inform the unit costs of intervention actions as a function of different parameters. The unit costs may depend e.g. on repair area, repair depth, condition of the structure etc.
34
Usually at the time of starting of a new management system the degradation and cost models are still deficient. That is why an updating system for models is recommended. New information is gathered from inspections and the implemented interventions by which the degradation and cost models are improved. Thus the reliability of the results of the system is also improved.
2.5.7 Process of service life management
The planning of the upkeep of structures is performed on two levels: 1. Module level Action planning 2. Structural or NPP unit level Annual action and resource planning
The interventions are specified at the structural module level. When the automatic design method is used, the optimal life cycle action profiles (LCAPs) are defined by the decision trees and the optimal timing of interventions is determined by the automatic condition guarding system. The interventions can, however, be re-specified manually after the automatic action planning. The automatic condition guarding system is not working in the manual design mode.
The annual project and resource plans, i.e. annual work programmes, are prepared by the Management System at the NPP unit level. The interventions are sorted and prioritised and the number of projects is matched with the budget limit. At the NPP unit level it is often reasonable to combine actions which are timed near to each other to the same year of implementation. As a result a synergy profit may be gained. Both automatic and manual design methods can be used in annual project and resource planning.
The calculation processes of the SLMS are described in detail in Chapter 4.

35
3. Inpection system
3.1 General
The SLMS is supported by two kinds of inspections: • in-service inspections • special inspections.
The in-service inspections of NPP buildings are defined in the In-Service Inspection Guide /11/. By inspections the general safety and the reliability in use are ensured so that whenever changes in structures are observed the necessary repairs can be implemented in time. Special attention is paid to the structural parts that are important for the service life of the whole plant. Some in-service inspections related to the serviceability of coating etc. are defined in the Proactive Maintenance Programme of the NPP unit.
The special inspections are defined in the Special Inspection Guide (not yet available). These inspections are performed for particular structures in which exceptional performance has been observed. Special inspections can also be performed for any structures for the purpose of calibration of the degradation models by special inspection methods. The special inspection methods are based on small samples taken from structures or special non-destructive evaluation methods.
3.2 In-service inspections
The in-service inspections are performed periodically usually at intervals of 1�2 years. The inspections of containment are usually performed during annual shutdowns according to the in-service inspection guide.
The in-service inspections are divided into two parts: (1) visual on-site inspections and (2) monitoring and measurements. Visual on-site inspection can be characterised as a general inspection. Continuous monitoring and measurements are addressed to structures which are especially important for the performance of the unit.

36
3.2.1 Visual on-site inspections
By visual on-site inspections, general condition and performance are assessed. Also, questions related to service life of structures can be discussed based on the observations based on the on-site inspections. It is especially important to determine the cause of a possible damage (or the fault) and how it has evolved. The level of accuracy in the inspections is dependent on the structural part and is defined in the In-service inspection plan.
The possible damages, faults or imperfections are recorded in the database. Special attention is paid to: 1. Cracks 2. Moisture- and corrosion damages 3. Deficiencies in the performance of steel structures, such as doors, hatches,
other inlets, clip plates, etc. 4. Changes in coatings 5. Deficiencies in roof coverings 6. Water leakages in underground facilities.
3.2.2 Monitoring and measurements
The correct performance of critical structures and structural parts is ensured by continuous monitoring and annual measurements. Such critical structures for the performance and safety of the plant are containment, reactor building, turbine foundations, seawater channels, fuel basins and coatings in active facilities.
The monitoring and measurements programme contains the following 1. Deformation measurements 2. Temperature measurements 3. Surveillance of crack growth 4. Surveillance of possible leakages 5. Tightness of containment 6. Surveillance of properties of concrete, reinforcing steel, prestressing steel
and expansion joint materials 7. Monitoring and measurements in seawater channels 8. Surveillance of coatings.
37
The monitoring and measurements programme consists of research plans for different sub-areas. The research plans contain the following: 1. the area of the inspection 2. extent of the inspection 3. frequency of inspections (interval) 4. methods of inspection 5. results of inspection, storing and treatment 6. evaluation of the results of inspection 7. responsible organisation of the inspection.
3.3 Special inspections
Two types of special inspections can be distinguished: (1) those performed for the purpose of finding out the causes, characteristics and/or the extent of degradation e.g. for the final planning of repair, and (2) those performed for the calibration of degradation models. In the latter case, the purpose is only to find out the present condition of structures without having any plans for repair at the moment. The special inspections are usually based on samples taken from structures and laboratory studies or special non-destructive evaluation methods.
As it is not recommendable large concrete samples be taken from NPP structures. The sample size in the special inspections is small and the amount of samples should be reduced to the minimum. Optical methods have proved to be effective in finding out the causes of degradation and the present degree of degradation (such as internal cracking, carbonation etc.). From the concrete samples, thin sections are usually made with a subsequent study by both polarising and fluorescence microscopes. Both the physical and chemical changes in the concrete surfaces can be observed in the samples.
Non-destructive inspection methods which can be used during special inspections are e.g. ultra sound measurements, rebound hammer measurements, potential and polarisation resistance measurements, X-ray photography, etc.
The final aim is that every structural module included in the SLMS would be inspected by special methods. However, high activity or hard accessibility may prevent taking samples from some modules.
38
3.4 Modulation of structures
Structures are divided into structural modules for service life management. The purpose of the modulation is:
• dividing concrete structures into homogenous areas • providing a system for documentation of damage observations.
The modules are fabricated of the same material and are exposed to the same environmental influences. The principle is that structural parts belonging to the same module can be inspected, analysed and planned without being divided into smaller parts. For instance several columns, beams, slabs or walls can be treated in the same module if they are materially and structurally similar and surrounded by same environmental conditions. On the other hand a column or a wall which is exposed partly to different environmental conditions should be divided into different modules accordingly.
39
4. Evaluation of future condition and service life
4.1 General
Two kinds of deterioration in structures can be distinguished:
Degradation is deterioration which can be predicted and the rate of which can be evaluated by degradation models
Damages are deterioration which can hardly be predicted by degradation models as they occur only accidentally. The occurrence of damages can be detected by visual inspections.
In practice all modes of deterioration that cannot be predicted by degradation models are treated as damages. Treatment of damages is reactive i.e. they are first considered when the inspector has registered them in the database. As for damages, the inspector registers everything that is necessary to define the damage and the intervention for the damage. For every observation of damage the following data is given by the inspector:
• damage type, • degree of damage, • degree of urgency, • intervention, and • area of repair.
On the other hand, many types of deterioration can be treated predictively i.e. the course of the degradation process and the timings of actions are determined based on degradation models.
4.2 Modelling of degradation and service life
The degradation of a structural part or a protective system with time is described by mathematical models. Two methods can be used in the modelling: degradation models or service life models. A degradation model presents the average degree of degradation with time (or age). A service life model expresses

40
the time from the fabrication of the structure or a protective system to the time when the structure or the protective system has attained the limit state (limit degree of degradation) on average.
Both degradation and service life models contain parameters can be classified in the following categories /7/: pA material parameters pB parameters related to structural details or design pC parameters related to the wokmanship pD parameters related to internal stresses pE parameters related to external stresses (environmental exposure) pF parameters related to in-service stresses pG parameters related to the level of maintenance.
The parameters of the models must be consistent with the initial data in the database.
4.2.1 Degradation models
A degradation model is a mathematical formula in which the degree of degradation is presented as a function of time /12, 13/.
)()( tfNtN LS ⋅= (1)
In the formula NLS is a limit state corresponding to the service life with the degradation scale
0, 1, 2, 3 ...NLS N the degree of degradation (in the degradation scale 0, 1, 2, 3 ...NLS), f(t) the basic degradation function, which gets a value 0 at the start of the
service life and 1 at the end of the service life, and t time (age) in years.
In many cases the form of the basic degradation model is an exponential function:
)t(N

41
ntaf ⋅= (2)
nLS taNN ⋅⋅=
(3)
where a is a coefficient and n an exponent of time
The coefficient a depends on the above mentioned p-parameters, i.e. materials, structural features, workmanship etc.
),,,,,,( GFEDCBA pppppppaa = (4)
The exponent of time may also be dependent on some of the above mentioned parameters.
Depending on the exponent, the rate of degradation can be: n < 1 decelerating n = 1 linear (uniform) n > 1 accelerating
4.2.2 Service life models
A service life model is a mathematical formula which expresses the average service of a structure or a system as a function of parameters. A service life model can contain parameters related to materials, structural features, workmanship, environmental condition etc.
),,,,,,( GFEDCBALL ppppppptt = (5)
where tL is the service life (in years)
42
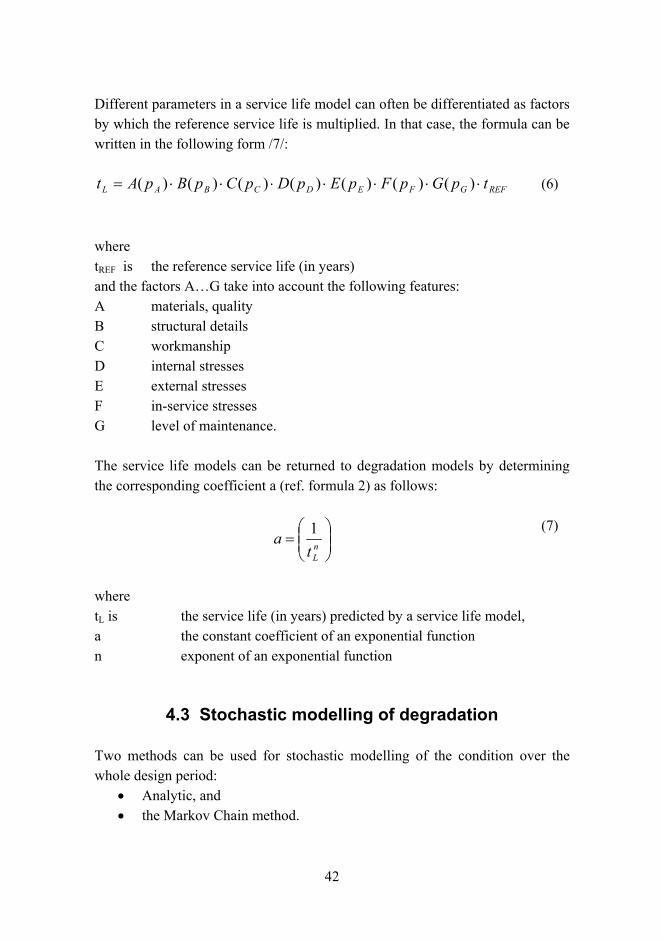
Different parameters in a service life model can often be differentiated as factors by which the reference service life is multiplied. In that case, the formula can be written in the following form /7/:
REFGFEDCBAL tpGpFpEpDpCpBpAt ⋅⋅⋅⋅⋅⋅⋅= )()()()()()()(
(6)
where tREF is the reference service life (in years) and the factors A�G take into account the following features: A materials, quality B structural details C workmanship D internal stresses E external stresses F in-service stresses G level of maintenance.
The service life models can be returned to degradation models by determining the corresponding coefficient a (ref. formula 2) as follows:
⎟⎟⎠
⎞⎜⎜⎝
⎛= n
Lta 1
(7)
where tL is the service life (in years) predicted by a service life model, a the constant coefficient of an exponential function n exponent of an exponential function
4.3 Stochastic modelling of degradation
Two methods can be used for stochastic modelling of the condition over the whole design period:
• Analytic, and • the Markov Chain method.
43
In the analytic method the distribution of degradation is assumed to follow well-known mathematical distribution functions. The scatter of degradation and service life are determined accordingly. In the Markov Chain method, condition transitions of the structure from one condition state to another are assumed to occur periodically with a certain probability. This assumption and the chain calculation gives an impression of natural-like spread. In both cases the degradation models presented in Chapter 4.2. define the average degradation.
4.3.1 Principles of the analytic method
In the analytic method, it is assumed that there is a spread around an average degradation. Because of this spread there is also a variation in the time of attaining the limit state of degradation, i.e. service life. The average degradation is determined using the degradation models described in Chapter 4.2.
The spread around the average degradation is assumed to follow well-known mathematical distribution functions. The most usual functions to choose from are the following:
• normal (Gaussian) distribution • log-normal distribution • exponential distribution • Weibul distribution, and • gamma distribution.
As the degradation cannot be negative, the real distribution of degradation is obviously skewed. That is why log-normal, exponential, Weibul and gamma-distributions are preferable over the normal distribution. However, if only the other tail of the distribution is used, the normal distribution cannot always be excluded.
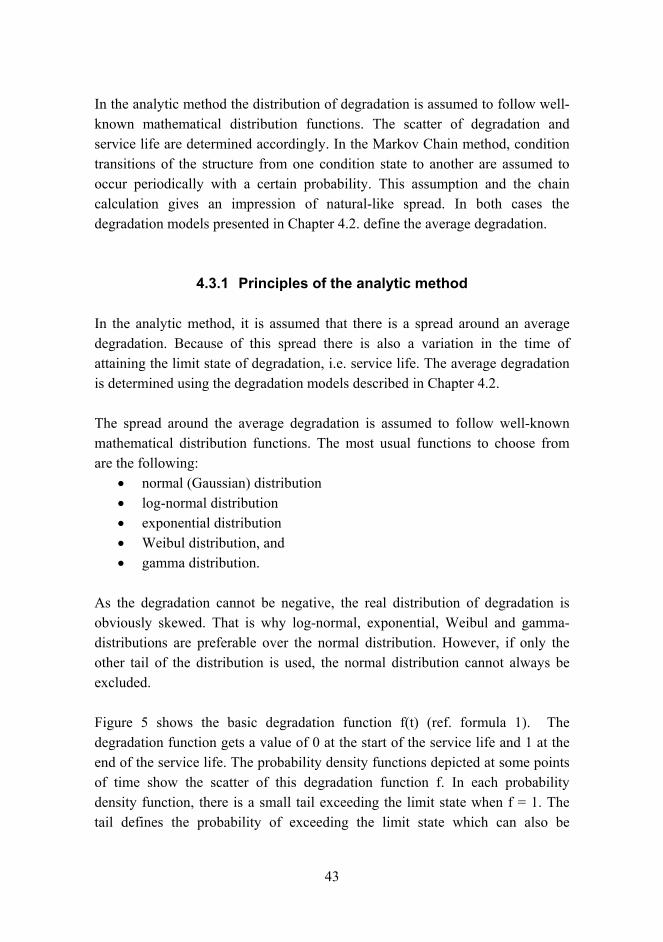
Figure 5 shows the basic degradation function f(t) (ref. formula 1). The degradation function gets a value of 0 at the start of the service life and 1 at the end of the service life. The probability density functions depicted at some points of time show the scatter of this degradation function f. In each probability density function, there is a small tail exceeding the limit state when f = 1. The tail defines the probability of exceeding the limit state which can also be

44
interpreted as the probability of time t exceeding the service life tL. The function P{t>tL} is a distribution function increasing from 0 to 1.
Figure 5. Principle of determination the service life distribution function.
In the following section only the log-normal distribution is studied in more detail.
Log-normal distribution
Let us assume that the degradation function is of the type presented in Equation 1. Then average degradation is:
)()( tNN =µ (8)
and the standard deviation of N is
)()( NVN N µσ ⋅= (9)
Function f(t)
1
Time (t) 0
Average f(t)
Function P{t>tL}
45
where N is the degree of degradation, and
VN the coefficient of variation ( )()(
NNVN µ
σ=
)
According to the definition of a log-normal distribution, the function Y = ln(N) is normally distributed. The mean and the standard deviation of Y can be determined from the following formulas:
)1ln()( 22NVYs +=
(10)
)(5.0)(ln)( 2 YsYYm ⋅−= µ (11)
The probability of the service life being shorter than a certain time t is as follows:
)()ln()ln(ln)()( βθ −=>=>=>=> LSLSLSL NYPNNPNNPttP (12)
where θ is the cumulative density function of the standard normal distribution (µ = 0, σ = 1) and
)(ln)(
YstYm −
=β
(13)
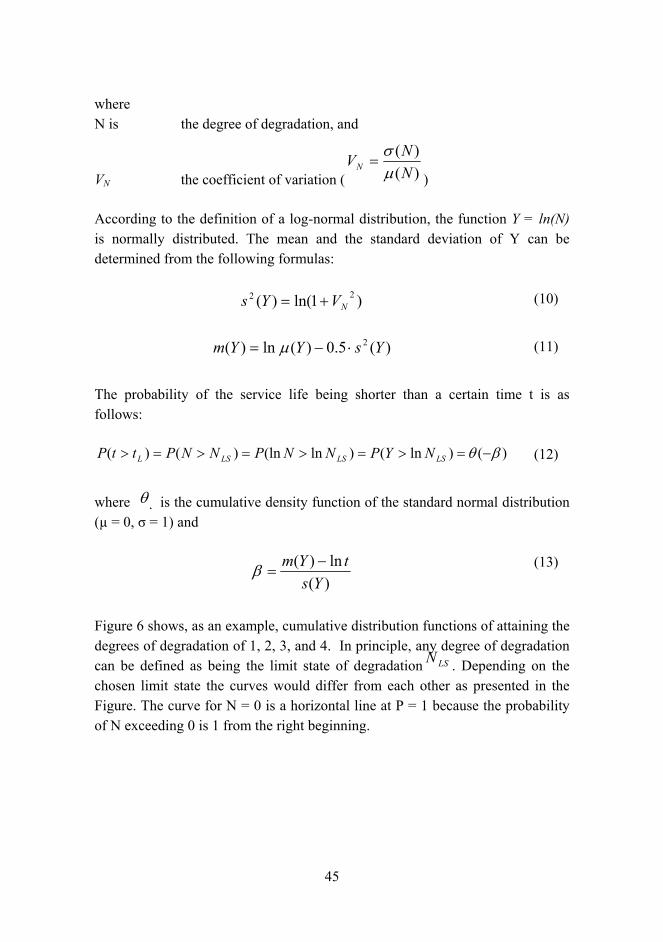
Figure 6 shows, as an example, cumulative distribution functions of attaining the degrees of degradation of 1, 2, 3, and 4. In principle, any degree of degradation can be defined as being the limit state of degradation LSN . Depending on the chosen limit state the curves would differ from each other as presented in the Figure. The curve for N = 0 is a horizontal line at P = 1 because the probability of N exceeding 0 is 1 from the right beginning.
46
0,0
0,2
0,4
0,6
0,8
1,0
0 10 20 30 40 50
Time (year)
Cum
ulat
ive
prob
abili
ty0
1
2
3
4
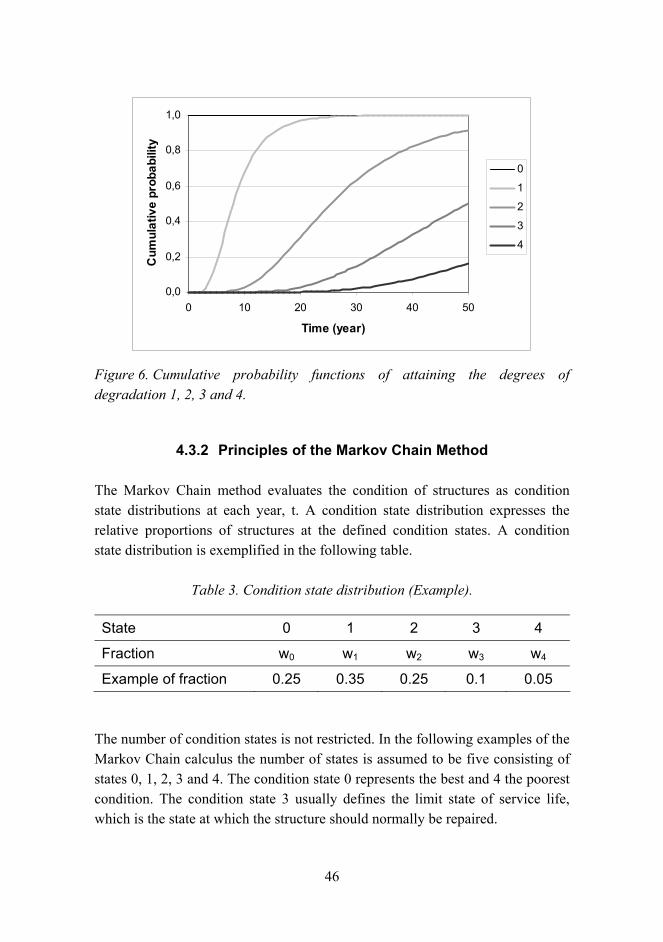
Figure 6. Cumulative probability functions of attaining the degrees of degradation 1, 2, 3 and 4.
4.3.2 Principles of the Markov Chain Method
The Markov Chain method evaluates the condition of structures as condition state distributions at each year, t. A condition state distribution expresses the relative proportions of structures at the defined condition states. A condition state distribution is exemplified in the following table.
Table 3. Condition state distribution (Example).
State 0 1 2 3 4
Fraction w0 w1 w2 w3 w4
Example of fraction 0.25 0.35 0.25 0.1 0.05
The number of condition states is not restricted. In the following examples of the Markov Chain calculus the number of states is assumed to be five consisting of states 0, 1, 2, 3 and 4. The condition state 0 represents the best and 4 the poorest condition. The condition state 3 usually defines the limit state of service life, which is the state at which the structure should normally be repaired.
47
The fraction of structures can be determined in any functional unit of measure suitable for the case (volume, area, length or piece). When predicting the condition of structures by the Markov Chain method, the condition state vector is interpreted as expressing the probability of a structure to be at any of the condition states in the future. The sum of all fractions in a condition state vector must always be 1.
The changes in condition states as a result of both degradation and interventions are evaluated by transition probability matrices. The condition state distribution of each year is obtained by multiplying the condition state vector of the previous year by the transition probability matrix. Mathematically the principle is presented in Equation 14. By repeated multiplication the condition state distributions can be predicted over time up to several years or even tens of years.
PtWtW *)1()( −= (14)
where W(t) is condition state distribution of year t and P transition probability matrix.
There are two kinds of transition probability matrices: • Degradation matrices • Action effect matrices.
Degradation matrices are applied in years when repairs are not performed, i.e. the changes in the condition state distribution result only from degradation. The action effect matrices predict the condition state distribution, as it will be after the repair. They are applied only in those years during which repairs are performed. Accordingly, by the help of the Markov Chain, it is possible to reproduce the condition of a structure during the whole time frame as a series of sequential annual condition state distributions. The treated time frame may include various maintenance and repairs such as coatings, other predictive maintenance actions, repairs and renewals.

48
Degradation matrices
Usually the form of a degradation matrix is assumed to be as the one presented in Table 4. The elements of a transition probability matrix express the probability that a structure, which at the beginning of a year was at condition state i (vertical direction), will be at the end of the year at condition state j (horizontal direction). The transition probabilities are normally assumed to be constants, i.e. they are not dependent on time. In principle the step of time can vary but in this application it is one year.
It has been assumed in the table that within one year the structure either stays at the same condition state where it was at the beginning of that year or it drops to the next state, i.e. dropping more than 1 state in a year is not possible. Accordingly, most of the transition probabilities are 0. Only the diagonal probabilities, i.e. the probabilities that a structure stays at the same condition state and the probabilities next to the right of them expressing the probability that the structure will be transited to the next state during a year, are non-zero elements. The sum of transition probabilities in each row must be 1 (pi;i + pi;i+1 =1).
Table 4. Transition probability matrix for degradation (5 state system).
State 0 1 2 3 4
0 p00 p01 0 0 0
1 0 p11 p12 0 0
2 0 0 p22 p23 0
3 0 0 0 p33 p34
4 0 0 0 0 1
The transition probabilities of degradation matrices are determined automatically from previously developed degradation model functions by special conversion methods. So the information included in the material, structural and environmental parameters of the model functions are automatically transferred to the transition probabilities of degradation matrices.
49
The "drop-from-state" transition probabilities, pi,i+1, can be deduced from the scaled degradation model functions (ref. Chapter 4.2) by derivation of the model function and determination of the average value of the derivative within the interval of the states i and i+1.
1;
'1;1;
))(()(+
++ ⎟⎠⎞
⎜⎝⎛
∂∂
==ii
iiii ttNtNp
(15)
where pi;i+1 is transition probability from stat i to state i+1 N(t) a degradation function (ref. Chapter 4.2). N is the degree of
degradation and is considered to be the same as condition state.
The average value of the derivative can be determined either by calculating the value of the derivative in several points within the range i; i+1 or by determining the value of the derivative in a point that is proved to optimally represent the average.
The "Remain-in-state" transition probabilities, pi;i, can be determined by subtracting the corresponding "drop-from-state" probability from 1.
1;; 1 +−= iiii pp (16)
At the lower right corner of the matrix the value of the probability element is always 1 as the structures in the highest possible condition state always stay at the same condition state.
The condition state vector after n years is predicted by multiplying the initial condition state vector, W(0), by the transition matrix n times in the row, as shown in the example of Figure 7. In this example the limit condition state of service life has been defined to be 3 (N = 3). The state 4 is assumed to be a "terminal state", i.e. an extra state where all structures finally end up. All structures in this case start off in perfect condition, so the initial damage index distribution is | 1, 0, 0, 0, 0 |.
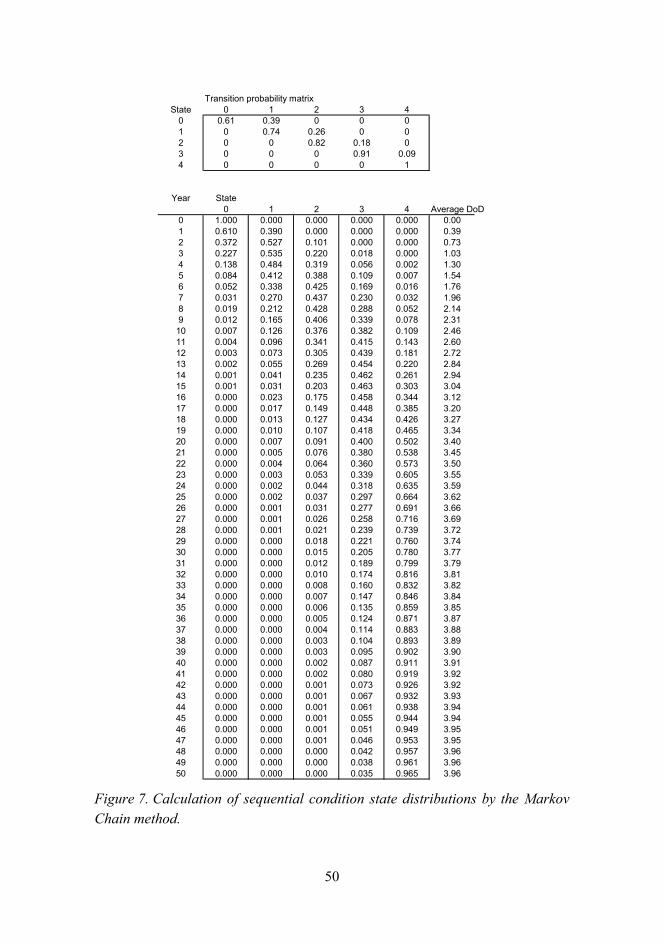
50
Transition probability matrixState 0 1 2 3 4
0 0.61 0.39 0 0 01 0 0.74 0.26 0 02 0 0 0.82 0.18 03 0 0 0 0.91 0.094 0 0 0 0 1
Year State0 1 2 3 4 Average DoD
0 1.000 0.000 0.000 0.000 0.000 0.001 0.610 0.390 0.000 0.000 0.000 0.392 0.372 0.527 0.101 0.000 0.000 0.733 0.227 0.535 0.220 0.018 0.000 1.034 0.138 0.484 0.319 0.056 0.002 1.305 0.084 0.412 0.388 0.109 0.007 1.546 0.052 0.338 0.425 0.169 0.016 1.767 0.031 0.270 0.437 0.230 0.032 1.968 0.019 0.212 0.428 0.288 0.052 2.149 0.012 0.165 0.406 0.339 0.078 2.3110 0.007 0.126 0.376 0.382 0.109 2.4611 0.004 0.096 0.341 0.415 0.143 2.6012 0.003 0.073 0.305 0.439 0.181 2.7213 0.002 0.055 0.269 0.454 0.220 2.8414 0.001 0.041 0.235 0.462 0.261 2.9415 0.001 0.031 0.203 0.463 0.303 3.0416 0.000 0.023 0.175 0.458 0.344 3.1217 0.000 0.017 0.149 0.448 0.385 3.2018 0.000 0.013 0.127 0.434 0.426 3.2719 0.000 0.010 0.107 0.418 0.465 3.3420 0.000 0.007 0.091 0.400 0.502 3.4021 0.000 0.005 0.076 0.380 0.538 3.4522 0.000 0.004 0.064 0.360 0.573 3.5023 0.000 0.003 0.053 0.339 0.605 3.5524 0.000 0.002 0.044 0.318 0.635 3.5925 0.000 0.002 0.037 0.297 0.664 3.6226 0.000 0.001 0.031 0.277 0.691 3.6627 0.000 0.001 0.026 0.258 0.716 3.6928 0.000 0.001 0.021 0.239 0.739 3.7229 0.000 0.000 0.018 0.221 0.760 3.7430 0.000 0.000 0.015 0.205 0.780 3.7731 0.000 0.000 0.012 0.189 0.799 3.7932 0.000 0.000 0.010 0.174 0.816 3.8133 0.000 0.000 0.008 0.160 0.832 3.8234 0.000 0.000 0.007 0.147 0.846 3.8435 0.000 0.000 0.006 0.135 0.859 3.8536 0.000 0.000 0.005 0.124 0.871 3.8737 0.000 0.000 0.004 0.114 0.883 3.8838 0.000 0.000 0.003 0.104 0.893 3.8939 0.000 0.000 0.003 0.095 0.902 3.9040 0.000 0.000 0.002 0.087 0.911 3.9141 0.000 0.000 0.002 0.080 0.919 3.9242 0.000 0.000 0.001 0.073 0.926 3.9243 0.000 0.000 0.001 0.067 0.932 3.9344 0.000 0.000 0.001 0.061 0.938 3.9445 0.000 0.000 0.001 0.055 0.944 3.9446 0.000 0.000 0.001 0.051 0.949 3.9547 0.000 0.000 0.001 0.046 0.953 3.9548 0.000 0.000 0.000 0.042 0.957 3.9649 0.000 0.000 0.000 0.038 0.961 3.9650 0.000 0.000 0.000 0.035 0.965 3.96
Figure 7. Calculation of sequential condition state distributions by the Markov Chain method.

51
The expectation value of the degree of degradation (N = DoD) is obtained by multiplying the scale vector R = ¦ 0, 1, 2, 3, 4 ¦ by the condition state distribution, as shown in Equation 17.
RtWtE *)()( = (17)
where E(t) is expectation value for the degree of damage (= average) R scale vector comprised of the numerical values of condition states.
The probability density functions and the cumulative probability functions for the states 0...4 are depicted in Figures 8 and 9 according to the calculations in Figure 7.
0,0
0,2
0,4
0,6
0,8
1,0
0 10 20 30 40 50Time (year)
Prob
abili
ty d
ensi
ty 01234
Figure 8. Probability density functions for condition states (= degrees of damage) 0�4 calculated by the Markov Chain method.
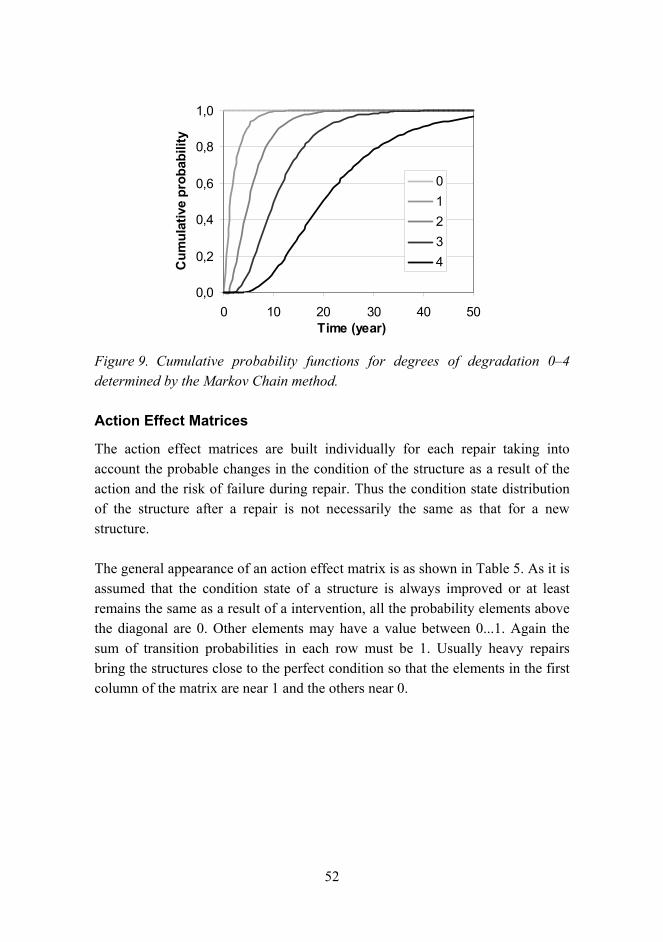
52
0,0
0,2
0,4
0,6
0,8
1,0
0 10 20 30 40 50Time (year)
Cum
ulat
ive
prob
abili
ty01234
Figure 9. Cumulative probability functions for degrees of degradation 0�4 determined by the Markov Chain method.
Action Effect Matrices
The action effect matrices are built individually for each repair taking into account the probable changes in the condition of the structure as a result of the action and the risk of failure during repair. Thus the condition state distribution of the structure after a repair is not necessarily the same as that for a new structure.
The general appearance of an action effect matrix is as shown in Table 5. As it is assumed that the condition state of a structure is always improved or at least remains the same as a result of a intervention, all the probability elements above the diagonal are 0. Other elements may have a value between 0...1. Again the sum of transition probabilities in each row must be 1. Usually heavy repairs bring the structures close to the perfect condition so that the elements in the first column of the matrix are near 1 and the others near 0.

53
Table 5. Transition probability matrix for intervention effects (5 state system).
State 0 1 2 3 4
0 p00 0 0 0 0
1 p10 p11 0 0 0
2 p20 p21 p22 0 0
3 p30 p31 p32 p33 0
4 p40 p41 p42 p43 p44
A repair may also have an impact on the rate of degradation after the repair. If the rate of degradation is expected to be changed after an intervention, the degradation matrix is changed respectively.
4.4 Condition controlled life cycle cost analysis
If a condition is controlled life cycle cost analysis, actions are scheduled automatically. The principle of triggering actions in a Markov Chain life cycle table is presented in Figure 10. The sequential annual condition state distributions have been determined by Markov Chain on the left side of the figure. They show the probability of the component to be at any of the condition states at any time. In the middle of the figure the respective cumulative probabilities which express the probability of exceeding or being equal to any of the condition states are presented. In this example condition state 3 was selected for the limit condition state and 50 % as the maximum allowable probability for exceeding the limit condition state. If this criterion is exceeded during a year, a repair will be performed in the next year. The action effects on the condition state distribution of the structure are obtained by multiplying the condition state distribution of the year by the action effect matrix in the upper left corner. At the same time the repair costs are added in the cost counters in the right side of the figure. In other years only the increase of degradation is evaluated by the degradation matrix that is situated below the action effect matrix.

54
Transition probability matrix for repair actionState 0 1 2 3 4
0 1.00 0 0 0 0 LC COSTS PER UNIT AREA1 0.95 0.05 0 0 0 Cumulative real costs 600 Euro/m2
2 0.92 0.05 0.03 0 0 Cumulative PV costs 221 Euro/m2
3 0.90 0.05 0.03 0.02 0 Average annual costs 12.00 Euro/m2/year4 0.88 0.05 0.03 0.02 0.02 Equalised annual costs 9.90 Euro/m2/year
TOTAL LC COSTSTransition probability matrix for degradation Cumulative real costs 30000 Euro
State 0 1 2 3 4 Cumulative PV costs 11059 Euro0 0.330 0.670 0 0 0 Average annual costs 600 Euro/year1 0 0.662 0.338 0 0 Equalised annual costs 495 Euro/year2 0 0 0.765 0.235 0 REPAIR CRITERIA3 0 0 0 0.814 0.186 Limit state 3 (2 or 3)4 0 0 0 0 1 Max Proba 0.5 (0.01-0.99)
Condition state distributions Cumulative distributions Condition LC costs Discount LC costsYear State (DoD) Average DoD State (DoD) fulfilled real factor discounted
0 1 2 3 4 0 1 2 3 40 1.000 0.000 0.000 0.000 0.000 0.00 1.000 0.000 0.000 0.000 0.000 0 1.000 01 0.330 0.670 0.000 0.000 0.000 0.67 1.000 0.670 0.000 0.000 0.000 0 0.962 02 0.109 0.664 0.227 0.000 0.000 1.12 1.000 0.891 0.227 0.000 0.000 0 0.925 03 0.036 0.513 0.398 0.053 0.000 1.47 1.000 0.964 0.451 0.053 0.000 0 0.889 04 0.012 0.363 0.478 0.137 0.010 1.77 1.000 0.988 0.625 0.147 0.010 0 0.855 05 0.004 0.248 0.488 0.224 0.035 2.04 1.000 0.996 0.748 0.259 0.035 0 0.822 06 0.001 0.167 0.457 0.297 0.077 2.28 1.000 0.999 0.832 0.374 0.077 0 0.790 07 0.000 0.111 0.406 0.350 0.132 2.50 1.000 1.000 0.888 0.482 0.132 0 0.760 08 0.000 0.074 0.348 0.380 0.197 2.70 1.000 1.000 0.926 0.578 0.197 1 0 0.731 09 0.907 0.050 0.028 0.012 0.004 0.16 1.000 0.093 0.043 0.015 0.004 100 0.703 70
10 0.300 0.640 0.038 0.016 0.006 0.79 1.000 0.700 0.060 0.022 0.006 100 0.676 7011 0.099 0.624 0.246 0.022 0.009 1.22 1.000 0.901 0.277 0.031 0.009 100 0.650 7012 0.033 0.479 0.399 0.076 0.013 1.56 1.000 0.967 0.488 0.089 0.013 100 0.625 7013 0.011 0.339 0.467 0.156 0.027 1.85 1.000 0.989 0.650 0.183 0.027 100 0.601 7014 0.004 0.232 0.472 0.237 0.056 2.11 1.000 0.996 0.765 0.293 0.056 100 0.577 7015 0.001 0.156 0.439 0.304 0.100 2.35 1.000 0.999 0.843 0.404 0.100 100 0.555 7016 0.000 0.104 0.389 0.351 0.157 2.56 1.000 1.000 0.896 0.507 0.157 1 100 0.534 7017 0.910 0.050 0.027 0.010 0.003 0.15 1.000 0.090 0.040 0.013 0.003 200 0.513 12218 0.301 0.642 0.037 0.015 0.005 0.78 1.000 0.699 0.057 0.020 0.005 200 0.494 12219 0.099 0.626 0.246 0.021 0.008 1.21 1.000 0.901 0.274 0.028 0.008 200 0.475 12220 0.033 0.481 0.400 0.075 0.012 1.55 1.000 0.967 0.486 0.086 0.012 200 0.456 12221 0.011 0.340 0.469 0.155 0.025 1.84 1.000 0.989 0.649 0.180 0.025 200 0.439 12222 0.004 0.232 0.473 0.236 0.054 2.11 1.000 0.996 0.764 0.291 0.054 200 0.422 12223 0.001 0.156 0.441 0.304 0.098 2.34 1.000 0.999 0.843 0.402 0.098 200 0.406 12224 0.000 0.104 0.390 0.351 0.155 2.56 1.000 1.000 0.896 0.506 0.155 1 200 0.390 12225 0.910 0.050 0.027 0.010 0.003 0.15 1.000 0.090 0.040 0.013 0.003 300 0.375 15926 0.301 0.642 0.037 0.015 0.005 0.78 1.000 0.699 0.057 0.020 0.005 300 0.361 15927 0.099 0.626 0.246 0.021 0.008 1.21 1.000 0.901 0.274 0.028 0.008 300 0.347 15928 0.033 0.481 0.400 0.075 0.012 1.55 1.000 0.967 0.486 0.086 0.012 300 0.333 15929 0.011 0.340 0.469 0.155 0.025 1.84 1.000 0.989 0.649 0.180 0.025 300 0.321 15930 0.004 0.232 0.473 0.236 0.054 2.11 1.000 0.996 0.764 0.291 0.054 300 0.308 15931 0.001 0.156 0.441 0.304 0.098 2.34 1.000 0.999 0.843 0.402 0.098 300 0.296 15932 0.000 0.104 0.390 0.351 0.155 2.56 1.000 1.000 0.896 0.506 0.155 1 300 0.285 15933 0.910 0.050 0.027 0.010 0.003 0.15 1.000 0.090 0.040 0.013 0.003 400 0.274 18734 0.301 0.642 0.037 0.015 0.005 0.78 1.000 0.699 0.057 0.020 0.005 400 0.264 18735 0.099 0.626 0.246 0.021 0.008 1.21 1.000 0.901 0.274 0.028 0.008 400 0.253 18736 0.033 0.481 0.400 0.075 0.012 1.55 1.000 0.967 0.486 0.086 0.012 400 0.244 18737 0.011 0.340 0.469 0.155 0.025 1.84 1.000 0.989 0.649 0.180 0.025 400 0.234 18738 0.004 0.232 0.473 0.236 0.054 2.11 1.000 0.996 0.764 0.291 0.054 400 0.225 18739 0.001 0.156 0.441 0.304 0.098 2.34 1.000 0.999 0.843 0.402 0.098 400 0.217 18740 0.000 0.104 0.390 0.351 0.155 2.56 1.000 1.000 0.896 0.506 0.155 1 400 0.208 18741 0.910 0.050 0.027 0.010 0.003 0.15 1.000 0.090 0.040 0.013 0.003 500 0.200 20742 0.301 0.642 0.037 0.015 0.005 0.78 1.000 0.699 0.057 0.020 0.005 500 0.193 20743 0.099 0.626 0.246 0.021 0.008 1.21 1.000 0.901 0.274 0.028 0.008 500 0.185 20744 0.033 0.481 0.400 0.075 0.012 1.55 1.000 0.967 0.486 0.086 0.012 500 0.178 20745 0.011 0.340 0.469 0.155 0.025 1.84 1.000 0.989 0.649 0.180 0.025 500 0.171 20746 0.004 0.232 0.473 0.236 0.054 2.11 1.000 0.996 0.764 0.291 0.054 500 0.165 20747 0.001 0.156 0.441 0.304 0.098 2.34 1.000 0.999 0.843 0.402 0.098 500 0.158 20748 0.000 0.104 0.390 0.351 0.155 2.56 1.000 1.000 0.896 0.506 0.155 1 500 0.152 20749 0.910 0.050 0.027 0.010 0.003 0.15 1.000 0.090 0.040 0.013 0.003 600 0.146 22150 0.301 0.642 0.037 0.015 0.005 0.78 1.000 0.699 0.057 0.020 0.005 600 0.141 221
Figure 10. Principles for the determination of condition state distributions, triggering of actions and calculation of life cycle costs /12/.
In Figure 11 the principles for determination of condition state distributions, triggering of actions and calculation of life cycle costs by the analytic method is presented. Log-normal distribution was used in this example. The method of triggering actions is the same as in Figure 10. In this case the condition of the

55
structure is assumed to return after the repair to a defined degree of degradation (not necessarily 0). This degree of degradation corresponds to certain time, t0, in the course of the function N(t). So every time when a repair is performed the time for function N(t) starts newly from t0.
LC DATA REPAIR CRITERIA LC COSTS PER UNIT AREADesign period 50 years Limit state 3 (2 or 3) Cumulative real costs 300 Euro/m2
Rate of interest 4.00 % Max Probability 0.5 (0.01-0.99) Cumulative PV costs 65 Euro/m2
Average annual costs 6.00 Euro/m2/yearDEGRADATION CURVE REPAIR DATA Equalised annual costs 2.91 Euro/m2/yearCoefficient c 0.5 (c = 3a) Repair costs 100 Euro/m2
Exponent n 0.6 Surface area 50 m2 TOTAL LC COSTSCumulative real costs 15000 Euro
AFTER REPAIR Cumulative PV costs 3246 EuroCondition state 0.40 Average annual costs 300 Euro/yearcorresponding to 1.00 years Equalised annual costs 145 Euro/year
Cumulative probability distributions Repair criteria LC costs Discount LC costsN(t) VN s2
s m Year from Year State (DoD) fulfilled real factor discountedlast repair from beginning 0 1 2 3 4
0.00 0.30 0.086178 0.29356 -11.56 0 0 1.000 0.000 0.000 0.000 0.000 0 1.000 00.50 0.30 0.086178 0.29356 -0.74 1 1 1.000 0.006 0.000 0.000 0.000 0 0.962 00.76 0.30 0.086178 0.29356 -0.32 2 2 1.000 0.138 0.000 0.000 0.000 0 0.925 00.97 0.30 0.086178 0.29356 -0.08 3 3 1.000 0.396 0.004 0.000 0.000 0 0.889 01.15 0.30 0.086178 0.29356 0.10 4 4 1.000 0.628 0.021 0.000 0.000 0 0.855 01.31 0.30 0.086178 0.29356 0.23 5 5 1.000 0.783 0.057 0.002 0.000 0 0.822 01.47 0.30 0.086178 0.29356 0.34 6 6 1.000 0.876 0.114 0.005 0.000 0 0.790 01.61 0.30 0.086178 0.29356 0.43 7 7 1.000 0.929 0.186 0.012 0.001 0 0.760 01.74 0.30 0.086178 0.29356 0.51 8 8 1.000 0.959 0.268 0.023 0.001 0 0.731 01.87 0.30 0.086178 0.29356 0.58 9 9 1.000 0.976 0.353 0.039 0.003 0 0.703 01.99 0.30 0.086178 0.29356 0.65 10 10 1.000 0.986 0.435 0.061 0.006 0 0.676 02.11 0.30 0.086178 0.29356 0.70 11 11 1.000 0.992 0.513 0.089 0.010 0 0.650 02.22 0.30 0.086178 0.29356 0.75 12 12 1.000 0.995 0.583 0.121 0.016 0 0.625 02.33 0.30 0.086178 0.29356 0.80 13 13 1.000 0.997 0.646 0.157 0.023 0 0.601 02.44 0.30 0.086178 0.29356 0.85 14 14 1.000 0.998 0.700 0.196 0.033 0 0.577 02.54 0.30 0.086178 0.29356 0.89 15 15 1.000 0.999 0.747 0.237 0.045 0 0.555 02.64 0.30 0.086178 0.29356 0.93 16 16 1.000 0.999 0.787 0.280 0.059 0 0.534 02.74 0.30 0.086178 0.29356 0.96 17 17 1.000 0.999 0.822 0.323 0.075 0 0.513 02.83 0.30 0.086178 0.29356 1.00 18 18 1.000 1.000 0.850 0.366 0.093 0 0.494 02.93 0.30 0.086178 0.29356 1.03 19 19 1.000 1.000 0.875 0.408 0.113 0 0.475 03.02 0.30 0.086178 0.29356 1.06 20 20 1.000 1.000 0.895 0.449 0.134 0 0.456 03.11 0.30 0.086178 0.29356 1.09 21 21 1.000 1.000 0.912 0.489 0.157 0 0.439 03.19 0.30 0.086178 0.29356 1.12 22 22 1.000 1.000 0.926 0.527 0.181 1 0 0.422 00.50 0.30 0.086178 0.29356 -0.74 1 23 1.000 0.006 0.000 0.000 0.000 100 0.406 410.76 0.30 0.086178 0.29356 -0.32 2 24 1.000 0.138 0.000 0.000 0.000 100 0.390 410.97 0.30 0.086178 0.29356 -0.08 3 25 1.000 0.396 0.004 0.000 0.000 100 0.375 411.15 0.30 0.086178 0.29356 0.10 4 26 1.000 0.628 0.021 0.000 0.000 100 0.361 411.31 0.30 0.086178 0.29356 0.23 5 27 1.000 0.783 0.057 0.002 0.000 100 0.347 411.47 0.30 0.086178 0.29356 0.34 6 28 1.000 0.876 0.114 0.005 0.000 100 0.333 411.61 0.30 0.086178 0.29356 0.43 7 29 1.000 0.929 0.186 0.012 0.001 100 0.321 411.74 0.30 0.086178 0.29356 0.51 8 30 1.000 0.959 0.268 0.023 0.001 100 0.308 411.87 0.30 0.086178 0.29356 0.58 9 31 1.000 0.976 0.353 0.039 0.003 100 0.296 411.99 0.30 0.086178 0.29356 0.65 10 32 1.000 0.986 0.435 0.061 0.006 100 0.285 412.11 0.30 0.086178 0.29356 0.70 11 33 1.000 0.992 0.513 0.089 0.010 100 0.274 412.22 0.30 0.086178 0.29356 0.75 12 34 1.000 0.995 0.583 0.121 0.016 100 0.264 412.33 0.30 0.086178 0.29356 0.80 13 35 1.000 0.997 0.646 0.157 0.023 100 0.253 412.44 0.30 0.086178 0.29356 0.85 14 36 1.000 0.998 0.700 0.196 0.033 100 0.244 412.54 0.30 0.086178 0.29356 0.89 15 37 1.000 0.999 0.747 0.237 0.045 100 0.234 412.64 0.30 0.086178 0.29356 0.93 16 38 1.000 0.999 0.787 0.280 0.059 100 0.225 412.74 0.30 0.086178 0.29356 0.96 17 39 1.000 0.999 0.822 0.323 0.075 100 0.217 412.83 0.30 0.086178 0.29356 1.00 18 40 1.000 1.000 0.850 0.366 0.093 100 0.208 412.93 0.30 0.086178 0.29356 1.03 19 41 1.000 1.000 0.875 0.408 0.113 100 0.200 413.02 0.30 0.086178 0.29356 1.06 20 42 1.000 1.000 0.895 0.449 0.134 100 0.193 413.11 0.30 0.086178 0.29356 1.09 21 43 1.000 1.000 0.912 0.489 0.157 100 0.185 413.19 0.30 0.086178 0.29356 1.12 22 44 1.000 1.000 0.926 0.527 0.181 1 100 0.178 410.50 0.30 0.086178 0.29356 -0.74 1 45 1.000 0.006 0.000 0.000 0.000 200 0.171 580.76 0.30 0.086178 0.29356 -0.32 2 46 1.000 0.138 0.000 0.000 0.000 200 0.165 580.97 0.30 0.086178 0.29356 -0.08 3 47 1.000 0.396 0.004 0.000 0.000 200 0.158 581.15 0.30 0.086178 0.29356 0.10 4 48 1.000 0.628 0.021 0.000 0.000 200 0.152 581.31 0.30 0.086178 0.29356 0.23 5 49 1.000 0.783 0.057 0.002 0.000 200 0.146 581.47 0.30 0.086178 0.29356 0.34 6 50 1.000 0.876 0.114 0.005 0.000 200 0.141 58
Figure 11. Condition Controlled Life Cycle Cost Analysis using the analytic method.

56
The life cycle costs are determined according to standard methods /8, 9/. Accordingly the costs are determined as:
• Real costs • Discounted costs (present value costs).
The total real costs are determined by simply summing up the intervention costs throughout the treated time as presented by Equation 18. No discounting is used:
∑∑= =
=t
i
n
jijR
i
CC0 1
;
(18)
where CR is the total real costs from the treated time frame, Euro/m2 Cj;i costs of the jth maintenance action in year i, Euro/m2 ni number of maintenance action in year i t number of years in the time frame (length of the span in years).
Discounted, i.e. present value (PV) costs refer to maintenance costs discounted to the present day by the discount factor. As the discount factor diminishes with time the present value costs of actions scheduled near to the start of the time frame are greater than the present value costs of respective actions scheduled later in the time frame. The total present value costs are calculated from Equation 19:
∑∑= = +
=t
ii
n
jijPV r
CCi
0 1; )1(
1
(19)
where CPV is total present value costs from the treated time frame, Euro/m2 r discount rate, and i time in years.
To compare different maintenance strategies it is advisable to redistribute the sum of life cycle costs evenly into annual costs. This can be done based either on real costs or present value costs. So two kinds of annual costs are defined:
• Average annual costs • Equalised annual costs.

57
The average annual costs are defined as the total real costs divided by the number of years in the time frame, as shown in Equation 20:
tCA R
A =
(20)
where AA is average annual costs, Euro/m2/year.
The equalised annual costs are determined by multiplying the total present value costs by the annuity factor, as shown in Equation 21:
1)1()1(−+
+⋅= t
t
PVE rrrCA
(21)
where AE is equalised annual costs, Euro/m2/year.
The equalised annual costs depend on how the maintenance actions are scheduled within the time frame. Maintenance actions scheduled near the start of the time frame increase the equalised annual costs more than those scheduled later in the time frame. This feature is emphasised with increasing discount rate.

58
5. Implementation plan of the SLMS The SLMS is implemented in two phases: (1) preliminary, and (2) actual research project. The preliminary research project was implemented in 2006. The actual research project is performed in 2�3 years under the auspices of the SAFIR 2010 research programme.
During the preliminary research project, a preliminary programme version of the Service Life management Process was produced. The first phase contained the following tasks:
• Identification of structures and modules and FMEA analyses • Preliminary database for structures and modules • Preliminary database for interventions • Preliminary degradation and damage models • Preliminary condition analysis based on Markov Chain • Preliminary results tables and paper reports.
The final programme version of the Service Life Management Process with supplementary programmes and analyses of the management system are produced during the actual research project. This phase contains the following tasks:
• Development of the final databases for structures, modules and interventions,
• Development of the module specific degradation and damage models, calibration systems of models and inspection instructions,
• Development of the manual system for life cycle design and automatic steering systems of the process (decision trees etc.),
• Development and combining of the cost and environmental impact analyses with the condition analysis and implementing the annual resource planning,
• Development and attachment of structural degradation analyses to the SLMS,
• Development and attachment of risk analyses to the SLMS.
The programme for Service Life Management Process is implemented in both the preliminary and final versions as a Microsoft Excel Visual Basic Application. Also the Database for structures and modules and the database for

59
interventions are created using the Excel database system. Associated parts of the system such as the structural analyses and risk analyses are, however, implemented using other programmes.
5.1 Tasks of the preliminary research project
5.1.1 Identification of structures and modules and FMEA analyses
The structures which are included in the SLMS are defined. In the first phase of implementation only structures pertaining to the containment and the sea water system are treated.
The structures are divided into modules using the principles presented in Chapter 3.2. The FMEA analysis is performed for modules.
The acronym FMEA comes from the words Failure Mode and Effect Analysis, which is a commonly known risk analysis method /18/. It means in practice identification and recording of the degradation and damage mechanisms specific to modules. In the same analysis an evaluation is made about the consequences which the degradation and damage mechanisms may cause to the structural performance and possibly to the operation of the plant. For programming it is essential to find out which types of deterioration are treated with degradation models and which types can only be treated as damages (if there are no degradation models for that kind of deterioration) (ref. Chapter 4.1).
5.1.2 Preliminary database for structures and modules
The database for structures and the database of modules consist of data from structures which are involved in the SLMS.
The database for structures contains the following structure specific data: • identification data • location data • material data • structural data

60
• year of fabrication • measuring data • environmental exposure data • classification data (such as safety class).
The database for modules contains the following module specific data: • identification data • location data • material data • structural data • measuring data • environmental exposure data • years of repair of maintenance actions • degradation and damage data • parameter data for the degradation, action effect and cost models • the action profile data (unless the decision tree method is applied).
The structural and modular databases are open to the user, i.e. the user can change or supplement the data of these databases from the displays of the programme.
5.1.3 Preliminary database for interventions
The database for interventions contains the data of all interventions as well as data of parameters of the models pertaining to the interventions. The actions can be divided into repairs and maintenance actions. The repairs improve the condition of the structure at least with respect to one degradation mechanism. On the other hand the maintenance actions only decelerate the rate of degradation.
The database of interventions include the following data (pertaining to both repair and maintenance actions):
• Action type classification • Cost data • Environmental impact data • Service life model data • Action effect model data • Data for Markov Chain modelling.

61
The database for interventions is not open to the user, i.e. the user cannot change data of this database.
5.1.4 Preliminary degradation and damage models
Based on the FMEA analyses described in Chapter 5.1.1, degradation models are created for each degradation type and for each repair. By degradation models the progress of degradation is predicted as a function of time. Degradation models are applied to both original (unrepaired) and repaired structures. The degradation rate after the repair usually differs from the degradation rate before the repair.
The degradation rate and service life of coatings and other maintenance actions are also estimated by models. Maintenance actions affect the degradation rate of structures proportionate to their condition i.e. the rate of degradation rate of structures increases when the protective coatings or other measures degenerate with time.
The modelling of damages means typing and classification of damages and sorting of repairs for different damage types.
5.1.5 Preliminary condition analysis based on Markov Chain
The Analytic method or the Markov Chain Method (ref. Chapter 4.4) will be applied to the condition analysis (which ever proves to be preferable). However, the examples in Figures 10 and 11 are inadequate to describe the whole life cycle cost analysis. For instance the degradation of a concrete structure can be retarded by applying an extra layer of concrete or a coating on the structure. However, as both the extra layer of concrete and the coating deteriorate themselves the condition of these protective systems must be first evaluated before evaluation of their effect on the condition of the structure. In practice three condition analysis tables are needed:
• Table of coatings • Table of extra concrete layer • Table of the structure.

62
These tables are connected to each other taking into account the mutual condition-related effects, as schematically presented in Figure 12.
Figure 12. A schematic presentation of a life cycle based condition analysis for concrete structures /12/.
Every structural module in turn is treated in the condition analysis. The data of the treated module are gathered automatically from the structural and modular databases and the database of maintenance and repairs. After the analysis the results data of the module are transited to the results tables. The logical progress of the programme can be schematically presented as in Figure 13.
Y e a r s
Coating table
Table for mortar or concrete
layer
Table for structure
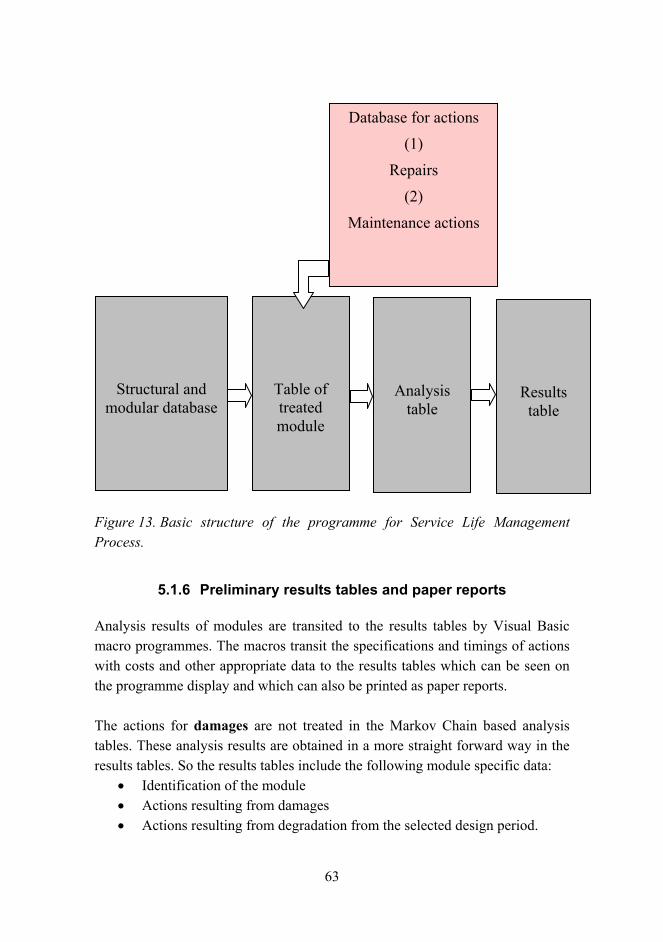
63
Figure 13. Basic structure of the programme for Service Life Management Process.
5.1.6 Preliminary results tables and paper reports
Analysis results of modules are transited to the results tables by Visual Basic macro programmes. The macros transit the specifications and timings of actions with costs and other appropriate data to the results tables which can be seen on the programme display and which can also be printed as paper reports.
The actions for damages are not treated in the Markov Chain based analysis tables. These analysis results are obtained in a more straight forward way in the results tables. So the results tables include the following module specific data:
• Identification of the module • Actions resulting from damages • Actions resulting from degradation from the selected design period.
Analysis table
Results table
Database for actions (1)
Repairs
(2)
Maintenance actions
Structural and modular database
Table of treated module

64
5.2 Tasks of the actual research project
5.2.1 Development of the final databases for structures, modules and interventions
In the preliminary research project only the framework of the databases for structures, modules and interventions were created, without attention to the contents of the data. In the actual research project the measuring data, material data (nominal strength and consistency of concrete, quality of steel) the structural data (thickness of concrete covers and diameter of steel bars etc.), environmental stresses and the history of manufacturing and repairs are specified for each module.
The database of interventions is also revisited and revised. The prices, environmental effects, degradation models and action effect models are updated.
5.2.2 Development of the module specific degradation and damage models, calibration systems of models and inspection instructions
In the preliminary research phase the purpose of the degradation models was only to show the working of the programme on the conceptual level, not paying much attention to the correctness of the models. So the degradation and damage models developed in the preliminary project are revisited in the actual research project to improve them by taking into account the material consistency, structural details and environmental stresses of each module.
The programme is also provided with a system for calibration of degradation models. This means that the degradation models are accommodated so that they obey the observed course of degradation as well as possible. Accordingly the calibrated degradation curve is forced to go along the observed point in the DoD -time space (DoD = Degree of Degradation).
The inspection instructions are completed in the actual research project so that the instructions will include all the degradation and damage types with their rating systems. Also a link module is prepared in the Service Life Management

65
programme for output of the blank-forms for inspectors. This helps the inspector and reduces the possibility of faulty input of inspection results.
5.2.3 Development of the manual system for life cycle design and automatic steering systems of the process (decision trees etc.)
The user of the SLMS is provided with the possibility of making changes to the automatically prepared plans. In such a case, a system is added to the Management Process allowing the user to do manual modifications to the plans. By the manual design system, the user can do a life cycle plan completely according to his/her own opinions by adding or removing actions or changing the definitions of actions. However, all the time the information on the condition effects from the changes in the plan are updated so that the designer can be assured that the allowed condition limits are not exceeded. The information on costs is also updated.
Technical steering systems refer to the technical guiding methods of the life cycle design process mentioned in Chapter 3.4. These methods include decision trees by which the actions are automatically specified in the action design of modules. By this automatic design method, the optimal interventions are defined taking into account the specific needs and features of each module. At the �nodes� of the tree the data of the module are compared with the set criteria and the decision is made accordingly. Possible criteria can be e.g. chloride stress, moisture stress, protections and condition of the structure.
In practice the decision trees are parts of the management programme in which the path from the root to leaves of the tree is traversed. As a result the optimal LCAP (life cycle action profile) is obtained.
5.2.4 Development and combining of the cost and environmental impact analyses with the condition analysis and implementing the
annual resource planning
The life cycle cost analysis and the Life Cycle Assessment (environmental impact analysis) are combined with the Markov Chain based condition analysis.
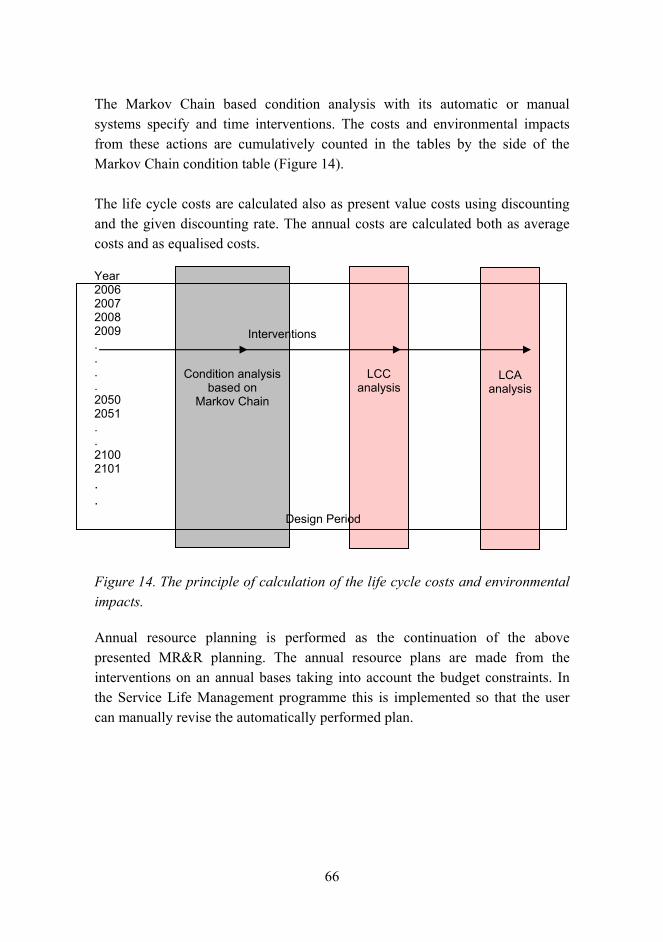
66
The Markov Chain based condition analysis with its automatic or manual systems specify and time interventions. The costs and environmental impacts from these actions are cumulatively counted in the tables by the side of the Markov Chain condition table (Figure 14).
The life cycle costs are calculated also as present value costs using discounting and the given discounting rate. The annual costs are calculated both as average costs and as equalised costs.
Figure 14. The principle of calculation of the life cycle costs and environmental impacts.
Annual resource planning is performed as the continuation of the above presented MR&R planning. The annual resource plans are made from the interventions on an annual bases taking into account the budget constraints. In the Service Life Management programme this is implemented so that the user can manually revise the automatically performed plan.
Condition analysis
based on Markov Chain
LCC
analysis
LCA
analysis
Design Period
Interventions
Year 2006 2007 2008 2009 . . . . 2050 2051 . . 2100 2101 . .

67
5.2.5 Development of structural degradation analyses
By structural degradation analyses, the consequences of materials degradation on structural behaviour is studied. Structural degradation analyses can be conducted using different methods and different levels of accuracy. In a SLMS of a NPP, a 2-level procedure is recommended. At the 1st level of accuracy, the load capacity of the degraded structure is evaluated in relation to the original load capacity of the same structure by a simple design formulae. In principle the analysis of crack corrosion included in the condition analysis can be considered as a simple structural degradation analysis in case the limit state of allowed corrosion has been specified based on the load capacity of the structure. Such a simple analysis is possible to be implemented in the basic condition analysis programme.
At the 2nd level of accuracy, the whole structures are treated (not just a cross section of it as at the 1st level analyses). The structural performance and the static load quantities can be examined by special methods, taking into account the effects of the observed damage in the stiffness of structures, possible changes in the regulations for loads etc. As an example a 3-dimensional linear or non-linear analysis can be conducted. A 2nd level analysis normally requires considerable resources and it cannot be combined directly with the Excel based condition analysis programme. Usually these analyses are conducted using the Finite Element Method (FEM).
5.2.6 Development and attachment of risk analyses to the SLMS
The structural analyses alone are not sufficient to ensure that no hazardous situations or accidents can happen during the lifetime of a NPP. Risk analyses are needed to find out the possibilities, probabilities and consequences of different accidents as a result of deficiencies in the performance of structures. Accordingly the analysis of risks starts from the three basic questions:
• What can go wrong? • How likely is it? • What are the consequences?

68
Risk analysis is evaluation of different hazards based on existing analysing methods. In the risk analyses of structures the experience gained from similar analysis for pipe systems and equipments are used of and basically the same methods are applied (Probability based Safety Analyses, PSA).
As for concrete structures in NPPs, it is justifiable to examine the following risks:
• Congestion of cool water channels by debris from structures (e.g. coatings) during a severe accident,
• Unintended performance of a prestressed structure during a severe accident as a result of relaxation and possible corrosion in tendons,
• Reduced tightness of the steel liner in a concrete containment as a result of steel corrosion,
• Reduced strength of concrete as a result of high temperature and radiation, and
• Risks related to water leakages in pools and wells.
One of the risk analysis methods, the FMEA-analysis (Failure Mode and Effect Analysis), is used in the preliminary phase of the project. However this method is only qualitative and it is not sufficient to be used in the quantitative evaluation of risks. In many cases the accidents are a result of many risk factors for which more advanced analysis methods have to be applied.
More advanced analysis methods are e.g. the ETA (Event Tree Analysis) and FTA (Fault Tree Analysis) analyses. By these methods the combined effects of several risk factors can be studied also on a quantitative basis.
69
6. Summary The SLMS of concrete structures in NPPs is a tool for predicting the condition and service life of structures over a long design period, planning and organising all interventions related to the upkeep of structures and evaluating the costs of the interventions over the design period. The interventions include maintenance and repairs and in special cases rehabilitation and renewal. The inspection system of structures and the upkeep of a database are interlinked with the SLMS. A life cycle cost analysis and a LCA are developed for the whole design period while also the annual costs are evaluated. Other services such as structural analyses, qualitative and quantitative risk analyses, ecological life cycle analyses, and multiple attribute decision making aid can also be added to the system. The process and the methodological basis of the management system were developed in the European Union research project LIFECON (GIRD-CT-2000-00378) in the years 2001�2003. /11, 12/.
A plan prepared using the SLMS fulfils the requirements presented in the Finnish Regulatory guide YVL 1.1, which states that �a plan shall be presented for how the design and qualification of the components and structures, their operation and operating experience, in-service inspections and tests, and maintenance are integrated so as to form a comprehensive aging management programme�. The system identifies �all significant aging and wear mechanisms and potential degradation owing to aging� /2/.
The system provides the utility of a plant with the following information /11/: • present condition state of structures, • predicted condition of structures over the licensed operating time, • predicted service life of structures, • predicted maintenance and repairs and their timings during the whole
operating time, and • costs of maintenance and repairs.
By the SLMS the administration of a NPP can convince and persuade authorities that the concrete structures in the NPP fulfil all the requirements of performance and safety and to design the upkeep of structures in such a way that the requirements will be fulfilled during the whole licensed operating time. For maintenance staff and designers the SLMS specifies and times all the

70
maintenance and repairs throughout the operating time so that they can be systematically taken into account in the annual action and resource plans.
The predicted condition and service life estimates are based on special condition analyses made for each structural part (module) using the best available degradation models. By the degradation models the progress of degradation is evaluated as a function of time and as a function of due material, structural and environmental factors. The maximum allowable degree of degradation is defined so that the service life can be explicitly determined together with the degradation models. Sometimes more than one degradation mechanism may have to be considered in the condition analysis.
When the degradation mechanisms and the most relevant material, structural and environmental parameters affecting the degradation mechanisms have been identified, the progress of degradation can be predicted and the interventions can be planned for the whole planned operating time. The interventions can be e.g. applications of protection systems, such as coatings, tilings, and protective concrete layers. In special cases non-mechanical repair methods such as realkalisation and electrochemical chloride removal can be considered. In case of steel corrosion, cathodic protection can be applied to reduce the rate of corrosion. As a special corrosion protection method it is also possible to change the gas atmosphere of a containment into a oxygen free atmosphere.
Massive mechanical repairs are hardly feasible in concrete NPP structures. However, local repairs are possible to do even by traditional mechanical repair methods.
71
References Standards and regulatory guides:
1. YVL 1.0 Safety criteria for design of NPPs.
2. YVL 1.1 Regulatory control of safety at nuclear facilities.
3. YVL 1.2 Documents pertaining to safety control of nuclear facilities.
4. YVL 1.8 Repairs, modifications and preventive maintenance at nuclear facilities.
5. YVL 4.1 Concrete structures for nuclear facilities.
6. YVL 4.2 Steel structures for nuclear facilities.
7. ISO 15686: Buildings and Constructed Assets � Service Life Planning � Part 1: General Principles. 2000.
8. ISO 15686: Buildings and Constructed Assets � Service Life Planning �Part 5: Whole Life Costing.
9. ASTM E 917, 1994. Measuring Life-Cycle Costs of Buildings and Building Systems. American Society for Testing and Materials. 12 p.
10. ASTM E 1765, 1998. Applying Analytical Hierarchy Process (AHP) to Multiattribute Decision Analysis of Investments Related to Building and Building Systems. American Society for Testing and Materials. 13 p.
11. In-Service Inspection Guide, 2005. (Rakennusten määräaikaistarkastukset). Teollisuuden Voima. Tunnus: 107835. (In Finnish).

72
Other references:
12. Söderqvist, M.-K. & Vesikari, E. 2004. Generic technical handbook for a predictive life cycle management system of concrete structures (LMS). LIFECON Deliverable D1.1 http://www.vtt.fi/rte/strat/projects/lifecon/
13. Vesikari, E. 2004. Statistical Condition Management and Financial Optimisation in Lifetime Management of Structures. Part 1: Markov Chain Based Life Cycle Cost (LCC) Analysis. Part 2: Reference Structure Models for Prediction of Degradation. LIFECON Deliverable D2.2 http://www.vtt.fi/rte/strat/projects/lifecon/
14. Smith L.M., The Management of Aging in Nuclear Power Plant Civil Structures. 18 p. Scottish Nuclear Limited. 19 p.
15. Jávor, T. (Ed.) 1999. Life Prediction and Aging Management of Concrete Structures. Proc. Int. Conf. in Bratislava, Slovakia, 6�8 July, 1999. 363 p.
16. Naus, D. (Ed.) 2000. Life Prediction and Aging Management of Concrete Structures. Proc. Int. Workshop, Cannes, 16�17 Oct 2000. RILEM Proceedings PRO 16. 239 p.
17. Häkkä-Rönnholm, Eva. 2004. Requirements for coatings of NPP containments. STUK-YTO-TR 210. Helsinki 2004. 24 p.
18. Lair, J., Rissanen T. & Sarja A. 2004. Methods for Optimisation and Decision Making in Lifetime Management of Structures. LIFECON Deliverable D2.3 2004. http://www.vtt.fi/rte/strat/projects/lifecon/
19. McNulty, T., McNair, I. & Bradford, Ph. A Regulatory View of Plant Life Management of Civil Structures in the Nuclear Industry. 1998. HSE Nuclear Division. 11 p.
20. Judge R., IAEA Co-ordinated Research Programme on Aging Management of Concrete Containment Buildings. 1997 In: Byars, E.A. & McNulty, T. (Ed.) 1997. Management of Concrete Structures for Long-Term

73
Serviceability. Proc. Int. Sem. University of Sheffield, England, UK. 13 Nov. 1997, pp. 107�116.
21. A Decade of Activities in the Area of Aging of NPP Concrete Structures, 1995�2005. NEA / IAGE Working Group/ Concrete Subgroup. To be published.


Series title, number and report code of publication
VTT Publications 648 VTT-PUBS-648
Author(s) Vesikari, Erkki Title
Service life management system of concrete structures in nuclear power plants Abstract The Service Life Management System (SLMS) is a tool for predicting the condition of structures over a long design period, planning and organising all interventions related to the upkeep of structures and evaluating the costs and environmental impacts of interventions over the design period. The interventions include maintenance and repairs and in special cases rehabilitation and renewal. The inspection of structures and the upkeep of a database are interlinked with the SLMS. A life cycle cost (LCC) analysis, including annual costs, and a life cycle assessment (LCA) are performed for the whole design period. Other features such as structural analyses, qualitative and quantitative risk analyses, and MADA (Multiple Attribute Decision making Aids) can also be added to the system.
The system characterizes the utility of a plant with the following information:
• present condition state of structures, • predicted condition of structures over the licensed operating time, • predicted service life of structures, • predicted maintenance and repairs and their timings during the whole operating time, and • the costs of maintenance and repairs.
Using the SLMS, the administration of a NPP can convince and persuade authorities that the concrete structures in the NPP fulfil all the requirements of performance and safety. The upkeep of structures can be designed in a way that the requirements will be fulfilled during the licensed operating time. For maintenance staff and designers, the SLMS specifies and schedules all the maintenance and repairs throughout the operating time so that they can be systematically taken into account in the annual action and resource plans.
ISBN 978-951-38-7032-4 (URL: http://www.vtt.fi/publications/index.jsp)
Series title and ISSN Project number VTT Publications 1455-0849 (URL: http://www.vtt.fi/publications/index.jsp)
1065
Date Language Pages June 2007 English, Finnish abstr. 73 p.
Name of project Commissioned by CONSAFE
Keywords Publisher Inspection systems, service life management, concrete structures, nuclear power plants, nuclear safety, condition monitoring, service life, modelling, maintenance, life cycle costs
VTT Technical Research Centre of Finland P.O.Box 1000, FI-02044 VTT, Finland Phone internat. +358 20 722 4404 Fax +358 20 722 4374


Julkaisun sarja, numero ja raporttikoodi
VTT Publications 648 VTT-PUBS-648
Tekijä(t) Vesikari, Erkki Nimeke
Ydinvoimaloiden betonirakenteiden käyttöiän hallintajärjestelmä Tiivistelmä Käyttöiänhallintajärjestelmä on rakenteiden ylläpidon suunnittelun ja seurannan väline, jolla voidaan ennakoida rakenteiden käyttöikä sekä suunnitella ja organisoida kaikkia rakenteiden ylläpitoon liittyviä toimintoja, joita ovat ennakkohuolto- ja korjaustyöt sekä erityistapauksissa perusparantaminen ja uusiminen. Käyttöiänhallintajärjestelmään liittyvät läheisesti rakenteiden tarkastusjärjestelmä ja rakenteiden tietokannan ylläpidon järjestelmä.
Käyttöiänhallintajärjestelmä on yhdenmukainen viranomaismääräyksen YVL 1.1:n kanssa, jonka mukaan laitoksen on esitettävä �suunnitelma siitä, kuinka laitteiden ja rakenteiden suunnittelu ja kelpoistaminen, käyttö ja käyttökokemusten hyödyntäminen, määräaikaistarkastukset ja -testaukset ja kunnossapito integroidaan kokonaisvaltaiseksi ikääntymisen hallintaohjelmaksi�. Käyttöiän hallintajärjestelmä yksilöi kaikki merkitykselliset turmeltumismekanismit sekä potentiaaliset turmeltumisvaikutukset.
Käyttöiänhallintajärjestelmä antaa laitoksesta mm. seuraavia tietoja:
• rakenteiden nykykuntotila • ennusteet rakenteiden kuntotilasta laitoksen käyttöajan aikana • rakenteiden ennakoitu käyttöikä • ennakoidut huolto- ja korjaustoimenpiteet • toimenpiteistä johtuvat elinkaarikustannukset.
Ydinvoimaloiden käyttöiänhallintajärjestelmä on sekä ydinvoimalan johdolle että huolto- ja korjaustöistä vastaavalle henkilökunnalle tarkoitettu työkalu. Sen avulla organisaation johto voi itse vakuuttua ja vakuuttaa viranomaisille, että rakenteet täyttävät niille asetetut toimivuus- ja turvallisuusvaatimukset sekä ennustaa rakenteiden käyttökelpoisuus myös tulevaisuudessa niin pitkälle kuin voimalalle suunnitellaan käyttöaikaa. Kunnossapito- ja korjaustöistä vastaaville suunnittelijoille ja toteuttajille käyttöiänhallintajärjestelmä määrittelee ja ajoittaa voimalarakenteiden rakenneosien toimenpiteet etukäteen siten, että ne voidaan ottaa suunnitelmallisesti huomioon vuosittaisissa toimenpideohjelmissa sekä laskee toimenpiteistä johtuvat kustannukset.
ISBN 978-951-38-7032-4(URL: http://www.vtt.fi/publications/index.jsp)
Avainnimeke ja ISSN Projektinumero VTT Publications 1455-0849 (URL: http://www.vtt.fi/publications/index.jsp)
1065
Julkaisuaika Kieli Sivuja Kesäkuu 2007 Englanti, suom. tiiv. 73 s.
Projektin nimi Toimeksiantaja(t) CONSAFE
Avainsanat Julkaisija
Inspection systems, service life management, concrete structures, nuclear power plants, nuclear safety, condition monitoring, service life, modelling, maintenance, life cycle costs
VTT PL 1000, 02044 VTT Puh. 020 722 4404 Faksi 020 722 4374


VTT PUBLICATIONS
628 Kolari, Kari. Damage mechanics model for brittle failure of transversely isotropic solids. Finite element implementation. 2007. 195 p. + app. 7 p.
629 Communications Technologies. VTT's Research Programme 2002–2006. Final Report. Ed. by Markku Sipilä. 2007. 354 p.
630 Solehmainen, Kimmo. Fabrication of microphotonic waveguide components on silicon. 2007. 68 p. + app. 35 p.
631 Törrö, Maaretta. Global intellectual capital brokering. Facilitating the emergence of innovations through network mediation. 106 p. + app. 2 p.
632 Lanne, Marinka. Yhteistyö yritysturvallisuuden hallinnassa. Tutkimus sisäisen yhteistyön tarpeesta ja roolista suurten organisaatioiden turvallisuustoiminnassa. 2007. 118 s. + liitt. 81 s.
633 Oedewald, Pia & Reiman, Teemu. Special characteristics of safety critical organizations. Work psychological perspective. 2007. 114 p. + app. 9 p.
634 Tammi, Kari. Active control of radial rotor vibrations. Identification, feedback, feedforward, and repetitive control methods. 2007. 151 p. + app. 5 p.
635 Intelligent Products and Systems. Technology theme – Final report. Ventä, Olli (ed.). 2007. 304 p.
636 Evesti, Antti. Quality-oriented software architecture development. 2007. 79 p.
637 Paananen, Arja. On the interactions and interfacial behaviour of biopolymers. An AFM study. 2007. 107 p. + app. 66 p.
638 Alakomi, Hanna-Leena. Weakening of the Gram-negative bacterial outer membrane. A tool for increasing microbiological safety. 2007. 95 p. + app. 37 p.
639 Kotiluoto, Petri. Adaptive tree multigrids and simplified spherical harmonics approximation in deterministic neutral and charged particle transport. 2007. 106 p. + app. 46 p.
640 Leppänen, Jaakko. Development of a New Monte Carlo Reactor Physics Code. 2007. 228 p. + app. 8 p.
641 Toivari, Mervi. Engineering the pentose phosphate pathway of Saccharomyces cerevisiae for production of ethanol and xylitol. 2007. 74 p. + app. 69 p.
642 Lantto, Raija. Protein cross-linking with oxidative enzymes and transglutaminase. Effects in meat protein systems. 2007. 114 p. + app. 49 p.
643 Trends and Indicators for Monitoring the EU Thematic Strategy on Sustainable Development of Urban Environment. Final report summary and recommendations. Häkkinen, Tarja (ed.). 2007. 240 p. + app. 50 p.
644 Saijets, Jan. MOSFET RF Characterization Using Bulk and SOI CMOS Technologies. 2007. 171 p. + app. 4 p.
645 Laitila, Arja. Microbes in the tailoring of barley malt properties. 2007. 107 p. + app. 79 p.
646 Mäkinen, Iiro. To patent or not to patent? An innovation-level investigation of the propensity to patent. 2007. 95 p. + app. 13 p.
647 Mutanen, Teemu. Consumer Data and Privacy in Ubiquitous Computing. 2007. 82 p. + app. 3 p.
648 Vesikari, Erkki. Service life management system of concrete structures in nuclear power plants. 2007. 73 p.

VTT PU
BLICA
TION
S 648Service life m
anagement system
of concrete structures in nuclear power plants
Erkki Vesikari
ESPOO 2007ESPOO 2007ESPOO 2007ESPOO 2007ESPOO 2007 VTT PUBLICATIONS 648
Erkki Vesikari
Service life management system ofconcrete structures in nuclearpower plants
The Service Life Management System (SLMS) is a tool for predicting thecondition of structures over a long design period, planning and organisingall interventions related to the upkeep of structures and evaluating thecosts and environmental impacts of interventions over the design period.The interventions include maintenance and repairs and in special casesrehabilitation and renewal. The inspection of structures and the upkeep ofa database are interlinked with the SLMS. A life cycle cost (LCC) analysis,including annual costs, and a life cycle assessment (LCA) are performedfor the whole design period. Other features such as structural analyses,qualitative and quantitative risk analyses, and MADA (Multiple AttributeDecision making Aids) can also be added to the system.
Inspection system
Service Life Management
• Guarding of condition
• Triggering of interventions
• Specification of interventions
Implementation of interventions
Technical guidance and mathematical
methods
Regulatory guidance
Degradation models
Action effect
Maintenance of database
ISBN 978-951-38-7032-4 (URL: http://www.vtt.fi/publications/index.jsp)ISSN 1455-0849 (URL: http://www.vtt.fi/publications/index.jsp)
Julkaisu on saatavana Publikationen distribueras av This publication is available from
VTT VTT VTTPL 1000 PB 1000 P.O. Box 1000
02044 VTT 02044 VTT FI-02044 VTT, FinlandPuh. 020 722 4404 Tel. 020 722 4404 Phone internat. + 358 20 722 4404Faksi 020 722 4374 Fax 020 722 4374 Fax + 358 20 722 4374