service quality and student satisfaction of students …
TRANSCRIPT

SERVICE QUALITY AND STUDENT SATISFACTION
OF STUDENTS IN PRIVATE UNIVERSITIES IN
NAIROBI COUNTY
BY
MARTIN NTABATHIA
A research project submitted in partial fulfilment of the
requirement for the Award of Degree of Master of
Business Administration (MBA),
School of Business, University of Nairobi
October 2013

i
DECLARATION
I hereby declare that this research project is my own original work and that it has never
been presented to any other university for assessment or award of a degree.
Signature: __________________________ Date: ______________
Name: Martin Ntabathia
Registration No.D61/66903/2011
This research project has been submitted for examination with my approval as the
University Supervisor.
SUPERVISOR:
Signature: __________________________ Date: ______________
NAME: Ernest Akelo.
Department of Management Science
School of Business
University of Nairobi

ii
ACKNOWLEDGEMENTS
I thank my wife and children, my brother Mugambi and my sister in law Dorcas for all
the support and encouragement they gave me while working on this project.
I also thank my supervisor Mr Ernest Akelo and my moderator Mr Onserio Nyamwange
for their guidance and cooperation.
I will not forget the help I received from Felix Mogesa of Strathmore University and
all my friends and colleagues for their wonderful advice and correction.
To all of you thank you very much.

iii
DEDICATION
I dedicate this work to God and my late parents who made me what I am.

iv
ABSTRACT
Private universities in Kenya like other businesses operate in a competitive environment. Knowing how to satisfy their students who are their primary customers is important because it can lead to future business. The relationship between service quality and student satisfaction is important because if it is understood properly it can enable the right decisions to be made about service quality that lead to increase in student satisfaction. The study was carried out to find out whether there is a relationship between service quality and student satisfaction of private university students in Nairobi County. About 118 students were interviewed through a survey that was based on higher education service quality model HeDPERF. It was found that service quality is positively related to student satisfaction and that some of the most important aspects of an institution that students liked most were the reputation of the university and the nature of the programs offered. This means that universities have to improve on their service quality while at the same time improving on their reputation, variety and flexibility of programs offered in order to attract more students.

v
Table of Contents
DECLARATION ............................................................................................................ i
ACKNOWLEDGEMENTS ........................................................................................... ii
DEDICATION .............................................................................................................. iii
ABSTRACT .................................................................................................................. iv
LIST OF TABLES ....................................................................................................... vii
LIST OF FIGURES .................................................................................................... viii
1 INTRODUCTION ........................................................................................ 1
1.1 Background ........................................................................................................ 1
1.1.1 Student as a Customer ................................................................................... 2
1.1.2 Service Quality .............................................................................................. 3
1.1.3 Student Satisfaction ....................................................................................... 6
1.1.4 Private Universities ........................................................................................ 8
1.2 Research Problem .............................................................................................. 9
1.3 Research Objectives ......................................................................................... 11
1.4 Value of Study ................................................................................................. 11
2 LITERATURE REVIEW ............................................................................. 12
2.1 Introduction ..................................................................................................... 12
2.2 Service Quality................................................................................................. 13
2.3 Student Satisfaction ......................................................................................... 16
2.4 Service Quality in Higher Education ............................................................... 17

vi
2.5 Measuring Service Quality and Customer Satisfaction ................................... 18
2.6 Higher Education Performance Model ............................................................. 20
3 RESEARCH METHODOLOGY ................................................................. 24
3.1 Research Design ............................................................................................. 24
3.2 Population ....................................................................................................... 24
3.3 Sample Design ................................................................................................ 24
3.4 Data Collection ............................................................................................... 25
3.5 Data Analysis ................................................................................................... 25
4 RESEARCH FINDINGS, RESULTS AND DISCUSSION ....................... 27
4.1 Introduction .................................................................................................... 27
4.2 Sampling procedure and data collection ......................................................... 27
4.3 Data Analysis .................................................................................................. 27
4.4 Results ............................................................................................................. 29
4.5 Interpretation and Discussion of the Results .................................................... 36
5 SUMMARY, CONCLUSION AND RECOMENDATIONS ..................... 37
5.1 Summary ........................................................................................................ 37
5.2 Conclusion ...................................................................................................... 38
5.3 Recommendations ........................................................................................... 38
REFERENCES .................................................................................................. 40
APPENDICES ............................................................................................................ 45

vii
List of Tables
Table 4.1 Means and standard deviations for the questionnaire items on service quality……29
Table 4.2 Means and standard deviations for the questionnaire items on satisfaction……….31
Table 4.3 Means for determinants of service quality and student satisfaction……………….32
Table 4.4 Multiple Regression Results……………………………………………………….32
Table 4.5 Analysis of Variance (ANOVA)…………………………………………...............33
Table 4.6 Regression Coefficients……………………………………………………………34
Table 4.7 Correlation Matrix…………………………………………………………………35

viii
List of Figures
Figure 1 Gap model…………………………………………………………………………..15
Figure 2 Relationships between service quality dimensions and customer satisfaction……...21

ix
LIST OF ACRONYMS
CUE – COMMISION FOR UNIVERSITY EDUCATION
SERVQUAL – SERVICE QUALITY
SERVPERF- SERVICE PERFORMANCE
HEdPERF – HIGHER EDUCATION PERFORMANCE

1
CHAPTER ONE: INTRODUCTION
1.1 Background
There is intense competition between private universities in Kenya for students Waruru
(2013). The competition is so intense that universities are trying to outdo each other by
buying advertising space in both print and electronic media and using members of their
alumni to pass on the message. Waruru (2013) cites one of the vice chancellors of a
local private university as having predicted an increase in enrolments that will result
from favourable government policies, that allow state funded students to enrol in private
universities because the private universities have an upper hand when it comes to
quality.
Private universities need to know what to do to in order to satisfy their students because
satisfied students can recommend their friends and relatives to join these institutions in
future. Service quality is one of the factors that can lead to customer satisfaction
(Kasper, Helsdingen, and Gabbott's 2006). Service quality can be used as a strategy for
competitive advantage (Gronroos, 2007).
According to Slack, Chambers, & Johnston, (2010) the five core service performance
objectives in operations management are quality, flexibility, speed, dependability and
cost. Core services performance objectives are the minimum requirements that a
customer expects to see or experience in a product or a service. The success or failure
of an operation is determined by how these core performance objectives are met. In
most cases, they also form the basis of competitive advantage. For example Evans and

2
Collier (2007) have mentioned cost, quality, time, flexibility and innovation as sources
of competitive advantage.
1.1.1 Student as a Customer
There is some controversy surrounding the identification of true customers of education
and whether marketing metaphors like customers and customer satisfaction can be
applied to students. In Hebert, Dellana and Bass view as cited by (Brennan &
Bennington, 2000) there is some confusion as to whether the primary customer of
higher education is the student, parents, community, employers, research community,
government or society in general. Other researchers suggest that seeing students as
customers in state funded universities might solve some of the problems experienced
by them like distant leadership and unsatisfactory course requirements on offer (Vuori,
2013). Deming (1986) states that (as cited by Brennan & Bennington, 2000) a customer
is the end user of a product despite who pays. Going by this definition therefore students
should be the primary customers of education because they benefit most from the
knowledge acquired.
Taking marketing metaphors like customers and customer satisfaction and applying
them directly to education without further adjustments is not recommended because it
may lead to negative consequences. Examples of these are the narrow definition of
customers, confusion between short term and long term learning, insufficiently
accounting for teacher student interaction and reduction of academic staff to being
panderers of students which may in the long run lead to low quality (Schwartzman,
1995: Brennan & Bennington, 2000: Vuori, 2013: Mark, 2013).

3
Modern service marketing theory and research on services advocates for the treatment
of the customer as an active participant in the production process who is partly
responsible for the outcome and therefore is also responsible for his/her satisfaction
(Mark, 2013: Zeithaml, Bitner, & Gremler, 2006). The terms customers and customer
satisfaction that appear in this study are therefore understood in this context. What this
means in practical terms is that students are expected do what their lecturers expect of
them in order to achieve their long term goal of qualifying and getting the required
certifications as opposed to preferring shorter classes, fewer assignments and inflated
marks. This is what is referred as the long-term view.
1.1.2 Service Quality
The concept of quality is difficult to define because quality means different things to
different people. The way one customer will experience a product or service is not the
same way another will experience it. Quality can be categorized in terms of various
perspectives like Judgement, product, user, value or manufacturing perspective (Evans,
2011). With the judgment perspective, the quality of a product cannot be defined but
one can recognize it one he sees it. The user perspective is about how the needs of a
customer are met.
A product/service that does not address these needs is said to be of lower quality. The
value perspective views quality in terms of product/service features and price. If two
products have identical features but one has a lower price it will have a higher value
and therefore higher quality. The product perspective associates quality with features.
Products with more features are assumed to be of higher quality compared to those with

4
less. Under the manufacturing perspective, meeting product specifications is the main
determinant of quality.
The American Society for Quality (ASQ) (as cited by Evans, 2011) defines quality as
“totality of features and characteristics of a product or service that bear on its ability to
satisfy given needs.” A shorter definition that is generally accepted is that quality is the
ability to meet or exceed customer expectations. These two definitions are derived from
the product and user perspectives described earlier.
Service quality is an attitude formed overlong term evaluation of performance (Bateson
& Hoffman, 1999). Service quality can also be viewed in terms of measurements.
Palmer (2005) categorises these measurements as disconfirmation approaches,
performance-only measures, and importance-performance analysis. The
disconfirmation model refers to the difference between expected and perceived quality.
Quality gap is expressed as Q=E-P where Q is quality, E is expectation and P is the
perception.
Performance-only measures exclude the expectation (E) from the equation and only
measure performance or perception (P). According to Palmer (2005) the SERVPERF
Model was developed because of the difficulties of conceptualizing expectations. Both
SERVQUAL and SERVPERF are based on the five dimensions of service quality,
which are reliability, assurance, tangibles, empathy, and responsiveness. However,
although all these dimensions are important there are some that are more important than
others from the customer’s perspective. Higher Education performance (HEDPERF) is

5
a performance-based model that is similar to SERVPERF because it measures
perception only and not the gap between expectation and perception as is the case with
SERVQUAL. It is used to measure service quality in higher education.
The importance-performance approach classifies elements of service in terms of
performance and importance. The elements that are more important are given more
attention in evaluation. Apart from expectations and perceptions that define the
measurement of the service quality gap customers also use the corporate image of the
organization to evaluate service quality (Gronroos, 2007). This image can be split into
physical and functional service quality. The physical part is what can be measured
objectively like the length of a waiting line while functional quality is that part of the
service that cannot be measured objectively. An example is the attitude of service
provider’s staff.
In Kasper et al.(2006) view there are five service characteristics that determine how
service quality is achieved. The first is the inability to own the service the way one
would own a product. Quality assessment can only be made after the service has been
purchased. The second characteristic is the intangibility of services that make it
impossible to assess what is being offered and the quality of what has been delivered.
The third characteristic of service delivery is the inseparability of the service from the
people involved in its production and consumption. The customer is a participant in the
process and therefore this has an effect on the output received. If the customer is not
co-operative lower quality may be achieved. The fourth characteristics of services is
heterogeneity or variance of the service from time to time. This means that sometimes

6
the service is good while at other times it may be poor. Perishability is the fifth
characteristic of the service delivery that affects service quality. If it is not managed
well it may mean long waiting lines or no people in the queue at all which the customer
interprets as low quality.
In general, the main drivers of service quality are staff and the right technology (Evans,
2011). The author suggests that having well trained and motivated staff and the right
technology has an effect on service quality with information technology having the
largest impact. Apart from the customer the level of service quality is also determined
by other factors like the competitors, the technology used, efficient use of resources,
cost and also the owners of the business who have to decide whether to use quality as
a competitive advantage or just provide the basic quality (Wright & Race, 2004).
1.1.3 Student Satisfaction
Oliver’s (1997) view (as cited by Palmer 2005) is that “satisfaction is the emotional
reaction following a disconfirmation experience”. Geity and Thompson’s (1994)
definition (as cited by Palmer 2005) states that “satisfaction is a psychological
experience of a consumer after confirmation-disconfirmation of expectations of a
specific transaction”.
Kasper et al. (2006) suggest that satisfaction can be either specific for a part of a process
or overall for the whole organization. Satisfaction can be expressed through
compliments or loyalty to the service provider (Kasper et al., 2006). In the extreme

7
customers will express dissatisfaction by switching to the competitors. The major
reasons why a customer would want to switch are the failure of the core service
provided or behavioural issues like uncaring staff (Kasper et al., 2006).
According to Elliott & Healy (2001)“Student satisfaction is generally accepted as a
short-term attitude resulting from an evaluation of a student’s educational experience.
Student satisfaction results when actual performance meets or exceeds the student’s
expectations.”
The two definitions between customer satisfaction in general and student satisfaction
are very similar because they refer to short-term nature of specific transaction events.
Other researchers in this area have not attempted to separate the two. (Wilkins &
Balakrishnan, 2013: Oldfield & Baron, 2000: Alves & Raposo, (n.d.):Barnes, 2007).
For this reason customer satisfaction and student satisfaction are assumed to have the
same meaning in the context of this study.
Customer satisfaction is important because it has an effect on financial performance of
a firm as evidenced by some studies of financial services in the US that indicated that
there was a positive correlation between the proportion or percentage of business done
with a customer and that customer’s satisfaction (Kasper et al., 2006). Most experts
agree that there is a relationship between service quality and customer satisfaction but
they do not agree on the direction of the relationship as some suggest that service quality
comes before satisfaction while others say it is the other way (Parasuraman, Zeithaml
& Berry 1985: Cronin Jr & Taylor, 1992: Bitner, 1990).

8
Service quality is among the factors that determine customer satisfaction and customer
satisfaction can lead to customer loyalty (Kasper et al., 2006). Customer loyalty has a
positive impact on the financial performance of a firm (Gronroos, 2007). This can
happen because of referrals, cost savings, and increased business from existing
customers. Evans (2011) cites an example of one US University where the
implementation of quality programs lead to increased student satisfaction. As a result,
90% of the undergraduate students and alumni said that if they could do it all over again
they would enrol in the same university.
1.1.4 Private Universities
The study was conducted on campuses of private universities operating in Nairobi
County. There are 31 accredited private universities in Kenya of which 25 of them have
their main campuses or branch campuses in Nairobi County. According to Waruru
(2013) private universities in Kenya account for around 60,000 students, which is about
20% of the total undergraduate student population. The oldest private university in
Kenya is the University of East Africa Baraton and was registered in 1991. Private
universities exist because the public universities are not able to absorb all the qualified
students who complete high school every year. In some cases, students are not able to
pursue their preferred courses in public universities because of competition and
therefore they have to enrol in private universities.
The commission for university education is a government body and is the predecessor
of the former commission for higher education (“Vision and Mission,” n.d.). It is
responsible for regulating the conduct of universities and accreditation of university

9
programmes for all universities operating in Kenya. Its vision is to ensure that there is
sustainable quality in university education.
1.2 Research Problem
Universities need to know how students perceive the services they offer so that they
can improve on them. Kasper et al. (2006), suggests that service quality is one of the
factors that affect customer satisfaction. Universities have therefore to satisfy their
students in order to compete. Service quality leads to customer satisfaction and loyalty
(Kasper et al., 2006).
The research objective is to find out the relationship between service quality and student
satisfaction and the nature of the relationship. A positive relationship is an indication
that student satisfaction increases when service quality increases while a negative
relationship is an indication of the decrease in satisfaction as a result of an increase in
quality. This research also shows which of the service quality dimensions is more
important than the others.
There is some research that has been done in Europe and Asia on service quality and
customer satisfaction (Abdullah 2006: Sulieman 2013: Wilkins & Balakrishnan, 2013).
The original study by Abdullah (2006) was about finding a tool for measuring service
quality in higher education. The study concluded that the current tools for measuring
service quality in higher education were not appropriate and therefore a new tool known
as HEdPERF was introduced. A study by Sulieman (2013) on housing bank in Jordan
bank found that the dimensions of service quality have an effect on customer
satisfaction. Similarly another study by Wilkins & Balakrishnan (2013) found out that
students in branch campuses of foreign universities with branch campuses in United

10
Arab emirates (UAE) were satisfied with their institutions because of the quality of the
lecturers at their campuses, availability of resources and the effective use of technology.
In Kenya, there are studies that have been carried out on service quality and customer
satisfaction. Otemba (2012) carried out a study on the telecommunications sector that
was based on the five dimensions of service quality. The study found out that the five
dimensions of service quality had an effect on customer satisfaction. Another study
carried out by Mabinda (2012) on audit quality and customer satisfaction found that
firm image, price and empathy had an effect on customer satisfaction. This study is
relevant because it deals with the service quality in higher education, as there are not
many studies that have been carried out in this area.
The main difference between students and other customers is that there are slightly
different dimensions used to evaluate service quality as shown in the HEdPERF model
explained under literature review. So far, it does not appear as if this type of research
has been carried out in Kenya and therefore this study fills this gap.
The research questions are:
1. Is there any relationship between service quality and student satisfaction?
2. What is the type of relationship that exists between service quality and student
satisfaction?
3. Which dimensions are the most important?

11
1.3 Research Objective
The research objective is to determine the relationship between service quality
dimensions and student satisfaction.
1.4 Value of the Study
This study will benefit the Universities because it shows the relationship between
service quality and student satisfaction. This information can be used as input for future
decisions on service design based on what students have indicated are the most
important dimensions of service quality in this model.
The Commission for University Education being the body that is responsible for
regulating universities will want to find out if students are getting value for their money.
Since this research does not cover all universities in Kenya, further studies in this area
are necessary and therefore researchers may want to use this study in future. Academics
may also want to use it for academic reasons.

12
CHAPTER TWO: LITERATURE REVIEW
2.1 Introduction
This review discusses definitions of services, service quality, student satisfaction, and
the relationship between service quality and student satisfaction. It also deals with
service quality in higher education and explains the various methods or models used to
measure service quality. Finally, it recommends HEdPERF as the appropriate model
for this study.
There are many definitions of services but none has been accepted so far as the main
one. The following are cited as examples.
“A service is a process consisting of more or less intangible activities that normally but
necessarily always take place in interactions between the customer and the service
employees and/or physical resources or goods or systems of the service provider which
are provided as solutions to customer problems.” (Gronroos, 2007).
“A service is a time-perishable intangible experience performed for a customer acting
in the role of co-producer.” (Fitzsimmons & Fitzsimmons, 2011).
Most definitions emphasis intangibility and participation as the main characteristics of
the service product. Apart from these, services also have simultaneity and heterogeneity
as characteristics. Intangibility means that a service cannot be touched but can only be
experienced. Participation means that the customer is involved in the production

13
process while simultaneity means that the service has to be produced and consumed at
the same time. Perishability means that a service cannot be stored while heterogeneity
means that the process cannot create exactly the same experience for every customer
and therefore some variation may take place.
Services are presented to the consumer as a package also known as a bundle of goods
and services (Fitzsimmons & Fitzsimmons, 2011). Fitzsimmons and Fitzsimmons,
(2011) explain further that the five features of this bundle are support facility, the goods
used to support the service, the information obtained from the customer, explicit
services or benefits easily identifiable and implicit services or benefits that are vaguely
experienced by the customer.
2.2 Service Quality
There is no generally accepted definition of service quality. However most authors
describe service quality in terms of the gap between customer perception and customer
expectation. Customer perception is what the customer thinks of the service that has
been performed and customer expectation is what the customer was expecting to
receive.
Parasuraman et al. (1985) developed the gap model that explains gaps that may arise in
between what the customer expects to receive and what the organization provides. It is
composed of five gaps linked together. Gap one occurs as result of management’s
misunderstanding of the customer’s needs from the market research carried out. Gap

14
two is as a result of the designer’s misinterpretation of the information passed on from
market research while gap three is the conformance gap and arises when staff fail to
perform the service as stipulated by the standards that have been put by the
organization.
Gap four is the communication gap, which arises due to the wrong information being
passed on to the customer. This means that the customer is not informed of what goes
on in the background and therefore may interpret delays as failure when this is not the
case. Gap five is the difference between what the customer expects and what the
customer thinks of the service that has been received.

15
From: Parasuraman, A., Zeithaml, V. A., and Berry, L. L. (1985).A Conceptual Model
of Service Quality and Its Implications for Future Research.Journal of Marketing,
49(4), pages 41–50.
Retrieved 29th August 2013, from http://www.ebscohost.com

16
2.3 Student Satisfaction
According to Bateson and Hoffman (1999), most experts agree that customer
satisfaction is a short term transaction specific measure while service quality is an
attitude formed over a long term evaluation of performance. Elliott & Healy (2001)
define student satisfaction as short-term attitude resulting from an evaluation of a
student’s educational experience. There is not much difference between the two terms
because the student is just another kind of customer who is a consumer of the education
service and therefore most of the literature on service marketing will apply.
There is a general agreement among experts that there is a relationship between service
quality and customer satisfaction but what is not clear is the direction of this
relationship as some like Parasuraman et al. (1985) and Cronin Jr and Taylor, (1992)
say that service quality comes before customer satisfaction. On the contrary according
to Bitner (1990) customer satisfaction comes before service quality
Some recent studies in this area have also supported the view that service quality leads
to customer satisfaction. A study carried out by Sulieman, (2013) on Jordanian banks
revealed that the five dimensions of service quality have an effect on level of customer
satisfaction. Another study conducted in United Arab Emirates on branch campuses of
some international universities found that qualified lecturers, technology and other
resources had an effect on student satisfaction (Wilkins & Balakrishnan, 2013).

17
However, student satisfaction levels seemed to vary with nationalities and programs.
The researchers explained that this could probably be because of the different cultures
and backgrounds that the students come from. They therefore recommended further
research in other parts of the world as their conclusions could not be generalised.
In view of the cultural and environmental differences that exist between Kenya and the
countries where these studies were carried out it was the researcher’s view that this
study be carried out in Kenya to find out if service quality offered by Kenyan
universities has an effect on student satisfaction.
2.4 Service Quality in Higher Education
Quality in higher education is an issue that has been addressed by various institutions.
In the United Kingdom quality assurance is managed by Quality Assurance Agency for
Higher Education (QAA) which is a non-profit organisation (“More about us and our
work,” n.d.). Similarly in in the United states quality assurance is managed by non-
profit organisations that are run by the universities themselves (El-Khawas, 2001:
“Council for Higher Education Accreditation: Accreditation Serving the Public
Interest,” 2012). In Kenya quality assurance is managed by a government funded
organization known as the Commission for University education (“Vision and
Mission,” n.d.)
Apart from these there have been attempts by the universities themselves to introduce
or demonstrate quality assurance through the use of total quality management
techniques and ISO certifications (Evans, 2011: Lundquist, 1997). Some of the
universities have stated that they have benefitted from the application of these systems.

18
In Kenya out of the 31 private universities only two are ISO certified (“Certified firms
on ISO 9001:2008 Quality Management systems, qms,” n.d.: Gudo, Oanda, & Olel,
2011).
The other method that is common in British and American universities is what is known
as student evaluation of teaching or SET (Johnson, 2000). At the end of the semester
students are issued with forms to fill that have questions on how the lectures were
conducted by a particular lecturer. SET assessments can be used as the basis for
promotions and other rewards.
A number of universities have also used SERVQUAL model or some of its
modifications to measure service quality (Oldfield & Baron, 2000: Wilkins &
Balakrishnan, 2013:Barnes, 2007).
2.5 Measuring Service Quality and Student Satisfaction
Various authors have slightly different approaches on the models for measuring service
quality but most of them mention SERVQUAL or one of its adaptations in their
discussion. Palmer (2005) refers to performance-only measures, disconfirmation
models, and importance-performance approaches. Performance-only measures are
those models that deal only with performance and leave out expectation in the
calculation. An example is the SERVPERF model developed by Cronin Jr and Taylor,
(1992) which is a variation of the of the SERVQUAL model. Disconfirmation

19
approaches are models that explain service quality in terms of expectation and
perception but cannot be used to measure service quality (Kasper et al., 2006).
The SERVQUAL model was developed by Parasuraman et al. (1985) in 1985 and was
later refined in 1988. It has reliability, assurance, tangibles, empathy, and
responsiveness as its main dimensions and is used to measure the service quality gap,
which is the gap between expectation and perception. It is expressed as Q=P-E where
Q is the quality gap, P is the Perception of the service received and E is the expected
service.
SERVQUAL has been criticised for among other things the fact that expectation is
measured in order to assess the gap. The problem with measuring expectation is that it
cannot be measured before the service is provided, as this would have been past
expectation. Similarly, it cannot be measured after the service has been provided
because expectations may change in the course of offering the service. For this reason
Cronin Jr and Taylor (1992), came up with a new tool called SERVPERF that was
based on the SERVQUAL model but without the expectations part of the equation.
This tool measures performance of the service and not the gap as is the case with
SERVQUAL. Cronin Jr and Taylor (1992) claimed that their tool had superior
performance. Other studies have shown similar results. Theoretically, SERVQUAL is
superior because in service quality it is the gap that should be measured and not
performance only. However since both tools give similar results, for practical reasons
SERVPERF is preferred because it is easy to apply.

20
Higher Education Performance (HEdPERF) described in the next section is one of the
models used to measure service quality in higher education institutions.
2.6 Higher Education Performance Model
Higher Education Performance (HEdPERF) is a tool developed by Abdullah (2006) to
measure service quality in higher education Institutions. Parasuraman et al. (1988) have
recommended that their model be adapted or modified to suit specific situations.
In coming up with HEdPERF Abdullah (2006) argued that the original SERVQUAL
model and the revised version of SERVPERF were too generic to apply to higher
education institutions. HEdPERF is theoretically the same as SERVPERF because it
measures performance only and not the expectations performance gap like the case is
with the SERVQUAL model.
The original version had academic aspects, non-academic aspects, reputation, access,
program issues and understanding as its dimensions. The revised version omits
understanding as one of its dimensions and therefore has five dimensions.
HEdPERF has been found to perform better when compared to SERVQUAL and
SERVPERF in academic institutions. The five dimensions are broken down or
operationalized into 41 items. HEdPERF will be used for this study because it is more
specific to higher education institutions.

21
Conceptual Model
Hypothesis
H0 There is no relationship between service quality and student satisfaction.
H0: b1=b2=b3=b4=b5= 0
HA: There is a relationship between service quality and student satisfaction.
HA: at least one bi not equal to zero

22
Non-Academic Aspects
These are mostly services offered by non-academic staff. Examples of these are library
services, financial services, admissions, dean of students, hostels, cafeteria and other
services that do not involve actual teaching of students. Staff offering these services are
being evaluated on their performance and willingness to help students.
Academic Aspects
In this category are activities like teaching, setting examinations and marking. The
academic staff are assessed on their knowledge of the subjects they teach, appearance,
and willingness to help students.
Reputation of the Institution
The reputation of a particular university in the eyes of the public and employers is
important because it has an effect on the employability of its graduates. Employers will
shun institutions that have bad reputations because they associate poor quality with
them.
Access
Accessibility of the institution in terms of distances, communication channels like
telephones and email is important. Students prefer institutions that are close to where
they live or which have nearby accommodation and staff who answer their queries
promptly.

23
Program Issues
This factor emphasises the importance of offering a variety of reputable academic
programs in a flexible manner.
Regression Model
• SS = b0 + bixi …….. + b5x5 + e
• Where,
• SS= Student satisfaction.
• b0 = Constant
• b1x1 = Non-Academic aspects.
• b2x2 = Academic aspects.
• b3x3 = Reputation.
• b4x4 = Access.
• b5x5 = Program Issues.
The regression model expresses the relationship between student satisfaction and
various dimensions of service quality. The independent variables are non-academic
aspects, academic aspects, reputation, access and program issues. The dependent
variable is student satisfaction.

24
CHAPTER THREE: RESEARCH METHODOLOGY
3.1 Research Design
The research design is descriptive, cross-sectional and statistical. It is a correlational
study. A correlational study is used when relationships between two or more variables
are being investigated. Research studies can also be classified according to how the data
is going to be obtained. They can be categorised as empirical, experimental, or case
study. This study is an empirical study that uses primary data obtained from a survey.
It is correlational because the objective of the study is to find out the relationship
between the two variables of service quality and student satisfaction.
3.2 Population
The population is all undergraduate students of private universities operating in Nairobi
County. These universities are expected to have around 60,000 students (Waruru,
2013). The study focused on undergraduate students who are expected to be an
homogeneous group as their programmes are similar because they are regulated by
CUE. No distinction is made between the day and evening students. The sample frame
(list) is the undergraduate students of these universities.
3.3 Sample Design
Cochran’s formula for sample size is used for most samples that have a single variable
and large populations. In cases where there are several variables other methods like
Krejcie and Morgan’s (1973) table (as cited by Sekaran and Bougie, 2010) are used.
Using Krejcie and Morgan’s table the sample size for a population of 70,000 is 382.

25
The sample size of 377 was adopted for this study because the population is estimated
to be 60,000 students.
The sampling procedure used for the sample is purposive sampling because of the
problem of obtaining accurate students registers from which to sample from.
3.4 Data Collection
Data was collected through a questionnaire based on the 41 questions of the HEdPERF
model and five questions for satisfaction. The questionnaire scales were based on the 7
point Likert scale, which is used in similar studies (Wilkins & Balakrishnan, 2013). The
students were interviewed in common areas like the Cafeteria, lecture theatres or
Library since this is where most of them are likely to congregate.
3.5 Data Analysis
Data was edited to remove outliers or any unusual responses. It was then coded for
analysis with the computer using a statistical package called PSPP. The model used to
analyse the data is multiple regression. Multiple regression is used when there are many
independent variables and dependent variables. In this case, there are five independent
variables and one dependent variable. These are academic aspects, non-academic
aspects, reputation, access and program issues which are compared with satisfaction.
The advantage of using multiple regression instead of simple regression is that multiple
regression gives a single value for R unlike simple regression, which gives five answers

26
for the five dimensions. R measures correlation relationship between the variables. A
negative value indicates a negative relationship while a positive value indicates a
positive relationship. The strength of the relationship is shown by the value of R. Apart
from correlation and regression model descriptive statistics like means and standard
deviations were also used to analyse the data

27
CHAPTER FOUR: RESEARCH FINDINGS, RESULTS AND
DISCUSSION
4.1 Introduction
This chapter deals with data collection analysis and discussion of the results.
The statistics used to analyses the data and the methods used to identify the universities
that were sampled are also explained.
4.2 Sampling procedure and data collection
Out of the 31 accredited private universities, only 25 have campuses in Nairobi County.
This information is available from the CUE website and the websites of the universities
listed in the CUE website. Requests for authority to collect data were sent to a number
of these universities but only a few responded with the rest declining for various
reasons. Among those universities that agreed to participate in the survey, 180
questionnaires were sent out of which 118 were returned properly filled.
4.3 Data Analysis
The completed questionnaires were checked for accuracy before entering the data in
Microsoft Excel Spreadsheet for the initial processing. The initial process involved
entering the values for the responses in the spreadsheet and calculating the means for
each variable based on the number of questions for that variable in the questionnaire.
For example, a mean is calculated for the responses to the nine questions that appear

28
under Academic aspects to represent that variable in the questionnaire for a particular
respondent. For each questionnaire, therefore there are means for the dependent
variable student satisfaction, and the independent variables of Non-academic aspects,
Academic aspects, Reputation, Access and Program issues. For each of the 118
respondents there are six items of data representing these variables. Data was edited
further to remove errors that result from non-responses. Non-responses or nulls that
appear on the spreadsheet were replaced with zeros.
The information from the spreadsheet was saved as a text file and imported into PSPP
for further processing. Multiple regression was performed on the data using PSPP and
then Microsoft Excel. Similar results were obtained from both applications. For the
purpose of obtaining descriptive statistics like means and standard deviations for the
questions in the questionnaire, codes were allocated to represent the 41 questions on
service quality and the five questions on satisfaction. These were used as variables in
PSPP.

29
4.4 Results
Table 4.1
Means and standard deviations for the questionnaire items on service quality Variable No Mean Std Dev
N7 116 5.94 1.46
AM9 116 5.81 1.56
R1 115 5.7 1.59
AM1 116 5.69 1.44
R8 111 5.68 1.47
N11 117 5.64 1.35
AM6 116 5.64 1.55
R3 113 5.62 1.47
AM5 115 5.5 1.49
R7 113 5.5 1.8
N8 112 5.49 1.51
N13 118 5.37 1.75
A3 110 5.35 1.78
P2 117 5.34 1.7
N10 116 5.32 1.47
AM7 115 5.3 1.57
AM3 117 5.29 1.64
AM8 115 5.29 1.65
A1 110 5.29 1.69

30
Table 4.1 continued...
Means and standard deviations for the questionnaire items on service quality Variable No Mean Std Dev
N9 116 5.28 1.66
AM4 116 5.28 1.49
A2 114 5.28 1.62
N4 114 5.26 1.54
AM2 116 5.24 1.59
N5 113 5.17 1.77
R4 114 5.15 1.71
A7 109 5.13 1.63
R6 116 5.08 1.87
P1 115 5.05 1.82
R9 114 5.04 1.78
N12 116 5.03 1.77
A5 115 5.02 1.91
N1 117 4.88 1.76
N2 117 4.78 1.75
A6 113 4.78 1.81
N6 116 4.69 1.78
A4 114 4.63 1.81
R10 117 4.61 1.89
N3 118 4.53 1.86
R5 111 4.12 2.04 R2 112 3.57 2.13
The data in Table 4.1 shows the means and standard deviations calculated from the 41
questions of the questionnaire on service quality. According to the information from
the table items that were rated well in terms of quality are those relating to convenient
opening hours (N7) whose mean was 5.94, followed experienced and knowledgeable
academic staff (AM9) at 5.81 and professional appearance and image of the university
(R1) at 5.7. This means that the respondents do somewhat agree that there is some
quality offered by these institutions. Of the three top rated issues, professional

31
appearance and image of the university (R1) had the highest standard deviation of 1.59.
The high variance could probably be due to the different backgrounds of these
institutions. The least rated issues were hostel facilities (R2) at 3.57 and recreation
facilities (R5) at 4.12. This could probably be because most of the universities operating
in the city centre do not have these facilities in their campuses due to shortage of space.
Table 4.2
Means and standard deviations for the questionnaire items on satisfaction Variable No Mean Std Dev
SAM 113 5.19 1.65
SA 114 5.14 1.58
SR 114 5.1 1.71
SP 114 4.89 1.78
SN 72 4.67 1.65
Table 4.2 shows information on means for questions on student satisfaction. According
to the table, the respondents were somewhat satisfied with the academic aspects of their
universities (SAM). The mean for academic aspects was the highest at 5.19 followed
by access to the university (SA) at 5.14 and reputation of the institution (SR) at 5.1.
The respondents were indifferent to non-academic staff issues (SN) and program issues
(SP) which had the lowest means. This means that the students were neither satisfied
nor dissatisfied.

32
Table 4.3
Means for determinants of service quality and student satisfaction Variable Service quality Mean Satisfaction Mean
Academic aspects 5.44 5.19
Access 5.066 5.14
Reputation 5.007 5.1
Program issues 5.198 4.89
Non Academic aspects 5.181 4.67
The information on table 4.3 compares the means of the five service quality
determinants with means for satisfaction. The results show that the respondents do
agree that they are they are getting some quality from the universities they are studying
in. They are also somewhat satisfied with what they are getting in the areas of
academics, access to the institution and the reputation of their institution. They are
however not too happy on issues related to the delivery of services by non-academic
staff and program issues.
Table 4.4
Multiple Regression Results
R R Square Adjusted R Square Std. Error of the
Estimate
0.59 0.35 0.32 1.44
Notes Correlation coefficient R= 0.59, Coefficient of determination R
squared =0.35 or 35% of total variation

33
Table 4.4 shows the correlation between service quality dimensions and student
satisfaction. The correlation R which is 0.59 is an indicator of how strong the
relationship is. It shows a positive relationship between the two variables which means
that service quality tends to increase with student satisfaction. A correlation of between
0.4 and 0.69 is regarded as a strong positive relationships and therefore it can be
concluded that service quality and student satisfaction have a strong positive
relationship. An increase in one leads to some proportionate increase in the other.
Table 4.5
Analysis of Variance (ANOVA)
Sum of
Squares
Df Mean Square F Significance
Regression 122.51 5 24.5 11.82 0.00
Residual 232.13 100 2.07
Total 354.64 117
Notes F-Statistic p value=0.00 (p<0.05).Reject null hypothesis
Table 4.5 is the ANOVA table that breaks down the variations and shows the
significance of the model. According to the table out of the total variation of 354.64
only 122.51 or 34% can be explained by the model. The significance of the F value is
given as zero which is far below p value of 0.05. This means that the null hypothesis
that states that the coefficients of the regression model could be zero is rejected because
there is very little chance that the variations occurred randomly.
34
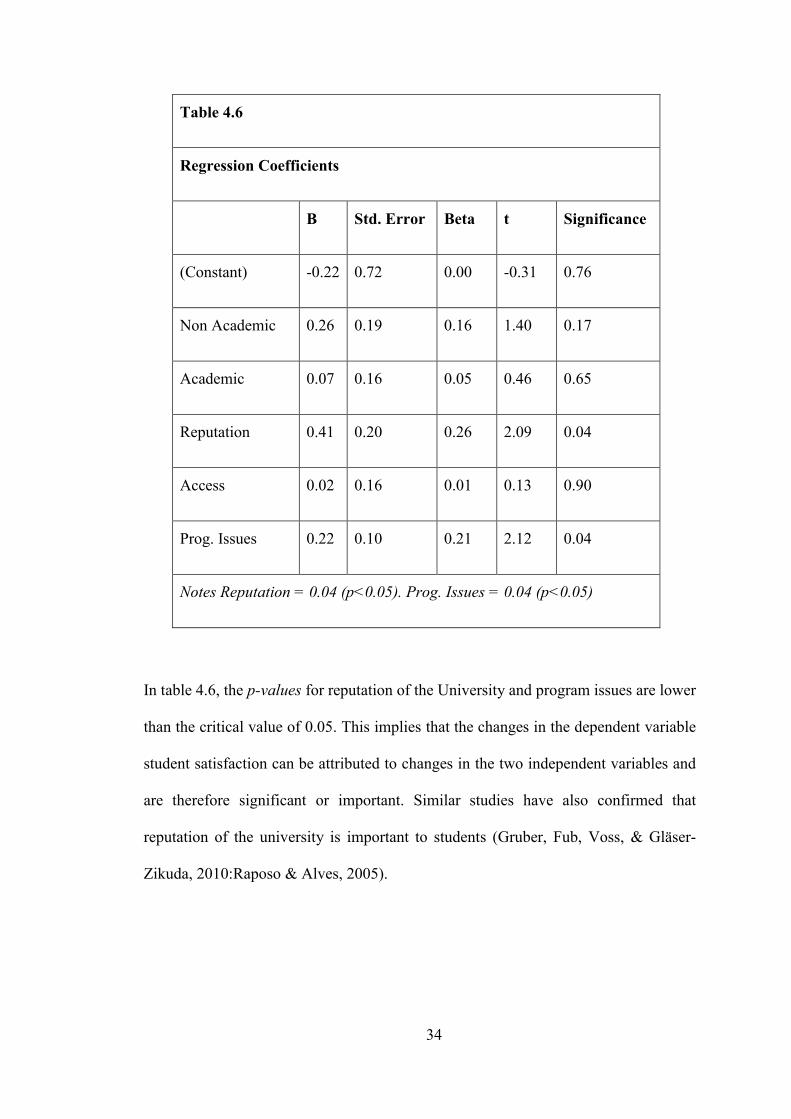
Table 4.6
Regression Coefficients
B Std. Error Beta t Significance
(Constant) -0.22 0.72 0.00 -0.31 0.76
Non Academic 0.26 0.19 0.16 1.40 0.17
Academic 0.07 0.16 0.05 0.46 0.65
Reputation 0.41 0.20 0.26 2.09 0.04
Access 0.02 0.16 0.01 0.13 0.90
Prog. Issues 0.22 0.10 0.21 2.12 0.04
Notes Reputation = 0.04 (p<0.05). Prog. Issues = 0.04 (p<0.05)
In table 4.6, the p-values for reputation of the University and program issues are lower
than the critical value of 0.05. This implies that the changes in the dependent variable
student satisfaction can be attributed to changes in the two independent variables and
are therefore significant or important. Similar studies have also confirmed that
reputation of the university is important to students (Gruber, Fub, Voss, & Gläser-
Zikuda, 2010:Raposo & Alves, 2005).

35
Table 4.7
Correlation Matrix
Non Academic Academic Reputation Access
Prog. Issues
Non Academic 1 0.69 0.63 0.57 0.53
Academic 1 0.67 0.58 0.46
Reputation 1 0.67 0.59
Access 1 0.5
Prog. Issues 1
The correlation matrix in table 4.7 shows correlations between the independent
variables in the regression model. It is an indication that apart from the correlation
between the five service quality dimensions and students satisfaction the independent
variables also tend to vary with each other. This is known as multicollinearity.
Multicollinearity in itself does not invalidate the multiple regression model but instead
it gives us an indication of how the regression coefficients have been inflated. It is
considered significant when it exceeds the value or R. In table 4.6 the correlations
between non-academic aspects and Academic aspects, non-academic aspects and
reputation, academic aspects and reputation, reputation and access, and finally between
reputation and program issues all appear to be significant because they have
correlations with higher values compared to R.
The fact that there are correlations between the independent variables, though not
unusual, could be an indication that changes in the affected variables could lead to
changes in other independent variables.

36
4.5 Interpretation and Discussion of the Results
The results show that there is a positive relationship between service quality and student
satisfaction as shown by the positive correlation coefficient of 0.59. The coefficient of
determination R square is the statistic that gives a measure of total variation that can be
explained by the model. As demonstrated in table 4.4 it has a value of 0.35. This means
that about 35% of the total variation of the students’ satisfaction variable is explained
by the five independent variables.
The main objective of this study was to find out if there is a relationship between service
quality and students satisfaction. This objective has now been achieved by the findings
that confirm that there is a positive relationship between the two variables
Research question number three is also answered by table 4.6 that shows that reputation
of the university and program issues are the most important issues that affect student
satisfaction for the students in these universities.
The other information obtained from this study is that students do feel that they are
receiving quality from their universities and that they are somewhat satisfied with what
they are getting.

37
CHAPTER FIVE: SUMMARY CONCLUSION AND
RECOMMENDATIONS
5.1 Summary
This study focused on finding out whether there is a relationship between service
quality and students satisfaction of students in private universities operating in Nairobi
County. The importance of the two variables to universities was also stressed. It was
mentioned that because universities want to compete they might want to know what
contributes to their students’ satisfaction because satisfied students may want to return
or tell other potential students about the institution. According to the literature,
reviewed service quality is one of the variables that may lead to student satisfaction and
therefore knowledge about the relationship between the two is important to these
institutions.
The model used to evaluate service quality is known as HeDPERF which is short form
for Higher Education Performance and is based the perception of the respondent on
services provided by the institution. Similar models that are based on perception like
SERVPERF were also mentioned. The research methodology used was descriptive and
cross-sectional. Purposive sampling was used for sample selection. A total of 180
questionnaires were sent out of which 118 were properly completed and returned. Data
was analysed through statistical software using a descriptive statistics and multiple
regression model of five independent variables that represent service quality. These
variables are Non-academic aspects, Academic aspects, Reputation, Access and
program issues. The dependent variable is student satisfaction.

38
The results show that there is a relationship between service quality and student
satisfaction and that reputation and program issues are the most important issues among
the five determinants of service quality that can affect student satisfaction in the
universities surveyed.
5.2 Conclusion
The objective of this study was to find out whether there is a relationship between
service quality and student satisfaction. The results show that there is a positive
relationship between service quality and student satisfaction. The model used also
demonstrated that what students care most about is the reputation of the university and
program issues. These findings are important to the universities because they help them
to focus on what is important to the students.
5.3 Recommendations
This study had a number of limitations. Some of these had to do with the time available,
the resources available, and the bureaucracy of the institutions in the study. In some
cases, it can take these institutions up to a month before permission to conduct the
survey is granted. This is due to the number of people who have to be consulted. Others
refused to participate in the survey citing confidentiality among other reasons.
By the time the study was completed some universities had not decided whether to give
consent to requests that were still under consideration. Probably with more time, they
would have done this, which would have then resulted in a higher response rate.

39
Because of the small number of institutions that participated in the survey the findings
of this study cannot therefore be generalised. Future studies in this area should also
cover the whole country and probably also include public universities because they are
all competing in the same market.

40
REFERENCES
Abdullah, F. (2006). The development of HEdPERF: a new measuring instrument of
service quality for the higher education sector. International Journal of
Consumer Studies, 30(6), 569–581. doi:DOI: 10.1111/j.1470-
6431.2005.00480.x
Alves, H., & Raposo, M. (n.d.). The influence of university image on student behaviour.
International Journal of Educational Management, 24(1), 73–85.
doi:10.1108/09513541011013060
Barnes, B. R. (2007). Analysing Service Quality: The Case of Post-Graduate Chinese
Students. Total Quality Management & Business Excellence, 18(3), 313–331.
Bateson, J. E. G., & Hoffman, K. D. (1999). Managing services marketing (4th ed.).
Fort Worth: The Dryden Press.
Bitner, M. J. (1990). Evaluating Service Encounters: The Effects of Physical
Surroundings and Employee Responses., 54(2), 69–82.
Brennan, L., & Bennington, L. (2000). Concepts in Conflict: Students and Customers–
An Australian Perspective. Journal of Marketing for Higher Education, 9(2),
19–40. doi:10.1300/J050v09n02_02
Council for Higher Education Accreditation: Accreditation Serving the Public Interest.
(2012). Council for Higher Education Accreditation. Retrieved from
http://www.chea.org/pdf/chea-at-a-glance_2012.pdf
Cronin Jr, J., & Taylor, S. (1992). Measuring Service Quality: A Reexamination and
Extension. Journal of Marketing, 56(3), 55–68.

41
El-Khawas, E. (2001). Accreditation in the USA: Origins,dvelopments and future
prospects. International Institute for Educational planning. Retrieved from
http://unesdoc.unesco.org/images/0012/001292/129295e.pdf
Elliott, K. M., & Healy, M. A. (2001). Key Factors Influencing Student Satisfaction
Related to Recruitment and Retention. Journal of Marketing for Higher
Education, 10(4), 1–11. doi:10.1300/J050v10n04_01
Evans, J. R. (2011). The management and control of quality (8th ed.). South-Western-
Cengage Learning (USA).
Evans, J. R., & Collier, D. A. (2007). Operations Management: An Integrated
Approach to goods and services. (International Student Edition.). Mason, OH,
USA: Thomson/South-Western.
Fitzsimmons, J. A., & Fitzsimmons, M. J. (2011a). Service Management (7th ed.).
Boston: McGrawhill.
Fitzsimmons, J. A., & Fitzsimmons, M. J. (2011b). Service Management (7th ed.).
Boston: McGrawhill.
Gronroos, C. (2007). Services Management and Marketing (Third.). Chichester,
England: John Wiley and sons ltd.
Gruber, T., Fub, S., Voss, R., & Gläser-Zikuda, M. (2010). Examining student
satisfaction with higher education services: Using a new measurement tool.
International Journal of Public Sector Management, 23(2), 105 – 123.
Gudo, C. O., Oanda, I. O., & Olel, M. . (2011). Role of Institutional Managers in Quality
Assurance: Reflections on Kenya’s University Education. Australian Journal of
Business and Management Research, 1(2).

42
Johnson, R. (2000). The Authority of the Student Evaluation Questionnaire. Teaching
in Higher Education, 5(4), 419–434. doi:10.1080/713699176
Kasper, H., Helsdingen, P. van, & Gabbott, M. (2006). Services marketing management
(2nd ed.). Chichester, England: John Wiley and sons ltd.
Lundquist, R. (1997). Quality Systems and ISO 9000 in Higher Education. Assessment
& Evaluation in Higher Education, 22(2), 159–172.
doi:10.1080/0260293970220205
Mabinda, B. B. (2012). Relationship between audit quality attributes and client
satisfaction for companies quoted at the stock exchange. University of Nairobi,
Nairobi.
Mark, E. (2013). Student satisfaction and the customer focus in higher education.
Journal of Higher Education Policy and Management, 35(1), 2–10.
doi:10.1080/1360080X.2012.727703
More about us and our work. (n.d.). The Quality Assurance Agency for Higher
Education. Retrieved from http://www.qaa.ac.uk/WorkWithUs/Pages/About-
QAA.aspx
Oldfield, B. M., & Baron, S. (2000). Student perceptions of service quality in a UK
university business and management faculty. Quality Assurance in Education,
8(2), 85–95. doi:10.1108/09684880010325600
Otemba, J. . (2012). Service quality dimensions and customer Satisfaction in the kenyan
telecomunications. University of Nairobi, Nairobi.
Palmer, A. (2005). Principles of services marketing (4th ed.). London: McGrawhill.

43
Parasuraman, A., Zeithaml, V. A., & Berry, L. L. (1985). A Conceptual Model of
Service Quality and Its Implications for Future Research. Journal of Marketing,
49(4), 41–50.
Parasuraman, A., Zeithaml, V. A., & Berry, L. L. (1988). SERVQUAL: A Multiple-
Item Scale for Measuring Consumer Perceptions of Service Quality. Journal of
Retailing, 64(1), 5–6.
Raposo, M., & Alves, H. (2005). Marketing higher education: students’ service
expectations. HEW, EconWPA. Retrieved from
http://EconPapers.repec.org/RePEc:wpa:wuwphe:0511005.
Schwartzman, R. (1995). Are students customers? The metaphorical mismatch
between management and education. Education, 116(2), 215.
Sekaran, U., & Bougie, R. (2010). Research methods for business (5th ed.). Chichester,
England: John Wiley and sons ltd.
Slack, N., Chambers, S., & Johnston, R. (2010). Operations management (6th ed.).
Harlow, England: Financial Times Prentice Hall.
Sulieman, A. (2013). Basic dimensions of the (servqual model) and its impact on the
level of customer satisfaction: an empirical study of the housing bank in karak,
jordan. European Scientific Journal, 9(1). Retrieved from
http://eujournal.org/index.php/esj/article/view/690
Vision and Mission. (n.d.). Commission for University Education. Retrieved from
http://www.cue.or.ke/about-us/vision-and-mission

44
Vuori, J. (2013). Are Students Customers in Finnish Higher Education? Tertiary
Education and Management, 19(2), 176–187.
doi:10.1080/13583883.2013.784926
Waruru, M. (2013, October 5). Thriving private universities compete for students.
University World News. London. Retrieved from
http://www.universityworldnews.com/article.php?story=20131002162621160
&query=kenya
Wilkins, S., & Balakrishnan, M. S. (2013). Assessing student satisfaction in
transnational higher education. International Journal of Educational
Management, 27(2), 143 – 156.
Wright, N. J., & Race, P. (2004). The Management of Service Operations (2nd ed.).
London: Thomson Learning.

45
APPENDICES
Appendix I
List of private university campuses in Nairobi County.
Name of institution
Date
awarded
Charter or
LIA Physical address
University of Eastern Africa Baraton 1991
Ngong Rd,
Kindarumast.
Catholic University of Eastern Africa
(CUEA) 1992 Langata
Daystar University 1994
Ngong Rd Kenyatta
roundabout
United States International University 1999 Thika Rd
Africa Nazarene University 2002 Stanbank Moi avenue
Kenya Methodist University 2006 University way
St. Paul’s University 2007 Moi avenue
Pan Africa Christian University 2008 Kamiti Rd
Strathmore University 2008 Ole sangale
Kabarak University 2008 Wabera st.
Mount Kenya University 2011 Moi avenue
Africa International University 2011 Karen
Great Lakes University of Kisumu
(GLUK) 2012 Opp. Kenyatta Market
KCA University 2013 Thika road
Adventist University of Africa 2013 Magadi road
Kiriri Women’s University of Science
and Technology 2002 Westlands
Aga Khan University 2002 Aga Khan hospital
Presbyterian University of East Africa 2008 Moi avenue - Bazaar
Inoorero University 2009 Forest Road
GENCO University 2010
Mombasa Road
Parkside towers
Management University of Africa 2011 Mbugani Estate
Riara University 2012 Mbagathi Road
Pioneer International University 2012 Opposite Kie
Nairobi International School of
Theology
Kilimani -
MutitoAndei road
East Africa School of Theology Buru Buru

46
APPENDIX II
Questionnaire
This survey is used in partial fulfilment of the Master’s Degree in Business
Administration at the University of Nairobi. It is anonymous and confidential.
Are you an undergraduate student? If yes kindly, answer the questions below by ticking
on the appropriate box.
Course student is enrolled in……………. Questionnaire No
Service Quality
1=Strongly disagree 2= disagree 3= Somewhat disagree, 4= Neither agree or
disagree 5== Somewhat agree 6= Agree 7= Strongly agree.
Determinant Operational component Service quality.
1 2 3 4 5 6 7
Non Academic aspects
Sincere interest in solving problem
Caring and individualized attention
Efficient/prompt dealing with complaints
Responding to request for assistance
Accurate and retrievable records
Promises kept
Convenient opening hours
Positive attitude
Good communication
Knowledgeable of systems/procedures
Feeling secured and confident
Service within reasonable time frame
Confidentiality of information

47
Determinant Operational component Service quality.
1 2 3 4 5 6 7
Academic aspects
Knowledgeable in course content
Caring and courteous staff
Responding to request for assistance
Sincere interest in solving problem
Positive attitude
Good communication
Feedback on progress
Sufficient and convenient consultation
Educated and experience academicians
Determinant Operational component Service quality.
Reputation
1 2 3 4 5 6 7
Professional appearance/image
Hostel facilities and equipment
Academic facilities
Internal quality programmes
Recreational facilities
Minimal class sizes
Ideal campus location/layout
Reputable academic programmes
Easily employable graduates
Health services

48
Determinant Operational component Service quality.
1 2 3 4 5 6 7
Access
Equal treatment and respect
Fair amount of freedom
Easily contacted by telephone
Counselling services
Student’s union
Feedback for improvement
Service delivery procedures
Determinant Operational component Service quality.
1 2 3 4 5 6 7
Program Issues
Variety of programmes/specializations
Flexible syllabus and structure
Satisfaction
1=Completely dissatisfied 2= Mostly dissatisfied 3= Somewhat dissatisfied, 4 =
Neither Satisfied or dissatisfied, 5= Somewhat Satisfied, 6= Mostly Satisfied 7=
Completely Satisfied.
Determinant Student Satisfaction
Non Academic
aspects
1 2 3 4 5 6 7
Academic aspects
Reputation
Access
Program Issues