servicenow, inc. (now) - kerrisdalecap.com · servicenow, inc. (now) ... programmable code can lead...
TRANSCRIPT

November 2012
ServiceNow, Inc. (NOW)
We believe that ServiceNow, Inc. (“NOW” or the “Company”) is highly overvalued. The Company was taken public earlier this year at $18/share and has since ridden the cloud computing wave to a price of $30/share, implying an eye-popping 18.3x 2012E revenue multiple. Even if ServiceNow becomes the market leader and grows its share of the $1.5bn IT Help Desk market from the current 10%-15% to 30%, we believe the stock is still worth less than half of its current trading price. We have spoken to numerous industry professionals about ServiceNow and the IT Service Management (“ITSM”) sector, and our research indicates that ServiceNow does not have a sustainable competitive advantage over its numerous public and private peers. The Company has become a victim of its own success by helping to galvanize a previously dormant industry to rapid innovation. NOW does not offer a unique technology; rather, it merely introduced the SaaS business model to a sector where slow-moving incumbents had frustrated certain segments of their customer base through cumbersome upgrades and lumpy up-front costs. Its adoption of a SaaS solution, combined with an aggressive salesforce, helped NOW gain market share at the expense of larger players. Today, however, the competitive landscape is changing, with both incumbents and a slew of new upstarts featuring SaaS offerings similar to NOW’s products, and many at lower price points. The result has been predictable: NOW's once enviable growth is rapidly decelerating. The first signs of this became apparent when the company reported its third quarter earnings – NOW declined 12% after reporting slowing growth in the third quarter and projecting further decelerating growth in the upcoming quarter. We also believe that ServiceNow is burdened with many of the same problems as legacy systems. Like hosted software, ServiceNow’s fully-customizable, programmable code can lead to long implementation times, problems during software upgrade cycles, and increased total cost of ownership (“TCO”). These problems will only be exacerbated as NOW’s customer count continues to grow and its legacy customers begin to voice concerns. From a catalyst perspective, the market may view NOW’s Amended S-1 filing and the VCs' rush to unload their shares into the market as sufficient reason to reduce the stock's valuation multiple to a more reasonable level. Once the Amended S-1 offering doubles NOW’s public float and investors begin to scrutinize future lock-up expirations, institutional demand for shares could begin to wane, dragging down NOW’s share price. Given ServiceNow’s absurd $4.7 billion market capitalization, when compared to its projected 2012 revenue of $239m, we think NOW’s share price is poised to collapse. The market is gradually digesting the company’s decelerating growth trends, and as NOW’s lockup expires, we believe the market will send the stock materially lower.
Disclaimer: As of the publication date of this report, Kerrisdale Capital Management, LLC ("Kerrisdale"), other research contributors, and others with whom we have shared our research (the “Authors”) have short positions in and own option interests on the stock of the Company covered herein (ServiceNow, Inc.) and stand to realize gains in the event that the price of the stock declines. Following publication, the Authors may transact in the securities of the Company. The Authors have obtained all information herein from sources they believe to be accurate and reliable. However, such information is presented “as is”, without warranty of any kind – whether express or implied. The Authors of this report make no representation, express or implied, as to the accuracy, timeliness, or completeness of any such information or with regard to the results obtained from its use. All expressions of opinion are subject to change without notice, and the Authors do not undertake to update this report or any information contained herein. Please read our full legal disclaimer at the end of the report.

Kerrisdale Capital Management, LLC | 1212 Avenue of the Americas, 3rd Floor | New York, NY 10036 | Tel: 212.792.7999 | Fax: 212.531.6153 2
Table of Contents
I. SUMMARY OF RED FLAGS ..................................................................................................... 3
II. COMPANY OVERVIEW ...................................................................................................................... 5
III. AN ABSURD VALUATION AT 20X REVENUE.................................................................... 7
PLATFORM-AS-A-SERVICE............................................................................................................... 9 THIN FLOAT IPO ARTIFICIALLY INCREASED SHARE DEMAND.................................................... 10 MUCH OF THE PRESS, ANALYSTS, AND FINANCIAL DATABASES OVERLOOK NOW’S HIGHLY
DILUTIVE OPTION POOL ............................................................................................................. 10
IV. NOW FACES COMPETITIVE AND STRUCTURAL HEADWINDS ............................... 11
SAAS HELP DESK COMPETITION HAS INTENSIFIED..................................................................... 11 SERVICENOW’S ANCILLARY OFFERINGS PROVIDE VERY LITTLE REVENUE ............................... 14 NOW’S PLATFORM-AS-A-SERVICE OFFERING HAS SEVERAL FATAL FLAWS................................ 16 SINGLE-TENANT VS. MULTI-TENANT .......................................................................................... 17 NOW LOSES MONEY ON INSTALLATIONS ................................................................................... 18 NOW’S INSIDERS HAVE FILED TO BEGIN SELLING SHARES AHEAD OF LOCK-UP EXPIRATION. 19 ONE COMPARABLE, BMC SOFTWARE, TRADES AT 2.4X 2014E REVENUE .................................... 21
V. CONCLUSION.......................................................................................................................... 22
VI. FULL LEGAL DISCLAIMER .................................................................................................. 24
Kerrisdale Capital Management, LLC | 1212 Avenue of the Americas, 3rd Floor | New York, NY 10036 | Tel: 212.792.7999 | Fax: 212.531.6153 3
I. Summary of Red Flags Below are key reasons why NOW’s share price should plummet: NOW’s decelerating growth rates in Q3 and Q4E are only the beginning. NOW’s
market shares gains have not been driven by technology, patents or enhanced R&D; rather, they are the function of ServiceNow offering a SaaS ITSM help desk solution for customers who were disenchanted with the incumbents’ on-premise offerings due to cumbersome upgrades, unpredictable costs, and a lack of customization flexibility. While that helped NOW gain initial momentum, the marketplace is meaningfully changing, with virtually all players introducing SaaS offerings. BMC is quickly expanding its RemedyForce segment and has introduced the user-friendly MyIT offering. HP has reworked its help desk product with the release of Service Anywhere, a SaaS-based ITSM upgrade designed for what it calls "codeless configuration". Smaller players like Cherwell Software, EasyVista, and Hornbill are offering competitive SaaS solutions that are winning business and gaining share. The increased competition should pressure NOW’s overall growth rate as well as reduce market pricing, rendering ServiceNow’s historical growth rates unsustainable. Finally, the low-hanging fruit in terms of customer wins is rapidly drying up. NOW's prior client wins have been fueled by frustrated customers who had no qualms about switching from on-premise to SaaS; future wins will have to come from customers who may not be as aggravated with BMC's or HP’s on-premise offerings or, for small- and mid-sized businesses, may prefer a simpler out-of-the-box solution from Cherwell, Hornbill, EasyVista, or other private competitors.
The overall ITSM market size is only $1.5 billion, less than one-third of NOW’s $4.7 billion market capitalization. Leading technology research firm Gartner estimates that the IT Service Management market opportunity is $1.5 billion, and is growing at a modest 7% per year. Furthermore, Gartner's research predicts that only 50% of IT organizations will move to SaaS by 2015, implying that the total market opportunity for NOW's ITSM business is less than $1 billion. Given emerging competition from other SaaS ITSM service providers, we believe that the company will have a difficult time exceeding 30% market share. At $207m of LTM revenue, NOW appears to already control 10% to 15% of the market. So even if NOW’s market share rises to 30%, which we don’t see happening until 2014 at the earliest, NOW's ITSM business should be generating less than $600 million revenue with limited additional growth opportunities. The result of the limited market size and increasing competition will be flattening growth over the next few years.
We see limited evidence that NOW is generating meaningful business outside of its
core ITSM help desk offering. In order to inflate its addressable market size, NOW management claims to have created revenue opportunities beyond the IT Help Desk with its Discovery and Runbook Automation products. These modules contain additive functionality designed for the Configuration Management and Workload Automation software markets used by IT departments. But analysis from Gartner, Citigroup, and our research all indicate that ServiceNow’s simplistic products have yet to capture more than a negligible share of either market opportunity. ServiceNow has yet to even make it into Gartner’s Magic Quadrant for Workload Automation or its categorization of Configuration Management providers, which summarize the leading vendors in each discipline.

Kerrisdale Capital Management, LLC | 1212 Avenue of the Americas, 3rd Floor | New York, NY 10036 | Tel: 212.792.7999 | Fax: 212.531.6153 4
ServiceNow’s PaaS is unproven and outmatched. NOW's PaaS offering faces daunting challenges. The product’s closed platform and lack of off-the-shelf third-party applications strikes us as too flawed to succeed against entrenched platforms from the likes of Google, Salesforce.com, and Microsoft. ServiceNow's PaaS uses a largely closed, "single-tenant" system that does not easily integrate with outside software applications, complicating its ability to integrate best-of-breed tools that come from outside the ServiceNow ecosystem. For these reasons, we don’t believe that PaaS can grow into the type of revenue driver that could justify NOW's lofty valuation. In fact, the closed nature of NOW's PaaS offering could be a long-term shortcoming of NOW’s Help Desk product versus more open solutions like Remedyforce, which integrates with the Force.com platform.
ServiceNow’s Help Desk product has many of the same flaws as its legacy
competitors', including long implementation times, complexity during software upgrade cycles, and daunting upfront coding costs. After numerous calls with customers and Help Desk experts, we believe that NOW falls well short of fully addressing the industry’s pervasive problems. Should a customer require customized functionality, as many do, it can take 6-8 months1 and tens of thousands of dollars in implementation costs to get NOW’s system up and running. Furthermore, a ‘pure’ SaaS offering should have a multi-tenant design, meaning that the underlying code is shared by all users in the cloud. This makes regular software updates simpler and vastly reduces the time and costs required for upfront implementation. And if an enterprise-class customer needs a high degree of customization, then a non-SaaS, hosted system like BMC Remedy may be comparable. For these reasons, we think it’s a mistake to assume that the Company’s growth can remain head and shoulders above its rapidly evolving competition over the next 1-2 years.
Given ServiceNow’s limited market size, competitive pressures within the SaaS ITSM
sector, unproven PaaS product, and uninspiring technology when one looks past its more commodity ITSM offering, the math behind NOW’s valuation simply does not add up. ServiceNow reported 13% sequential revenue growth in Q3 and has projected about 10% sequential revenue growth in Q4. Even if it beats guidance in Q4, sequential quarter-over-quarter growth will likely decline below 10% in 2013 and probably below 5% by 2014, which implies annual revenue growth of 20% to 30%. The current 18x 2012E revenue is a preposterous multiple given the slowing growth and numerous business challenges NOW will face.
From a technical standpoint, the Company's looming lockup expiration on December
26th, as well as its recent S-1 which allows certain insiders to sell shares before the lockup expiration, should exert downward pressure on shares. Only 11% of NOW's float is publicly traded (13.4m of its 123m unadjusted shares) but that should soon increase as lockups expire and as its highly dilutive option pool (37m; $4.48 strike) is exercised. ServiceNow’s non-trading shares were supposed to be locked-up until the day after Christmas, but according to a recently filed secondary S-1 (the “Amended S-1”), the Company has modified this lock-up and plans to sell 13.4m new shares at an earlier date. This will approximately double the public float. Should the underwriters exercise their greenshoe, as is typical, NOW will dilute its existing shareholders with 1.9m new shares. The remaining 11.5m shares (assuming the greenshoe is exercised) are being sold by NOW’s venture capital investors. NOW also has an enormously dilutive option pool
1 As indicated on the bottom of page 38 in NOW’s S-1.

Kerrisdale Capital Management, LLC | 1212 Avenue of the Americas, 3rd Floor | New York, NY 10036 | Tel: 212.792.7999 | Fax: 212.531.6153 5
consisting of 37m options struck at an average price of $4.48, creating a dilutive effect of 32m shares at the current share price. Certain financial databases, industry press, and even Wall Street analysts completely overlook this option number in their valuation calculations. Finally, following an initial IPO price range of only $15-$17, NOW shares have since traded up to $30 on very little news (shares moved up 5% after a Q1 2012 revenue beat). We believe this run has been partly caused by NOW’s ‘thin float’ or ‘sliver sale’ initial public offering, a practice that even Jim Cramer eviscerates as reckless. ServiceNow sold 13.4m of its 123m common shares in the June 2012 IPO. By creating a mismatch between supply and demand, these thin floats can artificially drive up demand for shares, thereby inflating share prices in the hopes that it remains at elevated levels through the lock-up period.
In this report, we will address the above concerns in detail and their implications to value.
II. Company Overview ServiceNow is a niche business software developer that markets IT Service Management products under a software-as-a-service (“SaaS”) subscription model. The Company’s lead product is an IT Help Desk program that has been the most heavily marketed SaaS product to emerge in a space largely dominated by hosted software. With any IT Help Desk software, instead of picking a phone to call the help desk, an employee can log into an online system to report an IT issue and receive rapid feedback. The IT manager on the other end receives the query, makes the required changes and solves the issue as part of his or her workflow queue. The Company calls this an “incident, problem, and change” process (Q2 Call). Our more than dozen calls with experts have indicated that the Help Desk software space is largely commoditized with a litany of vendors offering similar products. However, incumbents were initially slow to move to a SaaS model, which has several advantages over hosted software. This created an opportunity for the completely SaaS-based NOW. The advantages of SaaS include automated software updates, remote access through the cloud and off-premise database redundancies, amongst others. With that said, hosted software remains the most sensible choice versus SaaS for the many enterprise-scale businesses that require the greatest functionality and wish to maintain their software systems on more secure, in-house networks. In the case of ServiceNow, customization comes with a price since customers must retain JavaScript programmers on their staff or hire outside consultants to maintain the NOW code database. More recently introduced competitive SaaS offerings have migrated from complex coding requirements to out-of-the-box, multi-tenant SaaS solutions that offer simpler upfront implementation. For an overview of the ServiceNow software, we suggest that investors view the Company’s demo site and decide for themselves whether this really looks like a ~$4.5 billion piece of software. The screenshot below is the employee login dashboard from the Company’s demo site.

Kerrisdale Capital Management, LLC | 1212 Avenue of the Americas, 3rd Floor | New York, NY 10036 | Tel: 212.792.7999 | Fax: 212.531.6153 6
The leader in the IT service management software business is currently BMC Software, a profitable company with a 20+ year track record and a client base of over 50,000. While BMC’s Remedy software has historically been sold as hosted software under a license, BMC has aggressively invested in its SaaS solutions and now has about 475 SaaS customers. In the third quarter, BMC added 90 SaaS customers, giving them 23% sequential quarter-on-quarter growth and demonstrating the customer buy-in of their SaaS solutions. This growth rate was almost twice that of ServiceNow’s customer growth (12%) over the same period. On their most recent earnings call, BMC discussed that when they bid for "a competitive deal with one of our biggest SaaS competitor[s]," likely a reference to ServiceNow, that "this last quarter we were at about a 60% win rate” (BMC Q2 F2013 Call). In order to gain market share in the extremely competitive IT Help Desk market, NOW has aggressively expanded its headcount and hired expensive sales staff. Compare NOW's R&D investments with its sales and marketing annual spend. In the last three fiscal years (year-end June 30th), ServiceNow reported $2.4m, $7.2m and $7.0m in research and development costs (the product was first created in 2005). Compare this to $8.5m, $19.3m and $34.1m of sales and marketing expense over the same periods. It's apparent that ServiceNow has become a sales company, not a high-tech R&D-intensive business with a deep technological advantage. Contrary to what glowing analyst reports might lead investors to believe, ServiceNow’s software is not beyond critique. The Company’s online service forum is full of complaints. Even the trusted research group Gartner states that ServiceNow’s “reporting, analytics, and dashboarding capabilities are average” and that “the vendor struggles to balance messaging of IT service management offerings versus platform-as-a-service capabilities.” As ServiceNow aggressively expands its headcount, it is also beginning to lose creative employees. In August 2012, Chris Dancy decided to quit ServiceNow to join BMC as a Director in the Office of the CTO. Mr. Dancy runs a heavily followed Twitter account (@ServiceSphere) and is widely considered to be at the forefront of social media in the IT Help Desk space. Mr. Dancy joined BMC after seeing Remedy’s MyIT product for the first time.

Kerrisdale Capital Management, LLC | 1212 Avenue of the Americas, 3rd Floor | New York, NY 10036 | Tel: 212.792.7999 | Fax: 212.531.6153 7
III. An Absurd Valuation at 20x Revenue
Momentum shifts are not baked into ServiceNow’s current valuation, as the Company is effectively priced for perfection and the stock should waver at the slightest hiccup. Even with a hoard of well-capitalized competitors, very serious product risks and material growth hurdles, NOW trades at 21x LTM revenue. This multiple is higher than even Facebook at its IPO price. But more importantly, the Company is EBITDA negative yet trades at offensively high 2013E and 2014 EBITDA multiples of 196x and 74x, respectively. At the current price, we believe that investors are accepting inordinate amounts of risk for a mere 1.4% 2014 EBITDA yield (if NOW meets consensus estimates). Capitalization Multiples$mm; FY End Dec 31st 11/12/2012 # MultipleCurrent Share Price $29.66 LTM Revenue $207.7 21.1x
Outstanding Shares(1) 125.3 2012E Revenue 239.2 18.3xRSUs 1.1 2013E Revenue 366.7 11.9xDilutive Effect of Options 31.6 2014E Revenue 529.8 8.3xMarket Capitalization $4,688.5
Less: PF Cash(1)(2)(3) (311.7) LTM EBITDA ($11.9) n.m.
Add: Debt(2) – 2012E EBITDA 1.7 n.m.Enterprise Value $4,376.8 2013E EBITDA 22.3 196.3x
# Strike 2014E EBITDA 59.1 74.1xOptions Outstanding 37.3 $4.48Dilutive Effect of Options 31.6 2013E EPS 0.02 n.m.
(1) Includes the issuance of 1.9m new shares (1.65m + 0.25m of the 1.7475m greenshoe) per the Nov. 9th S-1(2) Balance sheet figures as of September 30th, 2012 10-Q.(3) Includes $55.2m of proceeds from the 1.9m share issuance (see page 30 of Nov. 9th S-1)Sources: Company filings (S-1s, 10-Qs), CapitalIQ Estimates By comparison, BMC trades at 2.4x 2012E revenue and 6.6x 2012E EBITDA. BMC is actually growing its SaaS customer base more quickly than ServiceNow. SaaS Customer Count
Quarter Ended3/31/2012 6/30/2012 9/30/2012 Sources:
ServiceNow 1,074 1,201 1,346 Q2/Q3 2012 Earnings Calls% Growth 11.8% 12.1%
BMC(1) 315 385 475 Fiscal Q1/Q2 2013 Earnings Calls% Growth 22.2% 23.4%
(1) BMC stated on its FQ2 (Sept 30th period end) call that they added "90 new SaaS customers… ...[we] currently have approximately 475 SaaS customers" Source: Company filings and earnings calls. ServiceNow’s recent third quarter earnings report proves that NOW is actually a slowing business.

Kerrisdale Capital Management, LLC | 1212 Avenue of the Americas, 3rd Floor | New York, NY 10036 | Tel: 212.792.7999 | Fax: 212.531.6153 8
NOW Revenue Growth is SlowingQuarter Ended
$mm 3/31/2012 6/30/2012 9/30/2012 Q4 Guidance
Billings(1) $58.6 $72.1 $81.2% QoQ Growth 23.0% 12.6%
Deferred Revenue 115.8 131.1 147.9∆ in Deferred Revenue 15.3 16.8
Revenue 47.4 56.8 64.3 $69 - 71 % QoQ Growth 19.7% 13.3% 8.8%
Sources: NOW Earnings Press Releases.(1) Billings = Revenue + Change in Deferred Revenue(2) Growth figures employs a midpoint of $70m
(2)
In the SaaS software sector, many analysts believe that billings is a better indicator of growth than revenue. Billings, as reported by NOW and others, more accurately reflects total upfront sales by including the deferred revenue of a subscription contract over its life. ServiceNow’s billings have slowed sharply from 23% sequential growth in the second quarter to 13% in the third. The Company has not given billings guidance for the fourth quarter, but has guided to revenue growth of ~10%. Even if NOW modestly beats their fourth quarter estimates, any growth in billings lower than 13% would indicate that NOW's revenue growth should soon drop below 10% sequentially, which is simply too low for a 20x+ LTM revenue multiple. The IT Help Desk sector is one of the most competitive sub-segments of the IT Service Management business. ServiceNow competes in a market still largely dominated by industry stalwarts like BMC, HP, Computer Associates, and IBM. These market giants offer bundled product offerings across all ITSM and ITOM product verticals, giving them a strong edge on smaller peers, including NOW, who have more limited product offerings. The market is also populated by smaller, private SaaS competitors such as Cherwell Software, EasyVista, and Hornbill. According to a report from Gartner, IT Help Desk has a market size of $1.5bn and is only growing at 7%, a figure that is hardly enough to justify NOW’s 21x LTM revenue multiple. Wall Street estimates predict that NOW can grow its market share from about 10% to 15% in 2011 to 35% in 2014 to reach a revenue estimate of $530 million. Hitting these growth expectations will be extremely challenging since switching costs are high and Help Desk functionality is largely commoditized across competitive platforms. NOW must grow market share by about 7%/year to reach the Street’s 2013 revenue estimates. As a data point, Salesforce.com has only been able to increase its market share of the Customer Relationship Management software market by about 2-3% per year, according to data from Gartner: Customer Relationship Management (CRM) Software Market
$mm 2006 2007 2008 2009 2010 2011
Market Size 6,574 8,130 9,147 9,286 10,583 12,016% Growth 23.7% 12.5% 1.5% 14.0% 13.5%
SAP 25.6% 25.5% 22.5% 20.1% 18.9% 19.3%Oracle 15.5% 16.2% 16.1% 16.4% 16.5% 16.0%Salesforce.com 6.9% 8.3% 10.6% 12.4% 13.9% 16.7%Microsoft 5.6% 4.1% 6.4% 7.4% 7.5% 7.5%Amdocs 2.7% 5.2% 4.9% 4.2% 3.9% 3.6%Others 43.7% 40.7% 39.6% 39.5% 39.3% 36.9%
Source: Gartner Research
Kerrisdale Capital Management, LLC | 1212 Avenue of the Americas, 3rd Floor | New York, NY 10036 | Tel: 212.792.7999 | Fax: 212.531.6153 9
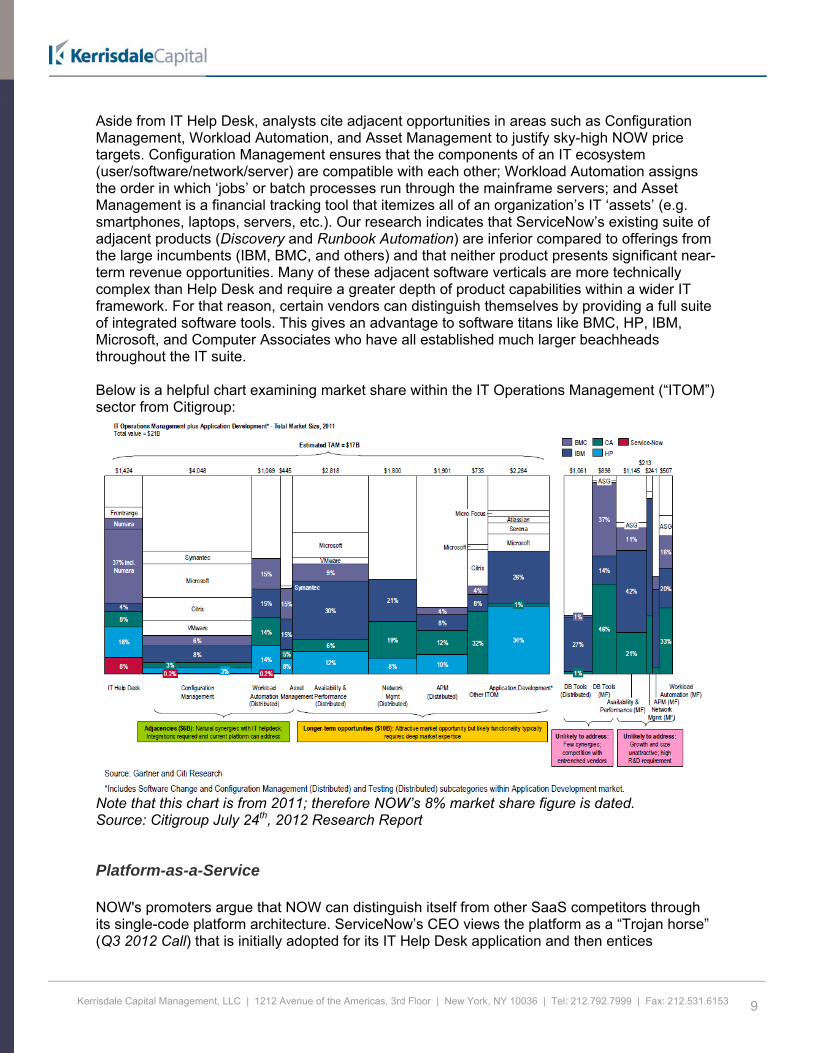
Aside from IT Help Desk, analysts cite adjacent opportunities in areas such as Configuration Management, Workload Automation, and Asset Management to justify sky-high NOW price targets. Configuration Management ensures that the components of an IT ecosystem (user/software/network/server) are compatible with each other; Workload Automation assigns the order in which ‘jobs’ or batch processes run through the mainframe servers; and Asset Management is a financial tracking tool that itemizes all of an organization’s IT ‘assets’ (e.g. smartphones, laptops, servers, etc.). Our research indicates that ServiceNow’s existing suite of adjacent products (Discovery and Runbook Automation) are inferior compared to offerings from the large incumbents (IBM, BMC, and others) and that neither product presents significant near-term revenue opportunities. Many of these adjacent software verticals are more technically complex than Help Desk and require a greater depth of product capabilities within a wider IT framework. For that reason, certain vendors can distinguish themselves by providing a full suite of integrated software tools. This gives an advantage to software titans like BMC, HP, IBM, Microsoft, and Computer Associates who have all established much larger beachheads throughout the IT suite. Below is a helpful chart examining market share within the IT Operations Management (“ITOM”) sector from Citigroup:
Note that this chart is from 2011; therefore NOW’s 8% market share figure is dated. Source: Citigroup July 24th, 2012 Research Report
Platform-as-a-Service NOW's promoters argue that NOW can distinguish itself from other SaaS competitors through its single-code platform architecture. ServiceNow’s CEO views the platform as a “Trojan horse” (Q3 2012 Call) that is initially adopted for its IT Help Desk application and then entices
Kerrisdale Capital Management, LLC | 1212 Avenue of the Americas, 3rd Floor | New York, NY 10036 | Tel: 212.792.7999 | Fax: 212.531.6153 10
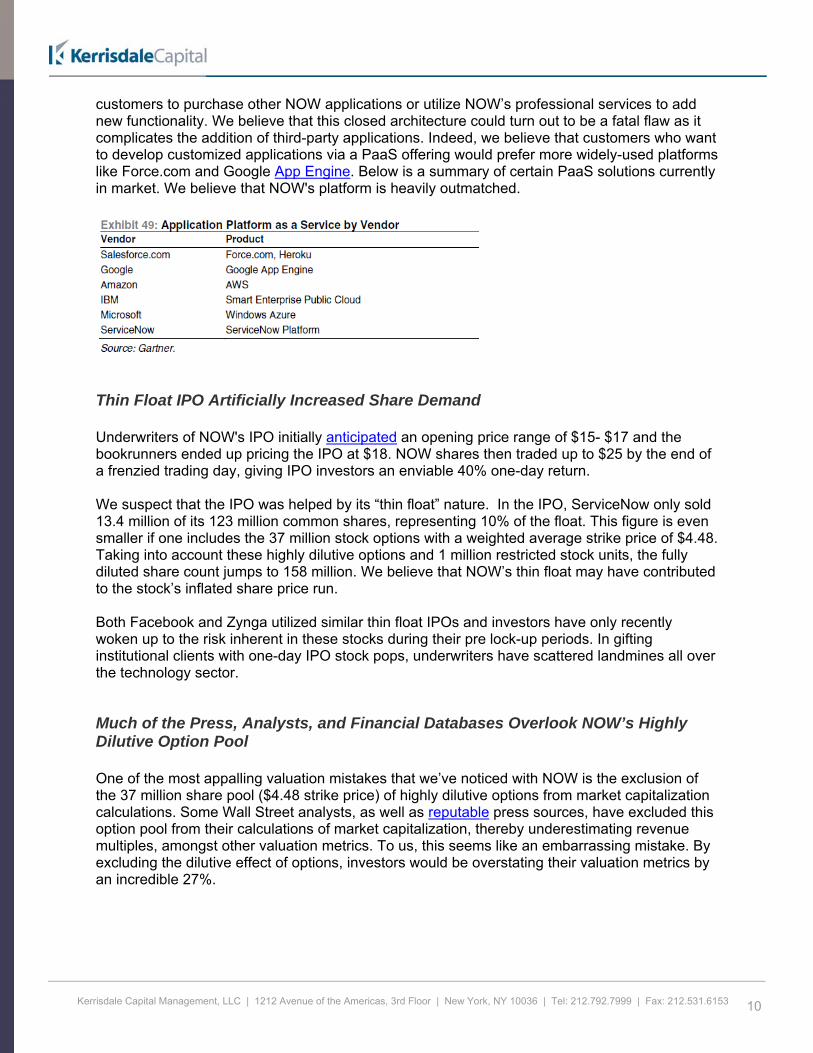
customers to purchase other NOW applications or utilize NOW’s professional services to add new functionality. We believe that this closed architecture could turn out to be a fatal flaw as it complicates the addition of third-party applications. Indeed, we believe that customers who want to develop customized applications via a PaaS offering would prefer more widely-used platforms like Force.com and Google App Engine. Below is a summary of certain PaaS solutions currently in market. We believe that NOW's platform is heavily outmatched.
Thin Float IPO Artificially Increased Share Demand Underwriters of NOW's IPO initially anticipated an opening price range of $15- $17 and the bookrunners ended up pricing the IPO at $18. NOW shares then traded up to $25 by the end of a frenzied trading day, giving IPO investors an enviable 40% one-day return. We suspect that the IPO was helped by its “thin float” nature. In the IPO, ServiceNow only sold 13.4 million of its 123 million common shares, representing 10% of the float. This figure is even smaller if one includes the 37 million stock options with a weighted average strike price of $4.48. Taking into account these highly dilutive options and 1 million restricted stock units, the fully diluted share count jumps to 158 million. We believe that NOW’s thin float may have contributed to the stock’s inflated share price run. Both Facebook and Zynga utilized similar thin float IPOs and investors have only recently woken up to the risk inherent in these stocks during their pre lock-up periods. In gifting institutional clients with one-day IPO stock pops, underwriters have scattered landmines all over the technology sector.
Much of the Press, Analysts, and Financial Databases Overlook NOW’s Highly Dilutive Option Pool One of the most appalling valuation mistakes that we’ve noticed with NOW is the exclusion of the 37 million share pool ($4.48 strike price) of highly dilutive options from market capitalization calculations. Some Wall Street analysts, as well as reputable press sources, have excluded this option pool from their calculations of market capitalization, thereby underestimating revenue multiples, amongst other valuation metrics. To us, this seems like an embarrassing mistake. By excluding the dilutive effect of options, investors would be overstating their valuation metrics by an incredible 27%.

Kerrisdale Capital Management, LLC | 1212 Avenue of the Americas, 3rd Floor | New York, NY 10036 | Tel: 212.792.7999 | Fax: 212.531.6153 11
The Effect of Dilutive Options$mm except per share Undiluted Diluted Difference %Share Price $29.66 $29.66 $29.66
Common Shares(1) 125.3 125.3 125.3Restricted Share Units 1.1 Strike 1.1 1.1Options 37.3 $4.48 – 31.6Share Count 126.4 158.1
Market Capitalization $3,749.8 $4,688.5 ($938.7) 25.0%Net Cash (311.7) (311.7)
Enterprise Value $3,438.1 $4,376.8
EV/LTM Revenue $207.7 16.6x 21.1x (4.5x)EV/2012E Revenue 239.2 14.4x 18.3x
(1) Includes the issuance of 1.9m new shares (1.65m + 0.25m of the 1.7475m greenshoe) per the Nov. 9th S-1 Sources: NOW Prospectus, S-1, 10-Q, and CapitalIQ consensus estimates. We encourage investors to check their valuation sources thoroughly – frequently used research tools like Bloomberg, CapitalIQ and Yahoo Finance are all misrepresenting NOW’s market capitalization and price/revenue multiples.
Bloomberg
CapitalIQ
Sources: Bloomberg, CapitalIQ
IV NOW Faces Competitive and Structural Headwinds
SaaS Help Desk Competition Has Intensified The Market Leader: BMC Software There's little doubt that BMC was too slow to embrace SaaS for the ITSM sector, and its complacency allowed NOW to enter the market and steal market share. That said, BMC's technological depth in the broader ITOM space is extensive, and we believe it has taken steps to stop the bleeding. The company now offers a rapidly growing SaaS solution as well as an

Kerrisdale Capital Management, LLC | 1212 Avenue of the Americas, 3rd Floor | New York, NY 10036 | Tel: 212.792.7999 | Fax: 212.531.6153 12
OnDemand version of its market leading Remedy software. The pure SaaS product, RemedyForce, operates within the Force.com cloud platform, making it convenient for customers who already use productivity applications on Force.com. BMC has grown its SaaS customer base from ~315 in Q1 to ~475 in Q3 2012, implying about 20% sequential quarterly growth. This customer growth figure is about twice that of NOW. According to BMC’s CEO, “RemedyForce is an area we're really going to be putting some more dollars into and more focus on” (BMC FQ2 2013 Earnings Call). For larger enterprise customers who require greater customization, Remedy OnDemand is BMC’s flagship product offered over the cloud. It gives customers a choice between a secure, fully-customizable hosted system and a simpler, configurable SaaS. On Tuesday, October 30th, BMC launched MyIT, the newest addition to its Remedy suite of products. MyIT is a social and self-service tool that integrates with Remedy to increase productivity. Amongst other features, MyIT allows users to self-diagnose IT problems, make the corresponding requests, and personalize their IT Help Desk application with their favorite tools. MyIT also integrates seamlessly with mobile hardware, such as phones or tablets, allowing the end-user to do things like request a conference room, access an application, or request a webinar remotely. MyIT has received favorable reviews by Stephen Mann from Forrester Research. Mr. Mann stated that, “[MyIT is] a great move by BMC that pushes the proverbial envelope for ITSM tools.” Chris Dancy, the widely-followed ITSM executive who decided to quit ServiceNow to join BMC, says that MyIT was “the real reason I joined BMC.” Mr. Dancy is the #2 most-followed thought leader in the ITSM industry on Twitter (Mr. Mann is #1).
BMC’s MyIT
Source: BMC Software website.
Finally, one of BMC’s biggest advantages versus NOW remains its deep suite of ITSM products. Many enterprise customers prefer a single vendor that offers solutions across the IT service and operations management landscapes. ServiceNow may have a strong IT Help Desk product, but it's still technologically immature in Configuration Management, Workload Automation and its other ancillary product verticals. This gives horizontally integrated companies such as BMC, HP and IBM a significant advantage over upstarts like ServiceNow.

Kerrisdale Capital Management, LLC | 1212 Avenue of the Americas, 3rd Floor | New York, NY 10036 | Tel: 212.792.7999 | Fax: 212.531.6153 13
The Three Incumbents: HP, CA, IBM BMC isn’t the only incumbent making efforts to protect its existing customer base with new SaaS offerings. Last week, HP announced the release of HP Service Anywhere, which provides many of the same capabilities as HP’s traditional ITSM offerings, but under a SaaS framework. HP has designed this product for “codeless configuration,” which would allow users to add functionality without having to know a programming language. This could potentially give HP's product an edge over NOW for customers who want to lower their implementation and coding costs. HP Service Anywhere also introduced a significant social media component to its Help Desk suite. Service Anywhere should make it more difficult for NOW to poach existing HP users like it did in the past. Computer Associates has also reacted to the ServiceNow threat with its CA Nimsoft Service Desk, a multi-tenant SaaS solution that allows configuration while limiting in-suite coding. Should a large enterprise customer require complex functionality, CA still offers its software in a customizable, hosted instance. This multi-tiered product approach, as used by BMC and HP, allows customers to choose between a more secure hosted offering or a SaaS-based approach. IBM remains a common brand of choice for large, complex enterprises that require a full suite of IT functionality. IBM integrates IT Help Desk, Configuration Management, Asset Management and Workload Automation through a single interface under its SmartCloud network. The SmartCloud is available for a single price and easily integrates with 10 incremental “ITIL” (Information Technology Infrastructure Library) products, such as IBM Rational and IBM Tivoli. IBM holds a leading 20-30% market share in many of these more complex computing areas such as Network Management and Application Development. ServiceNow does not have functionality in either segment, giving it a material disadvantage for complex Fortune 500 clients.
Source: IBM Product Brochure.
Emerging Competitors: Private ITSM Companies Moving beyond the large incumbents, several other private companies have recently emerged as competitors to ServiceNow. Each of these companies has a core SaaS Help Desk product supported by a few adjacent tools, putting their product depth in-line with ServiceNow. Cherwell Software, founded by former executives of FrontRange, is a strong SaaS competitor that is frequently overlooked by Street analysts but often cited by industry experts. Unlike ServiceNow, Cherwell offers an all-inclusive, concurrent license rather than a piecemeal offering. This is a

Kerrisdale Capital Management, LLC | 1212 Avenue of the Americas, 3rd Floor | New York, NY 10036 | Tel: 212.792.7999 | Fax: 212.531.6153 14
major selling point for some customers, who feel cheated when ServiceNow attempts to upsell them additional modules such as Discovery and Runbook Automation. Cherwell also owns its own data centers whereas NOW is still in the process of transitioning to wholly-owned centers. Cherwell has done well internationally; half of its sales are outside the United States. Cherwell can also engineer its product as a PaaS, potentially pitting it head-to-head with NOW at nearly every sales pitch. There are other competitors that could emerge to chip away at NOW's edge as the leading SAAS provider of ITSM. One company we’ve heard great things about from independent experts is the Europe-based EasyVista. EasyVista is the successor to Staff & Line, which was founded in 1988 and has a deep heritage in the ITSM space. EasyVista has created a well-designed, highly functional product that some believe shows innovation much like ServiceNow did 5 years ago. EasyVista features a codeless SaaS architecture that makes it relatively simple to configure. According to the company’s website, non-technical IT users can be trained to configure the product in under a day. EasyVista 2012 has been updated for full integration between the help desk solution and configuration/asset management, workflow automation, and other ancillary product capabilities. While EasyVista is still expanding its sales presence in the U.S., our research indicates that it is increasingly showing up in the final rounds of RFP meetings and could be primed to disrupt NOW’s growth trajectory. EasyVista currently boasts a customer roster with the likes of L’Oreal, Mercedes Benz, HSBC, and Quicksilver. Hornbill is a third name that repeatedly came up during our discussions with industry professionals. Like BMC, Hornbill provides both hosted and SaaS ITSM software, providing customers a choice between on-premise and SaaS. Going further with its customer-centric approach, Hornbill’s SaaS product is priced in three separate tiers (standard, pro, and expert). The ‘standard’ solution allows those who prefer fast implementation periods over complex customization to get their ITSM processes up and running as soon as possible. ServiceNow also faces opposition from the likes of Axios, LANDesk, SAManage, FrontRange, Serena Software, SunView Software, and dozens of other ITSM companies. Accordingly, we do not believe that ServiceNow has anything close to a monopoly in the SaaS market, as many believe, but instead competes with numerous offerings. We would also expect that investment bankers are currently banging down the doors of the fastest-growing private ITSM companies given NOW’s valuation. New IPO funding could help companies like Cherwell become even more viable alternatives to NOW, especially among enterprise customers. This would slow down NOW's market share growth as well as pressure them on pricing.
ServiceNow’s Ancillary Offerings Provide Very Little Revenue NOW markets two ancillary products that it attempts to upsell alongside its IT Help Desk software. While Wall Street believes that these secondary products can quickly gain market share over entrenched competitors, these products continue to make limited headway even after several years in existence. Discovery, the Configuration Management tool that helps map server loads and computing operations, was launched in late 2007 yet still only has 0.2% market share, according to a Citigroup July 24th report. We also believe that this very low market share is not necessarily due to a lack of customers to cross-sell to, but rather because of the software's lack of functionality.

Kerrisdale Capital Management, LLC | 1212 Avenue of the Americas, 3rd Floor | New York, NY 10036 | Tel: 212.792.7999 | Fax: 212.531.6153 15
A report on the Configuration Management market last year from Gartner doesn’t even list ServiceNow as a player in this market. We believe that the chart below is particularly relevant since the $4bn Configuration Management market size figure was put together by Gartner itself, and they would therefore be best placed to define the competitors for that revenue pie.
Source: http://www.tumblr.com/tagged/configuration-management
ServiceNow is nowhere to be found in the above diagram. ServiceNow’s other tool, aside from Help Desk, is Runbook Automation, a tool that addresses part of the complex Workload Automation market (coordination of batch submissions and other computing-intensive data processes). Runbook Automation also has a meager 0.2% market share (Gartner/Citigroup figures) even though Runbook was launched in late 2010. Frank Slootman, NOW’s CEO, commented that for Runbook Automation, “the penetration is less than 10%” (NOW Q2 2012 Earnings Call) of their existing customer base. Slootman went on to say on the Q3 2012 earnings call, that “in terms of the model, our principle source of upsell revenue comes from incremental users, right, as opposed to incremental applications.” Below is the Gartner Magic Quadrant for Workload Automation. Gartner lists twelve competitors. ServiceNow is nowhere to be found. The world's leading technology research firm does not consider ServiceNow to be a meaningful vendor in Workload Automation.

Kerrisdale Capital Management, LLC | 1212 Avenue of the Americas, 3rd Floor | New York, NY 10036 | Tel: 212.792.7999 | Fax: 212.531.6153 16
Gartner’s Magic Quadrant for Workload Automation
Source: Gartner’s February 27th 2012 report.
Much like Help Desk, these adjacent fields are highly competitive and heavily populated by large enterprises as well as well-funded private companies. Data from Gartner supports our skeptical analysis of the revenue opportunity for Discovery and Runbook Automation.
NOW’s Platform-as-a-Service Offering Has Several Fatal Flaws Broadly speaking, platform-as-a-service (PaaS) products allow customers to integrate numerous disparate software products (including SaaS) under a single dashboard. This dashboard then manages each piece of software as an individual application. One can think of a PaaS dashboard as being akin to the home screen on an iPhone. Much like the App Store, the more applications that one adds into an ecosystem, the more valuable the platform becomes. Market leaders such as Force.com have 220,000 different applications made by leading software vendors like Oracle, SAP, Microsoft, Facebook and other developers who’ve become comfortable with the Force.com system.
Source: Force.com Source: Citigroup, July 24th, 2012

Kerrisdale Capital Management, LLC | 1212 Avenue of the Americas, 3rd Floor | New York, NY 10036 | Tel: 212.792.7999 | Fax: 212.531.6153 17
As shown in the PaaS overview chart above, Force.com, Microsoft Azure and LongJump are all examples of open platforms. ServiceNow, on the other hand, uses a largely closed, single-tenant system that does not easily integrate with outside software applications. While this might allow additional customization in some instances, it limits the ability to integrate best-of-breed tools that come from outside the ServiceNow ecosystem. Frank Slootman, ServiceNow’s CEO, has essentially conceded that NOW does not compete head-to-head with more widely used platforms:
“The platform market itself is very difficult. I am not looking for out-and-out confrontations with other platform vendors when I can roll the platform in the door right behind our ITSM application portfolio. That is our strategy and that's the one that's working for us, and that's the one that we're going to continue to follow.” ̶ NOW Q3 Earnings Call
We're skeptical that NOW's Platform-as-a-Service strategy will succeed. Competition in PaaS is fierce. It’s one thing to disrupt dithering incumbents like BMC and HP in the ITSM sector; it’s another to compete head-to-head with visionary, aggressive and well-funded companies like Salesforce.com and Amazon.
Single-Tenant vs. Multi-Tenant The differences between single and multi-tenant SaaS are subtle but matter when forecasting the future direction of the industry. Single-tenant SaaS generally refers to fully-customizable software that can vary by customer (including a separate database instance for each application); ServiceNow’s customizable code firmly places them in this category. Some of the independent experts that we’ve spoken with believe that a multi-tenant architecture, or one in which the underlying software is identical across customers, is a better way forward for the SaaS industry. Without variation in the underlying code, multi-tenant SaaS makes regular software updates much simpler for all end users. This issue is significant since many of NOW's customer wins have come from clients who have been frustrated with the incumbents' cumbersome upgrades, and are looking for predictable, straightforward software updates. Yet a single-tenant system would typically involve complex upgrades given that different clients have customized their NOW platforms with functionality specific to their operations. Additionally, single tenancy usually involves substantial upfront coding costs and longer implementation times. For these reasons, NOW may lose certain customers over time to SaaS providers who offer more attractive multi-tenant solutions.

Kerrisdale Capital Management, LLC | 1212 Avenue of the Americas, 3rd Floor | New York, NY 10036 | Tel: 212.792.7999 | Fax: 212.531.6153 18
SaaS Multi-Tenant
SaaS Single-Tenant
Source: ServiceNow. NOW Loses Money Upfront on Installations Because they use a customizable code architecture, NOW’s Help Desk product requires more upfront technical training and implementation services than a simpler multi-tenant solution. This adds engineering costs that must be borne by either NOW or its customers. These costs are reflected in NOW’s Professional Services segment, which has lost $4.2m over the last twelve months.
Fiscal Year Ending Quarter Ending
($ in millions) 6/30/2010 6/30/2011 12/31/2011 12/31/2011 3/31/2012 6/30/2012 9/30/2012 LTM
Subscription Revenue $40.1 $79.2 $110.9 $34.6 $39.5 $46.8 $55.3 $176.2Period/Period Grow th 124.6% 97.6% 40.0% 13.9% 14.4% 18.4% 18.1% –
Professional Services/Other 3.3 13.5 17.2 4.6 7.9 10.0 9.1 31.5Period/Period Grow th 120.6% 313.7% 27.8% 19.6% 70.7% 26.2% (8.9%) –
Net Sales $43.3 $92.6 $128.1 $39.2 $47.4 $56.8 $64.3 $207.7Year/Year Grow th n.a. 113.8% 38.2% -- 88.1% 92.6% 88.2% --
Quarter/Quarter Grow th n.a. n.a. n.a. 14.6% 21.1% 19.7% 13.3% --
COGS - Subscription (6.4) (15.3) (24.3) (8.8) (11.0) (14.2) (17.9) (51.9)COGS - Professional (9.8) (16.3) (22.3) (7.2) (10.2) (8.7) (9.6) (35.8)
Total COGS ($16.2) ($31.6) ($46.6) ($16.0) ($21.2) ($22.9) ($27.6) ($87.7)
Gross Margin $27.1 $61.1 $81.4 $23.2 $26.2 $33.9 $36.8 120.0% Revenue 62.6% 65.9% 63.6% 59.2% 55.2% 59.7% 57.1% 57.8%
Gross Margin - Subscription 33.7 63.9 86.6 25.8 28.5 32.6 37.3 124.3% Revenue 84.1% 80.7% 78.1% 74.7% 72.2% 69.6% 67.6% 70.5%
Gross Margin - Professional (6.6) (2.8) (5.2) (2.6) (2.3) 1.3 (0.6) (4.2)(1)
Source: Company filings. (1) Includes $2m of non-recurring revenue associated with the Knowledge user conference.

Kerrisdale Capital Management, LLC | 1212 Avenue of the Americas, 3rd Floor | New York, NY 10036 | Tel: 212.792.7999 | Fax: 212.531.6153 19
Historically, ServiceNow has implemented coding changes through third-party consultants. The Company was able to undercharge for these services since the partners were reliant on the customer flow from NOW. But ServiceNow has recently moved to bring these implementation services in-house. According to NOW’s 10-Q, they also adjusted the pricing model for Professional Services from a fixed-fee to a time-and-materials arrangement. Our conversations with independent experts confirm our belief that this could drive up the life-cycle costs of NOW’s IT Help Desk product and make it less price competitive versus its peers. While this might finally help NOW work towards a break-even gross margin in the segment, the Company could lose customers who would have chosen NOW due to its lower cost relative to BMC. NOW’s Insiders Have Filed to Begin Selling Shares Ahead of Lock-up Expiration According to ServiceNow’s IPO prospectus, the vast majority of its shareholders were subject to a 180-day lock-up. As a group, these holders represent 106.2 million common shares, or roughly 87% of the outstanding common stock. The remaining 2.5m shares are subject to a lock-up until February 21, 2013. But after market close on November 9th, as investors were leaving their desks for the weekend, ServiceNow reneged on their previous lock-up schedule and filed an amended S-1 agreement to push forward share sales by insiders in a newly dilutive offering by the Company. Insider VC investors (primarily JMI Equity in this offering) will sell 11.5m shares (including a pro rata share of the greenshoe). The offering is also issuing 1.9m new shares (including pro-rata share of the greenshoe), which will further dilute existing shareholders in order to raise about $55m for the Company. Given that NOW had $256.5 million of cash and equivalents and its cash flow from operations less capital expenditures has never been less than -$15 million in any rolling twelve-month period over the past three years, the company clearly does not need additional cash. Rather, we view the $55 million capital raise as a sign that management itself views its stock as overvalued, and wants to raise capital before the share price declines to a less attractive level. The new issuance should increase the share count to 125m common and 158m on a fully diluted basis. The combination of the insider sales and the 1.9m of new issuance will effectively double the size of the 13.4m public float. We believe the supply of new shares could place downward pressure on NOW’s share price. The amended lock-up structure allows for the sale of an additional i) 5m shares on December 26th, 2012; ii) 42.7m shares on the second trading day after Q4 results are announced (~late January/early February); iii) 49.8m shares on the 91st day following the Amended S-1 offering and; iv) 2.45m shares on February 21st, 2013. At NOW’s current price, NOW’s VC owners may be eager to return cash to their limited partners, particularly since they invested in ServiceNow at far lower levels. According to data from NOW’s S-1 and public press releases, JMI has invested $16.5m through four separate offerings to accumulate its current 59.8m shareholding, indicating a $0.28 buy-in price. This means that JMI’s investment is currently sitting on a 105x cash-on-cash return at NOW’s $30 trading price. Sequoia joined the fray in November 2009 by sweeping up 23.9m shares for only $51.6m, giving them a buy-in price of $2.16. Greylock, which invested in February 2012, only 4 months before the IPO date, bought 2.5m shares at a $10.20 price per share. With buy-in prices as low as these, the VCs may be counting down the days to the lock-up expiration date. The Effect of Lock-Up Expirations Facebook’s (“FB”) share price history is instructive in illustrating the risks of sudden lock-up expirations. As most investors know, Facebook’s IPO was highly anticipated and closely

Kerrisdale Capital Management, LLC | 1212 Avenue of the Americas, 3rd Floor | New York, NY 10036 | Tel: 212.792.7999 | Fax: 212.531.6153 20
followed. Even after its opening day stumble, FB shares initially traded at a 20x trailing revenue multiple. But as time went on and the IPO hangover settled in, investors become wary as FB’s share lock-ups approached expiration.
Source: August 16th, 2012 Sterne Agee Research Report. As these concerns settled in, Facebook’s trailing revenue multiple collapsed from 20x to 8x. The chart below indicates that selling pressure actually arrives well ahead of the actual lock-up date as investors anticipate the incoming share supply.
5.00x
7.00x
9.00x
11.00x
13.00x
15.00x
17.00x
19.00x
21.00x
23.00x
25.00x
$15.00
$20.00
$25.00
$30.00
$35.00
$40.00
$45.00
Facebook Share Price Lock-Up Date Facebook Trailing Revenue Multiple (LTM)
Eurphoriadrives an IPO priced near 20x LTM revenue
FB has settled around a 8x trailing revenue multiple
Concerns over August lock-ups drive the multiple to 10x
The Problem with Lock-ups: Facebook Case Study
Post-euphoriahangover drives a correction to 15x
Sha
re P
rice
EV
/LTM
Reve
nue
Source: CapitalIQ. If one believes that the Facebook plunge was a unique one-off case, consider Zynga (“ZNGA”), which experienced a similar downward trajectory as lock-ups approached expiration.
Source: August 16th, 2012 Sterne Agee Research Report.

Kerrisdale Capital Management, LLC | 1212 Avenue of the Americas, 3rd Floor | New York, NY 10036 | Tel: 212.792.7999 | Fax: 212.531.6153 21
-1.00x
1.00x
3.00x
5.00x
7.00x
9.00x
$0.00
$4.00
$8.00
$12.00
$16.00
$20.00
Zynga Share Price Lock-Up Date Zynga Trailing Revenue Multiple
EV
/LT
M R
eve
nue
Share
Pri
ce
Concern ahead of first lock-up expiration on 4/30 drives premptive selling
The Problem with Lock-ups: Part 2, Zynga
IPO around 5x trailing revenue
325m shares (39% of float) expires on May 29th, helping to drive the revenue multiple to 3x
Source: CapitalIQ. We readily acknowledge that many other factors were in play during these periods. But just a cursory look at the share price chart next to the share lock-up dates suggests more than a casual association. One Comparable, BMC Software, trades at 2.4x 2014E revenue ServiceNow’s 10%+ sequential quarterly growth is simply unsustainable given the limited size of the Help Desk market, the high switching costs between product offerings, and the introduction of SaaS products by NOW’s larger competitors. Therefore, we’d argue that NOW should revert to a multiple comparable to BMC Software as NOW’s growth continues to slow. Using this logic, if one assigns a 3x-4x 2014E revenue multiple range, a generous premium to BMC even though NOW currently burns cash, the 2014 revenue estimates of $530m would equate to a share price range of $12-$15. Even at the high end, this represents a more than 50% discount to the current trading price. This price range assumes that NOW continues to execute perfectly and can reach the analyst expectation of $530m and grow its share of the $1.5bn IT Help Desk market from about 15% to 35% over two years.

Kerrisdale Capital Management, LLC | 1212 Avenue of the Americas, 3rd Floor | New York, NY 10036 | Tel: 212.792.7999 | Fax: 212.531.6153 22
USD in millions Share Price Market Enterprise EV / Revenue EV / EBITDA
Calendar Year Multiples Ticker 11/12/2012 Cap(1)Value LTM 2012E 2013E 2014E LTM 2012E 2013E
ServiceNow, Inc. NOW $29.66 $4,688.5 $4,376.8 21.1x 18.3x 11.9x 8.3x n.m. n.m. 196.3x
"Best" Comparable
BMC Software Inc. BMC $40.12 6,271.8 5,643.1 2.6x 2.6x 2.4x 2.4x 7.0x 6.6x 5.9x
Other IT Help Desk Competitors
IBM IBM $189.25 218,900.6 235,417.6 2.2x 2.3x 2.2x 2.1x 8.9x 8.8x 8.1x
Hewlett-Packard HPQ $13.41 26,521.4 46,348.4 0.4x 0.4x 0.4x 0.4x 3.2x 3.0x 3.3x
CA Technologies CA $22.09 10,298.1 9,483.1 2.0x 2.0x 2.0x 2.0x 5.6x 5.1x 5.5x
Other SaaS Software
Oracle Corporation ORCL $30.30 152,780.2 136,286.2 3.7x 3.7x 3.5x 3.2x 8.0x 6.6x 6.8x
salesforce.com, inc CRM $141.68 19,489.5 18,192.3 6.9x 6.0x 4.7x 3.9x 156.5x 35.6x 25.7x
SolarWinds, Inc. SWI $51.89 4,032.6 3,824.1 15.2x 14.4x 11.6x 9.7x 30.8x 24.5x 20.7x
NetSuite Inc. N $60.42 4,716.1 4,540.0 15.8x 14.8x 11.5x n.a. n.m. 137.3x 109.0x
Source: CapitalIQ(1) Fully diluted to include stock options and restricted stock . Pro Forma for NOW's shelf S-1 offering
V. Conclusion We congratulate ServiceNow for creating a niche IT service management product with only $40m of R&D during the four-year period between June 2008 and June 2012. We also commend JMI Equity for their 105x return and Sequoia on their 1300% return, at least on paper. But recent moves by BMC, HP, and others to defend their turf in the SaaS space will make it much more difficult for NOW to win customers at its current rate, expediting the Company’s growth deceleration. Several recently introduced products prove that in a rapidly changing and highly competitive industry, ServiceNow does not have a technological moat, nor should it be assumed that the Company can continue to grow market share indefinitely. Somehow NOW has achieved a $4.7bn market capitalization, which is roughly the entire IT Help Desk ($1.4bn) and Configuration Management ($4bn) sectors combined. Since NOW only has about 15% share in the former and minimal penetration into the latter, we believe that investors have relied on pie-in-the-sky investor presentations instead of grounded financial analysis. We also do not believe that ServiceNow’s Help Desk product is as groundbreaking as many believe. The Company’s single-tenant SaaS model is susceptible to many of the same problems that have plagued hosted software, namely extended upfront implementation periods, ongoing professional services fees to maintain the code database, and high total costs of ownership over the cycle. While Fortune 500 customers may expect to incur these problems to achieve their desired level of customization, we believe that customers further down-market are becoming more sensitive to these issues. Some of the more nimble multi-tenant SaaS can actually offer long-term cost savings and rapid implementation cycles thanks to a simplified software platform. As ServiceNow begins to expand its customer base beyond the low-hanging fruit (i.e. dissatisfied customers seeking an alternative to hosted), these issues should increasingly come to light.

Kerrisdale Capital Management, LLC | 1212 Avenue of the Americas, 3rd Floor | New York, NY 10036 | Tel: 212.792.7999 | Fax: 212.531.6153 23
These substantial growth headwinds combined with the Company’s untenable valuation should increasingly come into focus as NOW’s venture capital investors seek to unload their shares onto the public markets. In our opinion, the November 9th Amended S-1 is a clear showing of bad faith by the initial VC investors as its pushes forward share sales that were intended to be locked-up until December 26th, 2012 (according to the original prospectus). The Amended S-1 contemplates the sale of 11.5m by insiders and the issuance of 1.9m new shares by NOW itself, assuming that the full greenshoe is exercised, the combination of which will double the Company’s 13.4m float. With 158m diluted shares outstanding, this offering only scratches the surface of the secondary sales that will soon come to market. Should NOW’s growth continue to retreat to more sustainable levels, as is every indication, we believe that this selling pressure will only exacerbate the sharp fall that we expect in NOW’s share price.

Kerrisdale Capital Management, LLC | 1212 Avenue of the Americas, 3rd Floor | New York, NY 10036 | Tel: 212.792.7999 | Fax: 212.531.6153 24
Full Legal Disclaimer As of the publication date of this report, Kerrisdale Capital Management LLC and its affiliates (collectively "Kerrisdale"), others that contributed research to this report and others that we have shared our research with (collectively, the “Authors”) have short positions in and own options on the stock of the company covered herein (ServiceNow, Inc.) and stand to realize gains in the event that the price of the stock declines. Following publication of the report, the Authors may transact in the securities of the company covered herein. All content in this report represent the opinions of Kerrisdale. The Authors have obtained all information herein from sources they believe to be accurate and reliable. However, such information is presented “as is”, without warranty of any kind – whether express or implied. The Authors make no representation, express or implied, as to the accuracy, timeliness, or completeness of any such information or with regard to the results obtained from its use. All expressions of opinion are subject to change without notice, and the Authors do not undertake to update or supplement this report or any information contained herein. This document is for informational purposes only and it is not intended as an official confirmation of any transaction. All market prices, data and other information are not warranted as to completeness or accuracy and are subject to change without notice. The information included in this document is based upon selected public market data and reflects prevailing conditions and the Authors’ views as of this date, all of which are accordingly subject to change. The Authors’ opinions and estimates constitute a best efforts judgment and should be regarded as indicative, preliminary and for illustrative purposes only. Any investment involves substantial risks, including, but not limited to, pricing volatility, inadequate liquidity, and the potential complete loss of principal. This report’s estimated fundamental value only represents a best efforts estimate of the potential fundamental valuation of a specific security, and is not expressed as, or implied as, assessments of the quality of a security, a summary of past performance, or an actionable investment strategy for an investor. This document does not in any way constitute an offer or solicitation of an offer to buy or sell any investment, security, or commodity discussed herein or of any of the affiliates of the Authors. Also, this document does not in any way constitute an offer or solicitation of an offer to buy or sell any security in any jurisdiction in which such an offer would be unlawful under the securities laws of such jurisdiction. To the best of the Authors’ abilities and beliefs, all information contained herein is accurate and reliable. The Authors reserve the rights for their affiliates, officers, and employees to hold cash or derivative positions in any company discussed in this document at any time. As of the original publication date of this document, investors should assume that the Authors are short shares of NOW and have positions in financial derivatives that reference this security and stand to potentially realize gains in the event that the market valuation of the company’s common equity is lower than prior to the original publication date. These affiliates, officers, and individuals shall have no obligation to inform any investor about their historical, current, and future trading activities. In addition, the Authors may benefit from any change in the valuation of any other companies, securities, or commodities discussed in this document. Analysts who prepared this report are compensated based upon (among other factors) the overall profitability of the Authors’ operations and their affiliates. The compensation structure for the Authors’ analysts is generally a derivative of their effectiveness in generating and communicating new investment ideas and the performance of recommended strategies for

Kerrisdale Capital Management, LLC | 1212 Avenue of the Americas, 3rd Floor | New York, NY 10036 | Tel: 212.792.7999 | Fax: 212.531.6153 25
the Authors. This could represent a potential conflict of interest in the statements and opinions in the Authors’ documents. The information contained in this document may include, or incorporate by reference, forward-looking statements, which would include any statements that are not statements of historical fact. Any or all of the Authors’ forward-looking assumptions, expectations, projections, intentions or beliefs about future events may turn out to be wrong. These forward-looking statements can be affected by inaccurate assumptions or by known or unknown risks, uncertainties and other factors, most of which are beyond the Authors’ control. Investors should conduct independent due diligence, with assistance from professional financial, legal and tax experts, on all securities, companies, and commodities discussed in this document and develop a stand-alone judgment of the relevant markets prior to making any investment decision.