services and activities
TRANSCRIPT

43
Chapter 3
SERVICES AND ACTIVITIES

Services and Activities
45
Introduction
This chapter gathers some significant statistics into a quantitative illustration of thevarious sectors of the Ministry’s activities divided into 6 sections (Italians abroad andmigratory policies - Cultural sector - Economic cooperation - Protocol - Legal affairsand Other services and activities).
1. The section on Italians abroad and migratory policies contains data concerningconsular services.
As of January 2003 a total of 3 965 586 Italian citizens residing abroad were enrolledin consular registries with a slight reduction of 2.3% as compared with the previousyear. More than half of all Italians residing abroad (Figure 3.1) reside in Europeancountries (56%) while 38% are enrolled in the consular registries of the Americas.
Figure 3.1 – Italians enrolled in consular registries: distribution by geographicalarea (as of 1° January 2003)
This is a well-established situation and not comparable to the heavy influxes thatcharacterised many of the decades of the last century.
Asia and Oceania
4%Sub-Saharan
Africa1%
The Americas38%
Europe56%
Mediterranean and Middle
East1%
Services and Activities
46
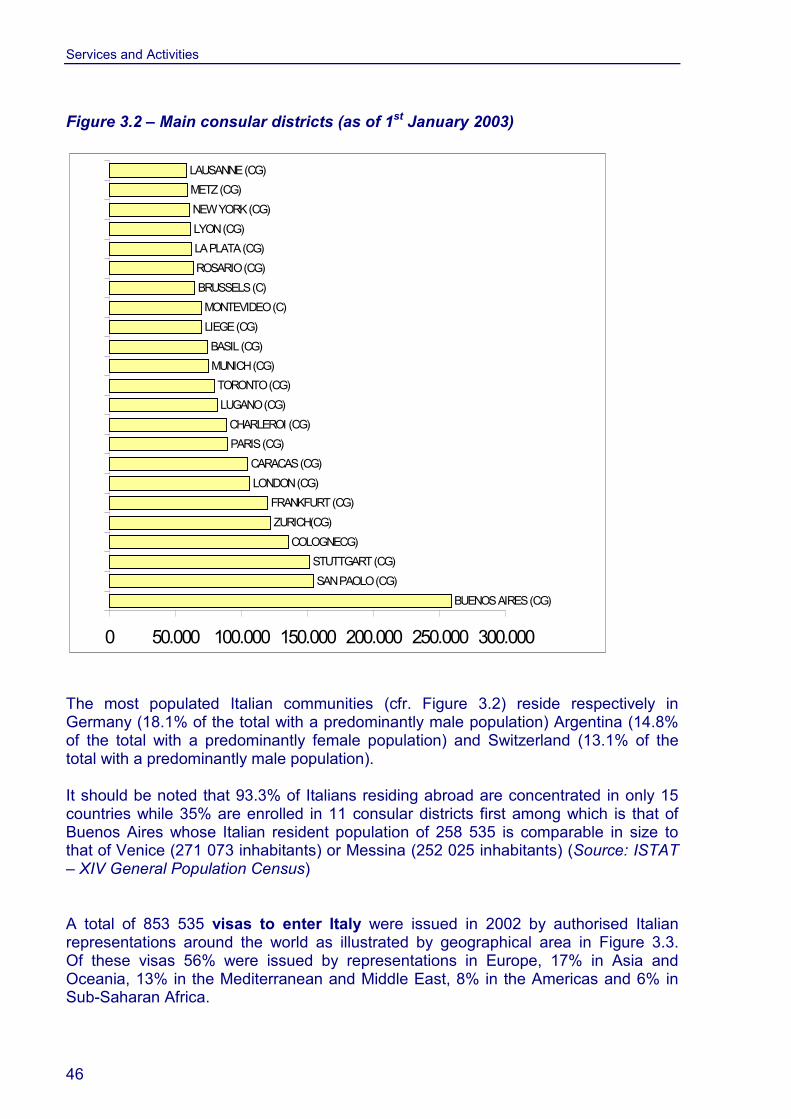
Figure 3.2 – Main consular districts (as of 1st January 2003)
BUENOS AIRES (CG)SAN PAOLO (CG)
STUTTGART (CG)COLOGNECG)
ZURICH(CG)FRANKFURT (CG)
LONDON (CG)CARACAS (CG)
PARIS (CG)CHARLEROI (CG)
LUGANO (CG)TORONTO (CG)
MUNICH (CG)BASIL (CG)
LIEGE (CG)MONTEVIDEO (C)
BRUSSELS (C)ROSARIO (CG)LA PLATA (CG)LYON (CG)NEW YORK (CG)METZ (CG)LAUSANNE (CG)
0 50.000 100.000 150.000 200.000 250.000 300.000
The most populated Italian communities (cfr. Figure 3.2) reside respectively inGermany (18.1% of the total with a predominantly male population) Argentina (14.8%of the total with a predominantly female population) and Switzerland (13.1% of thetotal with a predominantly male population).
It should be noted that 93.3% of Italians residing abroad are concentrated in only 15countries while 35% are enrolled in 11 consular districts first among which is that ofBuenos Aires whose Italian resident population of 258 535 is comparable in size tothat of Venice (271 073 inhabitants) or Messina (252 025 inhabitants) (Source: ISTAT– XIV General Population Census)
A total of 853 535 visas to enter Italy were issued in 2002 by authorised Italianrepresentations around the world as illustrated by geographical area in Figure 3.3.Of these visas 56% were issued by representations in Europe, 17% in Asia andOceania, 13% in the Mediterranean and Middle East, 8% in the Americas and 6% inSub-Saharan Africa.

Services and Activities
47
Figure 3.3 – Visas to enter Italy subdivided by geographical area (2002)
Of all visas issued in 2002 46% were for purposes of tourism 14% for business, 10%for transit and 7% for dependent employment and family reunion (Figure 3.4).
Figure 3.4 – Visas to enter Italy subdivided by purpose (2002)
Tourism46%
Family Reunion7%
Dependent Employement
7%
Transit10%
Business14%
Other11%Study
5%
The main consular and administrative services (passports - certificates of birth, deathand marriage, citizenship acts and conscription operations) showed a sharp increasein 2002 compared with the previous year attributable to the heavy “Argentine crisis”the effects of which were translated into an enormous request for citizenship andpassports. A peak (*75.9%) was recorded in 2002 in citizenship related activities, asubstantial increase (+18.3%) in birth, death and marriage certificates and conscriptionoperations and, finally, an increase of little more than 5% in passport requests.
Europe56%
Asia and Oceania17%Sub-Saharan
Africa6%
Mediterranean and Middle East
13%
The Americas8%

Services and Activities
48
2. The Cultural sector section contains data regarding Italian schools and Chairsabroad and scholarships, those awarded by the Directorate General for CulturalPromotion and Cooperation as well as those awarded by the Directorate General forDevelopment Cooperation.
As shown in Figure 3.5 the majority of the schools and Chairs are located in Europe.The number of students remains practically stable from one scholastic year to another:the average ratio of Italian students to foreign students is 0.2.
Regarding the Italian Chairs abroad in 2002 (Fig. 3.6), the situation was very similar tothe previous year: 272 Italian Chairs abroad in the 2002/2003 academic year ascompared with 266 in the 2002/2001 academic year.
In the context of the activities in the course of 2002 related to the diffusion of ItalianLanguage and Culture in the World, it is interesting to note the data on Italiancourses in local public schools:
• the offering of no less than 11 502 Italian language courses and the teaching ofItalian in 15 347 local public schools;
• the students attending these language courses numbered 120 495 and thepersons studying Italian in local public schools 365 278.
Figure 3.5 – Italian Schools abroad by geographical area and level(School Year 2001/2002)
10 135 5
18 16
7 9
17 13
67
1715
8 5
0
10
20
30
40
50
60
70
Europe The Americas Mediterranean andMiddle East
Sub-Saharan Africa
High SchoolJunior High SchoolPrimaryKindergarden

Services and Activities
49
Figure 3.6 – Italian language and culture Chairs abroad (Academic Years from1996/97 to 2002/03)
0
50
100
150
200
250
300
1996/97 1997/98 1998/99 1999/2000 2000/2001 2001/2002 2002/2003
Europe The AmericasMediterranean and Middle East Sub-Saharan AfricaAsia and Oceania
3. The Economic cooperation section (Tables 3.12) contains data on sectors such asdebt restructuring and cancellation of foreign debt for poor countries.
4. The Protocol section (from Table 3.13 to 3.17) contains data on visits by Heads ofState and Government to Italy and those of the President of the Republic, the PrimeMinister and the Minister for Foreign Affairs abroad.
5. The section on Legal affairs (from Table 3.18 to 3.20) refers mainly to the activitiescarried out by the Diplomatic Legal Advisory Service and presents data on the legalactivities carried out by the Ministry of Foreign Affairs at the international level, inparticular at the European level.
6. The last section entitled Other services and activities (Table 3.21) refers toLibrary and Diplomatic Archives Users.

Services and Activities
50
Tables – Italians Abroad and Migratory Policies
Table 3.1 – Consular Registry: Italians registered by geographical area(from 1999 to 2003)
GeographicalArea 1999 2000 2001 2002 2003
Total M FEurope 2 091 810 2 151 800 2 218 044 2 272 429 2 236 464 1 205 512 1 030 952
The Americas 1 318 367 1 473 944 1 556 276 1 588 383 1 517 893 757 718 760 175Mediterranean andMiddle East 23 628 25 184 27 013 27 672 24 172 12 672 11 500Sub-SaharanAfrica 55 315 57 571 54 124 52 017 45 682 24 211 21 471
Asia and Oceania 128 368 131 782 134 838 139 763 140 375 72 233 68 142
TOTAL 3 617 488 3 840 281 3 990 295 4 080 264 3 964 586 2 072 346 1 892 240
Source: DGIT
Table 3.1.1 – Consular Registry in Europe: Italians registered (1stJanuary 2003)
Countries Class City Italians M FAlbania Cons. Scutari 26 11 15
Emb. Tirana 473 345 128Gen.Cons. Valona (a) …. …. ….
Total Albania 499 356 143Armenia Emb. Jerevan 13 6 7Austria Gen.Cons. Innsbruck 4 929 2 619 2 310
Emb. Vienna 8 110 4 317 3 793Total Austria 1 039 6 936 6 103
Azerbaijan Emb. Baku 21 11 10Belgium Cons. Brussels 64 819 33 601 31 218
Gen.Cons. Charleroi 88 707 47 444 41 263Cons. Ag. Genk 23 783 12 095 11 688Gen.Cons. Liege 69 905 36 270 33 635Vice Cons. Mons 35 354 18 707 16 647
Total Belgium 282 568 148 117 134 451Belorussia Emb. Minsk (a) …. …. ….Bosnia-Herzegovina Emb. Sarajevo 330 153 177Bulgaria Emb. Sofia 396 258 138Cyprus Emb. Nicosia 446 226 220Croatia Gen.Cons. Fiume 6 332 2 967 3 365
Cons. Spalato 715 329 386

Services and Activities
51
Emb. Zagabria 1 127 557 570Total Croatia 8 174 3 853 4 321
Denmark Emb. Copenaghen 4 021 2 341 1 680Estonia Emb. Tallinn 41 30 11Yugoslav Republic ofMacedonia Emb. Skopje 118 54 64Russian Federation Emb. Moscow 1 135 775 360
Gen.Cons.St. Petersburg 93 70 23
Total Russian Fed. 1 228 845 383Finland Emb. Helsinki 1 343 800 543France Cons. Bastia 6 366 3 275 3 091
Cons. Chambery 21 172 10 974 10 198Cons. Lille 32 640 16 769 15 871Gen.Cons Lyon 61 420 30 966 30 454Gen.Cons. Marseilles 27 217 14 465 12 752Gen.Cons Metz 59 066 31 548 27 518Cons. Mulhouse 18 526 9 832 8 694Gen.Cons. Nice 29 485 16 482 13 003Gen Cons.. Paris 89 287 47 732 41 555Emb. Paris (DOM-
TOM) 1 187 736 451Cons. Toulouse 15 622 7 706 7 916
Total France 361 988 190 485 17 503Georgia Emb. Tbilisi 20 15 5Germany Gen Cons.. Hamburg 16 414 9 448 6 966
Emb. Berlin 12 562 7 342 5 220Gen.Cons. Cologne 135 448 75 165 60 283Cons. Dortmund 54 079 30 227 23 852Gen.Cons. Frankfurt 119 808 66 328 53 480Cons. Freiburg 48 467 26 302 22 165Gen.Cons. Hannover 25 004 14 264 10 740Gen Cons.. Liepsig 2 562 1 736 826Cons. Ag. Mannheim 14 492 8 200 6 292
Cons. Gen. Munich 74 991 44 333 30 658Cons. Nuremburg 31 055 17 297 13 758Cons. Saarbrücken 23 188 12 603 10 585Gen.Cons. Stuttgart 151 566 84 561 67 005Cons. Ag. Wolfsburg 8 927 4 982 3 945
Total Germany 718 563 402 788 315 775Greece Cons. Athens 10 241 4 682 5 559Ireland Emb. Dublin 5 027 2 794 2 233Kazakhstan Emb. Almaty (1) …. …. ….Latvia Emb. Riga 26 21 5Lithuania Emb. Vilnius 34 29 5Luxembourg Cons. Esch-Sur-
Alzette 23 198 11 756 11 442

Services and Activities
52
Malta Emb. Malta 1 153 741 412Monaco Gen.Cons. Monaco 6 122 3 310 2 812Norway Emb. Oslo 2 159 1 229 930Netherlands Gen Cons.. Amsterdam 30 845 16 786 14 059Poland Emb. Warsaw 1 703 988 715Portugal Emb. Lisbon 3 244 1 855 1 389United Kingdom Vice Cons. Bedford 20 090 10 171 9 919
Gen.Cons. Edinburgh 10 959 5 866 5 093Gen.Cons. London 106 296 58 419 47 877Cons. Manchester 28 058 14 906 13 152
Total United Kingdom 165 403 89 362 76 041Czech Republic Emb. Prague 1 969 1 195 774Fed. Rep. of Yugoslavia (b) Gen.Cons. Bar (a) …. …. ….
Emb. Belgrade 515 251 264Tot. Fed. Rep. of Yugoslavia 515 251 264
Romania Emb. Bucharest 1 624 1 140 484Gen.Cons. Timisoara (a) …. …. ….
Total Romania 1 624 1 140 484San Marino Emb. San Marino 6 969 3 618 3 351Slovakia Emb. Bratislava 261 192 69Slovenia Gen.Cons. Capodistria 1 743 863 880
Emb. Ljubljana 429 226 203Total Slovenia 2 172 1 089 1 083
Spain Gen Cons.. Barcelona 20 795 12 248 8 547Gen.Cons. Madrid 27 323 15 615 11 708
Total Spain 48 118 27 863 20 255Sweden Emb. Stockholm 6 988 3 889 3 099Switzerland Gen.Cons. Basil 74 306 39 107 35 199
Cons. Berna 37 626 19 884 17 742Cons. Ag Chur 11 041 6 072 4 969Gen.Cons. Geneva 41 481 21 412 20 069Gen.Cons. Laussanne 58 573 30 403 28 170Gen.Cons. Lugano 81 690 42 465 39 225Cons. Ag Neufchatel 17 880 9 044 8 836Cons. San Gallo 42 818 22 557 20 261Cons. Ag Sion 17 057 8 926 8 131Cons. Ag Wettingen 16 700 8 821 7 879Gen.Cons. Zurich 121 974 64 217 57 757
Total Switzerland 521 146 272 908 248 238Turkey Emb. Ankara 147 87 60
Gen.Cons. Istanbul 2 047 1 007 1 040Cons. Izmir 880 409 471
Total Turkey 3 074 1 503 1 571

Services and Activities
53
Ukraine Emb. Kiev 197 171 26Hungary Emb. Budapest 1 441 841 600Uzbekistan Emb. Tashkent 27 25 2
TOTAL EUROPE 2 236 464 1 205 512 1 030 952min Emb. Jerevan 13MAX Gen.Cons. Stuttgart 151 566
Source: DGIT
(a) data not available(b) since February 2003 the Federal Republic of Yugoslavia has been called the Republic of Serbia andMontenegro.Legend: Emb. = Embassies; Gen Cons.. = General Consulate; Cons. = Consulate; Vice Cons. = Vice Consulate;Cons Ag. = Consular Agency
Table 3.1.2 – Consular Registry in the Americas: Italians registered (1stJanuary2003)
Countries Class City Italians M FArgentina Gen.Cons. Bahia Blanca 29 243 13 545 15 698
Gen.Cons. Buenos Aires 258 535 126 422 132 113Gen.Cons. Cordoba 38 511 19 079 19 432Gen.Cons. La Plata 62 245 31 329 30 916Cons. Ag. Lomas De Zamora 45 976 22 051 23 925Cons. Mar Del Plata 29 983 14 780 15 203Cons. Mendoza 20 965 10 076 10 889Cons. Ag. Moron 38 503 18 085 20 418Gen.Cons Rosario 63 473 31 212 32 261
Total Argentina 587 434 286 579 300 855Bolivia Emb. La Paz 2 248 1 173 1 075Brazil Emb. Brasilia 3 478 1 682 1 796
Cons. Belo Horizonte 13 769 7 035 6 734Gen.Cons. Curitiba 30 987 14 627 16 360Gen.Cons. Porto Alegre 37 278 17 974 19 304Cons. Recife 5 342 2 958 2 384Gen.Cons. Rio De Janeiro 38 736 19 635 19 101Gen.Cons. San Paolo 154 546 72 920 81 626
Total Brazil 284 136 136 831 147 305Canada Cons. Edmonton 6 450 3 383 3 067
Gen.Cons. Montreal 38 039 19 638 18 401Emb. Ottawa 5 469 2 768 2 701Gen.Cons. Toronto 79 504 41 380 38 124Gen.Cons. Vancouver 14 287 7 342 6 945
Total Canada 143 749 74 511 69 238Chile Emb. Santiago del Chile 43 013 20 279 22 734Colombia Emb. Santa Fè de

Services and Activities
54
Bogotà 10 470 5 361 5 109Costa Rica Emb. San Josè 3 194 1 737 1 457Cuba Emb. Havana 1 256 701 555Ecuador Emb. Quito 8 731 4 303 4 428El Salvador Emb. San Salvador 1 431 755 676Guatemala Emb. Guatemala 2 618 1 312 1 306Honduras Emb. Tegucigalpa 703 403 300Mexico Emb. Mexico City 7 520 4 245 3 275Nicaragua Emb. Managua 735 419 316Panama Emb. Panama 1 280 668 612Paraguay Emb. Asuncion 3 418 1 777 1 641Peru Emb. Lima 27 237 12 923 14 314Dominican Republic Emb. Santo Domingo 5 324 3 086 2 238United States ofAmerica Gen.Cons. Boston 12 231 6 157 6 074
Gen.Cons. Chicago 18 121 9 400 8 721Cons. Detroit 12 231 6 271 5 960Gen.Cons. Philadelphia 20 606 10 802 9 804Gen.Cons. Houston 3 918 2 012 1 906Gen.Cons. Los Angeles 18 146 9 340 8 806Gen.Cons. Miami 17 321 9 567 7 754Vice Cons. Newark 15 393 8 363 7 030Gen.Cons. New York 60 817 31 938 28 879Gen.Cons. San Francisco 9 986 5 268 4 718Emb. Washington 3 003 1 504 1 499
Total United States 191 773 100 622 91 151Uruguay Cons. Montevideo 69 640 33 147 36 493Venezuela Gen.Cons. Caracas 104 711 57 729 46 982
Cons. Maracaibo 17 272 9 157 8 115Total Venezuela 121 983 66 886 55 097
TOTAL AMERICAS 1 517 893 757 718 760 175min Emb. Tegucigalpa 703MAX Gen Cons.. Buenos Aires 258 535
Source: DGIT
Legend: Emb. = Embassies; Gen. Cons. = General Consulate; Cons. = Consulate; Vice Cons. = Vice Consulate;Cons Ag. = Consular Agency
Table 3.1.3 – Consular Registry in Mediterranean and Middle East Area: Italians registered (1stJanuary 2003)
Countries Class City Italians M FAlgeria Emb. Algiers 601 451 150Saudi Arabia Gen.Cons. Jeddah 343 211 132
Emb. Riad 397 276 121Total Saudi Arabia 740 487 253

Services and Activities
55
Egypt Gen.Cons. Alexandria 861 377 484Cons. Il Cairo 2 975 1 530 1 445
Total Egypt 3 836 1 907 1 929United Arab Emirates Emb. Abu Dhabi 319 203 116
Cons. Ag Dubai 681 387 294Total Emirates 1 000 590 410
Jerusalem Gen.Cons. Jerusalem 1 690 785 905Jordan Emb. Amman 637 305 332Iran Emb. Teheran 321 195 126Israel Emb. Tel Aviv 7 476 3 541 3 935Kuwait Emb. Al Kuwait 173 100 73Lebanen Emb. Beirut 1 426 737 689Libya Gen.Cons. Bengasi 88 35 53
Gen.Cons. Tripoli 768 554 214Total Libya 856 589 267
Morocco Gen.Cons. Casablanca 1 830 1 051 779Emb. Rabat 251 139 112
Total Morocco 2 081 1 190 891Oman Emb. Mascate 18 12 6Qatar Emb. Doha 169 122 47Syria Emb. Damascus 381 194 187Tunisia Emb. Tunis 2 623 1 386 1 237Yemen Emb. Sana'a 144 81 63
TOTAL MEDITERRANEAN AND MIDDLE EAST 24 172 12 672 11 500Min Emb. Mascate 18MAX Emb. Tel Aviv 7 476
Source: DGITLegenda: Emb. = Embassy; Gen Cons. = General Consulate; Cons. = Consulate ;.Cons Ag. = Consular Agency
Table 3.1.4 – Consular Registry in Sub-Saharan Africa: Italiansregistered (1stJanuary 2003)
Countries Class City Italians M FAngola Emb. Luanda 374 213 161Cameroon Emb. Yaoundè' 566 314 252Congo Emb. Brazzaville 203 158 45Ivory Coast Emb. Abidjan 844 493 351Eritrea Emb. Asmara 777 397 380Ethiopia Emb. Addis Ababa 1 405 737 668Gabon Emb. Libreville 169 116 53Ghana Emb. Accra 379 247 132Kenya Emb. Nairobi 1 937 1 080 857Mozambique Emb. Maputo 680 437 243Namibia Emb. Windhoek 184 101 83Nigeria Gen.Cons. Lagos 2 105 1 496 609Democratic Republic of

Services and Activities
56
Congo Emb. Kinshasa (*) …. …. ….Senegal Emb. Dakar 637 427 210South Africa Cons. Cape Town 7 445 3 627 3 818
Cons. Durban 3 809 1 922 1 887Gen.Cons. Johannesburg 18 674 9 512 9 162Emb. Pretoria 2 105 1 093 1 012
Total South Africa 32 033 16 154 15 879Sudan Emb. Khartoum 173 82 91Tanzania Emb. Dar es Salam 572 317 255Uganda Emb. Kampala 540 317 223Zambia Emb. Lusaka 808 468 340Zimbabwe Emb. Harare 1 296 657 639
TOTAL SUB-SAHARAN AFRICA 45 682 24 211 21 471min Emb. Libreville 169MAX Gen.Cons. Johannesburg 18 674
Fonte: DGIT
Legenda: Emb. = Embassy; Gen. Cons. = General Consulate; Cons.= Consulate;. Cons Ag. = Consular Agency(*) data not available
Table 3.1.5 – Consular Registry in Asia and Oceania: Italians registered(1stJanuary 2003)
Countries Class City Italians M FAustralia Cons. Adelaide 15 151 7 482 7 669 Cons. Brisbane 11 562 5 708 5 854 Emb. Canberra 2 454 1 266 1 188 Gen.Cons. Melbourne 52 203 27 061 25 142 Cons. Perth 13 150 6 765 6 385 Gen.Cons. Sydney 34 932 17 290 17 642
Total Australia 129 452 65 572 63 880Bangladesh Emb. Dacca (*) …. …. ….Philippines Emb. Manila 768 425 343Japan Gen.Cons. Osaka 419 247 172 Emb. Tokyo 1 292 773 519
Total Japan 1 711 1 020 691India Gen.Cons. Calcutta 96 59 37 Gen.Cons. Mumbai 427 232 195 Emb. New Delhi 197 107 90
Total India 720 398 322Indonesia Emb. Jakarta 616 391 225Malaysia Emb. Kuala Lumpur 312 205 107Myanmar Emb. Yangon 20 13 7

Services and Activities
57
New Zealand Emb. Wellington 1 808 952 856Pakistan Emb. Islamabad 147 84 63 Gen.Cons. Karachi 45 25 20
Total Pakistan 192 109 83Republic of Korea Emb. Seoul 159 94 65People’s Republic of China Gen.Cons. Canton 122 100 22 Gen.Cons. Hong Kong 1 161 688 473 Emb. Beijing 356 235 121 Gen.Cons. Shanghai 433 292 141
Tot. People’s Rep. Of China 2 072 1 315 757Singapore Emb. Singapore 884 557 327Sri Lanka Emb. Colombo 85 56 29Thailand Emb. Bangkok 1 466 1 048 418Vietnam Emb. Hanoi 110 78 32
TOTAL ASIA AND OCEANIA 140 375 72 233 68 142min Emb. Yangon 20MAX Gen.Cons. Melbourne 52 203
Source: DGIT
Legenda: Emb. = Embassy; Gen. Cons. = General Consulate; Cons. = Consulate; Cons Ag.. = Consular Agency(*) data not available
Table 3.2 – Italians registered in Consular Registries by gender – 15 mostpopulated Communities (1stJanuary 2003)
Countries Italiansregistered
% rate % cumulated of whichMale
of whichFemale
Germany 718 563 18.12 18.12 402 788 315 775Argentina 587 434 14.82 32.94 286 579 300 855Switzerland 521 146 13.15 46.09 272 908 248 238France 361 988 9.13 55.22 190 485 171 503Brazil 284 136 7.17 62.38 136 831 147 305Belgium 282 568 7.13 69.51 148 117 134 451United States ofAmerica 191 773 4.84 74.35 100 622 91 151United Kingdom 165 403 4.17 78.52 89 362 76 041Canada 143 749 3.63 82.15 74 511 69 238Australia 129 452 3.27 85.41 65 572 63 880Venezuela 121 983 3.08 88.49 66 886 55 097Uruguay 69 640 1.76 90.24 33 147 36 493Spain 48 118 1.21 91.46 27 863 20 255Chile 43 013 1.08 92.54 20 279 22 734South Africa 32 033 0.81 93.35 16 154 15 879

Services and Activities
58
Other countries 263 587 6.65 100.00 140 242 123 345TOTAL 3 964 586 100.00 -------- 2 072 346 1 892 240
Source: DGIT
Table 3.3 – Main consular services by type and geographical area (Year 2002)
Geographicalarea
Passports %prev.Year
Recordsof births.marriageor death
%prev.Year
Citizenshipacts(*)
% prev.Year
Conscriptionoperations
% prev.Year
Europe 278 848 1.2% 78 136 1.4% 11 264 13.5% 11 335 - 9.6%The Americas 130 452 16.5% 152 585 32.1% 82 778 95.1% 16 308 58.5%Mediterraneanand MiddleEast 4 627 0.8% 1 712 -19.5% 640 244.1% 275 13.6%Sub-SaharanAfrica 6 983 0.6% 2 956 - 0.5% 277 19.9% 458 - 7.5%Asia andOceania 11 092 - 1.5% 7 268 - 2.9% 4 486 19.6% 1 393 - 12.7%
TOTAL 432 002 5.3% 242 657 18.3% 99 445 75.9% 29 769 18.3%
Source: DGIT
(*) citizenship acts include the acts carried out by Embassies of Consulates for the acquisition, reacquisition, lossand recognition of Italian citizenship.
Table 3.4 – Entry visas by geographical area of request (Years 1999-2002)
Geographical area1999 2000 2001 %
change(01/00)
2002 %change(02/01)
Europe 500 255 590 736 542 989 -8.1% 483 765 -10.9%The Americas 55 039 67 814 61 842 -8.8% 64 467 4.2%Mediterranean andMiddle East 110 873 132 640 128 867 -2.8% 106 911 -17.0%Sub-Saharan Africa 43 027 58 327 51 102 -12.4% 47 372 -7.3%
Asia and Oceania 125 486 159 482 162 285 1.8% 151 020 -6.9%
TOTAL 834 680 1 008 999 947 085 - 6.1% 853 535 - 9.9%
Source: DGIT

Services and Activities
59
Table 3.4.1 – Entry visas by geographical area of request: Europe(Years 1999 - 2002)
Countries 1999 2000 2001 % change(01/00) 2002 % change
(02/01)Albania 33 490 35 889 45 470 26.7% 33 070 -27.3%Austria 86 73 64 -12.3% 61 -4.7%Azerbaijan 1 102 1 370 1 318 -3.8% 1 150 -12.7%Belgium 73 111 94 -15.3% 79 -16.0%Belarus 32 153 44 949 37 653 -16.2% 35 340 -6.1%Bosnia-Herzegovina 19 318 22 430 13 495 -39.8% 12 560 -6.9%Bulgaria 12 290 13 079 4 170 -68.1% 1 645 -60.6%Croatia 3 116 3 808 4 090 7.4% 3 076 -24.8%Cyprus 403 617 577 -6.5% 566 -1.9%Czech Republic 5 483 6 467 6 073 -6.1% 5 593 -7.9%Denmark 574 502 57 -88.6% 11 -80.7%Estonia 1 108 621 864 39.1% 813 -5.9%Finland 288 736 39 -94.7% 11 -71.8%France 314 275 230 -16.4% 209 -9.1%Georgia - - 535 - 2 284 326.9%Germany 337 455 510 12.1% 405 -20.6%Greece 564 948 451 -52.4% 564 25.1%Hungary 10 204 9 647 5 053 -47.6% 3 211 -36.5%Ireland 353 546 718 31.5% 999 39.1%Kazakhstan 2 053 2 721 1 522 -44.1% 1 958 28.6%Latvia 2 289 1 877 1 406 -25.1% 1 091 -22.4%Lithuania 458 215 274 27.4% 264 -3.6%Luxembourg 1 1 2 100.0% 6 200.0%Malta 546 608 552 -9.2% 540 -2.2%Monaco 2 13 5 -61.5% 4 -20.0%Netherlands 28 289 36 -87.5% 47 30.6%Norway 292 288 51 -82.3% 30 -41.2%Poland 7 345 9 829 11 086 12.8% 13 451 21.3%Portugal 152 277 176 -36.5% 128 -27.3%
Rep. Of Yugoslavia (a) 23 592 27 520 32 849 19.4% 28 903 -12.0%Romania 47 577 44 243 40 229 -9.1% 21 617 -46.3%Russian Federation 128 709 163 296 155 863 -4.6% 133 921 -14.1%San Marino 153 215 251 16.7% 221 -12.0%Slovakia 6 047 7 571 9 077 19.9% 11 503 26.7%Slovenia 1 873 1 993 1 931 -3.1% 1 638 -15.2%Spain 271 360 342 -5.0% 349 2.0%Sweden 1 198 1 399 195 -86.1% 39 -80.0%Switzerland 74 382 78 136 78 370 0.3% 88 082 12.4%Turkey 28 099 47 071 31 456 -33.2% 27 724 -11.9%

Services and Activities
60
Ukraine 33 380 35 749 29 795 -16.7% 26 998 -9.4%United Kingdom 7 502 9 238 12 488 35.2% 13 040 4.4%Uzbekistan 1 401 2 364 1 415 -40.1% 933 -34.1%Yugoslav Republic ofMacedonia 11 649 12 926 12 157 -5.9% 9 631 -20.8%
TOTAL 500 255 590 722 542 989 - 8.1% 483 765 - 10.9%
Source: DGIT
(a) Since February 2003 the Federal Republic of Yugoslavia has been called the Republic of Serbia andMontenegro.
Table 3.4.2 – Entry visas by geographical area of request: the Americas(Years 1999-2002)
Countries 1999 2000 2001 % change(01/00) 2002 % change
(02/01)Argentina 572 752 914 21.5% 1 158 26.7%Bolivia 185 232 246 6.0% 203 -17.5%Brazil 2 109 2 557 2 385 -6.7% 1 894 -20.6%Canada 1 826 2 178 1 898 -12.9% 2 256 18.9%Chile 352 399 351 -12.0% 423 20.5%Colombia 852 1 344 3 006 123.7% 4 393 46.1%Costa Rica 103 162 186 14.8% 157 -15.6%Cuba 8 867 9 391 7 533 -19.8% 6 557 -13.0%Dominican Republic 3 243 5 679 3 505 -38.3% 3 336 -4.8%Ecuador 356 814 992 21.9% 694 -30.0%El Salvador 110 107 114 6.5% 76 -33.3%Jamaica 347 34 - - - -Guatemala 82 189 169 -10.6% 122 -27.8%Honduras 75 409 541 32.3% 52 -90.4%Mexico 986 1 058 1 127 6.5% 1 165 3.4%Nicaragua 180 148 50 -66.2% 52 4.0%Panama 111 92 125 35.9% 114 -8.8%Paraguay 64 70 75 7.1% 72 -4.0%Peru 6 174 7 920 6 413 -19.0% 7 531 17.4%United States ofAmerica 27 863 33 378 31 494 -5.6% 33 496 6.4%Uruguay 71 91 80 -12.1% 101 26.3%Venezuela 511 805 638 -20.7% 615 -3.6%
TOTAL 55 039 67 809 61 842 - 8.8% 64 467 4.2%
Source: DGIT

Services and Activities
61
Table 3.4.3 – Entry visas by geographical area of request: Mediterranean andMiddle East (Years 1999-2002)
Countries 1999 2000 2001 % change(01/00) 2002 % change
(02/01)Algeria 7 572 8 100 6. 83 -13.8% 6 018 -13.8%Egypt 11 080 10 086 9 731 -3.5% 7 869 -19.1%Iran 6 912 8 393 9 066 8.0% 9 242 1.9%Iraq 44 - 31 - 44 41.9%Israel 569 988 648 -34.4% 671 3.5%Jerusalem 1 749 1 934 1 420 -26.6% 1 269 -10.6%Jordan 4 099 5 113 4 582 -10.4% 3 398 -25.8%Kuwait 3 131 3 616 3 035 -16.1% 3 374 11.2%Lebanon 10 253 12 347 15 095 22.3% 10 660 -29.4%Libya 16 281 19 853 18 308 -7.8% 13 879 -24.2%Morocco 16 637 22 690 21 882 -3.6% 12 568 -42.6%Oman 960 683 903 32.2% 1 020 13.0%Qatar 575 891 659 -26.0% 695 5.5%Saudi Arabia 8.586 8 942 9 712 8.6% 14 307 47.3%Syria 4 858 6 621 5 026 -24.1% 4 802 -4.5%Tunisia 11 856 15 727 15 409 -2.0% 10 722 -30.4%United Arab Emirates 4 797 5 577 5 586 0.2% 5 602 0.3%Yemen 914 1 074 791 -26.4% 771 -2.5%
TOTAL 110 873 132 635 128 867 - 2.8% 106 911 - 17.0%
Source: DGIT
Table 3.4.4 – Entry visas by geographical area of request: Sub-Saharan Africa(Years 1999-2002)
Countries 1999 2000 2001 % change(01/00) 2002 % change
(02/01)Angola 1 535 1 504 760 -49.5% 608 -20.0%Cameroon 1 276 2 027 1 815 -10.5% 2 123 17.0%Congo 254 956 583 -39.0% 443 -24.0%Cote d’Ivoire 1 673 3 038 2 727 -10.2% 1 867 -31.5%Eritrea 860 847 1 082 27.7% 840 -22.4%Ethiopia 3 494 2 929 2 447 -16.5% 2 107 -13.9%Gabon 750 1 055 453 -57.1% 710 56.7%Ghana 3 012 4 175 4 940 18.3% 5 265 6.6%Kenya 2 828 2 373 1 747 -26.4% 2 563 46.7%Madagascar 540 530 - - - -Mozambique 484 681 431 -36.7% 525 21.8%Nigeria 4 629 5 933 7 061 19.0% 8 546 21.0%

Services and Activities
62
Rep. Dem. del Congo 1 113 1 562 1 592 1.9% 1 245 -21.8%Senegal 2 023 3 615 2 283 -36.8% 2 295 0.5%South Africa 15 319 22 960 19 983 -13.0% 15 043 -24.7%Sudan 323 622 435 -30.1% 425 -2.3%Tanzania 804 933 793 -15.0% 734 -7.4%Uganda 829 1 236 811 -34.4% 1 042 28.5%Zambia 548 725 579 -20.1% 565 -2.4%Zimbabwe 733 621 580 -6.6% 426 -26.6%
TOTAL 43 027 58 322 51 102 - 12.4% 47 372 - 7.3%
Source: DGIT
Table 3.4.5 – Entry visas by geographical area of request: Asia and Oceania(Years 1999-2002)
Countries 1999 2000 2001%
change(01/00)
2002%
change(02/01)
Australia 864 1 199 1 188 -0.9% 1 297 9.2%Bangladesh 2 320 4 316 4 628 7.2% 3 401 -26.5%India 27 741 31 877 27 941 -12.3% 20 208 -27.7%Indonesia 7 532 8 176 9 517 16.4% 10 851 14.0%Japan 3 715 3 981 3 709 -6.8% 5 397 45.5%Malaysia 214 247 204 -17.4% 185 -9.3%Myanmar 279 310 281 -9.4% 302 7.5%New Zealand 182 179 242 35.2% 249 2.9%Pakistan 5 657 4 541 5 976 31.6% 4 120 -31.1%People’s Republic of China 24 787 38 371 40 075 4.4% 36 216 -9.6%Philippines 9 237 16 576 13 504 -18.5% 13 851 2.6%Republic of Korea 874 965 1 074 11.3% 1 302 21.2%Singapore 654 892 771 -13.6% 1 014 31.5%Sri Lanka 3 933 5 978 4 670 -21.9% 3 042 -34.9%Thailand 9 160 13 086 12 469 -4.7% 11 672 -6.4%Vietnam 903 1 146 1 184 3.3% 1 577 33.2%
Other countries 27 434 27 643 34 852 26.1% 36 336 4.3%
TOTAL 125 486 159 483 162 285 1.8% 151 020 - 6.9%
Source: DGIT

63
Tabl
e 3.
5 –
Entr
y vi
sas
acco
rdin
g to
type
of v
isa
(Yea
rs 2
001-
2002
)20
0120
02%
cha
nge
Purp
ose
USV
NV
RTV
TOTA
LU
SVN
VR
TVTO
TAL
02/0
1Ad
optio
n-
1 88
5-
1 88
5-
2 31
0-
2 31
022
.55%
Busi
ness
133
537
-4
113
137
650
102
508
-20
280
122
788
-10.
80%
Spor
ts-
1-
1-
--
--
Hea
lth1
384
275
247
1 90
61
381
207
630
2 21
816
.37%
Dip
lom
atic
-99
6-
996
-1
016
-1
016
2.01
%Ac
com
pany
ing
rela
tive
-5
574
-5
574
-3
966
-3
966
-28.
85%
Spor
ts e
vent
s11
266
-42
511
691
6 75
7-
1 97
48
731
-25.
32%
Job
oppo
rtuni
ties
-16
963
-16
963
-1
188
-1
188
-93.
00%
Invi
tatio
n22
404
-89
723
301
15 0
21-
4 53
619
557
-16.
07%
Self-
empl
oym
ent
4 40
01
537
405
977
2 97
171
61
024
4 71
1-2
1.18
%W
ork
as a
n em
ploy
ee19
032
54 1
4386
474
039
18 2
8339
438
2 20
759
928
-19.
06%
Mis
sion
12 2
076
574
1 41
920
200
9 68
86
905
2 95
419
547
-3.2
3%Fa
mily
mat
ters
23
-5
--
--
-R
elig
ious
mat
ters
4 09
92
800
119
7 01
83
028
2 48
435
95
871
-16.
34%
Ree
ntry
-3
050
-3
050
-2
919
-2
919
-4.3
0%El
ectiv
e re
side
ncy
-79
1-
791
-85
2-
852
7.71
%Fa
mily
reun
ion
-64
772
-64
772
-62
067
-62
067
-4.1
8%St
udy
11 1
9926
777
380
38 3
568
295
30 8
901
474
40 6
596.
00%
Trai
ning
1-
-1
--
--
-Tr
ansi
t63
987
-16
098
80 0
8563
241
-24
997
88 2
3810
.18%
Airp
ort t
rans
it5
821
-22
46
045
5 56
6-
625
628
-6.9
0%Tr
ansp
ort
10 9
79-
1 31
112
290
8 91
1-
2 85
211
763
-4.2
9%To
uris
m42
2 94
7-
11 4
2443
4 37
128
7 47
4-
102
044
389
518
-10.
33%
Tour
ism
- Ju
bile
e81
-11
92-
--
--
Job
holid
ays
-26
-26
-60
-60
130.
77%
TOTA
L72
3 34
618
6 16
737
572
947
085
533
124
155
018
165
393
853
535
-9.8
8%So
urce
: DG
ITU
nifo
rm S
chen
gen
Visa
s (U
SV) a
re v
alid
for a
ll te
rrito
ries
of th
e co
untri
es th
at h
ave
sign
ed th
e Sh
enge
n Tr
eaty
and
they
mig
ht b
e: a
) airp
ort t
rans
it; b
) tra
nsit
up to
5 d
ays;
c) s
hort
term
jour
ney
othe
r unt
il 90
day
s. R
estri
cted
Ter
ritor
ial V
isas
(RTV
) are
val
id o
nly
in It
aly;
in s
peci
al c
ircum
stan
ces.
they
are
als
o va
lid in
oth
er c
ount
ries.
Lon
g Te
rm V
isas
or N
atio
nal
Visa
s (N
V) a
re v
alid
for
over
90
days
in It
aly
and
only
for t
rans
it th
roug
h Sc
heng
en te
rrito
ries.
not
ove
r 5 d
ays.
Services and activities
63

Services and Activities
64
Table 3.6 – Entry visas by nationality: top 8 Countries (Years 2001 – 2002)
Countries 2002 2001 % changeRussian Federation 133 902 158 016 -15.3%People’s Republic of China 35 439 42 147 -15.9%Belarus 35 340 37 900 -6.8%Albania 33 074 46 285 -28.5%Fed. Rep. of Yugoslavia (a) 28 900 59 504 -51.4%Romania 21 608 41 081 -47.4%India 17 983 36 996 -51.4%Bosnia-Herzegovina 12 560 40 887 -69.3%
Source: DGIT
(a) Since February 2003 The Federal Republic of Yugoslavia has been called the Republic of Serbia andMontenegro.
Table 3.7 – Italians imprisoned abroad: situation by judicial position andgeographical area (Years 2001 – 2003)
ImprisonedGeographical area2001 2002 2003
Total Pending Condemned Total Pending Condemned Total
Europe 2 457 785 1 600 2 385 970 1 485 2 455The Americas 474 109 344 453 111 350 461Mediterranean andMiddle East 31 5 26 31 2 15 17Sub –SaharanAfrica 11 6 2 8 6 2 8Asia and Oceania 89 26 61 87 23 63 86TOTAL 3 062 931 2 033 2 964 1 112 1 915 3 027
Source: DGIT

Cultural sector
65
Cultural sector
Table 3.8 – Italian Schools abroad by type and geographical area(School Year 2001/2002)
TypeGeographical area
Public Legallyrecognised
Con presad’atto (1) Private (2) Total
Europe 15 30 14 3 62The Americas - 38 16 3 57Mediterranean and Middle East - 19 6 1 26Sub-Saharan Africa 6 11 7 2 26Asia and Oceania - - - - -TOTAL 21 98 43 9 171
Source: DGPC
(1) Con presa d’atto refers to schools set up by private institutions. Their curriculum does not necessarilycorrespond to national standards. Therefore an additional examination is required for official recognition of thecourse of studies.
(2) Private refers only to non-recognised private schools that complete the same course of study as recognisedItalian schools.
- Italian sections within foreign schools are not taken into account.
Table 3.9 – Italian Schools abroad by level and geographical area(School Year 2001/2002)
LevelGeographical area Kinder
gartenPrimary Junior High
SchoolHigh
SchoolTotal
Europe 10 18 17 17 62The Americas 13 16 13 15 57Mediterranean and Middle East 5 7 6 8 26Sub-Saharan Africa 5 9 7 5 26Asia and Oceania - - - - -
TOTAL 33 50 43 45 171
Souce: DGPC
-- Data provided refers to State Schools abroad as well as to legally recognised non-profit private Schools. -- Italian sections within foreign schools are not taken into account.
Cultural sector
66
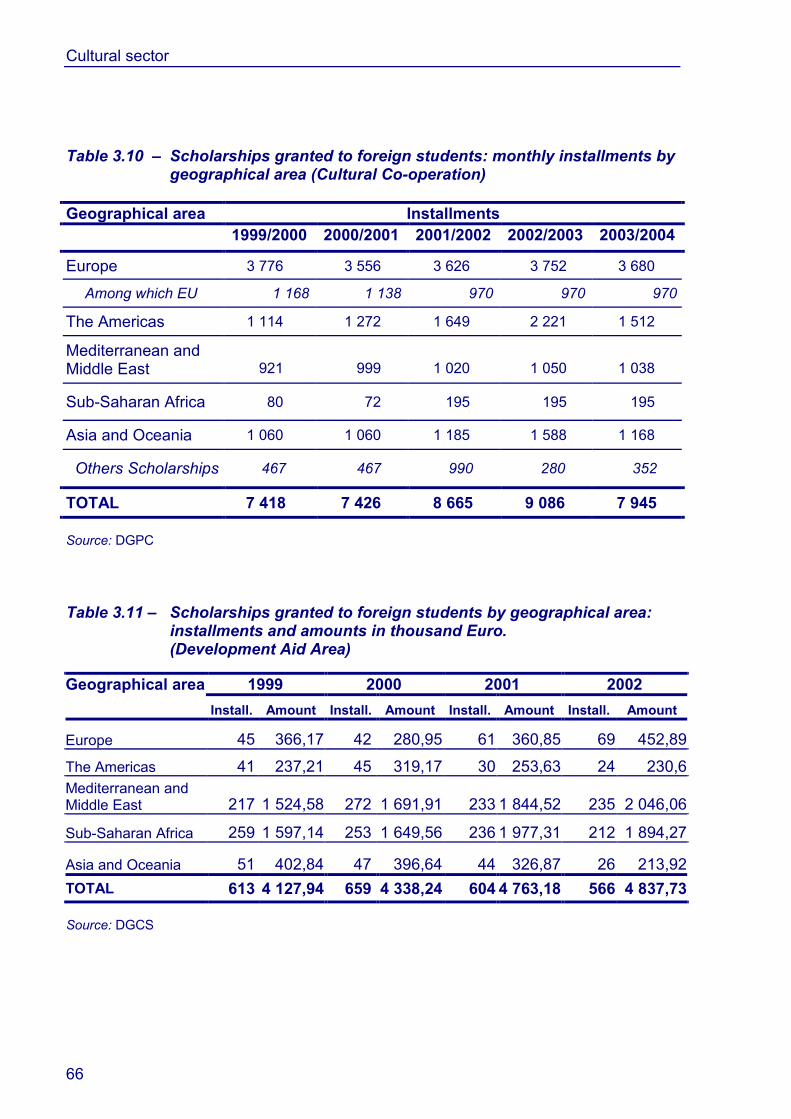
Table 3.10 – Scholarships granted to foreign students: monthly installments bygeographical area (Cultural Co-operation)
Geographical area Installments1999/2000 2000/2001 2001/2002 2002/2003 2003/2004
Europe 3 776 3 556 3 626 3 752 3 680
Among which EU 1 168 1 138 970 970 970
The Americas 1 114 1 272 1 649 2 221 1 512
Mediterranean andMiddle East 921 999 1 020 1 050 1 038
Sub-Saharan Africa 80 72 195 195 195
Asia and Oceania 1 060 1 060 1 185 1 588 1 168
Others Scholarships 467 467 990 280 352
TOTAL 7 418 7 426 8 665 9 086 7 945
Source: DGPC
Table 3.11 – Scholarships granted to foreign students by geographical area:installments and amounts in thousand Euro.(Development Aid Area)
1999 2000 2001 2002Geographical area Install. Amount Install. Amount Install. Amount Install. Amount
Europe 45 366,17 42 280,95 61 360,85 69 452,89
The Americas 41 237,21 45 319,17 30 253,63 24 230,6Mediterranean andMiddle East 217 1 524,58 272 1 691,91 233 1 844,52 235 2 046,06
Sub-Saharan Africa 259 1 597,14 253 1 649,56 236 1 977,31 212 1 894,27
Asia and Oceania 51 402,84 47 396,64 44 326,87 26 213,92TOTAL 613 4 127,94 659 4 338,24 604 4 763,18 566 4 837,73
Source: DGCS

Economic cooperation
67
Economic cooperation
Table 3.12 – Foreign Debt cancelled by Italy for HIPC - Heavily Indebted PoorCountries (2001-2002)
Million EuroYEAR Country Debt Cancelled2001 Guinea (Conakry) ** 17.9
2002 Benin ** 2.7 Bolivia *** 74.3 Burkina Faso ** 0.5 Cameroon** 51.1 Chad** 1.9 Ethiopia * 11.0 Ghana ** 5.8 Malawi *** 0.3 Mali ** 0.03 Mauritania ** 0.1 Mauritania *** 0.3 Mozambique *** 557.3 Senegal** 7.2 Sierra Leone* 5.5 Tanzania** 50.5 Tanzania*** 136.4 Uganda*** 142.8
TOTAL 2002 1 047.5
Source: DGCE
* = partial cancellation treatment for HIPC ** = partial cancellation interim debt-relief *** = total cancellation

Protocol
68
Protocol
Table 3.13 – Ambassadors accredited in Italy (1st January 2003)
Country/Organizationof accreditation
Ambassadorsresident in Italy
Ambassadors notresident in Italy
Total
Italian Republic(Quirinale) 128 39 167
Holy See 166 - 166InternationalOrganizations 33 - 33
Special Missions 4 - 4
TOTAL 331 39 370
Source: State Diplomatic Protocol
-- Foreign Embassies can be accredited to the Italian Republic, the Holy See or the International Organizationslocated in Rome (FAO. IFAD). Some of the foreign Ambassadors do not reside permanently in Italy. They oftenreside in other European Capitals where they are also accredited.
Table 3.14 – Official visits to Italy by Heads of State, Heads of Government,Ministers for Foreign Affairs and Heads of InternationalOrganizations (Years 1992 – 2002)
1992 1993 1994 1995 1996 1997 1998 1999 2000 2001 2002
Heads of State 9 7 13 21 19 22 42 68 72 55 55
Heads ofGovernment 17 10 12 5 21 24 32 45 49 60 37
Ministers forForeign Affairs 25 32 15 32 37 39 66 66 98 107 132
Heads ofInternationalOrganizations …. …. …. …. …. …. …. 12 37 26 30
TOTAL 51 49 40 58 77 85 140 191 256 248 254
Source: State Diplomatic Protocol

Protocol
69
Table 3.15 – Official visits to Italy by Heads of State, Heads of Government,Ministers for Foreign Affairs by geographical area (Years 2002)
Europe TheAmericas
Mediterraneanand Middle
EastSub-Saharan
AfricaAsia andOceania Total
Heads of State 22 17 5 7 4 55Heads of Government 24 3 4 3 3 37Ministers for Foreign Affairs 43 25 17 33 14 132TOTAL 89 45 26 43 21 224
Source: State Diplomatic Protocol
Table 3.16 – Visits abroad by the President of the Italian Republic, the PrimeMinister and the Minister for Foreign Affairs (Years 1999 - 2002)
1999 2000 2001 2002
President of the Republic 12 14 8 9Prime Minister (*) 30 31 22 167
Minister for Foreign Affairs 52 56 58 54TOTAL 94 101 88 230
Source: Protocol, Cabinet of Hon.Minister, Prime Minister’s Office
(*) Included in the visits of the Prime Minister are work meetings abroad.
Table 3.17 – Visits abroad by the President of the Italian Republic, the PrimeMinister and the Minister for Foreign Affairs by geographical area(Year 2002)
Europe TheAmericas
Mediter-ranean
andMiddleEast
Sub-Saharan
AfricaAsia andOceania Total
President of the Republic 6 - 2 1 - 9
Prime Minister (*) 76 47 23 7 14 167
Minister for Foreign Affairs 38 4 10 - 2 54TOTAL 120 51 35 8 16 230
Source: Protocol, Cabinet of Hon.Minister, Prime Minister’s Office
(*) Included in the visits of the Prime Minister are work meetings abroad.

Legal affairs
70
Legal affairs
Table 3.18 – Agreements signed by Italy (Years 1994-2002)
1994 1995 1996 1997 1998 1999 2000 2001 2002Bilateral agreementsSigned 89 103 110 222 144 124 160 81 116In force 89 79 65 140 117 103 119 96 80
Multilateral agreementsSigned 29 39 41 39 29 20 13 20 33In force 20 14 19 28 28 14 9 12 16
Total signed 118 142 151 261 173 144 173 101 149Total in force 109 93 84 168 145 117 128 108 96
Source: Diplomatic Legal Advisory Service
Table 3.19 – Legal procedures against Italy promoted by the European Court forHuman Rights (Years 1994 – 2002)
Legalprocedures
1994 1995 1996 1997 1998 1999 2000 2001 2002
418 348 308 507 714 754 269 265 612
Source: Diplomatic Legal Advisory Service
Table 3.20 – Direct actions to the Court of Justice of the EU (Years 1994 – 2002)
Direct actions * 1994 1995 1996 1997 1998 1999 2000 2001 2002
ex art.226 16 17 9 20 12 29 22 21 25ex art.230 9 8 10 16 11 13 9 4 10
Source Diplomatic Legal Advisory Service
* direct actions ex art.226 of the EC Treaty are promoted by the Commission against Italy when it failsto fulfil an obligation under the EC. Actions ex art. 230 of the EC Treaty are promoted by Italy to reviewthe legality of a Community Act.

Other services and activities
71
Other services and activities
Table 3.21 – Library and Diplomatic Archives users (Years 1999 – 2002)
1999 2000 2001 2002Users
Library (*) 2 845 3 010 2 887 2 352Diplomatic Archives 2 750 3 150 3 500 3 580
TOTAL 5 595 6 160 6 387 5 932
Source: Historical Archives and Documentation Service
(*) Since Autumn 2000, and for approximately 2 years, the Library reading room was dedicated to other activities.The new restored reading room was reopened in September 2000