session 3a: statement of the problem - secure · pdf filesession 3a: statement of the problem...
TRANSCRIPT

SESSION 3A:
STATEMENT OF THE PROBLEM
Meera Shekar
Global Lead, Nutrition
World Bank Group

NUTRITION-SENSITIVE SOCIAL PROTECTION: WHY AND WHAT?
Meera ShekarGlobal Lead, Nutrition
Moscow, September 10-11, 2015

Overview
1. Size and shape of the malnutrition problem• Stunting, wasting, underweight,
• Micronutrient malnutrition (“hidden hunger”)
• Overweight/obesity and related NCDs
2. When does malnutrition happen, and why?
3. Linkages between poverty, equity, and malnutrition
4. Rationale for nutrition-sensitive social protection programs
5. Riding the global SUN movement to scale-up Nutrition-sensitive SP
6. Nutrition-sensitive SP: A WIN-WIN for all!!
3

162 million children stunted in 2013 Global target: reduce to ~ 100 million by 2025
4

5Source: UNICEF, WHO, and World Bank. 2014.
EUROPE & CENTRAL ASIA
MIDDLE EAST & NORTH AFRICA
LATIN AMERICA & CARIBBEAN
EAST ASIA & PACIFIC
SUB-SAHARAN AFRICA
SOUTH ASIA
GLOBAL
0
20
40
60
1990 1995 2000 2005 2010 2013
Pre
vale
nce
,, (
%)
Child Stunting PrevalenceGlobal and regional trends, Children <5 years (1990-2013)

Child StuntingNumber of children (<5 years), by region (1990-2013)
Num
ber
of c
hild
ren
affe
cted
(m
illio
ns)
250
200
150
100
50
0
1990 1995 2000 2005 2010 2013
EUROPE & CENTRAL ASIA
MIDDLE EAST & NORTH AFRICA
LATIN AMERICA & CARIBBEAN
EAST ASIA & PACIFIC
SUB-SAHARAN AFRICA
SOUTH ASIA
Source: UNICEF, WHO, and World Bank 2014.

Child Overweight PrevalenceGlobal and regional trends (Children < 5 years) 1990-2013
EUROPE & CENTRAL ASIA
MIDDLE EAST & NORTH AFRICA
LATIN AMERICA & CARIBBEAN
EAST ASIA & PACIFIC
SUB-SAHARAN AFRICA
SOUTH ASIA
GLOBAL
Source: UNICEF, WHO, and World Bank. 2014.
0
5
10
15
Pre
vale
nce
, (%
)
0
5
10
15
1990 1995 2000 2005 2010 2013
Pre
vale
nce
, (%
)

1990 1995 2000 2005 2010 2013
Num
ber
of c
hild
ren
affe
cted
(m
illio
ns)
30
20
10
0
Source: UNICEF, WHO, and World Bank 2014.
Child OverweightNumber of children (<5 years), by region (1990-2013)
EUROPE & CENTRAL ASIA
MIDDLE EAST & NORTH AFRICA
LATIN AMERICA & CARIBBEAN
EAST ASIA & PACIFIC
SUB-SAHARAN AFRICA
SOUTH ASIA

Nutrition and the World Bank’s Twin Goals
Good nutrition drives incomes and economic growth
Improving nutrition targets the bottom 40%
Eq
uity
Po
ve
rty

Indirect loss in productivity
from poor cognitive
development and schooling
Direct loss in
productivity from
poor physical status
Loss in resources
from increased health
care costs of ill health
Income poverty
Low food
intake
Frequent
infections
Hard physical
labor
Large
families
Frequent
pregnancies
Malnutrition
Bhagwati et al, 2004; Repositioning Nutrition, 2006
e.g. lost agricultural productivity e.g. health care costs & absenteeisme.g. lowered educability
The vicious cycle of poverty and malnutrition

Economic growth and undernutrition
Income growth by itself will improve nutrition, but at a slow rate that will
not be sufficient to achieve the nutrition targets
% s
tunte
d c
hild
ren
Data Source: WB World Development Indicators, Latest available data for
each country, GDP PC PPP, constant int’l 2005 $
Stunting and GNPA highly variable relationship…
Underweight and GNPThe trickle-down effect is modest…

In India, 60% children in
the poorest quintiles are
stunted, vs. 25% in the
richest quintile
In Nigeria, 54% children in the
poorest quintile are stunted,
vs. 18% among the richest
54
46
35
26
18
0 10 20 30 40 50 60
Lowest
2nd
3rd
4th
Highest
Percent stunting among children under five years
Stunting disproportionately affects the poor
60
54
49
41
25
0 10 20 30 40 50 60 70
Poorest
4th
3rd
2nd
Richest
Percent stunting among children under 5
Source: Nigeria DHS 2003 and India NFHS 205/6.

The consequences of malnutrition
13
Iodine deficient children lose
13 IQ points
PRODUCTIVITY
There is a huge opportunity to permanently lock-in human
capital before age two to minimize these consequences
0.7 grades schooling loss
7 month delay in starting school
COGNITION SCHOOLING
HEALTH Losses of 10% over lifetime
earnings
2-3% loss of global GDP
(11% of GDP in Africa/Asia)
obesity costs 2.8% of global GDP
Underlying cause of 3.1 million /
45% of deaths of children <5
Underlying cause of 11 percent of
DALYs globally
Sources: World Bank, Repositioning Nutrition 2006; Victora et al, Lancet 2008; Adair et al, Lancet 2013;
IHME & World Bank Global Burden of Disease 2014; MGI 2014;
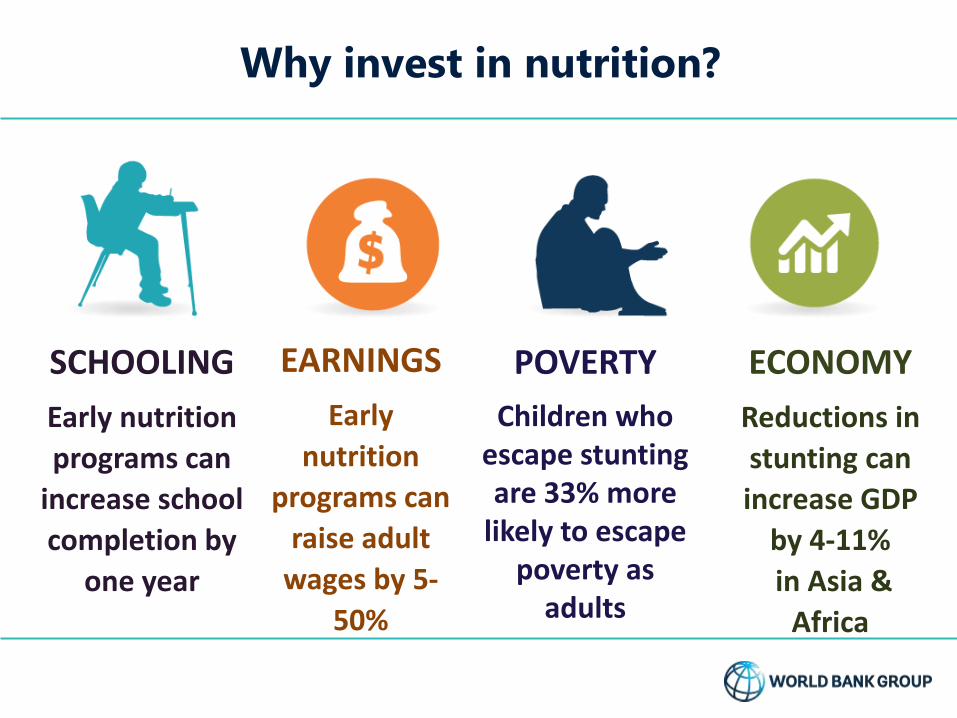
Why invest in nutrition?
SCHOOLING
Early nutrition
programs can
increase school
completion by
one year
EARNINGS
Early
nutrition
programs can
raise adult
wages by 5-
50%
POVERTY
Children who escape stunting are 33% more
likely to escape poverty as
adults
ECONOMY
Reductions in
stunting can
increase GDP
by 4-11%
in Asia &
Africa

The window of opportunity: first 1,000 days
15
• Sets the life-long foundation for human capital
• Adequate nutrition in this 1000-day window is imperative
• If not, the damage to future human capital is irreversible
WELL-NOURISHED
BRAIN CELLS
UNDERNOURISHED
BRAIN CELLS

-2,5
-2,25
-2
-1,75
-1,5
-1,25
-1
-0,75
-0,5
-0,25
0
0,25
0,5
0,75
1
1,25
1,5
1 4 7 10 13 16 19 22 25 28 31 34 37 40 43 46 49 52 55 58
Age (months)
Z-s
core
s (W
HO
)
EURO PAHO
EMRO SEARO
AFRO
Source: Victora CG, de Onis M, Hallal PC, Blössner M, Shrimpton R. Worldwide timing of
growth faltering: revisiting implications for interventions using the World Health Organization
growth standards. Pediatrics, 2010 (Feb 15 Epub ahead of print)
The first 1,000 days are critical to build human capital
Actions after age
two are:
TOO LATE
TOO EXPENSIVE
TOO LITTLE
Hei
gh
t-fo
r-age

Stunted children are also more likely to become overweight
Relative Risk
95% CI
Brazil 1.7 (1.2, 2.3)
S Africa 2.6 (2.0, 3.5)
China 4.2 (3.1, 5.7)
Russia 7.8 (5.7, 10.7)
Source: Popkin et al., J Nutr 1994

Weight gain and the risk of overweight: the tipping point
Rapid weight or length gain in the first 2 years does NOT increase risk of chronic disease
Growing evidence that rapid weight gain after age 2 associated with impaired glucose tolerance and obesity, especially among stunted kids
Risk
of
Obesity/NCDs
BUT…Source: (Victora et al 2010)

Food/nutrient
intake
- Infant and young child
nutrition an treatment of
severe undernutrition
- Micronutrient
supplementation &
fortification
- Hygiene practices
INSTITUTIONS
POLITICAL & IDEOLOGICAL
FRAMEWORK
ECONOMIC STRUCTURE
RESOURCES
ENVIRONMENT, TECHNOLOGY,
PEOPLE
Health
Water/
Sanitation
Health
services
Interventions
Immediate
causes
Underlying
causes
Basic
causes
- Ag & food security
- Health Systems
- Safety nets
- Water & sanitation
- Gender & Development
- Girls’ Education
-Climate change
Maternal
and child-
care
practices
Access
to food
Determinants of Child Nutrition
Adapted from UNICEF 1990 and Ruel 2009
- Poverty reduction &
economic growth
programs
-Good governance
-Trade & patents (& role of
private sector)
- Conflict Resolution
- Environmental
Safeguards
Nutrition-
specific
interventions
Nutrition-
sensitive
interventions

We have an affordable package of “nutrition-specific” interventions to reduce stunting
20
• Improving nutrition for women during
pregnancy
• Improving infant and young child
feeding practices, including exclusive
breastfeeding for the first six months
• Improving child nutrition, including
micronutrient supplementation
• Improving policy coordination,
capacity and evaluation
ANNUAL ADDITIONAL COST
PER CHILD UNDER-5
$8.50
$49.6 billion additional
financing needed globally over ten
yearsHowever, traditionally –these have been delivered through
the health sector –but, n-sensitive SP programming offers a
unique opportunity to expand delivery platforms and offer
WIN-WIN situations for both SP and HNP

~ 74 million fewer
children stunted in 2025
Nutrition-specificinterventions
* Includes per capita GDP, food availability and diversity, and women’s education, health and empowerment
Child Stunting: Trends and Targets
Underlying determinantsof stunting*
162m stunted
$1 invested in stunting = ~ $18 economic returns
~100m stunted by 40% by 2025
21
Total $49.6 billion over ten years
Source: World Bank and R4D, 2016 (forthcoming)

But, many challenges remain in scaling up nutrition because...
1. Malnutrition remains invisible
• To country policy makers…
• To global leaders…
• And to families and communities…
• A major effort is needed to “make under-nutrition visible” so action can follow…
7 years 7 years 4 years
2. Service delivery platforms for
nutrition have historically been
limited to the health sector

Potential pathways linking social protection
programs and improved nutrition outcomes
Improved Child Nutrition
Outcomes
Improved care for young
children & women
Less Infectious
disease
Improved Access
to Food
Improved Diets
Improved Health & sanitation
services
Income support
Micronutrient
Suppl./dewormingNutrition counseling
and services
Health/sanitation services
Source: Adapted from Neufeld, 2006
Potential components of social protection programs
Targ
et
nutr
itio
nally
vuln
era
ble

Getting the right startA WIN-WIN for Nutrition and for SP
Improved nutrition can be a driver of economic growth and a means to reduce poverty and enhance shared prosperity

Together, Social protection and Nutrition Programs can grow evidence and drive investment in human capital for long-term
prosperity : A WIN-WIN for all
25
-Take advantage
of early
malleability
-Build
foundations for
further learning
& productivity
-Prevent early
damage /avoid
irreversible loss
of potential
EARLY CHILDHOOD NUTRITION PROGRAMS APPEAR PROFITABLE, EVEN IF
PAYOFF IS ONLY 20+ YEARS FROM TODAY
26
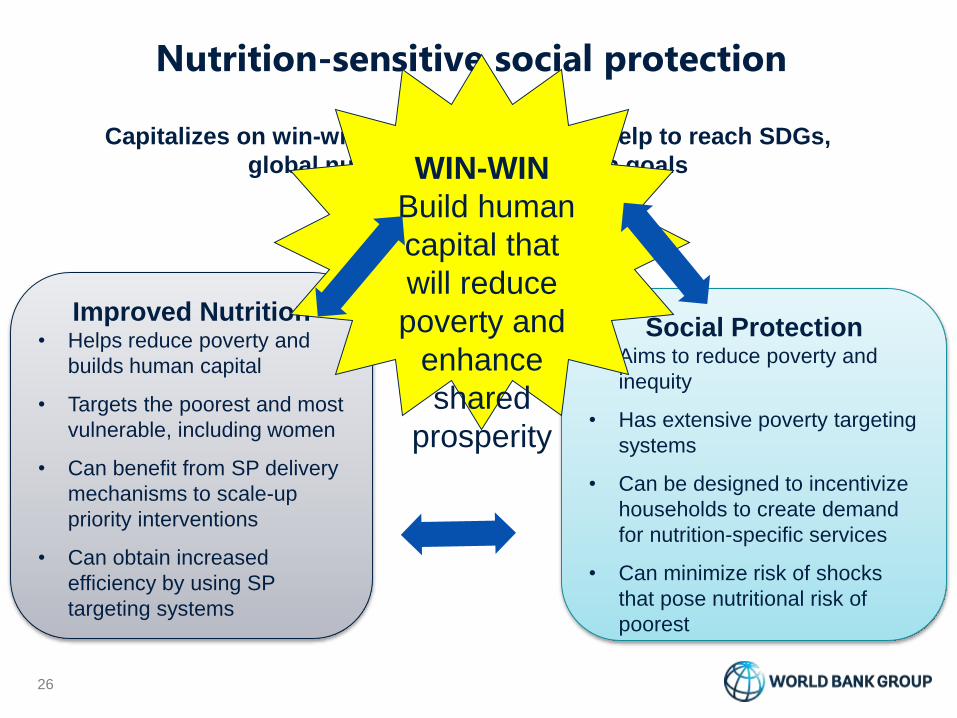
Improved Nutrition• Helps reduce poverty and
builds human capital
• Targets the poorest and most
vulnerable, including women
• Can benefit from SP delivery
mechanisms to scale-up
priority interventions
• Can obtain increased
efficiency by using SP
targeting systems
Social Protection• Aims to reduce poverty and
inequity
• Has extensive poverty targeting
systems
• Can be designed to incentivize
households to create demand
for nutrition-specific services
• Can minimize risk of shocks
that pose nutritional risk of
poorest
Nutrition-sensitive social protection
Capitalizes on win-win for both sectors can help to reach SDGs,
global nutrition targets, and twin goals WIN-WIN
Build human
capital that
will reduce
poverty and
enhance
shared
prosperity