session 4: analysis and reporting managing missing data rob coe (cem, durham) developing a...
TRANSCRIPT

Session 4: Analysis and reporting
Managing missing dataRob Coe (CEM, Durham)
Developing a statistical analysis planHannah Buckley (York Trials Unit)
Panel on EEF reporting and data archivingJonathan Sharples, Camilla Nevill, Steve Higgins and Andrew Bibby

Managing missing data
Rob Coe
EEF Evaluators Conference, York, 2 June 2014

∂
The problem
Only if everyone responds to everything is it still a randomised trial– Any non-response (post-randomisation) → not an RCT
It may not matter (much) if– Response propensity is unrelated to outcome– Non-response is low
Lack of ‘middle ground’ solutions– Mostly people either ignore or use very complex stats
3

∂
What problem are we trying to solve?
We want to estimate the distribution of likely effects of [an intervention] in [a population]– Typically represented by an effect size and CI
Missing data may introduce bias and uncertainty– Point estimate effect size different from observed– Probability distribution for ES (CI) widens
4
What kinds of analysis are feasible to reduce the risk of bias from missing data?
5

∂
Vocabulary
Missing Completely at Random (MCAR)– Response propensity is unrelated to
outcome
Missing at Random (MAR)– Missing responses can be perfectly
predicted from observed data
Missing Not at Random (MNAR)– We can’t be sure that either of the
above apply
6
Ignore missingness
Statistics:IWP, MI
??

∂
“When data are missing not at random, no method of obtaining unbiased estimates exists that does not incorporate the mechanism of non-random missingness, which is nearly always unknown. Some evidence, however, shows that the use of a method that is valid under missing at random can provide some reduction in bias.”
Bell et al, BMJ 2013
7
∂
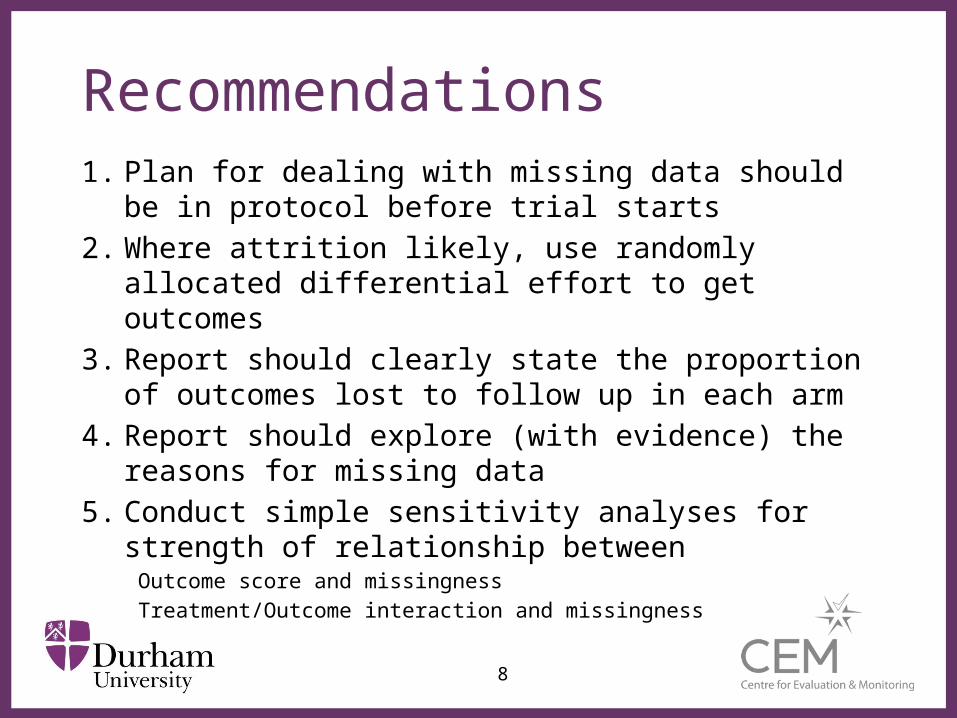
Recommendations1. Plan for dealing with missing data should be in
protocol before trial starts
2. Where attrition likely, use randomly allocated differential effort to get outcomes
3. Report should clearly state the proportion of outcomes lost to follow up in each arm
4. Report should explore (with evidence) the reasons for missing data
5. Conduct simple sensitivity analyses for strength of relationship between
Outcome score and missingness
Treatment/Outcome interaction and missingness
8

∂
If attrition is not low (>5%?)
6. Model outcome response propensity from observed variables
7. Conduct MAR analyses• Inverse weighted probabilities• Multiple imputation
8. Explicitly evaluate plausibility of MAR assumptions (with evidence)
9

∂
10

∂
11
∂
Useful references Bell, M. L., Kenward, M. G., Fairclough, D. L., & Horton, N. J.
(2013). Differential dropout and bias in randomised controlled trials: when it matters and when it may not. BMJ: British Medical Journal, 346:e8668. http://www.bmj.com/content/346/bmj.e8668
Graham, J. W. (2009). Missing data analysis: Making it work in the real world. Annual review of psychology, 60, 549-576.
National Research Council. The Prevention and Treatment of Missing Data in Clinical Trials. Washington, DC: The National Academies Press, 2010. http://www.nap.edu/catalog.php?record_id=12955
Shadish, W. R., Hu, X., Glaser, R. R., Kownacki, R., & Wong, S. (1998). A method for exploring the effects of attrition in randomized experiments with dichotomous outcomes. Psychological Methods, 3(1), 3.
www.missingdata.org.uk
12

Overview
• What is a SAP?
• When is a SAP developed?
• Why is a SAP needed?
• What should be included in a SAP?

What is a SAP?
• Pre-specifies analyses
• Expands on the analysis section of a
protocol
• Provides technical information

When is a SAP developed?
• After protocol finalised
• Before final data received
• Written in the future tense

Why create a SAP
• Pre-specify analyses
• Think through potential pitfalls
• Benefit to other analysts

ACTIVITY
• What do you think should be covered
in a SAP?
• Sort the cards into two piles
What should be in a SAP?
ACTIVITY DISCUSSION
• Which topics do you think do not
need to be covered in a SAP?
• Are there any topics which you were
unsure about?
What should be in a SAP?
What should be in a SAP?
ACTIVITY
1. Which of the cards cover key
background information and which
are related to analysis?
2. Which order would you deal with the
topics in?

Setting the scene
• Restate study objectives
• Study design
• Sample size
• Randomisation methods
The structure of a SAP

Description of outcomes
• Primary outcome
• Secondary outcome(s)
• When outcomes will be measured
• Why outcomes chosen
The structure of a SAP

Analysis - overview
• Analysis set (ITT)
• Software package
• Significance levels
• Blankets statements on confidence
intervals, effect sizes or similar
• Methods for handling missing data
The structure of a SAP

Analysis methods
• Baseline data
• Primary analysis
• Secondary analyses
• Subgroup analyses
• Sensitivity analyses
The structure of a SAP

Conclusions
• Producing a SAP is good practice
• Can help avoid problems in analysis
• Finalised before final data received
• Fairly detailed
• Flexible but should cover key points
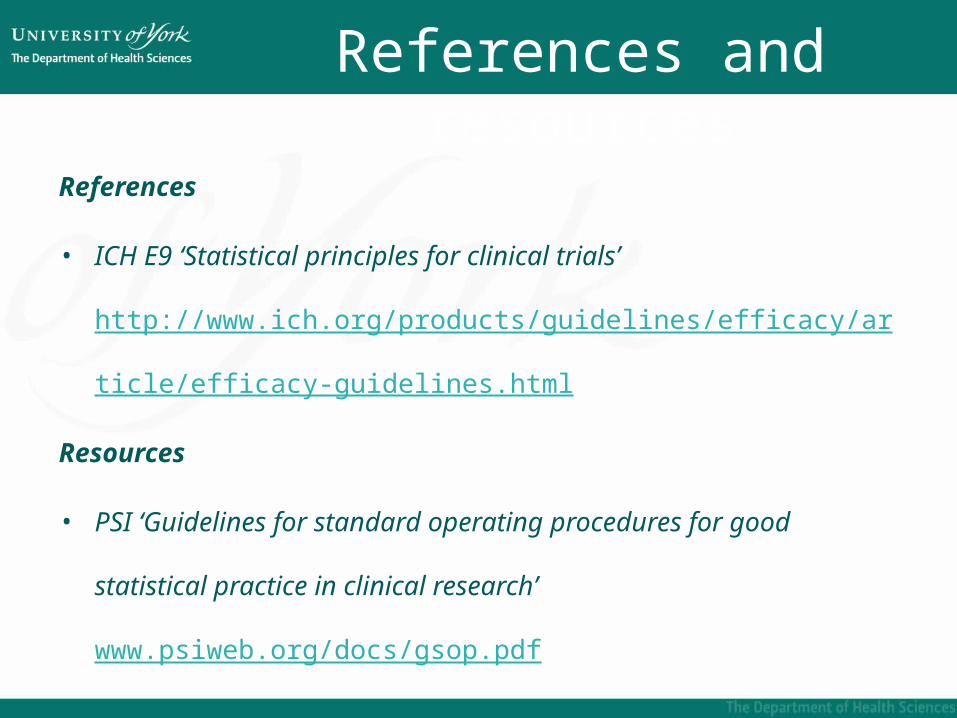
References and resources
References
• ICH E9 ‘Statistical principles for clinical trials’
http://www.ich.org/products/guidelines/efficacy/article/effica
cy-guidelines.html
Resources
• PSI ‘Guidelines for standard operating procedures for good
statistical practice in clinical research’
www.psiweb.org/docs/gsop.pdf

Thank you!
Any questions or discussion points?

EEF reporting and data archivingJonathan Sharples (EEF)Camilla Nevill (EEF)Steve Higgins (Durham) - ChairAndrew Bibby (FFT)

The reporting process and publication of results on EEF’s websiteJonathan Sharples (EEF)

Classifying the security of findings from EEF evaluationsCamilla Nevill (EEF)
Group Number of pupils
Effect size Estimated months’
progress Evidence strength
Literacy intervention 550 0.10 (0.03, 0.18) +2
www.educationendowmentfoundation.org.uk/evaluation

Example Appendix: Chatterbooks
Rating 1. Design 2. Power (MDES)
3. Attrition 4. Balance 5. Threats to validity
5 Fair and clear experimental design (RCT) < 0.2 < 10%
Well-balanced on observables
No threats to validity
4 Fair and clear experimental design (RCT, RDD) < 0.3 < 20%
3 Well-matched comparison (quasi-experiment) < 0.4 < 30%
Some threats
2 Matched comparison (quasi-experiment) < 0.5 < 40%
1 Comparison group with poor or no matching < 0.6 < 50%
0 No comparator > 0.6 > 50% Imbalanced on observables
Significant threats

Combining the results of evaluations with the meta-analysis in the Teaching and Learning ToolkitSteve Higgins (Durham)

Andrew Bibby
Archiving EEF project data


1. Include permission for linking and archiving in consent forms
2. Retain pupil identifiers
3. Label values and variables
4. Save Syntax or Do files
Prior to archiving…