settlement hierarchy - calderdale
TRANSCRIPT
Local Development Framework
Settlement Hierarchy Methodology Consultation
Evidence Base - November 2008

21 Introduction
32 Policy Context
3National Policy
3Regional Policy
4Local Policy
53 Methodology - research data
84 Methodology - modelling
215 Results
356 Recommendations
Appendix
361 Settlement identification map
ContentsIssues &
Options N
ovember 2008 | S
ettlement H
eirarchy Model M
ethodology
1 Introduction
1.1 Government has given local planning authorities the responsibility for ensuring that future new developmentshould embody as far as possible the principles of sustainable development.The Calderdale Local DevelopmentFramework (LDF), which will gradually replace the existing development plan (Replacement Calderdale UnitaryDevelopment Plan), will be a significant contributor to ensuring sustainable development is achieved.
1.2 The benchmark for assessing sustainability and sustainable development in the UK is “Securing OurFuture” (March 2005). It builds upon “A Better Quality of Life, A Strategy for Sustainable Development for theUK” published by the Government in 1991. Planning Policy Statement 1, “Delivering Sustainable Development”,published in February 2005, emphasises the need for the planning process to deliver sustainable development.The Strategy recognises that in achieving sustainable development, four inter-related and equally importantobjectives need to be fulfilled. These are:
social progress which recognises the needs of everyone;effective protection of the environment;prudent use of natural resources; andmaintenance of high and stable levels of economic growth and employment;
1.3 Future patterns of sustainable development in Calderdale will need to embrace these four sustainabilityobjectives in the context of local sustainability criteria. Achieving sustainable development is now at the heartof the development plan process and the emerging LDF will need to embrace sustainability in future developmentoptions.
1.4 Establishing a Settlement Hierarchy is arguably one of the most important ways the Calderdale LDF cancontribute to sustainable development. The Settlement Hierarchy will therefore be one of the key pieces ofevidence for the Calderdale LDF.
What is a Settlement Hierarchy
1.5 Settlements work by providing services for a wider area. The bigger the settlement the more services ittends to have. Over time a settlement hierarchy has developed in the district with Halifax being placed at thetop of the hierarchy providing the majority of the services.The smaller settlements have been limited to providinglocal services. As car ownership has increased this has led to a decline in services in many smaller settlements.
1.6 The Council’s methodology has evolved from the concept of a settlement hierarchy as set out within theRegional Spatial Strategy (2008) (RSS). A settlement hierarchy involves the classification of settlement typesaccording to a number of factors; these include accessibility to services and the level of facilities provided bythe settlement.
1.7 This model provides a snapshot in time of the facilities and accessibility to services within the differentsettlements of Calderdale.The identification of these factors will provide a basis for indicating the sustainabilityof different settlements and their ability to accommodate future growth. The settlement hierarchy model willalso indicate where there are deficiencies within a settlement that could be addressed through developmentor other means.
1.8 The information gained from the final settlement hierarchy model will be used to inform the spatial optionsfor the Core Strategy and Land Allocations and Designations Development Plan Documents for the CalderdaleLDF.
1 . Introduction
2
Issu
es &
Opt
ions
Nov
embe
r 20
08 |
Set
tlem
ent H
eira
rchy
Mod
el M
etho
dolo
gy

2 Policy Context
2.1 There is no specific guidance on how to undertake a study of Settlement Hierarchy. National and regionalpolicy does provide some key issues that need to be addressed and a regional Settlement Hierarchy underpinnedregional policy.The methodology indicated in the following sections builds upon these policy issues and regionalstudy.
National Policy
2.2 The main sources of national policy in relation to Settlement Hierarchy are PPS1 (Delivering SustainableDevelopment); PPS3 (Housing); PPS6 (Planning for Town Centres); PPS7 (Sustainable Development in RuralAreas) and PPG13 (Transport). They state that:
Most new development should be directed to existing towns and cities, to help maximise accessibility toemployment and services by walking, cycling and public transport.In rural areas, development should be focussed on settlements that can act as service centres forsurrounding areas.In open countryside small ribbons of housing development with no services are not usually appropriatefor further housing.Location of new development should take into account the accessibility to existing community facilities,infrastructure and services, including public transport. The location of new housing should facilitate thecreation of communities of sufficient size and mix to justify the development of, and sustain, communityfacilities, infrastructure and services.
Regional Policy
2.3 The Yorkshire and Humber RSS takes these national principles further and provides a settlement strategycontext for the region. This strategy identifies roles for the main towns and cities across the Yorkshire andHumber region.The regional policy context was based upon a Regional Settlement Study, undertaken in 2004.This study considered a total of 233 settlements across the Yorkshire and Humber Region (the main cities ofLeeds, Bradford, Hull and Sheffield were not studied). Each settlement was scored against a range of criteria,primarily concerning the availability of services such as financial, education, leisure and health. Each settlementwas then provided with an aggregate score and ranked accordingly. The ranks used were Sub-regional centre,Principal Centre, Local Service Centre and Basic Service Centre. Within Calderdale Halifax and Brighousewere named as Regional and Principal Centres respectively. Policies YH5 and YH6 of the emerging RSSindicate that these settlements should be the main foci for housing, employment, shopping, leisure, education,health and cultural activities and facilities within the district.
2.4 In addition to Halifax and Brighouse the following settlements were identified as Local Service Centres;
EllandHebden BridgeHipperholme/ LightcliffeLuddenden/ Luddenden FootMytholmroydRastrickRippondenSouthowramSowerby BridgeStainland/ Holywell GreenTodmordenWest Vale/ Greetland
2 . Policy Context
3
Issues & O
ptions Novem
ber 2008 | Settlem
ent Heirarchy M
odel Methodology
2.5 Other than Halifax and Brighouse none of the above classifications have been translated into the emergingRSS. It is therefore necessary for the LDF to formally identify which settlements are classified as Local ServiceCentres, or indeed if any other Principal Towns should be identified. Policy YH7 provides a policy context forLocal Service Centres, which states they should retain and improve local services, and facilities, supporteconomic diversification and meet locally generated needs for both market and affordable housing.
2.6 The RSS also provides criteria for travel times to essential facilities by public transport. This has beendone both for identifying accessibility to a new destination by the whole of the population, such as a school orhospital and accessibility to services from an origin, such as a new housing site. These criteria will be mostimportant when assessing individual site allocations, however they have been incorporated into this modelwherever possible.
Local Policy
2.7 Currently the most important local policy documents for the settlement hierarchy are the ReplacementCalderdale Unitary Development Plan (UDP) and the Community Strategy, Calderdale Futures. Both of thesedocuments promote the creation of sustainable communities by improving accessibility to services and facilities.
2.8 In addition other parts of the LDF evidence base will compliment the Settlement Hierarchy as they aredeveloped. These will include:
Strategic Flood Risk AssessmentEmployment Land ReviewStrategic Housing Land Availability AssessmentOpen Space, Sport and Recreation StudyGreen Belt Review
2 . Policy Context
4
Issu
es &
Opt
ions
Nov
embe
r 20
08 |
Set
tlem
ent H
eira
rchy
Mod
el M
etho
dolo
gy
3 Methodology - research data
3.1 The data for the study was collected through a combination of secondary sources and primary research.The data obtained through secondary sources in literature, previously published research, or publishedinformation sources were used to devise and provide a context for the questionnaires that are part of the originalresearch.
3.2 The use of secondary data is important to provide a context of the topic. There have been a variety ofinterpretations of ‘sustainable communities’ by different policy makers and commentators in recent years. Theuse of secondary data can help determine the significance of the term as a generic objective for the planningand regeneration of the localities in the study. Secondary data can be analysed to demonstrate actual orpotential relationships between the features of sustainable communities that inform the model.
3.3 The key concepts and ideas are economic, environmental, social, organisational and political. Theanalysis of the secondary data was used to construct the questionnaires and interview questions.
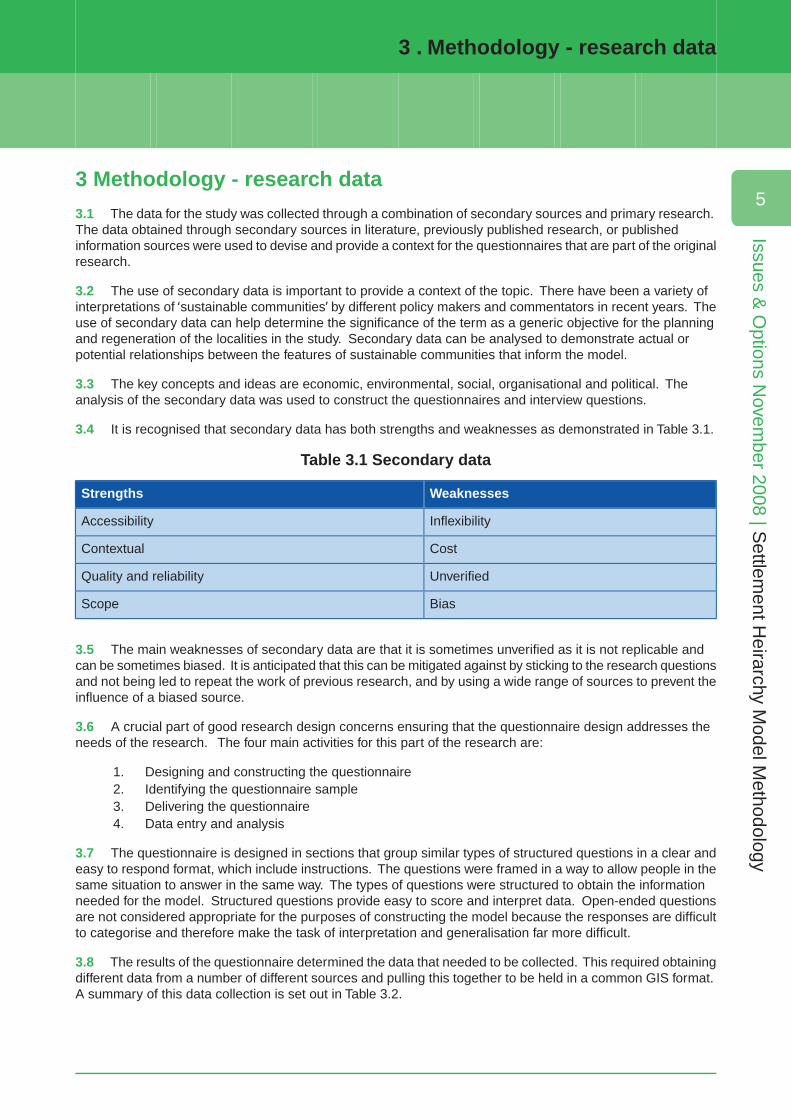
3.4 It is recognised that secondary data has both strengths and weaknesses as demonstrated in Table 3.1.
Table 3.1 Secondary data
WeaknessesStrengths
InflexibilityAccessibility
CostContextual
UnverifiedQuality and reliability
BiasScope
3.5 The main weaknesses of secondary data are that it is sometimes unverified as it is not replicable andcan be sometimes biased. It is anticipated that this can be mitigated against by sticking to the research questionsand not being led to repeat the work of previous research, and by using a wide range of sources to prevent theinfluence of a biased source.
3.6 A crucial part of good research design concerns ensuring that the questionnaire design addresses theneeds of the research. The four main activities for this part of the research are:
1. Designing and constructing the questionnaire2. Identifying the questionnaire sample3. Delivering the questionnaire4. Data entry and analysis
3.7 The questionnaire is designed in sections that group similar types of structured questions in a clear andeasy to respond format, which include instructions. The questions were framed in a way to allow people in thesame situation to answer in the same way. The types of questions were structured to obtain the informationneeded for the model. Structured questions provide easy to score and interpret data. Open-ended questionsare not considered appropriate for the purposes of constructing the model because the responses are difficultto categorise and therefore make the task of interpretation and generalisation far more difficult.
3.8 The results of the questionnaire determined the data that needed to be collected. This required obtainingdifferent data from a number of different sources and pulling this together to be held in a common GIS format.A summary of this data collection is set out in Table 3.2.
3 . Methodology - research data
5
Issues & O
ptions Novem
ber 2008 | Settlem
ent Heirarchy M
odel Methodology
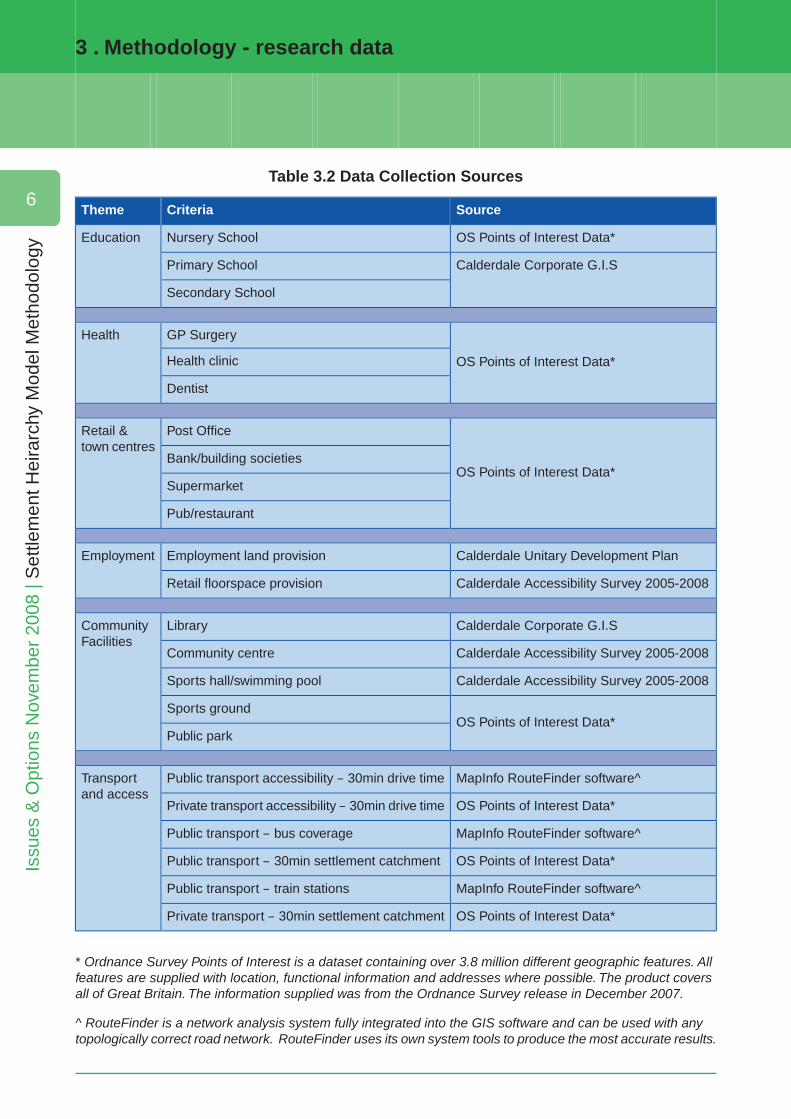
Table 3.2 Data Collection Sources
SourceCriteriaTheme
OS Points of Interest Data*Nursery SchoolEducation
Calderdale Corporate G.I.SPrimary School
Secondary School
OS Points of Interest Data*
GP SurgeryHealth
Health clinic
Dentist
OS Points of Interest Data*
Post OfficeRetail &town centres
Bank/building societies
Supermarket
Pub/restaurant
Calderdale Unitary Development PlanEmployment land provisionEmployment
Calderdale Accessibility Survey 2005-2008Retail floorspace provision
Calderdale Corporate G.I.SLibraryCommunityFacilities
Calderdale Accessibility Survey 2005-2008Community centre
Calderdale Accessibility Survey 2005-2008Sports hall/swimming pool
OS Points of Interest Data*Sports ground
Public park
MapInfo RouteFinder software^Public transport accessibility – 30min drive timeTransportand access
OS Points of Interest Data*Private transport accessibility – 30min drive time
MapInfo RouteFinder software^Public transport – bus coverage
OS Points of Interest Data*Public transport – 30min settlement catchment
MapInfo RouteFinder software^Public transport – train stations
OS Points of Interest Data*Private transport – 30min settlement catchment
* Ordnance Survey Points of Interest is a dataset containing over 3.8 million different geographic features. Allfeatures are supplied with location, functional information and addresses where possible. The product coversall of Great Britain. The information supplied was from the Ordnance Survey release in December 2007.
^ RouteFinder is a network analysis system fully integrated into the GIS software and can be used with anytopologically correct road network. RouteFinder uses its own system tools to produce the most accurate results.
3 . Methodology - research data
6
Issu
es &
Opt
ions
Nov
embe
r 20
08 |
Set
tlem
ent H
eira
rchy
Mod
el M
etho
dolo
gy
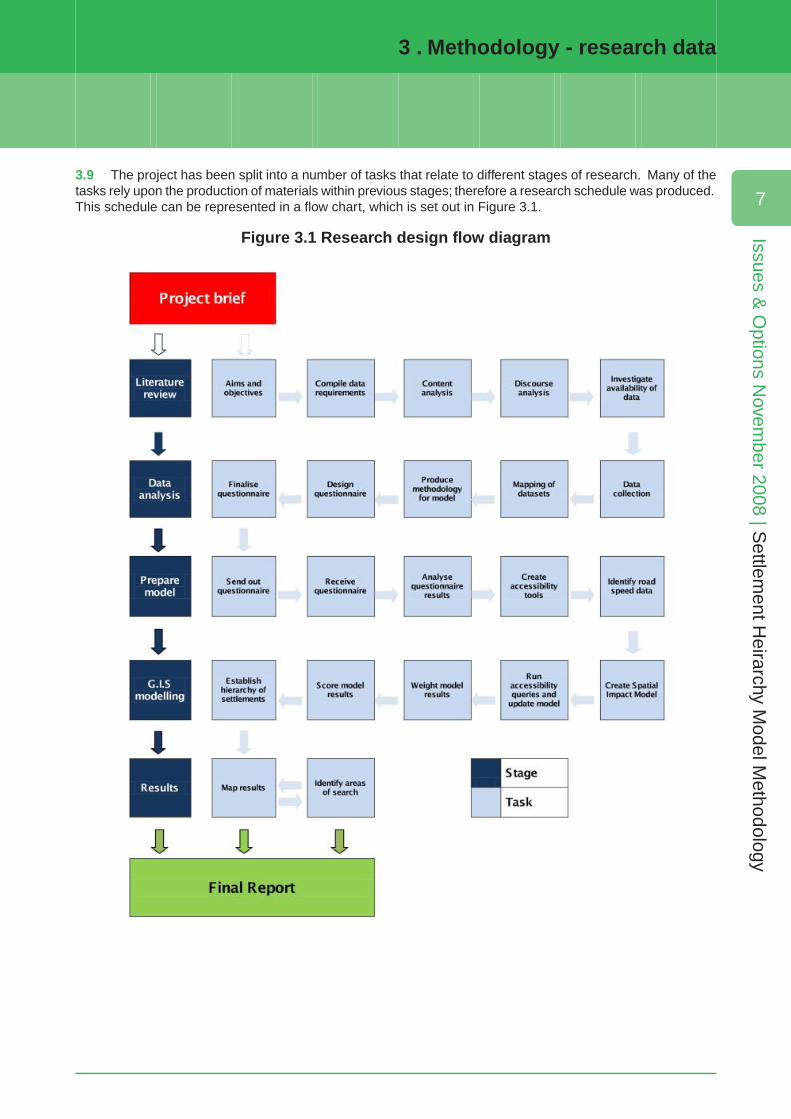
3.9 The project has been split into a number of tasks that relate to different stages of research. Many of thetasks rely upon the production of materials within previous stages; therefore a research schedule was produced.This schedule can be represented in a flow chart, which is set out in Figure 3.1.
Figure 3.1 Research design flow diagram
3 . Methodology - research data
7
Issues & O
ptions Novem
ber 2008 | Settlem
ent Heirarchy M
odel Methodology
4 Methodology - modelling
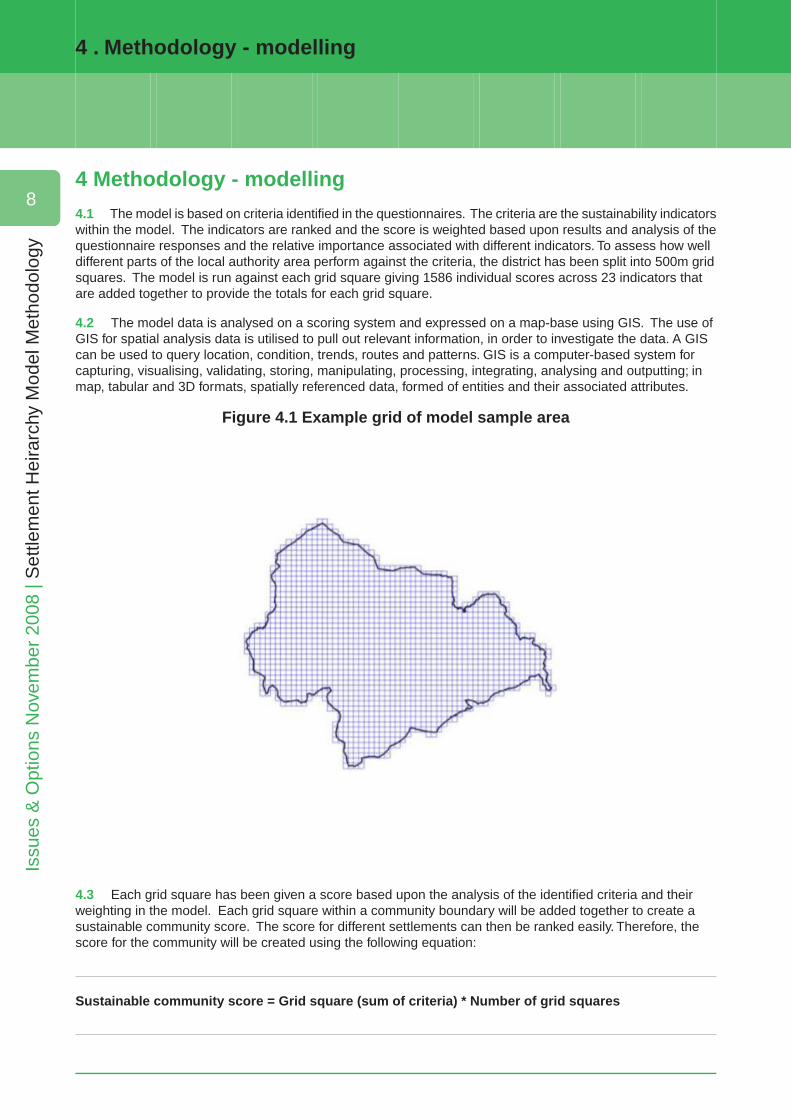
4.1 The model is based on criteria identified in the questionnaires. The criteria are the sustainability indicatorswithin the model. The indicators are ranked and the score is weighted based upon results and analysis of thequestionnaire responses and the relative importance associated with different indicators. To assess how welldifferent parts of the local authority area perform against the criteria, the district has been split into 500m gridsquares. The model is run against each grid square giving 1586 individual scores across 23 indicators thatare added together to provide the totals for each grid square.
4.2 The model data is analysed on a scoring system and expressed on a map-base using GIS. The use ofGIS for spatial analysis data is utilised to pull out relevant information, in order to investigate the data. A GIScan be used to query location, condition, trends, routes and patterns. GIS is a computer-based system forcapturing, visualising, validating, storing, manipulating, processing, integrating, analysing and outputting; inmap, tabular and 3D formats, spatially referenced data, formed of entities and their associated attributes.
Figure 4.1 Example grid of model sample area
4.3 Each grid square has been given a score based upon the analysis of the identified criteria and theirweighting in the model. Each grid square within a community boundary will be added together to create asustainable community score. The score for different settlements can then be ranked easily. Therefore, thescore for the community will be created using the following equation:
Sustainable community score = Grid square (sum of criteria) * Number of grid squares
4 . Methodology - modelling
8
Issu
es &
Opt
ions
Nov
embe
r 20
08 |
Set
tlem
ent H
eira
rchy
Mod
el M
etho
dolo
gy
4.4 Further analysis would be possible at site-specific locations to give scores at precise locations. Thiswould involve further calibration of the model and is considered beyond the scope of this study given thelimitations of time and resources.
Stage One: Identifying the assessment criteria
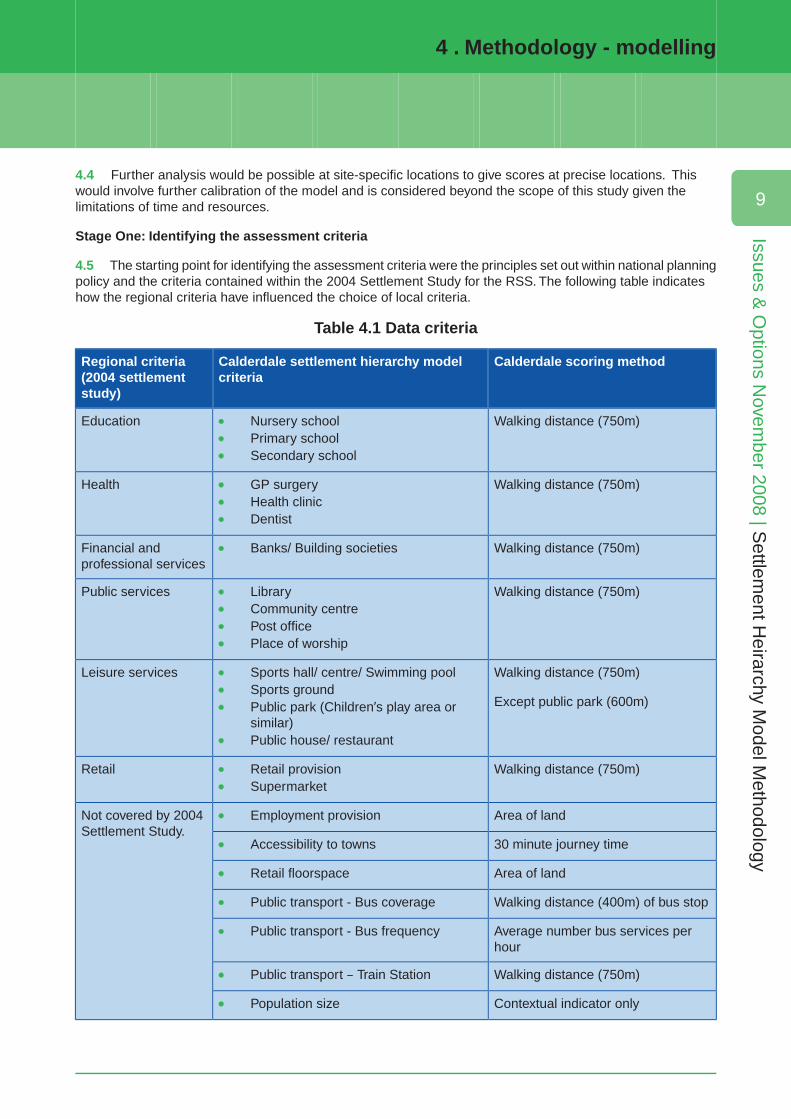
4.5 The starting point for identifying the assessment criteria were the principles set out within national planningpolicy and the criteria contained within the 2004 Settlement Study for the RSS. The following table indicateshow the regional criteria have influenced the choice of local criteria.
Table 4.1 Data criteria
Calderdale scoring methodCalderdale settlement hierarchy modelcriteria
Regional criteria(2004 settlementstudy)
Walking distance (750m)Education Nursery schoolPrimary schoolSecondary school
Walking distance (750m)Health GP surgeryHealth clinicDentist
Walking distance (750m)Financial andprofessional services
Banks/ Building societies
Walking distance (750m)Public services LibraryCommunity centrePost officePlace of worship
Walking distance (750m)
Except public park (600m)
Leisure services Sports hall/ centre/ Swimming poolSports groundPublic park (Children’s play area orsimilar)Public house/ restaurant
Walking distance (750m)Retail Retail provisionSupermarket
Area of landNot covered by 2004Settlement Study.
Employment provision
30 minute journey timeAccessibility to towns
Area of landRetail floorspace
Walking distance (400m) of bus stopPublic transport - Bus coverage
Average number bus services perhour
Public transport - Bus frequency
Walking distance (750m)Public transport – Train Station
Contextual indicator onlyPopulation size
4 . Methodology - modelling
9
Issues & O
ptions Novem
ber 2008 | Settlem
ent Heirarchy M
odel Methodology
4.6 Each criterion will be scored in a number of ways. The type of scoring used for each criterion is set outin Table 4.1. The method of scoring the criteria is based upon professional judgement and is influenced by theoutcomes of the questionnaire. The different criteria scoring ranges are determined through the assessmentof walking distances, amount of land coverage for a specific uses and travel times.
Identifying the assessment criteria: walking distances
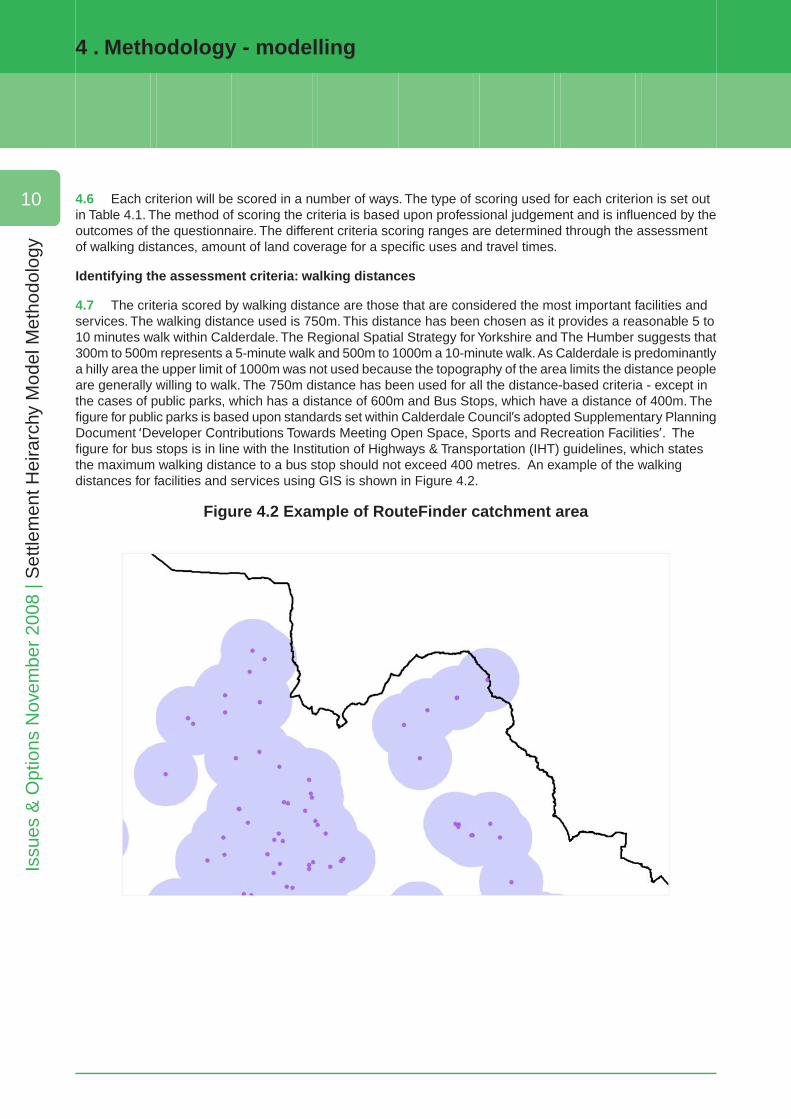
4.7 The criteria scored by walking distance are those that are considered the most important facilities andservices. The walking distance used is 750m. This distance has been chosen as it provides a reasonable 5 to10 minutes walk within Calderdale. The Regional Spatial Strategy for Yorkshire and The Humber suggests that300m to 500m represents a 5-minute walk and 500m to 1000m a 10-minute walk. As Calderdale is predominantlya hilly area the upper limit of 1000m was not used because the topography of the area limits the distance peopleare generally willing to walk. The 750m distance has been used for all the distance-based criteria - except inthe cases of public parks, which has a distance of 600m and Bus Stops, which have a distance of 400m. Thefigure for public parks is based upon standards set within Calderdale Council’s adopted Supplementary PlanningDocument ‘Developer Contributions Towards Meeting Open Space, Sports and Recreation Facilities’. Thefigure for bus stops is in line with the Institution of Highways & Transportation (IHT) guidelines, which statesthe maximum walking distance to a bus stop should not exceed 400 metres. An example of the walkingdistances for facilities and services using GIS is shown in Figure 4.2.
Figure 4.2 Example of RouteFinder catchment area
4 . Methodology - modelling
10
Issu
es &
Opt
ions
Nov
embe
r 20
08 |
Set
tlem
ent H
eira
rchy
Mod
el M
etho
dolo
gy
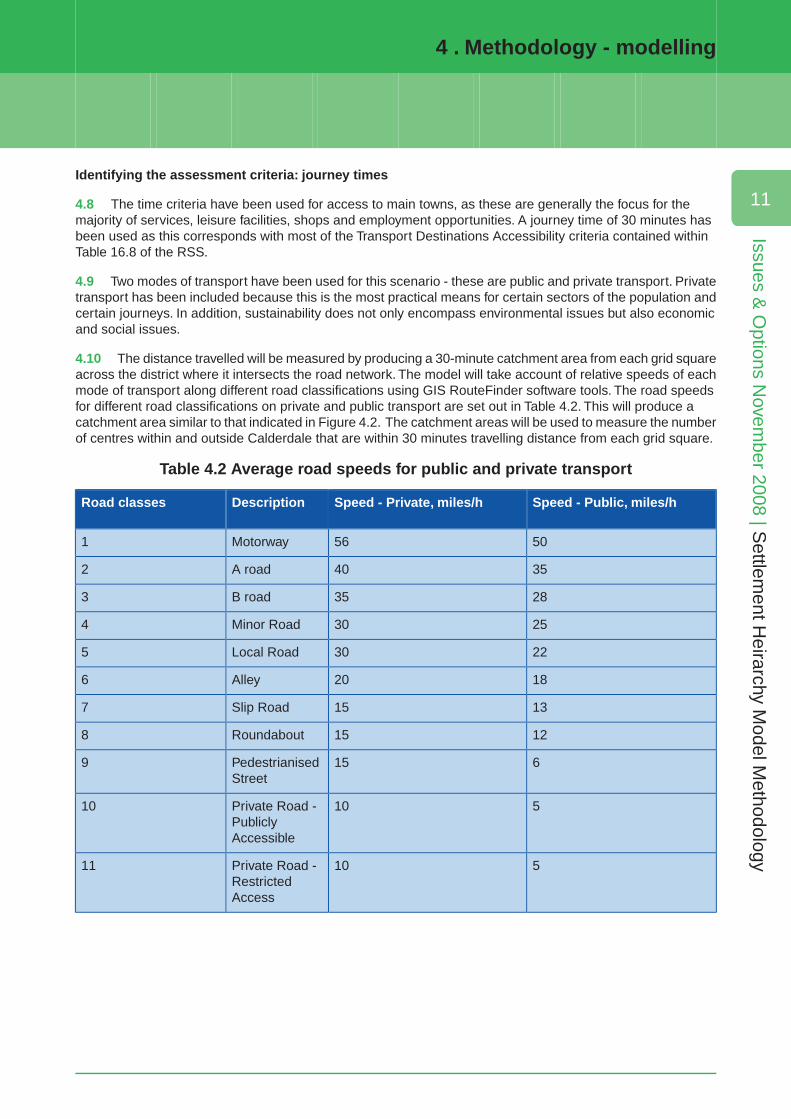
Identifying the assessment criteria: journey times
4.8 The time criteria have been used for access to main towns, as these are generally the focus for themajority of services, leisure facilities, shops and employment opportunities. A journey time of 30 minutes hasbeen used as this corresponds with most of the Transport Destinations Accessibility criteria contained withinTable 16.8 of the RSS.
4.9 Two modes of transport have been used for this scenario - these are public and private transport. Privatetransport has been included because this is the most practical means for certain sectors of the population andcertain journeys. In addition, sustainability does not only encompass environmental issues but also economicand social issues.
4.10 The distance travelled will be measured by producing a 30-minute catchment area from each grid squareacross the district where it intersects the road network. The model will take account of relative speeds of eachmode of transport along different road classifications using GIS RouteFinder software tools. The road speedsfor different road classifications on private and public transport are set out in Table 4.2. This will produce acatchment area similar to that indicated in Figure 4.2. The catchment areas will be used to measure the numberof centres within and outside Calderdale that are within 30 minutes travelling distance from each grid square.
Table 4.2 Average road speeds for public and private transport
Speed - Public, miles/hSpeed - Private, miles/hDescriptionRoad classes
5056Motorway1
3540A road2
2835B road3
2530Minor Road4
2230Local Road5
1820Alley6
1315Slip Road7
1215Roundabout8
615PedestrianisedStreet
9
510Private Road -PubliclyAccessible
10
510Private Road -RestrictedAccess
11
4 . Methodology - modelling
11
Issues & O
ptions Novem
ber 2008 | Settlem
ent Heirarchy M
odel Methodology
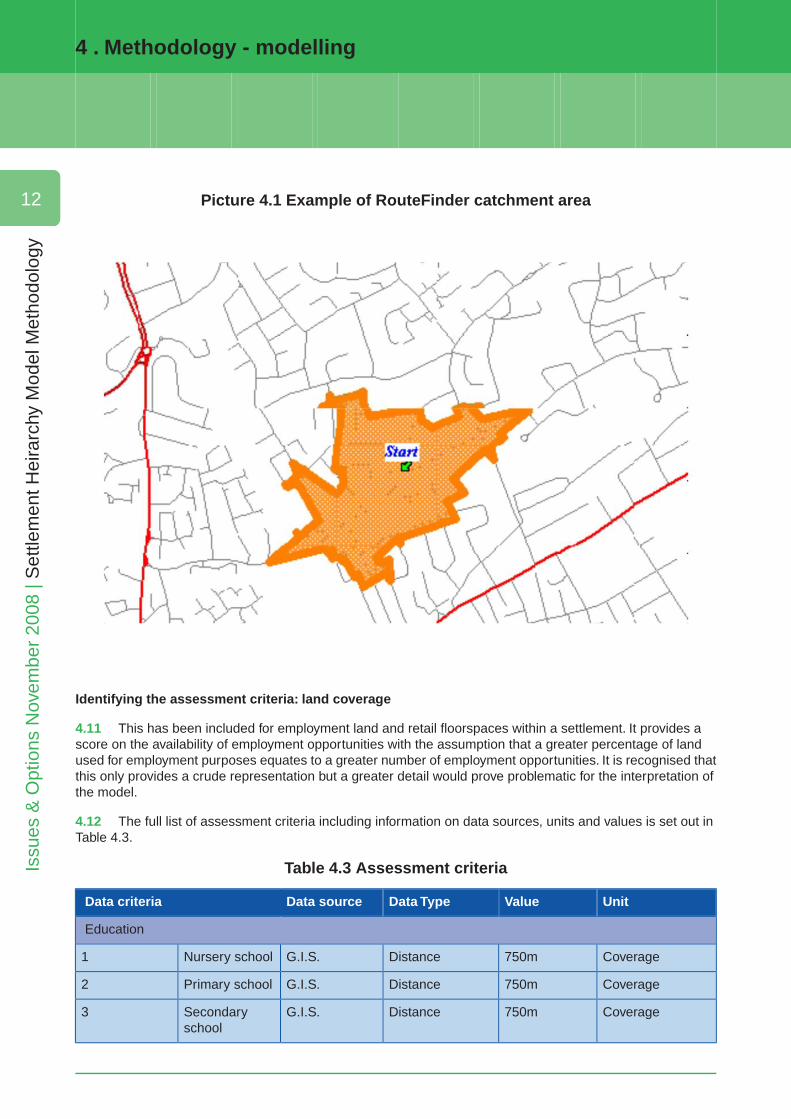
Picture 4.1 Example of RouteFinder catchment area
Identifying the assessment criteria: land coverage
4.11 This has been included for employment land and retail floorspaces within a settlement. It provides ascore on the availability of employment opportunities with the assumption that a greater percentage of landused for employment purposes equates to a greater number of employment opportunities. It is recognised thatthis only provides a crude representation but a greater detail would prove problematic for the interpretation ofthe model.
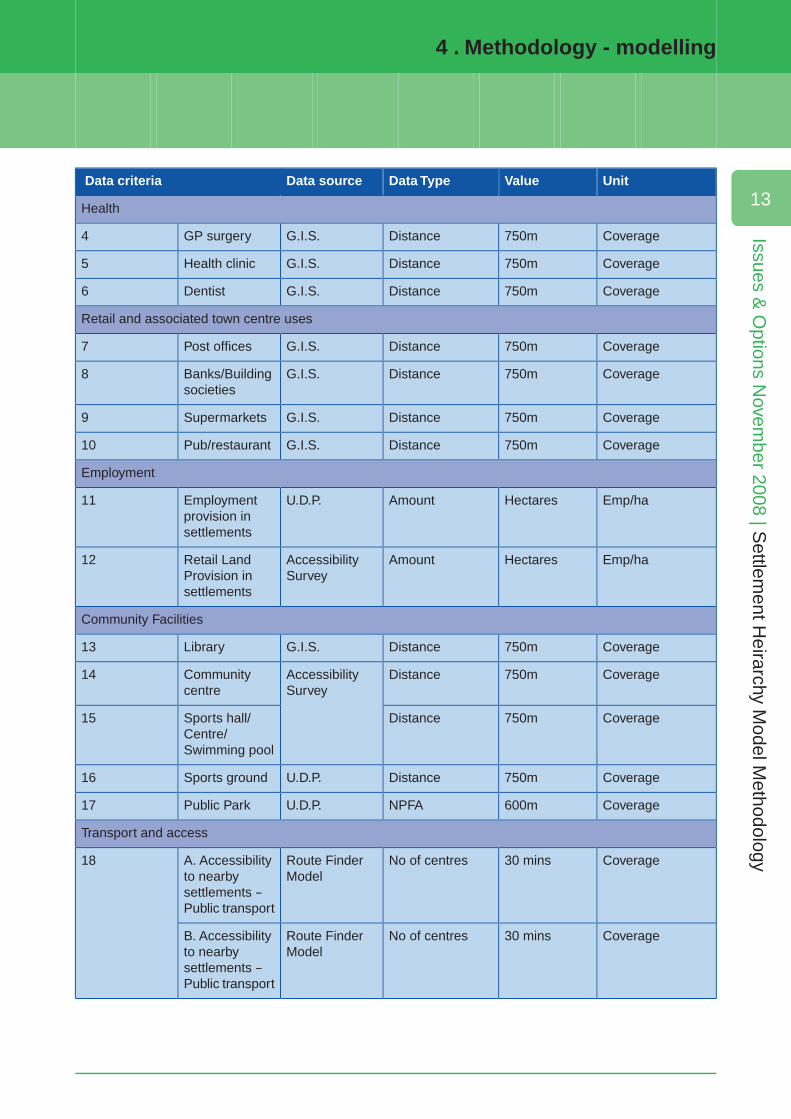
4.12 The full list of assessment criteria including information on data sources, units and values is set out inTable 4.3.
Table 4.3 Assessment criteria
UnitValueData TypeData source Data criteria
Education
Coverage750mDistanceG.I.S.Nursery school1
Coverage750mDistanceG.I.S.Primary school2
Coverage750mDistanceG.I.S.Secondaryschool
3
4 . Methodology - modelling
12
Issu
es &
Opt
ions
Nov
embe
r 20
08 |
Set
tlem
ent H
eira
rchy
Mod
el M
etho
dolo
gy
UnitValueData TypeData source Data criteria
Health
Coverage750mDistanceG.I.S.GP surgery4
Coverage750mDistanceG.I.S.Health clinic5
Coverage750mDistanceG.I.S.Dentist6
Retail and associated town centre uses
Coverage750mDistanceG.I.S.Post offices7
Coverage750mDistanceG.I.S.Banks/Buildingsocieties
8
Coverage750mDistanceG.I.S.Supermarkets9
Coverage750mDistanceG.I.S.Pub/restaurant10
Employment
Emp/haHectaresAmountU.D.P.Employmentprovision insettlements
11
Emp/haHectaresAmountAccessibilitySurvey
Retail LandProvision insettlements
12
Community Facilities
Coverage750mDistanceG.I.S.Library13
Coverage750mDistanceAccessibilitySurvey
Communitycentre
14
Coverage750mDistanceSports hall/Centre/Swimming pool
15
Coverage750mDistanceU.D.P.Sports ground16
Coverage600mNPFAU.D.P.Public Park17
Transport and access
Coverage30 minsNo of centresRoute FinderModel
A. Accessibilityto nearby
18
settlements –Public transport
Coverage30 minsNo of centresRoute FinderModel
B. Accessibilityto nearbysettlements –Public transport
4 . Methodology - modelling
13
Issues & O
ptions Novem
ber 2008 | Settlem
ent Heirarchy M
odel Methodology
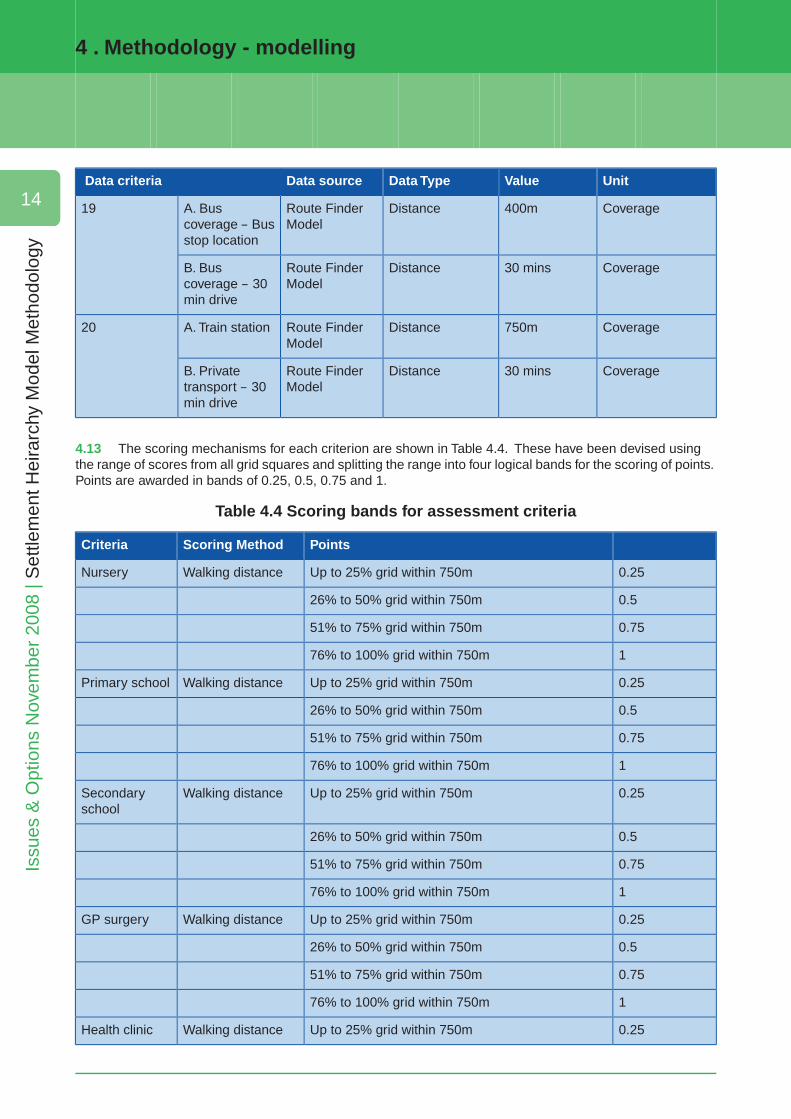
UnitValueData TypeData source Data criteria
Coverage400mDistanceRoute FinderModel
A. Buscoverage – Busstop location
19
Coverage30 minsDistanceRoute FinderModel
B. Buscoverage – 30min drive
Coverage750mDistanceRoute FinderModel
A. Train station20
Coverage30 minsDistanceRoute FinderModel
B. Privatetransport – 30min drive
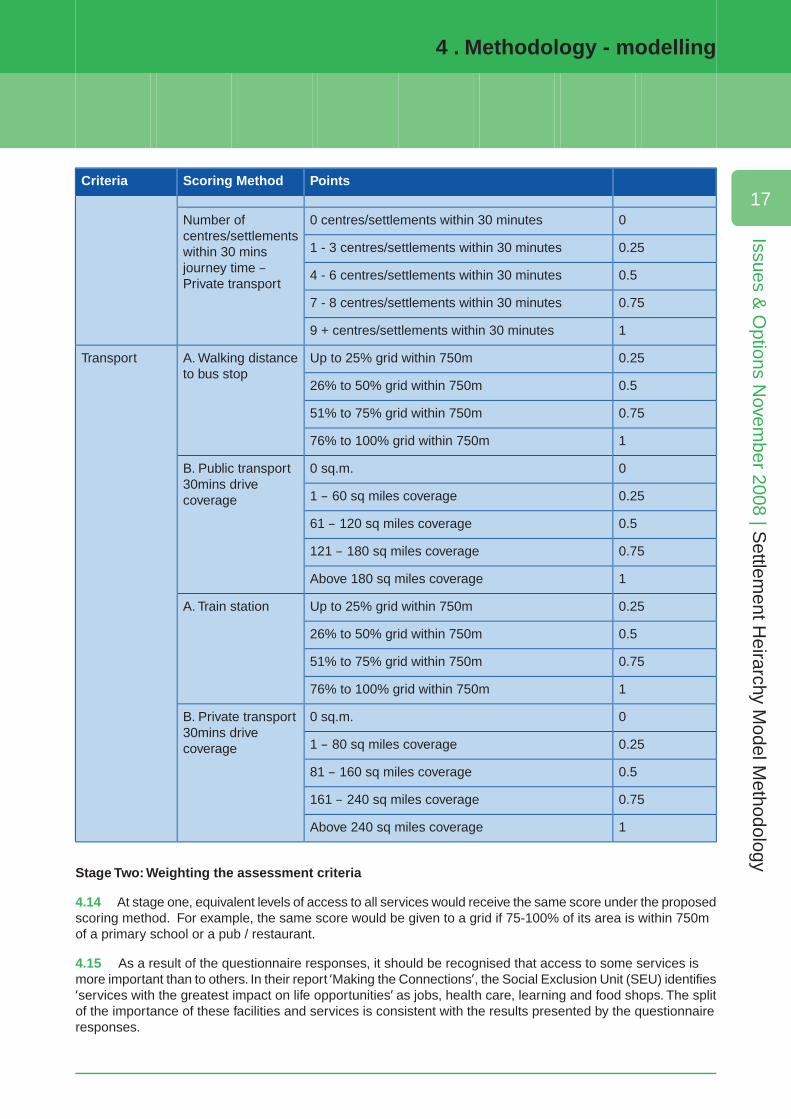
4.13 The scoring mechanisms for each criterion are shown in Table 4.4. These have been devised usingthe range of scores from all grid squares and splitting the range into four logical bands for the scoring of points.Points are awarded in bands of 0.25, 0.5, 0.75 and 1.
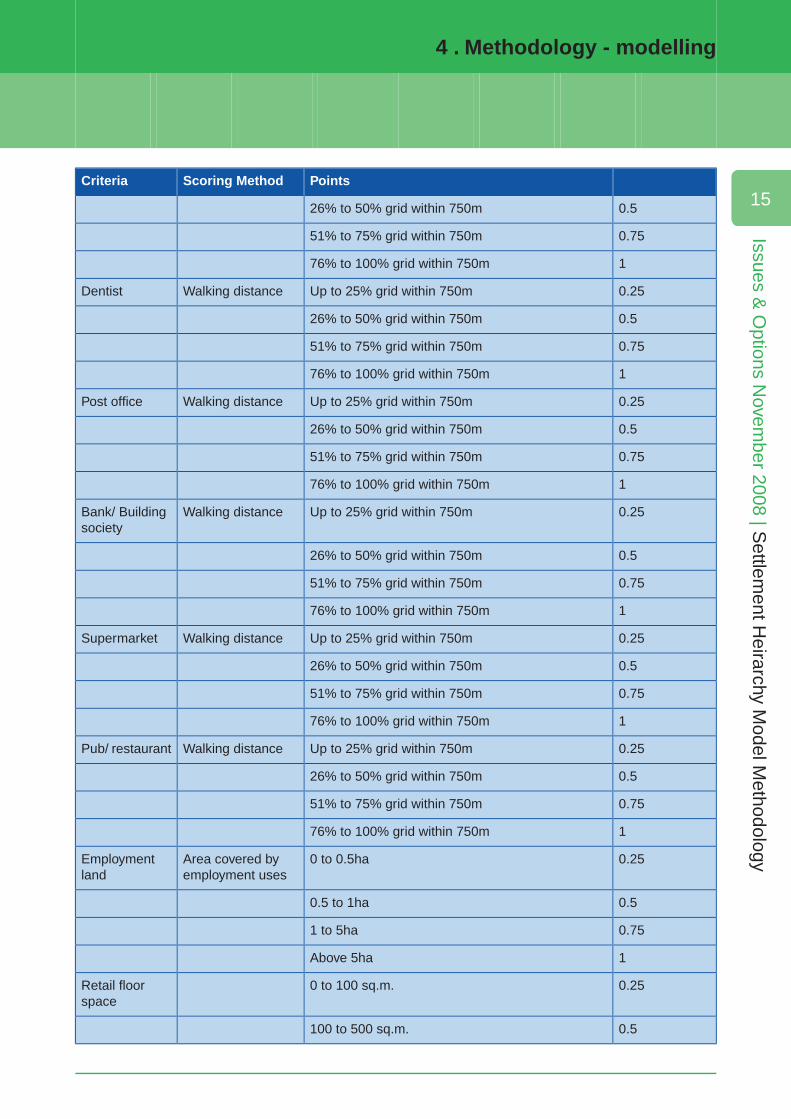
Table 4.4 Scoring bands for assessment criteria
PointsScoring MethodCriteria
0.25Up to 25% grid within 750mWalking distanceNursery
0.526% to 50% grid within 750m
0.7551% to 75% grid within 750m
176% to 100% grid within 750m
0.25Up to 25% grid within 750mWalking distancePrimary school
0.526% to 50% grid within 750m
0.7551% to 75% grid within 750m
176% to 100% grid within 750m
0.25Up to 25% grid within 750mWalking distanceSecondaryschool
0.526% to 50% grid within 750m
0.7551% to 75% grid within 750m
176% to 100% grid within 750m
0.25Up to 25% grid within 750mWalking distanceGP surgery
0.526% to 50% grid within 750m
0.7551% to 75% grid within 750m
176% to 100% grid within 750m
0.25Up to 25% grid within 750mWalking distanceHealth clinic
4 . Methodology - modelling
14
Issu
es &
Opt
ions
Nov
embe
r 20
08 |
Set
tlem
ent H
eira
rchy
Mod
el M
etho
dolo
gy
PointsScoring MethodCriteria
0.526% to 50% grid within 750m
0.7551% to 75% grid within 750m
176% to 100% grid within 750m
0.25Up to 25% grid within 750mWalking distanceDentist
0.526% to 50% grid within 750m
0.7551% to 75% grid within 750m
176% to 100% grid within 750m
0.25Up to 25% grid within 750mWalking distancePost office
0.526% to 50% grid within 750m
0.7551% to 75% grid within 750m
176% to 100% grid within 750m
0.25Up to 25% grid within 750mWalking distanceBank/ Buildingsociety
0.526% to 50% grid within 750m
0.7551% to 75% grid within 750m
176% to 100% grid within 750m
0.25Up to 25% grid within 750mWalking distanceSupermarket
0.526% to 50% grid within 750m
0.7551% to 75% grid within 750m
176% to 100% grid within 750m
0.25Up to 25% grid within 750mWalking distancePub/ restaurant
0.526% to 50% grid within 750m
0.7551% to 75% grid within 750m
176% to 100% grid within 750m
0.250 to 0.5haArea covered byemployment uses
Employmentland
0.50.5 to 1ha
0.751 to 5ha
1Above 5ha
0.250 to 100 sq.m.Retail floorspace
0.5100 to 500 sq.m.
4 . Methodology - modelling
15
Issues & O
ptions Novem
ber 2008 | Settlem
ent Heirarchy M
odel Methodology
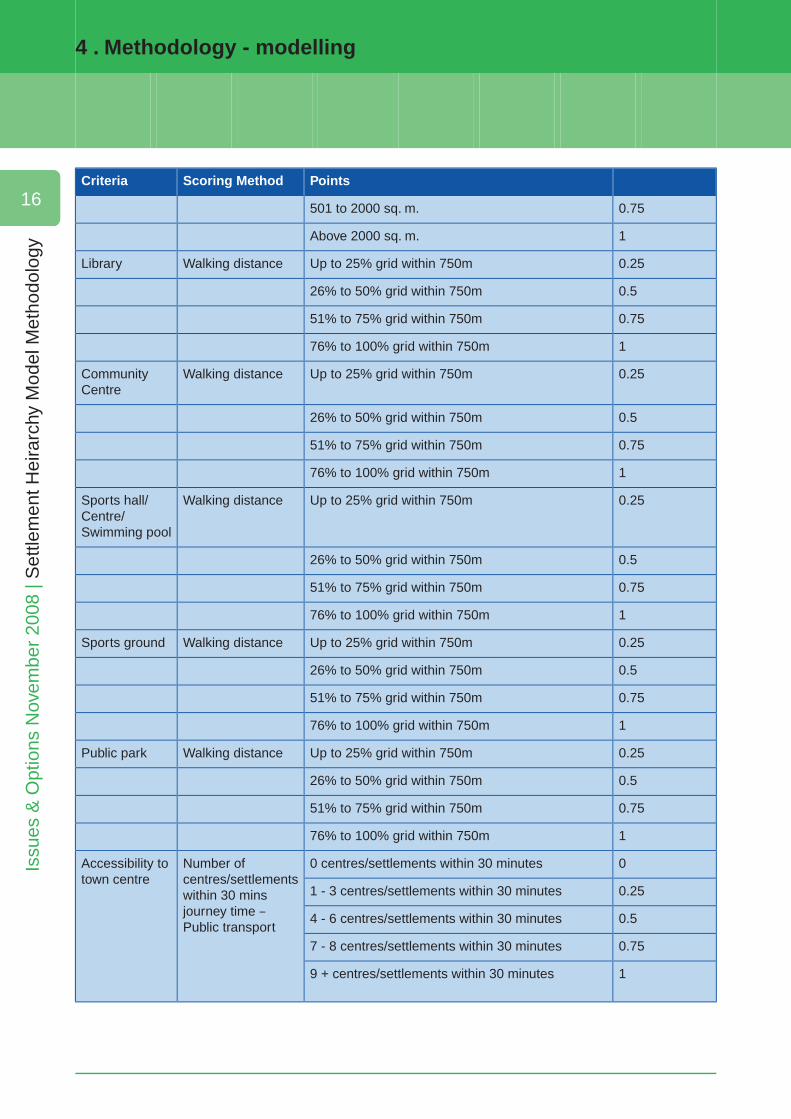
PointsScoring MethodCriteria
0.75501 to 2000 sq. m.
1Above 2000 sq. m.
0.25Up to 25% grid within 750mWalking distanceLibrary
0.526% to 50% grid within 750m
0.7551% to 75% grid within 750m
176% to 100% grid within 750m
0.25Up to 25% grid within 750mWalking distanceCommunityCentre
0.526% to 50% grid within 750m
0.7551% to 75% grid within 750m
176% to 100% grid within 750m
0.25Up to 25% grid within 750mWalking distanceSports hall/Centre/Swimming pool
0.526% to 50% grid within 750m
0.7551% to 75% grid within 750m
176% to 100% grid within 750m
0.25Up to 25% grid within 750mWalking distanceSports ground
0.526% to 50% grid within 750m
0.7551% to 75% grid within 750m
176% to 100% grid within 750m
0.25Up to 25% grid within 750mWalking distancePublic park
0.526% to 50% grid within 750m
0.7551% to 75% grid within 750m
176% to 100% grid within 750m
00 centres/settlements within 30 minutesNumber ofcentres/settlements
Accessibility totown centre
0.251 - 3 centres/settlements within 30 minuteswithin 30 minsjourney time –Public transport
0.54 - 6 centres/settlements within 30 minutes
0.757 - 8 centres/settlements within 30 minutes
19 + centres/settlements within 30 minutes
4 . Methodology - modelling
16
Issu
es &
Opt
ions
Nov
embe
r 20
08 |
Set
tlem
ent H
eira
rchy
Mod
el M
etho
dolo
gy
PointsScoring MethodCriteria
00 centres/settlements within 30 minutesNumber ofcentres/settlements
0.251 - 3 centres/settlements within 30 minuteswithin 30 minsjourney time –Private transport
0.54 - 6 centres/settlements within 30 minutes
0.757 - 8 centres/settlements within 30 minutes
19 + centres/settlements within 30 minutes
0.25Up to 25% grid within 750mA. Walking distanceto bus stop
Transport
0.526% to 50% grid within 750m
0.7551% to 75% grid within 750m
176% to 100% grid within 750m
00 sq.m.B. Public transport30mins drivecoverage 0.251 – 60 sq miles coverage
0.561 – 120 sq miles coverage
0.75121 – 180 sq miles coverage
1Above 180 sq miles coverage
0.25Up to 25% grid within 750mA. Train station
0.526% to 50% grid within 750m
0.7551% to 75% grid within 750m
176% to 100% grid within 750m
00 sq.m.B. Private transport30mins drivecoverage 0.251 – 80 sq miles coverage
0.581 – 160 sq miles coverage
0.75161 – 240 sq miles coverage
1Above 240 sq miles coverage
Stage Two: Weighting the assessment criteria
4.14 At stage one, equivalent levels of access to all services would receive the same score under the proposedscoring method. For example, the same score would be given to a grid if 75-100% of its area is within 750mof a primary school or a pub / restaurant.
4.15 As a result of the questionnaire responses, it should be recognised that access to some services ismore important than to others. In their report ‘Making the Connections’, the Social Exclusion Unit (SEU) identifies‘services with the greatest impact on life opportunities’ as jobs, health care, learning and food shops. The splitof the importance of these facilities and services is consistent with the results presented by the questionnaireresponses.
4 . Methodology - modelling
17
Issues & O
ptions Novem
ber 2008 | Settlem
ent Heirarchy M
odel Methodology
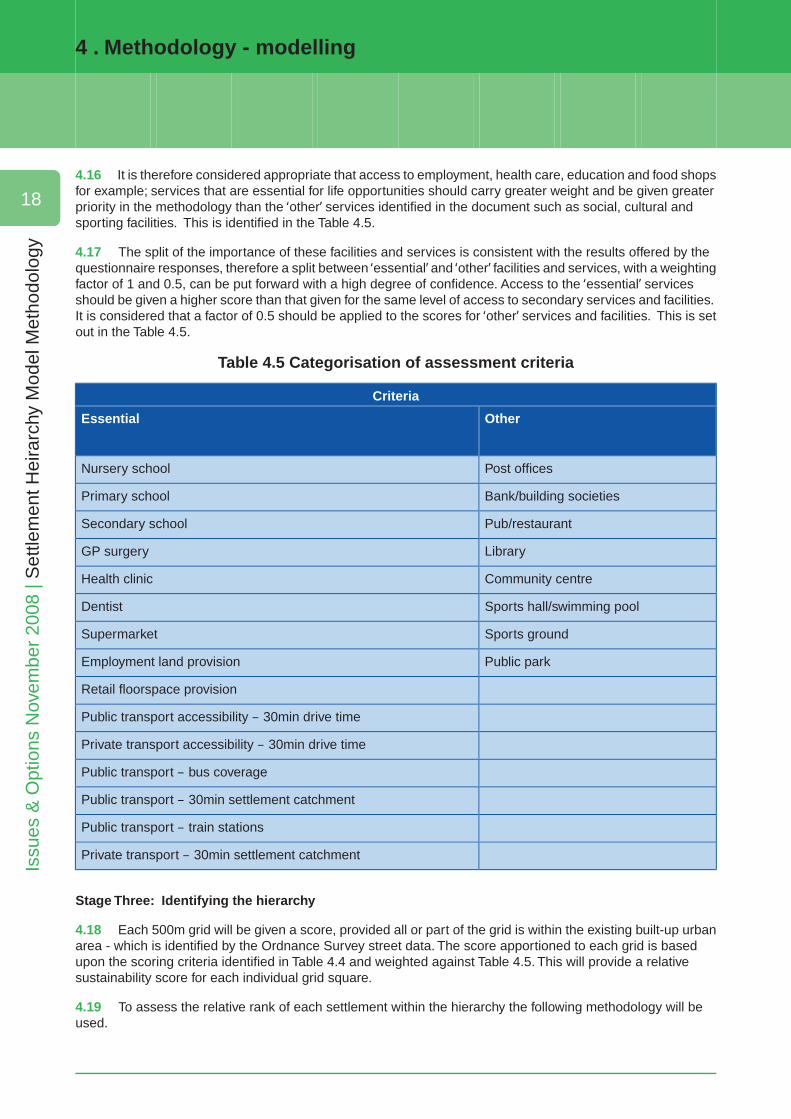
4.16 It is therefore considered appropriate that access to employment, health care, education and food shopsfor example; services that are essential for life opportunities should carry greater weight and be given greaterpriority in the methodology than the ‘other’ services identified in the document such as social, cultural andsporting facilities. This is identified in the Table 4.5.
4.17 The split of the importance of these facilities and services is consistent with the results offered by thequestionnaire responses, therefore a split between ‘essential’ and ‘other’ facilities and services, with a weightingfactor of 1 and 0.5, can be put forward with a high degree of confidence. Access to the ‘essential’ servicesshould be given a higher score than that given for the same level of access to secondary services and facilities.It is considered that a factor of 0.5 should be applied to the scores for ‘other’ services and facilities. This is setout in the Table 4.5.
Table 4.5 Categorisation of assessment criteria
Criteria
OtherEssential
Post officesNursery school
Bank/building societiesPrimary school
Pub/restaurantSecondary school
LibraryGP surgery
Community centreHealth clinic
Sports hall/swimming poolDentist
Sports groundSupermarket
Public parkEmployment land provision
Retail floorspace provision
Public transport accessibility – 30min drive time
Private transport accessibility – 30min drive time
Public transport – bus coverage
Public transport – 30min settlement catchment
Public transport – train stations
Private transport – 30min settlement catchment
Stage Three: Identifying the hierarchy
4.18 Each 500m grid will be given a score, provided all or part of the grid is within the existing built-up urbanarea - which is identified by the Ordnance Survey street data. The score apportioned to each grid is basedupon the scoring criteria identified in Table 4.4 and weighted against Table 4.5. This will provide a relativesustainability score for each individual grid square.
4.19 To assess the relative rank of each settlement within the hierarchy the following methodology will beused.
4 . Methodology - modelling
18
Issu
es &
Opt
ions
Nov
embe
r 20
08 |
Set
tlem
ent H
eira
rchy
Mod
el M
etho
dolo
gy
4.20 All grid squares that cover the settlement will be used except where the grid square covers less than50% of the identified settlement. Where the grid contains less than 50% of the settlement this will be either:
Discounted if the remainder of the square is not within the built-up area boundaryGiven to another adjoining settlement if this has more than 50% of its boundary within the grid square.
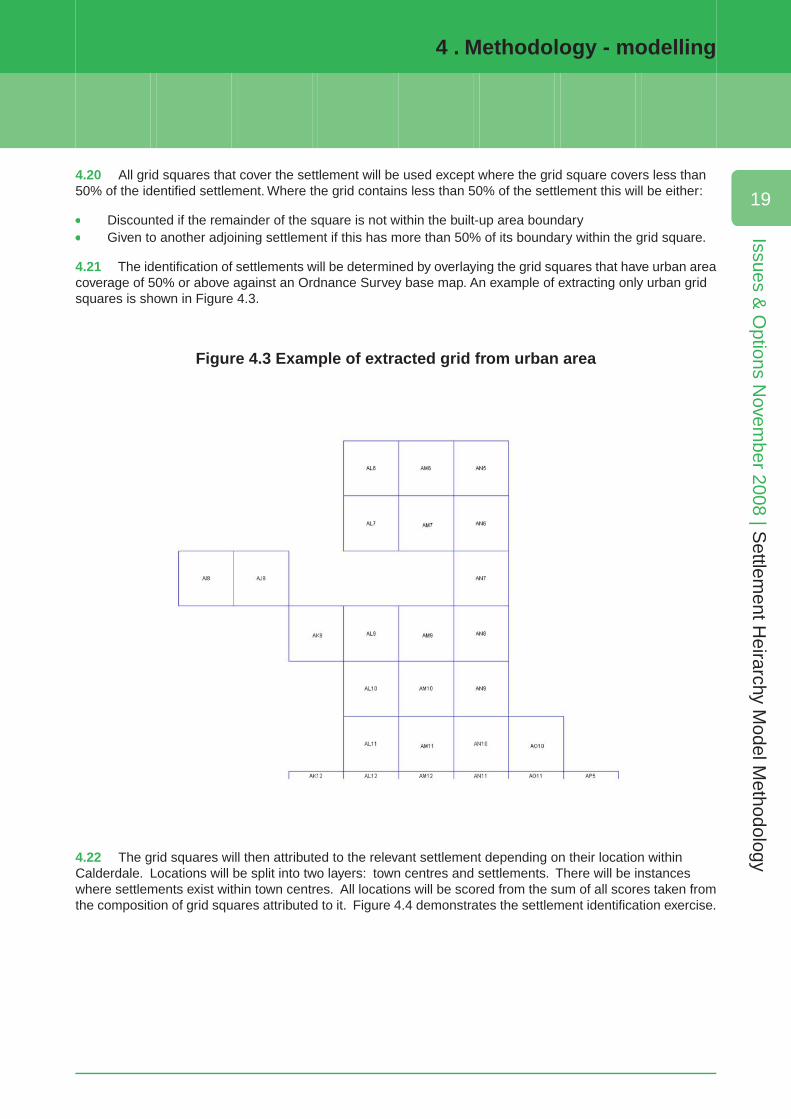
4.21 The identification of settlements will be determined by overlaying the grid squares that have urban areacoverage of 50% or above against an Ordnance Survey base map. An example of extracting only urban gridsquares is shown in Figure 4.3.
Figure 4.3 Example of extracted grid from urban area
4.22 The grid squares will then attributed to the relevant settlement depending on their location withinCalderdale. Locations will be split into two layers: town centres and settlements. There will be instanceswhere settlements exist within town centres. All locations will be scored from the sum of all scores taken fromthe composition of grid squares attributed to it. Figure 4.4 demonstrates the settlement identification exercise.
4 . Methodology - modelling
19
Issues & O
ptions Novem
ber 2008 | Settlem
ent Heirarchy M
odel Methodology
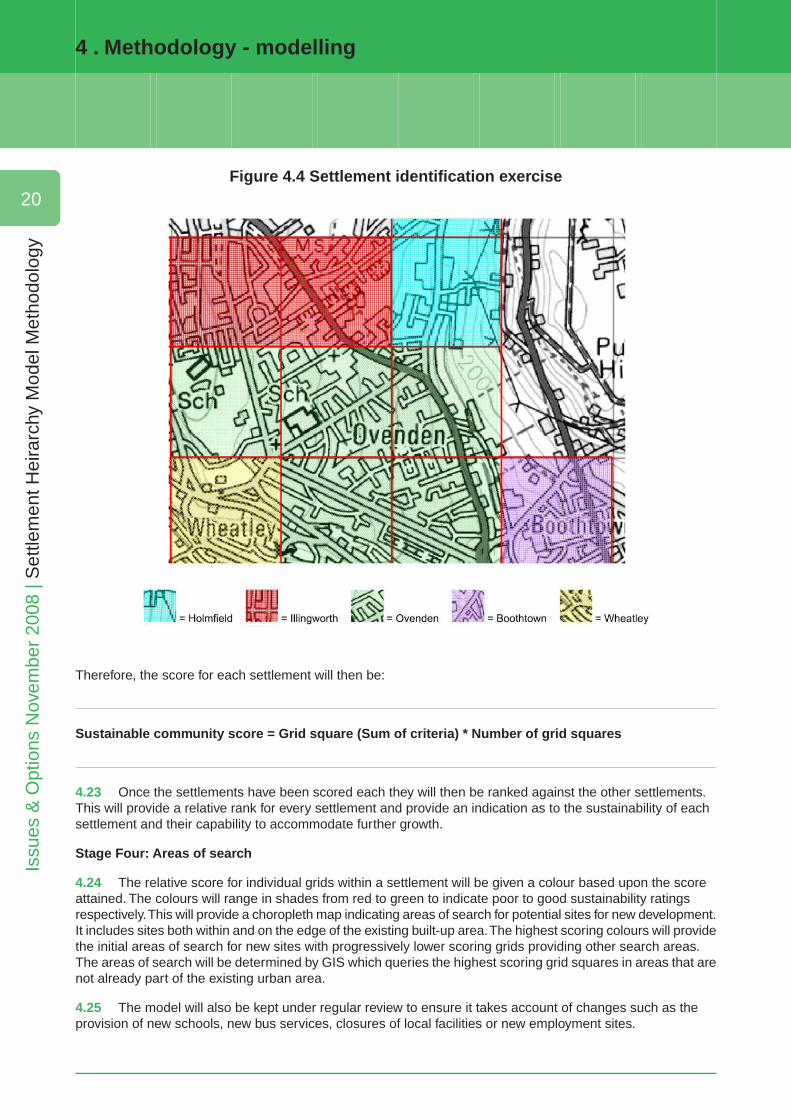
Figure 4.4 Settlement identification exercise
Therefore, the score for each settlement will then be:
Sustainable community score = Grid square (Sum of criteria) * Number of grid squares
4.23 Once the settlements have been scored each they will then be ranked against the other settlements.This will provide a relative rank for every settlement and provide an indication as to the sustainability of eachsettlement and their capability to accommodate further growth.
Stage Four: Areas of search
4.24 The relative score for individual grids within a settlement will be given a colour based upon the scoreattained. The colours will range in shades from red to green to indicate poor to good sustainability ratingsrespectively.This will provide a choropleth map indicating areas of search for potential sites for new development.It includes sites both within and on the edge of the existing built-up area.The highest scoring colours will providethe initial areas of search for new sites with progressively lower scoring grids providing other search areas.The areas of search will be determined by GIS which queries the highest scoring grid squares in areas that arenot already part of the existing urban area.
4.25 The model will also be kept under regular review to ensure it takes account of changes such as theprovision of new schools, new bus services, closures of local facilities or new employment sites.
4 . Methodology - modelling
20
Issu
es &
Opt
ions
Nov
embe
r 20
08 |
Set
tlem
ent H
eira
rchy
Mod
el M
etho
dolo
gy
5 Results
5.1 The results of the Settlement Hierarchy Model are set out in this section The totals for each of the 1586grid squares are the worked result of a number of different stages that are set out in Section Three. The differentstages of the model were created through the use of map-based data. The results are mapped and set out inthe sections. This chapter will describe the different stages and the significance of the results of each for thefinal model.
Stage One: Identifying the assessment criteria
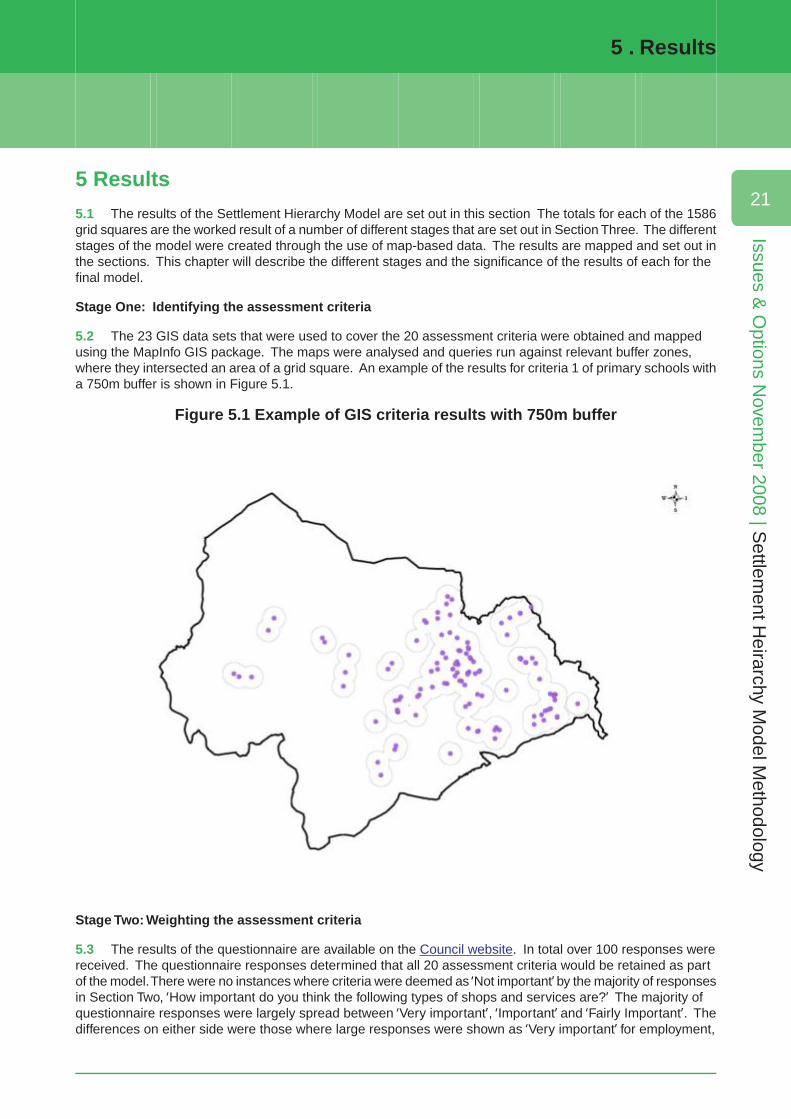
5.2 The 23 GIS data sets that were used to cover the 20 assessment criteria were obtained and mappedusing the MapInfo GIS package. The maps were analysed and queries run against relevant buffer zones,where they intersected an area of a grid square. An example of the results for criteria 1 of primary schools witha 750m buffer is shown in Figure 5.1.
Figure 5.1 Example of GIS criteria results with 750m buffer
Stage Two: Weighting the assessment criteria
5.3 The results of the questionnaire are available on the Council website. In total over 100 responses werereceived. The questionnaire responses determined that all 20 assessment criteria would be retained as partof the model.There were no instances where criteria were deemed as ‘Not important’ by the majority of responsesin Section Two, ‘How important do you think the following types of shops and services are?’ The majority ofquestionnaire responses were largely spread between ‘Very important’, ‘Important’ and ‘Fairly Important’. Thedifferences on either side were those where large responses were shown as ‘Very important’ for employment,
5 . Results
21
Issues & O
ptions Novem
ber 2008 | Settlem
ent Heirarchy M
odel Methodology
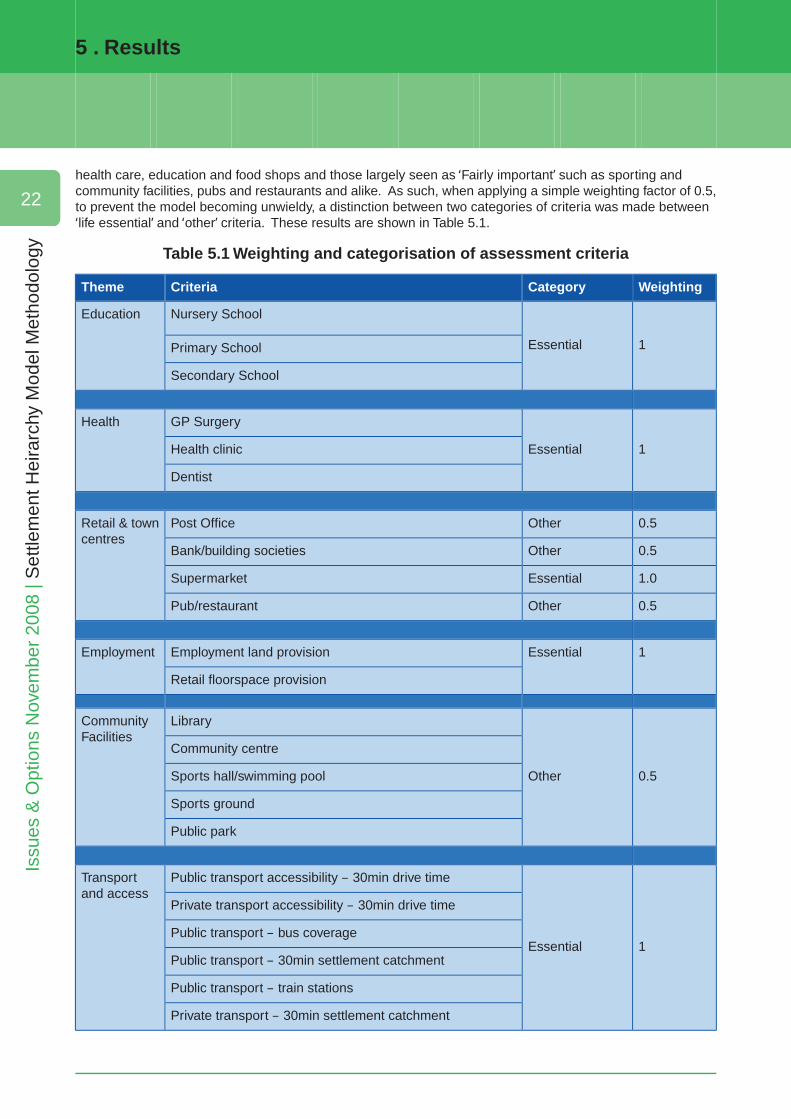
health care, education and food shops and those largely seen as ‘Fairly important’ such as sporting andcommunity facilities, pubs and restaurants and alike. As such, when applying a simple weighting factor of 0.5,to prevent the model becoming unwieldy, a distinction between two categories of criteria was made between‘life essential’ and ‘other’ criteria. These results are shown in Table 5.1.
Table 5.1 Weighting and categorisation of assessment criteria
WeightingCategoryCriteriaTheme
1Essential
Nursery SchoolEducation
Primary School
Secondary School
1Essential
GP SurgeryHealth
Health clinic
Dentist
0.5OtherPost OfficeRetail & towncentres
0.5OtherBank/building societies
1.0EssentialSupermarket
0.5OtherPub/restaurant
1EssentialEmployment land provisionEmployment
Retail floorspace provision
0.5Other
LibraryCommunityFacilities
Community centre
Sports hall/swimming pool
Sports ground
Public park
1Essential
Public transport accessibility – 30min drive timeTransportand access
Private transport accessibility – 30min drive time
Public transport – bus coverage
Public transport – 30min settlement catchment
Public transport – train stations
Private transport – 30min settlement catchment
5 . Results
22
Issu
es &
Opt
ions
Nov
embe
r 20
08 |
Set
tlem
ent H
eira
rchy
Mod
el M
etho
dolo
gy
Stage Three: Identifying the hierarchy
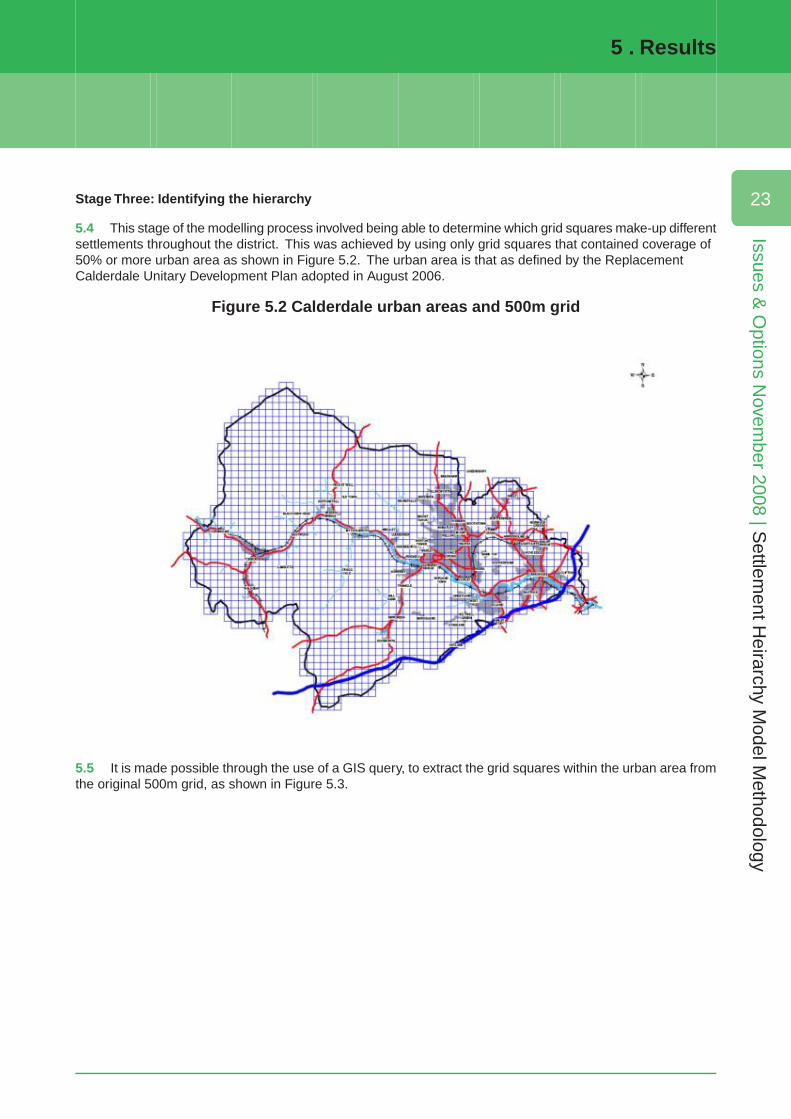
5.4 This stage of the modelling process involved being able to determine which grid squares make-up differentsettlements throughout the district. This was achieved by using only grid squares that contained coverage of50% or more urban area as shown in Figure 5.2. The urban area is that as defined by the ReplacementCalderdale Unitary Development Plan adopted in August 2006.
Figure 5.2 Calderdale urban areas and 500m grid
5.5 It is made possible through the use of a GIS query, to extract the grid squares within the urban area fromthe original 500m grid, as shown in Figure 5.3.
5 . Results
23
Issues & O
ptions Novem
ber 2008 | Settlem
ent Heirarchy M
odel Methodology
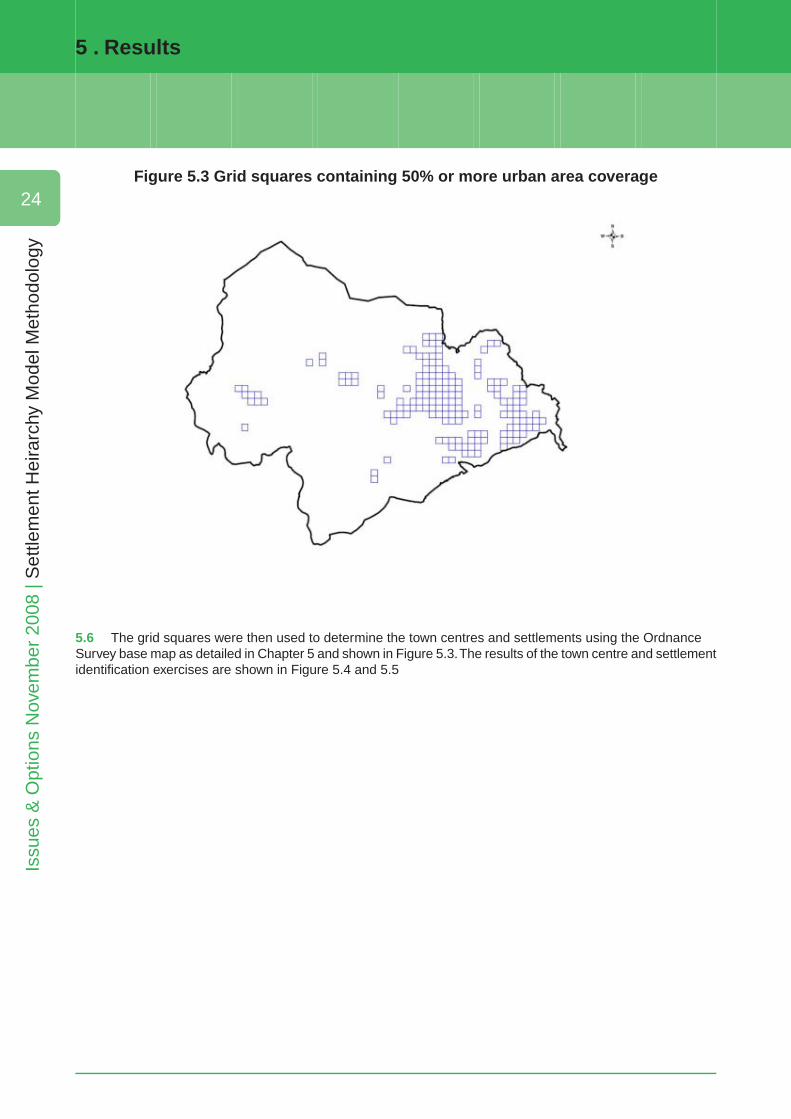
Figure 5.3 Grid squares containing 50% or more urban area coverage
5.6 The grid squares were then used to determine the town centres and settlements using the OrdnanceSurvey base map as detailed in Chapter 5 and shown in Figure 5.3.The results of the town centre and settlementidentification exercises are shown in Figure 5.4 and 5.5
5 . Results
24
Issu
es &
Opt
ions
Nov
embe
r 20
08 |
Set
tlem
ent H
eira
rchy
Mod
el M
etho
dolo
gy
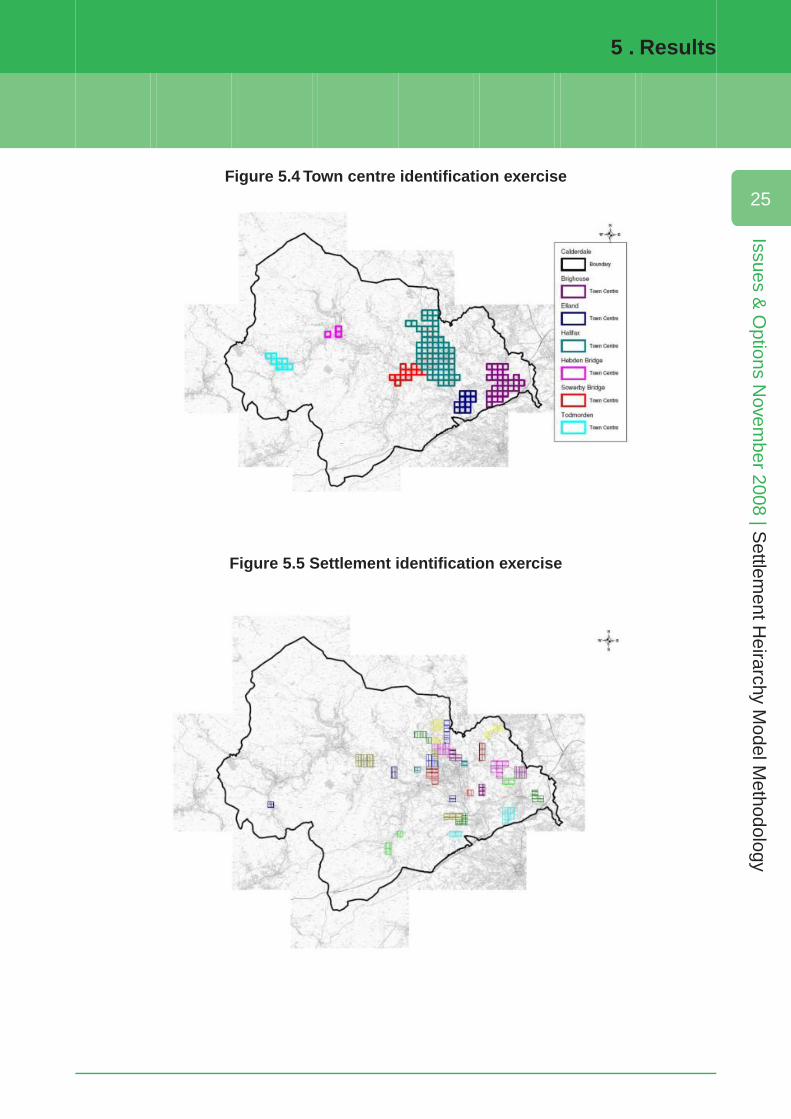
Figure 5.4 Town centre identification exercise
Figure 5.5 Settlement identification exercise
5 . Results
25
Issues & O
ptions Novem
ber 2008 | Settlem
ent Heirarchy M
odel Methodology
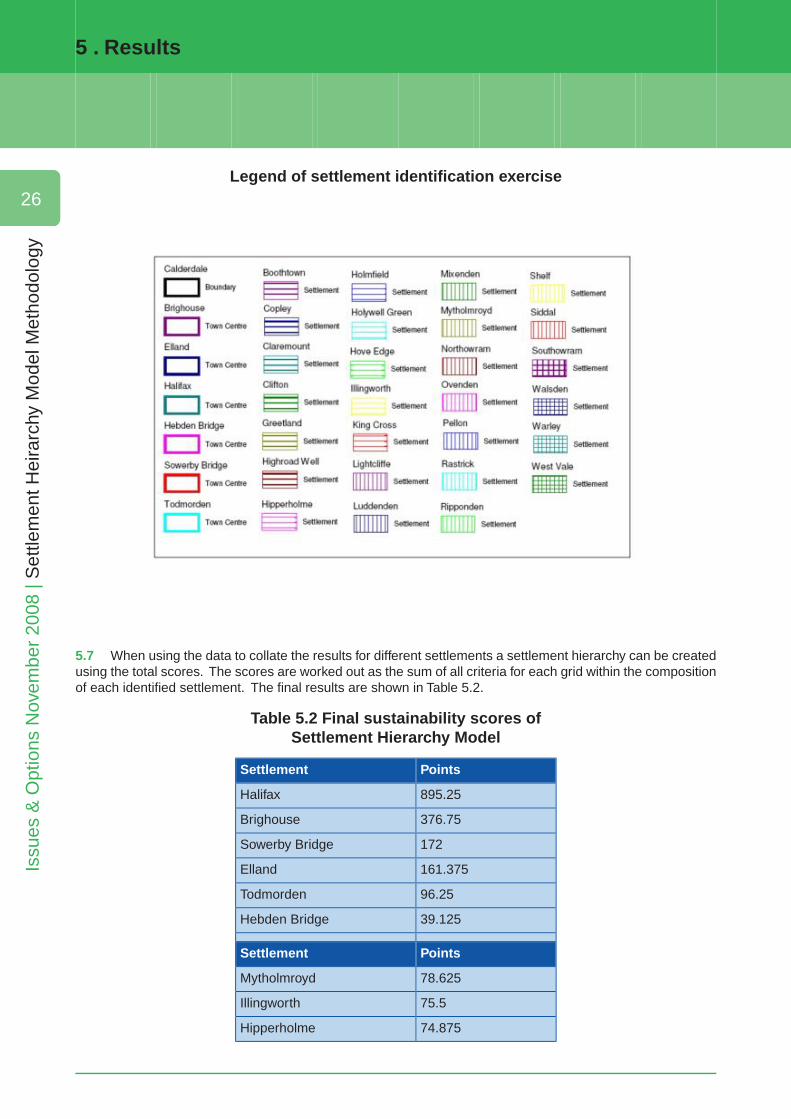
Legend of settlement identification exercise
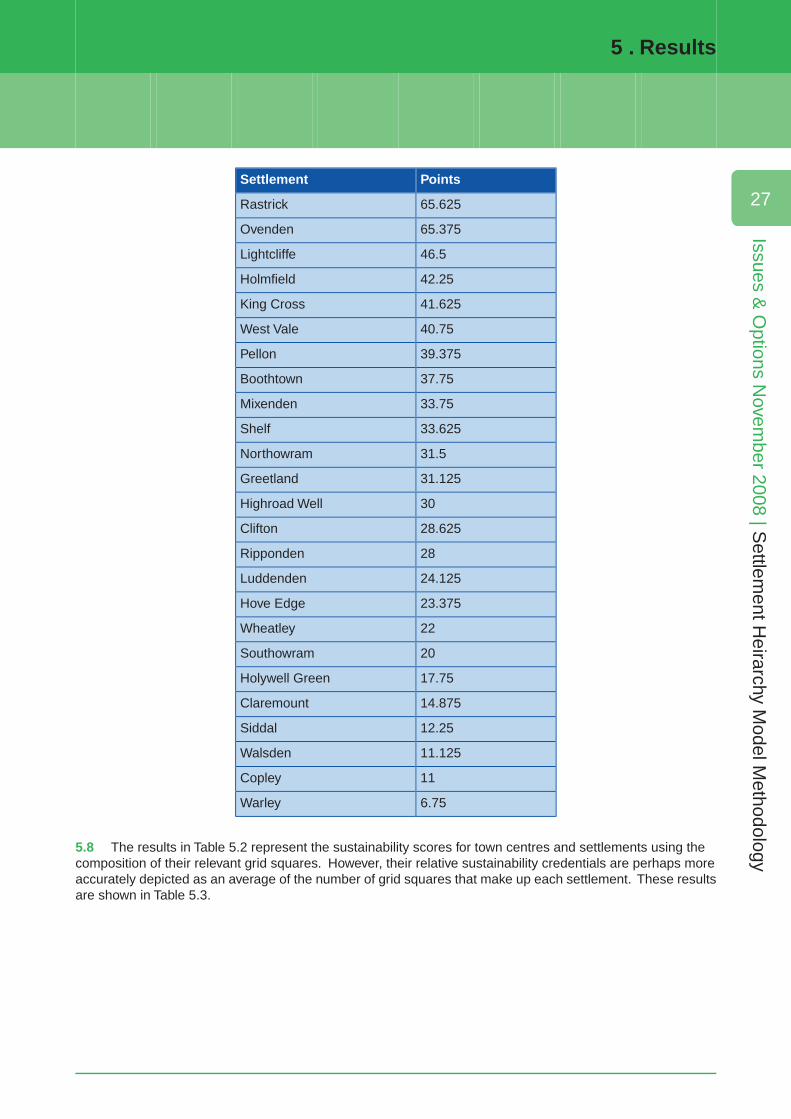
5.7 When using the data to collate the results for different settlements a settlement hierarchy can be createdusing the total scores. The scores are worked out as the sum of all criteria for each grid within the compositionof each identified settlement. The final results are shown in Table 5.2.
Table 5.2 Final sustainability scores ofSettlement Hierarchy Model
PointsSettlement
895.25Halifax
376.75Brighouse
172Sowerby Bridge
161.375Elland
96.25Todmorden
39.125Hebden Bridge
PointsSettlement
78.625Mytholmroyd
75.5Illingworth
74.875Hipperholme
5 . Results
26
Issu
es &
Opt
ions
Nov
embe
r 20
08 |
Set
tlem
ent H
eira
rchy
Mod
el M
etho
dolo
gy
PointsSettlement
65.625Rastrick
65.375Ovenden
46.5Lightcliffe
42.25Holmfield
41.625King Cross
40.75West Vale
39.375Pellon
37.75Boothtown
33.75Mixenden
33.625Shelf
31.5Northowram
31.125Greetland
30Highroad Well
28.625Clifton
28Ripponden
24.125Luddenden
23.375Hove Edge
22Wheatley
20Southowram
17.75Holywell Green
14.875Claremount
12.25Siddal
11.125Walsden
11Copley
6.75Warley
5.8 The results in Table 5.2 represent the sustainability scores for town centres and settlements using thecomposition of their relevant grid squares. However, their relative sustainability credentials are perhaps moreaccurately depicted as an average of the number of grid squares that make up each settlement. These resultsare shown in Table 5.3.
5 . Results
27
Issues & O
ptions Novem
ber 2008 | Settlem
ent Heirarchy M
odel Methodology
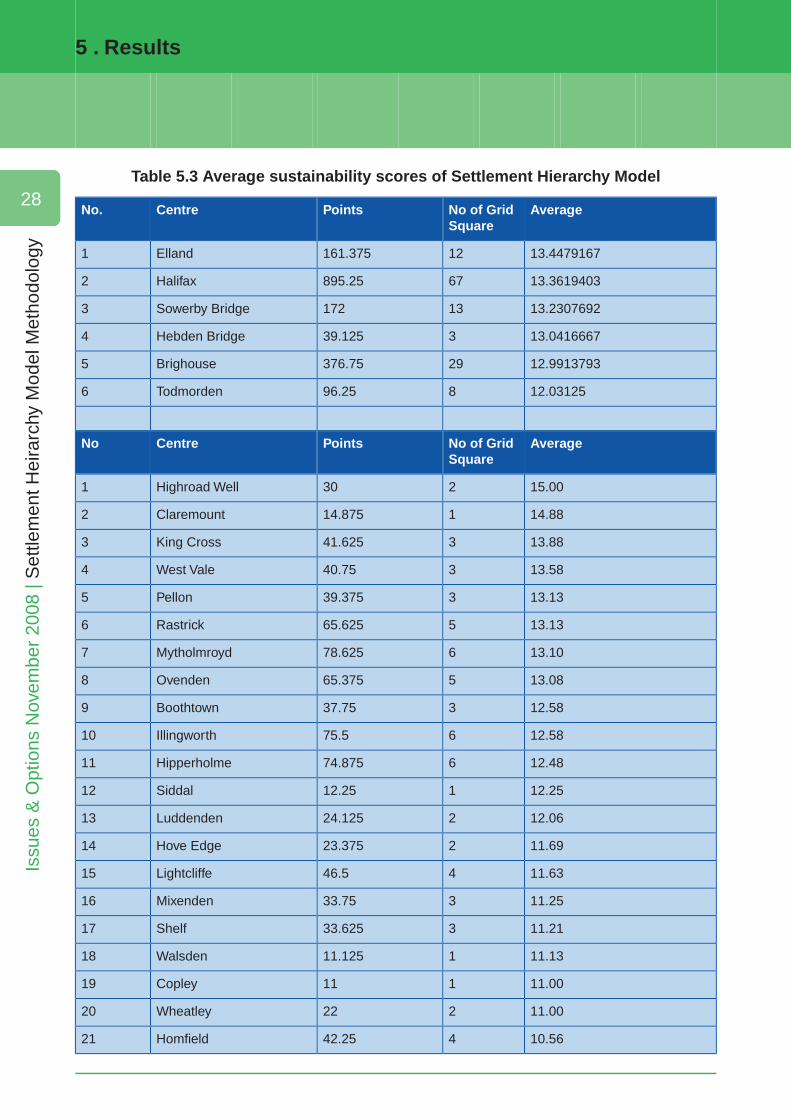
Table 5.3 Average sustainability scores of Settlement Hierarchy Model
AverageNo of GridSquare
PointsCentreNo.
13.447916712161.375Elland1
13.361940367895.25Halifax2
13.230769213172Sowerby Bridge3
13.0416667339.125Hebden Bridge4
12.991379329376.75Brighouse5
12.03125896.25Todmorden6
AverageNo of GridSquare
PointsCentreNo
15.00230Highroad Well1
14.88114.875Claremount2
13.88341.625King Cross3
13.58340.75West Vale4
13.13339.375Pellon5
13.13565.625Rastrick6
13.10678.625Mytholmroyd7
13.08565.375Ovenden8
12.58337.75Boothtown9
12.58675.5Illingworth10
12.48674.875Hipperholme11
12.25112.25Siddal12
12.06224.125Luddenden13
11.69223.375Hove Edge14
11.63446.5Lightcliffe15
11.25333.75Mixenden16
11.21333.625Shelf17
11.13111.125Walsden18
11.00111Copley19
11.00222Wheatley20
10.56442.25Homfield21
5 . Results
28
Issu
es &
Opt
ions
Nov
embe
r 20
08 |
Set
tlem
ent H
eira
rchy
Mod
el M
etho
dolo
gy
AverageNo of GridSquare
PointsCentreNo.
10.50331.5Northowram22
10.38331.125Greetland23
10.00220Southowram24
9.54327.625Clifton25
9.33328Ripponden26
8.88217.75Holywell Green27
6.7516.75Warley28
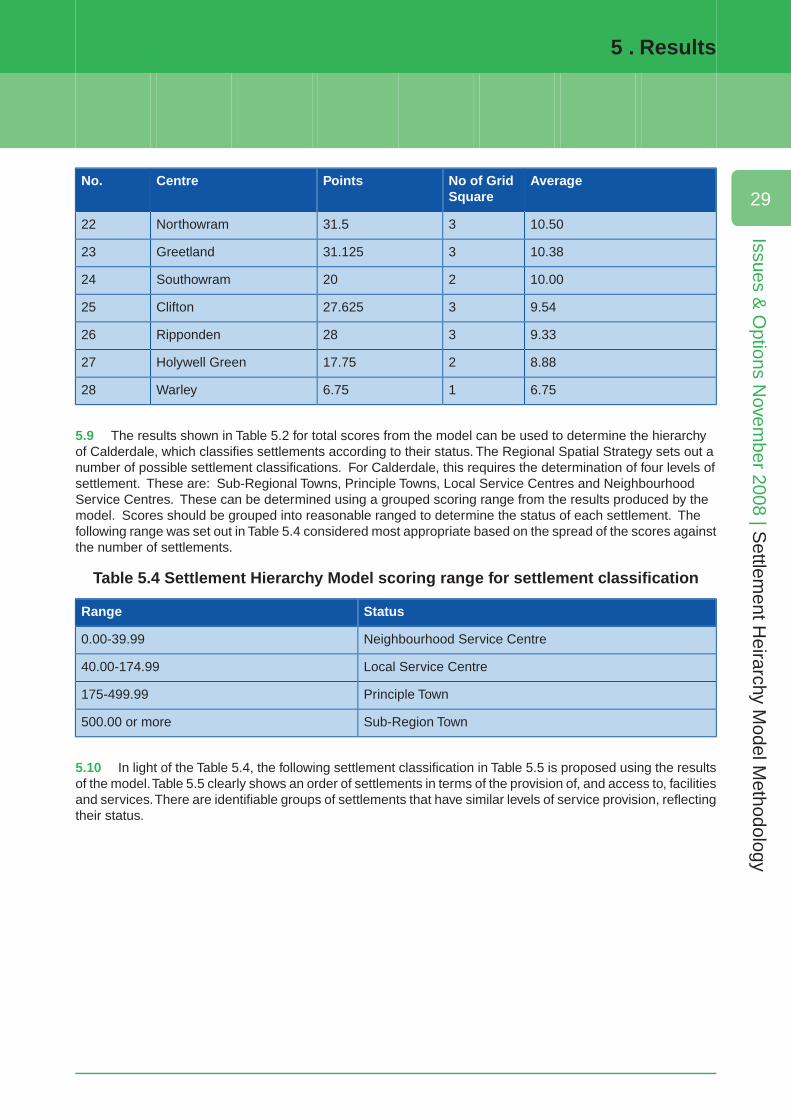
5.9 The results shown in Table 5.2 for total scores from the model can be used to determine the hierarchyof Calderdale, which classifies settlements according to their status. The Regional Spatial Strategy sets out anumber of possible settlement classifications. For Calderdale, this requires the determination of four levels ofsettlement. These are: Sub-Regional Towns, Principle Towns, Local Service Centres and NeighbourhoodService Centres. These can be determined using a grouped scoring range from the results produced by themodel. Scores should be grouped into reasonable ranged to determine the status of each settlement. Thefollowing range was set out in Table 5.4 considered most appropriate based on the spread of the scores againstthe number of settlements.
Table 5.4 Settlement Hierarchy Model scoring range for settlement classification
StatusRange
Neighbourhood Service Centre0.00-39.99
Local Service Centre40.00-174.99
Principle Town175-499.99
Sub-Region Town500.00 or more
5.10 In light of the Table 5.4, the following settlement classification in Table 5.5 is proposed using the resultsof the model.Table 5.5 clearly shows an order of settlements in terms of the provision of, and access to, facilitiesand services.There are identifiable groups of settlements that have similar levels of service provision, reflectingtheir status.
5 . Results
29
Issues & O
ptions Novem
ber 2008 | Settlem
ent Heirarchy M
odel Methodology
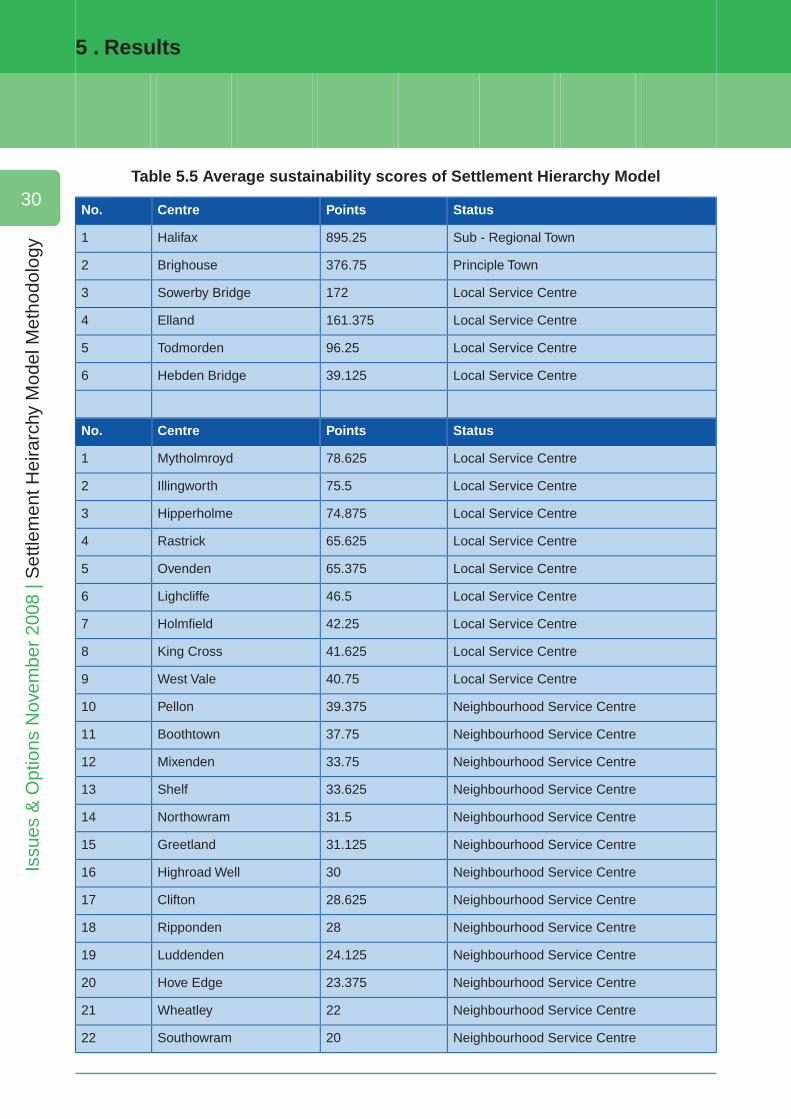
Table 5.5 Average sustainability scores of Settlement Hierarchy Model
StatusPointsCentreNo.
Sub - Regional Town895.25Halifax1
Principle Town376.75Brighouse2
Local Service Centre172Sowerby Bridge3
Local Service Centre161.375Elland4
Local Service Centre96.25Todmorden5
Local Service Centre39.125Hebden Bridge6
StatusPointsCentreNo.
Local Service Centre78.625Mytholmroyd1
Local Service Centre75.5Illingworth2
Local Service Centre74.875Hipperholme3
Local Service Centre65.625Rastrick4
Local Service Centre65.375Ovenden5
Local Service Centre46.5Lighcliffe6
Local Service Centre42.25Holmfield7
Local Service Centre41.625King Cross8
Local Service Centre40.75West Vale9
Neighbourhood Service Centre39.375Pellon10
Neighbourhood Service Centre37.75Boothtown11
Neighbourhood Service Centre33.75Mixenden12
Neighbourhood Service Centre33.625Shelf13
Neighbourhood Service Centre31.5Northowram14
Neighbourhood Service Centre31.125Greetland15
Neighbourhood Service Centre30Highroad Well16
Neighbourhood Service Centre28.625Clifton17
Neighbourhood Service Centre28Ripponden18
Neighbourhood Service Centre24.125Luddenden19
Neighbourhood Service Centre23.375Hove Edge20
Neighbourhood Service Centre22Wheatley21
Neighbourhood Service Centre20Southowram22
5 . Results
30
Issu
es &
Opt
ions
Nov
embe
r 20
08 |
Set
tlem
ent H
eira
rchy
Mod
el M
etho
dolo
gy
StatusPointsCentreNo.
Neighbourhood Service Centre17.75Holywell Green23
Neighbourhood Service Centre14.875Claremount24
Neighbourhood Service Centre12.25Siddal25
Neighbourhood Service Centre11.125Walsden26
Neighbourhood Service Centre11Copley27
Neighbourhood Service Centre6.75Warley28
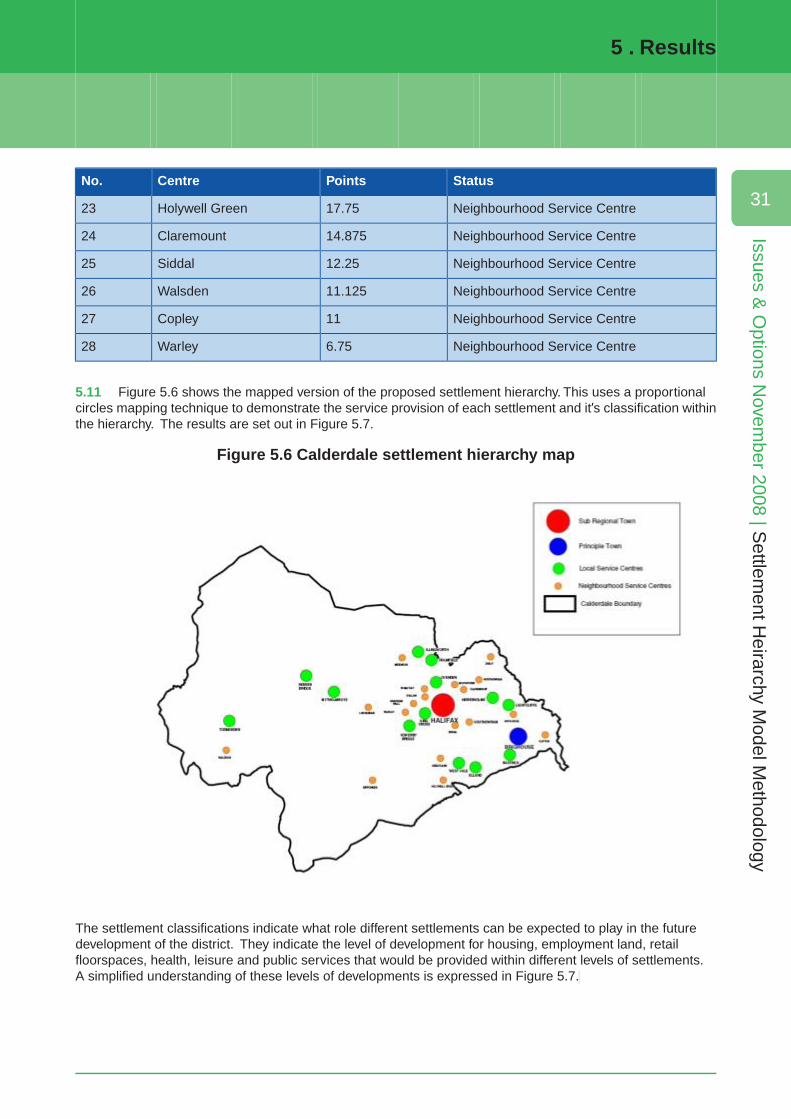
5.11 Figure 5.6 shows the mapped version of the proposed settlement hierarchy. This uses a proportionalcircles mapping technique to demonstrate the service provision of each settlement and it’s classification withinthe hierarchy. The results are set out in Figure 5.7.
Figure 5.6 Calderdale settlement hierarchy map
The settlement classifications indicate what role different settlements can be expected to play in the futuredevelopment of the district. They indicate the level of development for housing, employment land, retailfloorspaces, health, leisure and public services that would be provided within different levels of settlements.A simplified understanding of these levels of developments is expressed in Figure 5.7.
5 . Results
31
Issues & O
ptions Novem
ber 2008 | Settlem
ent Heirarchy M
odel Methodology
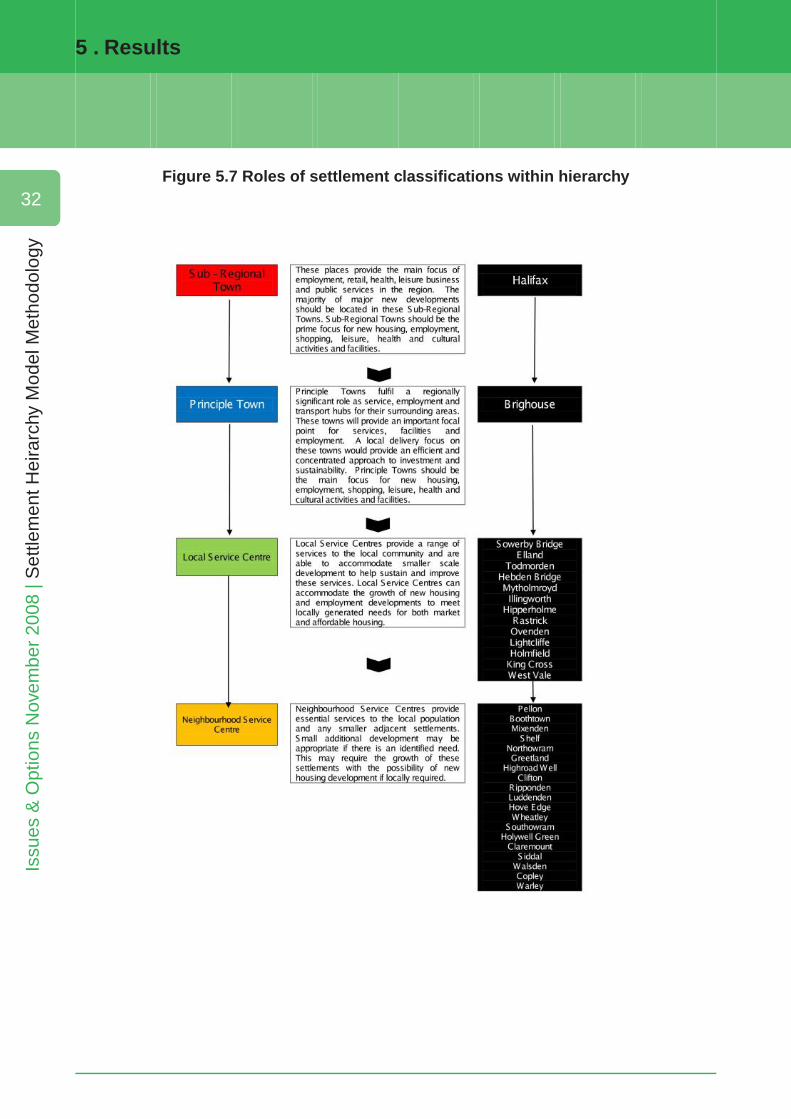
Figure 5.7 Roles of settlement classifications within hierarchy
5 . Results
32
Issu
es &
Opt
ions
Nov
embe
r 20
08 |
Set
tlem
ent H
eira
rchy
Mod
el M
etho
dolo
gy
Stage Four: Areas of search
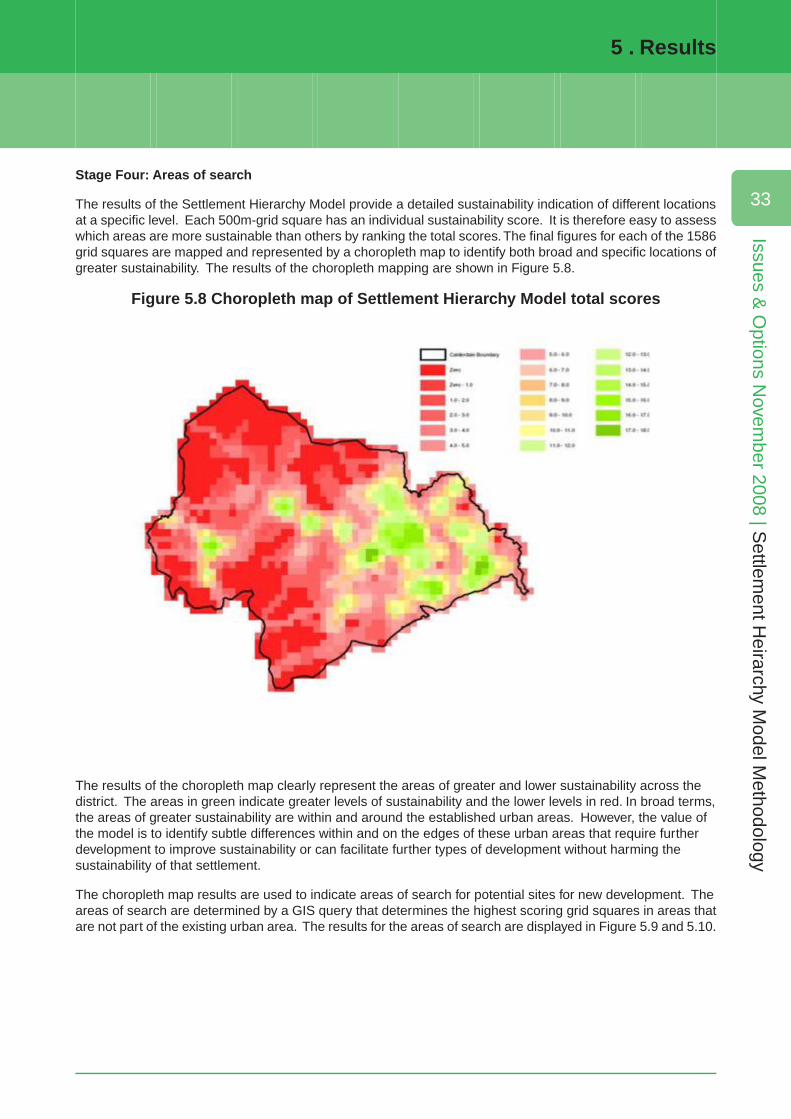
The results of the Settlement Hierarchy Model provide a detailed sustainability indication of different locationsat a specific level. Each 500m-grid square has an individual sustainability score. It is therefore easy to assesswhich areas are more sustainable than others by ranking the total scores.The final figures for each of the 1586grid squares are mapped and represented by a choropleth map to identify both broad and specific locations ofgreater sustainability. The results of the choropleth mapping are shown in Figure 5.8.
Figure 5.8 Choropleth map of Settlement Hierarchy Model total scores
The results of the choropleth map clearly represent the areas of greater and lower sustainability across thedistrict. The areas in green indicate greater levels of sustainability and the lower levels in red. In broad terms,the areas of greater sustainability are within and around the established urban areas. However, the value ofthe model is to identify subtle differences within and on the edges of these urban areas that require furtherdevelopment to improve sustainability or can facilitate further types of development without harming thesustainability of that settlement.
The choropleth map results are used to indicate areas of search for potential sites for new development. Theareas of search are determined by a GIS query that determines the highest scoring grid squares in areas thatare not part of the existing urban area. The results for the areas of search are displayed in Figure 5.9 and 5.10.
5 . Results
33
Issues & O
ptions Novem
ber 2008 | Settlem
ent Heirarchy M
odel Methodology
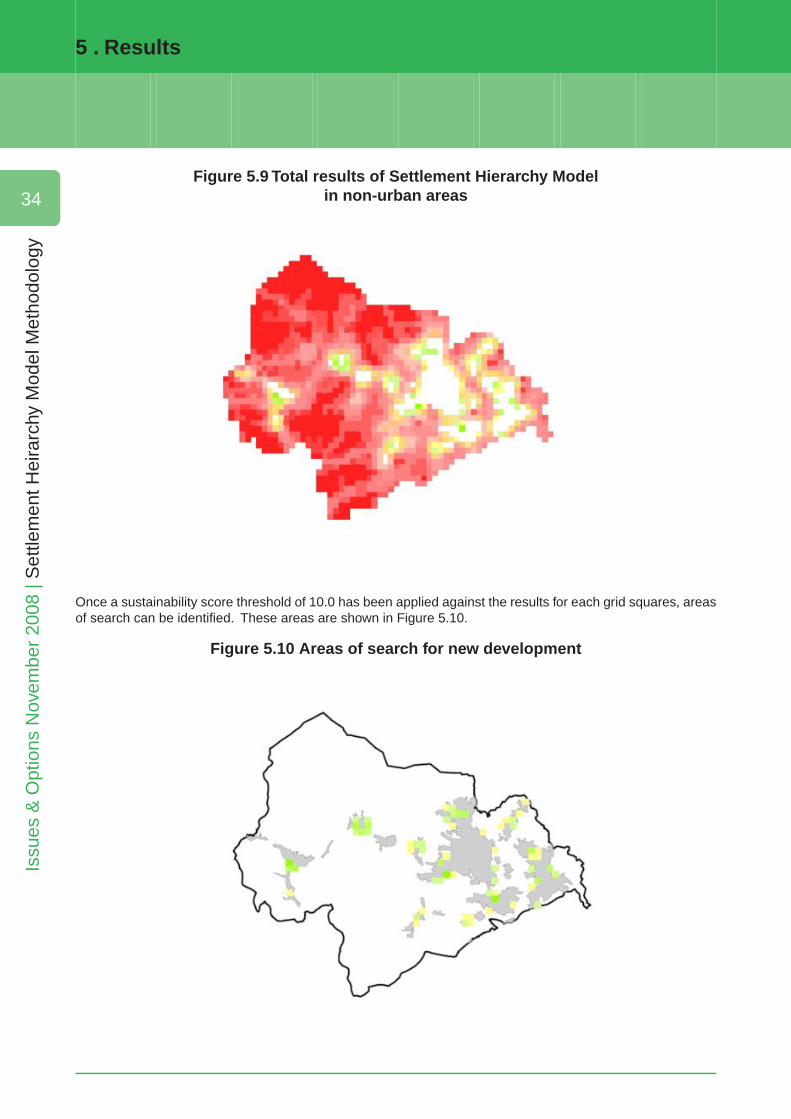
Figure 5.9 Total results of Settlement Hierarchy Modelin non-urban areas
Once a sustainability score threshold of 10.0 has been applied against the results for each grid squares, areasof search can be identified. These areas are shown in Figure 5.10.
Figure 5.10 Areas of search for new development
5 . Results
34
Issu
es &
Opt
ions
Nov
embe
r 20
08 |
Set
tlem
ent H
eira
rchy
Mod
el M
etho
dolo
gy
6 Recommendations
6.1 The sustainability of a settlement is in part determined by considering the level of and access to services.An important aspect of sustainability is ensuring that services remain viable and are able to be retained.
6.2 The sustainability of a settlement together with the availability of suitable sites, will impact on the abilityof a settlement to accommodate additional growth. It should be stressed that just because a settlement isconsidered sustainable it does not mean it will be expected to accommodate a particular level of growth,especially where there are no sites available to develop. However, one of the key objectives of the study is tohighlight the existing sustainability levels for each settlement and to consider which of these settlements havethe potential to accommodate future growth. The audit of services and analysis of data shows that there arediffering levels of sustainability.
6.3 There is a high level of service provision and access to services in Halifax and Brighouse. These areclassified as the Sub-Regional Town and Principal Town of the district. The results produced by the model areconsistent with the expectation of the Regional Spatial Strategy for the future of these places and go some wayto justify these visions. These settlements can be considered to be sustainable as they have sufficient serviceprovision for their populations, helping to reduce the need to travel.Where facilities or services are not available,access to them via public transport is good. These settlements are best placed to accommodate newdevelopment and further growth in the form of new housing or employment, which could allow for the expansionof existing services.
6.4 Local Service Centres have lower levels of service provision but access to services is still good. Thesesettlements can still be considered to be sustainable as the transport network is sufficient to allow their residentsrelatively good access to the services and facilities that they need. New service provision within these settlementscould be considered in order to reduce the need to travel. Only then could these settlements be considered aspossible locations for new development.
6.5 Some settlements, particularly those classified as Neighbourhood Service Centres, have both poorprovision and poor access to services and facilities. This reduces the sustainability of these settlements asresidents are more reliant on the private car and have to travel outside of the immediate area to access themajority of the services they require. New service development in these locations is unlikely to be realistic dueto their low population sizes, which would not support new facilities. These settlements are also highly unlikelyto be suitable to accommodate other types of growth, such as new housing.
6.6 Consideration will need to be given as to whether improvements are practical in some locations in orderto increase their level of sustainability. New or additional service provision may not always be viable in areaswhere the potential use is low due to a small population size or where there are no sites available toaccommodate the development.
6.7 The model identifies ‘areas of search’ grid squares where undeveloped land has a sustainability scoreof 10 or greater. These are the most appropriate sites for new development as they already host a sustainablelevel of infrastructure provision. The recommendations from this stage of the model would contribute directlyto forward planning documents such as Strategic Housing Land Availability Assessment and development plandocuments (DPDs) such as Core Strategy DPD and Land Allocations and Designations DPD.
6 . Recommendations
35
Issues & O
ptions Novem
ber 2008 | Settlem
ent Heirarchy M
odel Methodology
Ap
pen
dix
1 S
ettl
emen
t id
enti
fica
tio
n m
ap
Map
1.1
To
wn
Cen
tre
and
Set
tlem
ent
Iden
tifi
cati
on
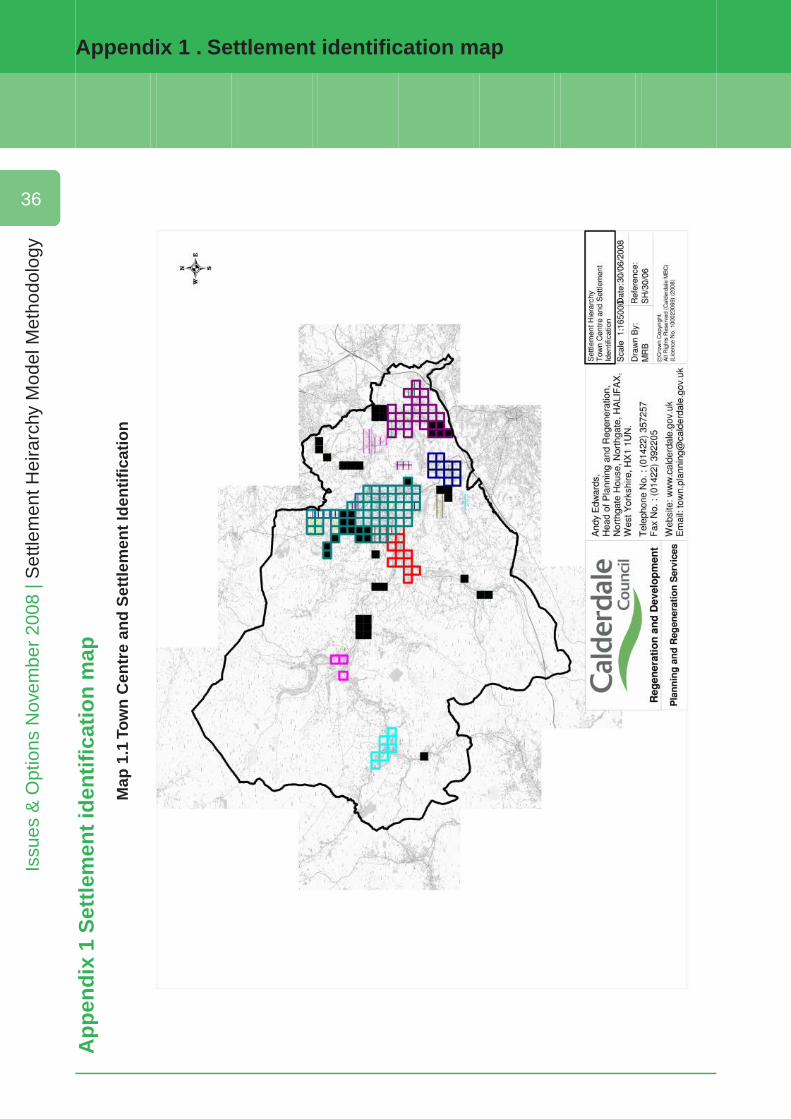
Appendix 1 . Settlement identification map
36
Issu
es &
Opt
ions
Nov
embe
r 20
08 |
Set
tlem
ent H
eira
rchy
Mod
el M
etho
dolo
gy