setup alert limit ro.pdf
TRANSCRIPT

Quality Attributes Specification Limits
Journal of Validation Technology44
Establishing Alert Limits for Microbial Counts in
Purified Water
INTRODUCTION
Purified Water (PW) is widely used in pharmaceuticaland other healthcare industries. Due to its property as an ex-cellent microbial growth medium, the microbial level hasbecome the most critical quality attribute in Purified Waterand is the most common problem encountered in PurifiedWater systems. To control such a highly sensitive growthmedium, understanding of the Purified Water system re-garding microbiological contamination, proliferation, andsurvival (e.g., biofilm) as well as appropriate control knowl-edge, is essentially required.
Although related guidelines including those of both theWorld Health Organization (WHO) and the U.S. Pharma-copoeia (USP) addressing microbial limits for PurifiedWater are available, establishing in-house limits is practi-cally required to effectively control microbial contamination.This article is provided to introduce a scientific method forestablishing microbial alert limits for Purified Water usingstatistical methods based on validation or historical data.
v
B Y P R A M O T E C H O L A Y U D T H
SPECIFICATIONS
The USP indicates the following specifications for Purified Water:
pH 5.0 - 7.0Conductivity ≤1.3 µS/cm (25˚C) (USP 24 Specification)Total Organic Carbon (TOC) ≤ 500 ppbMicrobial Count ≤ 100 CFU/mL
Microbial limits at various stages in water purification system suggested by WHO1:
Source (Raw) Water 200 300 500Post Carbon Filter 50 300 500Feed to RO Unit 20 200 500Feed to Polishing Unit * 10 50 100Purified Water 1 10 100* May be EDI (Electrodeionization) Unit or Mixed Bed Column
Suggested Maximum Limits (CFU/mL)Target Alert Action
Sampling Points
VOTE this article for “Best JVT Article 2007”

Pramote Cholayudth
November 2006 • Volume 13, Number 1 45
UNDERSTANDING OF BINOMIALDISTRIBUTION
Microbial data are countable (i.e., attribute or discrete)and not measurable (variable) data. Variable data may fol-low a Normal Distribution while the attribute data will fol-low a Binomial Distribution. Therefore, microbial countdata will ideally follow the Binomial Distribution.
If we repeatedly take samples of the same size n = 90from a population containing only conforming (say 95% ofthe population) and non-conforming (5%) items, the num-bers of non-conformity (success) will distribute accordingto the probability density function (pdf) governing the Bino-mial Distribution (Figure 1). This probability density func-tion is expressed below as:
In other words, Binomial Distribution is the samplingdistribution of the non-conforming units (non-conformity)in samples taken from a population with known non-con-forming rate (p). When sampling Purified Water from thesystem, distribution of the microbial counts will occur in thesame manner.
CRITERIA FOR ESTABLISHING MICROBIAL ALERT LIMITS
From Figure 1 when the Control Chart limits µ ± 3σ (approximately 99.73% of the normal curve area) are ap-plied, the control limits for np Chart, one of the most com-mon Attribute Control Charts, will be
Since the areas across (0, 10) and (0, 11) are 99.47 and99.82% respectively, so the area across the control limit (0,10.7) is approximately 99.5% of the binomial curve. Tocompute the area across (0, 10), for example, is to proceedas follows:
Using MS™ Excel® formula, P = BINOMDIST(10,90,0.05,TRUE) = 0.9947
Where:10 = Number of success90 = Sample size0.05 = Proportion of non-conformingTRUE = Cumulative distribution
UCL = = 10.7CL = np = 4.5
LCL = = -1.7 = 0
Where:UCL = Upper Control LimitCL = Center LineLCL = Lower Control Limit
npq3np +
npq3np −
Where:P = Probabilityn = Sample size (n! = n factorial)c = Number of success (c! = c factorial)p = Non-conforming rateq = 1-p
The relevant statistics for the curve are the following:
Mean = np = 90x0.05 = 4.50
SD = = = 2.07
Where:Mean = Mean of the distribution curveSD = Standard deviation of the curven = Sample sizep = Non-conforming rateq = 1-p
cnccnc qp)!cn(!c
!nqp
c
nP −−
−=⎟⎟
⎠
⎞⎜⎜⎝
⎛=
npq 95.0x05.0x90
Figure 1
Binomial Distribution:

Pramote Cholayudth
Journal of Validation Technology46
The alert limits for the microbial count in Purified Waterwill be also based on such limits (µ ± 3σ). However, the morepractical limits of µ ± 4σ or even less stringent (e.g., µ ± 5σ)are preferably applied to compensate the possible water sam-pling and testing technique errors as shown below
The value of n = 100 is based on the action limit (100 CFU/mL), which is the maximum number of colonyforming unit (CFU) allowed per mL.
PROCEDURE FOR ESTABLISHING MICROBIAL ALERT LIMITS
All the data to be used must meet the action limit of 100CFU/mL - i.e.: collected during the state-of-under-control pe-riod (validation or monitoring) of the PW system. The moreimportant consideration is that these microbial test results areof the same sample size - e.g.: 1 or 100 mL. One should notmix up the data if two or more different sample sizes aretaken. Therefore, the alert limits derived from the data for dif-ferent sample volumes may be different. Procedure for prepa-ration of data is described in the following steps:
• All individual results (from all points of use over anextended period) are averaged and then divided by100 to be a proportion value ( p )
• Find q which is equal to ( 1 - p) • Find n which is equal to 100• Proceed to next step for calculating the Mean and
SD and subsequently the alert limits using equation(1) and (2) above.
EXAMPLE CASES FOR ESTABLISHINGMICROBIAL ALERT LIMITS
In a pharmaceutical plant where the author providesconsulting service, the validation data Operational Qualifi-cation (OQ) for the Purified Water System is as follows:
UAL = µ ± 4σ = ……………… (1)
LAL = µ - 4σ = ……………… (2)
Where:UAL = Upper Alert LimitLAL = Lower Alert Limitµ = Mean of distributionσ = Standard distribution (SD) of distributionn = 100 (CFU/mL) = maximum count allowedp = Averaged proportion = averaged count per maximum count allowedq =
qpn4pn +
qpn4pn -
)p1( −

Pramote Cholayudth
November 2006 • Volume 13, Number 1 47
Day #
POU # 1
POU # 2
POU # 3
POU # 4
Return
POU # 4
(+Hose)
After RO
After EDI
1 <1 <1 <1 <1 <1 4 1 2
2 <1 <1 <1 <1 <1 <1 1 4
3 <1 <1 <1 <1 2 2 2 6
4 <1 <1 <1 <1 1 <1 3 5
5 4 <1 4 4 1 8 4 4
6 <1 <1 <1 2 3 18 <1 9
7 <1 <1 3 5 7 15 2 7
8 1 <1 2 8 6 6 1 4
9 <1 <1 4 1 6 15 23 10
10 <1 <1 <1 <1 8 5 1 2
2.06 7.50 3.90 5.30
Microbial Count Results (CFU/mL)Recirculation Loop
POU: Point of Use, RO: Reverse Osmosis, EDI: ElectrodeionizationNote: Zero result is denoted as <1 and transformed to 1 when computed for mean value.
Mean
Figure 3
Purified Water System Diagram
Pretreated Water
Vent Filter
Pump
UV
RO Unit EDI
Storage Tank
Return Loop
Purified Water System
(Point of Use #)4 3 2 1
Figure 2
Microbial Count Data

Pramote Cholayudth
Journal of Validation Technology48
Calculation for the upper and lower alert limits (UAL and LAL) is simply carried out as follows:
From a microbiological point of view, recording the zero result (0) is denoted as <1 in the Test Report. However, in com-putation of the mean value, it is more practical to use 1 (as in this article) or 0.5 instead of zero.
Count mean ( pn ) = 2.06
p = 2.06/100 = 0.0206
q = 1-0.0206 = 0.9794
UAL = qpn4pn + = 7.7 = 8
LAL = qpn4pn − = -3.6 = 0
Area below the curve = BINOMDIST (8,100,0.0206,TRUE) = 99.98%
Figure 4
Microbial Count Distribution in Purified Water

Pramote Cholayudth
November 2006 • Volume 13, Number 1 49
Point of use number 4 is designed for washing a piece of process equipment, sampling the water is also carried out throughthe flexible hose routinely used while washing. Handling of the hose is Good Manufacturing Practice (GMP) compliant - i.e.:disconnected and hung with both ends down while not in use and also under a sanitizing program.
Count mean ( pn ) = 7.5
p = 7.5/100 = 0.075
q = 1-0.075 = 0.925
UAL = qpn4pn + = 18.0 = 18
LAL = qpn4pn − = -3.0 = 0
Area below the curve = BINOMDIST (18,100,0.075,TRUE) = 99.99%
Figure 5
Microbial Count Distribution in Purified Water (via Hose Routinely Used)

Pramote Cholayudth
Journal of Validation Technology50
Figure 6
Microbial Count Distribution in Purified Water
Figure 7
Microbial Count Distribution in Purified Water
Pramote Cholayudth
November 2006 • Volume 13, Number 1 51
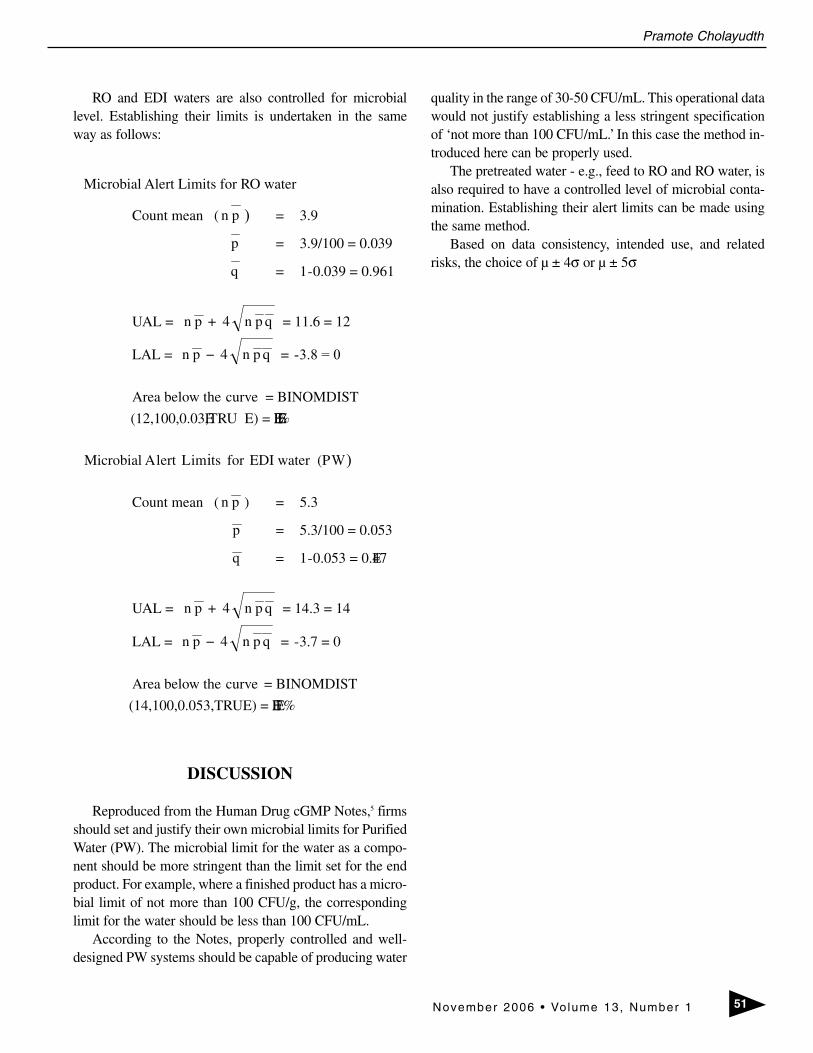
RO and EDI waters are also controlled for microbiallevel. Establishing their limits is undertaken in the sameway as follows:
DISCUSSION
Reproduced from the Human Drug cGMP Notes,5 firmsshould set and justify their own microbial limits for PurifiedWater (PW). The microbial limit for the water as a compo-nent should be more stringent than the limit set for the endproduct. For example, where a finished product has a micro-bial limit of not more than 100 CFU/g, the correspondinglimit for the water should be less than 100 CFU/mL.
According to the Notes, properly controlled and well-designed PW systems should be capable of producing water
quality in the range of 30-50 CFU/mL. This operational datawould not justify establishing a less stringent specificationof ‘not more than 100 CFU/mL.’ In this case the method in-troduced here can be properly used.
The pretreated water - e.g., feed to RO and RO water, isalso required to have a controlled level of microbial conta-mination. Establishing their alert limits can be made usingthe same method.
Based on data consistency, intended use, and relatedrisks, the choice of µ ± 4σ or µ ± 5σ
Count mean ( pn ) = 3.9
p = 3.9/100 = 0.039
q = 1-0.039 = 0.961
UAL = qpn4pn + = 11.6 = 12
LAL = qpn4pn − = -3.8 = 0
Area below the curve = BINOMDIST (12,100,0.039,TRU E) = 99.99%
Microbial Alert Limits for EDI water (PW)
Count mean ( pn ) = 5.3
p = 5.3/100 = 0.053
q = 1-0.053 = 0.947
UAL = qpn4pn + = 14.3 = 14
LAL = qpn4pn − = -3.7 = 0
Area below the curve = BINOMDIST
(14,100,0.053,TRUE) = 99.97%
Microbial Alert Limits for RO water

Pramote Cholayudth
Journal of Validation Technology52
should be considered for its proper use. Trend dataanalysis for the microbial count data on periodic basis (e.g.monthly) is also required using the same method for estab-lishing the trend limits.
Construction of the Binomial curve will help us imaginehow the microbial count will distribute and how justified theupper limit is. For readers who are interested in constructionof the Binomial curve for the Purified Water’s microbialdata, MS Excel file used for forming the curve is obtainablefrom [email protected].
CONCLUSION
Alert limits should be established for Purified and otherwater systems. Furthermore such limits are specifically re-quired for different sub-systems - e.g.: pretreatment, purifi-cation, and recirculation. When exceeded, it indicates thatthe system or sub-system may have drifted from its normaloperating condition. Alert levels are to be statistically estab-lished based on historical, routine monitoring data andshould reflect the seasonal variations of the source water.Therefore, comprehensive accumulated data up to one yearis required. For new systems, alert limits may be temporar-ily established using the OQ data. The limits will be period-ically reviewed and revised when necessary using the mostupdated accumulated data. Once the accumulated data cancover the annual seasonal variations (of source water) thelimits can be finalized and used permanently. o
ABOUT THE AUTHOR
Pramote Cholayudth is Executive Director ofValitech Co., Ltd., a well-established validation andcompliance consultant services company to thePharmaceutical Industry in Thailand. He is a guestspeaker on Process Validation to industrial pharma-ceutical scientists organized by the local FDA.Pramote was a full-time lecturer in the School ofPharmacy of a private university for four years(1998-2001). Prior to entering the academic arena,he spent 23 years in the Pharmaceutical Industrywith Bayer Laboratories (1974-1981) and OLIC(Thailand) Limited (1981-1997) - a leading and thelargest pharmaceutical toll manufacturer for multi-national companies. Pramote is the author of Con-
cepts and Practices of Pharmaceutical Process Val-idation. He is currently an Editorial Advisory Boardmember of the Journal of Validation Technology andcan be contacted by fax at 662-740-9586, by e-mailat [email protected], or by standard mailat the following address:
Pramote Cholayudth, 6/756 Number One ComplexBangkok-Ram 2 RoadPravate DistrictBangkok 10250, Thailand
REFERENCES
1. WHO Supplementary Training Modules on Good Manufac-
turing Practice, Presentation File on Water for Pharmaceuti-
cal Use Part 2: Water Purification Engineering.
2. The United States Pharmacopeial Convention, Inc., Gen-
eral Information Chapter <1231> Water for Pharmaceutical
Purposes, United States Pharmacopoeia 27th edition
Philadelphia, PA: National Publishing.
3. WHO Technical Report Series # 929, Thirty-ninth Report,
Annex 3: WHO Good Manufacturing Practices: Water for
Pharmaceutical Use, World Health Organization, 2005.
4. European Medicines Evaluation Agency, Note for Guidance
on Quality of Water for Pharmaceutical Use, London,
CPMP/QWP/158-01, May 2002.
5. Human Drug CGMP Notes, Volume 5, Number 1, March
1997, What Should Firms Use as Microbial Limits for Puri-
fied Water?
6. Vincent, D. W., Qualification of Purified Water Systems,
Journal of Validation Technology, Volume 10, Number 1,
November 2003.
Article Acronym Listing
EDI ElectrodeionizationMS MicrosoftOQ Operational QualificationPW Purified WaterRO Reverse OsmosisSD Sample Standard Deviation TOC Total Organic CarbonWHO World Health Organizationµ Population Mean σ Population Standard Deviation