setup of the debugger for a coresight system · setup of the debugger for a coresight system 6...
TRANSCRIPT

Setup of the Debugger for a CoreSight System
TRACE32 Online Help
TRACE32 Directory
TRACE32 Index
TRACE32 Documents ......................................................................................................................
ICD In-Circuit Debugger ................................................................................................................
Processor Architecture Manuals ..............................................................................................
ARM/CORTEX/XSCALE ...........................................................................................................
ARM Application Notes ........................................................................................................
Setup of the Debugger for a CoreSight System ............................................................. 1
Introduction .................................................................................................................... 3
Example of a CoreSight System ................................................................................... 4
Using this Application Note .......................................................................................... 6
Your Chip is Available in the SYStem.CPU List 6
Your Chip is NOT Available in the SYStem.CPU List 6
Set up the Debugger Yourselves for Debugging 6
Set up the Debugger Yourselves for Tracing 8
Declare Multiple CoreSight Modules of the same Type 8
Configuration Example 9
Required Tool Hardware and Licenses 9
How to use the CoreSight Modules 11
Discover Available CoreSight Components ................................................................ 12
Debug Access Port (DAP) ............................................................................................. 14
Multiple Test Access Ports in the JTAG Chain 14
Serial Wire Debug Port (SW-DP) 16
Alternative Way to Access Memory 18
Real-time Memory Access 19
Core Debug Register Access 20
JTAG Access Port (JTAG-AP) 21
Cross Trigger Interface (CTI), Cross Trigger Matrix (CTM) ....................................... 22
Performance Monitor Unit (PMU), BenchMark Counter (BMC) ................................. 24
Embedded Trace Macrocell (ETM), Program Trace Macrocell (PTM) ....................... 25
AMBA AHB Trace Macrocell (HTM) .............................................................................. 26
Instrumentation Trace Macrocell (ITM), System Trace Macrocell (STM) ................. 27
Setup of the Debugger for a CoreSight System 1 ©1989-2018 Lauterbach GmbH

Funnel (CSTF), AMBA Trace Bus (ATB), Replicator ................................................. 28
Embedded Trace Buffer (ETB, TMC used as ETB) ...................................................... 29
Embedded Trace FIFO (TMC used as ETF) .................................................................. 30
Embedded Trace Router (TMC used as ETR) .............................................................. 31
Trace Port Interface Unit (TPIU) .................................................................................... 32
Serial Wire Viewer (SWV), Serial Wire Output (SWO) ................................................ 34
High Speed Serial Trace Port (HSSTP) ......................................................................... 36
Setup of the Debugger for a CoreSight System 2 ©1989-2018 Lauterbach GmbH

Setup of the Debugger for a CoreSight System
Version 16-Nov-2018
Introduction
The ARM CoreSight technology provides additional debug and trace functionality with the objective of debugging an entire system-on-chip (SoC). CoreSight is a collection of hardware components which can be chosen and implemented by the chip designer appropriate to his system-on-chip to extend the debug features given by the cores.
This application note explains which settings the debugger will need to support the CoreSight components implemented on your system-on-chip. It tells you if certain debugger hardware modules are required. In addition, it describes the debugger commands to use the CoreSight features.
This application note gives you an idea what the CoreSight modules are good for and what you need to do to get them working. A full description of the commands can be found in other Lauterbach documents. To get a full picture of how the CoreSight modules can be used we recommend that you read the various CoreSight documents which can be downloaded from the ARM website (www.arm.com).
Setup of the Debugger for a CoreSight System 3 ©1989-2018 Lauterbach GmbH

Example of a CoreSight System
Figure: Debug Access Port (DAP)
Ad
vanc
ed P
erip
hera
l Bus
(AP
B)
Ad
vanc
ed H
igh/
per
form
ance
Bus
(AH
B)
JTAG
JTAG
System Memory
Processor Debug Register
Embedded TraceMacrocell (ETM)
Register
InstrumentationTrace Macrocell(ITM) Register(ITM) Register
FunnelRegister
JTAG Devicee.g. ARM9
MemoryAccess
Port
(MEM-AP)
MemoryAccess
Port
(MEM-AP)
JTAGAccess
Port
(JTAG-AP) JTAG Devicee.g. DSP
Trace PortInterface Unit
(TPIU) Register(TPIU) Register
Embedded TraceBuffer (ETB)
RegisterRegister
Cross TriggerInterface (CTI)
Registerg
ROM Table
g
Instrumentation
AMBA AHB TraceMacrocell (HTM)
Register
Debug Access Port
DAP
Debug Port JTAG or Serial Wire Debug Port (SW-DP)
Setup of the Debugger for a CoreSight System 4 ©1989-2018 Lauterbach GmbH

Figure: System wide trigger and trace
Funnel
Trace PortDebug Port
TPIUETBDAP
CTM
STM
CTI
DSP
DSPETM
ATB
Replicator
APBAHB
r
CTI
ARM9
ETMCTI
PTM
Cortex-A9
Setup of the Debugger for a CoreSight System 5 ©1989-2018 Lauterbach GmbH
Using this Application Note
Your Chip is Available in the SYStem.CPU List
After you have manually selected your chip in the SYStem.CPU window or with the SYStem.CPU command in a PRACTICE script (*.cmm), the debugger is informed about the CoreSight system on this chip and all settings are done automatically. In this case often a PRACTICE start-up script like
is sufficient to use all debug and trace features. Nevertheless the application note still will give you information on how to use the CoreSight modules and if you require certain debugger hardware.
Your Chip is NOT Available in the SYStem.CPU List
If your device is not listed in the SYStem.CPU window, then you should update your software. The newest release version can be downloaded from our website www.lauterbach.com/update.html. If even the latest release version does not list your device, then you should ask the Lauterbach support www.lauterbach.com/report.html if it is meanwhile supported and if you could get an intermediate software update.
If your chip is not yet supported, then we recommend that you ask Lauterbach support www.lauterbach.com/report.html to add the device to the debugger software or at least to provide a suitable start-up script containing the right debugger configuration.
There is a good chance that we can do this within a day especially if you provide the required information. You will get an idea what we need to know when you continue reading. Alternatively, we can request the information from the chip vendor.
Of course, we will respect confidential information. If you do not want Lauterbach to know how to connect to the chip, you need to configure it on your own which is described in the following.
Set up the Debugger Yourselves for Debugging
If your chip is not available for selection in the SYStem.CPU window, then select the core type instead of the chip. On Cortex cores, you need to specify the debug register base address. ARMv8 Cortex cores additionally require the base for the CTI interface.
SYStem.CPU <my_chip_name>SYStem.Up
Setup of the Debugger for a CoreSight System 6 ©1989-2018 Lauterbach GmbH

Example:
In multicore SMP debug sessions you need to specify the base addresses for all cores.
Example:
If you do not know the base addresses, try to find them out by reading the CoreSight ROM table. See chapter Discover Available CoreSight Components.
If the above example scripts are not sufficient to connect to your core, you probably need to set up the DAP because its default configuration does not match your system. See Debug Access Port (DAP).
You can view/edit the setup of the CoreSight modules with the SYStem.CONFIG.state /COmponents command:
SYStem.CPU CortexA15SYStem.CONFIG.COREDEBUG.Base <debug_base_address>SYStem.CONFIG.CTI.Base <base_address> ; required for ARMv8 coresSYStem.Up
SYStem.CPU CortexA15MPCoreSYStem.CONFIG.CoreNumber 2.CORE.ASSIGN 1. 2.SYStem.CONFIG.COREDEBUG.Base <debug_base_core0> <debug_base_core1>SYStem.CONFIG.CTI.Base <cti_base_core0> <cti_base_core1>SYStem.Up
NOTE: You need to configure only those CoreSight modules that relate to the cores you want to debug and trace in this debug session.
Setup of the Debugger for a CoreSight System 7 ©1989-2018 Lauterbach GmbH

Set up the Debugger Yourselves for Tracing
Although the description of the CoreSight modules in this application note mentions the required configuration commands, we do not recommend to do it on your own. Better collect all required information like chip name, chip documentation, a CoreSight block diagram would be very helpful (see figure System wide trigger and trace), discovery results (see chapter Discover Available CoreSight Components) and ask Lauterbach to do provide a suitable setup for you.
Declare Multiple CoreSight Modules of the same Type
You can have several of the following components: STM, FUNNEL, ETB, ETF, ETR.
Example: FUNNEL1, FUNNEL2, FUNNEL3, ...
If you do not specify a number for the CoreSight module, it internally gets the number 1.
In an SMP (Symmetric MultiProcessing) debug session, you can enter a list of base addresses for the components BMC, COREBEBUG, CTI, ETB, ETF, ETM, ETR to specify one component per core. The number of cores within the cluster can be configured using the SYStem.CONFIG CoreNumber command.
Example assuming four cores:
The address parameter can be just an address (e.g. 0x80001000), or you can add the access class in front of the address (e.g. AHB:0x80001000). Without an access class, the address gets the command specific default access class which is “DAP:” in most cases.
For more details, see “ARM Debugger” (debugger_arm.pdf).
SYStem.CONFIG CoreNumber 4.SYStem.CONFIG COREDEBUG.Base 0x80001000 0x80003000 0x80005000 0x80007000SYStem.CONFIG ETM.Base 0x8000c000 0x8000d000 0x8000e000 0x8000f000
Setup of the Debugger for a CoreSight System 8 ©1989-2018 Lauterbach GmbH

Configuration Example
Example: Dual CortexA9MPCore with ETM, STM and TPIU.
Required Tool Hardware and Licenses
Debugging:
For debugging you need a debug base module, e.g. “PowerDebug Module USB 3.0” and a debug probe, e.g. “Debug Cable” or “CombiProbe” including a debug license for the core family you want to debug, e.g. “Debugger For Cortex-A/R (ARMv7, 32-bit)”. If you want to debug multiple cores at the same time you might additionally need a “License for Multicore Debugging”. An additional hardware or license for debugging a CoreSight based system is not required.
SYStem.CPU CortexA9MPCoreSYStem.CONFIG CoreNumber 2.SYStem.CONFIG.COREDEBUG.Base 0x80010000 0x80012000SYStem.CONFIG.BMC.Base 0x80011000 0x80013000SYStem.CONFIG.ETM.Base 0x8001c000 0x8001d000SYStem.CONFIG.STM1.Base EAHB:0x20008000SYStem.CONFIG.STM1.Type ARMSYStem.CONFIG.STM1.Mode STPv2SYStem.CONFIG.FUNNEL1.Base 0x80004000SYStem.CONFIG.FUNNEL2.Base 0x80005000SYStem.CONFIG.TPIU.Base 0x80003000SYStem.CONFIG.FUNNEL1.ATBSource ETM.0 0 ETM.1 1SYStem.CONFIG.FUNNEL2.ATBSource FUNNEL1 0 STM1 7SYStem.CONFIG.TPIU.ATBSource FUNNEL2
NOTE: Only Debug Cables of the year 2008 or newer support SWD as well as JTAG.
ETM
ETM
STM
Core
Core
FUNNEL
TPIUFUNNEL
0
10
7
Setup of the Debugger for a CoreSight System 9 ©1989-2018 Lauterbach GmbH

On-chip tracing:
For on-chip tracing (or postprocessing of recorded off-chip trace data) you additionally need a “Trace License for ARM” which can be stored in the debug probe (“Debug Cable” or “CombiProbe”).
Off-chip tracing:
• System trace (ITM, STM): Requires a “CombiProbe” instead of a “Debug Cable”. The CombiProbe additionally provides signals to connect to the trace port of the chip and it has a trace memory included.
• Parallel program and data trace (ETM, PTM -> TPIU): You need a base module with trace memory inside and the possibility to connect a parallel trace probe like “Preprocessor for ARM-ETM/AUTOFOCUS II 600 Flex”. The preprocessor also includes the license for on-chip trace and also supports system trace.
• Serial program and data trace (ETM, PTM -> HSSTP): You need a base module with trace memory inside and the possibility to connect a serial trace probe like “Preprocessor for ARM-ETM/HSSTP HF-Flex”. The preprocessor also includes the license for on-chip trace and also supports system trace.
µTrace:
The µTrace, a low-cost tool for Cortex-M cores only, supports multicore debugging, on-chip and off-chip tracing (ITM, ETM -> TPIU) but for Cortex-M cores only.
Setup of the Debugger for a CoreSight System 10 ©1989-2018 Lauterbach GmbH

How to use the CoreSight Modules
In the list below, identify which CoreSight components you have on your system-on-chip and read the appropriate chapter. There you will find:
• A short explanation of the CoreSight component
• The debugger setups you will need in your start-up script
• A list of commands related to the new features
A full description of the commands can be found in other Lauterbach documents. To get a full picture of how the CoreSight modules can be used we recommend that you read the various CoreSight documents which can be downloaded from the ARM website www.arm.com.
We support more CoreSight compliant modules than described here. This application note focuses only on the ARM CoreSight modules.
CoreSight Components
• Debug Access Port (DAP)
• Cross Trigger Interface (CTI)Cross Trigger Matrix (CTM)Embedded Cross Trigger (ECT)
• Performance Monitor Unit (PMU)BenchMark Counter (BMC)
• Embedded Trace Macrocell (ETM)Program Trace Macrocell (PTM)
• AMBA AHB Trace Macrocell (HTM)
• Instrumentation Trace Macrocell (ITM)System Trace Macrocell (STM)
• Funnel (CSTF)AMBA Trace Bus (ATB)Replicator
• Embedded Trace Buffer (ETB, TMC used as ETB)
• Embedded Trace FIFO (TMC used as ETF)
• Embedded Trace Router (TMC used as ETR)
• Trace Port Interface Unit (TPIU)
• Serial Wire Viewer (SWV)Serial Wire Output (SWO)
• High Speed Serial Trace Port (HSSTP)
Setup of the Debugger for a CoreSight System 11 ©1989-2018 Lauterbach GmbH

Discover Available CoreSight Components
Description
A CoreSight system should have a ROM table, which you can read out to discover the CoreSight components integrated on your device.
The following command allows you to read the CoreSight ROM table partly and to skip modules which cannot be accessed at this time.
The discovery might fail if the DAP is not the only TAP controller in the JTAG chain. In this case you need to set the DAPIRPRE, … parameter first. See Debug Access Port (DAP).
There might be other reasons which cause the discovery to fail. For example the ROM table might not be implemented or there is a system level TAP controller which needs to be programed to make the DAP visible on JTAG or you might need to change the reset options, e.g. SYStem.Option EnReset OFF.
Example of a Discovery Protocol
You can mark proposed setup commands by clicking the buttons in the [x] column (see screenshot below). With the right mouse button, you can execute them or store them into a PRACTICE start-up script (*.cmm).
SYStem.DETECT DAP
Setup of the Debugger for a CoreSight System 12 ©1989-2018 Lauterbach GmbH

The following debugger settings can be derived from the ROM table information. Compare this with the relevant chapters of this application note.
Please note that information not included in the ROM table is still missing. For example, information about how the trace modules are connected on the chip. This piece of information is required to specify the ATBSources. But in this simple example, an educated guess is enough:
SYStem.CPU CortexA8SYStem.CONFIG.COREDEBUG.Base DAP:0x40008000
SYStem.CONFIG.MEMORYACCESSPORT 0SYStem.CONFIG.DEBUGACCESSPORT 1
SYStem.CONFIG.ETM.Base DAP:0x40002000SYStem.CONFIG.ETB.Base DAP:0x40001000SYStem.CONFIG.TPIU.Base DAP:0x40003000
SYStem.CONFIG.ETB.ATBSource ETMSYStem.CONFIG.TPIU.ATBSource ETM
Setup of the Debugger for a CoreSight System 13 ©1989-2018 Lauterbach GmbH

Debug Access Port (DAP)
See Example of a CoreSight System.
Multiple Test Access Ports in the JTAG Chain
A CoreSight system and also all Cortex cores always have a Debug Access Port (DAP). It is the main interface between debugger and on-chip debug and trace facilities. If the DAP is not the only Test Access Port (TAP) in the JTAG scan chain, you need to set up the position in the JTAG scan chain.
This is an example of a setup mask specifying the position of the DAP in a JTAG scan chain.
In case of Cortex cores this is the only scan chain you need to configure. Parameters like IRPRE, ..., ETMIRPRE, ... are not needed.
If you do not know the position of the DAP in the JTAG scan chain, try to detect it with the command:
SYStem.CONFIG DAPIRPRE <value>
SYStem.CONFIG DAPIRPOST <value>
SYStem.CONFIG DAPDRPRE <value>
SYStem.CONFIG DAPDRPOST <value>
SYStem.CONFIG.state /Jtag Display settings
SYStem.DETECT SHOWChain
Setup of the Debugger for a CoreSight System 14 ©1989-2018 Lauterbach GmbH
Example
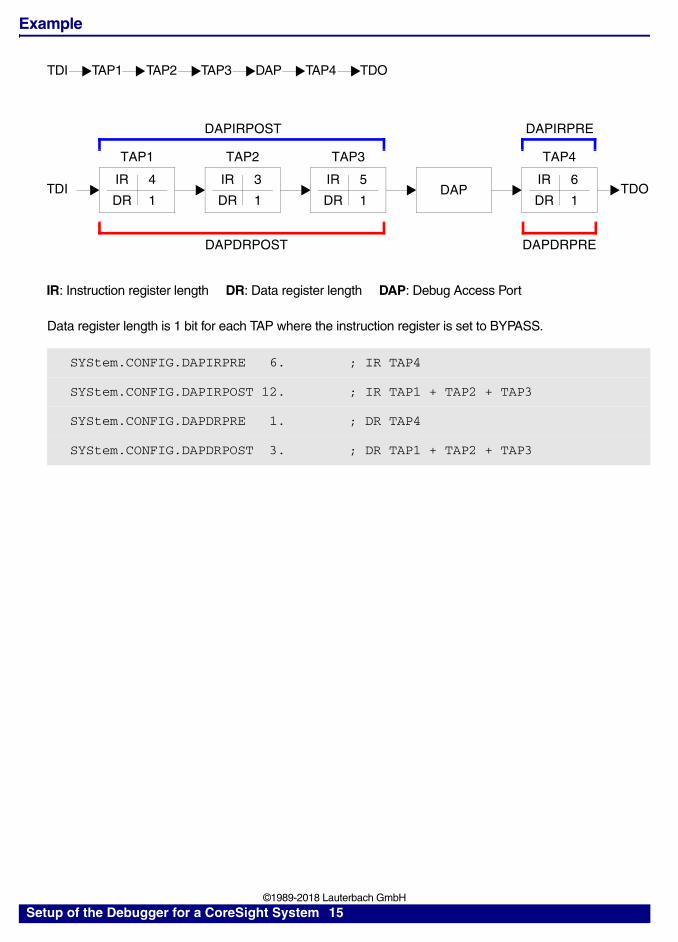
Data register length is 1 bit for each TAP where the instruction register is set to BYPASS.
SYStem.CONFIG.DAPIRPRE 6. ; IR TAP4
SYStem.CONFIG.DAPIRPOST 12. ; IR TAP1 + TAP2 + TAP3
SYStem.CONFIG.DAPDRPRE 1. ; DR TAP4
SYStem.CONFIG.DAPDRPOST 3. ; DR TAP1 + TAP2 + TAP3
DAP
DAPIRPOST DAPIRPRE
4
1
TAP1
IR
DR
3
1
TAP2
IR
DR
5
1
TAP3
IR
DR
6
1
TAP4
IR
DRTDI TDO
DAPDRPOST DAPDRPRE
IR: Instruction register length DR: Data register length DAP: Debug Access Port
TDI TAP1 TAP2 TAP3 DAP TAP4 TDO
Setup of the Debugger for a CoreSight System 15 ©1989-2018 Lauterbach GmbH

Serial Wire Debug Port (SW-DP)
Description
A Debug Access Port (DAP) based system normally provides a standard JTAG interface between the debugger and the DAP consisting of the signals TMS, TDI, TCK, TDO, nTRST. Alternatively, a Serial Wire Debug Port (SW-DP) can be implemented which uses just two signals TMSC and TCKC. Some chips provide both interfaces. The user can switch to the serial wire debug interface and use the remaining three signals for different purposes, e.g. the TDO signal can be used as Serial Wire Output (SWO) for the Serial Wire Viewer (SWV). This interface often can be found on Cortex-M3, Cortex-M4 and Cortex-M7 based devices.
Debugger Setup
You need a certain debug cable which supports the SW-DP. You can use all versions of the CombiProbe and the debug cable version V4 or newer. The pin position of TMSC is the same as TMS and TCKC the same as TCK. For Cortex-M cores you can also use the µTrace.
You need to inform the debugger that the two-pin communication shall be used:
This command must be used before the debugger establishes a connection (SYStem.Up).
Multi-drop Serial Wire Debug System:
Unlike JTAG, the serial wire interface does not allow to daisy-chain multiple DAPs. However, it can access multiple DAPs by connecting them in parallel and addressing them by an ID. This is called multi-drop serial wire. You need to know the ID. There is no way to read it out by a diagnosis function.
SYStem.CONFIG.DEBUGPORTTYPE SWD
Figure: CombiProbe
Figure: Debug Cable Version 4(older versions look different, have a blue flat cable)
Setup of the Debugger for a CoreSight System 16 ©1989-2018 Lauterbach GmbH

Usage
There are no additional features. The Serial Wire Debug Port is just an alternative interface between debugger and DAP in order to save pin count or in order to use the Serial Wire Output (SWO).
SYStem.CONFIG.DEBUGPORTTYPE SWDSYStem.CONFIG.SWDPTargetSel <id>
Setup of the Debugger for a CoreSight System 17 ©1989-2018 Lauterbach GmbH

Alternative Way to Access Memory
Description
The DAP can act as a bus master and can allow memory access to the following buses:
• Advanced High-performance Bus (AHB)
• Advanced Peripheral Bus (APB)
• Advanced eXtensible Interface (AXI) bus
Memory access is even possible while the core is running assuming these buses are connected to the DAP via the Memory Access Ports (MEM-AP).
Debugger Setup
The debugger needs to know the access port number the busses are connected to
<number> is between 0 and 255. The default number for the memory access port is 0. The default number for the debug access port is 1 which is correct in most cases.
Usage
Normal memory accesses from the debugger will be done by injecting load or store commands in the processor pipeline. The DAP provides an alternative way to access memory by accessing buses via the DAP. You can force the debugger to choose this way by using the access classes listed in the table above.
To access memory even during runtime, you need to add an ’E’ -> ’EAHB:’, ’EAPB:’.
Command Related Bus Access Class
SYStem.CONFIG.MEMORYACCESSPORT <number> typically AXI or AHB E:
SYStem.CONFIG.DEBUGACCESSPORT <number> typically APB DAP:
SYStem.CONFIG.AXIACCESSPORT <number> should be AXI AXI:
SYStem.CONFIG.AHBACCESSPORT <number> should be AHB AHB:
SYStem.CONFIG.APBACCESSPORT <number> should be APB APB:
Data.Set APB:0x90003020 %Long 0x12345678Data.dump AHB:0x80000000
Data.Set EAPB:0x90003020 %Long 0x12345678Data.dump EAHB:0x80000000
Setup of the Debugger for a CoreSight System 18 ©1989-2018 Lauterbach GmbH
Real-time Memory Access
Description
When debugging ARM Cortex-A and Cortex-R cores, the debugger displays memory by inserting load or store commands into the processor pipeline. This is not possible while the core is running. When running, the memory windows are frozen and show the hashed bar on the top to indicate that they cannot be updated.
To get access even when the core is running, you can use the AXI or AHB MEM-AP port of the DAP assuming the AXI or AHB system bus is connected to the DAP and the mapping is the same as from core view.
7
Debugger Setup
You need to enable real-time memory access with the command:
Usage
You need to add an ’E’ before the access class like ’ESD:’, ’ESR:’, ’EST:’ to cause the debugger to access memory even during run-time:
NOTE: You might see different things. The DAP will not see the caches and will not use memory translations (MMU). This typically works fine for non-cached physical addressed memory.
SYStem.MemAccess DAP
Data.dump ED:0x874500a8
Var.View %E flags
Setup of the Debugger for a CoreSight System 19 ©1989-2018 Lauterbach GmbH

Core Debug Register Access
Description
The Cortex cores use the DAP to give the debugger access to the core debug register and the CoreSight modules on the chip. They can typically be accessed via the MEM-AP APB, the peripheral bus.
Debugger Setup
The core debug registers are within a 4 kByte memory block. It is typically mapped on the Advanced Peripheral Bus (APB) which is connected to a Memory Access Port (MEM-AP) of the DAP. The debugger needs to know the base address of this register block.
The default <accessclass> is ‘DAP:’ which uses the MEM-AP specified by SYStem.CONFIG.DEBUGACCESSPORT <number> and will typically be the MEM-AP APB.
In case of the Cortex-M there is a fix base address 0xe000e000 which is set per default.
Usage
These settings only inform the debugger how to access the core debug register. This is a requirement to provide the (normal) core debug functions. There are no additional features.
SYStem.CONFIG.COREDEBUG.Base <accessclass>:<baseaddress>
Setup of the Debugger for a CoreSight System 20 ©1989-2018 Lauterbach GmbH

JTAG Access Port (JTAG-AP)
Description
For cores which do not have the debug register memory mapped like ARM7, ARM9, ARM11 or any non-ARM core with JTAG debug interface, the DAP offers the possibility to connect these cores to a JTAG Access Port (JTAG-AP). The JTAG-AP can drive up to 8 JTAG interfaces. The debugger communicates with registers in the DAP to cause the DAP to generate JTAG sequences on a certain ’port’ of the JTAG access port. This way you have multiple JTAG interfaces. One between the debugger and the DAP and for each connected core another one between DAP and core. This reduces performance compared to a daisy-chained JTAG connection, but the advantage in a multicore system is that even if a core is powered down or has no or reduced clock the other cores can still be debugged.
Debugger Setup
The debugger needs to know the JTAG-AP number where the JTAG-AP is connected to the DAP.
The <number> is between 0 and 255. (Commonly 2 is used.)
The COREJTAGPORT specifies to which of the 8 possible ports of the JTAG-AP the core is connected.
The <portnumber> is between 1 and 8.
Only one TAP controller shall be connected to one JTAG-AP (no daisy-chaining). In case of daisy-chained TAP controllers you need to specify the TAP position with these commands:
Usage
These settings only inform the debugger how to access the core debug register. This is a requirement to provide the (normal) core debug functions. There are no additional features.
SYStem.CONFIG JTAGACCESSPORT <number>
SYStem.CONFIG COREJTAGPORT <portnumber>
SYStem.CONFIG IRPRE <number>SYStem.CONFIG DRPRE <number>SYStem.CONFIG IRPOST <number>SYStem.CONFIG DRPOST <number>
Setup of the Debugger for a CoreSight System 21 ©1989-2018 Lauterbach GmbH

Cross Trigger Interface (CTI), Cross Trigger Matrix (CTM)
Description
The Embedded Cross Trigger (ECT) is a mechanism for passing debug events between multiple cores or modules. It can, for example, be used for halting cores synchronously or for triggering a trace recording. It consists of a Cross Trigger Matrix (CTM), which broadcasts the event signals via channels and one or more Cross Trigger Interfaces (CTI) which enable the processor or module to react on a event and/or to broadcast events to the other processors or modules. The Cross Trigger Interfaces (CTI) need to be programmed to get the functionality you want (see description below). There is no need to program the Cross Trigger Matrix (CTM), because it is a static implementation for broadcasting the signals of the Cross Trigger Interfaces (CTI).
The Cross Trigger Interface (CTI) has a 4 KByte memory mapped register block. By writing to these registers, you can select which event shall be broadcasted and on which event you want to react.
It is up to the chip designer which event is routed to which CTI signal. There is just a recommendation from ARM in the CoreSight documents.
Debugger Setup
The debugger needs to know the base address of the register block that the debugger can use the CTI for synchronous start/stop of the cores in a multicore debug session.
The default <accessclass> is ‘DAP:’ which uses the MEM-AP specified by SYStem.CONFIG.DEBUGACCESSPORT <number> and will typically be the MEM-AP APB.
To inform the debugger about the connection of the start/stop signals of the cores to the CTI you can use:
When you are debugging Cortex-A or Cortex-R cores and if the interconnection follows the recommendations by ARM, then CortexV1 is the correct parameter for <type>.
Usage
The CTI is automatically used to synchronously start/stop the cores. Other functions need to be activated by the user, e.g. by Data.Set commands in a PRACTICE script (*.cmm) or manually in the CTI peripheral file:
SYStem.CONFIG.CTI.Base <accessclass>:<address>
SYStem.CONFIG.CTI.Config <type>
PER.view ~~/percti.per <accessclass>:<cti_base_address>
Setup of the Debugger for a CoreSight System 22 ©1989-2018 Lauterbach GmbH

For a detailed description of the CTI register functionality, see the various CoreSight documents, which can be downloaded from the ARM website at www.arm.com.
Setup of the Debugger for a CoreSight System 23 ©1989-2018 Lauterbach GmbH

Performance Monitor Unit (PMU), BenchMark Counter (BMC)
Description
The Performance Monitor Unit (PMU) consists of a group of counters that can be configured to count certain events in order to get statistics on the operation of the processor and memory system. Examples of events are cache accesses/refills/write-backs, TLB refills, bus accesses, speculatively executed instructions.
TRACE32 uses the term BenchMark Counter (BMC) for this kind of feature in all core architectures. BMC is not a CoreSight unit, it is used as a synonym for PMU.
Debugger Setup
The debugger needs to know the base address of the PMU:
The default <accessclass> is ‘DAP:’ which uses the MEM-AP specified by SYStem.CONFIG.DEBUGACCESSPORT <number> and will typically be the MEM-AP APB.
Usage
The counters of Cortex-A/R cores can be read at run-time. The counters of ARM11 cores can only be read while the target application is halted.
For information about architecture-independent BMC commands, see BMC in general_ref_b.pdf.
For information about architecture-specific BMC commands, see ARM Specific Benchmarking Commands in debugger_arm.pdf.
There might be additional, device specific counters on your device, which we most likely support as well.
SYStem.CONFIG.BMC.Base <accessclass>:<address>
Setup of the Debugger for a CoreSight System 24 ©1989-2018 Lauterbach GmbH

Embedded Trace Macrocell (ETM), Program Trace Macrocell (PTM)
Description
The ETM and the PTM output information about the core’s activity. ETM outputs program and optional data trace, PTM outputs program trace only.
The data can be passed directly or combined with other trace sources via Funnel (CSTF) and AMBA Trace Bus (ATB) off-chip to the Trace Port Interface Unit (TPIU). There it will be captured by a trace port analyzer (ETM Preprocessor or CombiProbe or µTrace). Alternatively, it can be stored on-chip in the Embedded Trace Buffer (ETB or TMC/ETF used as ETB) or stored e.g. in DRAM via Embedded Trace Router (ETR) for later readout via JTAG or Serial Wire Debug Port (SW-DP).
Debugger Setup
If there is a non-CoreSight ARM ETM implemented on the chip then no additional settings are required. If there is a CoreSight ETM, then the debugger needs to know the base address:
The default <accessclass> is ‘DAP:’ which uses the MEM-AP specified by SYStem.CONFIG.DEBUGACCESSPORT <number> and will typically be the MEM-AP APB.
In addition, you need to specify to which module it is connected in the on-chip CoreSight trace system
Usage
For configuring the ETM (trace ID, timestamp, ...), you can use the ETM command group. The ETM.state window displays the current settings.
For tracing and trace analysis, use the trace commands from the Trace, Analyzer, and Onchip command groups. See e.g. “ARM-ETM Trace” (trace_arm_etm.pdf) and “ARM-ETM Training” (training_arm_etm.pdf).
SYStem.CONFIG.ETM.Base <accessclass>:<address>
SYStem.CONFIG.<module>.ATBSource ETM
NOTE: TRACE32 uses the command group ETM for both ETM and PTM.
Setup of the Debugger for a CoreSight System 25 ©1989-2018 Lauterbach GmbH

AMBA AHB Trace Macrocell (HTM)
Description
The HTM outputs information on accesses to an AHB bus on the chip. It gives visibility to bus information which cannot be provided by the Embedded Trace Macrocell (ETM). You can get information about:
• The bus utilization
• Free bus capacities
• You can see if (cache, write buffer) and when a memory access happens
• You get the time correlation between the bus access, program flow, and data access
Combined with other trace sources, the data can be passed via Funnel and AMBA Trace Bus (ATB) off-chip to the Trace Port Interface Unit (TPIU). There it will be captured by a trace port analyzer (ETM Preprocessor or CombiProbe). Alternatively, it can be stored on-chip in the Embedded Trace Buffer (ETB or TMC/ETF used as ETB) or stored e.g. in DRAM via Embedded Trace Router (ETR) for later readout via JTAG or Serial Wire Debug Port (SW-DP).
Debugger Setup
The debugger needs to know the base address of the control register block:
The default <accessclass> is ‘DAP:’ which uses the MEM-AP specified by SYStem.CONFIG.DEBUGACCESSPORT <number> and will typically be the MEM-AP APB.
In addition, you need to specify to which module it is connected in the on-chip CoreSight trace system:
Usage
For configuring the HTM (trace ID, trace priority, on/off ...) you can use the HTM command group. See general_ref_h.pdf. The HTM.state window displays the current settings. To view the HTM trace, result enter HTMAnalyzer.List or HTMOnchip.List.
SYStem.CONFIG.HTM.Base <accessclass>:<address>
SYStem.CONFIG.<module>.ATBSource HTM
Setup of the Debugger for a CoreSight System 26 ©1989-2018 Lauterbach GmbH

Instrumentation Trace Macrocell (ITM), System Trace Macrocell (STM)
Description
The ITM and STM output system trace information. Software running on an ARM processor can write to memory mapped registers. The ITM/STM generate trace packets containing the written values. ITM and STM CANNOT be used for full program and/or data trace.
ITM modules are typically available on Cortex-M based devices. The Cortex-M provides additional hardware facilities (DWT) which can automatically generate data for the ITM. This way, for example, variable values can be watched, or the program counter can be periodically output.
The data can be output directly on a single output pin named Serial Wire Output (SWO), where it will be captured by the CombiProbe or µTrace. Alternatively it can be output - together with other trace sources - via the AMBA Trace Bus (ATB) to the Trace Port Interface Unit (TPIU). There it will be captured by a trace port analyzer (ETM Preprocessor or CombiProbe). Another possibility is to store the data on-chip in the Embedded Trace Buffer (ETB or TMC/ETF used as ETB) or e.g. in DRAM via Embedded Trace Router (ETR) for later readout via JTAG or Serial Wire Debug Port (SW-DP).
Debugger Setup
The debugger needs to know the base address of the control register block:
The default <accessclass> is ‘DAP:’ which uses the MEM-AP specified by SYStem.CONFIG.DEBUGACCESSPORT <number> and will typically be the MEM-AP APB.
In addition, you need to specify to which module it is connected in the on-chip CoreSight trace system:
Usage
For configuring the ITM or STM (trace ID, trace priority, on/off ...) you can use the ITM or STM command group. The ITM.view or STM.view windows display the current settings. To view the trace results enter:
• ITMAnalyzer.List or STMAnalyzer.List (recorded with preprocessor) or
• ITMOnchip.List or STMOnchip.List (recorded on-chip).
For ITM usage with Cortex-M we recommend that you read the “CombiProbe for Cortex-M User’s Guide” (combiprobe_cortexm.pdf). For STM usage, you should read “System Trace User’s Guide” (trace_stm.pdf).
SYStem.CONFIG.ITM.Base <accessclass>:<address>SYStem.CONFIG.STM.Base <accessclass>:<address>
SYStem.CONFIG.<module>.ATBSource ITMSYStem.CONFIG.<module>.ATBSource STM
Setup of the Debugger for a CoreSight System 27 ©1989-2018 Lauterbach GmbH

Funnel (CSTF), AMBA Trace Bus (ATB), Replicator
Description
The CoreSight Trace Funnel (CSTF) is used to combine multiple trace sources into a single bus, called the AMBA Trace Bus (ATB). The trace data includes a source ID, so that the debug tool can identify the source of the trace packet. A Replicator is required if you need to simultaneously feed more than one trace sink like a Trace Port Interface Unit (TPIU) and an Embedded Trace Buffer (ETB).
Debugger Setup
There is no setup needed for the AMBA Trace Bus (ATB) and Replicator, but the debugger needs the base address of the Funnel control register block.
The default <accessclass> is ‘DAP:’ which uses the MEM-AP specified by SYStem.CONFIG.DEBUGACCESSPORT <number> and will typically be the MEM-AP APB.
In addition, you need to specify to which trace sources you have connected the up to eight funnel input ports:
Usage
The settings are required for the debugger to route the activated trace sources to the trace sink you want to use.
SYStem.CONFIG.FUNNEL.Base <accessclass>:<address>
SYStem.CONFIG.FUNNEL.ATBSource <source1> <portnumber_source1> <source2> ...
Setup of the Debugger for a CoreSight System 28 ©1989-2018 Lauterbach GmbH

Embedded Trace Buffer (ETB, TMC used as ETB)
Description
The ETB stores trace data at high rates to on-chip SRAM exclusively used by the ETB. The data can be read out via JTAG or Serial Wire Debug Port (SW-DP) when the trace recording has ended.
Debugger Setup
In case of a non-CoreSight ETB, you need to set the JTAG chain position (ETBIRPRE, ETBIRPOST, ETBDRPRE, ETBDRPOST) of the ETB TAP. In case of a CoreSight ETB, you need to set the base address for the ETB:
<accessclass> is typically ’DAP’ which is the default access class.<module> assigns the CoreSight module where this ETB gets its data from, e.g. “FUNNEL1”
To activate ETB instead of the Trace Port Interface Unit (TPIU) you need to set:
Usage
For tracing and trace analysis, use the trace commands from the Onchip command group. See e.g. “ARM-ETM Trace” (trace_arm_etm.pdf) and “ARM-ETM Training” (training_arm_etm.pdf).
SYStem.CONFIG.ETB.Base <accessclass>:<address>SYStem.CONFIG.ETB.ATBSource <module>
Trace.METHOD Onchip
Setup of the Debugger for a CoreSight System 29 ©1989-2018 Lauterbach GmbH

Embedded Trace FIFO (TMC used as ETF)
Description
The ETF is a FIFO for trace data on the chip to moderate the peak bandwidth the trace sinks need to handle. The ETF can alternatively be used as ETB to store trace data on chip.
Debugger Setup
The base address needs to be provided for ETF:
<accessclass> is typically ’DAP’ which is the default access class.<module> assigns the CoreSight module where this ETF gets its data from, e.g. “FUNNEL1”
The ETF can be used as ETB as well. In this case you might need to tell the debugger that you want to use this ETF to store on-chip trace data:
This is not needed if there is no other possibility to store trace data on chip.
Usage
When using it as a FIFO, then there is nothing else to configure. The debugger takes care of the trace path routing and controlling the ETF.
When using it as ETB, use the trace commands from the Onchip command group. See e.g. “ARM-ETM Trace” (trace_arm_etm.pdf) and “ARM-ETM Training” (training_arm_etm.pdf).
SYStem.CONFIG.ETF.Base <accessclass>:<address>SYStem.CONFIG.ETF.ATBSource <module>
Onchip.TraceCONNECT ETF1
Setup of the Debugger for a CoreSight System 30 ©1989-2018 Lauterbach GmbH

Embedded Trace Router (TMC used as ETR)
Description
The Embedded Trace Router (ETR) can send the trace data stream to a memory location on the AXI bus. This way you can use the DRAM as a big on-chip trace memory.
Debugger Setup
The base address needs to be provided for ETR:
<accessclass> is typically ’DAP’ which is the default access class.<module> assigns the CoreSight module where this ETR gets its data from, e.g. “FUNNEL1”
In addition, you need to tell the debugger the memory location and size which shall be used by the ETR. We recommend that you run the PRACTICE script file etr_utility.cmm, which can be found in the TRACE32 installation directory under ~~/demo/arm/etc/embedded_trace_router
If there is more than one possibility to store trace data on-chip you need to choose ETR as sink:
Usage
When using it as ETR, use the trace commands from the Onchip command group. See e.g. “ARM-ETM Trace” (trace_arm_etm.pdf) and “ARM-ETM Training” (training_arm_etm.pdf).
SYStem.CONFIG.ETR.Base <accessclass>:<address>SYStem.CONFIG.ETR.ATBSource <module>
Onchip.TraceCONNECT ETR
Setup of the Debugger for a CoreSight System 31 ©1989-2018 Lauterbach GmbH

Trace Port Interface Unit (TPIU)
Description
The TPIU formats and transmits the probably multi-source trace data coming from the AMBA Trace Bus (ATB) off-chip to the debug tool. The trace frequency is independent of the core clock and the data will be output on a parallel port configurable from 2 to 32 bit.
Debugger Setup
An ETM Preprocessor is required. The following figure shows the ETM Preprocessor LA-7992 AutoFocus II. Alternatively other types can be used.
For 4-bit wide trace port and trace clock < 200 MHz the CombiProbe can be used.
Figure: ETM Preprocessor AutoFocus II
Figure: CombiProbe
Setup of the Debugger for a CoreSight System 32 ©1989-2018 Lauterbach GmbH
The debugger needs to know the base address of the TPIU control register block:
<accessclass> is typically ’DAP’ which is the default access class.<module> assigns the CoreSight module where this ETR gets its data from, e.g. “FUNNEL1”
To activate the external trace via TPIU instead the on-chip Embedded Trace Buffer (ETB) you need to set:
This is the default if an ETM Preprocessor is connected to the debugger.
The trace port pins are often multiplexed with alternate functions. You might need to set up the right muxing. Further you might need to set up trace clock source and dividers for the TPIU, which is independent of the core clock and should be set up as fast as the IO pins and the tool (although the tool is probably not the bottleneck) can manage for trace bandwidth reasons.
The port size and port mode can be selected.
Usage
You can use the trace commands from the Trace or Analyzer command groups. See e.g. “ARM-ETM Trace” (trace_arm_etm.pdf) and “ARM-ETM Training” (training_arm_etm.pdf).
SYStem.CONFIG.TPIU.Base <accessclass>:<address>SYStem.CONFIG.TPIU.ATBSource <module>
Trace.Method Analyzer
TPIU.PortSize <size> e.g. 4, 8, 16, 32
TPIU.PortMode <mode> e.g. Bypass, Wrapped, Continuous
Setup of the Debugger for a CoreSight System 33 ©1989-2018 Lauterbach GmbH

Serial Wire Viewer (SWV), Serial Wire Output (SWO)
Description
The Serial Wire Viewer provides an output for the Instrumentation Trace Macrocell (ITM) through a single pin, the Serial Wire Output (SWO).
Debugger Setup
A CombiProbe or µTrace is required.
In addition to the settings for the ITM, the debugger needs to be informed that it receives the ITM data through the Serial Wire Output (SWO). The connector pin named TDO is used for that purpose. In order to use this pin for the ITM it is required to use the Serial Wire Debug Port (SW-DP) instead of the standard JTAG interface. As soon as SW-DP is activated
ITM data will be output on the SWO on the former TDO pin. At the moment only the UART protocol is supported.
SWO is a TPIU-like CoreSight module with a subset of the TPIU functionality. If the chip additionally includes a TPIU with a parallel trace port, then you need to select SWV/SWO by
SYStem.CONFIG SWDP ON
TPIU.PortSize SWV
Figure: CombiProbe
Figure: µTrace
Setup of the Debugger for a CoreSight System 34 ©1989-2018 Lauterbach GmbH

Usage
For usage of the ITM data output via SWV/SWO see the chapter Instrumentation Trace Macrocell.
Setup of the Debugger for a CoreSight System 35 ©1989-2018 Lauterbach GmbH

High Speed Serial Trace Port (HSSTP)
Description
The High-Speed Serial Trace Port uses the Aurora protocol and transmits the multi-source trace data coming from the AMBA Trace Bus (ATB) off-chip to the debug tool. The trace frequency is independent of the core clock.
Debugger Setup
A HSSTP Preprocessor is required. The following figure shows the ARM-ETM/HSSTP HF-Flex Preprocessor LA-7988. It supports up to 4 lanes with up to 6.5 Gbit/s.
Usage
You can use the trace commands from the Trace or Analyzer command groups. See e.g. “ARM-ETM Trace” (trace_arm_etm.pdf) and “ARM-ETM Training” (training_arm_etm.pdf).
Figure: HSSTP Preprocessor
Setup of the Debugger for a CoreSight System 36 ©1989-2018 Lauterbach GmbH