seven facts on noncognitive skills from education to the ... · economic facts | october 2016 diane...
TRANSCRIPT
ECONOMIC FACTS | OCTOBER 2016
Diane Whitmore Schanzenbach, Ryan Nunn, Lauren Bauer, Megan Mumford, and Audrey Breitwieser
Seven Facts on Noncognitive Skills from Education to the Labor Market
W W W . H A M I L T O N P R O J E C T . O R G
The Hamilton Project seeks to advance America’s promise of
opportunity, prosperity, and growth. The Project’s economic
strategy reflects a judgment that long-term prosperity is best
achieved by fostering economic growth and broad participation
in that growth, by enhancing individual economic security, and by
embracing a role for effective government in making needed public
investments. We believe that today’s increasingly competitive
global economy requires public policy ideas commensurate with
the challenges of the 21st century. Our strategy calls for combining
increased public investments in key growth-enhancing areas, a
secure social safety net, and fiscal discipline. In that framework,
the Project puts forward innovative proposals from leading
economic thinkers — based on credible evidence and experience,
not ideology or doctrine — to introduce new and effective policy
options into the national debate.
The Project is named after Alexander Hamilton, the nation’s
first treasury secretary, who laid the foundation for the modern
American economy. Consistent with the guiding principles of
the Project, Hamilton stood for sound fiscal policy, believed
that broad-based opportunity for advancement would drive
American economic growth, and recognized that “prudent aids
and encouragements on the part of government” are necessary to
enhance and guide market forces.
MISSION STATEMENT
The Hamilton Project is grateful to Shirley Brandman, Catherine
Brown, David Deming, David Dreyer, Joy Fox, Emma Garcia,
Kirabo Jackson, Melissa Kearney, Kriston McIntosh, and Michele
McLaughlin for insightful comments and discussions. The Hamilton
Project is also grateful to Gregory Nantz, Emma Billmyer, and
Elizabeth Debraggio for excellent research assistance.
ACKNOWLEDGMENTS
The Hamilton Project • Brookings i
Seven Facts on Noncognitive Skills from Education to the Labor Market
IntroductionCognitive skills—that is, math and reading skills that are measured by standardized tests—are generally understood to be of critical importance in the labor market. Most people find it intuitive and indeed unsurprising that cognitive skills, as measured by standardized tests, are important for students’ later-life outcomes. For example, earnings tend to be higher for those with higher levels of cognitive skills. What is less well understood—and is the focus of these economic facts—is that noncognitive skills are also integral to educational performance and labor-market outcomes.
Due in large part to research pioneered in economics by Nobel laureate James J. Heckman, there is a robust and growing body of evidence that noncognitive skills function similarly to cognitive skills, strongly improving labor-market outcomes. These noncognitive skills—often referred to in the economics literature as soft skills and elsewhere as social, emotional, and behavioral skills—include qualities like perseverance, conscientiousness, and self-control, as well as social skills and leadership ability (Duckworth and Yeager 2015). The value of these qualities in the labor market has increased over time as the mix of jobs has shifted toward positions requiring noncognitive skills. Evidence suggests that the labor-market payoffs to noncognitive skills have been increasing over time and the payoffs are particularly strong for individuals who possess both cognitive and noncognitive skills (Deming 2015; Weinberger 2014).
Although we draw a conceptual distinction between noncognitive skills and cognitive skills, it is not possible to disentangle these concepts fully. All noncognitive skills involve cognition, and some portion of performance on cognitive tasks is made possible by noncognitive skills. For the purposes of this document, the term “cognitive skills” encompasses intelligence; the ability to process, learn, think, and reason; and substantive knowledge as reflected in indicators of academic achievement. Since the No Child Left Behind Act of 2001, education policy has focused on accountability policies aimed at improving cognitive skills and closing test score gaps across groups. These policies have been largely successful, particularly for math achievement (Dee and Jacob 2011; Wong, Cook, and Steiner 2009) and among students most exposed to accountability pressure (Neal and Schanzenbach 2010). What has received less attention in policy debates is the importance of noncognitive skills.
To varying degrees, the ability to acquire noncognitive skills is heritable: some individuals have an inherently easier time getting along with others, just as some can more easily acquire cognitive skills and others can more
Diane Whitmore Schanzenbach, Ryan Nunn, Lauren Bauer, Megan Mumford, and Audrey Breitwieser
ii Seven Facts on Noncognitive Skills from Education to the Labor Market
Introduction continued from page i
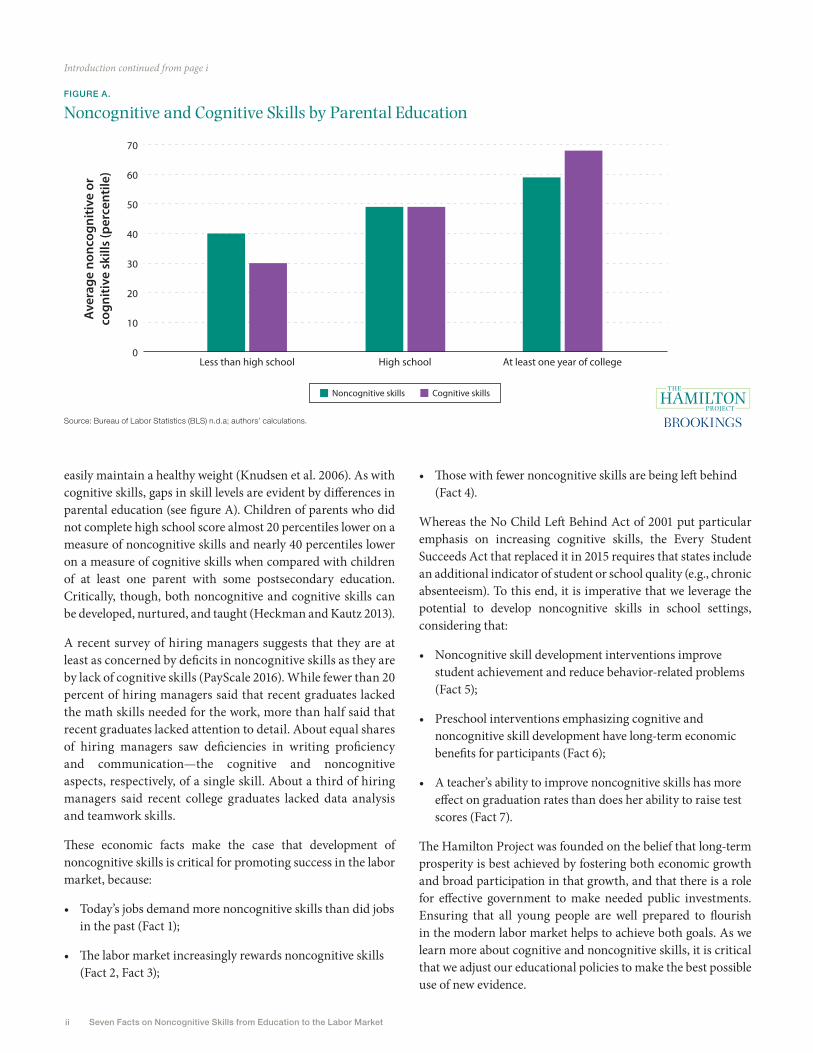
easily maintain a healthy weight (Knudsen et al. 2006). As with cognitive skills, gaps in skill levels are evident by differences in parental education (see figure A). Children of parents who did not complete high school score almost 20 percentiles lower on a measure of noncognitive skills and nearly 40 percentiles lower on a measure of cognitive skills when compared with children of at least one parent with some postsecondary education. Critically, though, both noncognitive and cognitive skills can be developed, nurtured, and taught (Heckman and Kautz 2013).
A recent survey of hiring managers suggests that they are at least as concerned by deficits in noncognitive skills as they are by lack of cognitive skills (PayScale 2016). While fewer than 20 percent of hiring managers said that recent graduates lacked the math skills needed for the work, more than half said that recent graduates lacked attention to detail. About equal shares of hiring managers saw deficiencies in writing proficiency and communication—the cognitive and noncognitive aspects, respectively, of a single skill. About a third of hiring managers said recent college graduates lacked data analysis and teamwork skills.
These economic facts make the case that development of noncognitive skills is critical for promoting success in the labor market, because:
• Today’s jobs demand more noncognitive skills than did jobs in the past (Fact 1);
• The labor market increasingly rewards noncognitive skills (Fact 2, Fact 3);
• Those with fewer noncognitive skills are being left behind (Fact 4).
Whereas the No Child Left Behind Act of 2001 put particular emphasis on increasing cognitive skills, the Every Student Succeeds Act that replaced it in 2015 requires that states include an additional indicator of student or school quality (e.g., chronic absenteeism). To this end, it is imperative that we leverage the potential to develop noncognitive skills in school settings, considering that:
• Noncognitive skill development interventions improve student achievement and reduce behavior-related problems (Fact 5);
• Preschool interventions emphasizing cognitive and noncognitive skill development have long-term economic benefits for participants (Fact 6);
• A teacher’s ability to improve noncognitive skills has more effect on graduation rates than does her ability to raise test scores (Fact 7).
The Hamilton Project was founded on the belief that long-term prosperity is best achieved by fostering both economic growth and broad participation in that growth, and that there is a role for effective government to make needed public investments. Ensuring that all young people are well prepared to flourish in the modern labor market helps to achieve both goals. As we learn more about cognitive and noncognitive skills, it is critical that we adjust our educational policies to make the best possible use of new evidence.
FIGURE A.
Noncognitive and Cognitive Skills by Parental Education
Source: Bureau of Labor Statistics (BLS) n.d.a; authors’ calculations.
Aver
age
nonc
ogni
tive
orco
gniti
ve s
kills
(per
cent
ile)
Noncognitive skills Cognitive skills
Less than high school High school At least one year of college0
10
20
30
40
50
60
70
The Hamilton Project • Brookings iii
Table of Contents
INTRODUCTION i
FACTS
1. The U.S. economy is demanding more noncognitive skills. 1
2. There are strong labor-market payoffs to both cognitive and noncognitive skills. 2
3. The labor market is increasingly rewarding noncognitive skills. 3
4. Those in the bottom quartile of noncognitive skills are only about one-third as likely 4 to complete a postsecondary degree as are those in the top quartile.
5. Noncognitive skill development interventions improve student achievement and reduce 5 behavior-related problems.
6. Preschool interventions emphasizing cognitive and noncognitive skill development 6 have long-term economic benefits for participants.
7. A teacher’s ability to improve noncognitive skills has more effect on graduation rates 7 than does her ability to raise test scores.
TECHNICAL APPENDIX 8
REFERENCES 10
RELEVANT HAMILTON PROJECT PAPERS 12

iv Seven Facts on Noncognitive Skills from Education to the Labor Market
The Hamilton Project • Brookings 1
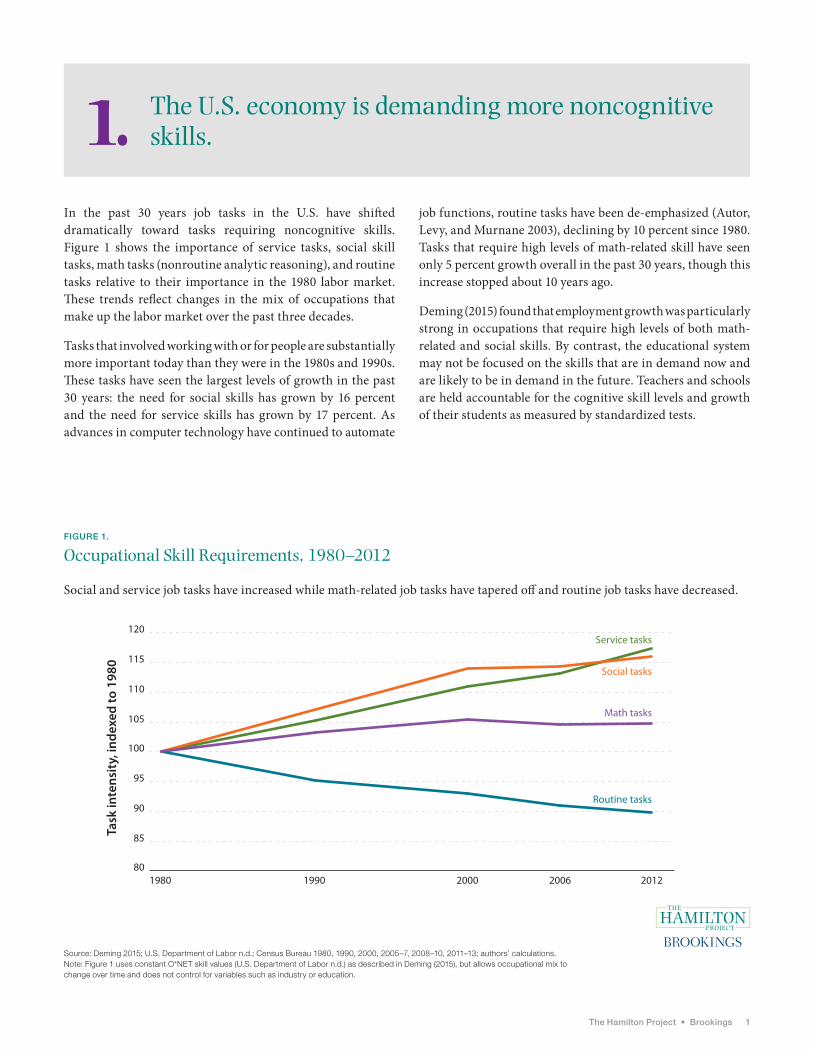
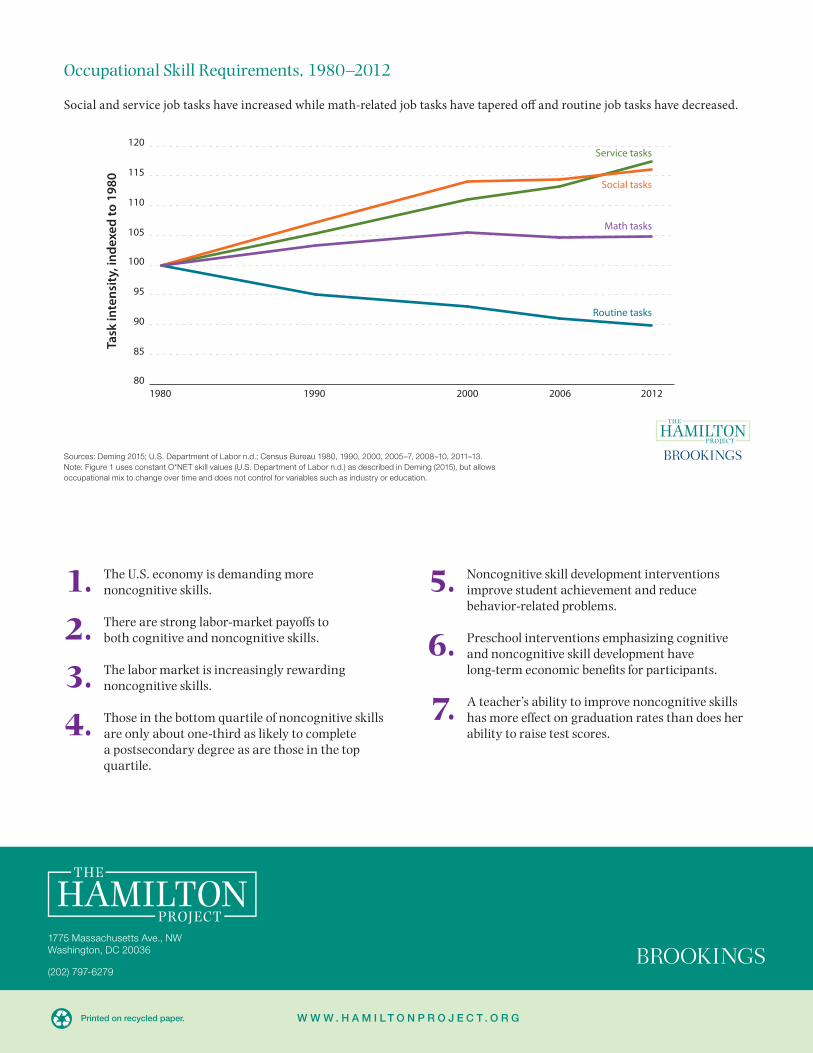
The U.S. economy is demanding more noncognitive skills.1.
In the past 30 years job tasks in the U.S. have shifted dramatically toward tasks requiring noncognitive skills. Figure 1 shows the importance of service tasks, social skill tasks, math tasks (nonroutine analytic reasoning), and routine tasks relative to their importance in the 1980 labor market. These trends reflect changes in the mix of occupations that make up the labor market over the past three decades.
Tasks that involved working with or for people are substantially more important today than they were in the 1980s and 1990s. These tasks have seen the largest levels of growth in the past 30 years: the need for social skills has grown by 16 percent and the need for service skills has grown by 17 percent. As advances in computer technology have continued to automate
job functions, routine tasks have been de-emphasized (Autor, Levy, and Murnane 2003), declining by 10 percent since 1980. Tasks that require high levels of math-related skill have seen only 5 percent growth overall in the past 30 years, though this increase stopped about 10 years ago.
Deming (2015) found that employment growth was particularly strong in occupations that require high levels of both math-related and social skills. By contrast, the educational system may not be focused on the skills that are in demand now and are likely to be in demand in the future. Teachers and schools are held accountable for the cognitive skill levels and growth of their students as measured by standardized tests.
FIGURE 1.
Occupational Skill Requirements, 1980–2012
Social and service job tasks have increased while math-related job tasks have tapered off and routine job tasks have decreased.
Source: Deming 2015; U.S. Department of Labor n.d.; Census Bureau 1980, 1990, 2000, 2005–7, 2008–10, 2011–13; authors’ calculations.Note: Figure 1 uses constant O*NET skill values (U.S. Department of Labor n.d.) as described in Deming (2015), but allows occupational mix to change over time and does not control for variables such as industry or education.
Task
inte
nsit
y, in
dexe
d to
198
0
80
100
120
95
115
90
110
85
105
1980 1990 2000 2006 2012
Service tasks
Social tasks
Math tasks
Routine tasks
2 Seven Facts on Noncognitive Skills from Education to the Labor Market
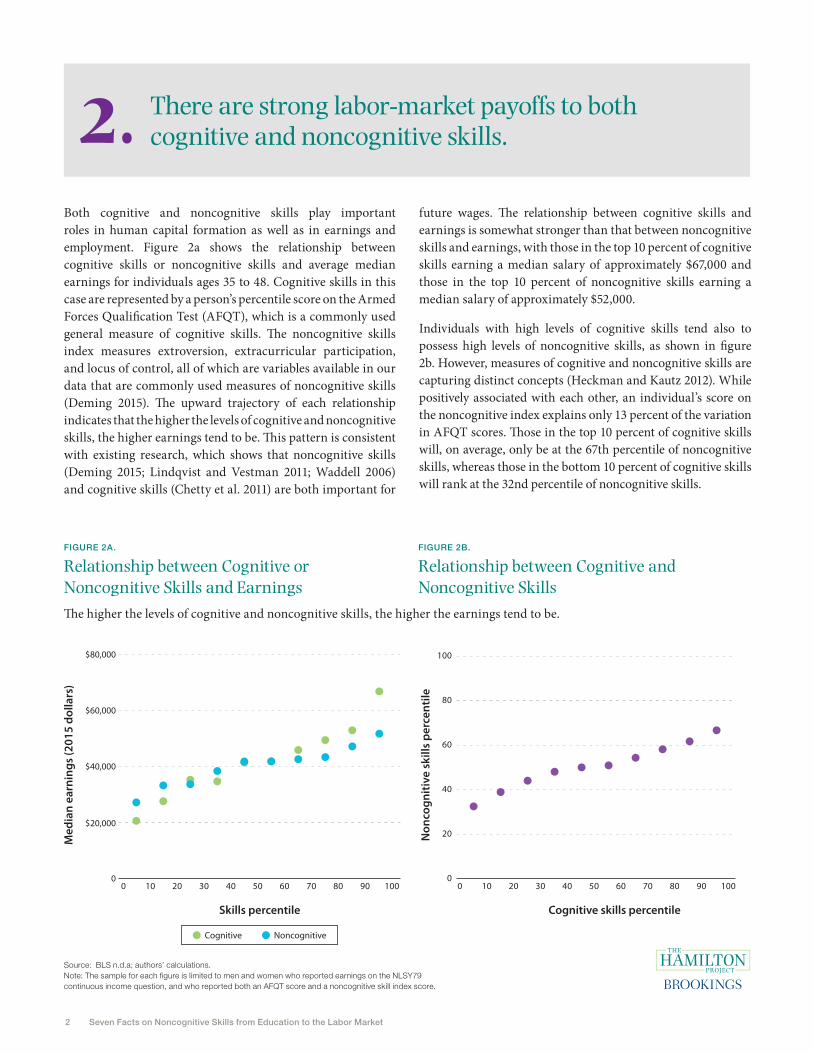
There are strong labor-market payoffs to both cognitive and noncognitive skills.2.
Both cognitive and noncognitive skills play important roles in human capital formation as well as in earnings and employment. Figure 2a shows the relationship between cognitive skills or noncognitive skills and average median earnings for individuals ages 35 to 48. Cognitive skills in this case are represented by a person’s percentile score on the Armed Forces Qualification Test (AFQT), which is a commonly used general measure of cognitive skills. The noncognitive skills index measures extroversion, extracurricular participation, and locus of control, all of which are variables available in our data that are commonly used measures of noncognitive skills (Deming 2015). The upward trajectory of each relationship indicates that the higher the levels of cognitive and noncognitive skills, the higher earnings tend to be. This pattern is consistent with existing research, which shows that noncognitive skills (Deming 2015; Lindqvist and Vestman 2011; Waddell 2006) and cognitive skills (Chetty et al. 2011) are both important for
future wages. The relationship between cognitive skills and earnings is somewhat stronger than that between noncognitive skills and earnings, with those in the top 10 percent of cognitive skills earning a median salary of approximately $67,000 and those in the top 10 percent of noncognitive skills earning a median salary of approximately $52,000.
Individuals with high levels of cognitive skills tend also to possess high levels of noncognitive skills, as shown in figure 2b. However, measures of cognitive and noncognitive skills are capturing distinct concepts (Heckman and Kautz 2012). While positively associated with each other, an individual’s score on the noncognitive index explains only 13 percent of the variation in AFQT scores. Those in the top 10 percent of cognitive skills will, on average, only be at the 67th percentile of noncognitive skills, whereas those in the bottom 10 percent of cognitive skills will rank at the 32nd percentile of noncognitive skills.
The higher the levels of cognitive and noncognitive skills, the higher the earnings tend to be.
Source: BLS n.d.a; authors’ calculations.Note: The sample for each figure is limited to men and women who reported earnings on the NLSY79 continuous income question, and who reported both an AFQT score and a noncognitive skill index score.
FIGURE 2A.
Relationship between Cognitive or Noncognitive Skills and Earnings
FIGURE 2B.
Relationship between Cognitive and Noncognitive Skills
Non
cogn
itive
ski
lls p
erce
ntile
Cognitive skills percentileSkills percentile
$20,000
$40,000
$60,000
$80,000
0
40
60
Med
ian
earn
ings
(201
5 do
llars
)
80
20
00 10 20 30 40 50 60 70 80 90 1000 10 20 30 40 50 60 70 80 90 100
100
Cognitive Noncognitive
Non
cogn
itive
ski
lls p
erce
ntile
Cognitive skills percentileSkills percentile
$20,000
$40,000
$60,000
$80,000
0
40
60
Med
ian
earn
ings
(201
5 do
llars
)
80
20
00 10 20 30 40 50 60 70 80 90 1000 10 20 30 40 50 60 70 80 90 100
100
Cognitive Noncognitive
The Hamilton Project • Brookings 3
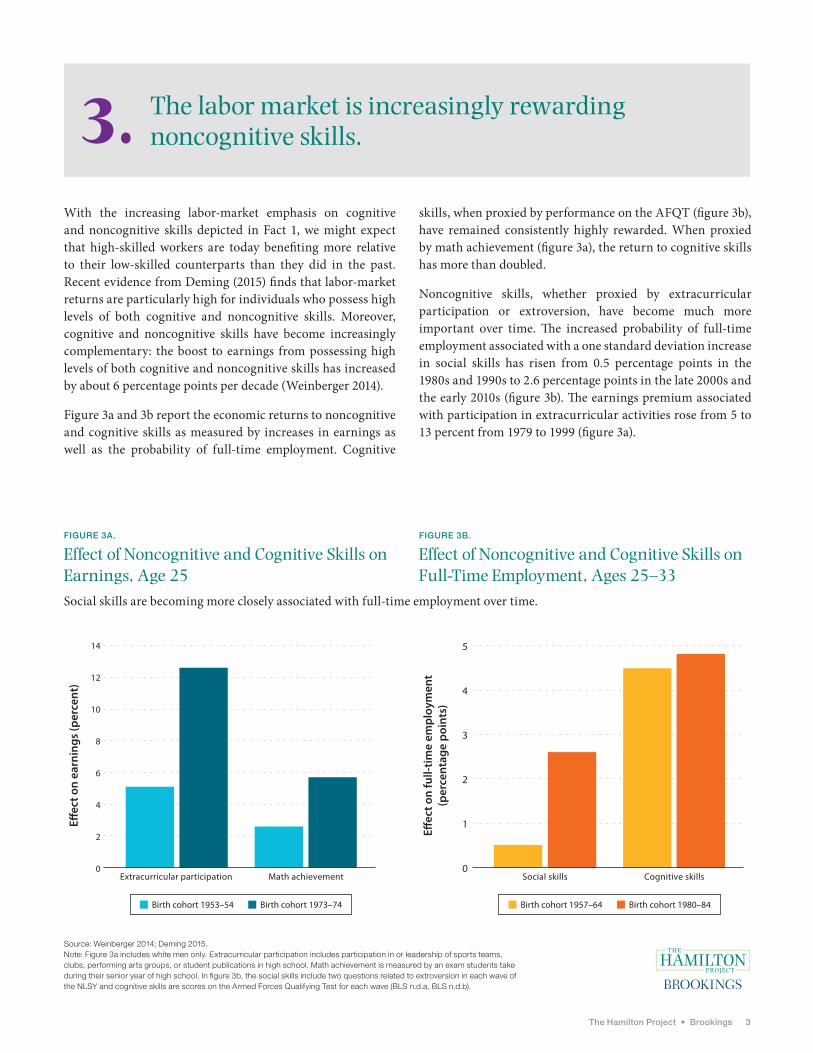
The labor market is increasingly rewarding noncognitive skills.3.
With the increasing labor-market emphasis on cognitive and noncognitive skills depicted in Fact 1, we might expect that high-skilled workers are today benefiting more relative to their low-skilled counterparts than they did in the past. Recent evidence from Deming (2015) finds that labor-market returns are particularly high for individuals who possess high levels of both cognitive and noncognitive skills. Moreover, cognitive and noncognitive skills have become increasingly complementary: the boost to earnings from possessing high levels of both cognitive and noncognitive skills has increased by about 6 percentage points per decade (Weinberger 2014).
Figure 3a and 3b report the economic returns to noncognitive and cognitive skills as measured by increases in earnings as well as the probability of full-time employment. Cognitive
skills, when proxied by performance on the AFQT (figure 3b), have remained consistently highly rewarded. When proxied by math achievement (figure 3a), the return to cognitive skills has more than doubled.
Noncognitive skills, whether proxied by extracurricular participation or extroversion, have become much more important over time. The increased probability of full-time employment associated with a one standard deviation increase in social skills has risen from 0.5 percentage points in the 1980s and 1990s to 2.6 percentage points in the late 2000s and the early 2010s (figure 3b). The earnings premium associated with participation in extracurricular activities rose from 5 to 13 percent from 1979 to 1999 (figure 3a).
Social skills are becoming more closely associated with full-time employment over time.
Source: Weinberger 2014; Deming 2015.Note: Figure 3a includes white men only. Extracurricular participation includes participation in or leadership of sports teams, clubs, performing arts groups, or student publications in high school. Math achievement is measured by an exam students take during their senior year of high school. In figure 3b, the social skills include two questions related to extroversion in each wave of the NLSY and cognitive skills are scores on the Armed Forces Qualifying Test for each wave (BLS n.d.a, BLS n.d.b).
FIGURE 3A.
Effect of Noncognitive and Cognitive Skills on Earnings, Age 25
FIGURE 3B.
Effect of Noncognitive and Cognitive Skills on Full-Time Employment, Ages 25–33
E�ec
t on
full-
time
empl
oym
ent
(per
cent
age
poin
ts)
E�ec
t on
earn
ings
(per
cent
)
Extracurricular participation Math achievement Cognitive skillsSocial skills
Birth cohort 1953–54 Birth cohort 1973–74
0
2
4
6
8
10
12
14
0
1
2
3
4
5
Birth cohort 1957–64 Birth cohort 1980–84
4 Seven Facts on Noncognitive Skills from Education to the Labor Market
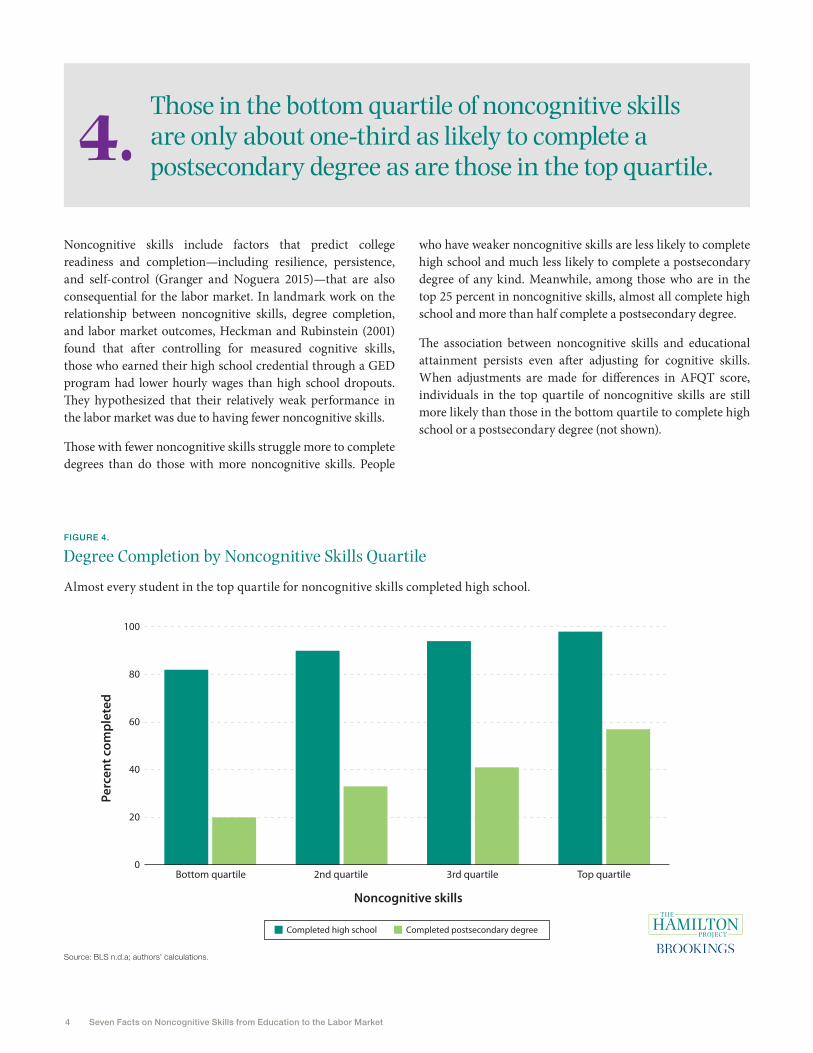
Those in the bottom quartile of noncognitive skills are only about one-third as likely to complete a postsecondary degree as are those in the top quartile.
4.Noncognitive skills include factors that predict college readiness and completion—including resilience, persistence, and self-control (Granger and Noguera 2015)—that are also consequential for the labor market. In landmark work on the relationship between noncognitive skills, degree completion, and labor market outcomes, Heckman and Rubinstein (2001) found that after controlling for measured cognitive skills, those who earned their high school credential through a GED program had lower hourly wages than high school dropouts. They hypothesized that their relatively weak performance in the labor market was due to having fewer noncognitive skills.
Those with fewer noncognitive skills struggle more to complete degrees than do those with more noncognitive skills. People
who have weaker noncognitive skills are less likely to complete high school and much less likely to complete a postsecondary degree of any kind. Meanwhile, among those who are in the top 25 percent in noncognitive skills, almost all complete high school and more than half complete a postsecondary degree.
The association between noncognitive skills and educational attainment persists even after adjusting for cognitive skills. When adjustments are made for differences in AFQT score, individuals in the top quartile of noncognitive skills are still more likely than those in the bottom quartile to complete high school or a postsecondary degree (not shown).
FIGURE 4.
Degree Completion by Noncognitive Skills Quartile
Almost every student in the top quartile for noncognitive skills completed high school.
Source: BLS n.d.a; authors’ calculations.
Noncognitive skills
Perc
ent c
ompl
eted
Completed postsecondary degreeCompleted high school
Bottom quartile 2nd quartile 3rd quartile Top quartile0
20
40
60
80
100
The Hamilton Project • Brookings 5
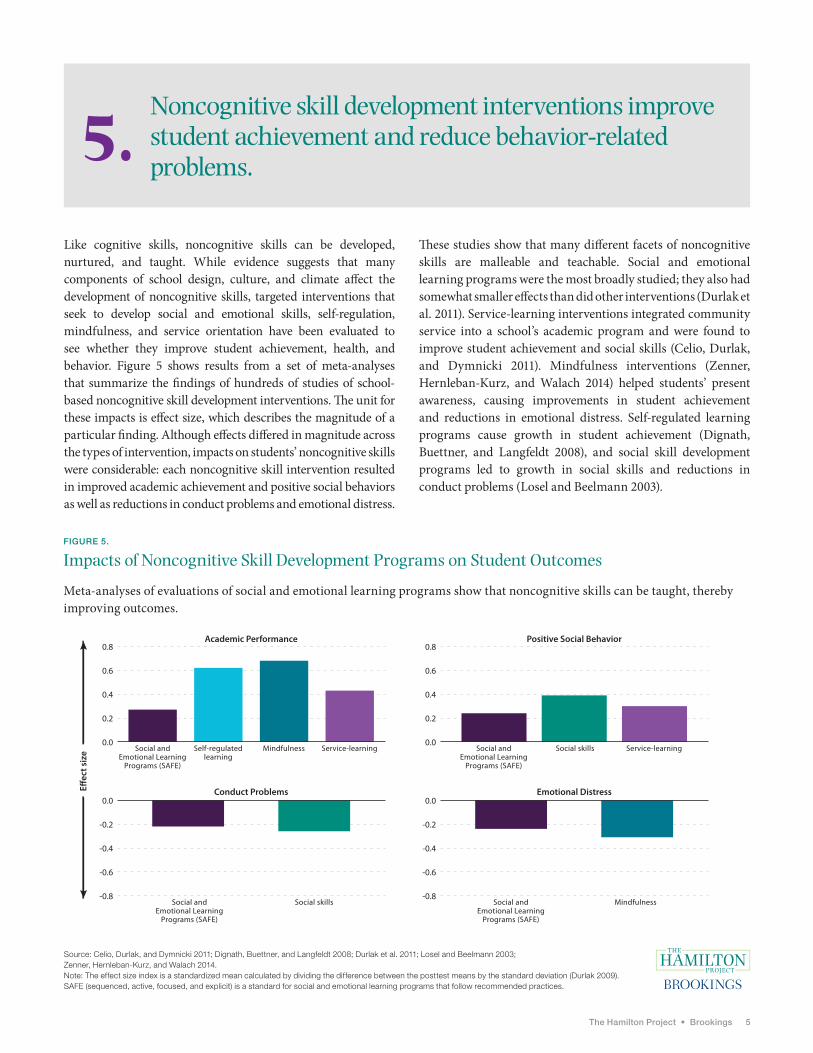
Noncognitive skill development interventions improve student achievement and reduce behavior-related problems.
5.Like cognitive skills, noncognitive skills can be developed, nurtured, and taught. While evidence suggests that many components of school design, culture, and climate affect the development of noncognitive skills, targeted interventions that seek to develop social and emotional skills, self-regulation, mindfulness, and service orientation have been evaluated to see whether they improve student achievement, health, and behavior. Figure 5 shows results from a set of meta-analyses that summarize the findings of hundreds of studies of school-based noncognitive skill development interventions. The unit for these impacts is effect size, which describes the magnitude of a particular finding. Although effects differed in magnitude across the types of intervention, impacts on students’ noncognitive skills were considerable: each noncognitive skill intervention resulted in improved academic achievement and positive social behaviors as well as reductions in conduct problems and emotional distress.
These studies show that many different facets of noncognitive skills are malleable and teachable. Social and emotional learning programs were the most broadly studied; they also had somewhat smaller effects than did other interventions (Durlak et al. 2011). Service-learning interventions integrated community service into a school’s academic program and were found to improve student achievement and social skills (Celio, Durlak, and Dymnicki 2011). Mindfulness interventions (Zenner, Hernleban-Kurz, and Walach 2014) helped students’ present awareness, causing improvements in student achievement and reductions in emotional distress. Self-regulated learning programs cause growth in student achievement (Dignath, Buettner, and Langfeldt 2008), and social skill development programs led to growth in social skills and reductions in conduct problems (Losel and Beelmann 2003).
FIGURE 5.
Impacts of Noncognitive Skill Development Programs on Student Outcomes
Meta-analyses of evaluations of social and emotional learning programs show that noncognitive skills can be taught, thereby improving outcomes.
Source: Celio, Durlak, and Dymnicki 2011; Dignath, Buettner, and Langfeldt 2008; Durlak et al. 2011; Losel and Beelmann 2003; Zenner, Hernleban-Kurz, and Walach 2014.Note: The effect size index is a standardized mean calculated by dividing the difference between the posttest means by the standard deviation (Durlak 2009). SAFE (sequenced, active, focused, and explicit) is a standard for social and emotional learning programs that follow recommended practices.
Social andEmotional Learning
Programs (SAFE)
Self-regulatedlearning
Mindfulness Service-learning Social andEmotional Learning
Programs (SAFE)
Social skills Service-learning
Academic Performance
Conduct Problems
Positive Social Behavior
E�ec
t siz
e
Emotional Distress
Social andEmotional Learning
Programs (SAFE)
Social skills Social andEmotional Learning
Programs (SAFE)
Mindfulness-0.8
-0.4
-0.2
0.0
-0.8
-0.6-0.6
-0.4
-0.2
0.0
0.0
0.2
0.4
0.6
0.8
0.0
0.2
0.4
0.6
0.8
6 Seven Facts on Noncognitive Skills from Education to the Labor Market
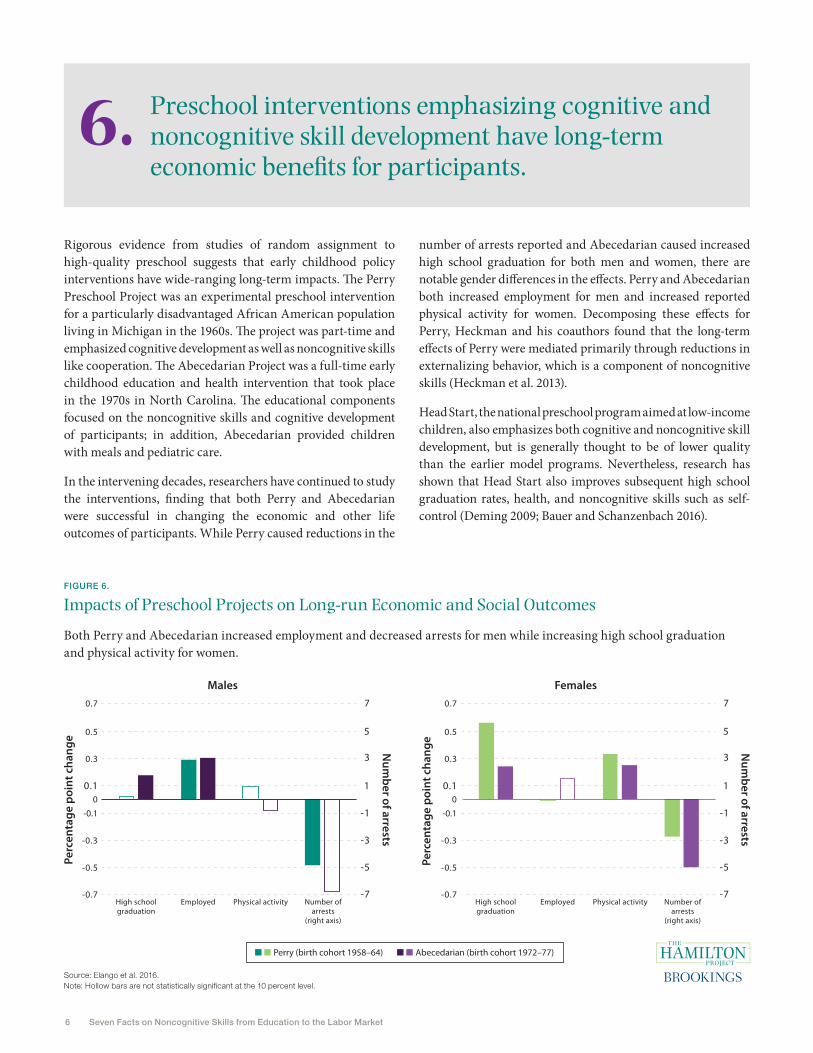
Preschool interventions emphasizing cognitive and noncognitive skill development have long-term economic benefits for participants.
6.
Rigorous evidence from studies of random assignment to high-quality preschool suggests that early childhood policy interventions have wide-ranging long-term impacts. The Perry Preschool Project was an experimental preschool intervention for a particularly disadvantaged African American population living in Michigan in the 1960s. The project was part-time and emphasized cognitive development as well as noncognitive skills like cooperation. The Abecedarian Project was a full-time early childhood education and health intervention that took place in the 1970s in North Carolina. The educational components focused on the noncognitive skills and cognitive development of participants; in addition, Abecedarian provided children with meals and pediatric care.
In the intervening decades, researchers have continued to study the interventions, finding that both Perry and Abecedarian were successful in changing the economic and other life outcomes of participants. While Perry caused reductions in the
number of arrests reported and Abecedarian caused increased high school graduation for both men and women, there are notable gender differences in the effects. Perry and Abecedarian both increased employment for men and increased reported physical activity for women. Decomposing these effects for Perry, Heckman and his coauthors found that the long-term effects of Perry were mediated primarily through reductions in externalizing behavior, which is a component of noncognitive skills (Heckman et al. 2013).
Head Start, the national preschool program aimed at low-income children, also emphasizes both cognitive and noncognitive skill development, but is generally thought to be of lower quality than the earlier model programs. Nevertheless, research has shown that Head Start also improves subsequent high school graduation rates, health, and noncognitive skills such as self-control (Deming 2009; Bauer and Schanzenbach 2016).
FIGURE 6.
Impacts of Preschool Projects on Long-run Economic and Social Outcomes
Both Perry and Abecedarian increased employment and decreased arrests for men while increasing high school graduation and physical activity for women.
Source: Elango et al. 2016.Note: Hollow bars are not statistically significant at the 10 percent level.
0
7
5
3
1
-1
-3
-5
-7High schoolgraduation
Employed Physical activity Number ofarrests
(right axis)
High schoolgraduation
Employed Physical activity Number ofarrests
(right axis)
Males Females
Perc
enta
ge p
oint
cha
nge
Perc
enta
ge p
oint
cha
nge
Num
ber of arrests
Num
ber of arrests
0.3
0.5
0.7
Perry (birth cohort 1958–64) Abecedarian (birth cohort 1972–77)
-0.1
-0.3
-0.5
-0.7
0
7
5
3
1
-1
-3
-5
-7
0.3
0.5
0.7
-0.1
-0.3
-0.5
-0.7
0.1 0.1
The Hamilton Project • Brookings 7
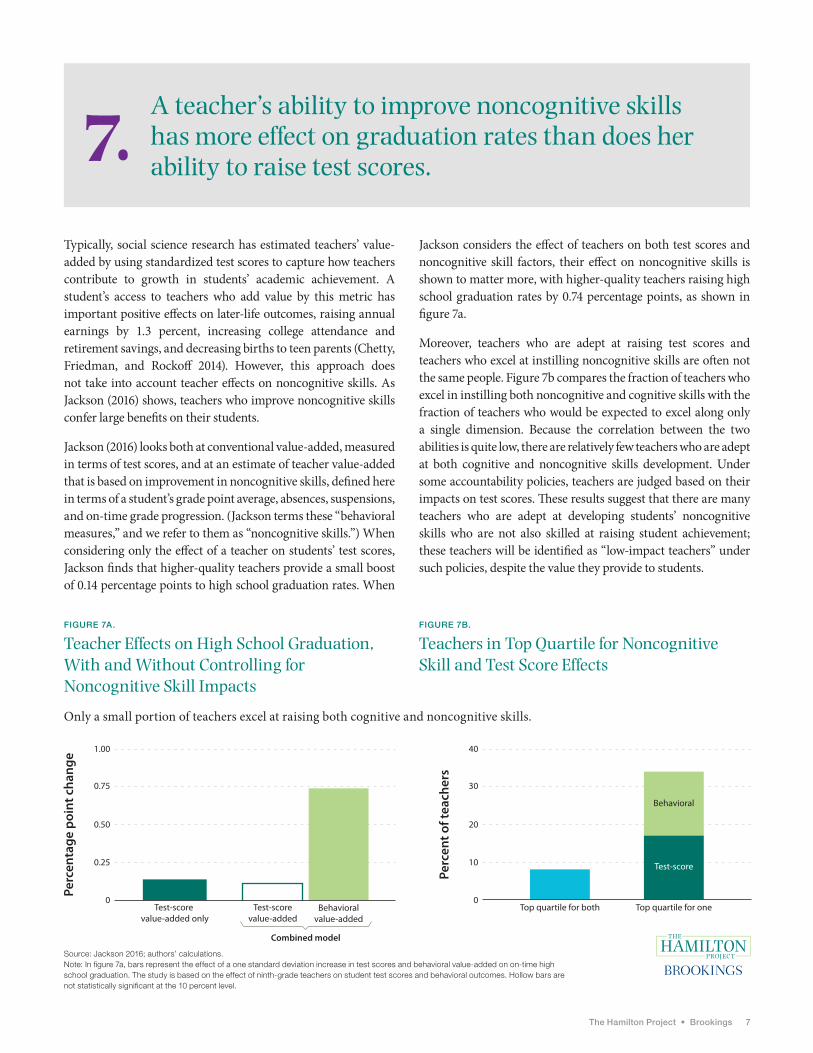
A teacher’s ability to improve noncognitive skills has more effect on graduation rates than does her ability to raise test scores.
7.Typically, social science research has estimated teachers’ value-added by using standardized test scores to capture how teachers contribute to growth in students’ academic achievement. A student’s access to teachers who add value by this metric has important positive effects on later-life outcomes, raising annual earnings by 1.3 percent, increasing college attendance and retirement savings, and decreasing births to teen parents (Chetty, Friedman, and Rockoff 2014). However, this approach does not take into account teacher effects on noncognitive skills. As Jackson (2016) shows, teachers who improve noncognitive skills confer large benefits on their students.
Jackson (2016) looks both at conventional value-added, measured in terms of test scores, and at an estimate of teacher value-added that is based on improvement in noncognitive skills, defined here in terms of a student’s grade point average, absences, suspensions, and on-time grade progression. (Jackson terms these “behavioral measures,” and we refer to them as “noncognitive skills.”) When considering only the effect of a teacher on students’ test scores, Jackson finds that higher-quality teachers provide a small boost of 0.14 percentage points to high school graduation rates. When
Jackson considers the effect of teachers on both test scores and noncognitive skill factors, their effect on noncognitive skills is shown to matter more, with higher-quality teachers raising high school graduation rates by 0.74 percentage points, as shown in figure 7a.
Moreover, teachers who are adept at raising test scores and teachers who excel at instilling noncognitive skills are often not the same people. Figure 7b compares the fraction of teachers who excel in instilling both noncognitive and cognitive skills with the fraction of teachers who would be expected to excel along only a single dimension. Because the correlation between the two abilities is quite low, there are relatively few teachers who are adept at both cognitive and noncognitive skills development. Under some accountability policies, teachers are judged based on their impacts on test scores. These results suggest that there are many teachers who are adept at developing students’ noncognitive skills who are not also skilled at raising student achievement; these teachers will be identified as “low-impact teachers” under such policies, despite the value they provide to students.
Only a small portion of teachers excel at raising both cognitive and noncognitive skills.
Source: Jackson 2016; authors’ calculations. Note: In figure 7a, bars represent the effect of a one standard deviation increase in test scores and behavioral value-added on on-time high school graduation. The study is based on the effect of ninth-grade teachers on student test scores and behavioral outcomes. Hollow bars are not statistically significant at the 10 percent level.
FIGURE 7A.
Teacher Effects on High School Graduation, With and Without Controlling for Noncognitive Skill Impacts
FIGURE 7B.
Teachers in Top Quartile for Noncognitive Skill and Test Score Effects
Combined model
Perc
enta
ge p
oint
cha
nge
Perc
ent o
f tea
cher
s
Test-score value-added only
Top quartile for both Top quartile for oneTest-scorevalue-added
Behavioralvalue-added
0
0.25
0.50
0.75
1.00
0
10
20
30
40
Behavioral
Test-score
8 Seven Facts on Noncognitive Skills from Education to the Labor Market
Technical Appendix
Figure A. Noncognitive and Cognitive Skills by Parental EducationData come from the National Longitudinal Survey of Youth 1979. Cognitive skills are measured by the Armed Forces Qualification Test. The noncognitive skills measure is a combined index of the Rotter Locus of Control scale, the Rosenberg Self-Esteem scale, and Deming’s (2015) social skills index; these scales and index aim to measure attitudes about work and reward, self-esteem, and general social skills, respectively. Parental education refers to the highest grade attained by either parent, which was asked of respondents in 1979 (respondents were ages 12 to 17).
Fact 1. The U.S. economy is demanding more noncognitive skills.Figure 1. Occupational Skill Requirements, 1980–2012We thank David Deming for sharing his data and programs that have allowed us to assign to occupations the values for service tasks, social tasks, math tasks, and routine tasks (Deming 2015). Service tasks are represented by the average of values for assisting and caring for others and service orientation. Social tasks are the average of values for social perceptiveness, coordination, persuasion, and negotiation. Math tasks represent mathematical reasoning ability, mathematics knowledge, and mathematics skills. Routine tasks measure the work context of occupations, specifically the degree of automation and importance of repeating same tasks. See Deming (2015) for additional detail. Task intensity calculations employ constant 1998 O*NET skill values, but reflect the occupational composition of employment in a given year and do not control for variables such as industry or education. Values for each task intensity are indexed to 100 in 1980.
Fact 2. There are strong labor-market payoffs to both cognitive and noncognitive skills.Figure 2A. Relationship between Cognitive or Noncognitive Skills and Earnings; Figure 2B. Relationship between Cognitive and Noncognitive SkillsThe sample for these calculations is limited to men and women who reported positive earnings on the NLSY79 continuous income question and who reported both an AFQT score and a noncognitive skill index score. The Armed Forces Qualification Test (AFQT) is a general measure of cognitive skills and is used to determine eligibility for enlistment in
the armed forces. Respondents were ages 16 to 24 when they reported AFQT scores in 1981.
The noncognitive skills measure is a combined index of the Rotter Locus of Control scale, the Rosenberg Self-Esteem scale, and Deming’s (2015) social skills index; these scales and index aim to measure attitudes about work and reward, self-esteem, and general social skills, respectively. In figure 2a the median of individual earnings of respondents is averaged over 2000, 2002, and 2004, when the respondents were ages 35 to 48. Median earnings are presented by decile of either AFQT score or the noncognitive skills index. For both figures the horizontal axis is the decile of each skill measure such that the first bin contains observations in the 0th to 10th percentiles, the second bin contains observations in the 11th to 20th percentiles, and so forth. In figure 2b each observation’s noncognitive skill index score is converted to a percentile, and the mean percentile is shown for each decile of AFQT scores.
Fact 3. The labor market is increasingly rewarding noncognitive skills.Figure 3A. Effect of Noncognitive and Cognitive Skills on Earnings, Age 25; Figure 3B. Effect of Noncognitive and Cognitive Skills on Full-Time Employment, Ages 25–33For figure 3a see Weinberger (2014) for additional information. The data are from the National Center for Education Statistics (NCES) longitudinal studies of high school students (including the National Longitudinal Study of the High School Class of 1972 and the National Education Longitudinal Study of 1988). The sample in Weinberger’s study is restricted to white men. Extracurricular participation includes participation in or leadership of sports teams, clubs, performing arts groups, or student publications in high school. Math achievement is measured by an exam students take during their senior year of high school. Results are from separate regressions for each cohort. For figure 3b see Deming (2015) particularly table 7, for additional information. The sample is restricted to respondents ages 25 to 33 in the NLSY79 and NLSY97 (BLS n.d.a., n.d.b.). For the 1979 cohort the social skills questions were, “Thinking about when you were six years old, would you describe yourself as extremely shy, somewhat shy, somewhat outgoing, or extremely outgoing?” and “Thinking about yourself as an adult, would you describe yourself as extremely shy, somewhat shy, somewhat outgoing, or extremely outgoing?” For the 1997
The Hamilton Project • Brookings 9
cohort, the social skills request for information was, “Using a scale from 1 to 7, where 1 means disagree strongly and 7 means agree strongly, please rate how well each pair of traits applies to you, even if one characteristic applies more strongly than the other: extroverted, enthusiastic; reserved, quiet.”
Fact 4. Those in the bottom quartile of noncognitive skills are only about one-third as likely to complete a postsecondary degree as are those in the top quartile.Figure 4. Degree Completion by Noncognitive Skill QuartileData for figure 4 are from NLSY79 (BLS n.d.a.). “Completed postsecondary degree” indicates completion of an associates, bachelors, masters, doctoral, or professional degree. See technical appendix entry for Fact 2 for details of the noncognitive skills index. Noncognitive skill scores are divided into quartiles, and percent completion of high school diploma and postsecondary degrees are calculated for each quartile.
Fact 5. Noncognitive skill development interventions improve student achievement and reduce behavior-related problems.Figure 5. Impacts of Noncognitive Skill Development Programs on Student OutcomesThe effect size index is a standardized mean calculated by dividing the difference between the posttest means by the standard deviation (Durlak 2009). This is the common unit of measurement for each represented paper. Effect sizes are calculated as magnitudes with positive values representing the desired outcomes, but are reversed to negative when appropriate for ease of interpretation. For additional details
on each meta-analysis, see Celio, Durlak, and Dymnicki (2011); Dignath, Buettner, and Langfeldt (2008); Durlak et al. (2011); Losel and Beelmann (2003); Zenner, Hernleban-Kurz, and Walach (2014).
Fact 6. Preschool interventions emphasizing cognitive and noncognitive skill development have long-term economic benefits for participants.Figure 6. Impacts of Preschool Projects on Long-run Economic and Social OutcomesOutcomes selected were common to evaluations of both Perry and Abecedarian based on Heckman et al. (2016, figure 7). For additional information, please refer to Campbell et al. (2014), Heckman et al. (2010), and Heckman et al. (2016).
Fact 7. A teacher’s ability to improve noncognitive skills has more effect on graduation rates than her ability to raise test scores.Figure 7A. Teacher Effects on High School Graduation, With and Without Controlling for Noncognitive Skill Impacts; Figure 7B. Teachers in Top Quartile for Noncognitive Skill and Test Score EffectsFor figure 7a, Jackson (2016, table 6, Columns 1 and 3) reports the relevant results. For figure 7b we use the correlation (0.164) between teacher effects on test scores and teacher effects on the behavioral factor reported in Jackson (2016) and further assume a bivariate normal distribution of the two teacher effects. This may differ from the actual distribution of the teacher effects estimated in Jackson (2016).
10 Seven Facts on Noncognitive Skills from Education to the Labor Market
References
Autor, David H., Frank Levy, and Richard J. Murnane. 2003. “The Skill Content of Recent Technological Change: An Empirical Exploration.” Quarterly Journal of Economics 118 (4): 1279–1333.
Bureau of Labor Statistics (BLS). n.d.a. “1979 National Longitudinal Survey of Youth.” National Longitudinal Surveys, Bureau of Labor Statistics, U.S. Department of Labor, Washington, DC.
———. n.d.b. “1997 National Longitudinal Survey of Youth.” National Longitudinal Surveys, Bureau of Labor Statistics, U.S. Department of Labor, Washington, DC.
Campbell, Frances, Gabriella Conti, James J. Heckman, Seong Hyeok Moon, Rodrigo Pinto, Elizabeth Pungello, and Yi Pan. 2014. “Early Childhood Investments Substantially Boost Adult Health.” Science 343 (6178): 1478–85.
Celio, Christine I., Joseph Durlak, and Allison Dymnicki. 2011. “A Meta-Analysis of the Impact of Service-Learning on Students.” Journal of Experiential Education 34 (2): 164–81.
Census Bureau. 1980. “Decennial Census.” Census Bureau, U.S. Department of Commerce, Washington, DC.
———. 1990. “Decennial Census.” Census Bureau, U.S. Department of Commerce, Washington, DC.
———. 2000. “Decennial Census.” Census Bureau, U.S. Department of Commerce, Washington, DC.
———. 2005–7. “American Community Survey 3-Year Estimates.” Census Bureau, U.S. Department of Commerce, Washington, DC.
———. 2008–10. “American Community Survey 3-Year Estimates.” Census Bureau, U.S. Department of Commerce, Washington, DC.
———. 2011–13. “American Community Survey 3-Year Estimates.” Census Bureau, U.S. Department of Commerce, Washington, DC.
Chetty, Raj, John N. Friedman, Nathaniel Hilger, Emmanuel Saez, Diane Whitmore Schanzenbach, and Danny Yagan. 2011. “How Does Your Kindergarten Classroom Affect Your Earnings? Evidence from Project STAR.” Quarterly Journal of Economics 126 (4): 1593–1660.
Chetty, Raj, John N. Friedman, and Jonah E. Rockoff. 2014. “Measuring the Impacts of Teachers II: Teacher Value-Added and Student Outcomes in Adulthood.” American Economic Review 104 (9): 2633–79.
Dee, Thomas S., and Brian Jacob. 2011. “The Impact of No Child Left Behind on Student Achievement.” Journal of Policy Analysis and Management 30 (3): 418–46.
Deming, David J. 2015. “The Growing Importance of Social Skills in the Labor Market.” Working Paper No. 21472, National Bureau of Economic Research, Cambridge, MA.
Dignath, Charlotte, Gerhand Buettner, and Hans-Peter Langfeldt. 2008. “How Can Primary School Students Learn Self-Regulated Learning Strategies Most Effectively? A Meta-analysis on Self-Regulation Training Programmes.” Educational Research Review 3 (2): 101–29.
Duckworth, Angela L., and David Scott Yeager. 2015. “Measurement Matters: Assessing Personal Qualities Other Than Cognitive Ability for Educational Purposes.” Educational Researcher 44 (4): 237–51.
Durlak, Joseph A. 2009. “How to Select, Calculate, and Interpret Effect Sizes.” Journal of Pediatric Psychology 34 (9): 917–28.
Durlak, Joseph A., Allison B. Dymnicki, Rebecca D. Taylor, Roger P. Weissberg, and Kriston B. Schellinger. 2011. “The Impact of Enhancing Students’ Social and Emotional Learning: A Meta-Analysis of School-Based Universal Interventions.” Child Development 82 (1): 405–32.
Elango, Sneha, Jorge Luis Garcia, James J. Heckman, and Andres P. Hojman. 2016. “Early Childhood Education.” In Economics of Means-Tested Transfer Programs in the United States, vol. 2, edited by Robert Moffitt. Chicago: University of Chicago Press.
Every Student Succeeds Act (ESSA) of 2015, Pub. L. 114–95 (2015).
Granger, Lindsay R., and Pedro A. Noguera. 2015. “College Readiness and Urban Schools.” Handbook of Urban Educational Leadership: 470-79.
Heckman, James J., and Tim Kautz. 2012. “Hard Evidence on Soft Skills.” Working Paper No. 18121, National Bureau of Economic Research, Cambridge, MA.
———. 2013. “Fostering and Measuring Skills: Interventions that Improve Character and Cognition.” Working Paper No. 19656, National Bureau of Economic Research, Cambridge, MA.
Heckman, James, Seong Hyeok Moon, Rodrigo Pinto, Peter Savelyev, and Adam Yavitz. 2010. “Analyzing Social Experiments as Implemented: A Reexamination of the Evidence from the HighScope Perry Preschool Program.” Quantitative Economics 1 (1): 1–46.
Heckman, James, Rodrigo Pinto, and Peter Savelyev. 2013. “Understanding the Mechanisms Through Which an Influential Early Childhood Program Boosted Adult Outcomes.” American Economic Review 103 (6): 2052–86.
The Hamilton Project • Brookings 11
Heckman, James, and Yona Rubenstein. 2001. “The Importance of Noncognitive Skills: Lessons from the GED Testing Program.” American Economic Review 91 (2): 145–149.
Jackson, Kirabo C. 2016. “What Do Test Scores Miss? The Importance of Teacher Effects on Non-Test Score Outcomes.” Working Paper No. 22226, National Bureau of Economic Research, Cambridge, MA.
Knudsen, Eric, James J. Heckman, Judy Cameron, and Jack P. Shonkoff. 2006. “Economic, Neurobiological and Behavioral Perspectives on Building America’s Future Workforce.” Proceedings of the National Academy of Sciences 103 (27): 10155-62.
Lindqvist, Erik, and Roine Vestman. 2011. “The Labor Market Returns to Cognitive and Noncognitive Ability: Evidence from the Swedish Enlistment.” American Economic Journal: Applied Economics 3 (1): 101–28.
Losel, Friedrich, and Andreas Beelmann. 2003. “Effects of Child Skills Training in Preventing Antisocial Behavior: A Systematic Review of Randomized Evaluations.” Annals of the American Academy 587 (1): 84–109.
Neal, Derek, and Diane Whitmore Schanzenbach. 2010. “Left Behind by Design: Proficiency Counts and Test-Based Accountability.” Review of Economics and Statistics 92 (2): 263–83.
No Child Left Behind Act of 2001, Pub. L. 107-110 (2002).
U.S. Department of Labor. n.d. “Occupational Information Network (O*NET).” Employment and Training Administration, U.S. Department of Labor, Washington, DC.
PayScale, Inc. 2016. “PayScale and Future Workplace Release 2016 Workforce-Skills Preparedness Report.” PayScale Inc., Seattle, WA.
Waddell, Glen R. 2006. “Labor-Market Consequences of Poor Attitude and Low Self-Esteem in Youth.” Economic Inquiry 44 (1): 69–97.
Weinberger, Catherine. 2014. “The Increasing Complementarity between Cognitive and Social Skills.” Review of Economics and Statistics 96 (5): 849–61.
Wong, Manyee, Thomas D. Cook, and Peter Steiner. 2009. “No Child Left Behind: An Interim Evaluation of Its Effects on Learning Using Two Interrupted Time Series Each with Its Own Non-Equivalent Comparison Series.” Working Paper No. 09-11, Institute for Policy Research, Northwestern University, Evanston, IL.
Zenner, Charlotte, Solveig Hernleban-Kurz, and Harald Walach. 2014. “Mindfulness-Based Interventions in Schools: A Systematic Review and Meta-Analysis.” Frontiers in Psychology 5: 603.
12 Seven Facts on Noncognitive Skills from Education to the Labor Market
POLICY PROPOSALS ON COGNITIVE AND
NONCOGNITIVE SKILLS
• “Increasing Targeting, Flexibility, and Transparency in Title I of the Elementary and Secondary Education Act to Help Disadvantaged Students” Nora E. Gordon proposes reforms to make the Title I formula more transparent, streamlined and progressive by distributing additional resources to the neediest areas. In addition, she suggests improvements in federal guidance and fiscal compliance outreach efforts so that local districts understand the flexibility they have to spend the resources effectively.
• “Providing Disadvantaged Workers with Skills to Succeed in the Labor Market”Sheena McConnell, Irma Perez-Johnson, and Jillian Berk offer proposals to help disadvantaged adult workers obtain the skills necessary to succeed in the labor market. The authors call for an increase in funding in the Workforce Investment Act Adult program. They also propose a series of four steps that state and local workforce boards can take to better take advantage of grant opportunities to test the proposed strategies aimed at improving outcomes for trainees.
• “Expanding Summer Employment Opportunities for Low-Income Youth”Amy Ellen Schwartz and Jacob Leos-Urbel propose that the federal government make grants to state and local governments to work with local community-based organizations (CBOs) on the expansion of summer job programs. Targeting low-income youth ages sixteen to nineteen (enrolled in or graduated from high school), these expanded programs would provide employment and training to young people who currently face many barriers to entering the workforce.
ECONOMIC FACTS AND FRAMING PAPERS
• “Fourteen Economic Facts on Education and Economic Opportunity”Diane Whitmore Schanzenbach, David Boddy, Megan Mumford, and Greg Nantz There are many factors at work in determining educational outcomes; some of these are more easily addressed by policy reforms than others, and not all can be addressed directly within the K–12 education system. To illustrate the payoffs from increasing educational attainment, the challenges faced by our nation’s K–12 schools, and the promise of targeted childhood interventions, The Hamilton Project offers the following fourteen facts on education and economic opportunity.
• “A Dozen Economic Facts About K-12 Education”Michael Greenstone, Max Harris, Karen Li, Adam Looney, and Jeremy PatashnikEducation is a powerful force for promoting opportunity and growth. It is not surprising that an individual’s educational attainment is highly correlated with her income. What might be less obvious is that education is also a significant determinant of many other very important outcomes, including whether individuals marry, whether their children grow up in households with two parents, and even how long they will live. This paper explores both the condition of education in the United States and the economic evidence on several promising K-12 interventions that could improve the lives of Americans.
• “The Future of Work in the Age of the Machine”Melissa Kearney, Brad Hershbein, and David Boddy Recent developments in technology, including the proliferation of smart machines, networked communication, and digitization, have the potential to transform the economy in groundbreaking ways. In this framing paper, The Hamilton Project explores the debate about how computerization and machines might change the future of work and the economy, and what challenges and opportunities this presents for public policy.
Relevant Hamilton Project Papers on Cognitive and Noncognitive Skills
ADVISORY COUNCIL
GEORGE A. AKERLOFKoshland Professor of EconomicsUniversity of California, Berkeley
ROGER C. ALTMANFounder & Executive ChairmanEvercore
KAREN ANDERSONSenior Advisor, Results for AmericaExecutive Director, Results for All
ALAN S. BLINDERGordon S. Rentschler Memorial Professor of Economics & Public AffairsPrinceton University
ROBERT CUMBYProfessor of EconomicsGeorgetown University
STEVEN A. DENNINGChairmanGeneral Atlantic
JOHN DEUTCHInstitute ProfessorMassachusetts Institute of Technology
CHRISTOPHER EDLEY, JR.Co-President and Co-FounderThe Opportunity Institute
BLAIR W. EFFRONPartnerCenterview Partners LLC
DOUGLAS W. ELMENDORFDeanHarvard Kennedy School
JUDY FEDERProfessor & Former DeanMcCourt School of Public PolicyGeorgetown University
ROLAND FRYERHenry Lee Professor of EconomicsHarvard University
MARK T. GALLOGLYCofounder & Managing PrincipalCenterbridge Partners
TED GAYERVice President & DirectorEconomic StudiesThe Brookings Institution
TIMOTHY F. GEITHNERPresidentWarburg Pincus
RICHARD GEPHARDTPresident & Chief Executive OfficerGephardt Group Government Affairs
ROBERT GREENSTEINFounder & PresidentCenter on Budget and Policy Priorities
MICHAEL GREENSTONEThe Milton Friedman Professor in EconomicsDirectorEnergy Policy Institute at ChicagoUniversity of Chicago
GLENN H. HUTCHINSCo-Founder Silver Lake
JAMES A. JOHNSONChairmanJohnson Capital Partners
LAWRENCE F. KATZElisabeth Allison Professor of EconomicsHarvard University
MELISSA S. KEARNEYProfessor of EconomicsUniversity of MarylandNonresident Senior FellowThe Brookings Institution
LILI LYNTONFounding PartnerBoulud Restaurant Group
MARK MCKINNONFormer Advisor to George W. BushCo-Founder, No Labels
ERIC MINDICHChief Executive Officer & Founder Eton Park Capital Management
SUZANNE NORA JOHNSONFormer Vice ChairmanGoldman Sachs Group, Inc.
PETER ORSZAGVice Chairman of Investment Bankingand Managing DirectorLazardNonresident Senior FellowThe Brookings Institution
RICHARD PERRYManaging Partner & Chief Executive OfficerPerry Capital
MEEGHAN PRUNTY Managing DirectorBlue Meridian PartnersEdna McConnell Clark Foundation
ROBERT D. REISCHAUERDistinguished Institute Fellow & President EmeritusUrban Institute
ALICE M. RIVLINSenior FellowThe Brookings Institution Professor of Public PolicyGeorgetown University
DAVID M. RUBENSTEIN Co-Founder & Co-Chief Executive OfficerThe Carlyle Group
ROBERT E. RUBINCo-Chair, Council on Foreign RelationsFormer U.S. Treasury Secretary
LESLIE B. SAMUELSSenior CounselCleary Gottlieb Steen & Hamilton LLP
SHERYL SANDBERGChief Operating Officer Facebook
RALPH L. SCHLOSSTEINPresident & Chief Executive OfficerEvercore
ERIC SCHMIDTExecutive Chairman Alphabet Inc.
ERIC SCHWARTZChairman and CEO76 West Holdings
THOMAS F. STEYERBusiness Leader and Philanthropist
LAWRENCE H. SUMMERSCharles W. Eliot University Professor Harvard University
PETER THIELEntrepreneur, Investor, and Philanthropist
LAURA D’ANDREA TYSONProfessor of Business Administration and EconomicsDirectorInstitute for Business & Social ImpactBerkeley-Haas School of Business
DIANE WHITMORE SCHANZENBACHDirector
W W W . H A M I L T O N P R O J E C T . O R G
W W W . H A M I L T O N P R O J E C T . O R G
1775 Massachusetts Ave., NW Washington, DC 20036
(202) 797-6279
Printed on recycled paper.
1. The U.S. economy is demanding more noncognitive skills.
2. There are strong labor-market payoffs to both cognitive and noncognitive skills.
3. The labor market is increasingly rewarding noncognitive skills.
4. Those in the bottom quartile of noncognitive skills are only about one-third as likely to complete a postsecondary degree as are those in the top quartile.
5. Noncognitive skill development interventions improve student achievement and reduce behavior-related problems.
6. Preschool interventions emphasizing cognitive and noncognitive skill development have long-term economic benefits for participants.
7. A teacher’s ability to improve noncognitive skills has more effect on graduation rates than does her ability to raise test scores.
Occupational Skill Requirements, 1980–2012
Social and service job tasks have increased while math-related job tasks have tapered off and routine job tasks have decreased.Ta
sk in
tens
ity,
inde
xed
to 1
980
80
100
120
95
115
90
110
85
105
1980 1990 2000 2006 2012
Service tasks
Social tasks
Math tasks
Routine tasks
Sources: Deming 2015; U.S. Department of Labor n.d.; Census Bureau 1980, 1990, 2000, 2005–7, 2008–10, 2011–13.Note: Figure 1 uses constant O*NET skill values (U.S. Department of Labor n.d.) as described in Deming (2015), but allows occupational mix to change over time and does not control for variables such as industry or education.