seven major sources of economic progress - common sense
TRANSCRIPT

COMMON SENSE ECONOMICS ~WHAT EVERYONE SHOULD KNOWABOUT WEALTH AND PROSPERITY2010
by James Gwartney, Richard Stroup, Dwight Lee, and Tawni Ferrarini
http://CommonSenseEconomics.com/
1
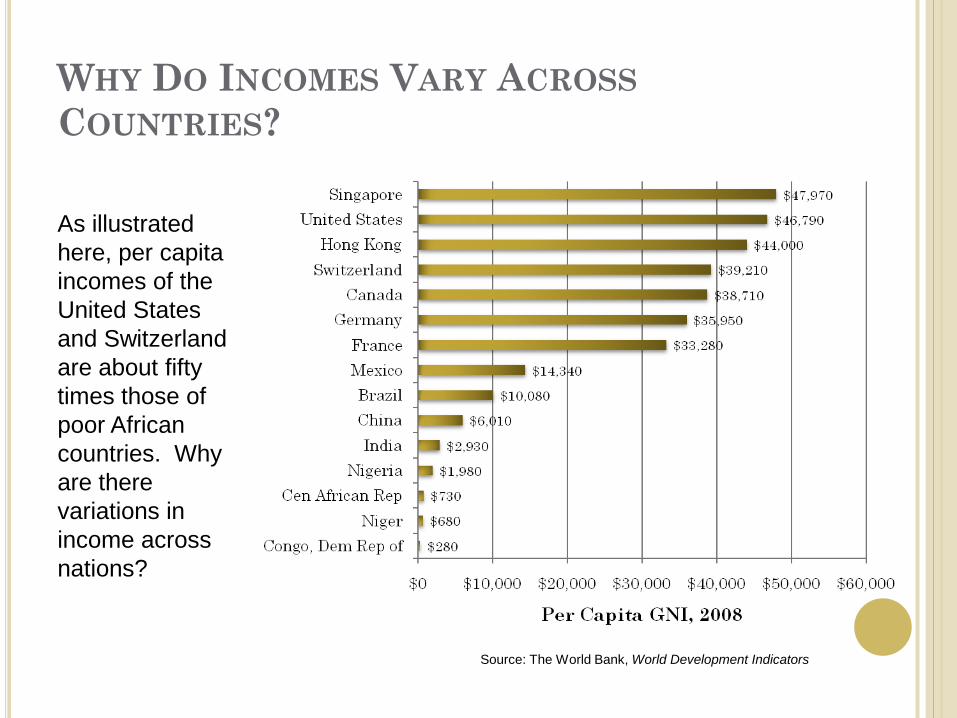
WHY DO INCOMES VARY ACROSSCOUNTRIES?
As illustrated here, per capita incomes of the United States and Switzerland are about fifty times those of poor African countries. Why are there variations in income across nations?
Source: The World Bank, World Development Indicators

SOME KEY QUESTIONS FOR THOUGHT
Why do the incomes of people in some countries grow rapidly and soar to high levels while the incomes of people in other countries stagnate and remain low?
Capital investments and improvements in technology clearly influence income levels. But why is the capital investment in some countries much higher than others? Why aren’t improvements in technology adopted more rapidly in poor countries?
How important are factors such as secure property rights, governmental policies and money of stable value? Why might institutions and policies influence income levels and living standards?
3
http://comm
onsenseeconomics.com
/

SEVEN MAJOR SOURCES OF ECONOMICGROWTH
Source #1 - The Legal System The foundation for economic progress is a legal
system that protects privately owned property and enforces contracts in an evenhanded manner.
4
http://comm
onsenseeconomics.com
/

PRIVATE PROPERTY RIGHTS
Private property rights grant the owner of property the right to buy, sell, or derive income from their land, natural resources, capital and entrepreneurial talent.
Owners of private property can decide how their property will be used, but they cannot use it in ways that violate the ownership rights of others.
Private ownership makes people accountable for their actions.
5
http://comm
onsenseeconomics.com
/
WHAT DO PROPERTY RIGHTS DO TO FUELECONOMIC GROWTH?
They: Encourage people to use their property
productively. Promote wise stewardship. Encourage people to develop their property in
ways beneficial to others for possible exchange, transfer or sale.
Promote the wise development and conservation of resources for the future.
6
http://comm
onsenseeconomics.com
/
WHEN DID THE “EXPERTS” ARGUE THEU.S. WOULD RUN OUT OF OIL? In which year(s) did experts predict that the U.S.
would run out of oil in the near future? A. 1914B. 1926C. 1970sD. 2008E. All of the above
Answer: All of the above!
7
http://comm
onsenseeconomics.com
/
WHY HAVE DOOMSDAY FORECASTSBEEN WRONG? When the scarcity of a privately owned resource
increases, the invisible hand of the market takes over and prices rise.
Buyers and sellers have an incentive to seek substitutes, discover ways to conserve, and innovate when their rights to the rewards from doing so are protected!
Competitive markets and flexible prices have spurred (a) conservation, (b) new discoveries and technological improvements that have expanded supply, and (c) the development of substitutes that have falsified the doomsday scenarios.
Market forces work and the “sky” never falls!8
http://comm
onsenseeconomics.com
/

SEVEN MAJOR SOURCES OF ECONOMICGROWTH
Source #2 - Competitive Markets Competition promotes the efficient use of
resources and provides a continuous stimulus for innovative improvements.
9
http://comm
onsenseeconomics.com
/

THE COMPETITIVE PROCESS
Competition is present when the market is open and alternative firms are free to enter and compete.
Competition encourages firms to: supply goods and services consumers value highly
relative to cost, produce efficiently (Keep their costs low)
Competition weeds out firms that fail to provide consumers with quality goods at competitive prices.
10
http://comm
onsenseeconomics.com
/

CONSUMERS RULE! Consumers Vote on Which Businesses Stay
and Which Must Go Using Their Dollars. Consumer purchases translate into business
revenue. Producers will supply those goods and services
consumers’ value enough to pay a price sufficient to cover the cost of the resources required for their production.
Producers who fail to do this will make losses and be driven out of business. Profits and losses decide which firms will survive and what goods will be produced. Examples: Target vs. Wal-mart vs. K-Mart vs. Sears and Best Buy vs. Circuit City
11
http://comm
onsenseeconomics.com
/
COMPETITION AND INNOVATION
In a market economy entrepreneurs are free to innovate.
If consumers value the innovation enough to cover its costs, the new business will profit and prosper.
But if consumers find that the new products are worth less than their costs, the businesses will suffer losses and eventually fail.
Consumers are the ultimate judge and jury of business innovation and performance.
The approval of central planners, a legislative majority, or business rivals is not necessary for an entrepreneur to try out a new idea.
12
http://comm
onsenseeconomics.com
/

COMPETITION, BUSINESS, ANDGOVERNMENT
Competition is not pro-business. Businesses often lobby government officials
requesting favors that will limit competition. Government regulations that limit entry into
markets and favor some businesses over others undermine the competitive process.
13
http://comm
onsenseeconomics.com
/

SELF-INTEREST AND COMPETITION
When Directed by Competition Self-Interest is a Powerful Force for Economic Progress.
It is not from the benevolence of the butcher, the brewer, or the baker that we expect our dinner, but from their regard to their own self-interest. We address ourselves not to their humanity but to their self-love, and never talk to them of our own necessities, but of their advantages.
Adam Smith, Wealth of Nations, 177614
http://comm
onsenseeconomics.com
/

SEVEN MAJOR SOURCES OF ECONOMICGROWTH
Source #3 - Limits on Government Regulation Regulatory policies that reduce trade also
retard economic progress.
15
http://comm
onsenseeconomics.com
/

GOVERNMENTS LIMIT TRADE ANDRETARD PROGRESS BY
Limiting entry into some businesses and occupations (Licensing requirements, completing bureaucratic forms, bailing out some firms and not others, etc.)
Substituting political authority for rule of law and freedom of contract (and imprecise, ambiguous and discriminatory laws invite people to spend resources on lobbying efforts or bribery rather than production.)
Imposing price controls (Price floors and ceilings interfere with trades between buyers and sellers, distort prices, and lead to inefficient levels of production and employment.)
16
http://comm
onsenseeconomics.com
/
REGULATION AND EXCHANGE
Exchange is productive; it helps people expand output and achieve higher income levels.
Regulations that substitute government edicts for voluntary exchange are often counterproductive.
A country cannot realize its full potential unless restrictions that limit trade and increase the cost of doing business are kept to a minimum.
17
http://comm
onsenseeconomics.com
/

SEVEN MAJOR SOURCES OF ECONOMICGROWTH
Source #4 - An Efficient Capital Market To realize its potential, a nation must have a
mechanism that channels capital into wealth-creating projects.
18
http://comm
onsenseeconomics.com
/

CAPITAL INVESTMENT AND ITS ROLE INGROWTH
Capital goods are assets that will help us produce more consumption goods in the future. Physical capital ~ Robotics in automobile
plants, warehouses, computers in accounting offices, tools, restaurant ovens, etc.
19
http://comm
onsenseeconomics.com
/

CAPITAL INVESTMENT
Requires consumption sacrifices today or self-sacrifice today. Involves savings or consuming less today in order to
expand future output and consumption. The expected payoff is increased production, income
and consumption in the future.
20
http://comm
onsenseeconomics.com
/

INVESTMENT AND GROWTH
If a country is going to grow and prosper, a mechanism is needed to channel savings into productive investments.
Capital markets perform this function.
21
http://comm
onsenseeconomics.com
/

SOUND CAPITAL MARKETS
Attract saving and channel it into investments expected to generate wealth
Bring millions of buyers and sellers in various types of markets together
22
http://comm
onsenseeconomics.com
/

CAPITAL MARKETS, BROADLY DEFINED, INCLUDE
Loanable funds (mortgages, equity lines of credit, commercial loans, personal loans)
Real estate (residential and non-residential)Financial markets (mutual funds, bonds,
and the stock market)
23
http://comm
onsenseeconomics.com
/

SOUND INSTITUTIONS MATTER.
Sound institutions protect the rights of the buyers and sellers and enforce the rules and regulations against fraud and misrepresentation.
The poor and rich are made better off when sound institutions help capital markets function efficiently.
Banks, credit unions and investment firms are part of the capital market. They bring the buyers and sellers of capital together as savers, borrowers and investors. 24
http://comm
onsenseeconomics.com
/

INTEREST RATES AND INVESTMENT
Interest rates provide people with an incentive to save.
Interest rates reflect the cost of borrowing for businesses and others.
Productive investments will yield returns sufficient to cover all costs, including borrowing and the opportunity cost of funds invested.
25
http://comm
onsenseeconomics.com
/
BUT, NOT ALL INVESTMENT PROJECTSARE PRODUCTIVE… Investment involves risk. Unprofitable and
unproductive investments will occur in a world of uncertainty.
Failures play an important role. Losses will lead to business failure and bring unproductive investments to a halt.
Market forces hold investors accountable for their mistakes. This provides them with a strong incentive to search for and undertake productive projects and avoid ones that are unproductive.
Productive investments promote economic growth. 26
http://comm
onsenseeconomics.com
/
GOVERNMENT INTERVENTION IN THEU.S. MORTGAGE MARKET PART 1/2
Two large government-sponsored corporations, Fannie Mae and Freddie Mac, played an important role in the allocation of financial capital to the housing industry.
Fannie Mae and Freddie Mac had a competitive advantage because they were able to obtain funds cheaper than private firms since their bonds were perceived to be backed by the federal government.
But their government sponsorship also meant they were highly political. 27
http://comm
onsenseeconomics.com
/
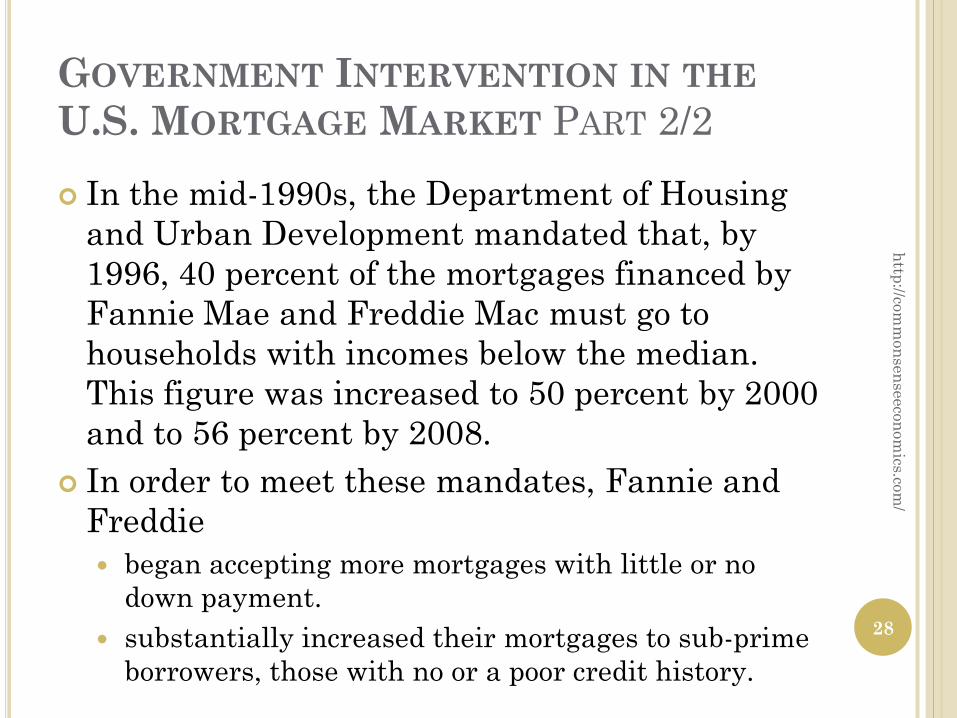
GOVERNMENT INTERVENTION IN THEU.S. MORTGAGE MARKET PART 2/2 In the mid-1990s, the Department of Housing
and Urban Development mandated that, by 1996, 40 percent of the mortgages financed by Fannie Mae and Freddie Mac must go to households with incomes below the median. This figure was increased to 50 percent by 2000 and to 56 percent by 2008.
In order to meet these mandates, Fannie and Freddie began accepting more mortgages with little or no
down payment. substantially increased their mortgages to sub-prime
borrowers, those with no or a poor credit history. 28
http://comm
onsenseeconomics.com
/

FANNIE MAE AND FREDDIE MAC
The share of all mortgages held by Fannie Mae and Freddie Mac rose from 25 percent in 1990 to 45 percent in 2001. http://com
monsenseeconom
ics.com/
29Source: Office of Federal Housing Enterprise Oversight, www.ofheo.gov.
THE SECONDARY EFFECTS OFGOVERNMENT INTERVENTION
Question: When more mortgages are extended with little or no down payment and to borrowers with a poor credit history, what will eventually happened to the mortgage default rate?
30
http://comm
onsenseeconomics.com
/

ANSWER: Sub-prime mortgages
(including those extended with incomplete documentation) soaring from 4.5 percent of the new mortgages in 1994, to 13.2 percent in 2000 and to nearly one-third of the total share of mortgage originations by 2005-2006.
http://comm
onsenseeconomics.com
/
31
4.5
13.2
9.2
25.0
32.233.6
18.1
0
10
20
30
40
1994 2000 2002 2004 2005 2006 2007
Shar
e of
Mor
tgag
es O
rigin
ated
Dur
ing
Year
(per
cent
)
Exhibit 2: Subprime Mortgages as a Share of the Total, 1994-2007
Source: The 1994-2000 data are from Edward M.Gramlich, Financial Services Roundtable Annual Housing Policy Meeting, Chicago, Illinois, 21 May 2004. The 2002-2007 data are from the Joint Center for Housing Studies of Harvard University, The State of the Nations Housing 2008,<http://www.jchs.harvard.edu/son/index.htm>. Loans with incomplete documentation and verification, known as Alt-A loans, are included in the subprime category. Studies indicate that most of the Alt-A loans were to sub-prime borrowers.

SEVEN MAJOR SOURCES OF ECONOMICGROWTH
Source #5 - Monetary Stability A stable monetary policy is essential for the
control of inflation, efficient allocation of investment, and achievement of economic stability.
32
http://comm
onsenseeconomics.com
/

MONEY, MONEY, MONEY! “Money is to an economy what language is to
communication.” Money of stable value enhances the gains from
trade. If money has a stable and predictable value, it will
reduce the uncertainty accompanying transactions across time. For example, It will be easier for borrowers and lenders to find mutually acceptable terms for loans and for many individuals to engage in time-dimension transactions (such as borrowing or lending for a house, automobile, capital equipment, education, business and the like over time) with some degree of certainty.
33
http://comm
onsenseeconomics.com
/

MONEY SERVES THREE PRIMARYFUNCTIONS
1. Medium of exchange 2. Store of value3. Unit of account
34
http://comm
onsenseeconomics.com
/

MONEY: WHAT COUNTS AS MONEY? The nation’s money supply consists of currency
held by the public, checking accounts, and traveler’s checks. The components of the M1 money supply can be used readily to buy and sell goods, services, resources, capital, assets and more.
The M2 money supply is a less liquid form of money and includes M1 plus (1) savings deposits, (2) time deposits of less than $100,000 at all depository institutions, and (3) money market mutual funds. The M2 money supply more fully reflects the store of value function of money.
35
http://comm
onsenseeconomics.com
/

EXHIBIT 1 DISPLAYED IN SUPPLEMENTALUNIT 6 ON MONETARY POLICY ATCOMMONSENSEECONOMICS.COM REVEALS
The M1 money supply was $1.72 trillion, while the M2 figure was $8.61 trillion. Thus, the M2 money supply is currently approximately five times that of M1.
http://comm
onsenseeconomics.com
/
36

WHO CONTROLS THE SUPPLY OFMONEY?
A nation’s central bank controls its supply of money primarily by buying and selling assets, usually government bonds. In the U.S., the central bank is the Federal Reserve Bank or the Fed. Board of Governors Federal Open Market Committee
37
http://comm
onsenseeconomics.com
/
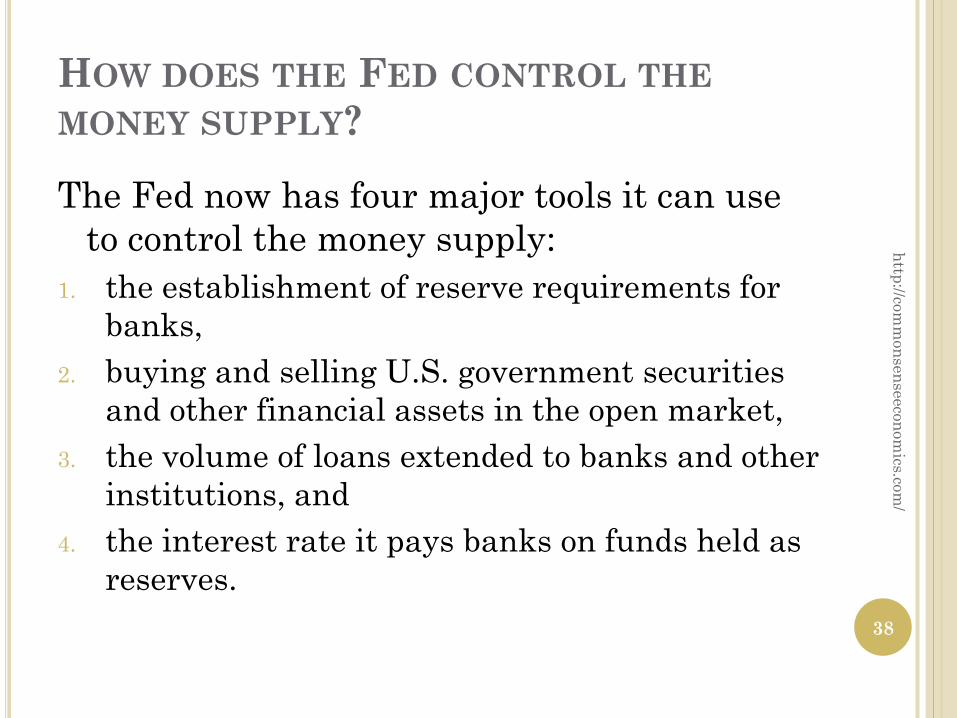
HOW DOES THE FED CONTROL THEMONEY SUPPLY?
The Fed now has four major tools it can use to control the money supply:
1. the establishment of reserve requirements for banks,
2. buying and selling U.S. government securities and other financial assets in the open market,
3. the volume of loans extended to banks and other institutions, and
4. the interest rate it pays banks on funds held as reserves.
38
http://comm
onsenseeconomics.com
/

THE VALUE OF MONEY The value of money is determined by the supply of
and demand for money. The value of money is steady when the supply of
money grows slowly (e.g. at approximately the same rate as goods and services).
When a central bank expands the money supply rapidly relative to the production of goods and services, inflation results because there are too many units of money (for example, dollars) chasing too few goods and services.
Inflation is caused by rapid increases in the supply of money.
Inflation generates uncertainty, reduces the gains from trade, and thereby retards economic growth.
39
http://comm
onsenseeconomics.com
/

THE LINKAGES BETWEEN VARIOUS RATESOF GROWTH OF THE MONEY SUPPLY ANDINFLATION
Inflation is caused by rapid increases in the supply of money.
The evidence presented in Exhibit 3 supports this claim.
http://comm
onsenseeconomics.com
/
40
Exhibit 3: Monetary Growth and Inflation, 1990-2007
Annual Growth Rate of the Money Supply (%)
Avg Annual Growth Rate of Inflation (%)
Slow Growth of the Money Supply
United States 2.1% 2.8%
Central African Republic 2.3% 3.4%
Singapore 2.5% 1.4%
New Zealand 2.8% 2.1%
Sweden 4.0% 2.0%
Mauritus 4.7% 6.5%
Canada 5.1% 2.1%
Rapid Growth of the Money Supply
Peru 22.7% 21.9%
Uruguay 24.6% 23.9%
Ghana 24.8% 22.2%
Malawi 27.4% 23.8%
Nigeria 27.5% 21.9%
Romania 35.6% 61.7%
Venezuela 36.8% 32.9%
Hypergrowth of the Money Supply
Turkey 71.8% 51.6%
Ukraine 84.5% 89.9%
Congo, Dem. Rep. 140.3% 360.4%
Zimbabwe 164.8% 165.3%
Source: The World Bank, World Development Indicators, 2009 and International Monetary Fund, International Financial Statistics (annual). The growth rate of the money supply is measured by the nominal growth of the money supply minus the growth of the real gross domestic product (GDP). The data for the Ukraine are for 1992-2007.

MONETARY POLICY AND ECONOMICSTABILITY
Shifts in monetary policy exert an impact on output and prices with a time lag.
The time lags of monetary policy are variable and sometimes quite lengthy.
Because of these time lags, persistent shifts back and forth from restrictive to expansionary monetary policy are likely to do more harm than good. They are likely to be a source of economic instability.
41
http://comm
onsenseeconomics.com
/
MONETARY POLICY AND THE GREATRECESSION PART 1/2 Expansionary monetary policy during 2002-2004
pushed interest rates to historic low levels. Along with regulations promoting easy credit for
housing, the low interest rates of 2002-2004 generated a boom in housing prices.
42
http://comm
onsenseeconomics.com
/
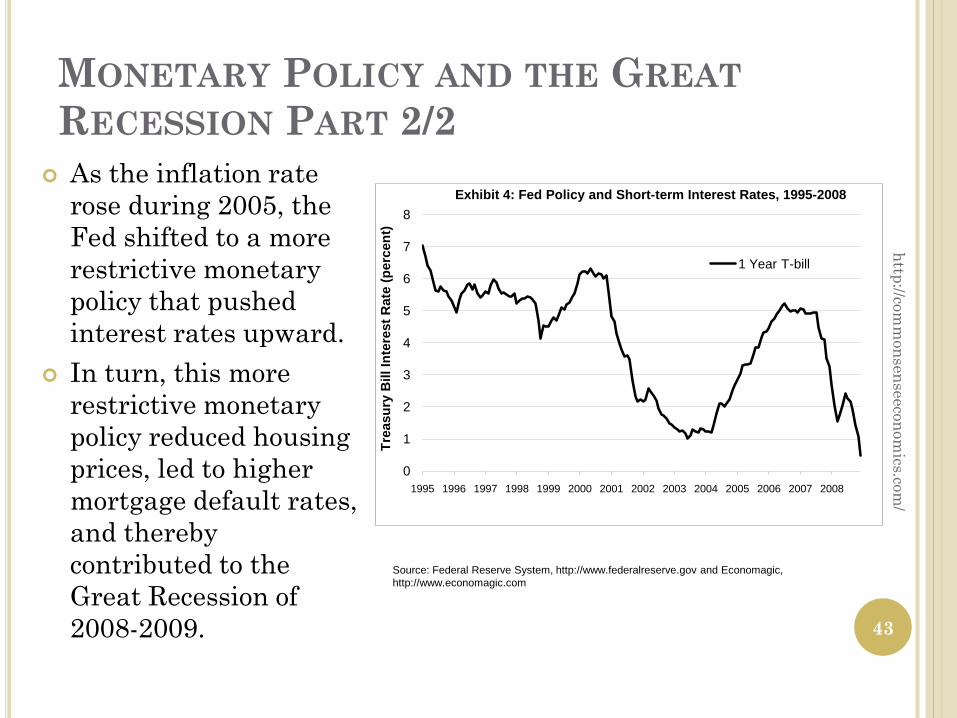
MONETARY POLICY AND THE GREATRECESSION PART 2/2 As the inflation rate
rose during 2005, the Fed shifted to a more restrictive monetary policy that pushed interest rates upward.
In turn, this more restrictive monetary policy reduced housing prices, led to higher mortgage default rates, and thereby contributed to the Great Recession of 2008-2009.
http://comm
onsenseeconomics.com
/
43
0
1
2
3
4
5
6
7
8
1995 1996 1997 1998 1999 2000 2001 2002 2003 2004 2005 2006 2007 2008
Trea
sury
Bill
Inte
rest
Rat
e (p
erce
nt)
Exhibit 4: Fed Policy and Short-term Interest Rates, 1995-2008
1 Year T-bill
Source: Federal Reserve System, http://www.federalreserve.gov and Economagic, http://www.economagic.com

QUESTIONS FOR DISCUSSION
How did the combination of regulations promoting loose mortgage lending standards and the Fed’s artificially low interest rate policies influence the boom and bust in the housing market and the soaring default rates and Great Recession that followed?
Were the housing investments of 2002-2007 productive?
44
http://comm
onsenseeconomics.com
/

SEVEN MAJOR SOURCES OF ECONOMICGROWTH
Source #6 - Low Tax Rates People will produce more when they are permitted to
keep more of what they earn.
45
http://comm
onsenseeconomics.com
/

HIGH MARGINAL TAX RATES
Discourage work effort and reduce the productivity of labor.
Reduce both the level and efficiency of capital formation.
Encourage individuals to consume tax-deductible goods when nondeductible goods may actually be more desirable.
46
http://comm
onsenseeconomics.com
/
QUESTION FOR DISCUSSION
The United States has had three major reductions in tax rates: the rate reductions during the 1920s in the aftermath of World War I, the Kennedy tax cuts of the 1960s, and the Reagan tax cuts of the 1980s.
What impact did these reductions in marginal tax rates have on the U.S. economy?
47
http://comm
onsenseeconomics.com
/

TAX POLICY AND THE GREAT DEPRESSION
A huge personal income tax increase was adopted in 1932 in the midst of the Great Depression.
The top marginal rate was increased from 25 percent to 63 percent in 1932. Other tax rates were increased by a similar proportion.
The results were disastrous. In 1932, real output fell by 13 percent, the largest single-year decline during the Great Depression era. Unemployment rose from 15.9 percent in 1931 to 23.6 percent in 1932.
In 1936, the Roosevelt Administration increased the top marginal rate to 79 percent. Recession and rising unemployment also followed this tax increase.
48
http://comm
onsenseeconomics.com
/

IMPORTANT LESSON
It is not a good idea to increase tax rates during a recession.
49
http://comm
onsenseeconomics.com
/

SEVEN MAJOR SOURCES OF ECONOMICGROWTH
Source #7 - Free Trade A nation progresses by selling goods and services that
it can produce at a relatively low cost and buying those that would be costly to produce.
50
http://comm
onsenseeconomics.com
/
FREE TRADE
Free trade consists simply in letting people buy and sell as they want to buy and sell. Protective tariffs are as much applications of force as are blockading squadrons, and their objective is the same—to prevent trade. The difference between the two is that blockading squadrons are a means whereby nations seek to prevent their enemies from trading; protective tariffs are a means whereby nations attempt to prevent their own people from trading.
- Henry George51
http://comm
onsenseeconomics.com
/
KEY PRINCIPLE OF INTERNATIONALTRADE
A nation progresses by selling goods and services that it can produce at a relatively low cost and buying those that would be costly to produce domestically. Trade makes it possible for the trading
partners to expand both production and consumption.
52
http://comm
onsenseeconomics.com
/

INTERNATIONAL TRADE
Makes it possible for each country to acquire goods, services and resources more economically.
Allows domestic producers and consumers to benefit from economies of scale.
Promotes competition in domestic markets and allows consumers to purchase a wider variety of goods, services and resources at lower prices.
Makes it possible for domestic producers to sell their goods and services where they can get the highest price for the value of what they offer in the marketplace.
53
http://comm
onsenseeconomics.com
/

GOVERNMENT BARRIERS TO TRADE
Trade barriers include tariffs on imports, domestic subsidies, quotas on imports, bureaucratic red tape, etc.
Trade barriers create inefficiencies in the protected industries, raise the cost of doing business with those protected industries, and force domestic consumers to pay higher prices than would be the case with free trade.
Trade barriers neither create nor destroy domestic jobs; they merely reshuffle employment.
54
http://comm
onsenseeconomics.com
/

THE LINK BETWEEN IMPORTS AND EXPORTS
Trade restrictions that reduce imports will also reduce the ability of foreigners to buy our exports.
Quotas and tariffs decrease the number of dollars earned by foreigners through the sale of imports to us.
Therefore, reductions in imports simultaneously reduce exports.
55
http://comm
onsenseeconomics.com
/

THE SMOOT-HAWLEY TRADE BILL OF1930
The bill increased tariffs on more than 3200 goods by approximately 50 percent.
The volume of trade declined sharply.The economy fell deeper into recession and
the unemployment rate soared. Unemployment stood at 7.8 percent when the Smoot-
Hawley bill was passed, but it ballooned to 23.6 percent of the labor force just two years later.
The stock market, which had been above 280 at passage, fell below 90 in the two years following its passage. 56
http://comm
onsenseeconomics.com
/

QUESTION FOR DISCUSSION
Explain why you agree or disagree with the following statement.
More than any other single action, unilateral removal of our trade restrictions would establish the environment for a more peaceful and prosperous world.
Common Sense Economics, 2010
57
http://comm
onsenseeconomics.com
/

BRINGING IT ALL TOGETHER
Explain why the following are important for a country’s prosperity: Secure protection of privately owned property Even-handed enforcement of contracts Stable monetary environment Low marginal tax rates Minimal barriers to trade Market versus government allocation of capital
58
http://comm
onsenseeconomics.com
/

ECONOMIC FREEDOM, GROWTH, ANDINCOME
The seven elements of this section imply that institutions and policies supportive of economic freedom will generate more rapid growth and lead to higher income levels. How can this be true?
59
http://comm
onsenseeconomics.com
/

The countries with the highest levels of economic freedom have the highest per capita GDP and growth rates.
http://comm
onsenseeconomics.com
/
60
Exhibit 5: Economic Freedom, Per Capita GDP
EFW Rating, 1990-2007
GDP Per Capita 2007 PPP (constant 2005 international $)
Growth Rate of Per Capita GDP 1990-2007 PPP (percent, constant 2005 international $)
10 Highest Rated Countries, 1990-2007Hong Kong 8.8 $39,958 3.1%Singapore 8.6 $47,497 4.1%New Zealand 8.2 $25,282 1.9%United States 8.2 $43,102 1.8%Switzerland 8.1 $37,581 0.7%United Kingdom 8.0 $33,717 2.1%Canada 7.9 $36,260 1.8%Ireland 7.8 $41,036 5.1%Australia 7.7 $32,735 2.0%Netherlands 7.7 $36,956 2.0%Average 8.1 $37,412 2.5%
10 Lowest Rated Countries, 1990-2007Niger 5.0 $597 -0.7%Burundi 5.0 $349 -1.9%Venezuela 4.9 $11,480 1.1%Syria 4.9 $4,038 1.9%Central Afr. Rep. 4.8 $674 -1.0%Congo, Rep. Of 4.8 $3,517 0.1%Algeria 4.7 $7,317 1.0%Zimbabwe* 4.4 $450 -1.6%Congo, Dem. Rep. 4.2 $288 -4.3%Guinea-Bissau 4.2 $495 -2.1%Average 3.9 $2,920 -0.8%
Source: Derived from World Bank, World Development Indicators and James Gwartney and Robert Lawson, Economic Freedom of the World: 2009 Annual Report.