seventeenth - · pdf filemutual funds birla sun life asset ... sbi funds management private...
TRANSCRIPT

SEVENTEENTH ANNUAL REPORT 2010-11
KNOWLEDGE.EXPERIENCE.SERVICE.

ContentsKnowledge. Experience. Service.
Message from the Managing Directors
Corporate Information
Directors’ Report
Management Discussion and Analysis
Corporate Governance Report
Auditors’ Report
Financial Statements
Auditors’ Report on Consolidated Financial Statements
Consolidated Financial Statements
01
06
08
09
17
22
36
40
76
78

Three critical components that chart our success chronicle, and that define the cornerstone of our customer-centric foundation.
On these three parameters is built the nucleus of Emkay’s ability to lead the financial services industry. And in these three factors is ingrained the company’s deep-rooted philosophy and value system, which is geared towards generating excellence for each of our customers and stakeholders.
From developing our robust knowledge base, to building extensive experience across the complete gamut of our offerings, to delivering the best-in-class service to our ever-expanding base of customers – we have developed our business model on a foundation that is ideally positioned to give the best, across every aspect of our business.
From helping our clients take the right decision through recourse to our vast reservoir of research-based knowledge, to emerging stronger by leveraging our experience to weather storms in the financial markets, we have evolved a service core that:
“Lies firmly entrenched in the belief that knowledge is what endows the edge in making successful investment decisions. The many awards conferred upon our research team are a strong endorsement of this belief.
Is rooted in our 16 years of experience in the capital markets which have given us valuable insights into the working of the business. Experience has, in fact, taught us many vital things that no business school or instruction manual can.
Strongly believes in the idiom that the best brokerage offerings and infrastructure are nothing if, at the end of the day, they do not lead to client satisfaction. In a business that is high on competition and low on margins, we have realized that top quality service is more than a luxury to be offered to our clients; it is a necessity, a survival skill that we have honed over years of our expanding presence in a growing market.”
It is a service model that is geared to ensure absolute client satisfaction in all ways, at all times.
KNOWLEDGE.EXPERIENCE.SERVICE.
01

PHARMAAug’10, Mumbai
INDIACONFLUENCESep’10, Mumbai
INDIACONFLUENCENov’10, New York
BANKING &FINANCIALSMay’11, Mumbai
INDIACONFLUENCEMar’11, London
METALS &MININGFeb’11, Mumbai
CEMENT, INFRA& REAL ESTATEMay’11, Mumbai
A Confluence of Knowledge &ExperienceThe confluence of Knowledge and Experience is the best possible spark to ignite minds and enable service excellence. We, at Emkay, have been making consistent efforts to reach out to the best of minds in the finest of environments, where knowledge and experience combine to provide the ideal forum to facilitate investment strategies and financial growth. Our conferences, or Confluences as we call them, help us introduce investors to select companies with excellent growth potential, good management bandwidth and leadership in their respective segments. Over the years, our Confluences have emerged as a platform to leverage our growing Knowledge base and our extensive Experience to deliver the best-in-class Service to our customers and others.
02

03
Our Service excellence model, based on the confluence of Knowledge and Experience, has enabled us to build a strong clientele across diverse business segments.
Extending Service across businesses
MUTUAL FUNDSBirla Sun Life Asset Management Company Limited
HDFC Asset Management Company Limited
ICICI Prudential Asset Management Company Limited
Reliance Capital Asset Management Limited
SBI Funds Management Private Limited
UTI Asset Management Company Limited
Franklin Templeton Asset Management (India) Private Limited
BANKSHDFC Bank Limited
IDBI Bank Limited
ICICI Bank Limited
Bank of India
Punjab National Bank
Allahabad Bank
INSURANCESBI Life Insurance Company Limited
Birla Sun Life Insurance Company Limited
HDFC Standard Life Insurance Company Limited
ICICI Prudential Life Insurance Company Limited
Max New York Life Insurance Company Limited
Life Insurance Corporation of India
Reliance Life Insurance Company Limited
FoREIgN INSTITUTIoNAL INvESToRSIndea Capital Private Limited
Citigroup Global Markets Mauritius Private Limited
Credit Suisse (Singapore) Limited
Goldman Sachs Investments (Mauritius) I Limited
The Royal Bank of Scotland N.V.
New Vernon India Limited
CoRPoRATEDeccan Chronicle Holdings Limited
Jubilant Life Sciences Limited
Greaves Cotton Limited
Central Depository Services (India) Limited
Tata Investment Corporation Limited
REI Agro Limited
eClerx Services Limited
Blue Star Limited
Kajaria Ceramics Limited

Endorsing ourService Excellence.The Service excellence that we have evolved through the confluence of our Knowledge and Experience has found many an endorsement in the various rankings, awards and accolades that we have received over the years. Year 2010-11 saw us cross several new milestones in this regard.
Winner of the Best Broker Award, Rank-2, India; at the Thomson Reuters Starmine Awards, 2011. Winner of 7 other awards including ‘Industry Earnings Estimator’. `Overall Earnings Estimator’, `Overall Stock Picker’ and `Industry Stock Picker’.
Rated by Asiamoney Brokers Poll 2010, amongst the top three brokerages in India for small cap research and consistently leading in other categories like Overall Strategy, Banks, Cap Goods et al.
Winner of Asia’s Best Analysts 2011 Awards by the Wall Street Journal. Emkay analysts who won the honour: Manik Tanjea - No. 1 analyst in Technology and Rohan Gupta - No. 3 analyst in Chemicals. Voted the best amongst 10 countries and more than 3000 analysts
Spreading Knowledge.Sharing Experience.If knowledge and experience are the pillars of our growth, then spreading and sharing that knowledge and experience is our way of extending growth across the entire bandwidth of our clients, and others who have been associated with us in any way.
The testimonials of our clients are an indication of how this business philosophy of Emkay is impacting and benefiting them, enabling them to scale new levels of progress in their business trajectories. Here is what some of our clients have to say about our services:
04

“We really value Emkay’s in-depth research & corporate access/ events, particularly in mid cap space where we look for bigger ideas.”
Jayesh ShahCIOOHM Portfolio Equi Research Pvt. Ltd.
“I would like to extend my sincere appreciation for the highly professional services rendered by Emkay, and for the ingenious investment ideas of Emkay Private Wealth Management.”
Jitin MahbubaniGroup Managing Director B.L. Chainrai & Company (NIG) Limited
“Emkay’s PMS has served as a beacon of stability in volatile times and has met my expectations by consistently outperforming the markets.”
Kannan RanganathanManaging Director Clickwise eLearning Matrix Pvt. Ltd.
“The support from Emkay’s team in evaluating my existing Insurance portfolio and realigning it was invaluable.”
Ravinder Singh ParmarPartnerM/s Lalsingh and Sons
“I value the sound advice, excellent research reports and client friendly approach of Emkay. With all investment products under one roof, it makes it easy to take fast investment decisions. In fact, with Emkay, the relationship is more like an extended family relationship.”
Chandru Wadhwa Director Wadhwa Developers
“I would like to thank Emkay Insurance Brokers for providing excellent service. Through their diligent efforts, they helped me to understand the concept of term plan and get adequate life cover. I was able to obtain a quote that was actually less expensive. The customer service was also outstanding.”
Pranay GuptaTeam LeaderAccenture
05

Message from the Managing Directors
Dear Shareowners,
In contrast to the cautious mood that gripped the world economy at the end of fiscal 2009-10, the recently ended year closed on a more stable note. While there was still some uncertainty in parts of Europe and the employment data in the USA lagged behind other more sanguine indicators, it has largely been accepted that the worst is over. However, global economic dynamics are changing. Events in the Middle East and Asia – such as a surge in oil and food prices, the rising interest rates in Asia and a disruption of trade with Japan due to the natural disasters - are gaining importance as indicators of global growth drivers. As a result, while incidents in Europe and the US will still command their place of pride, it will be shared with developments in emerging markets.
Against the backdrop of relative stability in the international arena, India witnessed strong growth during most of 2010-11, coupled with high inflation. As a result, the priority of the government and the RBI shifted from boosting growth to inflation control. Rising interest rates and tightening of the fiscal deficit had an impact on the growth, especially towards the end of the year. Overall, India recorded a healthy 8.5% GDP growth in 2010-11, though marginally lower than most expectations.
Going forward, economic growth is expected to strengthen further as subdued demand picks up. Domestic consumption is expected to recover on the back of good growth in the agricultural sector, which is known to have a lagged effect on demand. Additionally, once inflation is under control and the RBI eases its monetary stance, consumption demand will get a further boost. On the external front, exports to Asian countries are also expected to pick up in 2012-13, according to OECD forecasts.
Financial marketsDuring the past year, the markets have reacted to rising interest rates, falling liquidity and the impact of the rising cost of inputs, especially crude oil, on corporate earnings. These resulted in margin pressures and overall, fiscal 2010-11 was a rather lacklustre year for most equity investors. However, a generalisation is difficult since different segments of the market displayed varying behaviour. While the Nifty returned 11%, the mid-caps clocked a dismal 1% and small-caps followed with a negative growth of 4%. There were some sectors like Consumer Durables, which did perform well, returning 48% and the Bankex and BSE Auto Indices gave returns in excess of 20%. BSE Realty and Power also began on a strong note but failed to deliver and ended the year with negative returns of 29% and 12%, respectively. So the fate of investors, during the bygone year was largely linked to their stock and sector picking abilities.
Going ahead, it appears that only the ability to have ‘patience’ will help investors. Building block industries like infrastructure and capital goods, which have not really performed well during the past year, are bound to pay rich dividends in the future if the country progresses at its current rate. More importantly, domestic political equations and the direction of food and crude prices will have an effect on stock prices. At the same time, the international impact could come in the form of some outflow of funds as the US economy recovers and European countries move ahead with their consolidation plans. The natural catastrophe that ravaged Japan in the early part of the current financial year will also cause some slowdown in funds from the Asian region. Nevertheless, outflows of funds are bound to be a temporary phenomenon as investing in Indian equities is still a very attractive proposition. It will continue to be so as long as economic growth remains on its current trajectory.
06

“Emkay organized a series of conferences for institutional clients across the globe. These meets - Emkay Confluence - were well received and appreciated.”
Emkay’s performance Despite the mixed signals from the market, fiscal 2010-11 was an eventful year for Emkay. Our client base expanded to reach 1 lac plus non-institutional investors and over 140 institutional clients. Making the most of sluggish markets, Emkay organized a series of conferences for institutional clients across the globe. These meets – Emkay Confluence – were well received and appreciated.
Emkay’s research continued to be the proud recipient of many awards in FY 2010-11 too. Emkay was recognized for its strategy, small cap research, accuracy of earnings estimates and stock picking ability amongst others.
While the stock markets were relatively lackluster during the year, our commodities business witnessed an increase in its gross income of nearly 50% from `6.37 crore to `9.35 crore. Overall the company’s top-line (consolidated) grew by a modest 4.75%, its profit after tax increased by close to 26% to reach `11.84 crore. Consequently, we maintained our dividend at 10% or `1 per share.
outlook for the futureWith growth in the economy moderating and the cost of funds rising, Emkay has decided to adapt itself to the changing scenario and make use of the interim time to change gears. It is our endeavor to arm ourselves with a well planned and meticulously implemented strategy for rationalization and consolidation to achieve better growth in FY 2011-12.
While we aim to focus on increasing the efficiency at the branches and may consolidate the branch network in the process, we will diligently implement cost rationalization in operations towards
improving our front-end. We will harness our knowledge-based strengths to increase our presence in the mass affluent and affluent markets, in a gradual shift from our focus on ‘micro retail’.
With our vast experience in the Indian markets and our valuable exposure to global markets as well, we feel confident about weathering financial market undulations and coming through stronger and wiser, as we have in the past.
on a concluding noteBeing a company in which knowledge and service are the pillars on which our growth depends, we acknowledge that our success is attributed to our dedicated employees.
We would also like to thank our share holders for reposing their faith in us and supporting our decisions in the best as well as the toughest of times. With our years of experience and your confidence in us and implicit support, we envisage a robust future.
Sincerely,
Krishna Kumar Karwa Prakash KacholiaManaging Director and CFO Managing Director
07

Corporate Information BoARD oF DIRECToRS
G. P. Gupta Chairman
S. K. Saboo Director
R. K. Krishnamurthi Director
G. C. Vasudeo Director
Krishna Kumar Karwa Managing Director & CFO
Prakash Kacholia Managing Director
CoMPANY SECRETARY & COMPLIANCE OFFICER
Rahul Sahasrabuddhe
STATUToRY AUDIToRS
B. L. Sarda & Associates, Chartered Accountants
BANKS
HDFC Bank Limited
Citibank N A
Bank of India
AXIS Bank Limited
Punjab National Bank
ICICI Bank Limited
State Bank of India
Corporation Bank
Kotak Mahindra Bank
Union Bank of India
BNP Paribas Bank
IndusInd Bank Limited
REgISTERED oFFICE
4D, 4th Floor, Hamam House, Ambalal Doshi Marg, Fort, Mumbai - 400 023
CoRPoRATE oFFICE
C - 06, Ground Floor, Paragon Centre,Pandurang Budhkar Marg, Worli, Mumbai - 400 013
REgISTRAR & TRANSFER AgENTS
Link Intime India Private LimitedC-13, Pannalal Silk Mills Compound,L.B.S. Marg, Bhandup (West), Mumbai - 400 078
08

9
Dear Members,
The Directors have pleasure in presenting the Seventeenth Annual Report of your Company and the Audited Accounts for the year ended on 31st March, 2011.
1. Financial results
An overview of the financial performance of your Company along with its subsidiaries for the year 2010-11 is as under:
(` in lac)
An overview of the standalone financial performance of your Company for the year 2010-11 is as under:
(` in lac)
DiReCToRS’ RepoRT
Name of the Company
Revenues
Profit/(Loss) before Interest,
Depreciation and Tax
Profit/(Loss) after
Tax
emkay Global Financial Services Limited
11826.44 1828.07 832.81
emkay Fincap Limited 364.34 321.22 193.30emkay Commotrade Limited
935.29 255.72 160.31
emkay insurance Brokers Limited
112.28 (60.17) (44.14)
emkay investment Managers Limited
106.70 70.62 45.35
Aggregate 13345.05 2415.46 1187.63
Particulars 31.03.2011 31.03.2010
Total income 11826.44 11671.57
profit before interest, Depreciation and Tax
1828.07 1964.19
Depreciation and Amortization 385.89 463.30
interest 156.16 151.64
profit before Taxation 1286.02 1349.25
provision for Taxation
-Current Tax 350.44 600.00
-Deferred Tax Charges/(Benefit) 98.15 (91.76)
-Short provision for Taxation of earlier years
4.62 1.40
profit after Taxation 832.81 839.61
Add: Balance brought forward 2207.31 1731.30
Amount available for appropriations 3040.12 2570.91
Appropriations
-proposed Dividend (Current and earlier year)
245.26 243.21
-provision for Tax on Dividend (Current and earlier year)
39.79 40.39
-Transfer to General Reserves 80.00 80.00
Balance carried forward 2675.07 2207.31
2. Dividend
The Board of Directors are pleased to recommend a dividend at the rate of ` 1/- per equity share of the face value of ` 10/- for the year ended 31st March, 2011 (previous year ` 1/- per equity share). This Dividend is subject to approval of the Members at the forthcoming 17th Annual General Meeting.
3. Transfer to Reserves
The Company proposed to transfer an amount of ` 80 lac to the General Reserve out of the amount available for appropriation. An amount of ` 467.75 lac is proposed to be retained in the profit & Loss Account.
4. Review of Operations
During the year under review, your Company recorded a total income of ` 11826.44 lac as compared to ` 11671.57 lac in the previous financial year, up by 1.33 %. The Net profit for the same period stands at ` 832.81 lac compared to ` 839.61 lac in the previous financial year.
5. Change in Office of Company Secretary
Mr. Manish Jain – Company Secretary & Compliance officer of the Company has resigned with effect from 6th August, 2010. The Board of Director places on record its appreciation for the services rendered by Mr. Jain during his tenure as the Company Secretary & Compliance officer.
Consequent to the resignati on of Mr. Manish Jain, Mr. Rahul Sahasrabuddhe was appointed as the Company Secretary & Compliance officer of the Company with effect from 27th August, 2010.
6. Cancellation of Membership of Currency Derivative Segment of Bombay Stock Exchange Limited
During the year under review, your Company had applied for cancellation of Currency Derivative Membership Certificate of Bombay Stock exchange Limited. The same has been cancelled by SeBi with effect from 31st March, 2010.
7. Membership of Currency Derivative Segment of United Stock Exchange of India Limited
During the year under review, the Company had applied for the membership of Currency Derivative segment of United Stock exchange of india Limited and acquired the membership on 7th February, 2011.
09

10
8. Management Discussion and Analysis
A detailed review of the operations, performance and future outlook of the Company and its businesses is given in the Management Discussion and Analysis, which forms part of the Annual Report.
9. Incorporation of Wholly-owned Subsidiary Company
The Company has floated a Wholly-owned Subsidiary in the name of ‘emkay investment Managers Limited’ on 8th June, 2010 to carry on the business of portfolio Management Services (pMS). ‘emkay investment Managers Limited’ obtained its Business Commencement Certificate on 23rd August, 2010.
10. Transfer of Portfolio Management Services Division of the Company
The Company had sought the approval of members through postal ballot process for transfer of portfolio Management Services division of the Company to its wholly-owned Subsidiary viz. emkay investment Managers Limited on 30th July, 2010. The Company has also obtained requisite approval from Securities and exchange Board of india (SeBi) in this regard and accordingly the Company has transferred its portfolio Management Services Division to its wholly owned subsidiary company viz. emkay investment Managers Limited at a consideration of ` 5 lac with effect from 1st January, 2011.
11. Public Deposits
During the year, your Company has not accepted and/or renewed any public deposits in terms of the provisions of Section 58A of the Companies Act, 1956 read with the Companies (Acceptance of Deposits) Rules, 1975.
12. Subsidiary Companies
Emkay Commotrade Limited (ECL) – a 100% subsidiary:
emkay Commotrade Limited offers commodity futures trading to its clients. it is member of four major commodity exchanges viz. Multi Commodity exchange of india Limited (MCX), National Commodity and Derivatives exchange Limited (NCDeX), National Spot exchange Limited (NSeL) and indian Commodity exchange Limited (iCeX). eCL has a net worth of ` 10,55,65,729/- as on 31st March, 2011.
Emkay Fincap Limited (EFL) – a 100% subsidiary:
emkay Fincap Limited is a RBi registered Non Deposit taking NBFC Company. Your Company had subscribed to 50,00,000 9% Non Convertible Redeemable preference Shares of ` 10 each of eFL on 25th July, 2007 for a period of five years. eFL has redeemed
40,00,000 9% Non Convertible Redeemable preference Shares of ` 10 each out of 50,00,000 9% Non Convertible Redeemable preference Shares on 9th June, 2010z
After the above redemptions, the paid up capital of eFL is now ` 23,00,00,000/- divided into 2,20,00,000 equity shares of ` 10 each and 10,00,000 9% Non-Convertible Redeemable preference Shares of ` 10 each. eFL has a networth of ` 31,11,43,847/- as on 31st March, 2011.
Emkay Insurance Brokers Limited (EIBL) – a 100% subsidiary:
emkay insurance Brokers Limited is registered with insurance Regulatory and Development Authority (iRDA) as a Direct insurance Broker and focuses on life and non-life businesses.
The Company has subscribed to 10,00,000 equity Shares of ` 10 each issued by eiBL and eiBL has redeemed 10,00,000 9% optionally Convertible Redeemable preference Shares of ` 10 each during the year under review which was subscribed by the Company. The paid-up capital of eiBL is now ̀ 4,00,00,000/- divided into 40,00,000 equity shares of `.10 each. eiBL has a net worth of ` 1,65,34,725/- as on 31st March, 2011.
Emkay Investment Managers Limited (EIML) - a 100% subsidiary
Your Company has incorporated a wholly owned subsidiary Company viz. emkay investment Managers Limited on 8th June, 2010. eiML has obtained its Business Commencement Certificate on 23rd August, 2010. eiML commenced the business of portfolio Management Services with effect from 1st January, 2011.
Your Company had subscribed to 25,00,000 equity Shares of the face value of ` 10 each during the year under review. The paid-up capital of eiML is now ` 2,50,00,000/- divided into 25,00,000 equity shares of ` 10 each. eiML has a networth of ` 2,95,35,466/- as on 31st March, 2011.
Ministry of Corporate Affairs, Government of india, New Delhi has granted General exemption under Section 212 (8) of the Companies Act, 1956 vide their circular No. 5/12/2007-CL-iii dated 8th February, 2011 subject to fulfillment of certain conditions as mentioned in their said circular for not attaching the Balance Sheet of the Subsidiary Companies for the year ended on 31st March, 2011.
Accordingly, the Board of Directors of the Company has passed a resolution on 20th May, 2011 giving consent for not annexing the balance sheet of the Subsidiary Companies i.e. emkay Fincap Limited, emkay Commotrade Limited, emkay insurance Brokers Limited and emkay investment Managers Limited for the year ended 31st March, 2011.
The Consolidated Financial Statements presented by the

11
Company include financial results of its Subsidiary Companies. The Company will make available the annual accounts of the Subsidiary Companies and the related information to any member of the Company who may be interested in obtaining the same. The annual accounts of the said Subsidiary Companies are also available for inspection by any member of the Company at the Corporate office situated at paragon Centre, C-6, Ground Floor, pandurang Budhkar Marg, Worli, Mumbai - 400 013.
The Statement containing financial information of the aforesaid Subsidiaries is included in the Consolidated Accounts forming part of the Annual Report of the Company.
13. Purchase of Office Premises:
The Company has been exploring various options for out right purchase of premises for office use considering the heavy rental outflow incurred on leased office premises. The Company has identified a property situated at ‘Ruby House’, Senapati Bapat Marg, Dadar (W), Mumbai-400 028. The Company has proposed to purchase the office premises in two tranches by executing two agreements. The Company has executed the first agreement with M/s. Mindset estates private Limited and M/s. Ruby Mills Limited for purchase of office premises admeasuring 8531 sq.ft. carpet area situated at 7th floor, South east Wing, The Ruby, Senapati Bapat Marg, J. K. Sawant Marg, Dadar (West), Mumbai-400 028. The Company will be executing the second agreement with M/s. Mindset estates private Limited and M/s. Ruby Mills Limited for the purchase of other part of the office premises situated at 7th floor, South east Wing, The Ruby, Senapati Bapat Marg, J. K. Sawant Marg, Dadar (West), Mumbai-400 028 at a later stage.
14. Employee Stock Option Schemes
With a view to remain a preferred employer, the Company has granted Stock options under two Schemes viz. eSop 2005 & eSop 2007 to the employees of the Company as well as that of the Subsidiary Companies.
(a) ESOP 2005
During the year 2006, the Company granted 381,250 options to the employees on 28th January, 2006 (each option carrying entitlement for one equity share of the face value of ` 10 each) at an exercise price of ` 20 per option. These stock options shall vest on expiry of one year from the date of grant and can be exercised during a period of three years from the date of vesting.
During the Financial Year 2010-11, the Remuneration/Compensation Committee allotted 51,500 equity Shares to 46 employees under the eSop 2005. These shares are listed on the Bombay Stock exchange Limited and the National Stock exchange of india Limited.
Summary of ESOP 2005 as on 31st March 2011:
(b) ESOP 2007
The Company had granted 1,442,000 options on 17th January, 2008 to the employees (each option carrying entitlement for one share of the face value of ` 10 each) at an exercise price of ` 363 per option which was later repriced at ` 63 per option. Further, the Company granted 244,000 options on 19th June, 2009, 207,500 options on 24th July, 2009, 1,00,000 options on 4th May, 2010 and 6,11,500 options on 27th July, 2010 to the employees under the said Scheme (each option carrying entitlement for one equity share of the face value of ` 10 each) at an exercise price of ` 63, ` 61, ` 93 and ` 77 respectively per option.
During the Financial Year 2010-11, the Remuneration/ Compensation Committee allotted 54,950 equity Shares to 27 employees under the eSop 2007. These shares are listed on the Bombay Stock exchange Limited and the National Stock exchange of india Limited.
Total no. of stock options available under the Scheme 3,81,250
exercise price ` 20/- per option
exercise period 3 years
Total no. of stock options granted under the scheme 3,81,250
Stock options lapsed 1,42,000
Stock options vested but not exercised 18,750
Stock options exercised 2,20,500
outstanding Stock options 18,750
Summary of ESOP 2007 as on 31st March 2011:
Total no. of stock options granted under the Scheme 24,26,575
exercise price:
14,42,000 options ` 63/- per option
2,44,000 options ` 63/- per option
2,07,500 options ` 61/- per option
1,00,000 options ` 93/- per option
6,11,500 options ` 77/- per option
exercise period 3 years.
Total no. of stock options granted under the scheme 26,05,000
Stock options lapsed 5,35,500
Stock options vested but not exercised 2,59,500
Stock options exercised 60,250
outstanding Stock options 20,09,250

12
Further, the Remuneration/Compensation Committee allotted 1000 equity Shares to one employee under the eSop 2005 and 2,500 equity Shares to an employee under the eSop 2007 on 2nd May, 2011.
Consequent to the above allotments made under the aforesaid eSop Schemes, the paid up equity Capital of the Company has increased from ` 24,32,08,000/- (as on 1st April, 2010) to ` 24,43,07,500/- as of date. The disclosures required to be made in the Directors’ Report in respect of the aforesaid eSop Schemes, in terms of the SeBi (eSop Scheme) Guidelines, 1999 are contained in Annexure A forming part of the Directors’ Report.
15. Employee Stock Option Plan - 2010 through trust route.
Your Company has introduced another eSop Scheme viz. employee Stock option plan-2010 (eSop-2010) through trust route. The said Scheme was approved by the shareholders in the 16th Annual General Meeting of the Company held on 30th August, 2010. Your Company has also set up an employee welfare trust viz. “emkay employee Welfare Trust’ (the Trust). The new scheme will facilitate grant of option through Remuneration / Compensation Committee and /or trust to the employees of the Company in the form of stock options exercisable into equity shares. on the recommendation of the Remuneration / Compensation Committee of your Company, the trustee of the emkay employee Welfare Trust have granted 5,55,000 stock options on 21st october, 2010 @ ` 93/- per option to the eligible employees of the Company during the year under review.
Total no. of stock options available under the Scheme
24, 41,995
exercise price -- 5,55,000 options ` 93/- per option
exercise period 3 years
Total no. of stock options granted under the scheme
5,55,000
Stock options lapsed Nil
Stock options vested but not exercised Nil
Stock options exercised Nil
outstanding Stock options 5,55,000
Further, the Company granted 27,000 Stock options on 2nd May, 2011 to the employee(s) under the said Scheme (each option carrying entitlement for one share of the face value of ` 10 each) at an exercise price of ` 63 per option.
Details required to be provided under the Securities and exchange Board of india (employees Stock options Scheme and employee Stock purchase Scheme) Guidelines, 1999 are set out in Annexure “A” to this report.
16. Directors
At the 17th Annual General Meeting, Mr. G. p. Gupta and Mr. S. K. Saboo retire by rotation and being eligible, offer themselves for re-appointment.
The above re-appointments form part of the Notice of the forthcoming 17th Annual General Meeting and the respective resolutions are recommended for your approval.
porfiles of these Directors as required under Clause 49 of the Listing Agreement are given in the Notice of the 17th Annual General Meeting.
17. Directors’ Responsibility Statement
pursuant to the provisions of Section 217 (2AA), of the Companies Act, 1956, the Directors confirm that:
a) in the preparation of the annual accounts, the applicable accounting policies and accounting standards have been followed consistently and proper explanation relating to material departures, if any, have been made;
b) Appropriate accounting policies have been selected and applied consistently and that judgments and estimates made are reasonable and prudent so as to give a true and fair view of the state of affairs of the Company as on 31st March, 2011 and of its profit for the year ended on that date;
c) proper and sufficient care has been taken for the maintenance of adequate accounting records in accordance with the provisions of the Companies Act, 1956 for safeguarding the assets of the Company and for preventing and detecting frauds and other irregularities;
d) The annual accounts have been prepared on a going concern basis.
18. Conservation of energy, technology absorption, foreign exchange earnings and outgo
The information as required under Section 217(1)(e) of the Companies Act, 1956 read with the Companies (Disclosure of particulars in the Report of the Board of Directors) Rules, 1988 is given in Annexure B to this report.
Summary of ESOP 2010 (through trust route) as on 31st March 2011:

13
19. Corporate Governance
The Company adheres to the principles of Corporate Governance mandated by the Securities and exchange Board of india and has implemented all the prescribed stipulations. As required by Clause 49 Vi of the Listing Agreement, a detailed report on Corporate Governance forms part of this Annual Report. The Auditors’ Certificate on compliance with Corporate Governance requirements by the Company is attached to the Corporate Governance Report.
The declaration regarding compliance with Company’s Code of Conduct for Directors and Senior Management personnel and Ceo/CFo certification are furnished in Annexure ‘1’ and Annexure ‘2’ respectively to the Corporate Governance Report.
20. Particulars of Employees
in accordance with the provisions of Section 217(2A) read with the Companies (particulars of employees) Rules, 1975 as amended by the Companies (particulars of employees) Amendment Rules , 2011, the names and other particulars of employees are to be set out in the Directors’ Report, as an addendum thereto. However, as per the provisions of Section 219(1)(b)(iv) of the Companies Act, 1956, the Report and accounts as therein set out, are being sent to all members of the Company excluding the aforesaid information about the employees. Any member, who is interested in obtaining such particulars about employees, may write to the Company Secretary at the Corporate office of the Company.
21. Auditors
Messrs B. L. Sarda & Associates, Chartered Accountants, retire as the Statutory Auditors of the Company at the ensuing Annual General Meeting and offer themselves for re-appointment. A certificate from them has been received to the effect that their re-appointment as Statutory Auditors of the Company, if made, would be within the limits prescribed under Section 224(1B) of the Companies Act, 1956. Further the Statutory Auditors have confirmed that they have subjected themselves to the peer review process of iCAi and hold a valid certificate issued by the ‘peer Review Board’ of the said institute as required by Clause 41 of the Listing Agreement.
The Audit Committee of the Board has recommended their re-appointment. The appointment is subject to approval of the Members at the forthcoming 17th Annual General Meeting.
22. Corporate Social Responsibility
The Ministry of Corporate Affairs has released a set of Voluntary Guidelines on Corporate Social Responsibility (CSR) in December,
2009. The Company has evolved a Corporate Social Responsibility policy and is actively practicing the policy. The CSR Committee comprises of some of Head of Departments viz. Mr. Rajesh Sharma - Chief operating officer, Ms. Divya Gandhi - Head-General insurance and principal officer and Ms. Ruth Singh - Head-Human Resources. The objectives of CSR policy are to contribute to social and economic development of the communities in which the Company operates, provide opportunities to employees to contribute to society through service and contributions, monetary and otherwise and to generate, through its CSR initiatives, a community goodwill for the Company and help reinforce a positive and socially responsible image of the Company as a corporate entity. provisions will be made by CSR Committee from the annual allocation of the CSR budget on the activities viz. Adoption of Village, education, Skill Development, Vocational Training etc.
23. Acknowledgement
Your Directors would like to take this opportunity to express sincere gratitude to their customers, bankers and other business associates for the continued cooperation and patronage. Your Directors gratefully acknowledge the ongoing co-operation and support provided by the Government, Regulatory Bodies and the Stock exchanges.
Your Directors place on record their deep appreciation for the exemplary contribution made by employees at all levels. The Directors also wish to express their gratitude to the valued shareholders for their unwavering trust and support.
On behalf of the Board of Directors
Krishna Kumar KarwaManaging Director & CFo
place : Mumbai
Date : 20th May, 2011
Prakash KacholiaManaging Director

14
Disclosures in compliance with Clause 12 of the Securities and exchange Board of india (employee Stock option Scheme) and (employee Stock purchase Scheme) Guidelines, 1999, as amended, are set below.
ANNeXURe “A” FoRMiNG pART oF THe DiReCToRS’ RepoRT
Sr. No. Particulars
ESOP Scheme-2005 ESOP Scheme-2007
ESOP Scheme-2010 ( Through Trust)
1 Total Number of options under the plan
3,81,250 24,26,575 24,42,725
2 options Granted during the year -- 7,11,500 5,55,000
3 exercise price & the pricing formula
` 20/- exercise price considered is the closing market price as on the day preceding the date of the grant on that stock exchange which has had the maximum trading volume of the company’s shares.
exercise price considered is the closing market price as on the day preceding the date of the grant on that stock exchange which has had the maximum trading volume of the company’s shares.
4 options vested (during the year) -- 2,30,300 --
5 options exercised (during the year)
33,250 48,950 --
6 The total number of shares arising as a result of exercise of options during the year.
32,250* 46,450* --
7 options lapsed (during the year) 1,000 2,20,000 --
8 Variation in terms of options -- -- --
9 Money realized by exercise of options ( during the year)
` 6,65,000 ` 30,83,850 --
10 Total number of options in force at the end of the year.
18,750 20,09,250 5,55,000
11 employee wise details of options granted to
i. Senior Management personnel during the year
-- Sandeep Sharma - 50,000om Ahuja - 1,00,000
Sandeep Singal – 2,40,000Anish Damania – 2,40,000Ajay parmar – 75,000
15
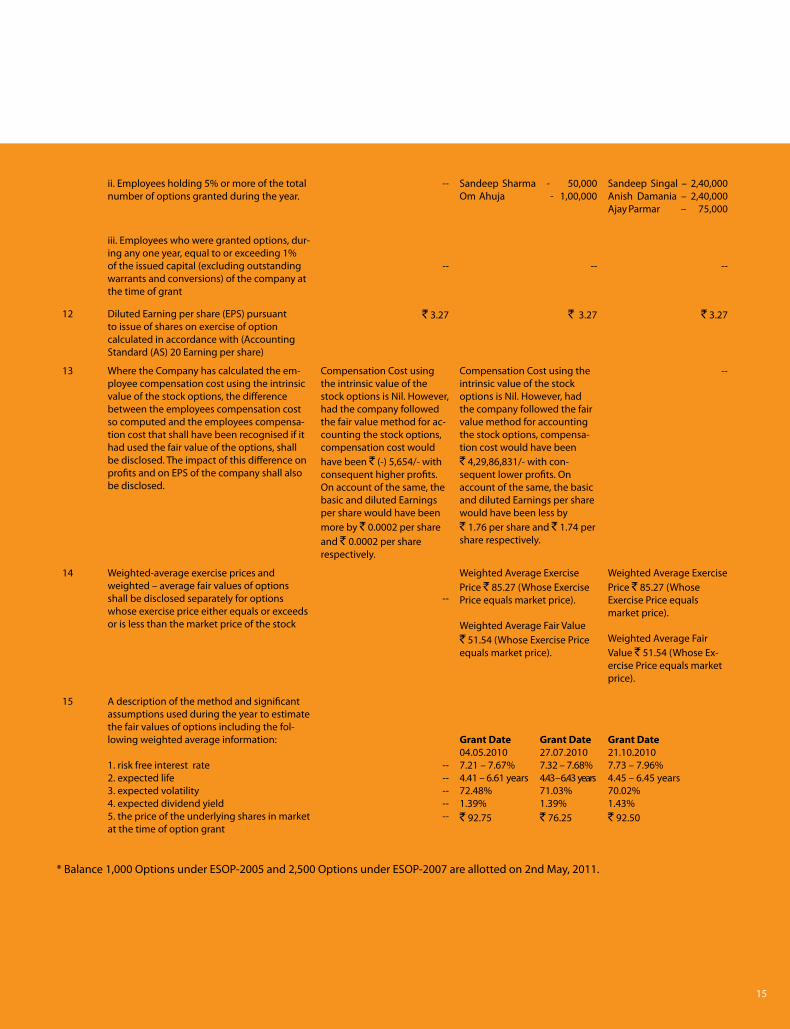
ii. employees holding 5% or more of the total number of options granted during the year.
-- Sandeep Sharma - 50,000om Ahuja - 1,00,000
Sandeep Singal – 2,40,000Anish Damania – 2,40,000Ajay parmar – 75,000
iii. employees who were granted options, dur-ing any one year, equal to or exceeding 1% of the issued capital (excluding outstanding warrants and conversions) of the company at the time of grant
-- -- --
12 Diluted earning per share (epS) pursuant to issue of shares on exercise of option calculated in accordance with (Accounting Standard (AS) 20 earning per share)
` 3.27 ` 3.27 ` 3.27
13 Where the Company has calculated the em-ployee compensation cost using the intrinsic value of the stock options, the difference between the employees compensation cost so computed and the employees compensa-tion cost that shall have been recognised if it had used the fair value of the options, shall be disclosed. The impact of this difference on profits and on epS of the company shall also be disclosed.
Compensation Cost using the intrinsic value of the stock options is Nil. However, had the company followed the fair value method for ac-counting the stock options, compensation cost would have been ` (-) 5,654/- with consequent higher profits. on account of the same, the basic and diluted earnings per share would have been more by ` 0.0002 per share and ` 0.0002 per share respectively.
Compensation Cost using the intrinsic value of the stock options is Nil. However, had the company followed the fair value method for accounting the stock options, compensa-tion cost would have been ` 4,29,86,831/- with con-sequent lower profits. on account of the same, the basic and diluted earnings per share would have been less by ` 1.76 per share and ` 1.74 per share respectively.
--
14 Weighted-average exercise prices and weighted – average fair values of options shall be disclosed separately for options whose exercise price either equals or exceeds or is less than the market price of the stock
--
Weighted Average exercise price ` 85.27 (Whose exercise price equals market price).
Weighted Average Fair Value ` 51.54 (Whose exercise price equals market price).
Weighted Average exercise price ` 85.27 (Whose exercise price equals market price).
Weighted Average Fair Value ` 51.54 (Whose ex-ercise price equals market price).
15 A description of the method and significant assumptions used during the year to estimate the fair values of options including the fol-lowing weighted average information:
1. risk free interest rate2. expected life3. expected volatility4. expected dividend yield5. the price of the underlying shares in market at the time of option grant
----------
Grant Date04.05.20107.21 – 7.67%4.41 – 6.61 years72.48%1.39%` 92.75
Grant Date27.07.20107.32 – 7.68%4.43 – 6.43 years71.03%1.39%` 76.25
Grant Date21.10.20107.73 – 7.96%4.45 – 6.45 years70.02%1.43%` 92.50
* Balance 1,000 options under eSop-2005 and 2,500 options under eSop-2007 are allotted on 2nd May, 2011.

16
Energy Conservation, Technology Absorption and Foreign Exchange Earnings and Outgo
a) Energy Conservation: Since the Company is engaged in financial services, it does not consume substantial energy. However, as a
responsible organiszation, the Company has adopted various environment friendly measures in order to conserve energy. The same
are as follows:
1. installation of capacitors to save power.
2. installation of power saving TFT monitors.
3. enabled automatic power off modes on idle monitors.
4. installation of Blade Servers in Data Centre which consume optimum power & space.
5. Minimal air-conditioning usage.
6. Fixed time schedules (timers enabled) for operating air-conditioners.
7. Shutting off electronic devices when not in use.
8. installation of power saving electrical equipments like CFL.
9. preventive maintenance of all electrical equipments for better efficiency and power consumption.
10. educating employees on ways to conserve electricity and other natural resources and a strict adherence to the same is ensured.
b) Technology Absorption: it is the policy of your Company to keep abreast of all the technological advancements in its field of opera-
tion and particularly so in the field of information Technology. The Management places immense importance on careful analysis and
absorption of the latest technology as well as on the development of technologies that abet the achievement of business goals and
improve its performance in the long run.
c) Details of Foreign Exchange Earnings and Outgo:
i) The foreign exchange inflows were ` 30,22,708/-
ii) The foreign exchange outflows were ` 1,01,10,915/-
ANNeXURe “B” FoRMiNG pART oF THe DiReCToRS’ RepoRT

17
ECONOMIC OVERVIEW
The indian economy is growing at a steady rate, though marginally lower than earlier anticipated. According to Central Statistics office (CSo) figures, it clocked a robust 8.5% during fiscal 2010-11, just short of the government’s earlier prediction of 8.6%.
A total of nine interest rate hikes between March 2010 and May 2011, aimed at quelling persistently high inflation, have effectively put the breaks on economic growth. These rate hikes impacted the industrial and manufacturing sector output, especially in the last quarter of FY2010-11. The country’s manufacturing sector growth slowed to 8.3% in 2010-11 from 8.8% in the previous year. Growth of the mining and quarrying sector also slowed down to 5.8% in 2010-11 from 6.9% in 2009-10, largely due to delays in government clearances and the pace of services sector growth declined somewhat to 9.4% in FY11 from 10.1% in FY10. Agricultural and allied sectors’ growth at 6.6% for FY2010-11, however, contributed strongly to overall growth due to abundant rains and a bumper harvest.
The world economy has seen steady growth too, putting crisis times behind it. The oeCD forecasts that the world’s GDp will expand by 4.2% this year and 4.6% in the next. in a vote of confidence in the global economy’s return to normalcy, it also forecast that trade volumes will grow by 8.1% this year and 8.4% in the one following.
INDUSTRY OVERVIEW
The financial sectors of both india and the world economy have finally emerged from the shadows of recession. However, they are passing through an equally trying phase – that of consolidation.
in india, while economic growth is back on its pre-crisis trajectory, inflation control has assumed paramount importance. in conjunction with supply side measures by the Government, the RBi has been tightening monetary policy to reign in inflation. With higher than expected rate hikes, financial markets have been feeling the heat; margins of organisations have come under pressure and the overpricing that may have existed on the bourses is slowly giving way to more perfect pricing.
in addition, political issues loom large. Major political movements could become a trigger for the domestic bourses. other simmering issues that could impact the bourses are the fall outs of the 2G scam and others that could get unearthed with the widespread interest in anti-corruption legislation and the demands for action against it.
Lastly, a disturbing structural change has emerged in the equity markets. The number of retail investors has not been increasing
MANAGeMeNT DiSCUSSioN AND ANALYSiS
at a healthy rate. A glance at the increase in demat accounts (as a proxy for the number of retail investors) depicts a decreasing incremental trend. over the last four years, the number of demat account holders have risen from 114.23 lac in 2007 to 150 lac in 2008, 166.31 lac in 2009 and finally to 179.74 lac in 2010. This trend, seen alongside the fact that 75% of the overall volumes in the equity market come from the derivatives segment, not in cash, seems to suggest that retail participants are more drawn towards speculation and less towards investing. Again, volumes in equity derivatives have been skewed towards options. This is an issue of concern since it culminates in lower commissions, which impacts revenue growth.
Meanwhile, world financial markets have seen their share of corrections too. After crude touching USD115 per barrel and gold climbing to all time highs, there has been some respite. The end of osama Bin Laden’s regime, which seemed to symbolise the attenuation of tensions in the Middle east, marked a deep cut in the CRB- Jefferries commodities index, amongst others. Crude dipped by around 10% in a single day and silver fell by a whopping 25%. As a result of these market movements, amongst other things, the US $ started hardening too.
in the short term, the ongoing consolidation may hurt both the economy and the markets marginally. But in the long term, the consolidation will take financial markets to a higher level of stability.
BUSINESS OVERVIEW
emkay has come a long way from its humble beginning around two decades ago. With a knowledge centric approach and our mission to provide our customers with secure, customized and comprehensive financial solutions and thereby achieve sustained growth, we now have a client base of around 1 lac non institutional and over 140 institutional clients and an employee strength of more than 900, including a 28-personnel rich research team that covers 273 stocks across 18 sectors including iT, pharma and Retail, amongst others. We have a retail network of 374 branches and franchisees and an average daily turnover of ` 1000 crore. We have received prestigious awards that have been bestowed upon us by financial sector bigwigs like Thomson Reuters, Asiamoney and The Wall Street Journal. We continue to make efforts towards setting new benchmarks and outperforming them.
Equity
emkay caters to both institutional and non-institutional clients with a more or less equal contribution to revenue from both segments. While the institutional business contributed 49.43% of total business in FY10-11, the non-institutional segment accounted

18
for the remaining 50.57%; a marginal shift from the previous year’s ratio of 47.04: 52.96 from institutional: non-institutional. The total number of institutional clients increased from 122 in FY09-10 to 143 in FY10-11 and the number of active non-institutional clients was 39,601 through 61 branches and 313 franchisees.The newly empanelled institutional clients comprise well known financial market players including mutual funds like iDBi Mutual Fund, Fiis like UBS – Swiss Finance Corporation, Standard Chartered Bank (Mauritius) Ltd. and BNp paribas Arbitrage, pMS like iDFC Asset Management Co. Ltd. and UTi invest Advisory Service Ltd., banks like The Catholic Syrian Bank Ltd. and Tamilnadu Mercantile Bank Ltd. and other corporates like Securities Trading Corporation of india Ltd. and Kotak investment Advisors Ltd.
emkay offers traders and investors, the most advanced and extensive online trading facilities through ‘eMTRADe’, its online trading portal. This portal offers a convenient and easy to use platform to invest in equity and various other products. Buying and selling shares is just a click away. Apart from convenience, emtrade also offers access to comprehensive research information, stock picks and mutual fund recommendations among other offerings. There are tailored services and trading strategies available to different types of customers: day traders, high-volume traders, derivatives traders and others.
The number of Dp accounts during the year went up from 75,200 to 80,096.
Research
emkay offers its clients premium research which is undertaken by an experienced and qualified team of 28 analysts who are assisted by production and database resource people. our research team actively covers 151 stocks and also researches another 122 additionally. The team released 28 industry reports during the year and also organised 36 road shows and 5 conferences.
Investment Banking
emkay is a SeBi registered Category i Merchant Banker. The company derived an income of ` 1287 lac from its investment banking operations during the year. This is marginally lower than the ` 1380 lac it garnered from this segment at the end of FY10. The company does, however, have mandates in hand for various debt syndication and corporate advisory services worth ` 158 crore and many more such deals in the pipeline.
Portfolio Management & Distribution Services
in keeping with our mission to provide our customers with secure, customized and comprehensive financial solutions, the company
has carved out its pMS division and transferred it to its wholly owned subsidiary, emkay investment Managers Limited with effect from Jan 1, 2011. our pMS has consistently outperformed the benchmark and helped in building wealth for our clients. The investment framework rests on a set of well established but flexible principles that draw on the concept of “economic” earning power and cash return on investment, as understood by the owner of a business. The investment value is assessed based on a detailed and rational analysis of facts. Most of all, our fee structure is transparent with no set up fee and entry loads.
The company has a network of 7 private Wealth branches located in Mumbai, Ahmedabad, New Delhi, Kanpur, Bangalore, Jaipur and pune with a total staff of 78 experienced and qualified professionals. The company’s distribution desk aims at strengthening the line of investment services offered. The offerings include ipos, bonds, structured products, debt and fixed income instruments amongst others.
Commodity
india currently has five national level commodities exchanges which have been set up under overall control of Forward Market Commission (FMC) of Government of india. These are highly regulated and subjected to various laws such as the Companies Act, Stamp Act, Contracts Act, etc., to ensure investor protection. This market is expected to get a boost as banks and foreign players will soon receive the go ahead to start trading in mini-contracts. The volumes on commodity exchanges are expected to increase by 20% by the end of FY12 itself. And our clients are bound to get a piece of the action when this happens.
Growth in Emkay Commotrade Revenue over the years
161
0
100
200
300
400
500
600
700
800
900
1000
360
582637
935
2006-2007 2007-2008 2008-2009 2009-2010 2010-2011
Year
(` in
lac)

19
emkay offers its clients the opportunity to trade in commodities through its 100% subsidiary ‘emkay Commotrade Limited’, which is a member of the Multi-Commodity exchange of india Limited (MCX); the National Commodity & Derivatives exchange Limited (NCDeX), the National Spot exchange Limited (NSeL) and indian Commodity exchange Limited (iCeX). We have intensified our focus on this segment by increasing the number of dedicated personnel from 66 to77 and the number of active franchisees from 103 to 114 between FY10 and FY11. The number of active clients in this segment increased from 5,272 to 7,731 and the gross income from this business has increased by nearly 50% from ̀ 6.37 crore to ` 9.34 crore.
Insurance
According to a study done by the Confederation of indian industries (Cii) and ernst and Young (e&Y), the insurance sector is poised for a quantum leap in performance with unprecedented growth opportunities, notwithstanding a temporary sliding growth curve. emkay has a presence in both the life and non-life broking businesses and offers policies to corporates and individuals through its 100% subsidiary emkay insurance Brokers Limited. The retail business accounts for 47.9% of the business income from this segment while corporate policy sales account for the balance. The life insurance business contributes 41.4% of total brokerage while the non-life segment brings in the remaining 58.6%.During the current fiscal, while the total number of policies fell marginally from 7182 to 6270, the premiums collected increased from ` 939 lac to ` 1154 lac and brokerage rose from ` 103 lac to ` 123 lac.
Credit and Finance
emkay Fincap Limited, a 100% subsidiary, carries out NBFC activities like financing against shares and margin funding. The amount deployed in margin funding increased from ` 1,973 lac in 2009-10 to ` 2,675 lac in 2010-11. The pAT from this business also increased from ` 120 lac to ` 193 lac during the same period.
OPPORTUNITIES AND THREATS
The indian economy is currently undergoing what can best be described as a belt tightening experience. With interest rates rising, corporate houses are facing the pinch and this is reflected in their valuation on the bourses. So, while volumes on stock exchanges have risen, these have been buoyed by trades in the F&o segment, rather than the cash segment and this in turn impacts broking incomes.
Mutual fund products have temporarily lost their sheen, given the stagnation in equity AUMs. Also, the growth in the insurance sector is moderating , although it is expected to remain steady.
The commodity segment of the business, however, offers great promise as a game changing regulation is likely to give a fillip to volumes in the near future.
However, we are well aware of the situation and sixteen long years of experience in the business has equipped us with ample armoury of strategies which enable us to cope with sagging markets and make the most of surging ones. During times when business seems to have lulled, we take the opportunity to focus on re-energizing our HR and buffing up their strengths. We use the hiatus in hectic activity to organise conferences which enable us to stay in touch with clients and retain our market share.
We have received numerous awards for being the best broker, our research, our strategy, our stock picking ability, and more, from reputed financial giants like Thomson Reuters, The Wall Street Journal Asia and Asiamoney. These are but testimonies of our strengths.
FUTURE OUTLOOK
We aim to achieve a robust top line in 2011-12 through a well planned and meticulously implemented strategy of rationalization and consolidation. We will focus on increasing the efficiency at the branches and may consolidate branch network in the process. on the supply side, we will diligently implement cost rationalization in operations towards improving our front-end. At the same time, we will change gears and focus on the mass affluent and affluent markets; a change in our strategic focus from ‘micro retail’.
We look forward to being leaner and stronger in FY 2011-12. We look forward to being ready for any challenges that we are presented with.
RISK AND CONCERNS
in the highly competitive environment that we are faced with at present, no risk is too small and no concern can go unheeded. in order to stay ahead of the game, we anticipate threats and preempt them or meet them head-on with suitable solutions. Some of the risks that we identify include
Economic Environment
Any adverse change in the economic conditions of the country due to the rising interest rates, persistent inflation, changes in tax, trade, fiscal and monetary policies, etc. could have an adverse effect on the company’s business, financial condition and results of operations.

20
Despite buoyant macro economic conditions in india, the RBi and government have together been focusing on inflation control. However, with a robust GDp growth rate of 8.5% in 2011, favourable demographics, rising per capita income, extremely low penetration of demat accounts as well as the increasing share of equity assets in household financial savings, india’s value proposition remains strong for sustained long term growth. The company is working towards creating a business model relevant to all market cycles.
Competition Risk
We belong in an industry segment where margins are wafer thin and competition abound. emkay is emerging as an important player in the financial sector with its pan india presence and comprehensive bouquet of product offering. The company’s strengths, viz. strong and proven business model, sound financials, extensive reach, well-equipped infrastructure, strong backend processes, long term relationships with clients and an experienced management team, give it a significant edge over its competitors. Thus, emkay believes that this risk is sufficiently mitigated, if not entirely.
Strategy Risk
A skewed business strategy could easily result in lost opportunities. Annual business plans and the long term business strategy are discussed thoroughly before being vetted by the Board of Directors. in addition, midterm reviews of the business strategy and the annual plans ensure that the Management initiates a mid-course correction, should the situation so warrant. The long term business strategy comprises:
• Cost rationalisation in operations towards improvements in the front-end
• Focus on the mass affluent and affluent markets; a shift from micro retail
• Branch consolidation: 53 branches by the end of Q2 2011-12
Regulatory Risk
The company’s growth and goodwill can be negatively affected if there is a violation of or non-compliance with regulatory norms. The Company has always maintained the highest level of compliance with regulatory norms. our legal department is well experienced and trained to ensure conformity to all the legal requirements. Hence we do not expect to be significantly affected by this risk.
HUMAN RESOURCES
Given our knowledge centric approach to business, we believe that our people are our most valuable resource. They are the capital on
which our business is built and they are the assets that enable us to reap rich dividends. We continually seek to ensure their wellbeing and do all we can to improve the quality of their output. As in the past, in 2010-11, we have taken a number of initiatives towards these ends. We have:
• introduced Group Term Life insurance for all employees, apart from Mediclaim and Group personal Accident cover.
• Upgraded the HR information system ‘Adrenalin’ to include attendance, leave modules amongst others.
• Revamped the performance Management system by setting KRAs and SMART goals for all verticals and roles.
• Devised a fully online system which focuses on competencies and training needs and gives feedback on performance.
• Rolled out a Reward and Recognition system and presented quarterly awards to star performers.
in addition, to refresh the spirit of the employees, regular outings and other recreational activities were organized. We also presented awards to employees who have put in long years of service (10 years plus) at a special function organized during our annual Diwali party. Stepping off the beaten track, we organised an ‘emkay’s Got Talent’ show in which we discovered and displayed the multi-faceted talents of our staff.
We also rolled out the revised employee policy Manual and framed our Corporate Social Responsibility (CSR) policy in our endeavor for social and economic development of the extended society we live in.
This fiscal has also been packed with training programmes and refresher courses towards the development of more subtle features of our employees. programs were customised for across various organizational divisions from the back office staff to the top management. For the institutional team, we organized knowledge based programmes with themes such as equity Valuation and Technical Analysis in addition to programmes like Business etiquette, aimed at honing their soft skills. Similarly, our operations (back office) desk and BMs were given training in Managerial effectiveness while our back office executives were sent for programmes in Telephone and email etiquette. To hone the skill sets of our entire staff at head office, we organized training programmes in Advanced excel and for the institutional Research team, training in Research report writing was imparted. Last, but not the least, we organized Business Transformation Workshops for our senior management.

21
These programmes covered more 300 employees across the different verticals and subsidiaries of emkay. We also conducted 7 induction programmes for all those who newly joined the company’s Ho and Branches to get them acquainted with our top management, policies and the culture of the organization.
FINANCIAL OVERVIEW
Consolidated:
INCOME : The Company recorded a total income of ` 13,299 lac in 2010-11, as compared to ` 12,581 lac for 2009-10, a growth of 5.7%.
EBIDTA : The Company’s eBiDTA stood at ` 2,410 lac against ` 2,189 lac in 2009-10, an increase of 10.09%.
PAT: The profit After Tax stood at ` 1,184 lac against ` 940 lac in 2009-10, an increase of 25.95%.
Standalone:
INCOME : The Company recorded a total income of ` 11,826 lac, as compared to ` 11,556 lac for 2009-10, a growth of 2.33% .
EBIDTA: The company’s eBiDTA stood at ` 1,828 lac against ` 1,964 lac in 2009-10, a decrease of 6.92%.
PAT: The profit After Tax stood at ` 833 lac against ` 840 lac in 2009-10, a decrease of 0.83%. The company also declared a dividend of 10%. i.e. ` 1 per share.
overall, the company is growing at a more moderate rate in keeping with the consolidation in the economy and financial sector.
INTERNAL CONTROL SYSTEMS AND THEIR ADEQUACIES
in any industry, the processes and internal control systems play a critical role in ensuring the health of a company. emkay’s well defined organisational structure, documented policy guidelines, defined authority matrix and internal controls ensure efficiency of operations, compliance with internal policies, applicable laws, regulations and protection of resources. Moreover, the Company continuously upgrades these systems in line with the best available practices.
The internal control systems are supplemented by extensive internal audits, regular reviews by management and standard policies and guidelines to ensure reliability of financial and all other records to prepare financial statements and other data. The Management information System provides timely and accurate information for effective control. Rigorous business planning as well as expense, capital and manpower budgeting processes ensure that progress is monitored against targets, and control is exercised on all major expenses, so that actual spending is in accordance with the budgets.
CAUTIONARY STATEMENT
Certain statements in this Management Discussion and Analysis describing the Company’s objectives, projections, estimates, expectations or predictions may be forward looking statements within the meaning of applicable securities, laws and regulations. Although the expectations are based on reasonable assumptions, the actual results could materially differ from those expressed or implied.

22
CoRpoRATe GoVeRNANCe RepoRT(As per Clause 49 of the Listing Agreement entered into with the Stock exchanges)
I. Company’s Philosophy on Corporate Governance
The Company believes in and practices good corporate gov-ernance. Corporate Governance provides that a Company is directed in such a way that it performs efficiently and effectively, keeping in view the long term interest of the share-holders, while respecting laws and regulations of the land and contributing, as a responsible corporate citizen, to the national exchequer. Your Company believes in professionalism of management, transparency and sound business ethics.
II. Board of Directors (Board)
• Composition During the year under consideration, the Board comprises
of six directors, each having expertise in their field of opera-tion. The Board has an optimum combination of executive and Non-executive Directors. out of six directors, four are Non-ex-ecutive Directors. The total number of Non-executive Directors is more than 50% of the total number of Directors which is in conformity with the requirement of Clause 49 of the Listing Agreement. The Chairman of the Board is a Non-executive and independent Director. The Chairman of the Board is neither a promoter nor a relative of the promoter of the Company nor occupying management positions at the Board level nor at one level below the Board. out of four Non-executive Direc-tors, three Directors are independent comprising 50% of total Directors and the minimum requirement as per Clause 49 is 33.33% of total Directors and therefore are in conformity with the Clause 49 of Listing Agreement.
None of the directors is a director in more than 15 public companies and member of more than 10 committees or act as Chairman of more than 5 committees across all companies in which they are directors. (For the purpose of reckoning the limit under this para, Chairmanship/Membership of the Audit Committee and the Shareholders’ Grievance Committee alone has been considered as specified in Clause 49 of Listing Agreement).
The Non-executive Directors including independent Directors on the Board possess experience and specialization in diverse fields such as legal, finance, banking, administration etc.
The brief profile of each Director is given below:
Mr. G.P. Gupta (Non-Executive Chairman, Independent)
Mr. Gian prakash Gupta has over 37 years of experience in Development Banking. He was formerly the Chairman and Managing Director of industrial Development Bank of india and Chairman of Unit Trust of india. He was associated as Director with various prominent Companies like Bharat Heavy electricals Ltd., National Aluminium Co. Ltd., Hindustan Aeronautics Ltd., power Finance Corporation Ltd., pTC india
Ltd. and NTpC Ltd. etc. Currently he serves on the Board of various listed companies, including idea Cellular Ltd., Aditya Birla Nuvo Ltd., Birla Sun Life insurance Co. Ltd., Swaraj engines Ltd., Dighi port Ltd. etc.
Mr. S. K. Saboo (Non-Executive, Non Independent Director)
Mr. Sushil Kumar Saboo has more than 43 years of manage-ment experience. presently he is Group Advisor (Chairman’s office) - Aditya Birla Group, a premier business group in india.
Mr. R. K. Krishnamurthi (Non-Executive, Independent Director)
Mr. R. K. Krishnamurthi, a Solicitor in the Mumbai High Court and the Supreme Court of england, has a rich and wide experience of over 38 years in legal field. He is a retired part-ner of Mulla & Mulla Craigie Blunt & Caroe, a reputed firm of Advocates, Solicitors and Notaries.
Mr. G. C. Vasudeo (Non-Executive, Independent Director)
Mr. G. C. Vasudeo is a fellow member of the institute of Chartered Accountants of india, The institute of Company Secretaries of india, The institute of Cost and Works Accountants of india and a Law Graduate from University of Mumbai. He has wide and rich industrial experience of over 32 years. He is presently executive Director - Finance of Si Group india Limited and is in charge of Corporate Finance, Accounts and information Technology. He has been instrumental in the restructuring of the Group and also in Mergers and Acquisi-tions within the Group.
Mr. Krishna Kumar Karwa (Executive Director, Promoter)
Mr. Krishna Kumar Karwa, a rank holder member of the institute of Chartered Accountants of india, is the promoter and Managing Director & CFo of the Company. Mr. Krishna Kumar Karwa has rich and varied experience of 23 years in all aspects of the equity Capital Markets. He is also the director of West Coast paper Mills Limited.
Mr. Prakash Kacholia (Executive Director, Promoter)
Mr. prakash Kacholia, a member of the institute of Chartered Accountants of india, is the promoter and Managing Director of the Company. Mr. Kacholia has a rich experience of 22 years in the capital markets with a focus on the derivative segment. He is currently on the Board of Boi Shareholding Limited.
The Composition of the Board, Directorship/Committee positions in other companies as on 31st March, 2011, number of Meetings held and attended during the year are as follows:

23
Name of the Director Category
Board Meetings during Financial Year 2010-11
Attendance at last AGM held on 30.08.2010 Private
CompanyPublic
CompanyChairman Member
Held Attended
Mr. G. p. Gupta NeD (i) 5 5 Y 3 10 4 3
Mr. S. K. Saboo NeD 5 5 Y -- 3 -- --
Mr. R. K. Krishnamurthi NeD (i) 5 5 Y -- 2 -- 1
Mr. G. C. Vasudeo NeD (i) 5 5 Y 1 3 -- 1
Mr. Krishna Kumar Karwa eD 5 5 Y 1 5 1 2
Mr. prakash Kacholia eD 5 5 Y 1 5 1 --Note: Category: NeD – Non-executive Director, NeD (i) – Non-executive Director and independent, eD – executive Director & promoter
• Board Meetings:
During the Financial Year 2010-2011, 5 Meetings were held on 4th May, 2010, 28th May, 2010, 27th July, 2010, 29th october, 2010 and 27th January, 2011.
The gap between any two Meetings did not exceed four months.
Agenda papers containing all necessary information/docu-ments are made available to the Board in advance to enable the Board to discharge its responsibilities effectively and take informed decisions. Where it is not practicable to attach or send the relevant information as a part of Agenda papers, the same are tabled at the meeting. Considerable time is spent by the Directors on discussions and deliberations at the Board Meetings.
The information as specified in Annexure iA to Clause 49 of the Listing Agreement is regularly made available to the Board, whenever applicable, for discussion and consideration.
• CodeofConduct:
The Board of Directors has laid down a Code of Conduct for all the Board members and all the employees in the management grade of the Company. The code covers amongst other things the Company’s commitment to honest & ethical personal con-duct, transparency and compliance of laws & regulations. The Code of Conduct is posted on the website of the Company.
All the Board members and senior management person-nel have confirmed compliance with the code. A declaration signed by the Managing Directors is annexed to this report as Annexure ‘1’.
III. Committees of Directors
Audit Committee
• Composition
The present composition of the Audit Committee is as follows:
Mr. G. C. Vasudeo Chairman
Mr. G. p. Gupta Member
Mr. R. K. Krishnamurthi Member
Mr. prakash Kacholia Member
Mr. G. p. Gupta has expressed his unwillingness to continue as the Chairman of the Audit Committee of the Company and has decided to continue as the Member of the Audit Committee. Consequent to this, the Audit Committee was re-constituted on 20th May, 2011 by inducting Mr. G. C. Vasudeo as the Chair-man of the Audit Committee.
The Audit Committee comprises of three Non-executive and independent Directors and one executive Director. The Chairman of the Audit Committee is a Non-executive and independent Director. All the members of the Audit Committee are finan-cially literate. Besides, Mr. G. C. Vasudeo, Chairman of the Audit Committee, has accounting or related financial management expertise. The Statutory Auditors, internal Auditors and Head of Finance & Accounts are permanent invitees to the Meetings. Mr. Rahul Sahasrabuddhe, Companny Secretary, acts as a Secretary to the Committee.
• Meetings
During the Financial Year 2010-11, 5 Meetings were held on 4th May, 2010, 28th May, 2010, 27th July, 2010, 29th october, 2010 and 27th January, 2011. The gap between any two Meet-ings did not exceed four months. The attendance of each Com-mittee member was as under:
Other Directorship Other CommitteePositions
24
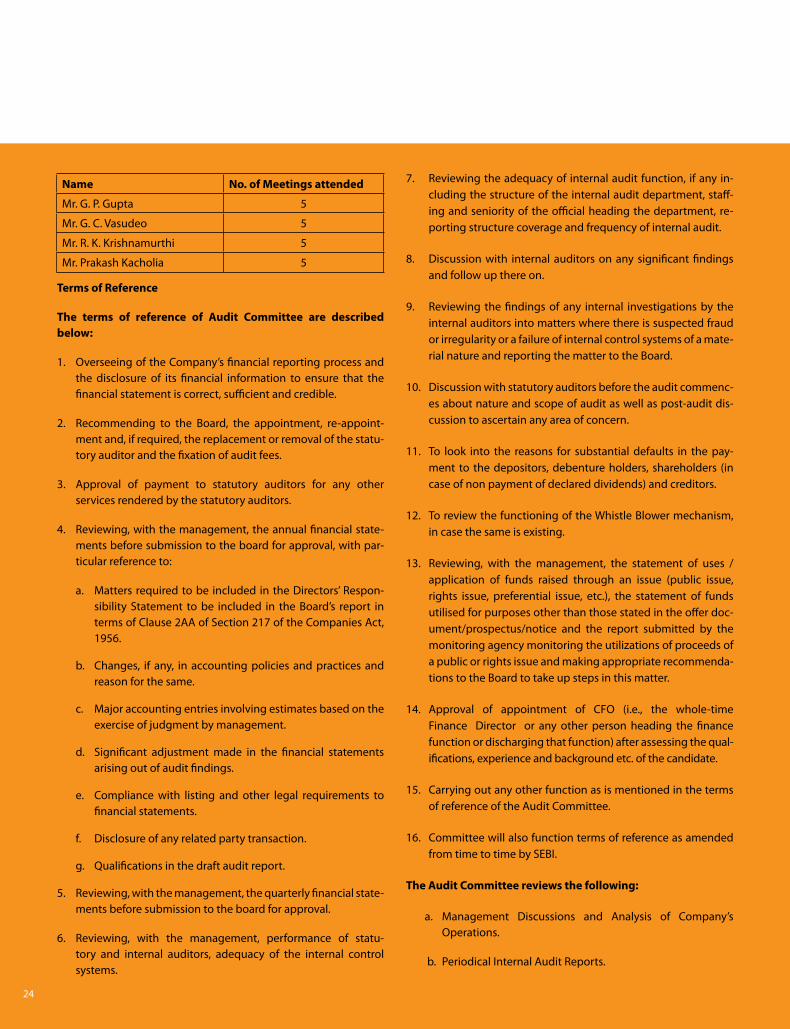
Name No. of Meetings attended
Mr. G. p. Gupta 5
Mr. G. C. Vasudeo 5
Mr. R. K. Krishnamurthi 5
Mr. prakash Kacholia 5
Terms of Reference
The terms of reference of Audit Committee are described below:
1. overseeing of the Company’s financial reporting process and the disclosure of its financial information to ensure that the financial statement is correct, sufficient and credible.
2. Recommending to the Board, the appointment, re-appoint-ment and, if required, the replacement or removal of the statu-tory auditor and the fixation of audit fees.
3. Approval of payment to statutory auditors for any other services rendered by the statutory auditors.
4. Reviewing, with the management, the annual financial state-ments before submission to the board for approval, with par-ticular reference to:
a. Matters required to be included in the Directors’ Respon-sibility Statement to be included in the Board’s report in terms of Clause 2AA of Section 217 of the Companies Act, 1956.
b. Changes, if any, in accounting policies and practices and reason for the same.
c. Major accounting entries involving estimates based on the exercise of judgment by management.
d. Significant adjustment made in the financial statements arising out of audit findings.
e. Compliance with listing and other legal requirements to financial statements.
f. Disclosure of any related party transaction.
g. Qualifications in the draft audit report.
5. Reviewing, with the management, the quarterly financial state-ments before submission to the board for approval.
6. Reviewing, with the management, performance of statu-tory and internal auditors, adequacy of the internal control systems.
7. Reviewing the adequacy of internal audit function, if any in-cluding the structure of the internal audit department, staff-ing and seniority of the official heading the department, re-porting structure coverage and frequency of internal audit.
8. Discussion with internal auditors on any significant findings and follow up there on.
9. Reviewing the findings of any internal investigations by the internal auditors into matters where there is suspected fraud or irregularity or a failure of internal control systems of a mate-rial nature and reporting the matter to the Board.
10. Discussion with statutory auditors before the audit commenc-es about nature and scope of audit as well as post-audit dis-cussion to ascertain any area of concern.
11. To look into the reasons for substantial defaults in the pay-ment to the depositors, debenture holders, shareholders (in case of non payment of declared dividends) and creditors.
12. To review the functioning of the Whistle Blower mechanism, in case the same is existing.
13. Reviewing, with the management, the statement of uses / application of funds raised through an issue (public issue, rights issue, preferential issue, etc.), the statement of funds utilised for purposes other than those stated in the offer doc-ument/prospectus/notice and the report submitted by the monitoring agency monitoring the utilizations of proceeds of a public or rights issue and making appropriate recommenda-tions to the Board to take up steps in this matter.
14. Approval of appointment of CFo (i.e., the whole-time Finance Director or any other person heading the finance function or discharging that function) after assessing the qual-ifications, experience and background etc. of the candidate.
15. Carrying out any other function as is mentioned in the terms of reference of the Audit Committee.
16. Committee will also function terms of reference as amended from time to time by SeBi.
The Audit Committee reviews the following:
a. Management Discussions and Analysis of Company’s operations.
b. periodical internal Audit Reports.
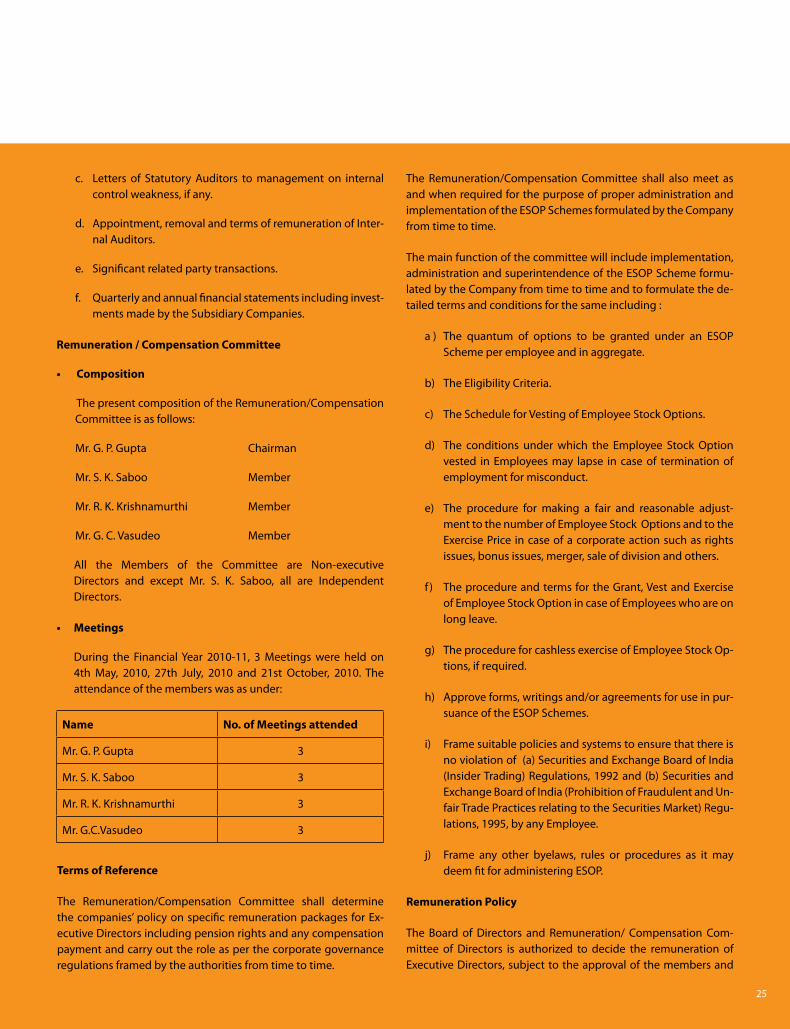
25
Name No. of Meetings attended
Mr. G. p. Gupta 3
Mr. S. K. Saboo 3
Mr. R. K. Krishnamurthi 3
Mr. G.C.Vasudeo 3
c. Letters of Statutory Auditors to management on internal control weakness, if any.
d. Appointment, removal and terms of remuneration of inter-nal Auditors.
e. Significant related party transactions.
f. Quarterly and annual financial statements including invest-ments made by the Subsidiary Companies.
Remuneration / Compensation Committee
• Composition
The present composition of the Remuneration/Compensation Committee is as follows:
Mr. G. p. Gupta Chairman
Mr. S. K. Saboo Member
Mr. R. K. Krishnamurthi Member
Mr. G. C. Vasudeo Member
All the Members of the Committee are Non-executive Directors and except Mr. S. K. Saboo, all are independent Directors.
• Meetings
During the Financial Year 2010-11, 3 Meetings were held on 4th May, 2010, 27th July, 2010 and 21st october, 2010. The attendance of the members was as under:
The Remuneration/Compensation Committee shall also meet as and when required for the purpose of proper administration and implementation of the eSop Schemes formulated by the Company from time to time.
The main function of the committee will include implementation, administration and superintendence of the eSop Scheme formu-lated by the Company from time to time and to formulate the de-tailed terms and conditions for the same including :
a ) The quantum of options to be granted under an eSop Scheme per employee and in aggregate.
b) The eligibility Criteria.
c) The Schedule for Vesting of employee Stock options.
d) The conditions under which the employee Stock option vested in employees may lapse in case of termination of employment for misconduct.
e) The procedure for making a fair and reasonable adjust-ment to the number of employee Stock options and to the exercise price in case of a corporate action such as rights issues, bonus issues, merger, sale of division and others.
f ) The procedure and terms for the Grant, Vest and exercise of employee Stock option in case of employees who are on long leave.
g) The procedure for cashless exercise of employee Stock op-tions, if required.
h) Approve forms, writings and/or agreements for use in pur-suance of the eSop Schemes.
i) Frame suitable policies and systems to ensure that there is no violation of (a) Securities and exchange Board of india (insider Trading) Regulations, 1992 and (b) Securities and exchange Board of india (prohibition of Fraudulent and Un-fair Trade practices relating to the Securities Market) Regu-lations, 1995, by any employee.
j) Frame any other byelaws, rules or procedures as it may deem fit for administering eSop.
Remuneration Policy
The Board of Directors and Remuneration/ Compensation Com-mittee of Directors is authorized to decide the remuneration of executive Directors, subject to the approval of the members and
Terms of Reference
The Remuneration/Compensation Committee shall determine the companies’ policy on specific remuneration packages for ex-ecutive Directors including pension rights and any compensation payment and carry out the role as per the corporate governance regulations framed by the authorities from time to time.
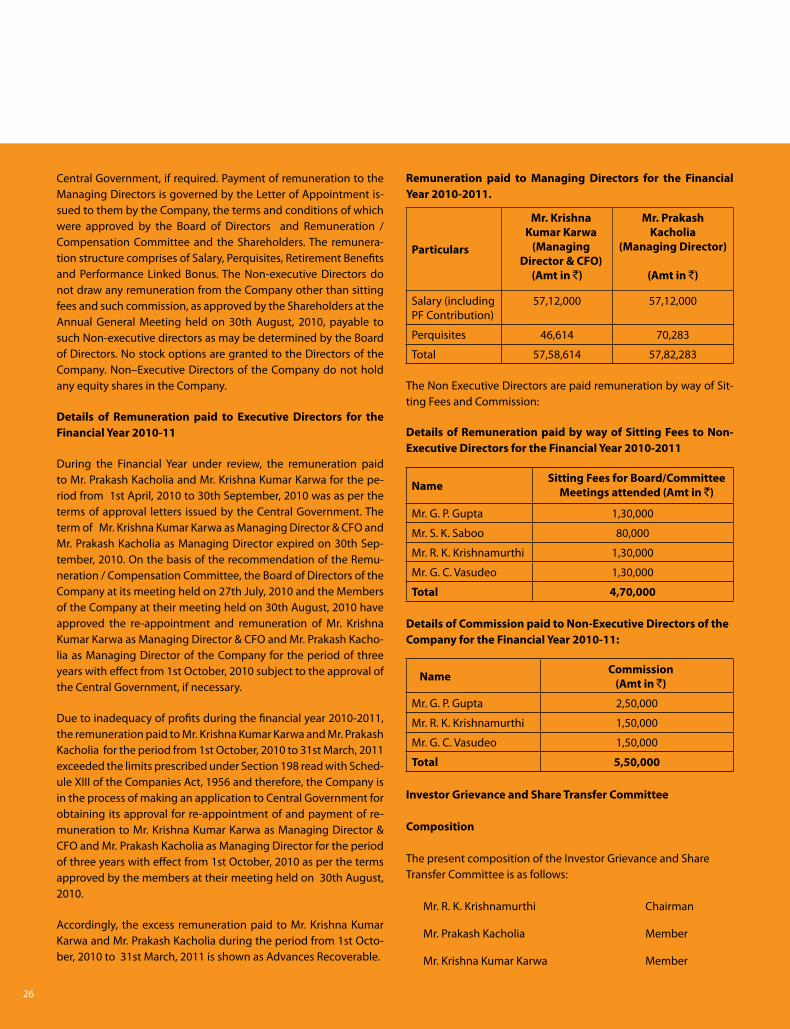
26
Central Government, if required. payment of remuneration to the Managing Directors is governed by the Letter of Appointment is-sued to them by the Company, the terms and conditions of which were approved by the Board of Directors and Remuneration / Compensation Committee and the Shareholders. The remunera-tion structure comprises of Salary, perquisites, Retirement Benefits and performance Linked Bonus. The Non-executive Directors do not draw any remuneration from the Company other than sitting fees and such commission, as approved by the Shareholders at the Annual General Meeting held on 30th August, 2010, payable to such Non-executive directors as may be determined by the Board of Directors. No stock options are granted to the Directors of the Company. Non–executive Directors of the Company do not hold any equity shares in the Company.
Details of Remuneration paid to Executive Directors for the Financial Year 2010-11
During the Financial Year under review, the remuneration paid to Mr. prakash Kacholia and Mr. Krishna Kumar Karwa for the pe-riod from 1st April, 2010 to 30th September, 2010 was as per the terms of approval letters issued by the Central Government. The term of Mr. Krishna Kumar Karwa as Managing Director & CFo and Mr. prakash Kacholia as Managing Director expired on 30th Sep-tember, 2010. on the basis of the recommendation of the Remu-neration / Compensation Committee, the Board of Directors of the Company at its meeting held on 27th July, 2010 and the Members of the Company at their meeting held on 30th August, 2010 have approved the re-appointment and remuneration of Mr. Krishna Kumar Karwa as Managing Director & CFo and Mr. prakash Kacho-lia as Managing Director of the Company for the period of three years with effect from 1st october, 2010 subject to the approval of the Central Government, if necessary.
Due to inadequacy of profits during the financial year 2010-2011, the remuneration paid to Mr. Krishna Kumar Karwa and Mr. prakash Kacholia for the period from 1st october, 2010 to 31st March, 2011 exceeded the limits prescribed under Section 198 read with Sched-ule Xiii of the Companies Act, 1956 and therefore, the Company is in the process of making an application to Central Government for obtaining its approval for re-appointment of and payment of re-muneration to Mr. Krishna Kumar Karwa as Managing Director & CFo and Mr. prakash Kacholia as Managing Director for the period of three years with effect from 1st october, 2010 as per the terms approved by the members at their meeting held on 30th August, 2010.
Accordingly, the excess remuneration paid to Mr. Krishna Kumar Karwa and Mr. prakash Kacholia during the period from 1st octo-ber, 2010 to 31st March, 2011 is shown as Advances Recoverable.
Remuneration paid to Managing Directors for the Financial Year 2010-2011.
The Non executive Directors are paid remuneration by way of Sit-ting Fees and Commission:
Details of Remuneration paid by way of Sitting Fees to Non-Executive Directors for the Financial Year 2010-2011
Details of Commission paid to Non-Executive Directors of the Company for the Financial Year 2010-11:
Investor Grievance and Share Transfer Committee
Composition
The present composition of the investor Grievance and Share Transfer Committee is as follows:
Mr. R. K. Krishnamurthi Chairman
Mr. prakash Kacholia Member
Mr. Krishna Kumar Karwa Member
Particulars
Mr. Krishna Kumar Karwa
(Managing Director & CFO)
(Amt in `)
Mr. Prakash Kacholia
(Managing Director)
(Amt in `)
Salary (including pF Contribution)
57,12,000 57,12,000
perquisites 46,614 70,283
Total 57,58,614 57,82,283
NameSitting Fees for Board/Committee
Meetings attended (Amt in `)
Mr. G. p. Gupta 1,30,000
Mr. S. K. Saboo 80,000
Mr. R. K. Krishnamurthi 1,30,000
Mr. G. C. Vasudeo 1,30,000
Total 4,70,000
Name Commission(Amt in `)
Mr. G. p. Gupta 2,50,000
Mr. R. K. Krishnamurthi 1,50,000
Mr. G. C. Vasudeo 1,50,000
Total 5,50,000

27
The Chairman of the Committee is the Non-executive and inde-pendent Director. The Company Secretary acts as Secretary to the Committee. The Committee meets once in every quarter in case the Committee has no share transfer formalities to attend. How-ever, in case there are share transfer formalities/ demat –remat of shares/complaints during any fortnight, the same shall be taken up in the share transfer committee meeting to be held by the end of that fortnight.
The Committee had 14 meetings during the financial year 2010-11 and Mr. prakash Kacholia was present at all the meetings. Mr. R. K. Krishnamurthi was not present in one meeting and Mr. Krishna Kumar Karwa was not present in the two meetings. The investor Grievance and Share Transfer Committee looks into the redressal of shareholder and investor complaints, issue of duplicate /con-solidated share certificates, remat /demat of shares and review of cases for refusal of transfer/ transmission and reference to statu-tory and regulatory authorities.
Mr. Rahul Sahasrabuddhe, the Company Secretary is designated as the Compliance officer.
Details of Shareholders/investors Complaints for the financial year 2010-11:
______________________________________________________Number received during the year 2Number resolved to the satisfaction of complainant 2Number pending redressal NilNumber pending Transfers Nil______________________________________________________
Subsidiary Companies
The Company has four wholly owned unlisted subsidiaries as un-der:
1. emkay Fincap Limited2. emkay Commotrade Limited3. emkay insurance Brokers Limited4. emkay investment Managers Limited (incorporated on
08.06.2010)
out of the above four Subsidiaries, emkay Fincap Limited is a ma-terial non-listed indian subsidiary whose turnover or net worth (i.e. paid-up Capital and Free Reserves) exceeds 20% of the consoli-dated turnover or net worth respectively, of the Company and its subsidiaries in the immediately preceding accounting year ended 31st March, 2010. As required under Clause 49, an independent Director of the Company has been placed on the Board as the di-rector of emkay Fincap Limited.
The Company monitors the performance of its subsidiaries, inter alia, by the following means:
1. The Financial Statements, in particular the investments made by the unlisted subsidiary companies are placed before the Company’s Audit Committee as well as before the Board.
2. The Minutes of Board and Audit Committee Meetings of the subsidiaries are placed at the Board Meetings of the Company.
3. Details of significant transactions and arrangements entered into by the unlisted subsidiary companies are placed before the Company’s Board, as and when applicable.
CEO / CFO Certification
The certificate required under Clause 49(V) of the Listing Agreement, duly signed by the Managing Directors / CFo has been given to the Board and the same is annexed to this report as An-nexure ‘2’.
Management Discussion and Analysis
The Management Discussion and Analysis Report is given sepa-rately in the Annual Report.
IPO Unclaimed Shares Demat Suspense Account
As per a directive issued by the SeBi vide their letter no. SBi / CFD /DiL /LA /1 /2009/24/04 dated 24.04.2009, the Company has opened a Beneficiary Account with emkay Global Financial Services Limited being a depository participant of CDSL in the name and style of “Emkay Global Financial Services Limited A/C IPO-Unclaimed Securities Suspense Account” and cred-ited the unclaimed shares lying in the escrow Account and the said account is held by the Company purely on behalf of the allottees who are entitled to the shares and the said unclaimed shares are not transferable in any manner. As on 31st March 2011, a total of 1150 shares pertaining to 7 allottees are lying in the said Account.
Further, in compliance with the aforesaid SeBi Circular, the Company has opened an account with HDFC Bank in the name and style of “EGFSL – IPO Unclaimed Shares Unpaid Dividend Account” and credited the said account with the dividends declared on ipo Unclaimed Shares from time to time. As on 31st March 2011, the amount of ` 5419/- is lying in the said account.

28
Secretarial Audit
During the Financial Year 2010-2011, Reconciliation of Share Capital Audit Report (earlier known as Secretarial Audit Report) as stipulated under Regulation 55A of SeBi (Depositories and par-ticipants) Regulations, 1996 was carried out on a quarterly basis by practicing Company Secretary for reconciliation of the total admit-ted capital with National Securities Depository Limited (NSDL) and Central Depository Services (india) Limited (CDSL) and total issued and listed capital. The audit confirms that the total issued/paid-up capital is in agreement with the total number of shares held in physical form and the total number of dematerialized shares held with NSDL and CDSL. The Reconciliation of Share Capital Audit Re-port is submitted to Stock exchanges and is also placed before the Board of Directors.
Code of Conduct for Prevention of Insider Trading:
pursuant to the requirements of the Securities and exchange Board of india (prohibition of insider Trading) Regulations, 1992, as amended, the Company has adopted a Code of Conduct for pre-vention of insider Trading. This Code of Conduct is applicable to all Directors and such identified employees of the Company as well as of the group companies who are expected to have unpublished price sensitive information relating to the Company.
General Body Meetings
Detail of venue, date and time of the last three Annual General Meetings (AGM) held:
Special Resolutions passed at the last three AGM:
1. At 16th AGM held on 30th August, 2010
• Re-appointment of and Payment of remuneration to Managing Directors.
• PaymentofCommissiontoNonExecutive&Independent Directors.
Financial Year
AGM No. Venue Date Time
2009-10 16th
M. C. Ghia Hall,
Fort, Mumbai
30th August, 2010
3.00 p.m.
2008-09 15th 11th September, 2009
3.00 p.m.
2007-08 14th 5th September, 2008
4.00 p.m.
• ApprovingamendmentsmadetoESOPScheme–2007.
• Introduction of new ESOP Scheme-2010 through trustroute.
2. At the 15th AGM held on 11th September, 2009-
• RevisioninremunerationpayabletoManagingDirectors.
• Approvalonchange intheplaceofmaintainingRegisterof Members, index of Members, copies of Annual Returns and related documents.
3. At 14th AGM held on 5th September, 2008 – Approv-ing amendments made to eSop Scheme – 2005 and eSop Scheme – 2007.
Postal Ballot:
During the Financial Year 2010-11, the Company had transferred the portfolio Management Services Division (pMS) to its wholly owned subsidiary company viz. emkay investment Managers Lim-ited and the approval of members was sought through postal Bal-lot process.
The Board of Directors of the Company appointed Mr. p. N. parikh of M/s. parikh & Associates, practicing Company Secretary, Mum-bai as scrutinizer for conducting the postal ballot process in a fair and transparent manner.
The results of the postal Ballot were declared on 30th July, 2010 by the Chairman at the Registered office of the Company. The details of voting pattern are as follows:
Particulars Special Resolution for transferring the port-folio Management Services Division (pMS) of the Company to its wholly owned subsidiary Company viz. emkay investment Managers Limited as mentioned in the Notice for postal Ballot dated 28th May, 2010
No. of ballots No. of shares
ToTAL ReCeiVeD 176 1,78,72,414
Less: invalid 17 14,760
Valid 159 1,78,57,654
- Assent 134 1,78,55,289
- Dissent 25 2,365
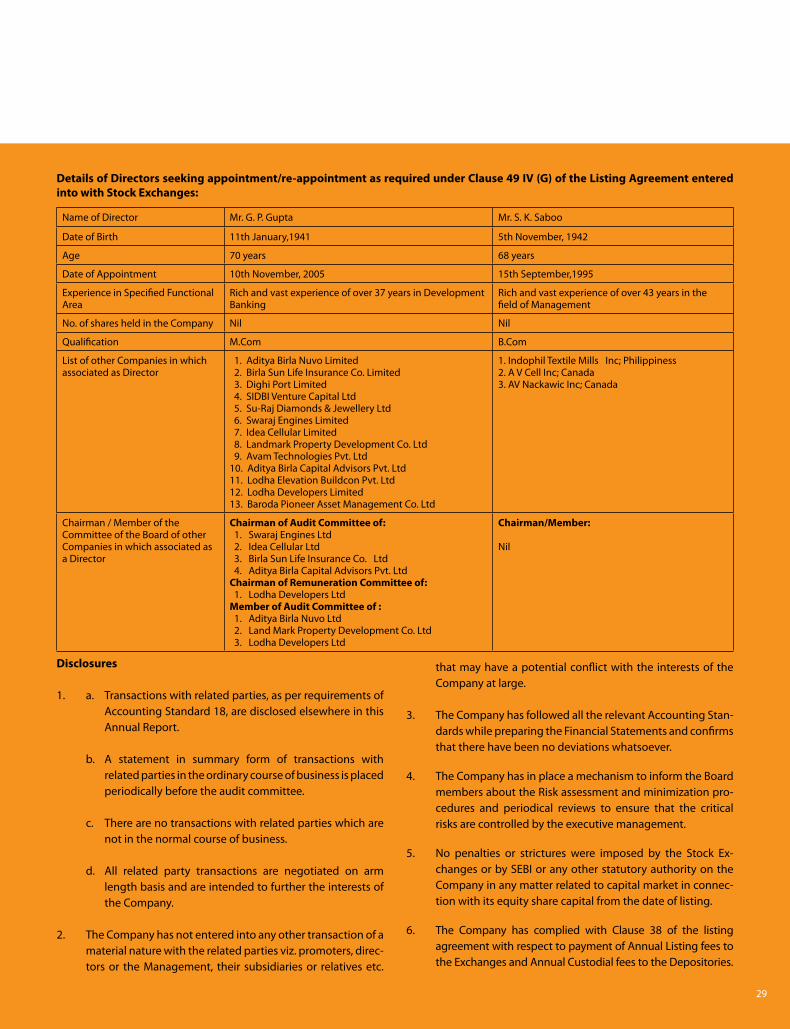
29
Name of Director Mr. G. p. Gupta Mr. S. K. Saboo
Date of Birth 11th January,1941 5th November, 1942
Age 70 years 68 years
Date of Appointment 10th November, 2005 15th September,1995
experience in Specified Functional Area
Rich and vast experience of over 37 years in Development Banking
Rich and vast experience of over 43 years in the field of Management
No. of shares held in the Company Nil Nil
Qualification M.Com B.Com
List of other Companies in which associated as Director
1. Aditya Birla Nuvo Limited 2. Birla Sun Life insurance Co. Limited 3. Dighi port Limited 4. SiDBi Venture Capital Ltd 5. Su-Raj Diamonds & Jewellery Ltd 6. Swaraj engines Limited 7. idea Cellular Limited 8. Landmark property Development Co. Ltd 9. Avam Technologies pvt. Ltd10. Aditya Birla Capital Advisors pvt. Ltd11. Lodha elevation Buildcon pvt. Ltd12. Lodha Developers Limited13. Baroda pioneer Asset Management Co. Ltd
1. indophil Textile Mills inc; philippiness 2. A V Cell inc; Canada3. AV Nackawic inc; Canada
Chairman / Member of the Committee of the Board of other Companies in which associated as a Director
Chairman of Audit Committee of: 1. Swaraj engines Ltd 2. idea Cellular Ltd 3. Birla Sun Life insurance Co. Ltd 4. Aditya Birla Capital Advisors pvt. LtdChairman of Remuneration Committee of: 1. Lodha Developers LtdMember of Audit Committee of : 1. Aditya Birla Nuvo Ltd 2. Land Mark property Development Co. Ltd 3. Lodha Developers Ltd
Chairman/Member:
Nil
Disclosures
1. a. Transactions with related parties, as per requirements of Accounting Standard 18, are disclosed elsewhere in this Annual Report.
b. A statement in summary form of transactions with related parties in the ordinary course of business is placed periodically before the audit committee.
c. There are no transactions with related parties which are not in the normal course of business.
d. All related party transactions are negotiated on arm length basis and are intended to further the interests of the Company.
2. The Company has not entered into any other transaction of a material nature with the related parties viz. promoters, direc-tors or the Management, their subsidiaries or relatives etc.
that may have a potential conflict with the interests of the Company at large.
3. The Company has followed all the relevant Accounting Stan-dards while preparing the Financial Statements and confirms that there have been no deviations whatsoever.
4. The Company has in place a mechanism to inform the Board members about the Risk assessment and minimization pro-cedures and periodical reviews to ensure that the critical risks are controlled by the executive management.
5. No penalties or strictures were imposed by the Stock ex-changes or by SeBi or any other statutory authority on the Company in any matter related to capital market in connec-tion with its equity share capital from the date of listing.
6. The Company has complied with Clause 38 of the listing agreement with respect to payment of Annual Listing fees to the exchanges and Annual Custodial fees to the Depositories.
Details of Directors seeking appointment/re-appointment as required under Clause 49 IV (G) of the Listing Agreement entered into with Stock Exchanges:

30
Means of Communication
1. The Quarterly/Annual Financial Results of the Company are normally published in the Business Standard and Sakaal.
2. The Quarterly/Annual Financial Results were promptly displayed on the Company’s website www.emkayglobal.com.
3. All the official news releases are regularly sent to the Stock exchanges and are promptly displayed on the Company’s website.
Non-Mandatory Requirements:
Among non-mandatory requirements, the following have been complied with:
1. The Board has setup a Remuneration / Compensation Committee and
2. Audit qualification – Zero qualification regimes.
AGM: Date, time and venue 1st August, 2011 at 3.00 p.M. at M. C. Ghia Hall, Fort, Mumbai – 400001.
Financial Year 1st April, 2010 to 31st March, 2011
Date of Book Closure Friday,22nd July, 2011 to Monday,1st August, 2011 (Both days inclusive)
Dividend payment Date 4th August, 2011
Listing on Stock exchanges -Bombay Stock exchange Limited
-National Stock exchange of india Limited
Stock Code / Symbol -Bombay Stock exchange Limited-532737
-National Stock exchange of india Limited-eMKAY
iSiN Number iNe296H01011
Registrar and Transfer Agents Link intime india private Limited,
C-13, pannalal Silk Mills Compound, L.B.S. Marg, Bhandup (West),
Mumbai-400078
Share Transfer System The Company has constituted an investor Grievance and Share Transfer Com-
mittee of its Directors. The Committee meets once in every quarter in case the
Committee has no share transfer formalities/ Demat-Remat of Shares/Com-
plaints to attend. However, in case there are formalities of transfer of shares
during any fortnight, the same shall be taken up in the share transfer com-
mittee meeting held by the end of that fortnight. The list of valid transfers/
transmission/ remat etc prepared by the Transfer Agent in respect of transfer
cases received by them, if any, are placed before the investor Grievance and
Share Transfer Committee for its approval/confirmation.
Dematerialization of Shares and liquidity As on 31.03.2011, 99.88% of the equity Share Capital comprising 2,43,97,435
equity shares out of total of 2,44,27,250 were dematerialized.
outstanding GDR /ADR /Warrants or any Convertible instruments, Conversion
Date and likely impact on equity
The Company has not issued any GDR /ADR /Warrants.
Address for correspondence Registered Office:
4D, 4th Floor, Hamam House, Ambalal Doshi Marg, Fort, Mumbai - 400 023.
Corporate Office:
paragon Center, C-06, Ground Floor, pandurang Budhkar Marg, Worli,
Mumbai-400 013.
Registrar and Transfer Agent:
Link intime india private Limited. C-13, pannalal Silk Mills Compound,
L.B.S. Marg, Bhandup (West), Mumbai - 400 078.
General Shareholder Information

31
Category No. of Shareholders No. of Shares % of total
promoters 3 1,34,22,500 54.95
Relatives of Directors 4 40,75,000 16.68
Fiis 1 1,54,000 0.63
Foreign Nationals 1 4,000 0.02
other Bodies Corporate 278 11,72,687 4.80
Mutual Fund 1 2,25,822 0.92
NRi (including Non Repatriable) 65 2,46,107 1.01
Trusts 3 6,67,127 2.73
public 6234 44,60,007 18.26
Total 6590 2,44,27,250 100.00
Number of Shares held (Face value of ` 10 each)
Shareholders Shares
Number % of total Number % of total
1-500 5,819 88.30 5,65,042 2.31
501-1000 243 3.69 1,99,926 0.82
1001-2000 164 2.49 2,63,312 1.08
2001-3000 125 1.90 3,06,126 1.25
3001-4000 58 0.88 2,07,176 0.85
4001-5000 41 0.62 1,91,737 0.79
5001-10000 65 0.98 5,10,938 2.09
10001 & above 75 1.14 2,21,82,993 90.81
Total 6,590 100.00 2,44,27,250 100.00
Categories of Share Holding as on 31st March, 2011
The Shareholding of different categories of the shareholders as on 31st March, 2011 is given below :
Distribution of Shareholding as on 31st March, 2011
The Shareholding distribution of the equity shares as on 31st March, 2011 is given below:

32
Market Price Data
During the year, the BSe Sensex moved from 17692 to 19445.
The Market price of the Company’s Shares traded on the Bombay Stock exchange Limited (BSe) and the National Stock exchange of india Limited (NSe) during each month of the last Financial Year from 1st April, 2010 to 31st March, 2011 is as follows:
Month BSE NSE
High Low High Low
(`) (`) (`) (`)
April, 2010 119.90 94.00 120.35 94.00
May, 2010 102.85 85.00 98.00 85.05
June, 2010 90.00 78.35 90.45 78.85
July, 2010 89.00 71.15 89.00 74.00
August, 2010 87.95 73.30 89.45 75.40
September, 2010 102.15 76.00 102.20 76.05
october, 2010 111.00 90.05 108.90 90.40
November, 2010 118.00 84.50 118.50 84.00
December, 2010 98.00 75.00 98.00 74.00
January, 2011 82.50 60.00 81.95 58.00
February, 2011 69.00 54.75 68.00 55.20
March, 2011 66.45 49.15 68.50 49.00
on behalf of the Board of DirectorsFor Emkay Global Financial Services Limited
Krishna Kumar Karwa Prakash KacholiaManaging Director & CFO Managing Director
place : Mumbai
Date : 20th May, 2011

33
CERTIFICATE OF CORPORATE GOVERNANCE
To the Members of
M/s. emkay Global Financial Services Limited
We have examined the compliance of conditions of Corporate Governance by emkay Global Financial Services Limited (‘the Company’) for
the year ended 31st March, 2011, as stipulated in Clause 49 of the Listing Agreement of the said Company with the Stock exchanges.
The compliance of conditions of Corporate Governance is the responsibility of the management. our examination was limited to proce-
dures and implementation thereof, adopted by the Company for ensuring the compliance of the conditions of the Corporate Governance.
it is neither an audit nor an expression of opinion on the financial statements of the Company.
in our opinion and to the best of our information and according to the explanations given to us and the representations made by the man-
agement, we certify that the Company has complied with the conditions of Corporate Governance as stipulated in the above mentioned
Listing Agreement.
We further state that such compliance is neither an assurance as to the future viability of the Company nor the efficiency or effectiveness
with which the management has conducted the affairs of the Company.
For B.L. Sarda & Associates Firm Registration No.109266W
Chartered Accountants
place : Mumbai (CA. B. L. Sarda)Date : 20th May, 2011 partner
M. No. 14568

34
CODE OF CONDUCT
in accordance with Sub-Clause i (D) of Clause 49 of the Listing Agreement with the Stock exchanges, we, Krishna Kumar Karwa -
Managing Director & CFo and prakash Kacholia - Managing Director of the Company confirm that the Board Members and the Senior
Management personnel of the Company have affirmed compliance with the Company’s Code of Conduct for the financial year ended
31st March, 2011.
For EMKAY GLOBAL FINANCIAL SERVICES LIMITED
Krishna Kumar Karwa Prakash KacholiaManaging Director & CFo Managing Director
place : Mumbai
Date : 20th May, 2011
Annexure-1

35
CEO/CFO CERTIFICATE
We hereby certify that -
(a) We have reviewed Financial Statement and the Cash Flow Statement for the year ended 31st March, 2011 and that to the best of our
knowledge and belief:
i) These statements do not contain any materially untrue statement or omit any material fact or contain statements that might be
misleading.
ii) These statements together present a true and fair view of the Company’s affairs and are in compliance with existing accounting
standards, applicable laws and regulations.
(b) There are, to the best of our knowledge and belief, no transactions entered into by the Company during the year which are fraudulent,
illegal or which violate the Company’s Code of Conduct.
(c) We accept responsibility for establishing and maintaining internal controls and that we have evaluated the effectiveness of the in-
ternal control systems of the Company and we have disclosed to the Auditors and the Audit Committee, deficiencies in the design
or operation of internal controls, if any, of which we are aware and the steps we have taken or proposed to take to rectify these
deficiencies.
(d) We have indicated to the Auditors and the Audit Committee :
i) Significant changes in internal controls during the year;
ii) Significant changes in accounting policies during the year and that the same have been disclosed in the notes to the financial
statements; and
iii) instances of significant fraud of which we have become aware and the involvement therein, if any, of the management or an
employee having a significant role in the Company’s internal control system.
Krishna Kumar Karwa Prakash Kacholia
Managing Director & CFo Managing Director
place : Mumbai
Date : 20th May, 2011
Annexure-2

36
AUDITORS’ REPORT TO THE MEMBERS OFEMKAY GLOBAL FINANCIAL SERVICES LIMITED
AUDiToRS’ RepoRT
1. We have audited the attached balance sheet of eMKAY GLoBAL FiNANCiAL SeRViCeS LiMiTeD as at 31st March, 2011 and also the profit and loss account and the cash flow statement for the year ended on that date annexed thereto. These financial statements are the responsibility of the company’s management. our responsibility is to express an opinion on these financial statements based on our audit.
=2. We conducted our audit in accordance with the auditing
standards generally accepted in india. Those standards require that we plan and perform the audit to obtain reasonable assurance about whether the financial statements are free of material misstatement. An audit includes examining, on a test basis, evidence supporting the amounts and disclosures in the financial statements. An audit also includes assessing the accounting principles used and significant estimates made by management, as well as evaluating the overall financial statement presentation. We believe that our audit provides a reasonable basis for our opinion.
3. As required by the Companies (Auditor’s Report) order, 2003 (the ‘order’), as amended, issued by the Central Government of india in terms of sub-section (4A) of section 227 of the Companies Act, 1956 (the ‘Act’), we enclose in the Annexure a statement on the matters specified in paragraphs 4 and 5 of the said order.
4. Further to our comments in the Annexure referred to above, we report that:
(i) We have obtained all the information and explanations, which to the best of our knowledge and belief were necessary for the purposes of our audit;
(ii) in our opinion, proper books of account as required by law have been kept by the company so far as appears from our examination of those books;
(iii) The Balance Sheet, profit and Loss Account and Cash Flow Statement dealt with by this report are in agreement with the books of account;
(iv) in our opinion, the Balance Sheet, profit and Loss Account and Cash Flow Statement dealt with by this report comply with the Accounting Standards referred to in sub-section (3C) of section 211 of the Act;
(v) on the basis of written representations received from the directors, as on 31st March, 2011 and taken on record by the Board of Directors, we report that none of the directors is disqualified as on 31st March, 2011 from being appointed as a director in terms of clause (g) of sub-section (1) of section 274 of the Act;
(vi) in our opinion and to the best of our information and according to the explanations given to us, the said accounts read together with the Significant Accounting policies and Notes to Accounts appearing in Schedule “T” give the information required by the Act, in the manner so required and give a true and fair view in conformity with the accounting principles generally accepted in india:
(a) in the case of the Balance Sheet, of the state of affairs of the company as at 31st March, 2011;
(b) in the case of the profit and Loss Account, of the profit for the year ended on that date; and
(c) in the case of the Cash Flow Statement, of the cash flows for the year ended on that date.
For B.L. Sarda & AssociatesFirm Registration No. 109266W
Chartered Accountants
(B. L. Sarda)place: Mumbai partnerDate : 20th May, 2011 Membership No. 014568

37
ANNEXURE TO THE AUDITORS’ REPORT REFERRED TO IN PARAGRAPH THREE OF OUR REPORT OF EVEN DATE
ANNeXURe To THe AUDiToRS’ RepoRT
(i) in our opinion and according to the information and explanations given to us, the nature of the Company’s business / activities during the year are such that clauses (viii), (xiii) and (xix) of paragraph 4 of the said order are not applicable to the company.
(ii) (a) The Company has maintained proper records showing full particulars, including quantitative details and situation of fixed assets.
(b) According to the information and explanations given to us, fixed assets of the company have been physically verified by the management during the year which in our opinion is reasonable having regard to the size of the Company and the nature of its assets. According to the information and explanations given to us, no material discrepancies were noticed on such verification.
(c) According to the information and explanations given to us, the company has not disposed off substantial part of fixed assets which could affect the going concern status of the company.
(iii) (a) The securities held as stock in trade have been confirmed with the statement of holding of depository at the end of the year. in our opinion, the frequency of verification of statement of holding is reasonable.
(b) in our opinion and according the information and explanations given to us, the procedure of confirmation of securities held as stock in trade followed by the Management were reasonable and adequate in relation to the size of the Company and the nature of its business.
(c) in our opinion and according the information and explanations given to us, the company has maintained proper records of securities held as stock in trade and as informed to us, no discrepancies have been noticed on verification between the statement of holding and the book records.
(iv) The Company has neither granted nor taken any secured or unsecured loan to / from companies, firms or other parties covered in the register maintained under section 301 of the Act during the year. Therefore comments under clause 4(iii) (a) to (g) of the order are not applicable.
(v) in our opinion and according to the information and explanations given to us, there are adequate internal control system commensurate with the size of the company and the nature of its business for the purchase of securities, fixed assets and for sale of securities and services. Further, on the basis of our examination and according to the information and explanations given to us, we have neither come across nor have we been informed of any instance of major weakness in the aforesaid internal control systems.
(vi) (a) in our opinion and according to the information and explanations given to us, the particulars of contracts or arrangements referred to in Section 301 of the Act have been entered in the register required to be maintained under that section.
(b) in our opinion and according to the information and explanations given to us, the transactions made in pursuance of contracts or arrangements entered in the register maintained under section 301 of the Act and exceeding the value of rupees five lakhs in respect of any party during the year for services obtained from such a party have been made at prices which are reasonable having regard to prevailing market prices at the relevant time. in case of services provided to another such party, no comparison could be made since similar transactions have not been made with other parties.
(vii) in our opinion and according to the information and explanations given to us, the Company has not accepted any deposits from public within the meaning of Sections 58A and 58AA or any other relevant provisions of the Act and the rules framed thereunder.
(viii) The internal Audit is being conducted by a firm of Chartered Accountants appointed by the management and in our opinion, the same commensurates with the size and nature of company’s business.
(ix) (a) The company has been regular in depositing with appropriate authorities undisputed statutory dues including provident fund, investor education and protection fund, employees’ state insurance, income tax, sales tax, wealth tax, service tax, custom duty, excise duty, cess and other statutory dues applicable to it. No undisputed amounts payable in respect of the aforesaid statutory dues were outstanding as at the last day of the financial year for a period of more than six months from the date they became payable.

38
(b) As at 31st March, 2011, according to the records of the company and the information and explanations given to us, the following are the particulars of disputed dues on account of income tax, sales tax, service tax, custom duty, wealth tax, excise duty and cess matters that have not been deposited:
(x) The Company has no accumulated losses as at 31st March, 2011 and it has not incurred any cash losses in the financial year ended on that date or in the immediately preceding financial year.
(xi) According to the information and explanations given to us, the company has not defaulted in repayment of dues to the bank. The Company has not obtained any borrowings from any financial institutions or by way of debentures.
(xii) The Company has not granted any loans and advances on the basis of security by way of pledge of shares, debentures and other securities.
(xiii) in our opinion and according to the information and explanations given to us, the Company has maintained proper records of the transactions and contracts in respect of its dealing or trading in shares, securities and other investments and timely entries have been made therein and the shares, securities and other investments have been held by the company in its own name.
(xiv) To the best of our knowledge and belief and according to the information and explanations given to us, the terms and conditions at which guarantee has been given by the Company for credit facilities taken from banks by a subsidiary are, in our opinion, not, prima facie, prejudicial to the interest of the Company.
(xv) To the best of our knowledge and belief and according to the information and explanations given to us, no term loans were obtained by the Company during the year.
(xvi) According to the Cash Flow Statement and other records examined by us and the information and explanations given
Nature of dues Amount (` in lac)
Period to which the amount
relates
Forum where pending
income Tax and interest 3.77 F.Y.2002-2003
income Tax Appellate Tribunal
income Tax and interest 3.07 F.Y.2004-2005
income Tax and interest 42.39 F.Y.2005-2006
income Tax and interest 26.27 F.Y.2006-2007
to us, on an overall basis, funds raised on short term basis have, prima facie, not been used during the year for long term investment.
(xvii) According to the information and explanations given to us, the company has not made any preferential allotment during the year to Companies / firms / parties covered in the register maintained under section 301 of the Act.
(xviii) The Company has not raised any money by public issues during the year.
(xix) According to the information and explanations given to us, no fraud on or by the company has been noticed or reported during the year.
For B.L. Sarda & AssociatesFirm Registration No. 109266W
Chartered Accountants
(B. L. Sarda)place: Mumbai partnerDate : 20th May, 2011 Membership No. 014568

39
THiS pAGe iS KepT BLANKiNTeNTioNALLY

40
BALANCe SHeeT AS AT 31ST MARCH, 2011
As per our report of even date By the order of the Board For B.L. SARDA & ASSoCiATeS G.p. GUpTA KRiSHNA KUMAR KARWA pRAKASH KACHoLiA Chartered Accountants Chairman Managing Director & CFo Managing Director S.K.SABoo R.K.KRiSHNAMURTHi G.C. VASUDeo Director Director Director(B. L. SARDA)partner RAHUL SAHASRABUDDHe Membership No. 014568 Company Secretary place : Mumbai place : MumbaiDate : 20th May, 2011 Date : 20th May, 2011
Particulars Schedule As At 31.03.2011 (`)
As At 31.03.2010 (`)
SOURCES OF FUNDS
1. SHAREHOLDERS’ FUNDS
Share Capital A 244,272,500 243,208,000
Reserves & Surplus B 1,134,798,016 1,076,595,271
1,379,070,516 1,319,803,271
2. LOAN FUNDS
Secured Loans C 14,154,000 86,250,000
Unsecured Loans D 11,422,403 86,250,000
25,576,403 172,500,000
Total 1,404,646,919 1,492,303,271
APPLICATION OF FUNDS
1. FIXED ASSETS e
Gross Block 323,979,727 292,803,659
Less : Depreciation and Amortization 248,093,621 214,690,360
Net Block 75,886,106 78,113,299
Capital Work in progress 209,273,617 1,485,726
285,159,723 79,599,025
2. INVESTMENTS F 355,004,526 360,004,526
3. DEFERRED TAX ASSET(Net) [Refer Note B(23) of Schedule T ] 42,892,200 52,707,500
4. CURRENT ASSETS, LOANS & ADVANCES
Stock - in Trade G 628,517 977,249
Sundry Debtors H 336,819,446 482,438,631
Cash and Bank Balances i 1,058,327,900 1,297,037,229
other Current Assets J 18,947,251 30,912,142
Loans And Advances K 204,571,845 150,806,180
1,619,294,959 1,962,171,431
Less : CURRENT LIABILITIES & PROVISIONS
Current Liabilities L 861,861,591 932,132,467
provisions M 35,842,898 30,046,744
897,704,489 962,179,211
NET CURRENT ASSETS 721,590,470 999,992,220
Total 1,404,646,919 1,492,303,271
Significant Accounting policies and Notes to the Accounts T
The Schedules referred to above form an integral part of the Balance Sheet.

41
pRoFiT AND LoSS ACCoUNT FoR THe YeAR eNDeD 31ST MARCH, 2011
Particulars Schedule For theYear Ended
31.03.2011 (`)
For the Year Ended 31.03.2010
(`)
Incomeincome from operations N 1,040,635,195 1,053,979,288 other income o 142,008,559 113,177,918
1,182,643,754 1,167,157,206 Expenditurepersonnel Cost p 454,236,454 349,915,359 operating expenses Q 336,136,523 418,383,947 Administrative expenses R 209,463,337 202,438,684 interest S 15,616,018 15,163,869 Depreciation and Amortization e 38,589,273 46,330,150
1,054,041,605 1,032,232,009 Profit Before Taxation 128,602,149 134,925,197 Provision for Taxation income Tax - Current tax 35,000,000 60,000,000 - Deferred tax charge/ (benefit) 9,815,300 (9,175,900) - Short provision for FBT of earlier Years 178,219 - - Short provision for Taxation of earlier Years 263,056 139,986 Wealth Tax - Current Year 44,100 - - earlier Year 20,500 - Profit After Taxation 83,280,974 83,961,111 Add: Balance Brought Forward 220,730,743 173,129,813 Amount Available for Appropriations 304,011,717 257,090,924 AppropriationsDividend - proposed 24,427,250 24,320,800 - paid for earlier Year 99,150 - Dividend Distribution Tax - on proposed Dividend 3,962,711 4,039,381 - on Dividend paid for earlier Year 16,468 - Transfer to General Reserve 8,000,000 8,000,000 Balance Carried Forward 267,506,138 220,730,743
304,011,717 257,090,924 Basic Earnings Per Share(` ) ( Face Value of ` 10 each) 3.41 3.46 Diluted Earnings Per Share(` ) ( Face Value of ` 10 each) 3.37 3.42 [ Refer Note B(21) of Schedule T ]Significant Accounting policies and Notes to the Accounts T The Schedules referred to above form an integral part of the profit and Loss Account
As per our report of even date By the order of the Board For B.L. SARDA & ASSoCiATeS G.p. GUpTA KRiSHNA KUMAR KARWA pRAKASH KACHoLiA Chartered Accountants Chairman Managing Director & CFo Managing Director S.K.SABoo R.K.KRiSHNAMURTHi G.C. VASUDeo Director Director Director(B. L. SARDA)partner RAHUL SAHASRABUDDHe Membership No. 014568 Company Secretary place : Mumbai place : MumbaiDate : 20th May, 2011 Date : 20th May, 2011

42
CASH FLoW STATeMeNT FoR THe YeAR eNDeD 31ST MARCH, 2011
Particulars Year ended 31.03. 2011 Year ended 31.03. 2010
Amount (`) Amount (`) Amount (`) Amount (`)
A. CASH FLOW FROM OPERATING ACTIVITIES
Net profit before tax, extraordinary items 128,602,149 134,925,197 Adjustment for :
interest 15,616,018 15,163,869
Depreciation and Amortization 38,589,273 46,330,150
(profit)/Loss on sale of investments (1,172,631) (4,701,687)
Loss on Sale of Fixed Assets/Assets Discarded 328,680 1,618,331
interest Received (289,864) (1,410,925)
Dividend Received (241,838) (258,781)
Unrealised Foreign exchange (gain)/loss (567) 1,395
provision for Doubtful Debts /Deposits / Advances
( Net of write back ) (38,731,447) 12,614,023
provision for loss on equity index/stock
futures, equity index/stock options and
currency futures ( Net of write back ) 6,293,812 20,391,436 200,876 69,557,251
operating profit before working capital changes 148,993,585 204,482,448 Adjustment for :
Trade and other receivables 188,097,359 (161,609,986)
Fixed Deposits with Banks and other items
not considered as cash equivalents
(Refer Note 3 below) 281,419,210 (42,140,760)
inventories 348,732 493,854
Trade payables (64,550,767) 405,314,534 249,209,108 45,952,216
Cash Generated from operations 554,308,119 250,434,664 Direct taxes (paid)/Refund (34,236,409) (34,236,409) (63,583,481) (63,583,481)
Cash flow before extraordinary items 520,071,710 186,851,183 extraordinary items - -
Net Cash from/ (used in) Operating Activities 520,071,710 186,851,183
B. CASH FLOW FROM INVESTING ACTIVITIES
purchase of Fixed Assets & Capital Work in progress (246,037,822) (21,868,022)
Sale of Fixed Assets 1,559,170 764,185
Acquisition of investments (1,860,237,458) (4,801,213,276)
Disposal of investments 1,861,410,089 4,805,914,963
investment in Subsidiary Companies (45,000,000) (15,000,000)
Redemption of investment in Subsidiary Companies 50,000,000 -
interest received 289,864 1,410,925
Loan given to emkay employees Welfare Trust (53,100,000) -
Dividend received 241,838 (290,874,319) 258,781 (29,732,444)
Net Cash from/ (used in) Investing Activities (290,874,319) (29,732,444)

43
Particulars Year ended 31.03. 2011 Year ended 31.03. 2010
Amount (`) Amount (`) Amount (`) Amount (`)
C. CASH FLOW FROM FINANCING ACTIVITIES
proceeds from issue of share capital 1,064,500 425,500
Securities premium received 3,427,350 545,900
proceeds/(Repayment) of Secured Loan (72,096,000) (33,416,801)
proceeds/(Repayment) of Unsecured loans (74,827,597) (1,086,062)
interest paid (15,616,018) (15,163,869)
Dividend paid (including dividend tax) (28,440,312) (186,488,077) - (48,695,332)
Net Cash from/ (used in) financing activities (186,488,077) (48,695,332)
Net increase in cash and cash equivalents (A+B+C) 42,709,314 108,423,407
Cash and cash equivalents at the beginning of the year 152,447,894 44,024,487
Cash and cash equivalents at the close of the year 195,157,208 152,447,894
Notes :
1. Cash and cash equivalents comprise of :
Cash & Cheques on hand 657,914 4,660,713
Balances with Scheduled Banks
- in Current Accounts 194,082,586 147,701,563
- in Fixed Deposits 400,000
Foreign Currency on Hand 15,902 84,245
Add / (Less) : Unrealised exchange Loss / (Gain) 806 16,708 1,373 85,618
195,157,208 152,447,894
As per our report of even date By the order of the Board
For B.L. SARDA & ASSoCiATeS G.p. GUpTA KRiSHNA KUMAR KARWA pRAKASH KACHoLiA Chartered Accountants Chairman Managing Director & CFo Managing Director S.K.SABoo R.K.KRiSHNAMURTHi G.C. VASUDeo Director Director Director(B. L. SARDA)partner RAHUL SAHASRABUDDHe Membership No. 014568 Company Secretary place : Mumbai place : MumbaiDate : 20th May, 2011 Date : 20th May, 2011
CASH FLoW STATeMeNT FoR THe YeAR eNDeD 31ST MARCH, 2011
2. Cash flow statement has been prepared under the indirect Method as set out in the Accounting Standard - 3 (AS-3) “Cash Flow Statement” issued by the institute of Chartered Accountants of india.
3. Cash and cash equivalent excludes fixed deposits with banks which have been pledged with exchanges/ banks, balance in Unclaimed Dividend and ipo Refund Account, Gift/ Meal Coupons and Stamps in hand.
4. previous year’s figures are re-grouped/ recasted/ re-arranged wherever considered necessary.

44
SCHeDULeS FoRMiNG pART oF THe BALANCe SHeeT AS AT 31ST MARCH, 2011
Particulars As At 31.03.2011 (`)
As At 31.03.2010 (`)
Schedule A
Share Capital
Authorised
40,000,000 equity Shares of ` 10/- each 400,000,000 400,000,000
Total 400,000,000 400,000,000
Issued, Subscribed & Paid Up Capital
244,27,250 (p.Y. 243,20,800) equity Shares of
` 10/- each fully paid up 244,272,500 243,208,000
(out of the above equity Shares 1,40,00,000 equity Shares are
allotted as fully paid-up bonus shares by capitalisation
of General Reserves)
Total 244,272,500 243,208,000
Schedule B
Reserves and Surplus
Securities Premium Account
opening Balance 687,713,734 687,167,834
Add: Received during the year 3,427,350 545,900
691,141,084 687,713,734
General Reserve
opening Balance 168,150,794 160,150,794
Add : Transfer from profit & Loss Account 8,000,000 8,000,000
176,150,794 168,150,794
Profit & Loss Account 267,506,138 220,730,743
Total 1,134,798,016 1,076,595,271
Schedule C
Secured Loans
From Banks
- Short Term Loan 11,250,000 86,250,000
(Secured by pledge of Fixed Deposits with bank)
From Other
- Vehicle Loan 2,904,000 -
(Secured by hypothecation of Motor Car)
Total 14,154,000 86,250,000
Schedule D
Unsecured Loans
Short Term Loans
- From a Bank 11,250,000 86,250,000
- interest accrued and due 172,403 -
Total 11,422,403 86,250,000

45
SCHeDULeS FoRMiNG pART oF THe BALANCe SHeeT AS AT 31ST MARCH, 2011
Des
crip
tion
Gro
ss B
lock
(At C
ost)
Dep
reci
atio
n / A
mor
tiza
tion
N
et B
lock
As
On
01.0
4.20
10
Add
itio
ns
Dur
ing
The
Year
Ded
ucti
ons
Dur
ing
The
Year
As
On
31.0
3.20
11
As
On
01.0
4.20
10
For T
he
Year
D
educ
tion
s D
urin
g Th
e Ye
ar
Upt
o 31
.03.
2011
A
s O
n 31
.03.
2011
A
s On
31.0
3.20
10
(`)
(`)
(`)
(`)
(`)
(`)
(`)
(`)
(`)
(`)
(A) T
angi
bles
Air
Cond
ition
ers
12,
914,
306
646
,168
5
13,4
66
13,
047,
008
4,5
42,2
10
1,2
00,0
80
195
,341
5
,546
,949
7
,500
,059
8
,372
,096
Com
pute
rs 9
0,09
4,95
0 1
2,28
5,69
3 1
,997
,717
1
00,3
82,9
26
67,
060,
578
11,
872,
488
1,6
54,0
58
77,
279,
008
23,
103,
918
23,
034,
372
Mot
or C
ars
8,1
90,2
83
4,4
38,3
30
1,7
25,7
24
10,
902,
889
3,9
76,3
02
1,0
89,0
04
1,4
00,0
25
3,6
65,2
81
7,2
37,6
08
4,2
13,9
81
Furn
iture
& F
ixtu
res
6,7
32,4
92
788
,052
2
09,2
18
7,3
11,3
26
5,1
00,7
85
843
,961
2
09,2
18
5,7
35,5
28
1,5
75,7
98
1,6
31,7
07
offi
ce e
quip
men
ts 3
1,64
9,12
8 3
,641
,843
1
,469
,858
3
3,82
1,11
3 1
1,74
0,33
8 3
,097
,621
5
69,4
90
14,
268,
469
19,
552,
644
19,
908,
790
Lice
nced
pro
pert
y-im
prov
emen
t 8
3,40
4,36
4 6
,425
,186
1
,157
,880
8
8,67
1,67
0 6
9,03
2,75
0 1
2,99
2,00
3 1
,157
,880
8
0,86
6,87
3 7
,804
,797
1
4,37
1,61
4
(B) I
ntan
gibl
es
Stoc
k ex
chan
ges
Mem
bers
hip
Righ
ts 2
8,25
5,00
0 -
- 2
8,25
5,00
0 2
8,25
5,00
0 -
- 2
8,25
5,00
0 -
-
Soft
war
es 3
1,56
3,13
6 1
0,02
4,65
9 4
1,58
7,79
5 2
4,98
2,39
7 7
,494
,116
-
32,
476,
513
9,1
11,2
82
6,5
80,7
39
Tota
l 2
,92,
803,
659
38,
249,
931
7,0
73,8
63
323,
979,
727
214,
690,
360
38,
589,
273
5,1
86,0
12
248
,093
,621
7
5,88
6,10
6 7
8,11
3,29
9
Prev
ious
Yea
r 2
,78,
560,
277
20,
382,
296
6,1
38,9
14
292,
803,
659
1,72
,116
,606
4
6,33
0,15
0 3
,756
,396
21
4,69
0,36
0 7
8,11
3,29
9 10
6,44
3,67
1
Sche
dule
E
Fixe
d A
sset
s
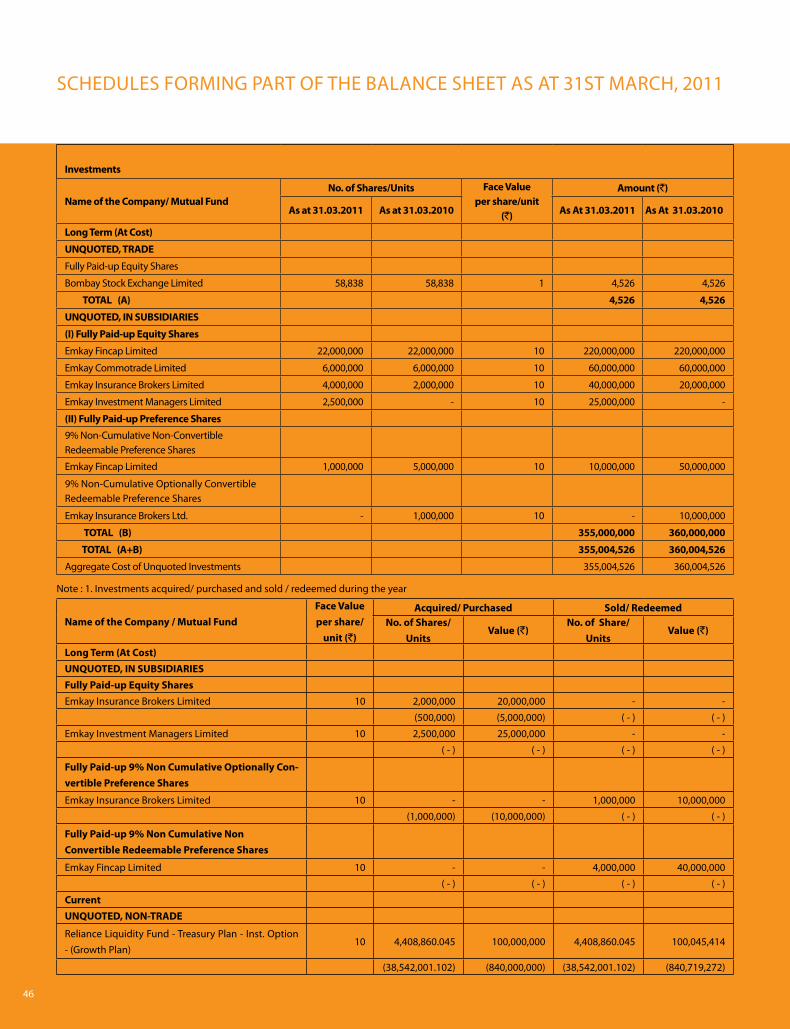
46
Schedule FInvestments
Name of the Company/ Mutual FundNo. of Shares/Units Face Value
per share/unit (`)
Amount (`)
As at 31.03.2011 As at 31.03.2010 As At 31.03.2011 As At 31.03.2010
Long Term (At Cost)
UNQUOTED, TRADE
Fully paid-up equity Shares
Bombay Stock exchange Limited 58,838 58,838 1 4,526 4,526
TOTAL (A) 4,526 4,526
UNQUOTED, IN SUBSIDIARIES
(I) Fully Paid-up Equity Shares
emkay Fincap Limited 22,000,000 22,000,000 10 220,000,000 220,000,000
emkay Commotrade Limited 6,000,000 6,000,000 10 60,000,000 60,000,000
emkay insurance Brokers Limited 4,000,000 2,000,000 10 40,000,000 20,000,000
emkay investment Managers Limited 2,500,000 - 10 25,000,000 -
(II) Fully Paid-up Preference Shares
9% Non-Cumulative Non-Convertible Redeemable preference Shares
emkay Fincap Limited 1,000,000 5,000,000 10 10,000,000 50,000,000
9% Non-Cumulative optionally Convertible Redeemable preference Shares
emkay insurance Brokers Ltd. - 1,000,000 10 - 10,000,000
TOTAL (B) 355,000,000 360,000,000
TOTAL (A+B) 355,004,526 360,004,526
Aggregate Cost of Unquoted investments 355,004,526 360,004,526
Name of the Company / Mutual FundFace Value per share/
unit (`)
Acquired/ Purchased Sold/ RedeemedNo. of Shares/
UnitsValue (`)
No. of Share/ Units
Value (`)
Long Term (At Cost)UNQUOTED, IN SUBSIDIARIESFully Paid-up Equity Sharesemkay insurance Brokers Limited 10 2,000,000 20,000,000 - -
(500,000) (5,000,000) ( - ) ( - )
emkay investment Managers Limited 10 2,500,000 25,000,000 - -
( - ) ( - ) ( - ) ( - )
Fully Paid-up 9% Non Cumulative Optionally Con-vertible Preference Shares
emkay insurance Brokers Limited 10 - - 1,000,000 10,000,000
(1,000,000) (10,000,000) ( - ) ( - )
Fully Paid-up 9% Non Cumulative Non Convertible Redeemable Preference Shares
emkay Fincap Limited 10 - - 4,000,000 40,000,000
( - ) ( - ) ( - ) ( - )
CurrentUNQUOTED, NON-TRADE
Reliance Liquidity Fund - Treasury plan - inst. option - (Growth plan)
10 4,408,860.045 100,000,000 4,408,860.045 100,045,414
(38,542,001.102) (840,000,000) (38,542,001.102) (840,719,272)
SCHeDULeS FoRMiNG pART oF THe BALANCe SHeeT AS AT 31ST MARCH, 2011
Note : 1. investments acquired/ purchased and sold / redeemed during the year

47
HDFC Liquid Fund - premium plan Growth 10 2,702,483.582 50,000,000 2,702,483.582 50,031,079
( - ) ( - ) ( - ) ( - )
Reliance Money Manager Fund - institutional option - Growth plan 1000 39,678.415 50,006,469 39,678.415 50,040,314
(205,172.390) (250,013,263) (205,172.390) (250,414,086)
Birla Sun Life Cash plus - instl. Growth 10 - - - -
(2,049,575.123) (50,000,000) (2,049,575.123) (50,023,365)
Birla Sun Life Cash plus - instl. premium - Growth plan 10 - - - -
(3,433,617.866) (50,000,000) (3,433,617.866) (50,046,697)
UTi Money Market Fund - institutional Growth plan 1000 202,461.912 210,104,927 202,461.912 210,164,532
(682,639.721) (700,306,577) (682,639.721) (700,715,719)
Axis Liquid Fund - Growth plan 10 - - - -
(109,292.920) (110,000,000) (109,292.920) (110,166,902)
Axis Treasury Advantage Fund - Growth 1000 97,331.420 100,012,720 97,331.420 100,066,570
(19,945.430) (20,009,286) (19,945.430) (20,051,452)
UTi Money Market Fund - Growth plan 1000 - - - -
(289,326.740) (730,000,000) (289,326.740) (730,335,886)
DWS insta Cash plus Fund - Super institutional plan Growth 10 24,924,656.342 300,000,000 24,924,656.342 300,171,883
(15,113,853.605) (180,000,000) (15,113,853.605) (180,022,330)
DWS Treasury Fund Cash - institutional plan - Growth 10 4,864,893.985 50,006,245 4,864,893.985 50,052,462
(17,658,602.213) (180,022,330) (17,658,602.213) (180,202,212)
Reliance Diversifited power Sector Fund - Retails Growth plan 10 - - - -
(6,530.032) (500,000) (6,530.032) (493,220)
Relaince Banking Fund - Growth plan 10 - - - -
(6,429.884) (500,000) (6,429.884) (478,792)
Relaince equity opportunity Fund - Retail Growth plan 10 - - - -
(18,131.183) (500,000) (18,131.183) (508,511)
Reliance Growth Fund - Retails plan 10 - - - -
(1,205.383) (500,000) (1,205.383) (492,359)
Reliance Vision Fund - Retail plan 10 - - - -
(2,035.928) (500,000) (2,035.928) (495,018)
Kotak Nifty exchange Traded Fund 10 - - - -
(16,231.000) (8,199,656) (16,231.000) (8,575,220)
Axis Liquid Fund - institutional Growth 1000 395,686.789 410,020,338 395,686.789 410,201,614
( - ) ( - ) ( - ) ( - )
DWS Ultra Short Term Fund - institutional Growth 10 4,613,984.960 50,076,963 4,613,984.960 50,104,647
( - ) ( - ) ( - ) ( - )
Reliance Liquidity Fund - Cash plan-Growth option-Growth plan 10 3162375.323 5,00,00,000 3162375.323 5,01,52,426
( - ) ( - ) ( - ) ( - )
Reliance Liquidity Fund - Growth option 10 14,094,443.133 200,000,000 14,094,443.133 200,084,605
(59,280,181.968) (800,000,000) (59,280,181.968) (800,509,433)
UTi Liquid Cash plan institutional - Growth option 1000 132,948.822 210,000,000.00 132,948.822 210,138,706
(172,294.289) (250,000,000) (172,294.289) (250,382,474)
UTi Treasury Advantage Fund - inst. plan (Growth option) 1000 64,403.222 80,009,796 64,403.222 80,155,837
(480,194.451) (580,162,165) (480,194.451) (581,268,297)
UTi Money Market Fund - Growth plan 10 - - - -
(2,017,284.090) (50,000,000) (2,017,284.090) (50,013,718)
SCHeDULeS FoRMiNG pART oF THe BALANCe SHeeT AS AT 31ST MARCH, 2011
Name of the Company / Mutual FundFace Value per share/
unit (`)
Acquired/ Purchased Sold/ RedeemedNo. of Shares/
UnitsValue (`)
No. of Shares/ Units
Value (`)

48
Particulars As At 31.03.2011
(`) As At 31.03.2010
(`)
Schedule G
Stock in Trade
Shares and Securities 628,517 977,249
Total 628,517 977,249
Schedule H
Sundry Debtors
(Unsecured)
exceeding six months
- Considered Good 5,009,045 56,037,673
- Considered Doubtful 56,840,319 115,585,490
61,849,364 171,623,163
Less : provision for Doubtful Debts 56,840,319 115,585,490
5,009,045 56,037,673
other Debts
- Considered Good 331,810,401 426,400,958
- Considered Doubtful 20,246,485 1,445,302
352,056,886 427,846,260
Less: provision for Doubtful Debts 20,246,485 1,445,302
331,810,401 426,400,958
Total 336,819,446 482,438,631
Schedule I
Cash And Bank Balances
Cash & Cheques on hand 657,914 4,660,713
Balances with Scheduled Banks
- in Current Accounts 194,082,586 147,701,563
- in Fixed Deposit Accounts 862,900,000 1,144,000,000
- in Unclaimed Dividend Accounts 172,915 137,428
- in ipo Refund Account 234,240 234,240
Gift/Meal Coupons 238,343 152,040
Stamps on Hand 26,000 67,000
Foreign Currency on Hand 15,902 84,245
Total 1,058,327,900 1,297,037,229
Schedule J
Other Current Assets
Accrued interest on Bank Fixed Deposits 18,947,251 30,912,142
Total 18,947,251 30,912,142
SCHeDULeS FoRMiNG pART oF THe BALANCe SHeeT AS AT 31ST MARCH, 2011

49
Particulars As At 31.03.2011 (`)
As At 31.03.2010 (`)
Schedule KLoans & Advances (Unsecured, considered good unless otherwise stated)Loan to Staff 5,467,339 1,950,444 Loan to emkay employee Welfare Trust [ Refer Note No. B 2(b)(ii) of Schedule T ] 53,100,000 - prepaid expenses 18,910,067 14,648,129 Advances Recoverable in cash or kind or for value to be received - Subsidiaries 213,574 26,043 - others Considered Good 14,549,371 18,661,113 - others Considered Doubtful 1,234,541 -
15,997,486 18,687,156 Less : provision for Doubtful Advances 1,234,541 -
14,762,945 18,687,156 Deposits - Considered Good 62,093,973 64,063,288 - Considered Doubtful 173,896 195,896
62,267,869 64,259,184 Less : provision for Doubtful Deposits 173,896 195,896
62,093,973 64,063,288 income Tax and Tax Deducted at Source (net of provision) 50,135,275 51,161,922 Fringe Benefit Tax (net of provision) 102,246 280,465 equity index/Stock options premium - 14,776 Mark to Market Margin - equity index/Stock Futures 6,494,688 88,304 Less : provision for Loss on equity index/Stock Futures 6,494,688 88,304
- -Mark to Market Margin - Currency Futures - 58,750 Less : provision for Loss on Currency Futures - 58,750Total 204,571,845 150,806,180
Schedule LCurrent LiabilitiesSundry Creditors 656,676,064 682,595,385 payable to Subsidiaries - 15,444 other Liabilities 22,728,606 16,900,741 Security/Margin Deposits 167,799,594 222,316,024 Advances 8,232,603 8,093,994 Share Application Money under eSop Schemes 177,500 920,500 Unclaimed Share Application Money (*) 234,240 234,240 Unclaimed Dividend (*) 172,915 137,428 equity index/Stock options premium 5,835,569 596,270 Add : provision for Loss on equity index/Stock options - 53,822
5,835,569 650,092 Mark to Market Margin - equity index/Stock Futures 4,500 268,619 Total 861,861,591 932,132,467 (*) Appropriate amount shall be transferred to “investor education & protection Fund” as and when due.
Schedule MProvisionsGratuity 7,388,337 1,686,563 Wealth Tax 64,600 - proposed Dividend 24,427,250 24,320,800 Dividend Distribution Tax 3,962,711 4,039,381 Total 35,842,898 30,046,744
SCHeDULeS FoRMiNG pART oF THe BALANCe SHeeT AS AT 31ST MARCH, 2011

50
SCHeDULeS FoRMiNG pART oF pRoFiT AND LoSS ACCoUNT FoR THe YeAR eNDeD 31ST MARCH, 2011
Particulars Year Ended 31.03.2011 (`)
Year Ended 31.03.2010 (`)
Schedule NIncome from OperationsBrokerage 848,710,329 859,672,392 investment Banking Activities 128,716,277 138,036,800 portfolio Management Fees 22,328,020 14,780,561 Depository operations 8,891,119 12,598,766 other Fees 15,339,655 9,205,611 profit/(Loss) in proprietory Trades in Securities/Derivatives transactions ( Net of expenses) 22,943,607 19,886,034 (Less)/Add : (provision)/Write Back for/of Loss on equity index/Stock options ( Net) 53,822 (53,822)(Less)/Add : (provision)/Write Back for/of Loss on equity index/Stock Futures ( Net) (6,406,384) (88,304)(Less)/Add : (provision)/Write Back for/of Loss on Currency Futures ( Net) 58,750 (58,750)
16,649,795 19,685,158 1,040,635,195 1,053,979,288
Schedule OOther Incomeinterest (Gross) - on fixed deposits with banks 70,519,030 81,491,376 (TDS ` 70,51,768/-, p.Y. ` 91,71,640/-) - others 269,919 1,410,925
70,788,949 82,902,301 Dividend (Gross) - on Long term Trade investments 235,352 235,352 - on Stock in Trade 6,486 23,429
241,838 258,781 Miscellaneous income 27,110,797 18,057,917 profit on Sale of investments - Current 1,172,631 4,701,687 provision for Doubtful Debts Written Back 42,542,469 7,257,232 provision for Doubtful Deposits Written Back 22,000 - Bad Debts Recovered 129,875 -
142,008,559 113,177,918
Schedule P Personnel CostSalaries and other Benefits 431,346,095 335,329,536 Contribution to provident Fund and other Funds 14,880,179 8,313,533 Staff Welfare expenses 8,010,180 6,272,290
454,236,454 349,915,359
Schedule QOperating ExpensesBrokerage & Commission 163,749,461 199,942,532 Communication, postage and Courier Charges 43,867,770 38,689,164 Fees & Stamps 45,848,475 40,589,959 Contribution/payments to Stock exchange 28,109,965 27,158,428 Membership & Subscription 18,503,205 19,006,100 Registration Fees 2,440,165 2,798,808 Depository Charges 4,287,622 5,694,469 Consultancy Fees 18,900,000 72,869,377 Loss due to execution of Trades 10,418,559 11,521,610 Claims/ Compensation 11,301 113,500
336,136,523 418,383,947

51
Particulars Year Ended 31.03.2011 (`)
Year Ended 31.03.2010 (`)
Schedule R
Administrative Expenses
electricity Charges 16,928,219 16,401,157
insurance 935,371 1,079,118
Repairs & Maintenance - others 15,229,447 14,135,700
Advertisement & Business promotion expenses 14,762,340 7,960,671
Motor Car expenses 541,173 484,446
printing & Stationery 10,749,405 8,688,618
Travelling and Conveyance 18,516,392 13,261,683
provision for Doubtful Debts 20,906,579 39,305,369
provision for Doubtful Deposits / Advances 1,234,541 195,896
Bank Commission and Charges 13,406,716 13,415,747
Bad Debts Written off 18,385,076 20,087,587
Less : provision Written Back (18,308,098) (19,630,010)
76,978 457,577
Deposits & Advances Written off 158,688 572,256
Software expenses 5,954,456 5,396,334
Legal & professional fees 10,913,177 4,932,845
Auditor’s Remuneration (Net of Service tax)
- Audit Fees 900,000 800,000
- Tax Audit Fees 100,000 50,000
- Taxation Matters 152,000 123,000
- other Matters 185,000 138,665
1,337,000 1,111,665
Rent 60,931,691 61,217,320
Loss on Sale of Fixed Assets/ Assets Discarded 328,680 1,618,331
Miscellaneous expenses 16,426,984 12,195,450
Donation 125,500 8,501
209,463,337 202,438,684
Schedule S
Interest
to Banks 13,643,587 15,004,264
to others 1,972,431 159,605
15,616,018 15,163,869
SCHeDULeS FoRMiNG pART oF pRoFiT AND LoSS ACCoUNT FoR THe YeAR eNDeD 31ST MARCH, 2011

52
SCHEDULE FORMING PART OF THE ACCOUNTS FOR THE YEAR ENDED 31ST MARCH, 2011
SCHEDULE “T”
(A) SIGNIFICANT ACCOUNTING POLICIES
1. Basis of Preparation of Financial Statements
The accompanying financial statements are prepared in accordance with Generally Accepted Accounting Principles and provisions of the Companies Act, 1956 under the historical cost convention on the accrual basis of accounting. The accounting policies have been consistently applied by the company unless otherwise stated.
2. Use of Estimates
The preparation of financial statements in conformity with generally accepted accounting principles requires estimates and assumptions to be made that affect the reported amounts of assets and liabilities and disclosures of contingent liabilities on the date of the financial statements and the reported amounts of revenues and expenses during the reporting period. Actual results could differ from these estimates and the differences between actual results and estimates are recognised in the periods in which the results are known / materialize.
3. Revenue Recognition
(a) Brokerage from secondary market is recognized as per contracted rates on the execution of transactions on behalf of the clients on the trade date.
(b) One time non refundable subscription fees with a validity of maximum of one year for joining various special brokerage schemes are treated as income when the client agrees to join that particular scheme and renders payment for the same. Brokerage reversible under the said schemes are reversed by making provision at the end of each quarter. However, actual credit for brokerage reversible to the client is given at the end of the validity period of the scheme opted.
(c) Portfolio Management Fees is accounted on accrual basis as follows :-
(i) in case of fees based on fixed percentage of Assets Under Management, income is accrued at the end of each quarter or closure of Portfolio Account, whichever is earlier.
(ii) in case of fees based on returns on Portfolio, income is accounted at the end of completion of one year by each client from the date of joining the Portfolio Management Scheme or closure of Portfolio Account, whichever is earlier.
(d) Dividend including interim are accounted when the right to receive payment is established.
(e) Profit/ (Loss) in proprietory trades in securities and derivatives comprises of profit/(loss) on sale of securities held as stock-in-trade, profit/(loss) on equity derivative instruments and profit/(loss) on currency futures transactions. Profit/(loss) on sale of securities is determined based on first-in-first-out (FIFO) basis of cost of securities sold. Profit/(loss) on equity derivative instruments is determined as explained in para 4 and 5 below. Profit/(loss) on Currency Futures transactions is also determined mutatis mutandis as explained in para 4 and 5 below.
4. Equity Index/Stock - Futures
(i) Equity Index/Stock Futures are marked-to-market on a daily basis. Debit or Credit balance disclosed under Loans and Advances or Current Liabilities, respectively, in the Mark-to-Market Margin – Equity Index / Stock Futures Account, represents the net amount paid or received on the basis of movement in the prices of Index/Stock futures till the Balance Sheet date.
(ii) As on the Balance Sheet date, Profit / Loss on open positions in Equity Index / Stock Futures is accounted for as follows:
• Credit balance in the Mark-to-Market Margin – Equity Index / Stock Futures Account, being the anticipated profit, is ignored and no credit for the same is taken in the Profit and Loss account.

53
• Debit balance in the Mark-to-Market Margin – Equity Index / Stock Futures Account, being the anticipated loss, is provided in the Profit and Loss account and is reflected in “Provision for Loss on Equity Index/Stock Futures Account” under Current Liabilities.
(iii) On final settlement or squaring-up of contracts for Equity Index / Stock Futures, the Profit or Loss is calculated as the difference between the settlement / squaring-up price and the contract price. Accordingly, debit or credit balance pertaining to the settled / squared-up contract in Mark-to-Market Margin – Equity Index / Stock Futures Account after adjustment of the provision for anticipated losses is recognized in the Profit and Loss account. When more than one contract in respect of the relevant series of Equity Index / Stock Futures contract to which the squared-up contract pertains is outstanding at the time of the squaring-up of the contract, the contract price of the contract so squared-up is determined using the weighted average cost method for calculating the Profit / Loss on squaring-up.
5. Equity Index/Stock - Options
(i) “Equity Index/Stock Options Premium Account” represents premium paid or received for buying or selling the options, respectively. Debit or Credit balance under the said account is disclosed under Loans and Advances or Current Liabilities as the case may be.
(ii) At the time of final settlement
Premium paid/received is recognised as an expense/income on exercise of Option. Further, difference between the final settlement price as on the exercise/expiry date and the strike price is recognised as Profit or Loss.
(iii) At the time of squaring off
Difference between the premium paid and received on squared off transactions is treated as Profit or Loss.
(iv) At the Balance Sheet date
In the case of long positions, provision is made for the amount by which the premium paid for those options exceeds the premium prevailing on the balance sheet date, and in the case of short positions, for the amount by which premium on the Balance Sheet date exceeds the premium received for those options, and is reflected in “Provision for Loss on Equity Index/Stock Option Account” under Current Liabilities.
6. Fixed Assets and Depreciation
a) Fixed Assets are stated at cost of acquisition including incidental expenses related to such acquisition and installation less accumulated depreciation.
b) Depreciation on Fixed Assets other than Improvements to Leasehold/ Licensed Premises have been provided on written down value method at the rates prescribed under Schedule XIV to the Companies Act, 1956 as amended from time to time including pro rata depreciation on additions/deletions made during the year.
c) Improvements to Leasehold/Licensed Premises are depreciated on a straight-line method over the Primary Lease Period or over a period of 3 years whichever is less starting from the date when the Leasehold/Licensed Premises are put to use.
7. Intangible Assets and Amortization
Items of expenditure that meet the recognition criteria as mentioned in Accounting Standard – 26 on “Intangible Assets” are classified as intangible assets and are amortized over the period of economic benefits.
Softwares are stated at cost of acquisition and are amortized on straight line basis over a period of 3 years irrespective of the date of acquisition.
Membership Rights in Stock Exchanges are amortized on straight- line basis over a period of 10 years.
SCHEDULE FORMING PART OF THE ACCOUNTS FOR THE YEAR ENDED 31ST MARCH, 2011

54
8. Stock – in – Trade
Stock – in – Trade of securities are valued at lower of the cost or market value on individual scrip by scrip basis. Cost is determined on First-in-First-Out (FIFO) basis.
9. Investments
Investments that are readily realizable and intended to be held for not more than twelve months are classified as Current Investments. All other investments are classified as long term investments. Long Term Investments are stated at cost. However, provision for diminution in value is made to recognize a decline other than temporary in the value of the investments.
Current Investments are stated at lower of cost and fair value and determined on an individual investment basis.
10. Employee Benefits
(i) Short Term Benefits
All employee benefits including leave encashment (short term compensated absences) and statutory bonus/ performance bonus/ incentives payable wholly within twelve months of rendering the service are classified as short term employee benefits and are charged to the Profit and Loss Account of the year.
(ii) Long Term Benefits
(a) Post Employment Benefits
(i) Defined Contribution Plans:- Retirement/ Employee benefits in the form of Provident Fund, Employees State Insurance and labour welfare are considered as defined contribution plan and contributions to the respective funds administered by the Government are charged to the Profit and Loss account of the year when the contribution to the respective funds are due.
(ii) Defined Benefit Plans :- Retirement benefits in the form of gratuity is considered as defined benefit obligation and is provided for on the basis of an actuarial valuation on projected unit credit method made as at the date of the Balance Sheet. The scheme is maintained and administered by an insurer to which the trustees make periodic contributions. Actuarial gain/loss, if any are immediately recognized in the Profit and Loss account.
(b) Other Long Term Benefits
As per the present policy of the company, there are no other long term benefits to which its employees are entitled.
11. Borrowing Cost
Borrowing costs that are attributable to the acquisition or construction of qualifying assets are capitalized as part of the cost of such assets. A qualifying asset is one that necessarily takes substantial period of time to get ready for intended use. All other borrowing costs are charged to revenue.
12. Assets on Operating Leases
Lease payments under operating leases are recognized as expenses on accrual basis in accordance with the respective leave and license agreements.
13. Share Issue Expenses
Expenses incurred in connection with fresh issue of Share Capital are adjusted against Securities Premium account in the year in which they are incurred.
SCHEDULE FORMING PART OF THE ACCOUNTS FOR THE YEAR ENDED 31ST MARCH, 2011

55
14. Taxation
Provision for Taxation has been made in accordance with the Income Tax Laws prevailing for the relevant assessment years.
15. Deferred Taxation
Deferred Tax resulting from timing differences between book and tax profits is accounted for under the liability method, at the tax rates that have been enacted or substantively enacted after the balance sheet date, to the extent that the timing difference are expected to crystallize as deferred tax charge/benefit in the profit and loss account and as deferred tax assets/ liabilities in the Balance Sheet.
16. Contingencies and Events Occuring After The Balance Sheet Date
Events occurring after the date of the Balance Sheet, which provide further evidence of conditions that existed at the Balance Sheet date or that arose subsequently, are considered up to the date of approval of accounts by the Board of Directors, where material.
17. Impairment
Where the recoverable amount of the fixed asset is lower than its carrying amount, a provision is made for the impairment loss. Post impairment, depreciation is provided for on the revised carrying value of the asset over its remaining useful life.
18. Provisions, Contingent Liabilities & Contingent Assets
A provision is recognized when an enterprise has a present obligation as a result of past event(s) and it is probable that an outflow of resources embodying economic benefits will be required to settle the obligation(s), in respect of which a reliable estimate can be made for the amount of obligation. Contingent liabilities, if material, are disclosed by way of notes. Contingent assets are not recognized or disclosed in the financial statements.
19. Foreign Currency Transactions
Foreign currency transactions are accounted at the exchange rates prevailing on the date of the transaction. Foreign currency monetary items outstanding as at the Balance Sheet date are reported using the closing rate. Gains and losses resulting from the settlement of such transactions and translation of monetary assets and liabilities denominated in foreign currencies are recognized in the Profit and Loss Account.
20. Employee Stock Compensation Cost
The company follows the intrinsic value method as prescribed by the Guidance note on “Accounting for Employee Share-based Payments” issued by the Institute of Chartered Accountants of India to account for the compensation cost of its Stock based employee compensation plans.
21. Stock Lending and Borrowing
Borrowing/ Lending fees paid/received on stocks borrowed/lent under Stock Lending and Borrowing Mechanism is recognized on accrual basis.
Amount deposited with Stock Exchanges for borrowed stocks has been shown under the head Current Assets, Loans and Advances and the same is reversed on return of such borrowed stock.
Sale proceeds of borrowed stock has been shown as Current Liabilities and the same is reversed on squaring up of the transaction with resultant gain/loss being recognized in the Profit and Loss account.
Provision is made for anticipated losses however anticipated profits are ignored for difference between sale price of borrowed stock and the price prevailing at the Balance Sheet date on such borrowed stock.
SCHEDULE FORMING PART OF THE ACCOUNTS FOR THE YEAR ENDED 31ST MARCH, 2011

56
* Options granted under ESOP – 2007 includes 1,20,000 options to employees of Subsidiary Companies.
** Closing market price prior to the date of grant except in case of ESOP – 2005 where the value determined by an independent valuer as the company was unlisted at that time.
b) i) The Company introduced ESOP – 2010 Scheme during the year and set up “Emkay Employees Welfare Trust” to administer and implement this in accordance with recommendations of the Remuneration / Compensation Committee of the Company. The said trust shall purchase shares of the Company from the Stock / Secondary Market from time to time and hold this pool of shares for the benefit of the Employees / Employee Directors. The Company may also grant financial assistance to the trust for this purpose with or without interest. The trust shall grant options to the employees in accordance with the directions and recommendations of the Remuneration / Compensation Committee. Each option would entitle an option holder to acquire one equity share of the Company from the trust. All present and future Permanent Employees and/or Employee Directors of the Company (excluding Promoter Employees and/or Promoter Directors) selected by the Remuneration / Compensation Committee from time to time would be entitled to participate in this Scheme.
(ii) For the above purpose, the Company during the year granted interest free loan of ̀ 5,31,00,000/- to the trust for the equity shares bought by the said trust. The repayment of the loan granted by the Company to the trust is dependent on the exercise of the options by the eligible employees and the market price of the underlying shares of the unexercised options at the end of the respective exercise period.
Particulars ESOP – 2005 ESOP – 2007 ESOP – 2010
Date of Grant 28.01.2006 17.01.2008 19.06.2009 24.07.2009 04.05.2010 27.07.2010 21.10.2010
Number of Options Granted*
3,81,250 14,42,000 2,44,000 2,07,500 1,00,000 611,500 5,55,000
Method of Settlement Equity
Vesting period from the date of Grant
Graded Vesting – Over 4 years
Graded Vesting – Over 3 years
Graded Vesting -
Over 5 years
Exercise period from the date of Vesting
3 years from the date of each vesting
Exercise Price (` per share) **
20 63 63 61 93 77 93
Market Price at the date of grant (` per share)
20 63 63 62 92.75 76.25 92.50
SCHEDULE FORMING PART OF THE ACCOUNTS FOR THE YEAR ENDED 31ST MARCH, 2011
(B) NOTES TO THE ACCOUNTS
1. Figures of the previous year have been regrouped, recasted and rearranged wherever necessary to make them comparable with the figures of the current year.
2. Employees Stock Option Schemes
Disclosure required pursuant to “Guidance Note on Accounting for Employee Share- based payments” in connection with company’s Employees Stock Option Schemes :-
a) The company has granted Employee Stock Options (ESOP) to its employees and employees of its subsidiaries. During the year ended 31st March, 2011, following schemes were in operation:

57
c) Details of activity under the ESOP Schemes have been summarized below:
d) The fair value and other disclosures and assumptions are given below : (i) Key Assumptions in Black - Scholes Model for calculating fair value as at the date of grant for options granted during the year :
Particulars ESOP-2005 ESOP-2007 ESOP-2010
2010-2011 2009-2010 2010-2011 2009-2010 2010-2011 2009-2010
Options Outstanding at the beginning of the year 53,000 120,000 15,66,700 13,65,500 - -
Options Granted during the year - - 7,11,500 4,51,500 555,000 -
Options Forfeited during the year - 2,500 - - - -
Options Exercised during the year 33,250 59,000 48,950 11,300 - -
Options Expired/ Lapsed during the year 1,000 5,500 220,000 2,39,000 - -
Options Outstanding at the end of the year 18,750 53,000 2,009,250 1,566,700 555,000 -
Options Exercisable at the end of the year 18,750 53,000 2,59,500 1,06,350 - -
Weighted Average remaining contractual life (in years) 1.51 0.66 5.44 5.55 7.51 -
Weighted Average Exercise Price of the options granted during the year (` per share)
20.00 20.00 85.27 62.78 85.27 -
Weighted Average Share Price at the date of exercise (` per share) 94.42 73.03 91.02 79.42 - -
Grant Date04.05.2010 27.07.2010 21.10.2010
Variables
Expected Volatility 72.48% 71.03% 70.02%
Risk Free Interest Rate 7.21% - 7.67% 7.32% - 7.68% 7.73% - 7.96%
Time to Maturity (in years) 4.41- 6.61 years 4.43 - 6.43 years 4.45 - 6.45 years
Expected Dividend Yield 1.39% 1.39% 1.43%
Exercise Price (` per share) 93 77 93
Price of the underlying share at the time of the option grant (`) per share)
92.75 76.25 92.50
ESOP 2010 ESOP 2007
SCHEDULE FORMING PART OF THE ACCOUNTS FOR THE YEAR ENDED 31ST MARCH, 2011SCHEDULE FORMING PART OF THE ACCOUNTS FOR THE YEAR ENDED 31ST MARCH, 2011

58
(iii) Other disclosures and assumptions :
• ExpectedvolatilityconsideredisonthebasisofstockpricesofthecompanyonNationalStockExchangeofIndiaLtd.(N SE) from 28th April, 2006 (i.e. date of Listing on exchanges) till the respective grant date.
• Riskfreeinterestrateconsideredistheinterestrateapplicableformaturityequaltotheexpectedlifeoftheoptionsbasedonthezero- coupon yield curve for government securities.
• TimetoMaturityconsideredistheperiodforwhichthecompanyexpectstheoptionstobelivetakingintoaccountthevestingperiod,average lengths of time of similar grants which have remained outstanding in the past etc.
• ExpectedDividendyieldconsideredistheaverageofdividendyieldsfortheprecedingyearstotheyearofgrant,inwhichdividendshave been paid.
• ExercisepriceconsideredisthepricedecidedbythecompanytobetheExerciseprice.• CurrentPriceoftheunderlyingshareconsideredistheclosingmarketpriceofthecompany’sequitysharesonNSEonthedateof
grant.
e) The Company has accounted compensation cost for the stock options granted using intrinsic value method. Had the company used the fair value method for calculating compensation cost for stock options granted, the impact on the company’s net profit and earning per share would have been as per the proforma amounts indicated below :
Particulars Year Ended 31st March 2011 Amount (`)
Year Ended 31st March 2010 Amount (`)
Net Income as reported 8,32,80,974 8,39,61,111
Add: - Intrinsic Value Compensation Cost Nil Nil
Less :- Fair Value Compensation Cost 4,29,81,177 8,12,31,677
Adjusted Pro-forma Net Income 4,02,99,797 27,29,434
Earning per Share
Basic
- As reported 3.41 3.46
- Proforma 1.65 0.11
Diluted
- As reported 3.37 3.42
- Proforma 1.63 0.11
f ) The fair value and other disclosures and assumptions have been determined by an independent consultant and relied upon by the Auditors.
3. Capital Work in progress represents capital advances, fixed assets acquired but not put to use before year end and expenses incurred pertaining thereto.
4. Debit and Credit balances are subject to confirmation.
5. Disclosure on retirement benefits as required in Accounting Standard 15 (AS – 15) on “Employee Benefits” are given below :
(ii) Fair Value as at the date of grant for options granted during the year :-
Particulars ESOP 2010 ESOP 2010
Grant Date 04.05.2010 27.07.2010 21.10.2010
Weighted Average Fair Value (` per share) 57.18 46.44 56.13
SCHEDULE FORMING PART OF THE ACCOUNTS FOR THE YEAR ENDED 31ST MARCH, 2011

59
(i) Defined Contribution Plan
The Company has recognized the following amounts in Profit and Loss Account towards Contribution to Defined Contribution Plans which are included under “Contribution to Provident fund and other funds” :
Particulars Year ended 31st March, 2011
(`)
Year ended 31st March, 2010
(`)
Provident Fund 60,00,366 58,64,544
Employees State Insurance Scheme 14,89,338 7,48,654
Maharashtra Labour Welfare Fund 2,138 3,734
(ii) Defined Benefit Plan
The details of the Company’s post retirement benefit plan for gratuity for its employees in conformity with the principles set out in AS – 15 which has been determined by an Actuary appointed for the purpose and relied upon by the Auditors are given below :
Sr. No. Particulars 2010-2011 (`)
2009-2010 (`)
I Changes in present value of obligations
Present Value of Obligations at beginning of the year 11,590,293 10,025,422
Interest cost 859,095 688,838
Current Service Cost 4,862,653 3,160,891
Past Service Cost ( Non-Vested Benefits) 148,890 -
Past Service Cost ( Vested Benefits) 2,184,673 -
Benefits Paid (271,398) (369,750)
Actuarial (gain)/loss on obligations (440,441) (1,915,108)
Present Value of Obligations at end of the year 18,933,765 11,590,293
II Changes in fair value of plan assets
Fair Value of Plan Assets at beginning of the year 9,903,730 5,729,401
Expected Return on Plan Assets 955,000 692,300
Contributions by employer 1,686,563 4,296,021
Benefits Paid (271,398) (369,750)
Actuarial gain/(loss) on plan assets (728,467) (444,242)
Fair Value of Plan Assets at end of the year 11,545,428 9,903,730
III Fair Value of plan assets
Fair Value of Plan Assets at beginning of the year 9,903,730 5,729,401
Actual Return on Plan Asset 226,533 248,058
Contributions 1,686,563 4,296,021
Benefits Paid (271,398) (369,750)
Fair Value of Plan Assets at end of the year 11,545,428 9,903,730
Funded Status (7,388,337) (1,686,563)
Excess of actual over estimated return on Plan Assets (728,467) (444,242)
SCHEDULE FORMING PART OF THE ACCOUNTS FOR THE YEAR ENDED 31ST MARCH, 2011

60
IV Actuarial Gain/(Loss) Recognized
Actuarial Gain/(Loss) for the year (Obligation) 440,441 1,915,108
Actuarial Gain/(Loss) for the year (Plan Assets) (728,467) (444,242)
Total Gain/(Loss) for the year (288,026) 1,470,866
Actuarial Gain/(Loss) recognized for the year (288,026) 1,470,866
Unrecognized Actuarial Gain/(Loss) at end of the year - -
V Amounts recognized in the Balance Sheet
Present Value of Obligations at end of the year 18,933,765 11,590,293
Fair Value of Plan Assets at end of the year 11,545,428 9,903,730
Funded Status (7,388,337) (1,686,563)
Unrecognized Actuarial Gain/(Loss) - -
Net Asset/(Liability) recognized in the balance sheet
under “Provisions – Gratuity” (7,388,337) (1,686,563)
VI Expense recognized in Profit and Loss Account
Current Service Cost 4,862,653 3,160,891
Interest cost 859,095 688,838
Past Service Cost ( Non-Vested Benefits) 148,890 -
Past Service Cost ( Vested Benefits) 2,184,673 -
Expected Return on Plan Assets (955,000) (692,300)
Net Actuarial (Gain)/Loss recognized for the year 288,026 (1,470,866)
Expense recognized in Profit and Loss Account under
“Personnel Cost” 7,388,337 1,686,563
VII Movements in the Liability recognized in Balance Sheet
Opening Net Liability 1,686,563 4,296,021
Expenses as above 7,388,337 1,686,563
Contribution paid (1,686,563) (4,296,021)
Closing Net Liability 7,388,337 1,686,563
VIII Investment pattern
Insurer Managed Funds 100.00% 100.00%
IX Principal Assumptions
Mortality LIC(1994-96)Ult LIC(1994-96)Ult
Discount Rate 8.30% 7.50%
Rate of increase in compensation 5.00% 5.00%
Rate of return (expected) on plan assets 9.00% 9.00%
SCHEDULE FORMING PART OF THE ACCOUNTS FOR THE YEAR ENDED 31ST MARCH, 2011
Sr. No. Particulars2010-2011
(`)2009-2010
(`)

61
6. (a) Details of Managerial Remuneration pursuant to Section 198 of the Companies Act, 1956 (included under the head “Personnel Cost”) :
Particulars Year ended
31st March, 2011( `)
Year ended31st March, 2010
(`)
(A) Managing Directors
Salary 1,02,00,000 1,20,00,000
Company’s Contribution to Provident Fund 12,24,000 14,40,000
Leave Salary - 4,60,000
Medical Reimbursement 54,676 74,591
Club Subscription 62,221 1,36,823
Total (A) 1,15,40,897 1,41,11,414
(B) Directors other than Managing Directors
Sitting Fees 4,70,000 3,70,000
Commission 5,50,000 5,50,000
Total (B) 10,20,000 9,20,000
Total (A+B) 1,25,60,897 1,50,31,414
(b) Contribution to Group Gratuity Scheme and Premium paid for Group Personal Accident Policy, Group Mediclaim Insurance Policy and Group Term Life Insurance Policy has not been considered, as employee-wise details are not available.
(c) In view of inadequate profits during the year, remuneration of Managing Directors for part of the year i.e. from 1st October, 2010 to 31st March, 2011 is restricted to the amounts permissible under Schedule XIII to the Companies Act, 1956.
(d) Consequent to (c) above, excess managerial remuneration paid of ` 42,03,182/- is recoverable from Managing Directors and included in “Advances recoverable in cash or kind or for value to be received.”
(e) (i) Computation of Net Profit in accordance with Section 349 of the Companies Act, 1956 :
ParticularsYear ended
31st March, 2011 (`)
Year ended 31st March, 2010
(`)
Profit Before Taxation as per Profit and Loss Account 1,28,602,149 134,925,197
Add: Managerial Remuneration 12,560,897 25,095,173*
Loss on Sale of Fixed Assets / Assets Discarded 328,680 1,618,331
Provision for Doubtful Debts 20,906,579 39,305,369
Provision for Doubtful Advances / Deposits 12,34,541 195,896
Provision for Loss in Derivative Transactions 64,94,688 200,876
Depreciation as per Financial Statements 38,589,273 46,330,150
208,716,807 247,670,992
Less: Provision for loss in Derivative Transactions Written Back 200,876 -
SCHEDULE FORMING PART OF THE ACCOUNTS FOR THE YEAR ENDED 31ST MARCH, 2011

62
7. In the opinion of Board of Directors, the current assets, loans and advances have value on realisation in ordinary course of business at least equal to the amount at which they are stated except as otherwise stated.
8. (i) Details of Contingent Liabilities and Guarantees:-
Sr. No. Particulars
As at 31st March, 2011 (`)
As at 31st March, 2010 (`)
1. Guarantees issued by the Banks (Net of Margin money being fixed deposits with Banks)Add : Margin money being fixed deposit with BanksGuarantees issued by the Banks
528,750,000
558,750,0001,087,500,000
548,750,000
548,750,0001,097,500,000
2. Corporate guarantee issued in favour of a bank to secure credit facilities sanctioned by the bank to Emkay Commotrade Limited (a Subsidiary Company)
8,00,00,000 8,00,00,000
3. Income Tax matters in appeal 21,136,631 17,411,067
ParticularsYear ended
31st March, 2011 (`)
Year ended 31st March, 2010
(`)
Provision for Doubtful Debts Written Back 60,850,567 26,887,242
Provision for Doubtful Deposits Written Back 22,000 -
Profit on Sale of Current Investments 1,172,631 4,701,687
Profit on transfer of Portfolio Management Services Division 5,00,000 -
Depreciation under section 350 of the Companies Act, 1956 38,589,273 46,330,150
Net Profit for Section 198 of the Companies Act, 1956 107,381,460 169,751,913
* Includes ` 1,00,63,759/- for the year ended 31st March, 2009.
Remuneration to Managing Directors
- Maximum amount eligible @ 10% 10,738,146 16,975,191
- Amount Paid other than Contribution to Provident Fund 10,316,897 12,671,414
Commission to Directors other than Managing Directors
- Maximum amount eligible @ 1% 1,073,815 1,697,519
- Amount Provided 550,000 550,000
(ii) Capital Commitments
Estimated amounts of contracts remaining to be executed on capital account and not provided for (net of advance) ̀ 18,61,69,299/- (P.Y. ` 72,865/-)
9. (a) Fixed Deposits lodged with Exchanges towards Security Deposit/Base Minimum Capital/ Additional Base Capital
SCHEDULE FORMING PART OF THE ACCOUNTS FOR THE YEAR ENDED 31ST MARCH, 2011
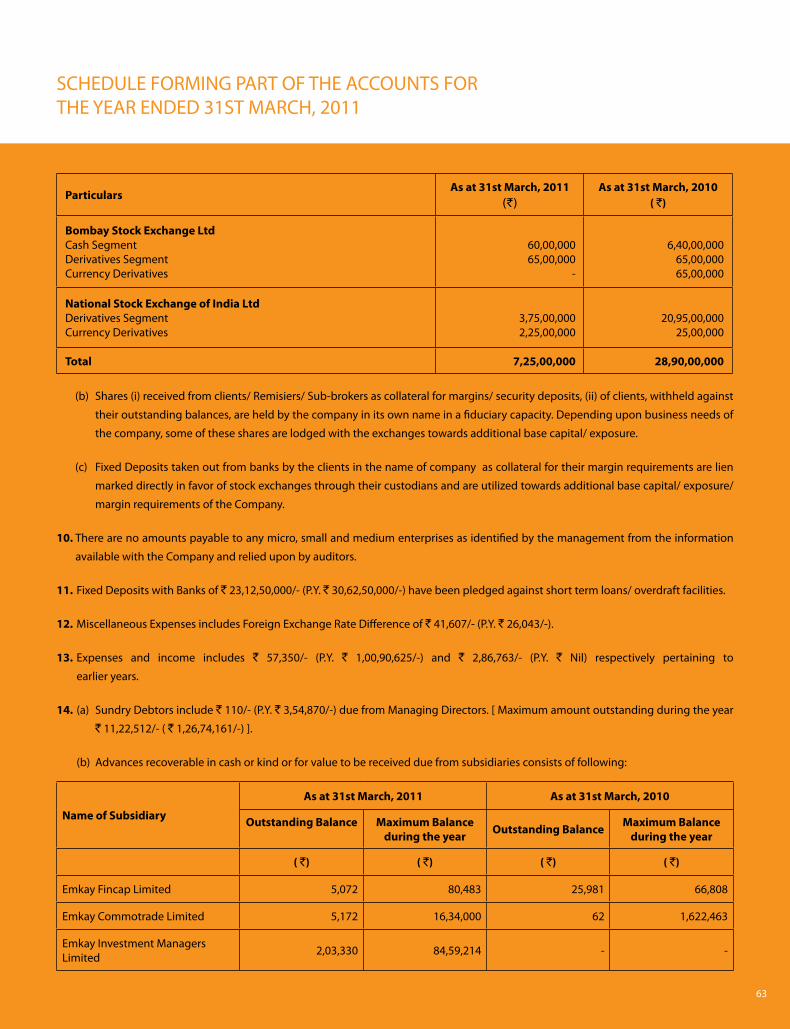
63
ParticularsAs at 31st March, 2011
(`)As at 31st March, 2010
( `)
Bombay Stock Exchange LtdCash Segment Derivatives Segment Currency Derivatives
60,00,00065,00,000
-
6,40,00,00065,00,00065,00,000
National Stock Exchange of India LtdDerivatives Segment Currency Derivatives
3,75,00,0002,25,00,000
20,95,00,00025,00,000
Total 7,25,00,000 28,90,00,000
Name of Subsidiary
As at 31st March, 2011 As at 31st March, 2010
Outstanding Balance Maximum Balance during the year Outstanding Balance Maximum Balance
during the year
( `) ( `) ( `) ( `)
Emkay Fincap Limited 5,072 80,483 25,981 66,808
Emkay Commotrade Limited 5,172 16,34,000 62 1,622,463
Emkay Investment Managers Limited 2,03,330 84,59,214 - -
SCHEDULE FORMING PART OF THE ACCOUNTS FOR THE YEAR ENDED 31ST MARCH, 2011
(b) Shares (i) received from clients/ Remisiers/ Sub-brokers as collateral for margins/ security deposits, (ii) of clients, withheld against
their outstanding balances, are held by the company in its own name in a fiduciary capacity. Depending upon business needs of
the company, some of these shares are lodged with the exchanges towards additional base capital/ exposure.
(c) Fixed Deposits taken out from banks by the clients in the name of company as collateral for their margin requirements are lien
marked directly in favor of stock exchanges through their custodians and are utilized towards additional base capital/ exposure/
margin requirements of the Company.
10. There are no amounts payable to any micro, small and medium enterprises as identified by the management from the information
available with the Company and relied upon by auditors.
11. Fixed Deposits with Banks of ` 23,12,50,000/- (P.Y. ` 30,62,50,000/-) have been pledged against short term loans/ overdraft facilities.
12. Miscellaneous Expenses includes Foreign Exchange Rate Difference of ` 41,607/- (P.Y. ` 26,043/-).
13. Expenses and income includes ` 57,350/- (P.Y. ` 1,00,90,625/-) and ` 2,86,763/- (P.Y. ` Nil) respectively pertaining to
earlier years.
14. (a) Sundry Debtors include ` 110/- (P.Y. ` 3,54,870/-) due from Managing Directors. [ Maximum amount outstanding during the year
` 11,22,512/- ( ` 1,26,74,161/-) ].
(b) Advances recoverable in cash or kind or for value to be received due from subsidiaries consists of following:
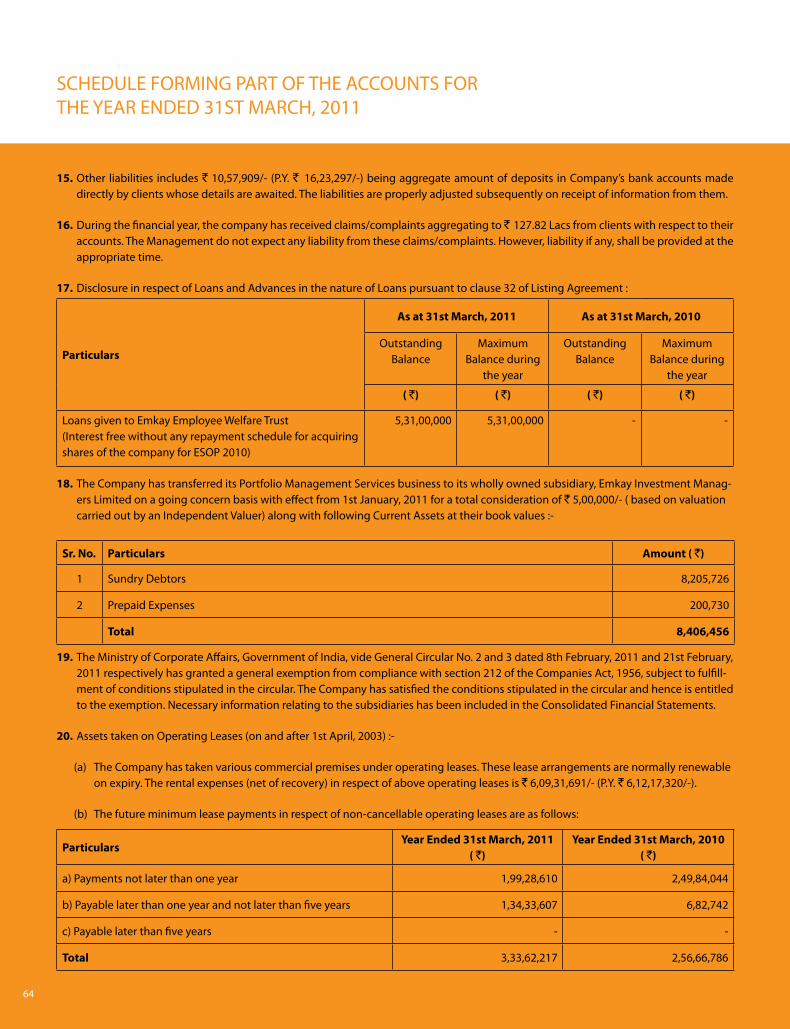
64
15. Other liabilities includes ` 10,57,909/- (P.Y. ` 16,23,297/-) being aggregate amount of deposits in Company’s bank accounts made directly by clients whose details are awaited. The liabilities are properly adjusted subsequently on receipt of information from them.
16. During the financial year, the company has received claims/complaints aggregating to ` 127.82 Lacs from clients with respect to their accounts. The Management do not expect any liability from these claims/complaints. However, liability if any, shall be provided at the appropriate time.
17. Disclosure in respect of Loans and Advances in the nature of Loans pursuant to clause 32 of Listing Agreement :
Particulars
As at 31st March, 2011 As at 31st March, 2010
Outstanding Balance
Maximum Balance during
the year
Outstanding Balance
Maximum Balance during
the year
( `) ( `) ( `) ( `)
Loans given to Emkay Employee Welfare Trust(Interest free without any repayment schedule for acquiring shares of the company for ESOP 2010)
5,31,00,000 5,31,00,000
-
-
18. The Company has transferred its Portfolio Management Services business to its wholly owned subsidiary, Emkay Investment Manag-ers Limited on a going concern basis with effect from 1st January, 2011 for a total consideration of ` 5,00,000/- ( based on valuation carried out by an Independent Valuer) along with following Current Assets at their book values :-
Sr. No. Particulars Amount ( `)
1 Sundry Debtors 8,205,726
2 Prepaid Expenses 200,730
Total 8,406,456
19. The Ministry of Corporate Affairs, Government of India, vide General Circular No. 2 and 3 dated 8th February, 2011 and 21st February, 2011 respectively has granted a general exemption from compliance with section 212 of the Companies Act, 1956, subject to fulfill-ment of conditions stipulated in the circular. The Company has satisfied the conditions stipulated in the circular and hence is entitled to the exemption. Necessary information relating to the subsidiaries has been included in the Consolidated Financial Statements.
20. Assets taken on Operating Leases (on and after 1st April, 2003) :-
(a) The Company has taken various commercial premises under operating leases. These lease arrangements are normally renewable on expiry. The rental expenses (net of recovery) in respect of above operating leases is ` 6,09,31,691/- (P.Y. ` 6,12,17,320/-).
(b) The future minimum lease payments in respect of non-cancellable operating leases are as follows:
ParticularsYear Ended 31st March, 2011
( `)Year Ended 31st March, 2010
( `)
a) Payments not later than one year 1,99,28,610 2,49,84,044
b) Payable later than one year and not later than five years 1,34,33,607 6,82,742
c) Payable later than five years - -
Total 3,33,62,217 2,56,66,786
SCHEDULE FORMING PART OF THE ACCOUNTS FOR THE YEAR ENDED 31ST MARCH, 2011

65
21. Earnings per share
Particulars For the year ended 31st March, 2011
(`)
For the year ended 31st March, 2010
(`)
Profit available for Equity Shareholders (`) 8,32,80,974 8,39,61,111
Weighted average number of Shares used in Computing Basic earning per share
24,408,990 24,296,247
Add : Potential number of Equity share that could arise on exercise of Employee Stock Options
2,95,559 2,41,393
Weighted average number of Shares used in Computing Diluted earning per share
24,704,549 24,537,640
Nominal Value of Equity Shares (`) 10 10
Basic Earnings Per Share (`) 3.41 3.46
Diluted Earnings Per Share (`) 3.37 3.42
22. Segment information
(a) Primary Segment:
The Company’s operations relate to one reportable business segment namely “Advisory and Transactional Services” comprising of Broking & Distribution of Securities, Investment Banking and other related Financial Intermediation Services.
(b) Secondary Segment: The company operates in India and hence there are no reportable Geographical Segments.
23. The break-up of Net Deferred Tax Assets are as under :
ParticularsAs at 31st March, 2011
( `)As at 31st March, 2010
( `)
Deferred Tax Assets
Difference between book and tax Depreciation
Provisions
Deferred Tax Liability
Net Deferred Tax Assets
1,53,17,200
2,75,75,000
4,28,92,200
-
-
4,28,92,200
1,37,01,000
3,90,06,500
5,27,07,500
-
-
5,27,07,500
SCHEDULE FORMING PART OF THE ACCOUNTS FOR THE YEAR ENDED 31ST MARCH, 2011
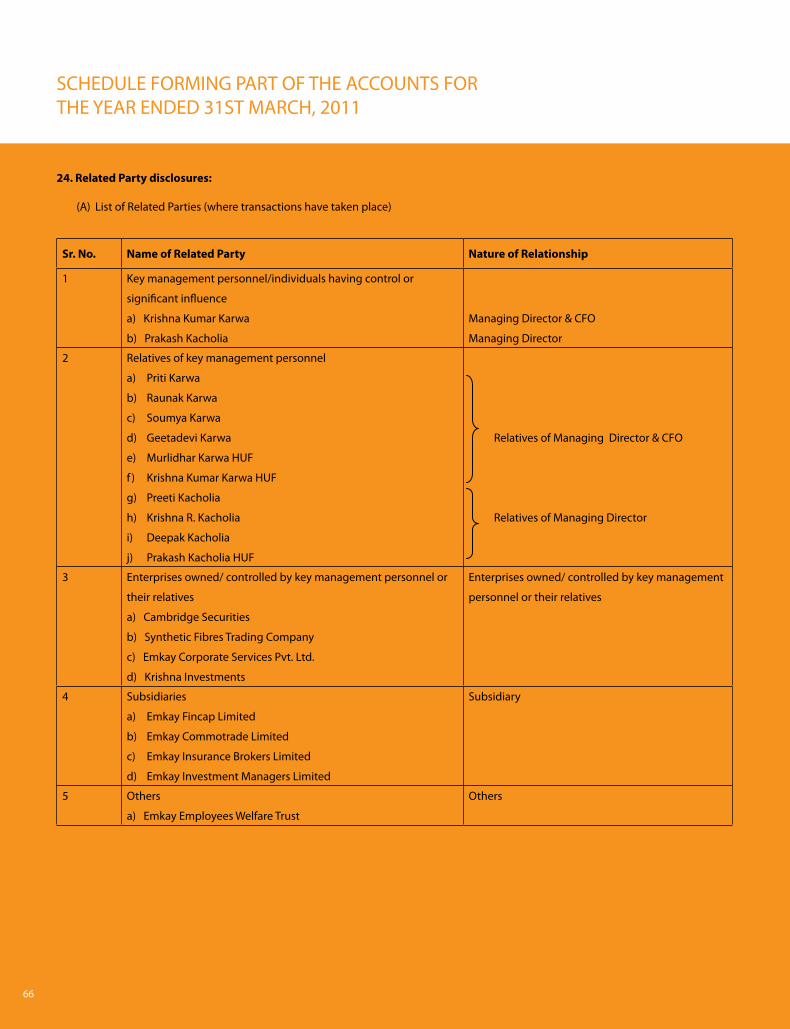
66
24. Related Party disclosures:
(A) List of Related Parties (where transactions have taken place)
Sr. No. Name of Related Party Nature of Relationship
1 Key management personnel/individuals having control or
significant influence
a) Krishna Kumar Karwa
b) Prakash Kacholia
Managing Director & CFO
Managing Director
2 Relatives of key management personnel
a) Priti Karwa
b) Raunak Karwa
c) Soumya Karwa
d) Geetadevi Karwa
e) Murlidhar Karwa HUF
f) Krishna Kumar Karwa HUF
g) Preeti Kacholia
h) Krishna R. Kacholia
i) Deepak Kacholia
j) Prakash Kacholia HUF
Relatives of Managing Director & CFO
Relatives of Managing Director
3 Enterprises owned/ controlled by key management personnel or
their relatives
a) Cambridge Securities
b) Synthetic Fibres Trading Company
c) Emkay Corporate Services Pvt. Ltd.
d) Krishna Investments
Enterprises owned/ controlled by key management
personnel or their relatives
4 Subsidiaries
a) Emkay Fincap Limited
b) Emkay Commotrade Limited
c) Emkay Insurance Brokers Limited
d) Emkay Investment Managers Limited
Subsidiary
5 Others
a) Emkay Employees Welfare Trust
Others
SCHEDULE FORMING PART OF THE ACCOUNTS FOR THE YEAR ENDED 31ST MARCH, 2011

67
SCHEDULE FORMING PART OF THE ACCOUNTS FOR THE YEAR ENDED 31ST MARCH, 2011
Sr.
No.
Part
icul
ars
Key
Man
agem
ent p
erso
n-ne
l/Ind
ivid
uals
hav
ing
cont
rol o
r si
gnifi
cant
influ
ence
Rela
tive
s of
key
m
anag
emen
t pe
rson
nel
Subs
idia
ry
Ente
rpri
ses
owne
d/
cont
rolle
d by
key
m
anag
emen
t per
sonn
el
or th
eir r
elat
ives
Oth
ers
2010
-201
120
09-2
010
2010
-201
120
09-2
010
2010
-201
120
09-2
010
2010
-201
120
09-2
010
2010
-201
120
09-2
010
(`)
(`)
(`)
(`)
(`)
(`)
(`)
(`)
(`)
(`)
1Ex
pend
itur
e
(a)
Sala
ries
& O
ther
Ben
efits
- Kr
ishn
a Ku
mar
Kar
wa
5,7
58,6
14
11,
928,
968
-
-
-
-
-
-
-
-
- Pr
akas
h Ka
chol
ia 5
,782
,283
1
1,99
8,70
6 -
-
-
-
-
-
-
-
Tota
l 1
1,54
0,89
7 2
3,92
7,67
4 -
-
-
-
-
-
-
-
(b)
Sub-
Brok
erag
e
- Kr
ishn
a In
vest
men
t -
-
-
-
-
-
6
39,3
30
499
,961
-
-
Tota
l -
-
-
-
-
-
6
39,3
30
499
,961
-
-
(c)
Busi
ness
Pro
mot
ion
Expe
nses
- Kr
ishn
a In
vest
men
t -
-
-
-
-
-
2
,085
-
-
-
Tota
l -
-
-
-
-
-
2
,085
-
-
-
(d)
Cont
ribu
tion
to E
mpl
oyee
W
elfa
re T
rust
- Em
kay
Empl
oyee
s
Wel
fare
Tru
st -
-
-
-
-
-
-
-
1
0,00
0 -
Tot
al -
-
-
-
-
-
-
-
1
0,00
0 -
2In
com
e
(a)
Brok
erag
e
- Kr
ishn
a Ku
mar
Kar
wa
310
,466
2
59,1
89
-
-
-
-
-
-
-
-
- Pr
akas
h Ka
chol
ia 9
1,97
5 3
0,01
7 -
-
-
-
-
-
-
-
- Pr
eeti
Kach
olia
-
-
416
,085
2
80,5
43
-
-
-
-
-
-
- Kr
ishn
a Ka
chol
ia -
-
5
1,86
5 1
87,4
65
-
-
-
-
-
-
- Pr
iti K
arw
a -
-
2
49,3
52
136
,590
-
-
-
-
-
-
- Ra
unak
Kar
wa
-
-
134
,261
1
28,9
86
-
-
-
-
-
-
- G
eeta
Dev
i Kar
wa
-
-
87,
676
53,
145
-
-
-
-
-
-
- M
urlid
har K
arw
a H
UF
-
-
36,
659
18,
421
-
-
-
-
-
-
- Kr
ishn
a Ku
mar
Kar
wa
HU
F -
-
8
1,50
5 4
8,06
4 -
-
-
-
-
-
- Ca
mbr
idge
Sec
uriti
es -
-
-
-
-
-
1
,244
9
02
-
-
- Sy
nthe
tic F
ibre
Tra
ding
Co.
-
-
-
-
-
-
3
06,7
78
199
,565
-
-
- Em
kay
Corp
orat
e Se
rvic
es P
vt L
td.
-
-
-
-
-
-
80,
946
58,
917
-
-
- Em
kay
Empl
oyee
s Wel
fare
Tru
st -
-
-
-
-
-
-
-
3
1,00
0 -
- Em
kay
Finc
ap L
td.
-
-
-
-
-
135
,066
-
-
-
-
Tota
l 4
02,4
41
289
,206
1
,057
,403
8
53,2
14
-
135
,066
3
88,9
68
259
,384
3
1,00
0 -
(B) T
rans
actio
ns w
ith re
late
d pa
rtie
s:

68
SCHEDULE FORMING PART OF THE ACCOUNTS FOR THE YEAR ENDED 31ST MARCH, 2011
Sr.
No.
Part
icul
ars
Key
Man
agem
ent p
erso
n-ne
l/Ind
ivid
uals
hav
ing
cont
rol o
r si
gnifi
cant
influ
ence
Rela
tive
s of
key
m
anag
emen
t pe
rson
nel
Subs
idia
ry
Ente
rpri
ses
owne
d/
cont
rolle
d by
key
m
anag
emen
t per
sonn
el
or th
eir r
elat
ives
Oth
ers
2010
-201
120
09-2
010
2010
-201
120
09-2
010
2010
-201
120
09-2
010
2010
-201
120
09-2
010
2010
-201
120
09-2
010
(`)
(`)
(`)
(`)
(`)
(`)
(`)
(`)
(`)
(`)
(b)
Dep
osit
ory
Char
ges
- Kr
ishn
a Ku
mar
Kar
wa
270
1
,130
-
-
-
-
-
-
-
-
- Pr
akas
h Ka
chol
ia 6
70
900
-
-
-
-
-
-
-
-
- Pr
eeti
Kach
olia
-
-
600
7
70
-
-
-
-
-
-
- Kr
ishn
a Ka
chol
ia -
-
6
58
600
-
-
-
-
-
-
- Pr
iti K
arw
a -
-
5
60
780
-
-
-
-
-
-
- G
eeta
Dev
i Kar
wa
-
-
600
6
80
-
-
-
-
-
-
- M
urlid
har K
arw
a H
UF
-
-
200
3
50
-
-
-
-
-
-
- Kr
ishn
a Ku
mar
Kar
wa
HU
F -
-
2
10
360
-
-
-
-
-
-
- Pr
akas
h Ka
chol
ia H
UF
-
-
-
200
-
-
-
-
-
-
- Em
kay
Finc
ap L
imite
d -
-
-
-
7
9,20
0 1
39,6
25
-
-
-
-
- Em
kay
Com
mot
rade
Lim
ited
-
-
-
-
6,1
31
606
-
-
-
-
- Em
kay
Inve
stm
ent M
anag
ers
Li
mite
d -
-
-
-
5
00
-
-
-
-
-
- Ca
mbr
idge
Sec
uriti
es -
-
-
-
-
-
8
04
430
-
-
- Sy
nthe
tic F
ibre
Tra
ding
Co.
-
-
-
-
-
-
350
2
70
-
-
- Em
kay
Corp
orat
e Se
rvic
es
Pvt L
td.
-
-
-
-
-
-
1,2
30
1,3
90
-
-
Tota
l 9
40
2,0
30
2,8
28
3,7
40
85,
831
140
,231
2
,384
2
,090
-
-
(c )
Port
folio
Man
agem
ent F
ees
- Kr
ishn
a Ku
mar
Kar
wa
-
810
,445
-
-
-
-
-
-
-
-
- Pr
akas
h Ka
chol
ia -
3
8,47
2 -
-
-
-
-
-
-
-
- Pr
iti K
arw
a -
-
-
2
62,3
80
-
-
-
-
-
-
- Ra
unak
Kar
wa
-
-
-
290
,060
-
-
-
-
-
-
- G
eeta
Dev
i Kar
wa
-
-
-
190
,664
-
-
-
-
-
-
- M
urlid
har K
arw
a H
UF
-
-
-
63,
798
-
-
-
-
-
-
- Kr
ishn
a Ku
mar
Kar
wa
HU
F -
-
-
1
89,6
58
-
-
-
-
-
-
Tota
l -
8
48,9
17
-
996
,560
-
-
-
-
-
-
(d)
Infr
astr
uctu
re M
aint
enan
ce C
harg
es
- Em
kay
Com
mot
rade
Lim
ited
-
-
-
-
4,0
00,0
00
3,6
00,0
00
-
-
-
-
Tota
l -
-
-
-
4,00
0,00
0 3
,600
,000
-
-
-
-

69
Sr.
No.
Part
icul
ars
Key
Man
agem
ent p
erso
n-ne
l/Ind
ivid
uals
hav
ing
cont
rol o
r si
gnifi
cant
influ
ence
Rela
tive
s of
key
m
anag
emen
t pe
rson
nel
Subs
idia
ry
Ente
rpri
ses
owne
d/
cont
rolle
d by
key
m
anag
emen
t per
sonn
el
or th
eir r
elat
ives
Oth
ers
2010
-201
120
09-2
010
2010
-201
120
09-2
010
2010
-201
120
09-2
010
2010
-201
120
09-2
010
2010
-201
120
09-2
010
(`)
(`)
(`)
(`)
(`)
(`)
(`)
(`)
(`)
(`)
(b)
Dep
osit
ory
Char
ges
- Kr
ishn
a Ku
mar
Kar
wa
270
1
,130
-
-
-
-
-
-
-
-
- Pr
akas
h Ka
chol
ia 6
70
900
-
-
-
-
-
-
-
-
- Pr
eeti
Kach
olia
-
-
600
7
70
-
-
-
-
-
-
- Kr
ishn
a Ka
chol
ia -
-
6
58
600
-
-
-
-
-
-
- Pr
iti K
arw
a -
-
5
60
780
-
-
-
-
-
-
- G
eeta
Dev
i Kar
wa
-
-
600
6
80
-
-
-
-
-
-
- M
urlid
har K
arw
a H
UF
-
-
200
3
50
-
-
-
-
-
-
- Kr
ishn
a Ku
mar
Kar
wa
HU
F -
-
2
10
360
-
-
-
-
-
-
- Pr
akas
h Ka
chol
ia H
UF
-
-
-
200
-
-
-
-
-
-
- Em
kay
Finc
ap L
imite
d -
-
-
-
7
9,20
0 1
39,6
25
-
-
-
-
- Em
kay
Com
mot
rade
Lim
ited
-
-
-
-
6,1
31
606
-
-
-
-
- Em
kay
Inve
stm
ent M
anag
ers
Li
mite
d -
-
-
-
5
00
-
-
-
-
-
- Ca
mbr
idge
Sec
uriti
es -
-
-
-
-
-
8
04
430
-
-
- Sy
nthe
tic F
ibre
Tra
ding
Co.
-
-
-
-
-
-
350
2
70
-
-
- Em
kay
Corp
orat
e Se
rvic
es
Pvt L
td.
-
-
-
-
-
-
1,2
30
1,3
90
-
-
Tota
l 9
40
2,0
30
2,8
28
3,7
40
85,
831
140
,231
2
,384
2
,090
-
-
(c )
Port
folio
Man
agem
ent F
ees
- Kr
ishn
a Ku
mar
Kar
wa
-
810
,445
-
-
-
-
-
-
-
-
- Pr
akas
h Ka
chol
ia -
3
8,47
2 -
-
-
-
-
-
-
-
- Pr
iti K
arw
a -
-
-
2
62,3
80
-
-
-
-
-
-
- Ra
unak
Kar
wa
-
-
-
290
,060
-
-
-
-
-
-
- G
eeta
Dev
i Kar
wa
-
-
-
190
,664
-
-
-
-
-
-
- M
urlid
har K
arw
a H
UF
-
-
-
63,
798
-
-
-
-
-
-
- Kr
ishn
a Ku
mar
Kar
wa
HU
F -
-
-
1
89,6
58
-
-
-
-
-
-
Tota
l -
8
48,9
17
-
996
,560
-
-
-
-
-
-
(d)
Infr
astr
uctu
re M
aint
enan
ce C
harg
es
- Em
kay
Com
mot
rade
Lim
ited
-
-
-
-
4,0
00,0
00
3,6
00,0
00
-
-
-
-
Tota
l -
-
-
-
4,00
0,00
0 3
,600
,000
-
-
-
-
SCHEDULE FORMING PART OF THE ACCOUNTS FOR THE YEAR ENDED 31ST MARCH, 2011
Sr.
No.
Part
icul
ars
Key
Man
agem
ent p
erso
n-ne
l/Ind
ivid
uals
hav
ing
cont
rol o
r si
gnifi
cant
influ
ence
Rela
tive
s of
key
m
anag
emen
t pe
rson
nel
Subs
idia
ry
Ente
rpri
ses
owne
d/
cont
rolle
d by
key
m
anag
emen
t per
sonn
el
or th
eir r
elat
ives
Oth
ers
2010
-201
120
09-2
010
2010
-201
120
09-2
010
2010
-201
120
09-2
010
2010
-201
120
09-2
010
2010
-201
120
09-2
010
(`)
(`)
(`)
(`)
(`)
(`)
(`)
(`)
(`)
(`)
(e)
Gai
n on
Tran
sfer
of P
MS
Busi
ness
- Em
kay
Inve
stm
ent M
anag
ers
Li
mite
d -
-
-
-
5
00,0
00
-
-
-
-
-
Tota
l -
-
-
-
5
00,0
00
-
-
-
-
-
3Ex
pens
es R
ecov
ered
- Em
kay
Finc
ap L
imite
d -
-
-
-
6
72,0
00
692
,196
-
-
-
-
- Em
kay
Com
mot
rade
Lim
ited
-
-
-
-
1,1
97,0
00
1,2
56,8
28
-
-
-
-
- Em
kay
Insu
ranc
e Br
oker
s
Lim
ited
-
-
-
-
-
11,
804
-
-
-
-
- Em
kay
Inve
stm
ent M
anag
ers
Li
mite
d -
-
-
-
5
66,9
53
-
-
-
-
-
- Ca
mbr
idge
Sec
uriti
es -
-
-
-
-
-
-
1
,635
-
-
- Kr
ishn
a In
vest
men
t -
-
-
-
-
-
1
9,30
0 1
6,80
0 -
-
Tota
l -
-
-
-
2
,435
,953
1
,960
,828
1
9,30
0 1
8,43
5 -
-
4Ex
pens
es R
eim
burs
ed
- Em
kay
Com
mot
rade
Lim
ited
-
-
-
-
-
3,6
92
-
-
-
-
- Em
kay
Insu
ranc
e Br
oker
s Li
mite
d -
-
-
-
4
,954
1
5,44
4 -
-
-
-
Tota
l -
-
-
-
4
,954
1
9,13
6 -
-
-
-
5In
vest
men
ts m
ade
- Em
kay
Insu
ranc
e Br
oker
s Li
mite
d -
-
-
-
2
0,00
0,00
0 1
5,00
0,00
0 -
-
-
-
- Em
kay
Inve
stm
ent
Man
ager
s Li
mite
d -
-
-
-
2
5,00
0,00
0 -
-
-
-
-
Tota
l -
-
-
-
45
,000
,000
1
5,00
0,00
0 -
-
-
-
6Sa
le o
f Ass
ets
- Em
kay
Insu
ranc
e Br
oker
s
Lim
ited
-
-
-
-
-
223
,025
-
-
-
-
- Em
kay
Inve
stm
ent
Man
ager
s Li
mite
d -
-
-
-
8
,406
,456
-
-
-
-
-
Tota
l -
-
-
-
8
,406
,456
2
23,0
25
-
-
-
-
7In
vest
men
ts re
deem
ed
- Em
kay
Finc
ap L
imite
d -
-
-
-
40,
000,
000
-
-
-
-
-
- Em
kay
Insu
ranc
e Br
oker
s
Lim
ited
-
-
-
-
10,
000,
000
-
-
-
-
-
Tota
l -
-
-
-
50
,000
,000
-
-
-
-
-

70
Sr.
No.
Part
icul
ars
Key
Man
agem
ent
pers
onne
l/Ind
ivid
uals
ha
ving
con
trol
or
sign
ifica
nt in
fluen
ce
Rela
tive
s of
key
m
anag
emen
t pe
rson
nel
Subs
idia
ry
Ente
rpri
ses
owne
d/
cont
rolle
d by
key
m
anag
emen
t per
sonn
el
or t
heir
rela
tive
s
Oth
ers
2010
-201
120
09-2
010
2010
-201
120
09-2
010
2010
-201
120
09-2
010
2010
-201
120
09-2
010
2010
-201
120
09-2
010
(`)
(`)
(`)
(`)
(`)
(`)
(`)
(`)
(`)
(`)
8Lo
ans
Giv
en
- Em
kay
Empl
oyee
s Wel
fare
Tru
st -
- -
- -
- -
- 5
3,10
0,00
0 -
Tota
l -
- -
- -
- -
- 5
3,10
0,00
0 -
9O
utst
andi
ngs
(a)
Sund
ry C
redi
tors
- Pr
akas
h Ka
chol
ia 4
98,5
07
275
,266
-
- -
- -
- -
-
- Pr
eeti
Kach
olia
- -
1,5
41,4
75
626
,615
-
- -
- -
-
- Kr
ishn
a Ka
chol
ia -
- 2
93,1
40
311
,287
-
- -
- -
-
- Ra
unak
Kar
wa
- -
428
,813
-
- -
- -
- -
- Sy
nthe
tic F
ibre
Tra
ding
Co.
- -
- -
- -
- 3
,607
,445
-
-
- Em
kay
Corp
orat
e Se
rvic
es P
vt. L
td.
- -
- -
- -
- 1
,363
,434
-
-
Tota
l 4
98,5
07
275
,266
2
,263
,429
9
37,9
02
- -
- 4
,970
,879
-
-
(b)
Sund
ry D
ebto
rs
- Kr
ishn
a Ku
mar
Kar
wa
- 3
46,0
20
- -
- -
- -
- -
- Pr
akas
h Ka
chol
ia 1
10
8,8
50
- -
- -
- -
- -
- D
eepa
k Ka
chol
ia
- -
9,2
58
9,2
58
- -
- -
- -
- Pr
iti K
arw
a -
- -
104
,188
-
- -
- -
-
- Ra
unak
Kar
wa
- -
- 1
24,0
91
- -
- -
- -
- G
eeta
Dev
i Kar
wa
- -
- 7
6,30
7 -
- -
- -
-
- M
urlid
har K
arw
a H
UF
- -
- 2
5,97
8 -
- -
- -
-
- Kr
ishn
a Ku
mar
Kar
wa
HU
F -
- -
76,
658
- -
- -
- -
- Pr
akas
h Ka
chol
ia H
UF
- -
- 2
20
- -
- -
- -
- Kr
ishn
a In
vest
men
ts
- -
- -
- -
1,1
32,4
93
1,3
26,2
05
- -
- Ca
mbr
idge
Sec
uriti
es -
- -
- -
- -
11
- -
Tota
l 1
10
354
,870
9
,258
4
16,7
00
- -
1,1
32,4
93
1,3
26,2
16
- -
(c )
Out
stan
ding
Exp
ense
s
- Kr
ishn
a Ku
mar
Kar
wa
- 4
59,5
80
- -
- -
- -
- -
- Pr
akas
h Ka
chol
ia -
459
,580
-
- -
- -
- -
-
Tota
l -
919
,160
-
- -
- -
- -
-
(d)
Loan
s
- Em
kay
Empl
oyee
s Wel
fare
Tru
st -
- -
- -
- -
- 5
3,10
0,00
0 -
Tota
l -
-
-
-
-
-
-
-
53
,100
,000
-
SCHEDULE FORMING PART OF THE ACCOUNTS FOR THE YEAR ENDED 31ST MARCH, 2011

71
SCHEDULE FORMING PART OF THE ACCOUNTS FOR THE YEAR ENDED 31ST MARCH, 2011
Sr.
No.
Part
icul
ars
Key
Man
agem
ent
pers
onne
l/Ind
ivid
uals
ha
ving
con
trol
or
sign
ifica
nt in
fluen
ce
Rela
tive
s of
key
m
anag
emen
t pe
rson
nel
Subs
idia
ry
Ente
rpri
ses
owne
d/
cont
rolle
d by
key
m
anag
emen
t per
sonn
el
or th
eir r
elat
ives
Oth
ers
2010
-201
120
09-2
010
2010
-201
120
09-2
010
2010
-201
120
09-2
010
2010
-201
120
09-2
010
2010
-201
120
09-2
010
(`)
(`)
(`)
(`)
(`)
(`)
(`)
(`)
(`)
(`)
(e)
Adv
ance
s
- Em
kay
Finc
ap L
imite
d -
-
-
-
5
,072
2
5,98
1 -
-
-
-
- Em
kay
Com
mot
rade
Ltd
. -
-
-
-
5
,172
6
2 -
-
-
-
-
Emka
y In
vest
men
t M
anag
ers
Lim
ited
-
-
-
-
203
,330
-
-
-
-
-
Tota
l -
-
-
-
2
13,5
74
26,
043
-
-
-
-
(f)
Adv
ance
s Re
ceiv
ed
- Em
kay
Insu
ranc
e Br
oker
s Li
mite
d -
-
-
-
-
1
5,44
4 -
-
-
-
Tota
l -
-
-
-
-
1
5,44
4 -
-
-
-
(g)
Secu
rity
/ M
argi
n D
epos
its
Rece
ived
- Kr
ishn
a In
vest
men
t -
-
-
-
-
-
2
00,0
00
200
,000
-
-
Tota
l -
-
-
-
-
-
2
00,0
00
200
,000
-
-
(h)
Man
ager
ial R
emun
erat
ion
Reco
vera
ble
-
Kris
hna
Kum
ar K
arw
a 2
,080
,163
-
-
-
-
-
-
-
-
-
-
Prak
ash
Kach
olia
2,1
23,0
19
-
-
-
-
-
-
-
-
-
Tota
l 4
,203
,182
-
-
-
-
-
-
-
-
-
(i)In
vest
men
ts -
Emka
y Fi
ncap
Lim
ited
- E
quity
Sha
res
-
-
-
-
22
0,00
0,00
0 2
20,0
00,0
00
-
-
-
-
- Em
kay
Finc
ap L
imite
d -
Pre
fere
nce
Shar
es
-
-
-
-
10,
000,
000
50,
000,
000
-
-
-
-
- Em
kay
Com
mot
rade
Lim
ited
-
Equi
ty S
hare
s -
-
-
-
6
0,00
0,00
0 6
0,00
0,00
0 -
-
-
-
- Em
kay
Insu
ranc
e Br
oker
s
Lim
ited
- Equ
ity S
hare
s -
-
-
-
4
0,00
0,00
0 2
0,00
0,00
0 -
-
-
-
- Em
kay
Insu
ranc
e Br
oker
s
Lim
ited
- Pre
fere
nce
Shar
es -
-
-
-
-
1
0,00
0,00
0 -
-
-
-
- Em
kay
Inve
stm
ent M
anag
ers
Li
mite
d - E
quity
Sha
res
-
-
-
-
25,
000,
000
-
-
-
-
-
Tota
l -
-
-
-
35
5,00
0,00
0 36
0,00
0,00
0 -
-
-
-
* Co
ntrib
utio
n to
Gro
up G
ratu
ity S
chem
e an
d Pr
emiu
m p
aid
for G
roup
Per
sona
l Acc
iden
t Pol
icy,
Gro
up M
edic
laim
Insu
ranc
e
Polic
y an
d G
roup
Term
Life
Insu
ranc
e Po
licy
has
not b
een
cons
ider
ed, a
s em
ploy
ee-w
ise
deta
ils a
re n
ot a
vaila
ble.
(C )
R
elat
ed P
artie
s ar
e id
entifi
ed b
y th
e m
anag
emen
t and
relie
d up
on b
y th
e Au
dito
rs.
(D)
N
o ba
lanc
es in
resp
ect o
f Rel
ated
Par
ties
have
bee
n w
ritte
n off
.
SCHEDULE FORMING PART OF THE ACCOUNTS FOR THE YEAR ENDED 31ST MARCH, 2011

72
Sr. No.
Particulars Type As At 31st March, 2011 As At 31st March, 2010
Nos. Amount (`) Nos. Amount (`)
1 Akruti City Ltd. Shares - - 12 6,228
2 GSS America Infotech Ltd. “ 405 55,485 405 119,657
3 Pan Electronics India Ltd. “ 100 610 100 600
4 Piramal Life Sciences Ltd. “ 1204 128,828 1204 156,941
5 PVP Ventures Ltd. “ 151 1,284 151 2,635
6 SREI Infrastructure Finance Ltd. “ - - 286 21,836
7 Television Eighteen India Ltd. “ 1004 77,860 1004 75,852
8 Jai Corp Ltd. “ 2000 324,000 2000 520,100
9 Unitech Ltd. “ 1000 40,450 1000 73,400
5864 628,517 6162 977,249
25. a) Closing Stock of Securities (Valued at lower of cost or market price) :-
b) Detailed information in respect of opening stock, purchases, sales and closing stock in respect of Securities traded in :-
ParticularsOpening Stock Purchases Sales Closing Stock
Nos. Amount (`) Nos. Amount (`) Nos. Amount (`) Nos. Amount (`)
Shares, Securities & Units
6,162 (27,715)
977,249 (1,471,103)
228* (118,910)
- (63,929,019)
526 (140,463)
29,360 (66,823,730)
5,864 (6,162)
628,517 (977,249)
* Bonus shares allotted.
Name of EquityIndex / Stock Futures
As at 31st March, 2011 As at 31st March, 2010
No. ofContracts
No. of Units No. ofContracts
No. of Units
Long Short Long Short
Nifty 994 - 49,700 241 - 12,050
DLF Ltd - - - 6 4,800 -
Bajaj Hindustan Ltd - - - 7 9,975 -
d) Detailed information in respect of Currency Futures contracts outstanding (Open Interest) : -
c) Detailed information in respect of Equity Index / Stock Futures contracts out standing (Open Interest) : -
Name of Currency Futures
As at 31st March, 2011 As at 31st March, 2010
No. ofContracts
No. of Units No. ofContracts
No. of Units
Long Short Long Short
Japanese Yen - Indian Rupee - - - 50 50,000 -
e) Detailed information in respect of Equity Index / Stock Options contracts outstanding (Open Interest) : -
SCHEDULE FORMING PART OF THE ACCOUNTS FOR THE YEAR ENDED 31ST MARCH, 2011

73
Name of EquityIndex / Stock Options
Premium carried forward as at 31st March, 2011
[net of provisions made] (`)
Premium carried forward as at 31st March, 2010
[net of provisions made] (`)
Nifty (5,835,569) (650,092)
Hindalco Industries Ltd - 14,776
Total (5,835,569) (635,316)
26. Additional information required pursuant to Part II of Schedule VI to the Companies Act, 1956 : -
ParticularsYear ended
31st March 2011 (`)
Year ended31st March 2010
(`)
(a) Expenditure in Foreign Currency
- Foreign Travelling 2,909,023 1,754,667
- Subscription 4,186,495 1,954,694
- Website Expenses - 7,414
- Business Promotion 3,015,397 -
(b) Earning in Foreign Currency
- Research Fees 2,923,784 232,356
- Miscellaneous Income 98,924 139,049
27. No Remittance in foreign currencies for dividends.
28. Other additional information required pursuant to Part II of Schedule VI to the Companies Act, 1956 are not applicable to the company.
29. Figures in brackets indicates previous years figures.
30. Figures have been rounded off to the nearest rupees.
31. Schedule ‘A’ to ‘T’ forms an integral part of the Financial Statements of the Company.
As per our report of even date By the order of the Board
For B.L. SARDA & ASSOCIATES G.P. GUPTA KRISHNA KUMAR KARWA PRAKASH KACHOLIA Chartered Accountants Chairman Managing Director & CFO Managing Director S.K.SABOO R.K.KRISHNAMURTHI G.C. VASUDEO Director Director Director(B. L. SARDA)Partner RAHUL SAHASRABUDDHE Membership No. 014568 Company Secretary Place : Mumbai Place : MumbaiDate : 20th May, 2011 Date : 20th May, 2011
SCHEDULE FORMING PART OF THE ACCOUNTS FOR THE YEAR ENDED 31ST MARCH, 2011

74
BALANCE SHEET ABSTRACT AND COMPANY’S GENERAL BUSINESS PROFILE
I Registration Details
Registration No. State Code
Balance Sheet Date
II Capital Raised during the year ( Amount in ` Thousands )
Public Issue Rights Issue
Bonus Issue Private Placement
III Position of Mobilisation and Deployment of Funds
(Amounts in ` Thousands)
Total Liabilities Total Assets
Sources of Funds
Paid up Capital Reserves and Surplus
Secured Loans Unsecured Loans
Deferred Tax Liability
Application of Funds
Net Fixed Assets Investments
Net Current Assets Misc. Expenditure
Accumulated Losses Deferred Tax Assets
IV. Performance of Company (Amount in ` Thousands)
Turnover/ Income Total Expenditure
Profit / Loss before tax Profit / Loss after tax
(Please tick appropriate box + for Profit - for Loss)
Basic Earning per share in ` Dividend rate %
Generic Names of Three Principal Products / Services of Company. (As per monetary items)
Item Code no. (ITC Code ) Product Description
Item Code no. (ITC Code ) NOT APPLICABLE Product Description
Item Code no. (ITC Code ) Product Description
8 4 8 9 9
3 1 0 3 2 0 1 1
N I L
N I L
2 8 5 1 6 0
7 2 1 5 9 0
N I L
1 1 8 2 6 4 4
1 2 8 6 0 2
1 1
N I L
1 0 6 5
1 4 0 4 6 4 7
1 1 3 4 7 9 8
1 1 4 2 2
3 5 5 0 0 5
N I L
4 2 8 9 2
1 0 5 4 0 4 2
8 3 2 8 1
3 . 4 1 1 0
1 4 0 4 6 4 7
2 4 4 2 7 3
1 4 1 5 4
N I L
By the order of the Board G.P. GUPTA KRISHNA KUMAR KARWA PRAKASH KACHOLIA Chairman Managing Director & CFO Managing Director S.K.SABOO R.K.KRISHNAMURTHI G.C. VASUDEO Director Director Director
RAHUL SAHASRABUDDHE Company Secretary Place : MumbaiDate : 20th May, 2011

75
STATEMENT PURSUANT TO SECTION 212 (1)(e) OF THE COMPANIES ACT, 1956, RELATING TO SUBSIDIARY COMPANIES
Name of the Subsidiary Company
Emkay Fincap
Limited
Emkay Commotrade
Limited
Emkay Insurance
Brokers Limited
Emkay InvestmentManagers
Limited
1. Financial Year of the Subsidiary ended on 31.03.2011 31.03.2011 31.03.2011 31.03.2011
2. Holding Company’s Interest
a) Equity Share of ` 10 each
Number of Shares fully paid 22,000,000 60,00,000 4,000,000 2,500,000
% Share held by Emkay Global Financial Services Limited 100% 100% 100% 100%
- - - -
19,329,713 16,030,818 (4,414,425) 4,535,466
- - - -
81,130,838 45,605,065 (23,465,205) 4,535,466
- - - -
For and on behalf of the Board of Directors
KRISHNA KUMAR KARWA PRAKASH KACHOLIA RAHUL SAHASRABUDDHE
Managing Director & CFO Managing Director Company Secretary
Place : Mumbai
Date : 20th May, 2011
3. The net aggregate of profits/(losses) of the Subsidiary Company for its financial period so far as they concern the member of Emkay Global Financial Services Limited
(a) Dealt with in the accounts of Emkay Global Financial Services Limited for the year ended 31st March, 2011 (`)
(b) Not dealt with in the accounts of Emkay Global Financial Services Limited for the year ended 31st March, 2011 (`)
4. The net aggregate of profits/(losses) of the Subsidiary Com- pany for its previous financial period so far as they concern the member of Emkay Global Financial Services Limited
(a) Dealt with in the accounts of Emkay Global Financial Services Limited for the year ended 31st March, 2011(`)
(b) Not dealt with in the accounts of Emkay Global Financial Services Limited for the year ended 31st March, 2011 (`)
5. As the Financial Year of the Subsidiary Companies coincide with the Financial Year of the Holding Company, Section 212(5) of the Companies Act,1956, is not applicable
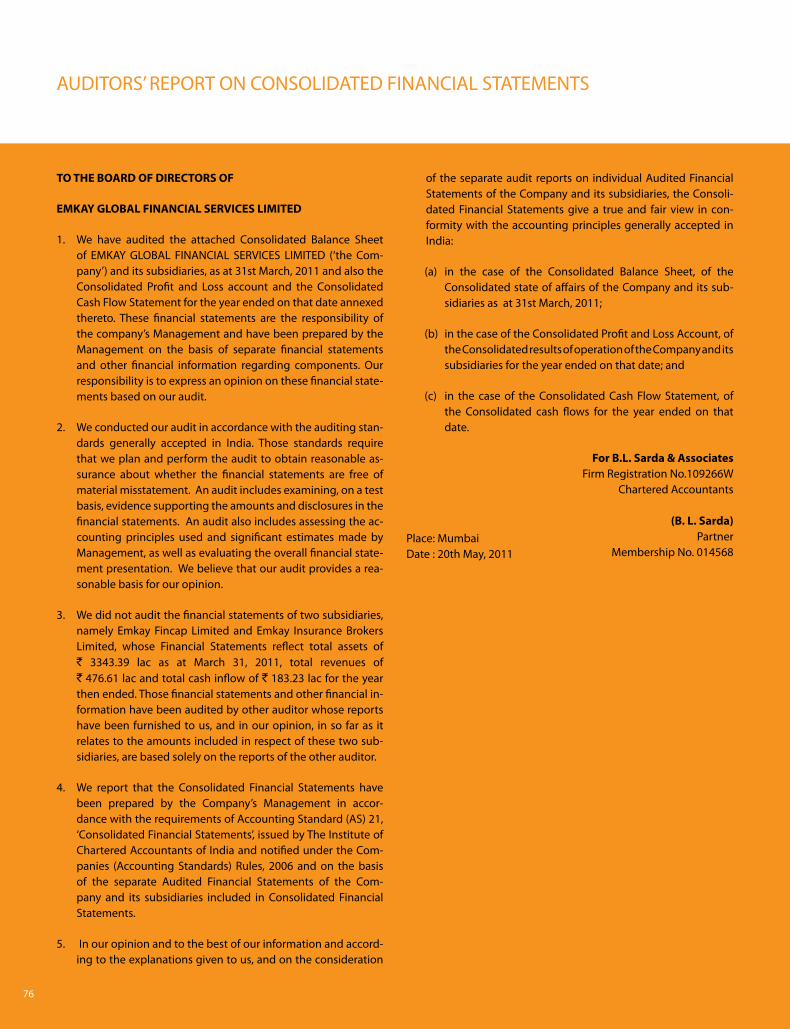
76
TO THE BOARD OF DIRECTORS OF
EMKAY GLOBAL FINANCIAL SERVICES LIMITED
1. We have audited the attached Consolidated Balance Sheet of EMKAY GLOBAL FINANCIAL SERVICES LIMITED (‘the Com-pany’) and its subsidiaries, as at 31st March, 2011 and also the Consolidated Profit and Loss account and the Consolidated Cash Flow Statement for the year ended on that date annexed thereto. These financial statements are the responsibility of the company’s Management and have been prepared by the Management on the basis of separate financial statements and other financial information regarding components. Our responsibility is to express an opinion on these financial state-ments based on our audit.
2. We conducted our audit in accordance with the auditing stan-dards generally accepted in India. Those standards require that we plan and perform the audit to obtain reasonable as-surance about whether the financial statements are free of material misstatement. An audit includes examining, on a test basis, evidence supporting the amounts and disclosures in the financial statements. An audit also includes assessing the ac-counting principles used and significant estimates made by Management, as well as evaluating the overall financial state-ment presentation. We believe that our audit provides a rea-sonable basis for our opinion.
3. We did not audit the financial statements of two subsidiaries, namely Emkay Fincap Limited and Emkay Insurance Brokers Limited, whose Financial Statements reflect total assets of ` 3343.39 lac as at March 31, 2011, total revenues of ` 476.61 lac and total cash inflow of ` 183.23 lac for the year then ended. Those financial statements and other financial in-formation have been audited by other auditor whose reports have been furnished to us, and in our opinion, in so far as it relates to the amounts included in respect of these two sub-sidiaries, are based solely on the reports of the other auditor.
4. We report that the Consolidated Financial Statements have been prepared by the Company’s Management in accor-dance with the requirements of Accounting Standard (AS) 21, ‘Consolidated Financial Statements’, issued by The Institute of Chartered Accountants of India and notified under the Com-panies (Accounting Standards) Rules, 2006 and on the basis of the separate Audited Financial Statements of the Com-pany and its subsidiaries included in Consolidated Financial Statements.
5. In our opinion and to the best of our information and accord-ing to the explanations given to us, and on the consideration
AUDITORS’ REPORT ON CONSOLIDATED FINANCIAL STATEMENTS
of the separate audit reports on individual Audited Financial Statements of the Company and its subsidiaries, the Consoli-dated Financial Statements give a true and fair view in con-formity with the accounting principles generally accepted in India:
(a) in the case of the Consolidated Balance Sheet, of the Consolidated state of affairs of the Company and its sub-sidiaries as at 31st March, 2011;
(b) in the case of the Consolidated Profit and Loss Account, of the Consolidated results of operation of the Company and its subsidiaries for the year ended on that date; and
(c) in the case of the Consolidated Cash Flow Statement, of the Consolidated cash flows for the year ended on that date.
For B.L. Sarda & AssociatesFirm Registration No.109266W
Chartered Accountants
(B. L. Sarda)Partner
Membership No. 014568Place: MumbaiDate : 20th May, 2011

77
THIS PAGE IS KEPT BLANKINTENTIONALLY
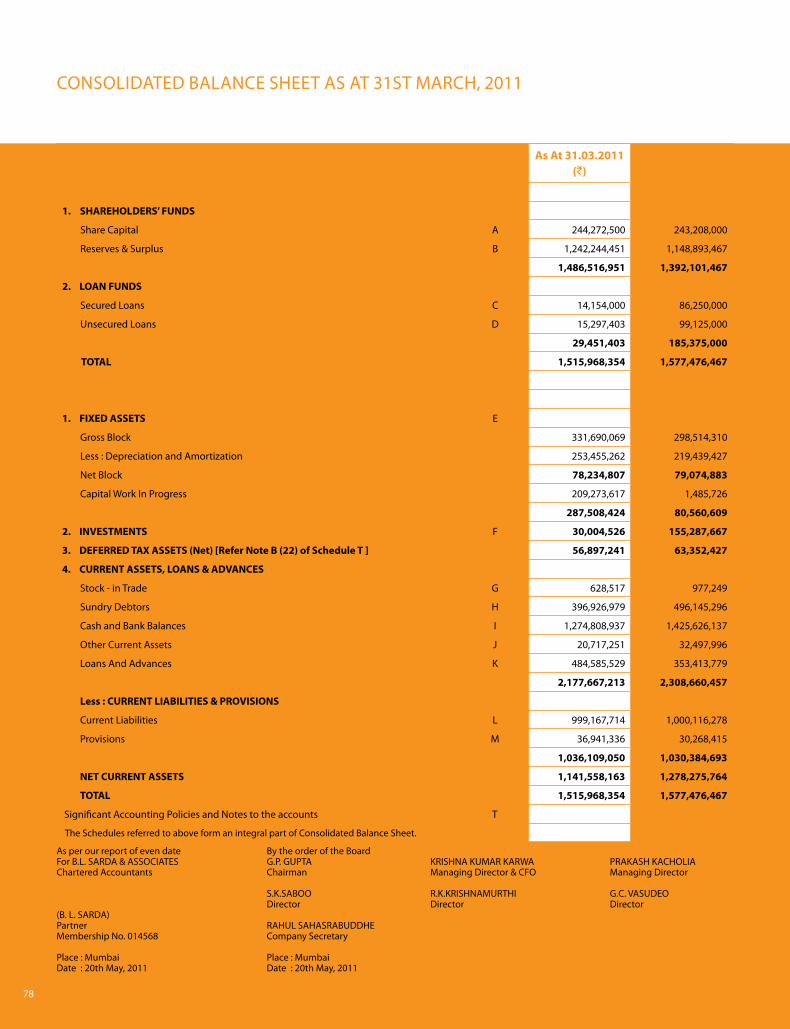
78
Particulars Schedule As At 31.03.2011
(`)As At 31.03.2010
(`)
SOURCES OF FUNDS
1. SHAREHOLDERS’ FUNDS
Share Capital A 244,272,500 243,208,000
Reserves & Surplus B 1,242,244,451 1,148,893,467
1,486,516,951 1,392,101,467
2. LOAN FUNDS
Secured Loans C 14,154,000 86,250,000
Unsecured Loans D 15,297,403 99,125,000
29,451,403 185,375,000
TOTAL 1,515,968,354 1,577,476,467
APPLICATION OF FUNDS
1. FIXED ASSETS E
Gross Block 331,690,069 298,514,310
Less : Depreciation and Amortization 253,455,262 219,439,427
Net Block 78,234,807 79,074,883
Capital Work In Progress 209,273,617 1,485,726
287,508,424 80,560,609
2. INVESTMENTS F 30,004,526 155,287,667
3. DEFERRED TAX ASSETS (Net) [Refer Note B (22) of Schedule T ] 56,897,241 63,352,427
4. CURRENT ASSETS, LOANS & ADVANCES
Stock - in Trade G 628,517 977,249
Sundry Debtors H 396,926,979 496,145,296
Cash and Bank Balances I 1,274,808,937 1,425,626,137
Other Current Assets J 20,717,251 32,497,996
Loans And Advances K 484,585,529 353,413,779
2,177,667,213 2,308,660,457
Less : CURRENT LIABILITIES & PROVISIONS
Current Liabilities L 999,167,714 1,000,116,278
Provisions M 36,941,336 30,268,415
1,036,109,050 1,030,384,693
NET CURRENT ASSETS 1,141,558,163 1,278,275,764
TOTAL 1,515,968,354 1,577,476,467
Significant Accounting Policies and Notes to the accounts T
The Schedules referred to above form an integral part of Consolidated Balance Sheet.
CONSOLIDATED BALANCE SHEET AS AT 31ST MARCH, 2011
As per our report of even date By the order of the Board For B.L. SARDA & ASSOCIATES G.P. GUPTA KRISHNA KUMAR KARWA PRAKASH KACHOLIA Chartered Accountants Chairman Managing Director & CFO Managing Director S.K.SABOO R.K.KRISHNAMURTHI G.C. VASUDEO Director Director Director(B. L. SARDA)Partner RAHUL SAHASRABUDDHE Membership No. 014568 Company Secretary Place : Mumbai Place : MumbaiDate : 20th May, 2011 Date : 20th May, 2011

79
Particulars Schedule For The Year
Ended 31.03.2011(`)
For The Year Ended 31.03.2010
(`)IncomeIncome from Operations N 1,170,669,756 1,139,853,288 Other Income O 159,246,688 129,806,519
1,329,916,444 1,269,659,807 ExpenditurePersonnel Cost P 486,142,166 384,405,774 Operating Expenses Q 373,653,400 444,199,553 Administrative Expenses R 228,613,058 222,174,528 Interest expended for Financing Activities 3,465,205 6,322,192 Interest - Others S 15,635,491 15,199,528 Depreciation and Amortization E 39,411,892 47,287,313 Preliminary Expenses 464,502 -
1,147,385,714 1,119,588,888 Profit Before Taxation 182,530,730 150,070,919 Provision for Taxation Income Tax - Current tax 56,700,000 71,985,000 - Deferred tax charge/(benefit) 6,455,186 (16,315,297) - Short Provision for Fringe Benefit Tax of Earlier Years 178,639 23,814 - Short Provision for Taxation of Earlier Years 703,092 380,764 Wealth Tax - Current Year 44,100 - - Earlier Year 20,500 - Profit After Taxation 118,429,213 93,996,638 Add: Balance Brought Forward 277,952,989 223,671,141 Amount Available for Appropriations 396,382,202 317,667,779 AppropriationsDividend - Proposed 24,427,250 24,320,800 - Paid for Earlier Year 99,150 - Dividend Distribution Tax - On Proposed Dividend 3,962,711 4,039,381 - On Dividend Paid for Earlier Year 16,468 - Transfer to Capital Redemption Reserve [ Refer Note B (3)(b) of Schedule T ] 40,000,000 - Transfer to General Reserve 9,600,000 8,950,000 Transfer to Special Reserve [ Refer Note B (14) of Schedule T ] 3,865,943 2,404,609 Balance Carried Forward 314,410,680 277,952,989
396,382,202 317,667,779 Basic Earnings Per Share ` (Face Value of ` 10 each) 4.85 3.87 Diluted Earnings Per Share ` ( Face Value of ` 10 each) 4.79 3.83 [ Refer Note B (20) of Schedule T ] Significant Accounting Policies and Notes to the accountsThe Schedules referred to above form an integral part of Consolidated Profit & Loss Account.
CONSOLIDATED PROFIT AND LOSS ACCOUNT FOR THE YEAR ENDED 31ST MARCH, 2011
As per our report of even date By the order of the Board For B.L. SARDA & ASSOCIATES G.P. GUPTA KRISHNA KUMAR KARWA PRAKASH KACHOLIA Chartered Accountants Chairman Managing Director & CFO Managing Director S.K.SABOO R.K.KRISHNAMURTHI G.C. VASUDEO Director Director Director(B. L. SARDA)Partner RAHUL SAHASRABUDDHE Membership No. 014568 Company Secretary Place : Mumbai Place : MumbaiDate : 20th May, 2011 Date : 20th May, 2011

80
CONSOLIDATED CASH FLOW STATEMENT FOR THE YEAR ENDED 31ST MARCH, 2011
Particulars
Year Ended 31.03.2011 Year Ended 31.03.2010
Amount (`)
Amount (`)
Amount (`)
Amount (`)
A. CASH FLOW FROM OPERATING ACTIVITIES
Net Profit before tax, extraordinary items 182,530,730 150,070,919
Adjustment for :
Interest Paid 19,100,696 21,521,720
Depreciation and Amortization 39,411,892 47,287,313
(Profit)/Loss on sale of Current investments (9,150,863) (14,611,480)
Public / Share Issue Expenses 53,410 235,250
Preliminary Expenses 464,502 -
Loss on Sale of Fixed Assets/Assets Discarded
(Net of Profit on Sale) 354,908 1,618,331
Interest Received (2,184,020) (3,057,441)
Dividend Received (271,598) (258,781)
Unrealised Foreign Exchange (gain)/loss (567) 1,395
Provision for Loss Assets (net of write back) 578,855 5,875,759
Provision for Sub-standard Assets ( net of write back ) 213,864 898,530
Provision for Standard Assets 637,295 -
Provision for Doubtful Debts/Deposits/Advances (35,050,005) 11,860,108
( net of write back )
Provision for loss on equity index/stock
futures/ equity index/stock options and
Currency Futures 6,293,812 20,452,181 200,876 71,571,580
Operating profit before working capital changes 202,982,911 221,642,499
Adjustment for :
Trade and other receivables 55,028,778 (133,469,991)
Fixed Deposits with Banks and Other items
not considered as cash equivalents
(Refer Note 3 below) 213,723,074 (41,206,574)
Inventories 348,732 493,854
Trade payables 5,011,017 274,111,601 215,395,433 41,212,722
Cash Generated from operations 477,094,512 262,855,221
Direct taxes (Paid)/Refund (51,773,544) (80,311,701)
Cash flow before extraordinary items 425,320,968 182,543,520
Extraordinary items - -
Net Cash from/ (used in) Operating Activities 425,320,968 182,543,520
B. CASH FLOW FROM INVESTING ACTIVITIES
Purchase of fixed assets (248,323,619) (22,253,371)
Sale of fixed assets 1,609,003 541,160
Acquisition of Investments (3,558,165,279) (6,663,389,574)
Disposal of Investments 3,692,599,283 6,615,271,099
Interest received 2,184,020 3,057,441
Loan given to Emkay Employees Welfare Trust (53,100,000) -
Dividend received 271,598 (162,924,994) 258,781 (66,514,464)
Net Cash from/ (used in) Investing Activities (162,924,994) (66,514,464)

81
2. Cash flow statement has been prepared under the Indirect Method as set out in the Accounting Standard (AS-3) “Cash Flow Statement” issued by the Institute of Chartered Accountants of India.
3. Cash and cash equivalent excludes fixed deposits with banks which have been pledged with exchanges/ banks, balance in Unclaimed Dividend and IPO Refund Account, Gift/ Meal Coupons and Stamps in hand.
4. Previous year’s figures are re-grouped/ re-arranged wherever considered necessary.
CONSOLIDATED CASH FLOW STATEMENT FOR THE YEAR ENDED 31ST MARCH, 2011
C. CASH FLOW FROM FINANCING ACTIVITIES
Proceeds from issue of share capital 1,064,500 425,500
Securities Premium received 3,427,350 545,900
Public/ Share Issue Expenses (53,410) (235,250)
Proceeds/(Repayment) of Secured Loan (72,096,000) (33,416,801)
Proceeds/(Repayment) of unsecured loans (83,827,597) 11,788,938
Preliminary Expenses (464,502) -
Interest paid (19,100,696) (21,521,720)
Dividend paid (including dividend tax) (28,440,312) (199,490,667) - (42,413,433)
Net cash from/ (used in) financing activities (199,490,667) (42,413,433)
Net increase in cash and cash equivalents (A+B+C) 62,905,307 73,615,623
Cash and cash equivalents at the beginning of the year 197,270,392 123,654,769
Cash and cash equivalents at the close of the year 260,175,699 197,270,392
Note :
1. Cash and cash equivalents comprise of :
Cash & Cheques on hand 692,958 4,703,649
Balances with Scheduled Banks
- In Current Accounts 215,566,033 182,981,125
- In Fixed Deposit Accounts 43,900,000 9,500,000
Foreign Currency on Hand 15,902 84,245
Add / (Less) : Unrealised Exchange Loss / (Gain) 806 1,373
260,175,699 197,270,392
Particulars
Year Ended 31.03.2011 Year Ended 31.03.2010
Amount
(`)
Amount
(`)
Amount
(`)
Amount
(`)
As per our report of even date By the order of the Board
For B.L. SARDA & ASSOCIATES G.P. GUPTA KRISHNA KUMAR KARWA PRAKASH KACHOLIA Chartered Accountants Chairman Managing Director & CFO Managing Director S.K.SABOO R.K.KRISHNAMURTHI G.C. VASUDEO Director Director Director(B. L. SARDA)Partner RAHUL SAHASRABUDDHE Membership No. 014568 Company Secretary Place : Mumbai Place : MumbaiDate : 20th May, 2011 Date : 20th May, 2011

82
SCHEDULES FORMING PART OF THE CONSOLIDATED BALANCE SHEET AS AT 31ST MARCH, 2011
Particulars As At 31.03.2011 (`)
As At 31.03.2010 (`)
Schedule AShare CapitalAuthorised400,00,000 Equity Share of ` 10/- each 400,000,000 400,000,000 Total 400,000,000 400,000,000 Issued, Subscribed & Paid Up Capital244,27,250 (P.Y.243,20,800) Equity Shares of ` 10/- each fully paid up 244,272,500 243,208,000 (Out of the above Equity Shares 1,40,00,000 Equity Shares are allotted as fully paid-up bonus shares by capitalisation of General Reserves)Total 244,272,500 243,208,000
Schedule BReserves and SurplusSecurities Premium AccountOpening Balance 687,713,734 687,167,834 Add: Received during the year 3,427,350 545,900
691,141,084 687,713,734 Special ReserveOpening Balance 12,362,893 9,958,284 Add : Transferred from Profit and Loss Account 3,865,943 2,404,609
16,228,836 12,362,893 Capital Redemption ReserveOpening Balance - - Add: Transferred from Profit & Loss Account [ Refer Note B (3)(b) of Schedule T ] 40,000,000 -
40,000,000 - General ReserveOpening Balance 170,761,128 161,811,128 Add: Transferred from Profit & Loss Account 9,600,000 8,950,000
180,361,128 170,761,128 Capital Reserve on ConsolidationOpening Balance 102,723 102,723
102,723 102,723 Profit & Loss Account 314,410,680 277,952,989 Total 1,242,244,451 1,148,893,467
Schedule CSecured LoansFrom Bank - Short Term Loan 11,250,000 86,250,000 (Secured by Pledge of Fixed Deposit with Bank)From Other - Vehicle Loan 2,904,000 -(Secured by hypothecation of Motor Car)Total 14,154,000 86,250,000
Schedule DUnsecured LoansShort Term Loans - From a Bank 11,250,000 86,250,000 - From a Body Corporate 3,875,000 12,875,000 - Interest accrued and due 172,403 - Total 15,297,403 99,125,000
82
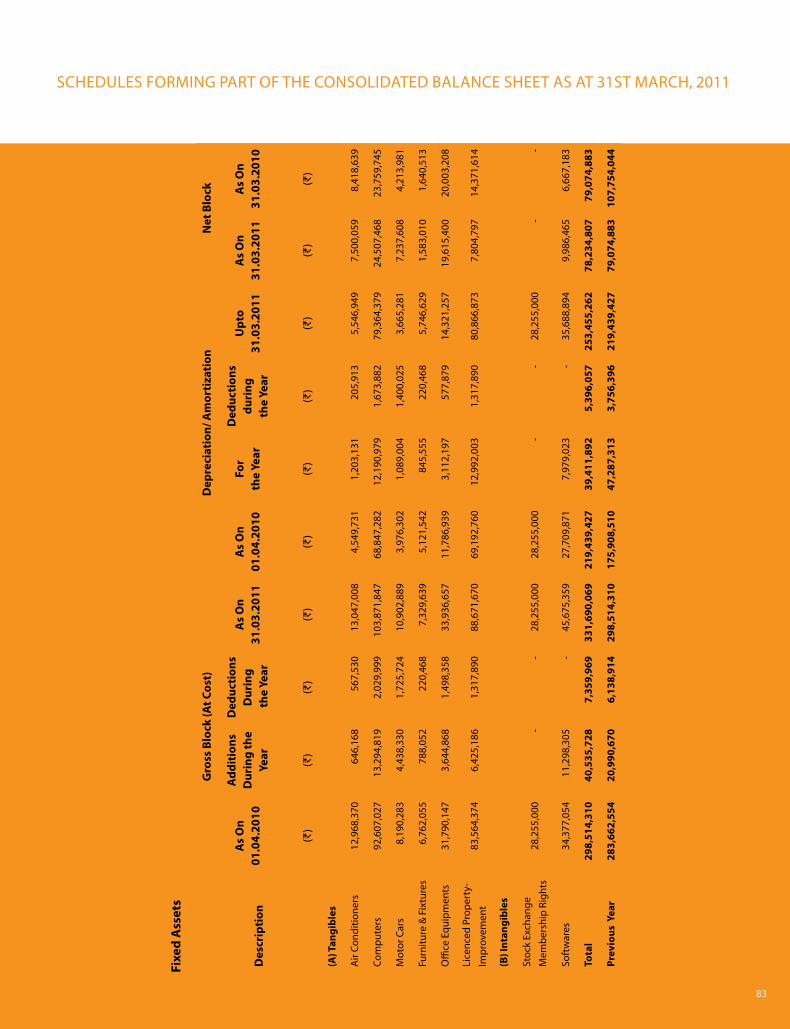
83
Des
crip
tion
Gro
ss B
lock
(At C
ost)
Dep
reci
atio
n/ A
mor
tiza
tion
N
et B
lock
As
On
01.0
4.20
10
Add
itio
ns
Dur
ing
the
Year
Ded
ucti
ons
Dur
ing
the
Year
As
On
31.0
3.20
11
As
On
01.0
4.20
10
For
the
Year
Ded
ucti
ons
duri
ng
the
Year
Upt
o
31.0
3.20
11
As
On
31.0
3.20
11
As
On
31.0
3.20
10
(`)
(`)
(`)
(`)
(`)
(`)
(`)
(`)
(`)
(`)
(A) T
angi
bles
Air
Cond
ition
ers
12,9
68,3
70 6
46,1
68
567
,530
13
,047
,008
4,54
9,73
11,
203,
131
205
,913
5,
546,
949
7,50
0,05
98,
418,
639
Com
pute
rs92
,607
,027
13,
294,
819
2,0
29,9
99
103,
871,
847
68,8
47,2
8212
,190
,979
1,6
73,8
82
79,3
64,3
7924
,507
,468
23,7
59,7
45
Mot
or C
ars
8,19
0,28
34,
438,
330
1,7
25,7
24
10,9
02,8
893,
976,
302
1,08
9,00
4 1
,400
,025
3,
665,
281
7,23
7,60
84,
213,
981
Furn
iture
& F
ixtu
res
6,76
2,05
578
8,05
222
0,46
87,
329,
639
5,12
1,54
284
5,55
5 2
20,4
68
5,74
6,62
91,
583,
010
1,64
0,51
3
Offi
ce E
quip
men
ts31
,790
,147
3,64
4,86
81,
498,
358
33,9
36,6
5711
,786
,939
3,11
2,19
757
7,87
914
,321
,257
19,6
15,4
0020
,003
,208
Lice
nced
Pro
pert
y-Im
prov
emen
t83
,564
,374
6,42
5,18
61,
317,
890
88,6
71,6
7069
,192
,760
12,9
92,0
03 1
,317
,890
80
,866
,873
7,80
4,79
714
,371
,614
(B) I
ntan
gibl
es
Stoc
k Ex
chan
ge
Mem
bers
hip
Righ
ts28
,255
,000
- -
28,2
55,0
0028
,255
,000
- -
28,2
55,0
00 -
-
Soft
war
es34
,377
,054
11,2
98,3
05 -
45,6
75,3
5927
,709
,871
7,97
9,02
3 -
35,6
88,8
949,
986,
465
6,66
7,18
3
Tota
l 29
8,51
4,31
0 4
0,53
5,72
8 7
,359
,969
33
1,69
0,06
9 2
19,4
39,4
27
39,
411,
892
5,3
96,0
57
253,
455,
262
78,2
34,8
0779
,074
,883
Prev
ious
Yea
r28
3,66
2,55
420
,990
,670
6,13
8,91
429
8,51
4,31
017
5,90
8,51
047
,287
,313
3,75
6,39
621
9,43
9,42
779
,074
,883
107,
754,
044
Sche
dule
E
SCHEDULES FORMING PART OF THE CONSOLIDATED BALANCE SHEET AS AT 31ST MARCH, 2011
Fixe
d A
sset
s
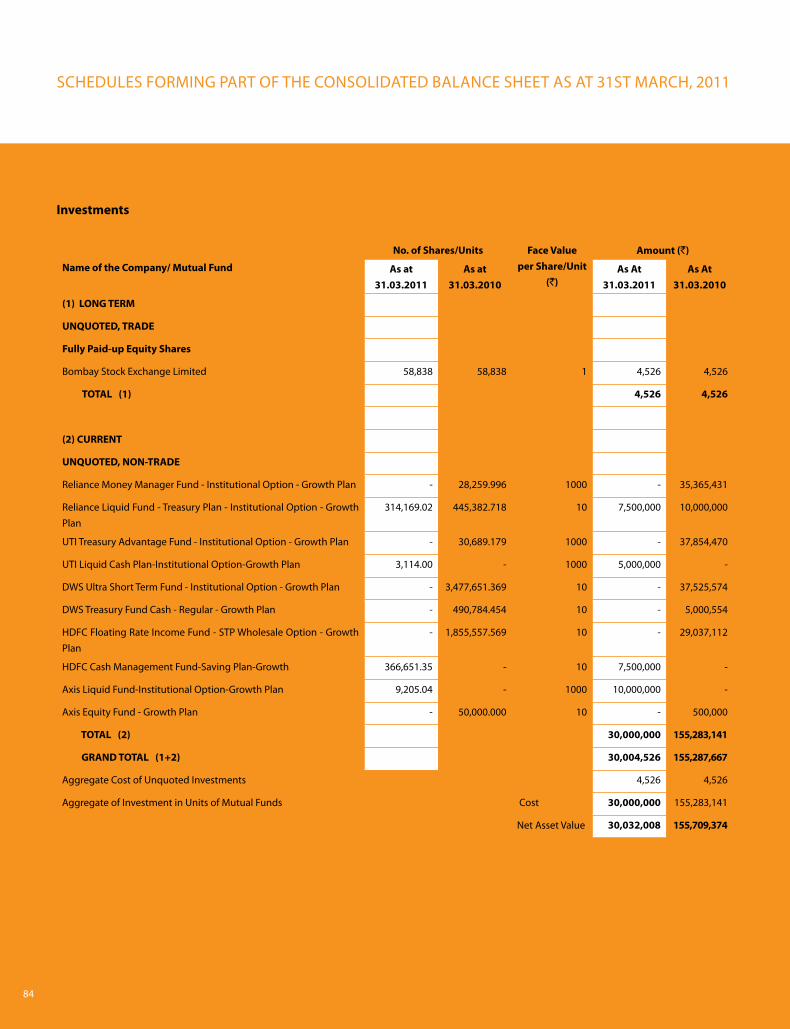
84
Name of the Company/ Mutual Fund
No. of Shares/Units Face Value per Share/Unit
(`)
Amount (`)
As at31.03.2011
As at 31.03.2010
As At31.03.2011
As At 31.03.2010
(1) LONG TERM
UNQUOTED, TRADE
Fully Paid-up Equity Shares
Bombay Stock Exchange Limited 58,838 58,838 1 4,526 4,526
TOTAL (1) 4,526 4,526
(2) CURRENT
UNQUOTED, NON-TRADE
Reliance Money Manager Fund - Institutional Option - Growth Plan - 28,259.996 1000 - 35,365,431
Reliance Liquid Fund - Treasury Plan - Institutional Option - Growth Plan
314,169.02 445,382.718 10 7,500,000 10,000,000
UTI Treasury Advantage Fund - Institutional Option - Growth Plan - 30,689.179 1000 - 37,854,470
UTI Liquid Cash Plan-Institutional Option-Growth Plan 3,114.00 - 1000 5,000,000 -
DWS Ultra Short Term Fund - Institutional Option - Growth Plan - 3,477,651.369 10 - 37,525,574
DWS Treasury Fund Cash - Regular - Growth Plan - 490,784.454 10 - 5,000,554
HDFC Floating Rate Income Fund - STP Wholesale Option - Growth Plan
- 1,855,557.569 10 - 29,037,112
HDFC Cash Management Fund-Saving Plan-Growth 366,651.35 - 10 7,500,000 -
Axis Liquid Fund-Institutional Option-Growth Plan 9,205.04 - 1000 10,000,000 -
Axis Equity Fund - Growth Plan - 50,000.000 10 - 500,000
TOTAL (2) 30,000,000 155,283,141
GRAND TOTAL (1+2) 30,004,526 155,287,667
Aggregate Cost of Unquoted Investments 4,526 4,526
Aggregate of Investment in Units of Mutual Funds Cost 30,000,000 155,283,141
Net Asset Value 30,032,008 155,709,374
SCHEDULES FORMING PART OF THE CONSOLIDATED BALANCE SHEET AS AT 31ST MARCH, 2011
Schedule F Investments

85
Schedule G
Stock in Trade
Shares & Securities 628,517 977,249
Total 628,517 977,249
Schedule H
Sundry Debtors
(Unsecured)
Exceeding six months
- Considered Good 5,279,259 56,510,487
- Considered doubtful 57,450,540 115,974,488
62,729,799 172,484,975
Less : Provision for doubtful debts 57,450,540 115,974,488
5,279,259 56,510,487
Other Debts
- Considered good 391,647,720 439,634,809
- Considered doubtful 23,729,054 1,467,652
415,376,774 441,102,461
Less: Provision for doubtful debts 23,729,054 1,467,652
391,647,720 439,634,809
Total 396,926,979 496,145,296
Schedule I
Cash And Bank Balances
Cash & Cheques on hand 692,958 4,703,649
Balances with Scheduled Banks
- In Current Accounts 215,566,033 182,981,125
- In Fixed Deposit Accounts 1,057,850,000 1,237,250,000
- In Unclaimed Dividend Account 172,915 137,428
- In IPO Refund Account 234,240 234,240
Gift/Meal Coupons 250,889 168,450
Stamps on Hand 26,000 67,000
Foreign Currency on Hand 15,902 84,245
Total 1,274,808,937 1,425,626,137
Schedule J
Other Current Assets
Accrued Interest on Bank Fixed Deposits 20,717,251 32,497,996
Total 20,717,251 32,497,996
ParticularsAs At 31.03.2011
(`)As At 31.03.2010
(`)
SCHEDULES FORMING PART OF THE CONSOLIDATED BALANCE SHEET AS AT 31ST MARCH, 2011

86
Schedule K
Loans & Advances (Unsecured, considered good, unless otherwise stated)
Loans Granted
-Secured 265,994,525 195,252,588
-Others 1,459,000 -
267,453,525 195,252,588
Less : Provision for Loss Assets 7,101,044 5,953,245
Less : Provision for Sub-Standard Assets 543,450 898,530
259, 809,031 188,400,813
Loan to Staff 5,467,339 1,950,444
Loan to Emkay Employees Welfare Trust [ Refer Note B (4)(b)(ii) of Schedule T ] 53,100,000 -
Prepaid Expenses 20,089,832 15,426,796
Advances Recoverable in cash or kind or for value to be received
- Considered Good 16,122,470 20,004,091
- Considered Doubtful 1,234,541 -
17,357,011 20,004,091
Less: Provision for Doubtful Advances 1,234,541 -
16,122,470 20,004,091
Deposits
- Considered Good 79,759,898 71,571,713
- Considered Doubtful 173,896 195,896
79,933,794 71,767,609
Less : Provision for Doubtful Deposits 173,896 195,896
79,759,898 71,571,713
Income Tax and Tax Deducted at Source ( Net of provision) 50,124,652 55,754,200
Fringe Benefit Tax ( Net of provision) 112,307 290,946
Equity Index/Stock Options Premium - 14,776
Mark to Market Margin -Equity Index/Stock Futures 6,494,688 88,304
Less : Provision for Loss in Equity Index/Stock Futures 6,494,688 88,304
- -
Mark to Market Margin - Currency Futures - 58,750
Less : Provision for Loss - Currency Futures - 58,750
- -
Total 484,585,529 353,413,779
ParticularsAs At 31.03.2011
(`)As At 31.03.2010
(`)
SCHEDULES FORMING PART OF THE CONSOLIDATED BALANCE SHEET AS AT 31ST MARCH, 2011
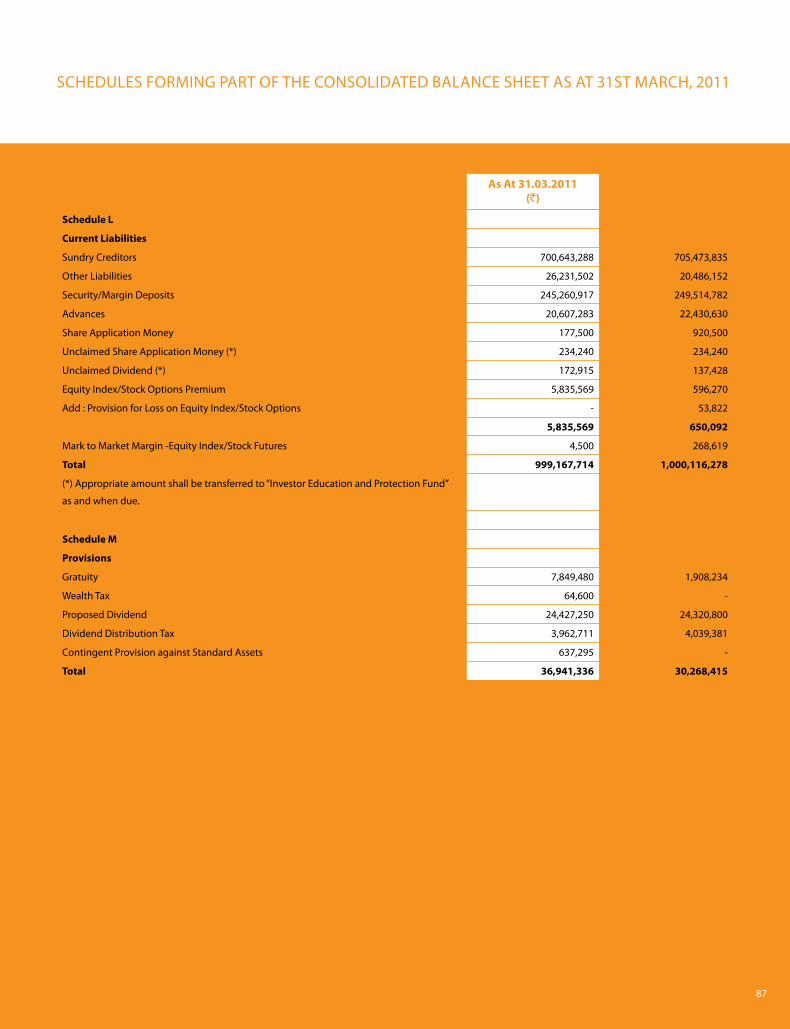
87
Schedule L
Current Liabilities
Sundry Creditors 700,643,288 705,473,835
Other Liabilities 26,231,502 20,486,152
Security/Margin Deposits 245,260,917 249,514,782
Advances 20,607,283 22,430,630
Share Application Money 177,500 920,500
Unclaimed Share Application Money (*) 234,240 234,240
Unclaimed Dividend (*) 172,915 137,428
Equity Index/Stock Options Premium 5,835,569 596,270
Add : Provision for Loss on Equity Index/Stock Options - 53,822
5,835,569 650,092
Mark to Market Margin -Equity Index/Stock Futures 4,500 268,619
Total 999,167,714 1,000,116,278
(*) Appropriate amount shall be transferred to “Investor Education and Protection Fund”
as and when due.
Schedule M
Provisions
Gratuity 7,849,480 1,908,234
Wealth Tax 64,600 -
Proposed Dividend 24,427,250 24,320,800
Dividend Distribution Tax 3,962,711 4,039,381
Contingent Provision against Standard Assets 637,295 -
Total 36,941,336 30,268,415
ParticularsAs At 31.03.2011
(`)As At 31.03.2010
(`)
SCHEDULES FORMING PART OF THE CONSOLIDATED BALANCE SHEET AS AT 31ST MARCH, 2011

88
SCHEDULES FORMING PART OF THE CONSOLIDATED PROFIT AND LOSS ACCOUNT FOR THE YEAR ENDED 31ST MARCH, 2011
Schedule NIncome from OperationsBrokerage 929,973,918 912,866,423 Investment Banking Activities 128,716,277 138,036,800 Portfolio Management Fees 32,081,679 14,780,561 Depository Operations 8,805,288 12,458,535 Interest from Financing Activities 29,242,937 32,043,883 Insurance Commission 10,486,716 9,706,482 Other Fees 15,930,583 9,269,073 Profit/(Loss) in Proprietory Trades in Securities/Derivatives transactions ( Net of expenses) 21,726,170 10,892,407 (Less)/Add : (Provision)/Write Back for/of Loss on Equity Index/Stock Options ( Net) 53,822 (53,822)(Less)/Add : (Provision)/Write Back for/of Loss on Equity Index/Stock Futures ( Net) (6,406,384) (88,304)(Less)/Add : (Provision)/Write Back for/of Loss on Currency Futures ( Net) 58,750 (58,750)
15,432,358 10,691,531 Total 1,170,669,756 1,139,853,288
Schedule OOther IncomeInterest (Gross) - On fixed deposits with banks 80,959,213 91,023,214 (TDS Rs. 80,95,786/-, P.Y. `1,01,42,860/- ) - Others 534,130 1,421,766
81,493,343 92,444,980 Dividend (Gross) - On Long term Trade Investments 235,352 235,352 - On Current Non-Trade Investments 29,760 - - On Stock in Trade 6,486 23,429
271,598 258,781 Miscellaneous Income 25,266,934 15,051,937 Profit on Sale of Investments - Current 9,150,863 14,611,480 Provision for Doubtful Debt s Written Back 42,582,489 7,432,079 Provision for Doubtful Deposits Written Back 22,000 - Provision for Sub Standard Assets Written Back 329,586 - Bad Debts Recovered 129,875 7,262 Total 159,246,688 129,806,519
Schedule PPersonnel CostSalaries and Other Benefits 462,065,498 369,093,525 Contribution to Provident Fund and Other Funds 15,557,981 8,718,508 Staff Welfare Expenses 8,518,687 6,593,741 Total 486,142,166 384,405,774
Schedule QOperating ExpensesBrokerage & Commission 197,337,029 222,623,834 Communication, Postage and Courier Charges 45,391,305 40,075,071 Fees & Stamps 46,546,191 40,914,327 Commitment Fees - 275,750
ParticularsYear Ended31.03.2011
(`)
Year Ended31.03.2010
(`)

89
SCHEDULES FORMING PART OF THE CONSOLIDATED PROFIT AND LOSS ACCOUNT FOR THE YEAR ENDED 31ST MARCH, 2011
ParticularsYear Ended31.03.2011
(`)
Year Ended31.03.2010
(`)
Contribution/Payments to Stock Exchange 28,224,989 27,238,071 Membership & Subscription 19,766,182 20,021,136 Registration Fees 2,482,317 2,798,808 Depository Charges 4,344,829 5,745,212 Consultancy Fees 18,900,000 72,869,377 Claims/Compensation 11,301 113,500 Loss due to Execution of Trades 10,649,257 11,524,467 Total 373,653,400 444,199,553
Schedule RAdministrative ExpensesElectricity Charges 19,610,530 19,240,426 Insurance 1,054,813 1,142,477 Repairs & Maintenance - Others 15,585,113 14,471,163 Advertisement & Business Promotion Expenses 14,845,567 8,460,495 Motor Car Expenses 541,173 484,446 Printing & Stationery 11,406,394 9,109,025 Travelling and Conveyance 19,339,774 14,042,363 Provision for Doubtful Debts 24,999,369 39,699,553 Provision for Doubtful Deposits / Advances 1,234,541 195,896 Provision for Loss Assets 578,855 5,953,245 Provision for Sub-Standard Assets 543,450 898,530 Provision for Standard Assets 637,295 - Bank Commission and Charges 14,094,700 14,338,106 Loss Assets Written off - 77,486 Less : Provision Written Back - (77,486)
- - Bad Debts Written off 18,799,975 21,130,382 Less : Provision Written Back (18,679,426) (20,603,262)
120,549 527,120 Deposits & Advances Written off 679,858 572,256 Software Expenses 6,192,378 5,543,650 Legal & Professional fees 12,406,539 5,678,048 Auditor’s Remuneration - Audit Fees 1,188,300 1,025,300 - Tax Audit Fees 176,575 112,575 - Taxation Matters 174,900 140,000 - Other Matters 259,363 158,695
1,799,138 1,436,570 Rent 65,219,138 65,533,580 Loss on Sale of Fixed Assets/ Assets Discarded 354,908 1,618,331 Miscellaneous Expenses 17,190,066 12,985,497 Donation 125,500 8,501 Share Issue Expenses 53,410 235,250 Total 228,613,058 222,174,528
Schedule SInterest to Banks 13,656,915 15,027,516 to Others 1,978,576 172,012 Total 15,635,491 15,199,528

90
SCHEDULE FORMING PART OF THE CONSOLIDATED ACCOUNTS FOR THE YEAR ENDED 31ST MARCH, 2011
SCHEDULE “T”
(A) SIGNIFICANT ACCOUNTING POLICIES TO CONSOLIDATED FINANCIAL STATEMENTS FOR THE YEAR ENDED 31ST MARCH, 2011
1. Basis of Preparation of Consolidated Financial Statements
The accompanying Consolidated financial statements are prepared in accordance with Generally Accepted Accounting Principles and provisions of the Companies Act, 1956 under the historical cost convention on the accrual basis of accounting. The accounting policies have been consistently applied by the group unless otherwise stated.
2. Use of Estimates
The preparation of Consolidated financial statements in conformity with generally accepted accounting principles requires estimates and assumptions to be made that affect the reported amounts of assets and liabilities and disclosures of contingent liabilities on the date of the financial statements and the reported amounts of revenues and expenses during the reporting period. Actual results could differ from these estimates and the differences between actual results and estimates are recognised in the periods in which the results are known / materialize.
3. Basis of Consolidation
i) Basis of Preparation:
The Consolidated Financial Statements are prepared in accordance with Accounting Standard (AS-21) on “Consolidated Financial Statements” issued by the Institute of Chartered Accountants of India and notified under the Companies (Accounting Standards) Rules, 2006. Reference in these notes to the Parent Company means Emkay Global Financial Services Limited, reference to Subsidiary Companies means four subsidiaries of Emkay Global Financial Services Limited, i.e. Emkay Fincap Limited, Emkay Commotrade Limited, Emkay Insurance Brokers Limited and Emkay Investment Managers Limited and reference to Group means the Parent Company and the Subsidiary Companies.
ii) The subsidiaries considered in Consolidated Financial Statements are:-
Name of the Subsidiaries Country of
IncorporationPeriod included in
ConsolidationProportion of
Ownership Interest
Emkay Fincap Limited India 01.04.2010 – 31.03.2011 100%
Emkay Commotrade Limited India 01.04.2010 – 31.03.2011 100%
Emkay Insurance Brokers Limited India 01.04.2010 – 31.03.2011 100%
Emkay Investment Managers Limited India 08.06.2010 – 31.03.2011 100%
iii) Principles of Consolidation:
• TheconsolidatedfinancialstatementscompriseoftheFinancialStatementsoftheParentCompanyanditssubsidiariesand have been combined on a line-by-line basis by adding together the book values of like items of assets, liabilities, income and expenses after eliminating intra-group balances / transactions and resulting profits / losses in full.
• TheConsolidatedFinancialStatementsarepresented,totheextentpossibleinthesameformatasthatadoptedbytheParent Company for its separate financial statements.
• TheConsolidatedFinancialStatementsofthegroupcompaniesarepreparedaccordingtouniformaccountingpoliciesacross the group and is in accordance with accounting principles generally accepted in India.

91
• Goodwill/CapitalReserveonConsolidation:
The excess of cost to the Parent Company of its investment in subsidiaries over its portion of equity in the subsidiaries at the respective dates on which investment in subsidiaries was made is recognised in the financial statements as goodwill and vice versa is recognised in financial statements as capital reserve. The Parent Company’s portion of equity in the subsidiaries is determined on the basis of the value of assets and liabilities as per the financial statements of the subsidiaries as on the date of investment.
4. Revenue Recognition:
(a) Brokerage income is recognized as per contracted rates on the execution of transactions on behalf of the clients on the trade date.
(b) One times non refundable subscription fees with a validity of maximum of one year for joining various special brokerage schemes are treated as income when the client agrees to join that particular scheme and renders payment for the same. Brokerage reversible under the said schemes are reversed by making provision at the end of each quarter. However, actual credit for brokerage reversible to the client is given at the end of the validity period of the scheme opted.
(c) Portfolio Management Fees by the parent and a subsidiary carrying on Portfolio Management Services (PMS) business is accounted on accrual basis as follows:-
(i) in case of fees based on fixed percentage of Assets Under Management, income is accrued at the end of each quarter or closure of Portfolio Account, whichever is earlier.
(ii) in case of fees based on returns on Portfolio, income is accounted at the end of completion of one year by each client from the date of joining the Portfolio Management Scheme or closure of Portfolio Account, whichever is earlier.
(d) Dividend including interim are accounted when the right to receive payment is established.
(e) Profit/ (Loss) in proprietory trades in securities and derivatives comprises of profit/(loss) on sale of securities held as stock-in-trade, profit/(loss) on equity derivative instruments, profit/(loss) on currency futures transactions and profit/(loss) on commodity futures transactions. Profit/(Loss) on sale of securities is determined based on first-in-first-out (FIFO) basis of cost of securities sold. Profit/(loss) on equity derivative instruments is determined as explained in para 5 and 6 below. Profit/(Loss) on Currency Futures and Commodity Futures transactions is also determined mutatis mutandis as explained in para 5 and 6 below.
(f ) Prudential norms for income recognition, asset classification and provisioning for non-performing assets as prescribed by Reserve Bank of India are followed in case of a subsidiary carrying on Non-banking Financial business.
(g) Income from Insurance Commission is accounted for on accrual basis in respect of business confirmed with the clients in case of a subsidiary carrying on Direct Insurance Broking Business.
5. Equity Index/Stock - Futures
(i) Equity Index/Stock Futures are marked-to-market on a daily basis. Debit or Credit balance disclosed under Loans and Advances or Current Liabilities, respectively, in the Mark-to-Market Margin – Equity Index / Stock Futures Account, represents the net amount paid or received on the basis of movement in the prices of Index/Stock futures till the Balance Sheet date.
(ii) As on the Balance Sheet date, Profit / Loss on open positions in Equity Index / Stock Futures is accounted for as follows:
• CreditbalanceintheMark-to-MarketMargin–EquityIndex/StockFuturesAccount,beingtheanticipatedprofit,isignoredand no credit for the same is taken in the Profit and Loss Account.
SCHEDULE FORMING PART OF THE CONSOLIDATED ACCOUNTS FOR THE YEAR ENDED 31ST MARCH, 2011

92
• DebitbalanceintheMark-to-MarketMargin–EquityIndex/StockFuturesAccount,beingtheanticipatedloss,isprovidedin the Profit and Loss account and is reflected in “Provision for Loss on Equity Index/Stock Futures Account” under Current Liabilities.
(iii) On final settlement or squaring-up of contracts for Equity Index / Stock Futures, the Profit or Loss is calculated as the difference between the settlement / squaring-up price and the contract price. Accordingly, debit or credit balance pertaining to the settled / squared-up contract in Mark-to-Market Margin – Equity Index / Stock Futures Account after adjustment of the provision for anticipated losses is recognized in the Profit and Loss account. When more than one contract in respect of the relevant series of Equity Index / Stock Futures contract to which the squared-up contract pertains is outstanding at the time of the squaring-up of the contract, the contract price of the contract so squared-up is determined using the weighted average cost method for calculating the Profit / Loss on squaring-up.
6. Equity Index/Stock - Options
(i) “Equity Index/Stock Options Premium Account” represents premium paid or received for buying or selling the options, respectively. Debit or Credit balance under the said account is disclosed under Loans and Advances or Current Liabilities as the case may be.
(ii) At the time of final settlement
Premium paid/received is recognised as an expense/income on exercise of Option. Further, difference between the final settlement price as on the exercise/expiry date and the strike price is recognised as Profit or Loss.
(iii) At the time of squaring off
Difference between the premium paid and received on squared off transactions is treated as Profit or Loss.
(iv) At the Balance Sheet date
In the case of long positions, provision is made for the amount by which the premium paid for those options exceeds the premium prevailing on the Balance Sheet date, and in the case of short positions, for the amount by which premium on the Balance Sheet date exceeds the premium received for those options, and is reflected in “Provision for Loss on Equity Index/Stock Option Account” under Current Liabilities.
7. Fixed Assets and Depreciation
a) Fixed Assets are stated at cost of acquisition including incidental expenses related to such acquisition and installation less accumulated depreciation.
b) Depreciation on Fixed Assets other than Improvements to Leasehold/ Licensed Premises have been provided on written down value method at the rates prescribed under Schedule XIV to the Companies Act, 1956 as amended from time to time including pro rata depreciation on additions/deletions made during the year.
c) Improvements to Leasehold/Licensed Premises are depreciated on a straight-line method over the Primary Lease Period or over a period of 3 years whichever is less starting from the date when the Leasehold/Licensed premises are put to use.
8. Intangible Assets and Amortization
Items of expenditure that meet the recognition criteria as mentioned in Accounting Standard – 26 on “Intangible Assets” are classified as intangible assets and are amortized over the period of economic benefits.
SCHEDULE FORMING PMART OF THE CONSOLIDATED ACCOUNTS FOR THE YEAR ENDED 31ST MARCH, 2011

93
Softwares are stated at cost of acquisition and are amortized on straight line basis over a period of 3 years irrespective of the date of acquisition.
Membership Rights in Stock Exchanges are amortized on straight- line basis over a period of 10 years.
9. Stock – in – Trade
Stock – in – Trade of securities are valued at lower of the cost or market value on individual scrip by scrip basis. Cost is determined on First-in-First-Out (FIFO) basis.
10. Investments
Investments that are readily realizable and intended to be held for not more than twelve months are classified as Current Investments. All other investments are classified as Long Term Investments. Long Term Investments are stated at cost. However, provision for diminution in value is made to recognize a decline other than temporary in the value of the investments.
Current Investments are stated at lower of cost and fair value and determined on an individual investment basis.
11. Employee Benefits
(i) Short Term Benefits
All employee benefits including leave encashment (short term compensated absences) and statutory bonus/performance bonus/ incentives payable wholly within twelve months of rendering the service are classified as short term employee benefits and are charged to the Profit and Loss Account of the year.
(ii) Long Term Benefits
(a) Post Employment Benefits
(i) Defined Contribution Plans: - Retirement/ Employee benefits in the form of Provident Fund, Employees State Insurance and labour welfare are considered as defined contribution plan and contributions to the respective funds administered by the Government are charged to the Profit and Loss Account of the year when the contribution to the respective funds are due.
(ii) Defined Benefit Plans: - Retirement benefits in the form of gratuity is considered as defined benefit obligation and is provided for on the basis of an actuarial valuation on projected unit credit method made as at the date of the Balance Sheet. The scheme is maintained and administered by an insurer to which the trustees make periodic contributions except in case of two subsidiary companies where the gratuity plan is non-funded. Actuarial gain/loss, if any are immediately recognized in the Profit and Loss account.
(b) Other Long Term Benefits
As per the present policy of the group, there are no other long term benefits to which its employees are entitled.
12. Borrowing Cost
Borrowing costs that are attributable to the acquisition or construction of qualifying assets are capitalized as part of the cost of such assets. A qualifying asset is one that necessarily takes substantial period of time to get ready for intended use. All other borrowing costs are charged to revenue.
SCHEDULE FORMING PART OF THE CONSOLIDATED ACCOUNTS FOR THE YEAR ENDED 31ST MARCH, 2011

94
SCHEDULE FORMING PART OF THE CONSOLIDATED ACCOUNTS FOR THE YEAR ENDED 31ST MARCH, 2011
13. Assets on Operating Leases
Lease payments under operating leases are recognized as expenses on accrual basis in accordance with the respective leave and license agreements.
14. Share Issue/Preliminary Expenses
In case of Parent, expenses incurred in connection with fresh issue of Share Capital are adjusted against Securities Premium account in the year in which they are incurred and in case of Subsidiaries, Share Issue / Preliminary Expenses are recognized as an expense in the year in which they are incurred.
15. Taxation
Provision for taxation has been made in accordance with the Income Tax Laws prevailing for the relevant assessment years.
16. Deferred Taxation
Deferred Tax resulting from timing differences between book and tax profits is accounted for under the liability method, at the tax rates that have been enacted or substantively enacted after the Balance Sheet date, to the extent that the timing difference are expected to crystallize as deferred tax charge/benefit in the Profit and Loss Account and as deferred tax assets/ liabilities in the Balance Sheet.
17. Contingencies and Events Occuring After The Balance Sheet Date
Events occurring after the date of the Balance Sheet, which provide further evidence of conditions that existed at the Balance Sheet date or that arose subsequently, are considered up to the date of approval of accounts by the Board of Directors, where material.
18. Impairment
Where the recoverable amount of the fixed asset is lower than its carrying amount, a provision is made for the impairment loss. Post impairment, depreciation is provided for on the revised carrying value of the asset over its remaining useful life.
19. Provisions, Contingent Liabilities & Contingent Assets
A provision is recognized when an enterprise has a present obligation as a result of past event(s) and it is probable that an outflow of resources embodying economic benefits will be required to settle the obligation(s), in respect of which a reliable estimate can be made for the amount of obligation. Contingent Liabilities, if material, are disclosed by way of notes. Contingent Assets are not recognized or disclosed in the financial statements.
20. Foreign Currency Transactions
Foreign currency transactions are accounted at the exchange rates prevailing on the date of the transaction. Foreign currency monetary items outstanding as at the Balance Sheet date are reported using the closing rate. Gains and losses resulting from the settlement of such transactions and translation of monetary assets and liabilities denominated in foreign currencies are recognized in the Profit and Loss Account.

95
21. Employee Stock Compensation Cost
The Parent Company follows the intrinsic value method as prescribed by the Guidance note on “Accounting for Employee Share-based Payments” issued by the Institute of Chartered Accountants of India to account for the compensation cost of its Stock based employee compensation plans.
22. Stock Lending and Borrowing
Borrowing/ Lending fees paid/received on stocks borrowed/lent under Stock Lending and Borrowing Mechanism is recognized on accrual basis.
Amount deposited with Stock Exchanges for borrowed stocks has been shown under the head Current Assets, Loans and Advances and the same is reversed on return of such borrowed stock.
Sale proceeds of borrowed stock has been shown as Current Liabilities and the same is reversed on squaring up of the transaction with resultant gain/loss being recognized in the Profit and Loss account.
Provision is made for anticipated losses however anticipated profits are ignored for difference between sale price of borrowed stock and the price prevailing at the Balance Sheet date on such borrowed stock.
(B) NOTES TO THE ACCOUNTS
1. Figures of the previous year have been regrouped, recasted and rearranged wherever necessary to make them comparable with the figures of the current year.
2. a) Emkay Investment Managers Limited was incorporated during the year on 8th June, 2010 as a Wholly Owned Subsidiary to take over the business of PMS from its Parent on a going concern basis. The said subsidiary obtained certificate of commencement of business on 23rd August, 2011.
b) The Parent Company transferred its PMS business after all regulatory approvals to its said wholly owned subsidiary on a going concern basis with effect from 1st January, 2011 for a total consideration of ` 5,00,000/- (based on valuation carried out by an Independent Valuer) accounted as Goodwill by the said subsidiary and as Gain on Transfer of PMS business by the Parent.
3. a) During the year, Emkay Insurance Brokers Limited redeemed 10,00,000 9% Optionally Convertible Redeemable Preference Shares of ` 10 each aggregating to ` 1,00,00,000/- out of the proceeds of fresh issue of 10,00,000 Equity Shares of ` 10/ each at par to its Parent Company as per the Board Resolution passed at the Board Meeting held on 11th August, 2010 as per the provisions of section 80 of the Companies Act, 1956.
b) During the year, Emkay Fincap Limited redeemed 40,00,000 9% Non Convertible Redeemable Preference Shares of ` 10 each aggregating to ̀ 4,00,00,000/- out of the profits of the said subsidiary company as per the Board Resolution passed at the Board Meeting held on 28th May, 2010. Consequently, the subsidiary company created Capital Redemption Reserve amounting to ` 4,00,00,000/- as per the provisions of section 80 of the Companies Act, 1956.
4. Employees Stock Option Schemes
Disclosure required pursuant to “Guidance Note on Accounting for Employee Share- based payments” in connection with Parent Company’s Employees Stock Option Schemes :-
a) The Parent Company has granted Employee Stock Options (ESOP) to its employees and employees of its subsidiaries. During the year ended 31st March, 2011, following schemes were in operation:
SCHEDULE FORMING PART OF THE CONSOLIDATED ACCOUNTS FOR THE YEAR ENDED 31ST MARCH, 2011

96
SCHEDULE FORMING PART OF THE CONSOLIDATED ACCOUNTS FOR THE YEAR ENDED 31ST MARCH, 2011
Particulars ESOP – 2005 ESOP – 2007 ESOP – 2010
Date of Grant 28.01.2006 17.01.2008 19.06.2009 24.07.2009 04.05.2010 27.07.2010 21.10.2010
Number of Options Granted*
3,81,250 14,42,000 2,44,000 2,07,500 1,00,000 611,500 5,55,000
Method of Settlement Equity
Vesting period from the date of Grant
Graded Vesting – Over 4 years
Graded Vesting – Over 3 years
Graded Vesting -
Over 5 years
Exercise period from the date of Vesting
3 years from the date of each vesting
Exercise Price (` per share) **
20 63 63 61 93 77 93
Market Price at the date of grant (` per share)
20 63 63 62 92.75 76.25 92.50
* ESOP – 2007 includes 1,20,000 options to employees of Subsidiary Companies.
** Closing market price prior to the date of grant except in case of ESOP – 2005 where the value determined by an independent valuer as the Parent Company was unlisted at that time.
b) (i) The Parent Company introduced ESOP – 2010 Scheme during the year and set up “Emkay Employees Welfare Trust” to administer and implement this in accordance with recommendations of the Remuneration / Compensation Committee of the Parent Company. The said trust shall purchase shares of the Parent Company from the Stock / Secondary Market from time to time and hold this pool of shares for the benefit of the Employees / Employee Directors. The Parent Company may also grant financial assistance to the trust for this purpose with or without interest. The trust shall grant options to the employees in accordance with the directions and recommendations of the Remuneration / Compensation Committee. Each option would entitle an option holder to acquire one equity share of the Parent Company from the trust. All present and future Permanent Employees and/or Employee Directors of the Parent Company (excluding Promoter Employees and/or Promoter Directors) selected by the Remuneration / Compensation Committee from time to time would be entitled to participate in this Scheme.
(ii) For the above purpose, the Parent Company during the year granted interest free loan of ` 5,31,00,000/- to the trust for the equity shares bought by the said trust. The repayment of the loan granted by the Parent Company to the trust is dependent on the exercise of the options by the eligible employees and the market price of the underlying shares of the unexercised options at the end of the respective exercise period.
c) Details of activity under the ESOP Schemes have been summarized below:
Particulars ESOP-2005 ESOP-2007 ESOP-2010
2010-2011 2009-2010 2010-2011 2009-2010 2010-2011 2009-2010
Options Outstanding at the beginning of the year 53,000 120,000 15,66,700 13,65,500 - -
Options Granted during the year - - 7,11,500 4,51,500 555,000 -
Options Forfeited during the year - 2,500 - - - -
Options Exercised during the year 33,250 59,000 48,950 11,300 - -
Options Expired/ Lapsed during the year 1,000 5,500 220,000 2,39,000 - -

97
SCHEDULE FORMING PART OF THE CONSOLIDATED ACCOUNTS FOR THE YEAR ENDED 31ST MARCH, 2011
d) The fair value and other disclosures and assumptions are given below :
(i) Key Assumptions in Black - Scholes Model for calculating fair value as at the date of grant for options granted during the year :
Grant DateESOP 2007 ESOP 2010
04.05.2010 27.07.2010 21.10.2010
Variables
Expected Volatility 72.48% 71.03% 70.02%
Risk Free Interest Rate 7.21% - 7.67% 7.32% - 7.68% 7.73% - 7.96%
Time to Maturity (in years) 4.41- 6.61 years 4.43 - 6.43 years 4.45 - 6.45 years
Expected Dividend Yield 1.39% 1.39% 1.43%
Exercise Price (` per share) 93 77 93
Price of the underlying share at the time of the option grant (` per share)
92.75 76.25 92.50
Particulars ESOP-2005 ESOP-2007 ESOP-2010
2010-2011 2009-2010 2010-2011 2009-2010 2010-2011 2009-2010
Options Outstanding at the end of the year 18,750 53,000 2,009,250 1,566,700 555,000 -
Options Exercisable at the end of the year 18,750 53,000 2,59,500 1,06,350 - -
Weighted Average remaining contractual life (in years) 1.51 0.66 5.44 5.55 7.51 -
Weighted Average Exercise Price of the options granted during the year (` per share)
20.00 20.00 85.27 62.78 85.27 -
Weighted Average Share Price at the date of exercise (` per share)
94.42 73.03 91.02 79.42 - -
(ii) Fair Value as at the date of grant for options granted during the year :-
(iii) Other disclosures and assumptions :
• ExpectedvolatilityconsideredisonthebasisofstockpricesofthecompanyonNationalStockExchangeofIndiaLtd.(NSE)from 28th April, 2006 (i.e. date of Listing on exchanges) till the respective grant date.
• Riskfreeinterestrateconsideredistheinterestrateapplicableformaturityequaltotheexpectedlifeoftheoptionsbasedonthe zero-coupon yield curve for government securities.
• TimetoMaturityconsideredistheperiodforwhichthecompanyexpectstheoptionstobelivetakingintoaccountthevestingperiod, average lengths of time of similar grants which have remained outstanding in the past etc.
Particulars ESOP 2007 ESOP 2010
Grant Date 04.05.2010 27.07.2010 21.10.2010
Weighted Average Fair Value (` per share) 57.18 46.44 56.13
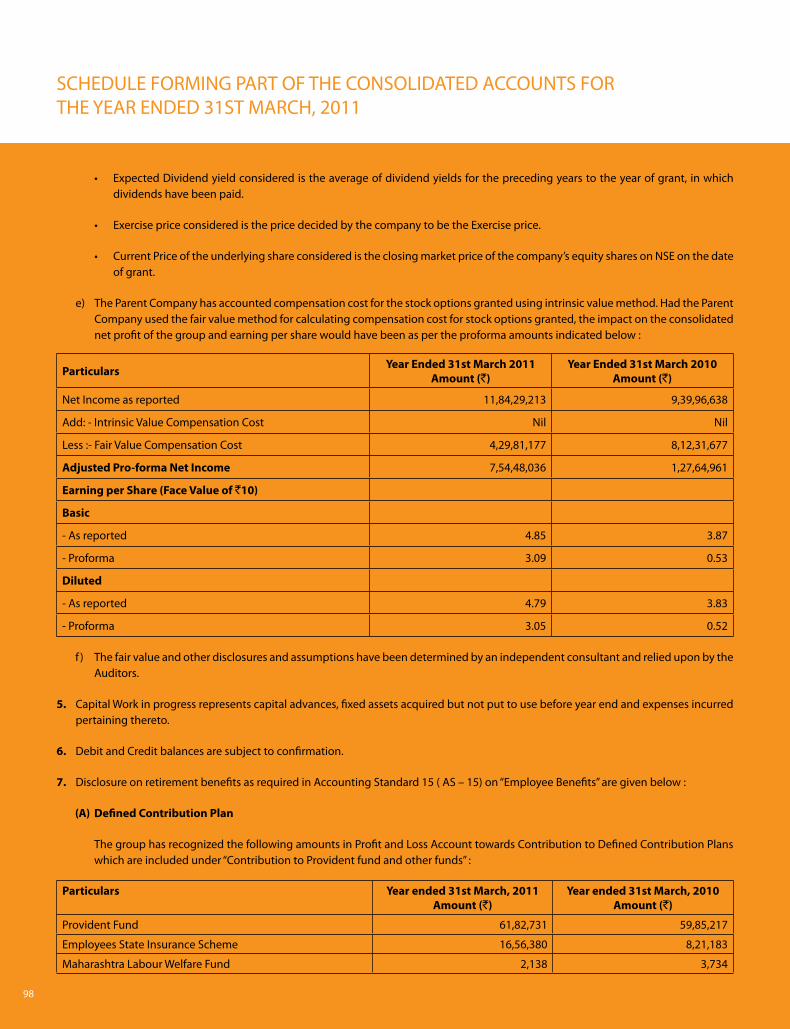
98
SCHEDULE FORMING PART OF THE CONSOLIDATED ACCOUNTS FOR THE YEAR ENDED 31ST MARCH, 2011
• ExpectedDividendyieldconsideredistheaverageofdividendyieldsfortheprecedingyearstotheyearofgrant,inwhichdividends have been paid.
• ExercisepriceconsideredisthepricedecidedbythecompanytobetheExerciseprice.
• CurrentPriceoftheunderlyingshareconsideredistheclosingmarketpriceofthecompany’sequitysharesonNSEonthedateof grant.
e) The Parent Company has accounted compensation cost for the stock options granted using intrinsic value method. Had the Parent Company used the fair value method for calculating compensation cost for stock options granted, the impact on the consolidated net profit of the group and earning per share would have been as per the proforma amounts indicated below :
Particulars Year Ended 31st March 2011 Amount (`)
Year Ended 31st March 2010 Amount (`)
Net Income as reported 11,84,29,213 9,39,96,638
Add: - Intrinsic Value Compensation Cost Nil Nil
Less :- Fair Value Compensation Cost 4,29,81,177 8,12,31,677
Adjusted Pro-forma Net Income 7,54,48,036 1,27,64,961
Earning per Share (Face Value of `10)
Basic
- As reported 4.85 3.87
- Proforma 3.09 0.53
Diluted
- As reported 4.79 3.83
- Proforma 3.05 0.52
f ) The fair value and other disclosures and assumptions have been determined by an independent consultant and relied upon by the Auditors.
5. Capital Work in progress represents capital advances, fixed assets acquired but not put to use before year end and expenses incurred pertaining thereto.
6. Debit and Credit balances are subject to confirmation.
7. Disclosure on retirement benefits as required in Accounting Standard 15 ( AS – 15) on “Employee Benefits” are given below :
(A) Defined Contribution Plan
The group has recognized the following amounts in Profit and Loss Account towards Contribution to Defined Contribution Plans which are included under “Contribution to Provident fund and other funds” :
Particulars Year ended 31st March, 2011 Amount (`)
Year ended 31st March, 2010 Amount (`)
Provident Fund 61,82,731 59,85,217
Employees State Insurance Scheme 16,56,380 8,21,183
Maharashtra Labour Welfare Fund 2,138 3,734

99
(B) Defined Benefit Plan
The details of the group’s post retirement benefit plan for gratuity for its employees in conformity with the principles set out in AS – 15 which has been determined by an Actuary appointed for the purpose and relied upon by the Auditors are given below :
SCHEDULE FORMING PART OF THE CONSOLIDATED ACCOUNTS FOR THE YEAR ENDED 31ST MARCH, 2011
Sr. No. Particulars 2010-2011 2009-2010
I Changes in present value of obligations
Present Value of Obligations at beginning of the year 12,289,164 10,503,937
Interest cost 911,511 722,334
Current Service Cost 5,344,275 3,474,540
Past Service Cost (Non-Vested Benefits) 148,890 -
Past Service Cost (Vested Benefits) 2,184,673 -
Benefits Paid (271,398) (369,750)
Actuarial (gain)/loss on obligations (622,368) (2,041,897)
Present Value of Obligations at end of the year 19,984,747 12,289,164
II Changes in fair value of plan assets
Fair Value of Plan Assets at beginning of the year 10,380,930 5,899,669
Adjustment to Opening Fair Value of Plan Assets 293 -
Expected Return on Plan Assets 1,007,300 721,000
Contributions by employer 1,892,863 4,594,370
Benefits Paid (271,398) (369,750)
Actuarial gain/(loss) on plan assets (757,344) (464,359)
Fair Value of Plan Assets at end of the year 12,252,644 10,380,930
III Fair Value of plan assets
Fair Value of Plan Assets at beginning of the year 10,380,930 5,899,669
Adjustment to Opening Fair Value of Plan Assets 293 -
Actual Return on Plan Asset 249,956 256,641
Contributions 1,892,863 4,594,370
Benefits Paid (271,398) (369,750)
Fair Value of Plan Assets at end of the year 12,252,644 10,380,930
Funded Status (7,732,103) (1,908,234)
Excess of actual over estimated return on Plan Assets (757,344) (464,359)

100
SCHEDULE FORMING PART OF THE CONSOLIDATED ACCOUNTS FOR THE YEAR ENDED 31ST MARCH, 2011
Sr. No. Particulars 2010-2011 2009-2010
IV Actuarial Gain/(Loss) Recognized
Actuarial Gain/(Loss) for the year (Obligation) 622,368 2,041,897
Actuarial Gain/(Loss) for the year (Plan Assets) (757,344) (464,359)
Total Gain/(Loss) for the year (134,976) 1,577,538
Actuarial Gain/(Loss) recognized for the year (134,976) 1,577,538
Unrecognized Actuarial Gain/(Loss) at end of the year - -
V Amounts recognized in the Balance Sheet
Present Value of Obligations at end of the year 19,984,747 12,289,164
Fair Value of Plan Assets at end of the year 12,252,644 10,380,930
Funded Status (7,732,103) (1,908,234)
Unrecognized Actuarial Gain/(Loss) - -
Net Asset/(Liability) recognized in the balance sheet
under “Provisions – Gratuity” (7,732,103) (1,908,234)
VI Expense recognized in Profit and Loss Account
Current Service Cost 5,344,275 3,474,540
Interest cost 911,511 722,334
Past Service Cost ( Non-Vested Benefits) 148,890 -
Past Service Cost ( Vested Benefits) 2,184,673 -
Expected Return on Plan Assets (1,007,300) (721,000)
Net Actuarial (Gain)/Loss recognized for the year (134,976) (1,577,538)
Expense recognized in Profit and Loss Account under
“Personnel Cost” 7,717,025 1,898,336
VII Movements in the Liability recognized in Balance Sheet
Opening Net Liability 1,908,234 4,604,268
Adjustment to Opening Fair Value of Plan Assets (293) -
Expenses as above 7,717,025 1,898,336
Contribution paid (1,892,863) (4,594,370)
Closing Net Liability 7,732,103 1,908,234

101
Sr. No. Particulars 2010-2011 2009-2010
VIII Investment pattern
Insurer Managed Funds except in case of two Subsidiary Companies where plan is not funded
100.00% 100.00%
IX Principal Assumptions
Mortality LIC(1994-96)Ult LIC(1994-96)Ult
Discount Rate 8.30% 7.50%
Rate of increase in compensation 5.00% to 10.00% 5.00%
Rate of return (expected) on plan assets 9.00% 9.00%
SCHEDULE FORMING PART OF THE CONSOLIDATED ACCOUNTS FOR THE YEAR ENDED 31ST MARCH, 2011
8. (a) Details of Managerial Remuneration in Parent Company (included under the head “Personnel Cost”) :
ParticularsYear ended
31st March, 2011Amount (`)
Year ended 31st March, 2010
Amount (`)
(A) Managing Directors
Salary 1,02,00,000 1,20,00,000
Company’s Contribution to Provident Fund 12,24,000 14,40,000
Leave Salary - 4,60,000
Medical Reimbursement 54,676 74,591
Club Subscription 62,221 1,36,823
Total (A) 1,15,40,897 1,41,11,414
(B) Directors other than Managing Directors
Sitting Fees 4,70,000 3,70,000
Commission 5,50,000 5,50,000
Total (B) 10,20,000 9,20,000
Total (A+B) 1,25,60,897 1,50,31,414
(b) Contribution to Group Gratuity Scheme and Premium paid on Group Personal Accident Policy, Group Mediclaim Insurance Policy and Group Term Life Insurance Policy has not been considered, as employee-wise details are not available.
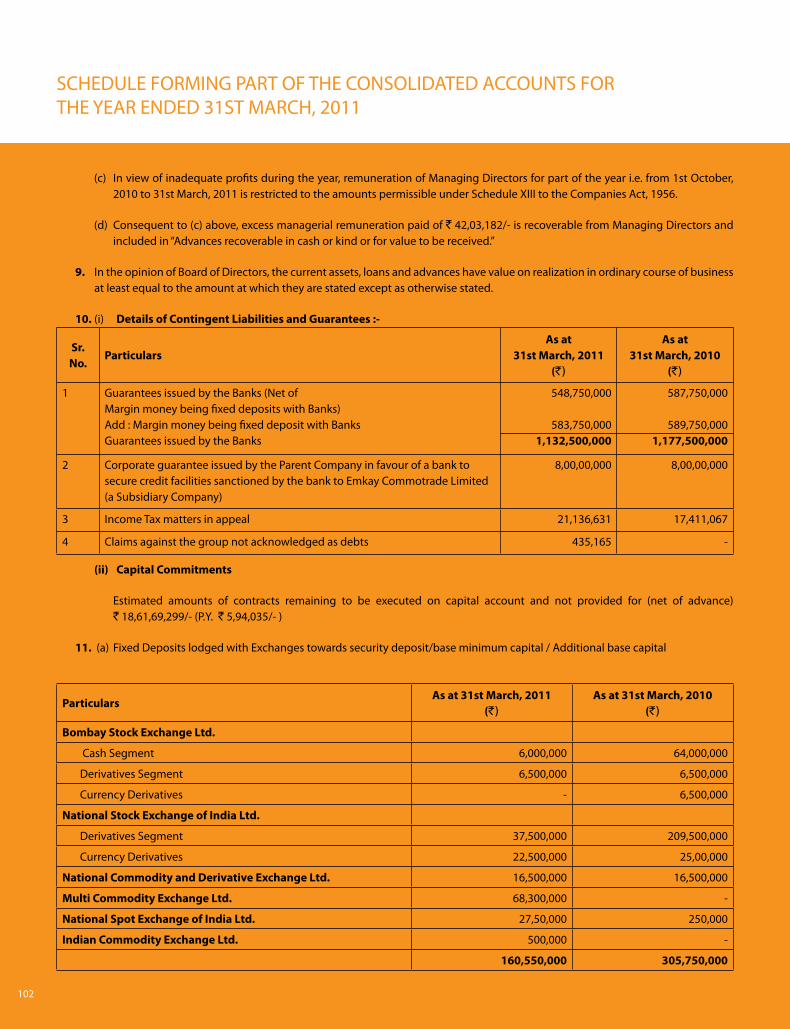
102
SCHEDULE FORMING PART OF THE CONSOLIDATED ACCOUNTS FOR THE YEAR ENDED 31ST MARCH, 2011
(c) In view of inadequate profits during the year, remuneration of Managing Directors for part of the year i.e. from 1st October, 2010 to 31st March, 2011 is restricted to the amounts permissible under Schedule XIII to the Companies Act, 1956.
(d) Consequent to (c) above, excess managerial remuneration paid of ` 42,03,182/- is recoverable from Managing Directors and included in “Advances recoverable in cash or kind or for value to be received.”
9. In the opinion of Board of Directors, the current assets, loans and advances have value on realization in ordinary course of business at least equal to the amount at which they are stated except as otherwise stated.
10. (i) Details of Contingent Liabilities and Guarantees :-
Sr. No.
ParticularsAs at
31st March, 2011 (`)
As at 31st March, 2010
(`)
1
Guarantees issued by the Banks (Net of Margin money being fixed deposits with Banks)Add : Margin money being fixed deposit with BanksGuarantees issued by the Banks
548,750,000
583,750,0001,132,500,000
587,750,000
589,750,0001,177,500,000
2 Corporate guarantee issued by the Parent Company in favour of a bank to secure credit facilities sanctioned by the bank to Emkay Commotrade Limited (a Subsidiary Company)
8,00,00,000 8,00,00,000
3 Income Tax matters in appeal 21,136,631 17,411,067
4 Claims against the group not acknowledged as debts 435,165 -
(ii) Capital Commitments
Estimated amounts of contracts remaining to be executed on capital account and not provided for (net of advance) ` 18,61,69,299/- (P.Y. ` 5,94,035/- )
11. (a) Fixed Deposits lodged with Exchanges towards security deposit/base minimum capital / Additional base capital
ParticularsAs at 31st March, 2011
(`)As at 31st March, 2010
(`)
Bombay Stock Exchange Ltd.
Cash Segment 6,000,000 64,000,000
Derivatives Segment 6,500,000 6,500,000
Currency Derivatives - 6,500,000
National Stock Exchange of India Ltd.
Derivatives Segment 37,500,000 209,500,000
Currency Derivatives 22,500,000 25,00,000
National Commodity and Derivative Exchange Ltd. 16,500,000 16,500,000
Multi Commodity Exchange Ltd. 68,300,000 -
National Spot Exchange of India Ltd. 27,50,000 250,000
Indian Commodity Exchange Ltd. 500,000 -
160,550,000 305,750,000

103
SCHEDULE FORMING PART OF THE CONSOLIDATED ACCOUNTS FOR THE YEAR ENDED 31ST MARCH, 2011
(b) Shares (i) received from clients/ Remisiers/ Sub-brokers as collateral for margins/ security deposits, (ii) of clients, withheld against their outstanding balances, are held by the Parent Company and a subsidiary in its own name in a fiduciary capacity. Depending upon business needs, some of these shares are either lodged with the exchanges towards additional base capital/ exposure and /or pledged to others towards borrowings.
(c) Fixed Deposits taken out from banks by the clients in the name of Parent Company and a subsidiary company as collateral for their margin requirements are lien marked directly in favor of exchanges through their custodians and are utilized towards additional base capital/ exposure/ margin requirements of the respective Company.
12. Fixed Deposits with Banks of ` 26,86,50,000/- (P.Y. ` 33,12,50,000/-) have been pledged with Banks against short term loans/ overdraft facilities.
13. Miscellaneous Expenses includes Foreign Exchange Rate Difference of ` 41,607/- (P.Y. ` 26,043/-).
14. Special Reserve is created by transferring twenty percent of net profit for the year under review in accordance with provisions of Section 45-IC of the Reserve Bank of India Act, 1934 in case of Emkay Fincap Limited , a Non Banking Finance Subsidiary.
15. Expenses and income includes ` 80,681/- (P.Y. ` 1,01,15,625/-) and ` 2,86,763/- (P.Y. ` Nil/- ) respectively pertaining to earlier years.
16. Sundry Debtors include ` 8,69,689/- (P.Y. ` 3,54,870/-) due from Managing Directors of Parent company.
17. Other liabilities includes ` 15,07,309/- (P.Y. ` 17,78,088/-) being aggregate amount of deposits in group’s bank accounts made directly by clients whose details are awaited. The liabilities are properly adjusted on receipt of information from branches.
18. During the financial year, the parent company has received claims/complaints aggregating to ` 127.82 Lacs from clients with respect to their accounts. The Management do not expect any liability from these claims/complaints. However, liability if any, shall be provided at the appropriate time.
19. Assets taken on Operating Leases (on and after 1st April, 2003) :-
(a) The Parent Company and its subsidiaries have taken various commercial premises under operating leases. These lease arrangement are normally renewable on expiry. The rental expenses in respect of above operating leases was ` 6,52,19,138/- (P.Y. ` 6,55,33,580/-).
(b) The future minimum lease payments in respect of non-cancellable operating leases are as follows:
ParticularsYear Ended
31st March, 2011 (`)
Year Ended 31st March, 2010
(`)
a) Payments not later than one year 22,418,610 27,370,302
b) Payable later than one year and not later than five years 17,826,778 682,742
c) Payable later than five years - -
Total 40,245,388 28,053,044

104
SCHEDULE FORMING PART OF THE CONSOLIDATED ACCOUNTS FOR THE YEAR ENDED 31ST MARCH, 2011
20. Earnings per share
ParticularsYear Ended
31st March, 2011 (`)
Year Ended 31st March, 2010
(`)
Profit available for Equity Shareholders (`) 11,84,29,213 9,39,96,638
Weighted average number of Shares used inComputing Basic earning per share
24,408,990 24,296,247
Add : Potential number of Equity share that Could arise on exercise of Employee Stock Options
2,95,559 2,41,393
Weighted average number of Shares used in Computing Diluted earning per share
24,704,549 24,537,640
Nominal Value of Equity Shares (`) 10 10
Basic Earnings Per Share (`) 4.85 3.87
Diluted Earnings Per Share (`) 4.79 3.83
21. Segment information
(a) Primary Segment
The Group’s operations relate to two reportable business segments namely “Advisory and Transactional Services” comprising of Broking & Distribution, Investment Banking and other related Financial Intermediation Services and “Non Banking Financing Activities”.
(b) Secondary Segment
The Group operates in India and hence there are no reportable geographical segments.
(c) Information about Business Segments
Particulars
Advisory and Transactional
Services
Non Banking Financing
Activities
Eliminations
Consolidated for
the year ended
31st March, 2011
Consolidated for
the year ended
31st March, 2010
Current
Year
Previous
Year
Current
Year
Previous
Year
Current
Year
Previous
Year
(`) (`) (`) (`) (`) (`) (`) (`)
A. REVENUE
1aIncome from External Clients
1,141,426,819 1,116,855,460 29,242,937 22,997,828 - - 1,170,669,756 1,139,853,288
1bIncome from Interseg-ment Operations
79,200 222,263 2,630 143,015 (81,830) (365,278) - -
Total Revenue 1,141,506,019 1,117,077,723 29,245,567 23,140,843 (81,830) (365,278) 1,170,669,756 1,139,853,288

105
SCHEDULE FORMING PART OF THE CONSOLIDATED ACCOUNTS FOR THE YEAR ENDED 31ST MARCH, 2011
Sr. No.
Particulars
Advisory and Transactional
Services
Non Banking Financing
Activities
Eliminations Consolidated for
the year ended
31st March,
2011
Consolidated for
the year ended
31st March,
2010Current
Year
Previous
Year
Current
Year
Previous
Year
Current
Year
Previous
Year
(`) (`) (`) (`) (`) (`) (`) (`)
B. RESULTS
1 Segment Results(PBIT) 163,961,429 141,119,915 21,853,931 7,377,033 - - 185,815,360 148,496,948
2 Interest Expense 15,635,491 15,199,528
3 Unallocated Income 12,350,861 16,773,499
4 Profit from Ordinary Activities 182,530,730 150,070,919
5 Exceptional Items: - -
6 Profit Before Tax 182,530,730 150,070,919
7 Provision for Current Tax 56,700,000 71,985,000
8 Deferred Tax Charge/(Benefit) 6,455,186 (16,315,297)
9 Wealth Tax 64,600 -
10 Tax Provision of Earlier Years 881,731 404,578
11 Profit After Tax 118,429,213 93,996,638
12 Less:- Minority Interest - -
13 Net Profit 118,429,213 93,996,638
C. OTHER INFORMATION:
1 Segment Assets 2,098,942,020 2,126,936,633 271,771,058 196,610,594 - - 2,370,713,078 2,323,547,227
2 Unallocated Corporate Assets 181,364,326 284,313,933
3 Total Assets 2,552,077,404 2,607,861,160
4 Segment Liabilities 1,034,570,974 1,028,299,250 1,473,476 2,085,443 - - 1,036,044,450 1,030,384,693
5 Unallocated Corporate Liabilities 64,600 -
6 Total Liabilities 1,036,109,050 1,030,384,693
7Capital Expenditure (Including Capital Work in Progress)
248,323,619 22,476,396 - - - - 248,323,619 22,476,396
8 Depreciation & Amortiza-tion 39,397,478 47,206,958 14,414 80,355 - - 39,411,892 47,287,313
9 Unallocated Depreciation & Amortization - -
10 Total Depreciation & Amortization - - 39,411,892 47,287,313
11Non Cash Expenses Other than Depreciation & Amortization
33,083,506 41,701,656 1,759,600 6,864,775 - - 34,843,106 48,566,431

106
SCHEDULE FORMING PART OF THE CONSOLIDATED ACCOUNTS FOR THE YEAR ENDED 31ST MARCH, 2011
22. The break-up of Net Deferred Tax Asset as at 31st March, 2011 is as under:-
ParticularsAs at 31st March, 2011
(`)As at 31st March, 2010
(`)
Deferred tax assetsDifference between book and tax depreciationProvisionsLossesUnabsorbed DepreciationDisallowances
Deferred tax liability
Net Deferred Tax Assets
15,158,97531,618,610 9,789,880
206,083123,693
13,619,22641,424,232
8,105,238171,585
32,146
56,897,241 63,352,427
- -
- -
56,897,241 63,352,427
23. Related Party Disclosures:( Where transactions have taken place)
(A) List of Related Parties:
Sr. No. Name of Related Party Nature of Relationship
1 Key management personnel/individuals having control or significant influencea) Krishna Kumar Karwa
b) Prakash Kacholia
Managing Director & CFO of Parent Company and Director in SubsidiariesManaging Director of Parent Company and Director in Subsidiaries
2 Relatives of key management personnela) Priti Karwab) Raunak Karwac) Soumya Karwad) Geetadevi Karwae) Murlidhar Karwa HUFf) Krishna Kumar Karwa HUFg) Preeti Kacholiah) Krishna R. Kacholiai) Deepak Kacholiaj) Prakash Kacholia HUF
Relatives of Managing Director & CFO of Parent Company
Relatives of Managing Director of Parent Company
3 Enterprises owned/ controlled by key management personnel or their relativesa) Cambridge Securitiesb) Synthetic Fibres Trading Companyc) Emkay Corporate Services Pvt. Ltd. d) Krishna Investments
Enterprises owned/ controlled by key management personnel or their relatives
4 Othersa) Emkay Employees Welfare Trust
Others

107
SCHEDULE FORMING PART OF THE CONSOLIDATED ACCOUNTS FOR THE YEAR ENDED 31ST MARCH, 2011
(B) Transactions with related parties:
Sr. No. Particulars
Key Management personnel/
Individuals having control or significant influence
Relatives of key management
personnel
Enterprises owned/con-trolled by key manage-ment personnel or their
relatives
Others
2010-2011 2009-2010 2010-2011 2009-2010 2010-2011 2009-2010 2010-2011 2009-2010
(`) (`) (`) (`) (`) (`) (`) (`)
1 Expenditure
(a) Salaries & Other Benefits
- Krishna Kumar Karwa 5,758,614 11,928,968 - - - - - -
- Prakash Kacholia 5,782,283 11,998,706 - - - - - -
Total 11,540,897 23,927,674 - - - - - -
(b) Sub-Brokerage
- Krishna Investment - - - - 661,261 499,961 - -
Total - - - - 661,261 499,961 - -
(c) Business Promotion Expenses - Krishna Investment - - - - 2,085 - - -
Total - - - - 2,085 - - -
(d) Contribution to Employee Welfare Trust- Emkay Employees Welfare Trust - - - - - - 10,000 -
Total - - - - - - 10,000 -
2 Income
(a) Brokerage
- Krishna Kumar Karwa 310,466 263,039 - - - - - -
- Prakash Kacholia 93,218 30,017 - - - - - -
- Preeti Kacholia - - 416,266 281,490 - - - -
- Krishna Kacholia - - 51,890 187,758 - - - -
- Priti Karwa - - 249,352 136,590 - - - -
- Raunak Karwa - - 134,261 128,986 - - - -
- Geeta Devi Karwa - - 87,676 53,145 - - - -
- Murlidhar Karwa HUF - - 36,659 18,421 - - - -
- Krishna Kumar Karwa HUF - - 81,505 48,064 - - - -
- Cambridge Securities - - - - 1,244 992 - - - Synthetic Fibre Trading Co. - - - - 306,778 199,565 - -
- Emkay Corporate Services Pvt.Ltd. - - - - 80,946 58,917 - -
- Emkay Employees Welfare Trust - - - - - - 31,000 -
Total 403,684 293,056 1,057,609 854,454 388,968 259,474 31,000 -
(b) Depository Charges
- Krishna Kumar Karwa 270 1,130 - - - - - -
- Prakash Kacholia 670 900 - - - - - -

108
SCHEDULE FORMING PART OF THE CONSOLIDATED ACCOUNTS FOR THE YEAR ENDED 31ST MARCH, 2011
Sr. No. Particulars
Key Management personnel/ Individuals
having control or significant influence
Relatives of key management
personnel
Enterprises owned/ controlled by key
management personnel or their relatives
Others
2010-2011 2009-2010 2010-2011 2009-2010 2010-2011 2009-2010 2010-2011 2009-2010
(`) (`) (`) (`) (`) (`) (`) (`)
- Preeti Kacholia - - 600 770 - - - -
- Krishna Kacholia - - 658 600 - - - -
- Priti Karwa - - 560 780 - - - -
- Geeta Devi Karwa - - 600 680 - - - -
- Murlidhar Karwa HUF - - 200 350 - - - -
- Krishna Kumar Karwa HUF - - 210 360 - - - -
- Prakash Kacholia HUF - - - 200 - - - -
- Cambridge Securities - - - - 804 430 - -
- Synthetic Fibre Trading Co. - - - - 350 270 - -
- Emkay Corporate Services Pvt. Ltd. - - - - 1,230 1,390 - -
Total 940 2,030 2,828 3,740 2,384 2,090 - -
(c) Portfolio Management Fees
- Krishna Kumar Karwa 760,483 810,445 - - - - - -
- Prakash Kacholia 27,894 38,472 - - - - - -
- Priti Karwa - - 339,572 262,380 - - - -
- Raunak Karwa - - 337,489 290,060 - - - -
- Geeta Devi Karwa - - - 190,664 - - - -
- Murlidhar Karwa HUF - - 65,781 63,798 - - - -
- Krishna Kumar Karwa HUF - - 169,004 189,658 - - - -
Total 788,377 848,917 911,846 996,560 - - - -
3 Expenses Recovered
- Krishna Investment - - - - 19,300 16,800 - -
- Cambridge Securities - - - - - 1,635 - -
Total - - - - 19,300 18,435 - -
4 Expenses Reimbursed
- Cambridge Securities - - - - - 2,819 - -
Total - - - - - 2,819 - -
5 Loans Given
- Emkay Employees Welfare Trust - - - - - - 53,100,000 -
Total - - - - - - 53,100,000 -
6 Outstandings
(a) Sundry Creditors
- Prakash Kacholia 498,507 275,266 - - - - - -
- Preeti Kacholia - - 1,541,475 626,615 - - - -
- Krishna Kacholia - - 293,140 311,287 - - - -
- Raunak Karwa - - 428,813 - - - - -
- Cambridge Securities - - - - - - - -

109
Sr. No. Particulars
Key Management personnel/ Individuals
having control or significant influence
Relatives of key management
personnel
Enterprises owned/ controlled by key
management personnel or their relatives
Others
2010-2011 2009-2010 2010-2011 2009-2010 2010-2011 2009-2010 2010-2011 2009-2010
(`) (`) (`) (`) (`) (`) (`) (`)
- Synthetic Fibre Trading Co. - - - - - 3,607,448 - -
- Emkay Corporate Services Pvt. Ltd.
- - - - - 1,363,434 - -
Total 498,507 275,266 2,263,429 937,902 - 4,970,882 - -
(b) Sundry Debtors
- Krishna Kumar Karwa 838,812 346,020 - - - - - -
- Prakash Kacholia 30,877 8,850 - - - - - -
- Preeti Kacholia - - - 381 - - - -
- Deepak Kacholia - - 9,258 9,258 - - - -
- Priti Karwa - - 374,548 104,188 - - - -
- Raunak Karwa - - 372,250 124,091 - - - -
- Geeta Devi Karwa - - - 76,307 - - - -
- Murlidhar Karwa HUF - - 72,557 25,978 - - - -
- Krishna Kumar Karwa HUF - - 186,411 76,658 - - - -
- Prakash Kacholia HUF - - - 220 - - - -
- Krishna Investments - - - - 1,132,493 1,326,205 - -
- Cambridge Securities - - - - - 11 - -
Total 869,689 354,870 1,015,024 417,081 1,132,493 1,326,216 - -
(c) Outstanding Expenses
- Krishna Kumar Karwa - 459,580 - - - - - -
- Prakash Kacholia - 459,580 - - - - - -
Total - 919,160 - - - - - -
(d) Loans
Emkay Employees Welfare Trust
- - - - - - 53,100,000 -
Total - - - - - - 53,100,000 -
(e)Security / Margin Deposits Received
- Krishna Investment - - - - 200,000 200,000 - -
Total - - - - 200,000 200,000 - -
(f)Managerial Remuneration Recoverable
- Krishna Kumar Karwa 2,080,163 - - - - - - -
- Prakash Kacholia 2,123,019 - - - - - - -
Total 4,203,182 - - - - - - -
SCHEDULE FORMING PART OF THE CONSOLIDATED ACCOUNTS FOR THE YEAR ENDED 31ST MARCH, 2011
* Contribution to Group Gratuity Scheme and Premium paid on Group Personal Accident Policy, Group Mediclaim Insurance Policy and Group Term Life Insurance Policy has not been considered, as employee-wise details are not available.
(C) Related Parties are identified by the management and relied upon by the auditors.
(D) No balances in respect of Related Parties have been written off.

110
SCHEDULE FORMING PART OF THE CONSOLIDATED ACCOUNTS FOR THE YEAR ENDED 31ST MARCH, 2011
24. Figures pertaining to the Subsidiary Companies have been reclassified wherever necessary to bring them in line with the Parent Company’s Financial Statements.
25. Figures in brackets indicates previous years figures.
26. Figures have been rounded off to the nearest rupees.
27. Schedule ‘A’ to ‘T’ forms an integral part of the Consolidated Financial Statements.
As per our report of even date By the order of the Board
For B.L. SARDA & ASSOCIATES G.P. GUPTA KRISHNA KUMAR KARWA PRAKASH KACHOLIA Chartered Accountants Chairman Managing Director & CFO Managing Director S.K.SABOO R.K.KRISHNAMURTHI G.C. VASUDEO Director Director Director
(B.L.SARDA)Partner RAHUL SAHASRABUDDHE Membership No. 014568 Company Secretary Place : Mumbai Place : MumbaiDate : 20th May, 2011 Date : 20th May, 2011

111
Sr. No.
ParticularsEmkay Fincap
Limited `
Emkay Commotrade
Limited
Emkay Insurance Brokers Limited
Emkay Investment Managers
Limited
(`) (`) (`) (`)
1 Capital 230,000,000 60,000,000 40,000,000 25,000,000
2 Reserves & P&L Balance- Cr/(Dr) 81,143,847 45,565,729 (23,465,275) 4,535,466
3 Total Assets 316,497,395 241,505,991 41,307,149 31,900,600
4 Total Liabilities 316,497,395 241,505,991 41,307,149 31,900,600
5 Investments 30,000,000 - - -
6 Gross Income 36,433,793 93,529,543 11,227,498 10,670,317
7 Profit/(Loss) Before Taxation 28,642,294 25,055,086 (6,133,232) 6,697,766
8Provision for Taxation (Current Year & Earlier Years)
9,719,203 10,121,253 - 2,300,000
9 Deferred Tax Charge / ( Benefit ) (406,622) (1,096,985) (1,718,807) (137,700)
10 Profit /(Loss) After Taxation 19,329,713 16,030,818 (4,414,425) 4,535,466
11 Proposed Dividend - - - -
1 Ministry of Company Affairs , Government of India New Delhi vide General Circular No.:5/12/2007-CL-III Dt:08/02/2011 has granted a general exemption U/s. 212(8) of the Companies Act, 1956, for not attaching the accounts of the subsidiaries of the Company. However, annual accounts of the Subsidiary Companies and the related detailed information will be made available to investors of the Company and the Subsidiaries of the Company seeking information at any point of time. The annual accounts of the Subsidiary Companies are available for inspection by any investor at the Registered Office of the Company and of the concerned Subsidiary of the Company.
For and on behalf of the Board of Directors
Krishna Kumar Karwa Prakash Kacholia Rahul Sahasrabuddhe Managing Director & CFO Managing Director Company Secretary
Place : Mumbai Date : 20th May, 2011
STATEMENT PURSUANT TO SECTION 212 (8) OF THE COMPANIES ACT, 1956, RELATING TO SUBSIDIARY COMPANIES

Emkay Global Financial Services LimitedParagon Centre, C-06, Ground Floor, Pandurang Budhkar Marg,Opp. Century Mills, Worli, Mumbai - 400 013.Tel: +91 22 66121212 www.emkayglobal.com
A W
YATT
SO
LUTI
ON
(inf
o@w
yatt
.co.
in)