sewage pollution in the coastal waters of mombasa city ...€¦ · 3 mombasa polytechnic...
TRANSCRIPT
Int. J. Environ. Res., 5(4):865-874, Autumn 2011ISSN: 1735-6865
Received 22 Nov. 2010; Revised 14 Feb. 2011; Accepted 3 March 2011
*Corresponding author E-mail: [email protected]
865
Sewage pollution in the Coastal waters of Mombasa City, Kenya:A norm Rather than an Exception
Okuku, E. O.1,2*, Ohowa, B.1, Mwangi, S. N.1,4, Munga, D.3, Kiteresi, L. I.1,Wanjeri, V. O.1, Okumu, S.1 and Kilonzo, J.1
1 Kenya Marine and Fisheries Research Institute, P.O. Box 81651, Mombasa, Kenya2 Soil and Water Management Division, Faculty of Bioscience Engineering, Katholike Universiteit
Leuven, Kasteelpark Arenberg 20, B-3001 Heverlee, Belgium3 Mombasa Polytechnic University, P.O. Box 90420- 80100, Mombasa, Kenya
4 University of Nairobi, P.O. Box 30197, G.P.O, Nairobi, Kenya
ABSTRACT:This study investigated the effects of sewage discharge on nutrient concentrations and BOD5
levels in the coastal waters and sediments ofthe City of Mombasa. The results indicated that nutrientconcentrations in Tudor, Mtwapa and Makupa Creeks were elevated as compared to concentrations in GaziCreek (mean ranges of 0.022-0.039mg/L, 0.038-0.163mg/L and 0.034-0.118mg/Lphosphates, nitrates andammonium respectively). Sediments were found to harbour relatively higher concentrations of nutrients thanwater compartment (mean ranges of 0.217-1.131mg/L, 0.199-0.603mg/L and 9.394-26.73mg/L for phosphates,nitrates and ammonium respectively) thus serving as a reservoir and potential source if sediments are re-suspended during heavy storms or dredging. Based on Chl-a levels, Makupa Creek could be classified aseutrophic whereas Mtwapa and Tudor Creeks could be placed at the upper limit of higher mesotrophy whileGazi Creekcould be considered as an oligotrophic system. Of the three impacted Creeks, Tudor was found tobe the most polluted.
Key words: Pollution, Nutrients, Eutrophication,Chlorophyll a, Sewage
INTRODUCTIONThe importance of marine resources is
acknowledged worldwide. Coastal fisheries play apivotal role in the livelihoods and cultures of manycoastal communities. More than one third of the world’spopulation live in the coastal zone which is just a narrowstrip constitutingonly 4% of the total land surface(UNEP, 2006). Rapid increase in population, foodproduction, urbanization and coastal development inmost of the world’s coastal regions are causing seriousenvironmental concerns such as marine pollution(Looser et al., 2000; Seitzinger et al., 2005; Bhatnagarand Sangwan, 2009). Clark and Attrill, (2001) identifiedoil, sewage, garbage, chemicals, radioactive waste, andthermal pollution as some of the common types ofpollution in marine ecosystems. Approximately 80% ofmarine pollution originates from land-based sourcesthat reach estuaries and coastal waters via non-point
runoff, direct deposit of waste and atmospheric fallout(GESAMP, 1990; Vijay et al., 2008; Li and Daler, 2004).Despite this significant contribution of land-basedactivitiesto coastal pollution, it has not been givenadequate attention (UNEP, 2006).
Most eutrophication and organic loadingproblems in coastal regions in the world are linked todischarge of sewage effluent and dumping of sewagesludge (Subramanian, 1999). Coastal ecosystems serveas receptors for industrial and municipal effluents(Clark, 1992; Palanisamy et al., 2007).Sewage can simplybe defined as a cocktail of waste from food preparation,dishwashing, garbage-grinding, toilets, baths, showersand sinks. It contains a wide variety of dissolved andsuspended materialsas well asdisease-causingmicroorganisms. When small quantities of sewage aredischarged into the ocean, a natural self-purificationprocess occurs. However, densely populated
866
Okuku, E. O. et al.
communities generate such large quantities of sewagethat dilution alone cannot avert pollution incidences.Sewage pollution has been identified as one of themost serious of all land-based threats to the marineenvironment and as an area where least progress hasbeen achieved (UNEP, 2006). Between 80-90% ofsewage is dischargedintothe coastal zones of manydeveloping countries untreated(UNEP, 2006). With thecurrent population level, man has the potential topollute every single waterway, ocean and drinkingwater supply with raw sewage if no urgent measuresare put in place.
Sewage-contaminated water introduces highlevels of nutrients which cause eutrophication inreceiving water bodies. Nitrates, phosphates andorganic matter found in human waste serve as food foralgae and bacteria. This makes these organisms torapidly increase in number to the point that they useup most of the dissolved oxygen that is naturally foundin water, making it difficult for other organisms in suchaquatic environments to live. It is a scenario of bacteriabasically “strangling” the other organisms. Moreover,biotic communities in sewage impacted environmentsare commonly exposed to a multitude of contaminants(Michael and Kennish, 1998) and disease-causingmicroorganisms. This situation puts human and wildlifehealth(Jenssen, 2003) as well as livelihoods (fromfisheries to tourism) at risk through reduction ofbiodiversity and productivity (López-Gappa et al.,1990;Hunter and Evans, 1995) and aesthetic andintrinsic value of the marine environmentespeciallywhen sewage discharge occurs into relatively shallowand sheltered coastal areas (as is the case in Kenya).Sewage discharge is one of the main sources of coastalwater pollution in Kenya. Mombasa city has only onesewage treatment facility which had previously stalledfor several years and is currently only working at 50%capacity after renovation works. This 50% capacitycan barely serve even 12% of the Mombasa Citypopulation leading to volumes of sewage beingdischarged either untreated or slightly treated.
The status of coastal water is an importantindicator of environmental quality in terms of pollutionload and related issues. The information on theseaspects is important for highlighting the need for urgentplanning and action in these areas. The objective ofthe present study was to assess the levels of sewagepollution and determine its effects and fate once it isdischarged into the Kenyan coastal waters.
MATERIALS & METHODSSampling was conducted during 2008-
2010sampling campaigns and covered both dry andwet seasons.Sampling sites were chosen to cover a
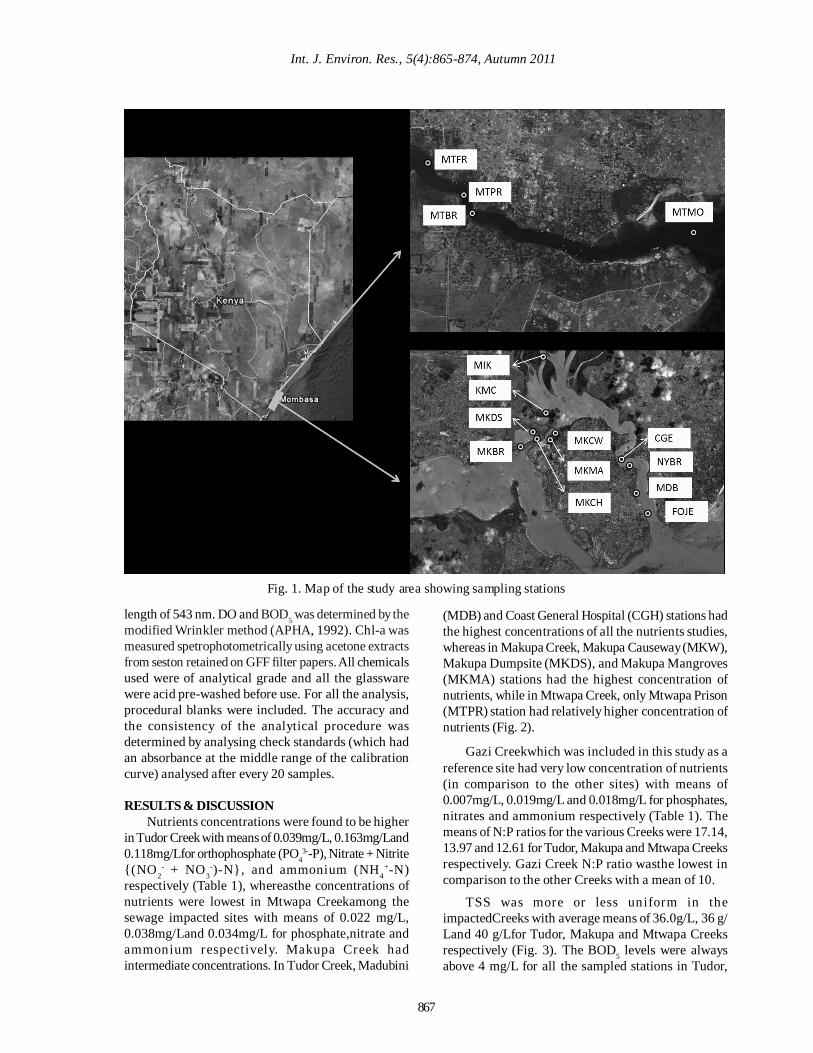
wide range of stations with different levels of sewageinputs. Three Mombasa Creeks (Tudor, Makupa andMtwapa)were sampled as impacted areas whereas GaziCreek(located more than 55 km from Mombasa City)was included in the study as a relatively pristine areato provide background concentrations (Fig. 1).According to this criteria, the sampling sites consideredin this study were Fort Jesus (FOJE), Madumbini(MDB), Coast General Hospital (CGH) Nyali Bridge(NYBR), Kenya Meat Commission slaughter (KMC)and Mikindani (MIK) in Tudor Creek; Makupa Bridge(MKBR), Makupa Causeway (MKCW), Makupamangroves (MKMA), Makupa Channel (MKCH)andMakupa Dumpsite (MKDS) in Makupa Creek; andMtwapa Ferry (MTFE), Mtwapa Bridge (MTBR),Mtwapa Prisons (MTPR) and Mtwapa Mouth (MTMO)in Mtwapa Creeks. In Gazi Creek, samples werecollected from old and new fish landing beaches.
From each sampling site, three replicate surfacewater samples for nutrients analysis were collected inpolyethylene bottles (prewashed in acid) and storedfrozen prior to analysis.Threereplicate water sampleswere taken in borosilicate bottles for 5 days BiologicalOxygen Demand (BOD5)and Dissolved Oxygen(DO)measurements. Chlorophyll a (Chl-a) samples werecollected from each site by filtering one litre of surfacewater on Glass Fibre Filters (GFF filters) under lowsuction. Three random sediment samples for nutrientsanalysiswere collected to a depth of 16 cm fromMakupa, Mtwapa and Gazi Creeks using plastic handcorers (Ø 8 cm) and extraneous material (such as debrisand stones) removed.Sediments samples weresectioned at the resolutionsof 0-2, 2-4, 4-8, 8-12 and12-16cm, placed in clean polythene zip bags and keptfrozen prior to analysis. Makupa and Mtwapa Creekswere chosen for sediments sampling to give differentdegrees of sewage impacts whereasGazi Creekwasincluded as a reference site.
The methods described by Parsons et al., (1984)and APHA, (1995) were used to analyse ammonium(NH4
+-N), Nitrate + Nitrite {(NO2- + NO3
-)-N}, andorthophosphate (PO4
3--P) in water samples andsediments.The extraction of nutrients from sedimentssamples was carried out following the proceduredescribed by USDA, (2004)which involved treatmentof samples with KCl, centrifugation and filtration usingGFFfilter papers. Orthophosphate was determinedusing ascorbic acid method and measuredcalorimetrically at a wavelength of 885 nm using UVvis spectrophotometer. Ammonium-N was determinedusing indophenol method and absorbance read at 630nm after at least six hours. Dissolved (nitrate andnitrite)-N was determined using cadmium reductionmethod and determined calorimetrically at a wave-
Int. J. Environ. Res., 5(4):865-874, Autumn 2011
867
Fig. 1. Map of the study area showing sampling stations
length of 543 nm. DO and BOD5 was determined by themodified Wrinkler method (APHA, 1992). Chl-a wasmeasured spetrophotometrically using acetone extractsfrom seston retained on GFF filter papers. All chemicalsused were of analytical grade and all the glasswarewere acid pre-washed before use. For all the analysis,procedural blanks were included. The accuracy andthe consistency of the analytical procedure wasdetermined by analysing check standards (which hadan absorbance at the middle range of the calibrationcurve) analysed after every 20 samples.
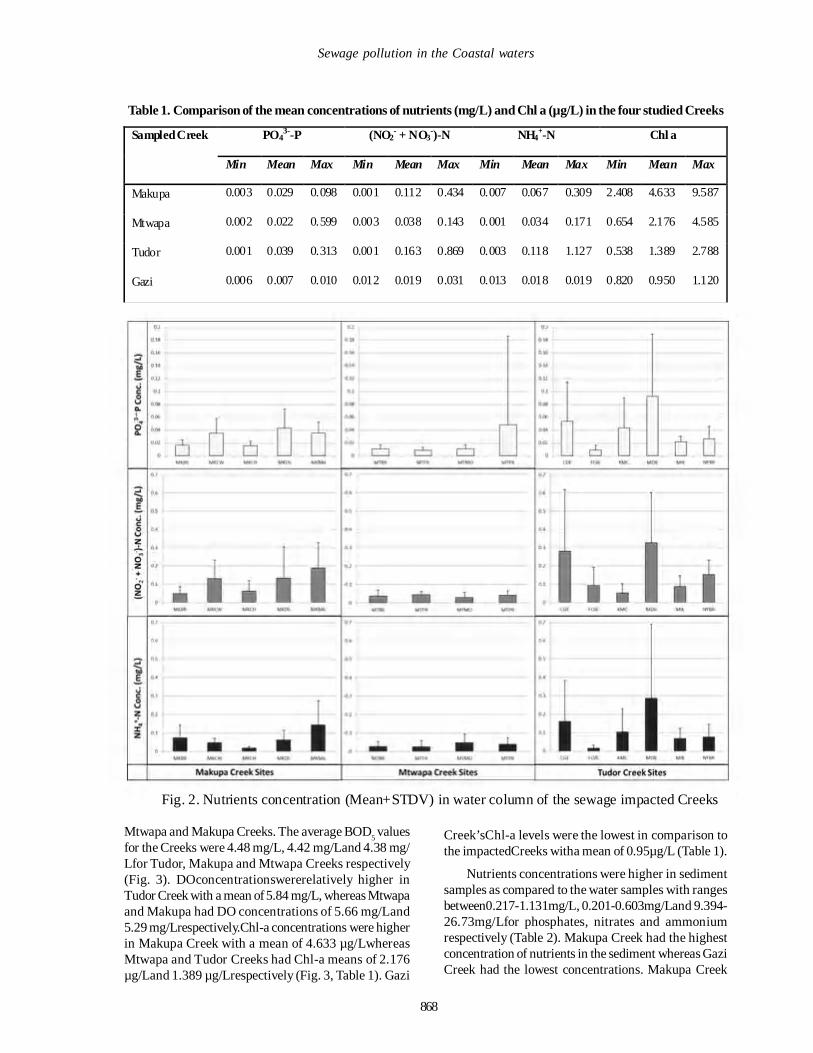
RESULTS & DISCUSSIONNutrients concentrations were found to be higher
in Tudor Creek with means of 0.039mg/L, 0.163mg/Land0.118mg/Lfor orthophosphate (PO4
3--P), Nitrate + Nitrite{(NO2
- + NO3-)-N}, and ammonium (NH4
+-N)respectively (Table 1), whereasthe concentrations ofnutrients were lowest in Mtwapa Creekamong thesewage impacted sites with means of 0.022 mg/L,0.038mg/Land 0.034mg/L for phosphate,nitrate andammonium respectively. Makupa Creek hadintermediate concentrations. In Tudor Creek, Madubini
(MDB) and Coast General Hospital (CGH) stations hadthe highest concentrations of all the nutrients studies,whereas in Makupa Creek, Makupa Causeway (MKW),Makupa Dumpsite (MKDS), and Makupa Mangroves(MKMA) stations had the highest concentration ofnutrients, while in Mtwapa Creek, only Mtwapa Prison(MTPR) station had relatively higher concentration ofnutrients (Fig. 2).
Gazi Creekwhich was included in this study as areference site had very low concentration of nutrients(in comparison to the other sites) with means of0.007mg/L, 0.019mg/L and 0.018mg/L for phosphates,nitrates and ammonium respectively (Table 1). Themeans of N:P ratios for the various Creeks were 17.14,13.97 and 12.61 for Tudor, Makupa and Mtwapa Creeksrespectively. Gazi Creek N:P ratio wasthe lowest incomparison to the other Creeks with a mean of 10.
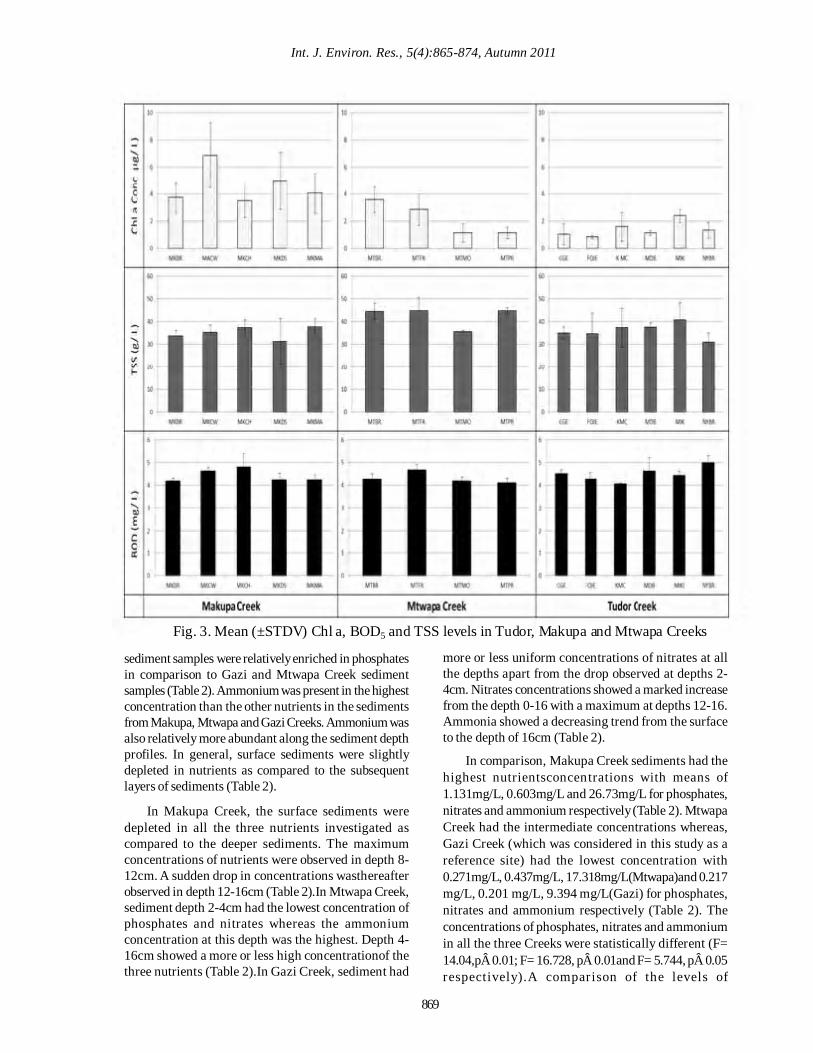
TSS was more or less uniform in theimpactedCreeks with average means of 36.0g/L, 36 g/Land 40 g/Lfor Tudor, Makupa and Mtwapa Creeksrespectively (Fig. 3). The BOD5 levels were alwaysabove 4 mg/L for all the sampled stations in Tudor,
868
Sewage pollution in the Coastal waters
Table 1. Comparison of the mean concentrations of nutrients (mg/L) and Chl a (µg/L) in the four studied Creeks
PO43--P (NO2
- + NO3-)-N NH4
+-N Chl a Sampled Creek
Min Mean Max Min Mean Max Min Mean Max Min Mean Max
Makupa 0.003 0.029 0.098 0.001 0.112 0.434 0.007 0.067 0.309 2.408 4.633 9.587
Mtwapa 0.002 0.022 0.599 0.003 0.038 0.143 0.001 0.034 0.171 0.654 2.176 4.585
Tudor 0.001 0.039 0.313 0.001 0.163 0.869 0.003 0.118 1.127 0.538 1.389 2.788
Gazi 0.006 0.007 0.010 0.012 0.019 0.031 0.013 0.018 0.019 0.820 0.950 1.120
Fig. 2. Nutrients concentration (Mean+STDV) in water column of the sewage impacted Creeks
Mtwapa and Makupa Creeks. The average BOD5 valuesfor the Creeks were 4.48 mg/L, 4.42 mg/Land 4.38 mg/Lfor Tudor, Makupa and Mtwapa Creeks respectively(Fig. 3). DOconcentrationswererelatively higher inTudor Creek with a mean of 5.84 mg/L, whereas Mtwapaand Makupa had DO concentrations of 5.66 mg/Land5.29 mg/Lrespectively.Chl-a concentrations were higherin Makupa Creek with a mean of 4.633 µg/LwhereasMtwapa and Tudor Creeks had Chl-a means of 2.176µg/Land 1.389 µg/Lrespectively (Fig. 3, Table 1). Gazi
Creek’sChl-a levels were the lowest in comparison tothe impactedCreeks witha mean of 0.95µg/L (Table 1).
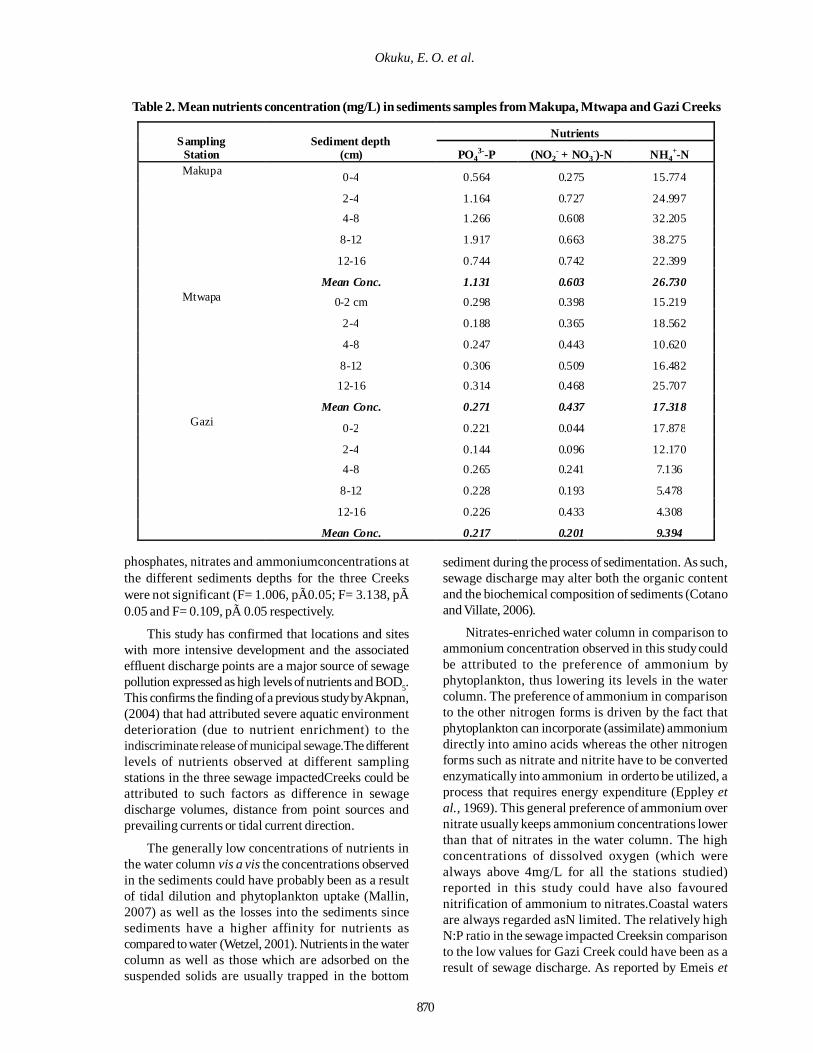
Nutrients concentrations were higher in sedimentsamples as compared to the water samples with rangesbetween0.217-1.131mg/L, 0.201-0.603mg/Land 9.394-26.73mg/Lfor phosphates, nitrates and ammoniumrespectively (Table 2). Makupa Creek had the highestconcentration of nutrients in the sediment whereas GaziCreek had the lowest concentrations. Makupa Creek
869
Int. J. Environ. Res., 5(4):865-874, Autumn 2011
sediment samples were relatively enriched in phosphatesin comparison to Gazi and Mtwapa Creek sedimentsamples (Table 2). Ammonium was present in the highestconcentration than the other nutrients in the sedimentsfrom Makupa, Mtwapa and Gazi Creeks. Ammonium wasalso relatively more abundant along the sediment depthprofiles. In general, surface sediments were slightlydepleted in nutrients as compared to the subsequentlayers of sediments (Table 2).
Fig. 3. Mean (±STDV) Chl a, BOD5 and TSS levels in Tudor, Makupa and Mtwapa Creeks
In Makupa Creek, the surface sediments weredepleted in all the three nutrients investigated ascompared to the deeper sediments. The maximumconcentrations of nutrients were observed in depth 8-12cm. A sudden drop in concentrations wasthereafterobserved in depth 12-16cm (Table 2).In Mtwapa Creek,sediment depth 2-4cm had the lowest concentration ofphosphates and nitrates whereas the ammoniumconcentration at this depth was the highest. Depth 4-16cm showed a more or less high concentrationof thethree nutrients (Table 2).In Gazi Creek, sediment had
more or less uniform concentrations of nitrates at allthe depths apart from the drop observed at depths 2-4cm. Nitrates concentrations showed a marked increasefrom the depth 0-16 with a maximum at depths 12-16.Ammonia showed a decreasing trend from the surfaceto the depth of 16cm (Table 2).
In comparison, Makupa Creek sediments had thehighest nutrientsconcentrations with means of1.131mg/L, 0.603mg/L and 26.73mg/L for phosphates,nitrates and ammonium respectively (Table 2). MtwapaCreek had the intermediate concentrations whereas,Gazi Creek (which was considered in this study as areference site) had the lowest concentration with0.271mg/L, 0.437mg/L, 17.318mg/L(Mtwapa)and 0.217mg/L, 0.201 mg/L, 9.394 mg/L(Gazi) for phosphates,nitrates and ammonium respectively (Table 2). Theconcentrations of phosphates, nitrates and ammoniumin all the three Creeks were statistically different (F=14.04,p 0.01; F= 16.728, p 0.01and F= 5.744, p 0.05respectively).A comparison of the levels of
870
sediment during the process of sedimentation. As such,sewage discharge may alter both the organic contentand the biochemical composition of sediments (Cotanoand Villate, 2006).
Nitrates-enriched water column in comparison toammonium concentration observed in this study couldbe attributed to the preference of ammonium byphytoplankton, thus lowering its levels in the watercolumn. The preference of ammonium in comparisonto the other nitrogen forms is driven by the fact thatphytoplankton can incorporate (assimilate) ammoniumdirectly into amino acids whereas the other nitrogenforms such as nitrate and nitrite have to be convertedenzymatically into ammonium in orderto be utilized, aprocess that requires energy expenditure (Eppley etal., 1969). This general preference of ammonium overnitrate usually keeps ammonium concentrations lowerthan that of nitrates in the water column. The highconcentrations of dissolved oxygen (which werealways above 4mg/L for all the stations studied)reported in this study could have also favourednitrification of ammonium to nitrates.Coastal watersare always regarded asN limited. The relatively highN:P ratio in the sewage impacted Creeksin comparisonto the low values for Gazi Creek could have been as aresult of sewage discharge. As reported by Emeis et
Okuku, E. O. et al.
phosphates, nitrates and ammoniumconcentrations atthe different sediments depths for the three Creekswere not significant (F= 1.006, pÃ0.05; F= 3.138, pÃ0.05 and F= 0.109, pà 0.05 respectively.
This study has confirmed that locations and siteswith more intensive development and the associatedeffluent discharge points are a major source of sewagepollution expressed as high levels of nutrients and BOD5.This confirms the finding of a previous study by Akpnan,(2004) that had attributed severe aquatic environmentdeterioration (due to nutrient enrichment) to theindiscriminate release of municipal sewage.The differentlevels of nutrients observed at different samplingstations in the three sewage impactedCreeks could beattributed to such factors as difference in sewagedischarge volumes, distance from point sources andprevailing currents or tidal current direction.
The generally low concentrations of nutrients inthe water column vis a vis the concentrations observedin the sediments could have probably been as a resultof tidal dilution and phytoplankton uptake (Mallin,2007) as well as the losses into the sediments sincesediments have a higher affinity for nutrients ascompared to water (Wetzel, 2001). Nutrients in the watercolumn as well as those which are adsorbed on thesuspended solids are usually trapped in the bottom
Table 2. Mean nutrients concentration (mg/L) in sediments samples from Makupa, Mtwapa and Gazi Creeks
Sampling Station
Sediment depth (cm)
Nutrients
PO43--P (NO2
- + NO3-)-N NH4
+-N Makupa 0-4 0.564 0.275 15.774
2-4 1.164 0.727 24.997
4-8 1.266 0.608 32.205
8-12 1.917 0.663 38.275
12-16 0.744 0.742 22.399
Mean Conc. 1.131 0.603 26.730 Mtwapa 0-2 cm 0.298 0.398 15.219
2-4 0.188 0.365 18.562
4-8 0.247 0.443 10.620
8-12 0.306 0.509 16.482
12-16 0.314 0.468 25.707
Mean Conc. 0.271 0.437 17.318 Gazi 0-2 0.221 0.044 17.878
2-4 0.144 0.096 12.170
4-8 0.265 0.241 7.136
8-12 0.228 0.193 5.478
12-16 0.226 0.433 4.308
Mean Conc. 0.217 0.201 9.394
871
Int. J. Environ. Res., 5(4):865-874, Autumn 2011
al., (2000), such an increase in N:P ratios could beindicative of increased anthropogenic input of nitrateand phosphate.
Naturally, phosphates are derived fromdecomposing organic matter and leaching ofphosphorus rich bedrock. The levels of phosphates inthe coastal waters are slowly rising due to increasingloading of human wastes, animal wastes, industrialwastes, and human disturbance of the land and itsvegetation. Worth noting are the high levels ofphosphates observed in the samples from sites adjacentto Madubini and Mtwapa Prison. These high levelscould be attributed to the kinds and quantities of soapsused in Mombasa old town and Mtwapa prison thatare densely populated. Goldman and Horne, (1983)observed that phosphate-containing detergents werethe major sources of soluble phosphates, contributingapproximately half the phosphates contained indomestic sewage.
Higher levels of Chl-a observed in Tudor, Makupaand Mtwapa Creeks as compared to Gazi Creek couldbe attributed to the high nutrients levels in thesesystems. Donnelly et al.,(1998) singled out phosphorusas a nutrient that can encourage the growth of nuisanceaquatic plants and can cause algal blooms. This issupported by this study that had mean phosphatesconcentration in the range of 0.022-0.039mg/L in thesewage impactedCreeks. The enhanced growth ofmicroalgae (high Chl a levels) observed in sewageimpacted Creeks furtherconfirm that Makupa, Tudorand Mtwapa Creeksareimpacted systems. This issupported by the work by Smith,(2006) which reportedthat nutrient control of eutrophication starts at the levelof primary producers, and a strong statistical responseof phytoplankton biomass to nutrient enrichment isevident in comparative analysis of worldwide coastalecosystems.
From the high concentration of nutrients and thelow TSS levels in TudorCreek as compared to Makupaand Mtwapa Creeks, it was expected that Tudor Creekwould have relativelyhigh levels of Chl-a than the othertwo sewage impacted Creeks. However, it was noticedthat TudorCreekinstead had the lowest Chl-a level. Thepossible explanation for this situation could beborrowed from the work by Li et al.,(2010)which notedthat changing nutrient concentrations at local scalesdo not always cause a change in phytoplanktonbiomass and that such changes may depend onsystem-specific attributes (e.g. water residence time)and complexity of biotic responses. Indeed MakupaCreeks is a semi- enclosed Creek with relatively highwater retention time as compared to Tudor and MtwapaCreeks and this could have led to flourishing ofphytoplankton communities in this Creek.
This study further identifiedsewage as the sourceof high nutrients concentrations by reporting elevatedmean concentrations of dissolved nutrients in waterand sediments from the sewage impacted sites incomparison to Gazi. Such high levels of nutrient levelshave been reported elsewhere to cause multiple anddetrimental effects on exposed organisms (Schlacheret al., 2007; Larsen and Webb, 2009 and Reopanichkuletal., 2009)) and can alter key structural and functionalattr ibutes of ecosystems that are affected bywastewater load (Reopanichkulet.al, 2010)as suchsewage could already be affecting or there is a possiblethreat to the ecosystem health.
High levels of nutrients in the sediments in thisstudy is not surprising given that nutrients often havea strong affinity for sedimentary particle surfaces andas such scavenging of nutrients by suspendedparticulate matter and subsequent sedimentation couldhave led to the high nutrients concentration with theresultantdeterioration in sediments’ quality (Gerritseet al., 1998). Even though sediment dating was notcarried out in this study, the high ammoniumconcentrations along the sediments core profilesclearly indicate that the impact of sewage on thesediments was an on-going activity long aftersedimentation. As reported elsewhere, the accumulatedsediments contain a repository of valuable historicalinformation on the temporal trend of pollutants inputinto aquatic ecosystems(Axelsson and El-Daoushy,1989). Future studies could consider dating ofsediments so that the temporal history of thesesystems (with regards to sewage pollution) could bediscerned.
The depletion of the surface sediment nutrientsconcentrations (as compared to the deep layers) couldbe attributed to an upward concentration gradientcreated by nutrients concentration in the water columnbeing below the equilibrium resulting into nutrientsloss from sediments to the overlying water column(Carl, 1989). The increase of phosphates with depthcould be attributed to the adsorption onto iron andmanganese oxides/hydroxides.
High concentrations of ammonium as comparedto nitrates in the sediments especially for Makupa andMtwapaCreeks is consistent with the findings of astudy done elsewhere by Mallin, (2007)which reportedthat stations impacted by sewage are usually anaerobicand as such the principal inorganic nitrogen form isammonium rather than nitrate. It was evident in thisstudy that denitrification was not probably a majorsink of N nutrients in the sewage impacted sedimentssince the bulk of the inorganic Nwasin the form ofammonium rather than nitrate (Wetzel,2001).Ammonium concentrations remained relatively
872
high with depth in the sediments from sewage impactedsediments (>15.219 mg/L), an indication of on-goingorganic matter remineralisation through the sedimentprofile. This clearly shows that the effects of sewagedischarge at a particular time take a number of years toclear from the ecosystem.
Sediments were found in this study to be shieldingMombasacoastal waters from excessive nutrientspollution. However, it should be notedthatsedimentswill not continue to accumulate nutrientsendlessly. When the loading is excessive (which isexpected soon with the growing population), thesedimentscould easily become saturated. Beyond thepoint of saturation, the concentration gradient ofnutrients in the overlying water and pore water isexpected to occur and this could expose the organismsto elevated concentrations.
Sewage pollution in the Coastal waters
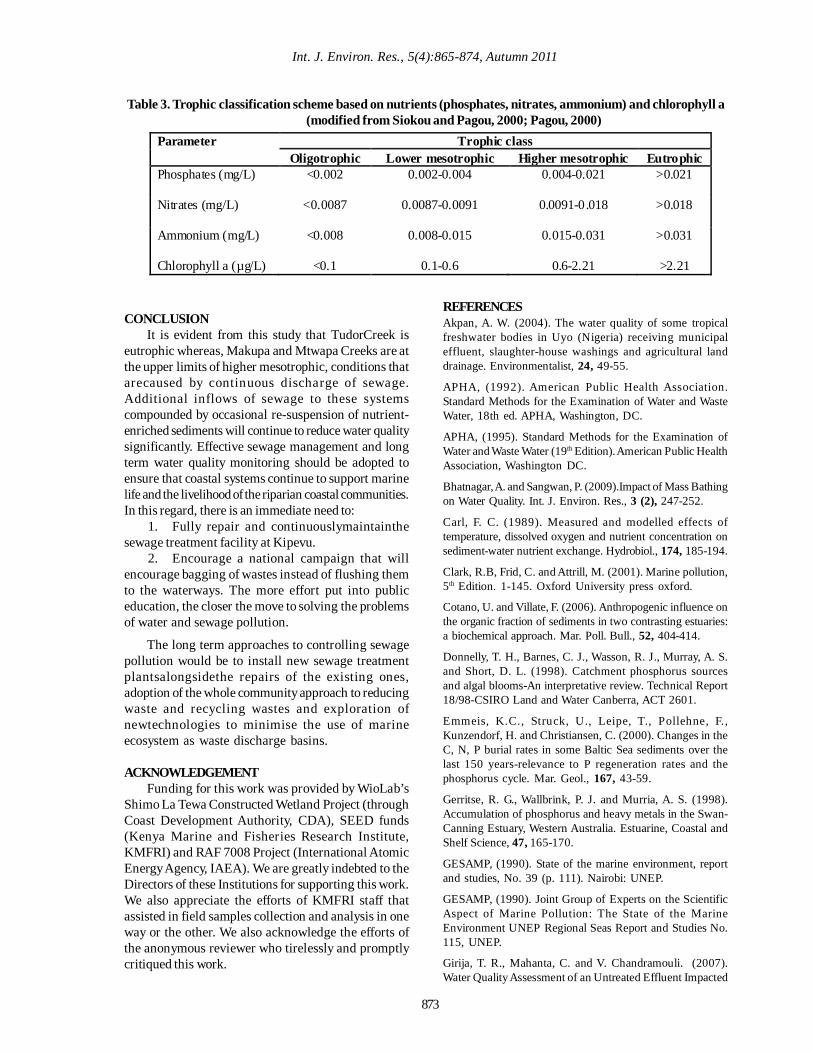
In general, phosphate enrichment was evident inTudor, Makupa and Mtwapa Creeks (with means above0.022 mg/L) as compared to Gazi Creek (with a mean of0.007 mg/L). Following the argument of Girija et al.,(2007) that watercourses with phosphorusconcentration exceeding 0.02 mg/L could be termedeutrophic, this study can confidently classify Tudor,Mtwapa and Makupa Creeks as eutrophic systems.This is further supported by trophic classificationscheme based on nutrients (Table 3) that classifies thethree sewage impacted Creeks as eutrophic whereasGazi Creek could be classified to be at the lower limit ofhigher mesotrophy.However, according to Hinga et al.,(1995),Chl-a is probably a better ‘instantaneous’indicator of trophic status than nutrient concentrationsbecause nutrient concentrations are easily affected bybiological uptake, which in turn is influenced by uptakecapabilities, interaction with grazers, temperature,turbulence and turbidity levels.For this study, theclassification scheme based on Chl a (Table 3) wastherefore adopted.
Based on Chl-a levels, Makupa Creek could beclassified as eutrophic, whereas Mtwapa and TudorCreeks could be placed at the upperlimits of highermesotrophy while Gazi Creekcould be classified asoligotrophic (Table 3). Further based on Chl-a dataand a scheme provided by Simbouraet al.,(2005),Makupa Creek could be classified as having badecological quality status (EQS), whereas Tudor andMtwapa have poor EQS while Gazi has high EQS.Trophic status correspondingto higher mesotrophiceutrophication conditions (poor EQS) is indicative ofsensitive ecosystems that could be eutrophic in thefuture if the increasing trend in eutrophicationparameters continues (Pagou et al., 2002). Highermesotrophy therefore serves as a red flag forecosystems that can potentially be threatened by future
human impacts. Bad EQS status corresponds toeutrophic level characterizing sensitive eutrophic areaswhereas oligotrophic systems (high EQS) arecharacterized by phytoplankton taxa composition andabundance that are consistent with undisturbedconditions (Simbouraet al., 2005).
The elevated concentrations of nutrients insewage impactedCreeks in comparison to Gazi Creektypically means that people from the impacted Creekscould be swimming in (and swallowing) some amountof raw sewage. In the fight against water pollution,sewage seems to be one of the easiest pollutants tocontrol in theory, but the hardest to deal with in practice.It is so absurd that human beings that pollute waterare the very people that are affected by that pollution.Unless the perception that only “things that go upcome down” changes and people become aware thateven “those things that go down the drains” comeback through bioaccumulated contaminants in seafoodand swallowing during swimming, then we are far fromwinning the fight against sewage pollution.
If the current trends of sewage discharge areallowed to continue, then the swimmers will continuebeing at an increased risk of contracting illness due tobacteria and viruses present in sewage effluent (i.e.gastrointestinal disorders, giardiasis, amoebicdysentery and cholera) and seafood will continue tobecontaminated thusincreasing consumers’ risk ofadverse health. Sewage contamination can also leadto high income lossesassociated with the closing offishing grounds and beaches which could impacttourism and fishing industry negatively resulting intoheavy economic loss for Kenya, a country that boastsof tourism as the second foreign exchange earner.
Even though the government clearlyunderstandsthe importance of treating raw sewage through acombination of physical, biological and chemicalprocesses to remove some or most of the pollutantsbefore discharge into the receiving body, the localauthority that is mandated to carry out such activitiesare heavily incapacitated by lack of the necessaryhuman, technical and financial capabilities to addressthe rising levels of sewage volumes.The role ofcontrolling sewage pollution should therefore not beleft to the local government alone for a simple reasonthat construction of sewage treatment facilities maynot be able to catch up with the increasing humanactivities. It is therefore vital that everyone recognizesraw sewage as one of our nastiest but solvable waterpollution issues. The cooperation of hotel owners,institutional and factory managers, local inhabitantsand wastewater treatment facilities’managers couldhelp reduce the threats of sewage pollution.
873
Int. J. Environ. Res., 5(4):865-874, Autumn 2011
Table 3. Trophic classification scheme based on nutrients (phosphates, nitrates, ammonium) and chlorophyll a(modified from Siokou and Pagou, 2000; Pagou, 2000)
Parameter Trophic classOligotrophic Lower mesotrophic Higher mesotrophic Eutrophic
Phosphates (mg/L)
<0.002 0.002-0.004 0.004-0.021 >0.021
Nitrates (mg/L)
<0.0087 0.0087-0.0091 0.0091-0.018 >0.018
Ammonium (mg/L)
<0.008 0.008-0.015 0.015-0.031 >0.031
Chlorophyll a (µg/L) <0.1 0.1-0.6 0.6-2.21 >2.21
CONCLUSIONIt is evident from this study that TudorCreek is
eutrophic whereas, Makupa and Mtwapa Creeks are atthe upper limits of higher mesotrophic, conditions thatarecaused by continuous discharge of sewage.Additional inflows of sewage to these systemscompounded by occasional re-suspension of nutrient-enriched sediments will continue to reduce water qualitysignificantly. Effective sewage management and longterm water quality monitoring should be adopted toensure that coastal systems continue to support marinelife and the livelihood of the riparian coastal communities.In this regard, there is an immediate need to: 1. Fully repair and continuouslymaintainthesewage treatment facility at Kipevu. 2. Encourage a national campaign that willencourage bagging of wastes instead of flushing themto the waterways. The more effort put into publiceducation, the closer the move to solving the problemsof water and sewage pollution.
The long term approaches to controlling sewagepollution would be to install new sewage treatmentplantsalongsidethe repairs of the existing ones,adoption of the whole community approach to reducingwaste and recycling wastes and exploration ofnewtechnologies to minimise the use of marineecosystem as waste discharge basins.
ACKNOWLEDGEMENTFunding for this work was provided by WioLab’s
Shimo La Tewa Constructed Wetland Project (throughCoast Development Authority, CDA), SEED funds(Kenya Marine and Fisheries Research Institute,KMFRI) and RAF 7008 Project (International AtomicEnergy Agency, IAEA). We are greatly indebted to theDirectors of these Institutions for supporting this work.We also appreciate the efforts of KMFRI staff thatassisted in field samples collection and analysis in oneway or the other. We also acknowledge the efforts ofthe anonymous reviewer who tirelessly and promptlycritiqued this work.
REFERENCESAkpan, A. W. (2004). The water quality of some tropicalfreshwater bodies in Uyo (Nigeria) receiving municipaleffluent, slaughter-house washings and agricultural landdrainage. Environmentalist, 24, 49-55.
APHA, (1992). American Public Health Association.Standard Methods for the Examination of Water and WasteWater, 18th ed. APHA, Washington, DC.
APHA, (1995). Standard Methods for the Examination ofWater and Waste Water (19th Edition). American Public HealthAssociation, Washington DC.
Bhatnagar, A. and Sangwan, P. (2009).Impact of Mass Bathingon Water Quality. Int. J. Environ. Res., 3 (2), 247-252.
Carl, F. C. (1989). Measured and modelled effects oftemperature, dissolved oxygen and nutrient concentration onsediment-water nutrient exchange. Hydrobiol., 174, 185-194.
Clark, R.B, Frid, C. and Attrill, M. (2001). Marine pollution,5th Edition. 1-145. Oxford University press oxford.
Cotano, U. and Villate, F. (2006). Anthropogenic influence onthe organic fraction of sediments in two contrasting estuaries:a biochemical approach. Mar. Poll. Bull., 52, 404-414.
Donnelly, T. H., Barnes, C. J., Wasson, R. J., Murray, A. S.and Short, D. L. (1998). Catchment phosphorus sourcesand algal blooms-An interpretative review. Technical Report18/98-CSIRO Land and Water Canberra, ACT 2601.
Emmeis, K.C., Struck, U., Leipe, T., Pollehne, F.,Kunzendorf, H. and Christiansen, C. (2000). Changes in theC, N, P burial rates in some Baltic Sea sediments over thelast 150 years-relevance to P regeneration rates and thephosphorus cycle. Mar. Geol., 167, 43-59.
Gerritse, R. G., Wallbrink, P. J. and Murria, A. S. (1998).Accumulation of phosphorus and heavy metals in the Swan-Canning Estuary, Western Australia. Estuarine, Coastal andShelf Science, 47, 165-170.
GESAMP, (1990). State of the marine environment, reportand studies, No. 39 (p. 111). Nairobi: UNEP.
GESAMP, (1990). Joint Group of Experts on the ScientificAspect of Marine Pollution: The State of the MarineEnvironment UNEP Regional Seas Report and Studies No.115, UNEP.
Girija, T. R., Mahanta, C. and V. Chandramouli. (2007).Water Quality Assessment of an Untreated Effluent Impacted
874
Urban Stream, The Bharalu Tributary of the BrahmaputraRiver, India. Environ. Monit. Assess., 130, 221-236.
Goldman, R. C. and Horne, J. A. (1983). Limnology. NewYork: McGraw-Hill Book.
Hinga, K.R., Jeon, H. and Lewis, N. F. (1995). Marineeutrophication review I: Quantifying the effects of nitrogenenrichment on phytoplankton in coastal ecosystems. NOAACoastal Ocean Office, Silver Spring, MD. 36p.
Hunter, C. and Evans, C. W. (1995). Coral reefs in KaneocheBay, Hawaii: two centuries of western influence and twodecades of data. Bulletin of Marine Science, 57, 501-515.
Jenssen, B. J. (2003). Marine pollution: the future challengeis to link human and wildlife studies - Guest Editorial.Environmental Health Perspectives, 111, A198.
Karou, J. (1992). The control of land-based sources of marinepollution: Recent international initiatives and prospects.Mar. Poll. Bull., 25, 80-81.
Larsen, M. C. and Webb, R. M. T. (2009). Potential effectsof runoff, fluvial sediment, and nutrient discharges on thecoral reefs of Puerto Rico. Journal of Coastal Research, 25(1), 189-208.
Li, D. and Dag D. (2004). Ocean Pollution from Land-basedSources: East China Sea, China. Ambio, 33, 107-113.
Li, W. K. W., Lewis, R. M. and Harrison, W. G. (2010).Multiscalarity of the Nutrient-Chlorophyll Relationship inCoastal Phytoplankton. Estuaries and Coasts, 33, 440-447.
Looser, R., Froescheis, O., Cailliet, G. M., Jarman, W. M.and Ballschmitter, K. (2000). The deep-sea as a final globalsink of semi volatile persistent organic pollutants? Part II:organochlorine pesticides in surface and deep-sea dwellingfish of the North Atlantic and South Atlantic and the MontereyBay Canyon (California). Chemosphere, 40, 661-670.
López-Gappa, J. J., Toblado, A. and Magaldi, N. H. (1990).Influence of sewage pollution on a rocky intertidalcommunity dominated by the mytilid Brachidontesrodriguezi. Mar. Ecol. Progress Series, 63, 163-175.
Mallin, M. A., Cahoon, L. B., Toothman, B. R., Parsons, D.C., McIver, M. R., Ortwine, M. L. and Harrington, R.N.(2007). Impacts of a raw sewage spill on water and sedimentquality in an urbanized estuary. Mar. Poll. Bull., 54, 81-88.
Michael, J. and Kennish, T. (1998). Pollution impacts onmarine biotic communities. Boca Raton, FL: CRC.
Nellemann, C. and Corcoran, E. (2006). Our precious coasts:marine pollution, climate change and the resilience of coastalecosystems. Arendal, Norway, UNEP/GRID-Arendal.
PAGOU, K. (2000). Assessment of the trophic conditionsin the Inner Thermaikos Gulf. Technical Report for theMinistry of Environment, Planning and Public Works,NCMR, Athens. 11pp.
Palanisamy, S., Neelamani, S., Yu-Hwan, A., Ligy, P. andGi-Hoon, H. (2007). Assessment of the levels of coastalmarine pollution of Chennai City, Southern India. WaterResources Management, 21, 1187-1206.
Parsons, T. R., Maita, Y. and Lalli, C. M. (1984). A manualof chemical and biological methods for seawater analysis.Pergamon Press. 173 pp.
Reopanichkul, P., Carter, R. W., Worachananant, S. andCrossland, C. J. (2010). Wastewater discharge degradescoastal waters and reef communities in southern Thailand.Marine Environmental Research, 69 (5), 287-296.
Reopanichkul, P., Schlacher, T., Carter, R. W. andWorachananant, S. (2009). Sewage impacts coral reefs atmultiple levels of ecological organization. Mar. Poll. Bull.,58, 1356-1362.
Schlacher, T. A., Stark, J. and Fischer, A. B. P. (2007).Evaluation of artificial light regimes and substrate types foraquaria propagation of the staghorn coral Acroporasolitaryensis. Aquaculture, 269, 278-289.
Seitzinger, S. P., Harrison, J. A., Dumont, E., Beusen, A. H.W. and Bouman, A. F. (2005). Sources and delivery of carbon,nitrogen, and phosphorus to the coastal zone: an overviewof Global Nutrient Export from Watersheds (NEWS) modelsand their application. Global Biogeochem. Cycles, 19, 1-2.
Simboura, N., Panayotidis, P. and Papathanassiou, E.(2005). A synthesis of the biological quality elements forthe implementation of the European Water FrameworkDirective in the Mediterranean Ecoregion: The case ofSaronikos Gulf. Ecological Indicators, 5, 253-266.
Siokou-Frangou, I. and Pagou, K. (2000). Assessment of thetrophic conditions and ecological status in the InnerSaronikos Gulf. Technical Report for the Ministry ofEnvironment, Planning and Public Works, NCMR, Athens.43pp.
Smith, V. H. (2006). Responses of estuarine and coastal marinephytoplankton to nitrogen and phosphorus enrichment.Limnology and Oceanography, 511 (2), 377-384.
Subramanian, B. R. (1999). Status of marine pollution ofIndia. In Proceeding of Indo-British integrated coastal zonemanagement training short-course conducted by Institutefor Ocean Management, Anna University.
UNEP, (2006). The state of the marine environment-trendsand processes. United Nations Environment Programme andthe Global Programme of Action for the Protection of theMarine Environment from Land-based Activities (GPA) ofthe United Nations Environment Programme (UNEP), TheHague. 52 p.
USSD, (2004). Soil survey laboratory methods manual.Rebecca Burt, Eds. Soil Survey Investigations Report, 42,735.
Vijay, R., Sardar, V. K., Dhage, S. S., Kelkar, P. S. and Gupta,A. (2010). Hydrodynamic assessment of sewage impact onwater quality of Malad Creek, Mumbai, India.Environ.Monit. Assess., 165, 559-571.
Wetzel, R. G. (2001). Limnology, Lake and River Ecosystems.Academic Press, San Diego, 1006 pp., third ed.
Williams, C. (1996). Combating marine pollution from land-based activities: Australian initiatives. Ocean and Coastalmanagement, 33, 87-112.
Okuku, E. O. et al.