sewer master plan update - home | city of white rockservices/documents/sewer... · prepared by:...
TRANSCRIPT

Prepared by: AECOM
3292 Production Way, Floor 4 604 444 6400 tel
Burnaby, BC, Canada V5A 4R4 604 294 8597 fax
www.aecom.com
Project Number:
60238740 Date:
January 7, 2013
Water Resources
City of White Rock
Sewer Master Plan Update Final Report

AECOM City of White Rock Sewer Master Plan Update
AECOM: 2012-01-06 © 2009-2012 AECOM Canada Ltd. All Rights Reserved. WR Sewermp_Final Updated Jan7.Docx

AECOM City of White Rock Sewer Master Plan Update
AECOM: 2012-01-06 © 2009-2012 AECOM Canada Ltd. All Rights Reserved. WR Sewermp_Final Updated Jan7.Docx
Statement of Qualifications and Limitations The attached Report (the “Report”) has been prepared by AECOM Canada Ltd. (“Consultant”) for the benefit of The City of White Rock (“Client”) in accordance with the agreement between Consultant and Client, including the scope of work detailed therein (the “Agreement”). The information, data, recommendations and conclusions contained in the Report (collectively, the “Information”):
is subject to the scope, schedule, and other constraints and limitations in the Agreement and the qualifications contained in the Report (the “Limitations”);
represents Consultant’s professional judgement in light of the Limitations and industry standards for the preparation of similar reports;
may be based on information provided to Consultant which has not been independently verified;
has not been updated since the date of issuance of the Report and its accuracy is limited to the time period and circumstances in which it was collected, processed, made or issued;
must be read as a whole and sections thereof should not be read out of such context;
was prepared for the specific purposes described in the Report and the Agreement; and
in the case of subsurface, environmental or geotechnical conditions, may be based on limited testing and on the assumption that such conditions are uniform and not variable either geographically or over time.
Consultant shall be entitled to rely upon the accuracy and completeness of information that was provided to it and has no obligation to update such information. Consultant accepts no responsibility for any events or circumstances that may have occurred since the date on which the Report was prepared and, in the case of subsurface, environmental or geotechnical conditions, is not responsible for any variability in such conditions, geographically or over time. Consultant agrees that the Report represents its professional judgement as described above and that the Information has been prepared for the specific purpose and use described in the Report and the Agreement, but Consultant makes no other representations, or any guarantees or warranties whatsoever, whether express or implied, with respect to the Report, the Information or any part thereof. Without in any way limiting the generality of the foregoing, any estimates or opinions regarding probable construction costs or construction schedule provided by Consultant represent Consultant’s professional judgement in light of its experience and the knowledge and information available to it at the time of preparation. Since Consultant has no control over market or economic conditions, prices for construction labour, equipment or materials or bidding procedures, Consultant, its directors, officers and employees are not able to, nor do they, make any representations, warranties or guarantees whatsoever, whether express or implied, with respect to such estimates or opinions, or their variance from actual construction costs or schedules, and accept no responsibility for any loss or damage arising therefrom or in any way related thereto. Persons relying on such estimates or opinions do so at their own risk. Except (1) as agreed to in writing by Consultant and Client; (2) as required by-law; or (3) to the extent used by governmental reviewing agencies for the purpose of obtaining permits or approvals, the Report and the Information may be used and relied upon only by Client. Consultant accepts no responsibility, and denies any liability whatsoever, to parties other than Client who may obtain access to the Report or the Information for any injury, loss or damage suffered by such parties arising from their use of, reliance upon, or decisions or actions based on the Report or any of the Information (“improper use of the Report”), except to the extent those parties have obtained the prior written consent of Consultant to use and rely upon the Report and the Information. Any injury, loss or damages arising from improper use of the Report shall be borne by the party making such use.

AECOM City of White Rock Sewer Master Plan Update
AECOM: 2012-01-06 © 2009-2012 AECOM Canada Ltd. All Rights Reserved. WR Sewermp_Final Updated Jan7.Docx

AECOM
3292 Production Way, Floor 4 604 444 6400 tel
Burnaby, BC, Canada V5A 4R4 604 294 8597 fax
www.aecom.com
WR Sewermp_Final Updated Jan7.Docx
January 7, 2013 Mr. Greg St. Louis, P.Eng. Director of Engineering and Municipal Operations City of White Rock Operations Department 877 Keil Street White Rock, BC V4B 4V6 Dear Mr. St. Louis: Project No: 60238740
Regarding: City of White Rock Sewer Master Plan Update Revised Final Report Submission Sincerely, AECOM Canada Ltd. Please find enclosed our Final Report for the Sewer Master Plan Update and updated 10-Year Capital Plan for the City of White Rock. This report includes all comments received from the City on September 17, 2012 by e-mail as well as additional comments from our meeting with City staff on October 9. We have enjoyed working with City Staff on this project and we look forward to providing continued services to the City of White Rock. If you have any questions or concerns please don’t hesitate to contact us at 604.444.6400. Sincerely, AECOM Canada Ltd. Stephen Bridger, P.Eng. Project Manager
Encl.
cc:

AECOM City of White Rock Sewer Master Plan Update
WR Sewermp_Final Updated Jan7.Docx

AECOM City of White Rock Sewer Master Plan Update
WR Sewermp_Final Updated Jan7.Docx
Distribution List
# of Hard Copies PDF Required Association / Company Name
3 Yes City of White Rock
Revision Log Revision # Revised By Date Issue / Revision Description
0 Stephen Bridger June 27, 2012 Draft Report
1 Stephen Bridger Aug 10, 2012 Final Report
2 Stephen Bridger Jan 7, 2013 Revised Final Report
AECOM Signatures
Report Prepared By:
Chris O’Donnell, EIT
Project Engineer
Report Reviewed By:
Stephen Bridger, P. Eng.
Project Manager

AECOM City of White Rock Sewer Master Plan Update
WR Sewermp_Final Updated Jan7.Docx
Executive Summary The City of White Rock retained AECOM to complete a Sewer Master Plan (SMP) Update including a 10-Year Capital Plan for planning and budgeting purposes. The City is home to approximately 19,240 people and covers an area of approximately 473 hectares. Existing land use in the City is predominantly low density residential with pockets of medium density residential land use and the commercial core is the Town Centre Area. Development in the form of densification is occurring as now townhouses and apartments are planned for construction, with the bulk of the development occurring in the Town Centre and North Bluff Areas. The future 2031 population is projected to be 23,500 based on the 2008 OCP and timing of development activity is dependent on market conditions. In addition, commercial development is anticipated to increase as opportunities arise in the Town Centre and the residential population increases. There is also incremental redevelopment and infill activity in areas outside of the Town Centre that will be ongoing. Prior to this document, the City had completed an assessment and Capital Plan for the sanitary sewer system in 2005 (Sanitary Sewer Model, Update and Capital Plan report by KWL) that was updated in 2010. The 2005 & 2010 reports were based on the 100-Year peak hour inflow and infiltration (I&I) rates developed using the Envelope Method that result in conservative flow estimates and subsequent recommended upgrades. In development of the new SMP, our analysis focused on a review of the I&I rates and recommendation of new rates to be applied for determination of system upgrades to meet existing system requirements and future population growth. In addition, a new hydraulic model was developed using XPSWMM that reflects current land use conditions and the future build out of the OCP. The hydraulic model incorporates all new infrastructure and was used to assess future land use changes for development of the updated Capital Plan. In terms of existing sanitary sewer infrastructure there are approximately 82 km of sewers that collect sewage from 10 major catchment areas and three City sanitary pump stations (Keil, Ash and Bergstrom) that pump to the Metro Vancouver Pump Station at the foot of Oxford Street. Linear sewer infrastructure includes gravity pipes ranging in diameter from 150 to 600 mm, forcemain ranging from 100 to 150 mm and the siphon ranging from 450 to 525 mm. Sewer pipe materials include asbestos cement, PVC, HDPE and clay pipe. The SMP report includes a summary of the existing information reviewed, details on the model development, model calibration and validation, I&I analysis, sanitary infrastructure assessment, and recommended improvements included in the City’s Capital Plan. As noted above, the major sanitary sewer upgrades included in the previous Capital Plan were designed for conveyance of the 100-Year Peak Hour I&I rates and to reduce the potential for sanitary sewer overflow (SSO) occurrence at the Metro Vancouver PS and elsewhere in the collection system. One of the most significant changes for the updated Master Plan is the use of a 50-Year event as opposed to 100-Year event that was previously used. Although the 50-Year event is less conservative, it was determined to be more realistic and achievable for White Rock given the limited tax base available for implementation or large scale capital projects. The 50-Year return period was also determined to be an acceptable frequency that one may anticipate localized sewer backup to occur balanced with financial capital cost for system upgrades compared to larger events. This change is further rationalized given that Metro Vancouver’s documented I&I target is for the 5-Year return period event (or 11,200 L/Ha/day) and there was no anecdotal evidence of reported overflows within the last 5 years from either the City or Metro Vancouver. A major upgrade that was proposed in the previous Capital Plan included a new diversion (from Johnston Street to Thrift Avenue) and pump station at Oxford Street and Thrift Avenue that would be tied into the Metro Vancouver forcemain on Oxford Street. The diversion and pump station were intended to reduce flows to the Metro Vancouver Pump Station as it is currently undersized for future flow conditions. Several challenges were presented with siting of a new pump station at Oxford and Thrift included the tie-in to an aging AC MV forcemain, utility relocations, and provisions for overflows requiring connections to the gravity sewer system. The forcemain connection issue also
AECOM City of White Rock Sewer Master Plan Update
WR Sewermp_Final Updated Jan7.Docx
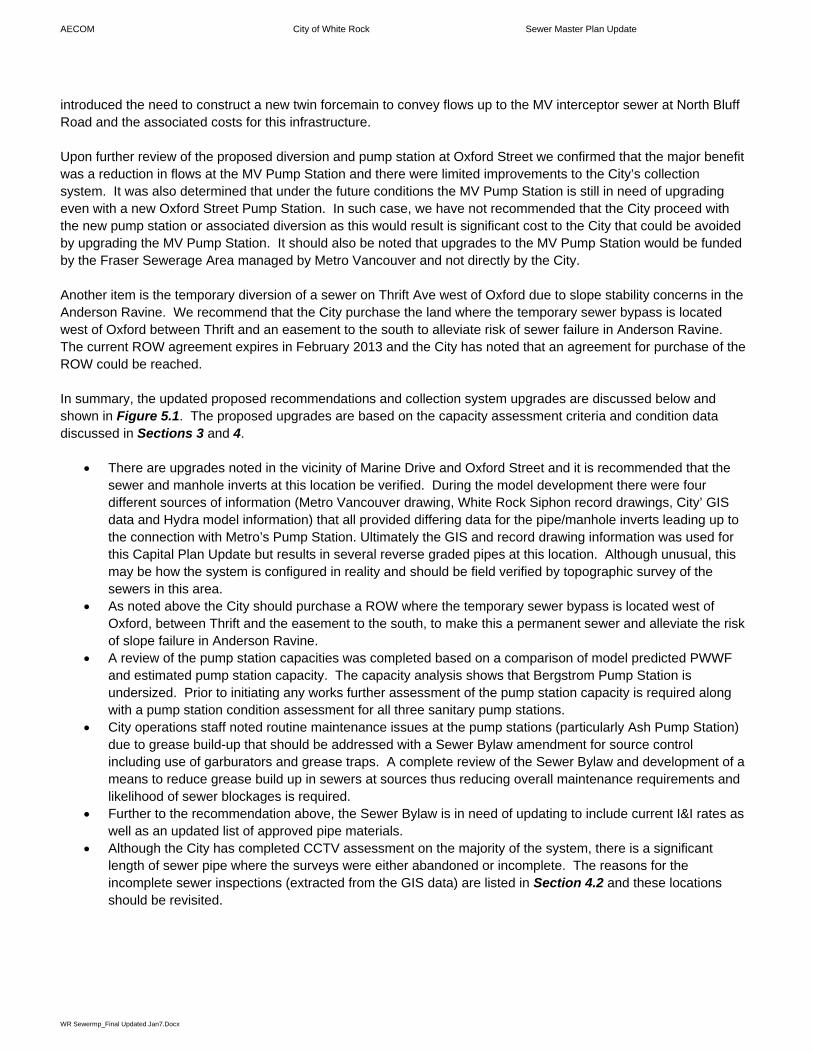
introduced the need to construct a new twin forcemain to convey flows up to the MV interceptor sewer at North Bluff Road and the associated costs for this infrastructure. Upon further review of the proposed diversion and pump station at Oxford Street we confirmed that the major benefit was a reduction in flows at the MV Pump Station and there were limited improvements to the City’s collection system. It was also determined that under the future conditions the MV Pump Station is still in need of upgrading even with a new Oxford Street Pump Station. In such case, we have not recommended that the City proceed with the new pump station or associated diversion as this would result is significant cost to the City that could be avoided by upgrading the MV Pump Station. It should also be noted that upgrades to the MV Pump Station would be funded by the Fraser Sewerage Area managed by Metro Vancouver and not directly by the City. Another item is the temporary diversion of a sewer on Thrift Ave west of Oxford due to slope stability concerns in the Anderson Ravine. We recommend that the City purchase the land where the temporary sewer bypass is located west of Oxford between Thrift and an easement to the south to alleviate risk of sewer failure in Anderson Ravine. The current ROW agreement expires in February 2013 and the City has noted that an agreement for purchase of the ROW could be reached. In summary, the updated proposed recommendations and collection system upgrades are discussed below and shown in Figure 5.1. The proposed upgrades are based on the capacity assessment criteria and condition data discussed in Sections 3 and 4.
There are upgrades noted in the vicinity of Marine Drive and Oxford Street and it is recommended that the sewer and manhole inverts at this location be verified. During the model development there were four different sources of information (Metro Vancouver drawing, White Rock Siphon record drawings, City’ GIS data and Hydra model information) that all provided differing data for the pipe/manhole inverts leading up to the connection with Metro’s Pump Station. Ultimately the GIS and record drawing information was used for this Capital Plan Update but results in several reverse graded pipes at this location. Although unusual, this may be how the system is configured in reality and should be field verified by topographic survey of the sewers in this area.
As noted above the City should purchase a ROW where the temporary sewer bypass is located west of Oxford, between Thrift and the easement to the south, to make this a permanent sewer and alleviate the risk of slope failure in Anderson Ravine.
A review of the pump station capacities was completed based on a comparison of model predicted PWWF and estimated pump station capacity. The capacity analysis shows that Bergstrom Pump Station is undersized. Prior to initiating any works further assessment of the pump station capacity is required along with a pump station condition assessment for all three sanitary pump stations.
City operations staff noted routine maintenance issues at the pump stations (particularly Ash Pump Station) due to grease build-up that should be addressed with a Sewer Bylaw amendment for source control including use of garburators and grease traps. A complete review of the Sewer Bylaw and development of a means to reduce grease build up in sewers at sources thus reducing overall maintenance requirements and likelihood of sewer blockages is required.
Further to the recommendation above, the Sewer Bylaw is in need of updating to include current I&I rates as well as an updated list of approved pipe materials.
Although the City has completed CCTV assessment on the majority of the system, there is a significant length of sewer pipe where the surveys were either abandoned or incomplete. The reasons for the incomplete sewer inspections (extracted from the GIS data) are listed in Section 4.2 and these locations should be revisited.

AECOM City of White Rock Sewer Master Plan Update
WR Sewermp_Final Updated Jan7.Docx
There are a significant number of sewers with an internal condition grade (ICG) of 3 or 4 and most of these have been highlighted for rehabilitation in this SMP report along with several point repairs for sewers with holes or major joint displacements. The City should re-CCTV all proposed locations prior to any works.
The City should conduct condition assessment on approximately 10% or 8 km of sewers each year. The results of the CCTV inspections should be reviewed by a qualified consultant to determine the rehabilitation works required and priority that they should be completed in. In addition to sewers, the manholes should also be inspected for both structural and service defects.
Operation and maintenance of the Siphon could be enhanced by reinstating the water level monitor for the siphon at Maple Street and Victoria Ave. An operations manual for the Siphon was completed back in 2000 when the project was completed and this document should be reviewed to assess what maintenance measures are in place and could be improved upon.
A summary of the total expenditure for capital improvements per year is provided in Table E.1 below.
Table E.1 Summary of Capital Plan
Year Approximate Length to
be Replaced (m) Cost Estimate
2013* 1,349 $ 1,645,800
2014 685 $ 878,400
2015 406 $ 588,000
2016 612 $ 820,900
2017 602 $ 684,500
2018 ‐ 2023 854 $ 2,509,300
Total 4,507 $ 7,126,900
* 2013 upgrades include works on Marine Drive from High Street to Bishop Road
Figure 6.1 shows the proposed sanitary upgrades based on the year required and a detail breakdown of the proposed capital improvements for each year is shown in Table 6.3.

AECOM City of White Rock Sewer Master Plan Update
WR Sewermp_Final Updated Jan7.Docx
Table of Contents Statement of Qualifications and Limitations Letter of Transmittal Distribution List Executive Summary
page
1 Introduction ..................................................................................................................................... 1
1.1 Overview .............................................................................................................................................. 1 1.2 Key Issues & Objectives ...................................................................................................................... 2 1.3 Key Terms and Abbreviations ............................................................................................................. 3
2 Model Development and Calibration ............................................................................................. 4
2.1 GIS Data Review ................................................................................................................................. 4 2.2 Model Software Review and Selection ................................................................................................ 5 2.3 Existing Sewer Infrastructure ............................................................................................................... 7 2.4 Flow Monitoring Data ........................................................................................................................... 8 2.5 Sewage Flow Generation .................................................................................................................... 9 2.6 Model Calibration and Validation ....................................................................................................... 12 2.7 Inflow and Infiltration Analysis ........................................................................................................... 15
3 Hydraulic Analysis ........................................................................................................................ 16
3.1 Design Criteria ................................................................................................................................... 16 3.2 Existing and Future Land Use ........................................................................................................... 16 3.3 System Capacity Assessment ........................................................................................................... 17
4 Sewer Condition Assessment ..................................................................................................... 19
4.1 Aging Infrastructure ........................................................................................................................... 19 4.2 Condition Assessment ....................................................................................................................... 20
5 Recommendations ........................................................................................................................ 22
5.1 Comparison with Previous Recommendations .................................................................................. 22 5.2 Summary of Recommendations ........................................................................................................ 23
6 10-Year Capital Plan ..................................................................................................................... 25

AECOM City of White Rock Sewer Master Plan Update
WR Sewermp_Final Updated Jan7.Docx
List of Tables
Table 1.1 Key Terms/Abbreviations
Table 2.1 Software Review Key Findings
Table 2.2 Sanitary Sewer Diameters
Table 2.3 Sanitary Sewer Materials
Table 2.4 Sanitary Pump Stations
Table 2.5 Summary of Temporary Flow Meter Sites
Table 2.6 Dry Weather Flow Summary
Table 2.7 Calibration and Validation Summary
Table 2.8 Summary of RDII rates per Return Period
Table 3.1 Sewer Capacity Summary
Table 3.2 Number of Surcharged MHs
Table 3.3 Sewer Forcemain Velocity Summary
Table 3.4 Sanitary Pump Station Capacity
Table 4.1 Summary of Pipe Year of Installation
Table 4.2 Estimated life Cycle of Sewer Based on Material Type Only
Table 4.3 Summary of Trenchless Point Repair Locations
Table 6.1 Unit Costs for Upgrades
Table 6.2 Summary of Capital Plan
Table 6.3 Details of 10-Year Capital Plan
List of Figures
Figure 1.1 City of White Rock Study Area
Figure 2.1 Sanitary Sewer Catchment Areas
Figure 2.2 Existing Sanitary Sewer System
Figure 2.3 Flow Monitor Locations
Figure 2.4 Diurnal Pattern - Residential
Figure 2.5 RTK Parameter Description
Figure 2.6 Model Calibrated R-Values
Figure 3.1 OCP Land Use
Figure 3.2 Exiting System with OCP & 50-Year 2-Hour I&I Event
Figure 4.1 Existing Sanitary Sewer Year of Installation
Figure 4.2 Incomplete/Abandoned CCTV Assessments
Figure 4.3 Sanitary Sewer Recommended Rehabilitation Works
Figure 5.1 Proposed Upgrades for Capacity
Figure 6.1 Capital Projects
Appendices
Appendix A Dry and Wet Weather Model Calibration and Validation Appendix B RDII Estimation Graphs

Sewer Master Plan Update
WR Sewermp_Final Updated Jan7.Docx 1
1 Introduction
1.1 Overview
The City of White Rock retained AECOM to complete a Sewer Master Plan (SMP) including an updated 10-Year Capital Plan for budgeting purposes. Prior to this document, the City had completed an assessment and Capital Plan for the sanitary sewer system in 2005 (Sanitary Sewer Model, Update and Capital Plan report by KWL) that was updated in 2010. The 2005 & 2010 reports were based on the 100-Year peak hour inflow and infiltration (I&I) rates developed using the Envelope Method which results in conservative flow estimates and subsequent recommended upgrades. In development of the new SMP, our analysis focused on a review of the I&I rates and recommendation of new rates to be applied for determination of the updated Capital Plan to meet existing system requirements and future population growth. According to the 2011 Census data and the current Official Community Plan (OCP), White Rock is home to approximately 19,240 people and expected to grow to 23,500 people by 2031. The City covers an area of approximately 473 hectares and is bound by Semiahmoo Bay to the south and the City of Surrey to the west, north and east as shown in Figure 1.1. In terms of sanitary sewer infrastructure there are approximately 82 km of sanitary sewers that collect sewage from 10 major catchment areas and three City sanitary pump stations (Keil, Ash and Bergstrom) that pump to the Metro Vancouver Pump Station at the foot of Oxford Street. Linear sewer infrastructure includes gravity pipes ranging in diameter from 150 to 600 mm, forcemain ranging from 100 to 150 mm and the siphon ranging from 450 to 525 mm. Sewer pipe materials include asbestos cement, PVC, HDPE and clay pipe. Over the last 10 years, the City has completed a number of sewer condition assessment and rehabilitation projects including CCTV investigations, smoke testing, point repairs, pipe lining, lateral connection investigation, and sewer replacement. A review of all the sewer rehabilitation works completed since 2001 is presented in the Audit of Sanitary Rehabilitation Program (KWL 2011) report. In addition to providing a comprehensive summary of the rehabilitation projects and I&I analysis already completed, one of the primary objectives for the audit of the sewer rehabilitation program was to provide documentation for meeting Metro Vancouver’s Integrated Liquid Waste and Resource Management Plan (ILWRMP) requirements. The updated SMP was required to review recommendations provided in the previous studies and convert the hydraulic model from HYDRA to a new software package. A review of available hydraulic modelling software was completed and XPSWMM was selected for use based on its capabilities and for consistency with the current drainage model. In such case, a city-wide hydro-dynamic XPSWMM model was developed to reflect current land use conditions and full build out of the OCP. The new hydraulic model incorporates newly constructed infrastructure and was used to assess future land use changes to assist with development of a new Capital Plan. The SMP includes a summary of the existing information reviewed, details on the model development, model calibration and validation, I&I analysis, sanitary infrastructure assessment, and recommended improvements to be included in the City’s Capital Plan.

City of Surrey
City of White Rock
Sewer Master Plan Update
Figure 1.1
Project No. Date
60238740 June 2012
q
0 200 400 600 800100
Meters
City of White RockStudy Area
BE
RG
ST
RO
M R
D
BIS
HO
P R
D
THRIFT AVE
OX
FO
RD
ST
FIN
LA
Y S
T
STA
YT
E R
D
MARINE DR
NORTH BLUFF RD
BUENA VISTA AVE
Legend
City Boundary

Sewer Master Plan Update
WR Sewermp_Final Updated Jan7.Docx 2
1.2 Key Issues & Objectives
This SMP is in-line with the City’s OCP goals for achieving appropriate levels of services and infrastructure improvements to accommodate growth and preventing adverse impacts on health, property and the environment. To achieve these goals, the SMP outlines a phased Capital Plan for sanitary sewer infrastructure improvements and replacement that is within the current budget expenditures. Current development within the City includes densification of mixed use residential and commercial areas in and around the Town Centre Area (including North Bluff East and West areas and the Johnston Road area) as well as lot subdivision or amalgamation for re-development into smaller single family homes or townhouse infill type developments. The 2031 population is predicted to be 23,500 which is an increase of 22%. In summary, the main objectives of this Sanitary Master Plan are as follows:
Review existing and background information; Develop an updated hydraulic model of the City’s entire sanitary sewer system using XPSWMM; Calibrate the model to “existing conditions/populations” using dry and wet weather flow data, then validate
the model; Develop sanitary flow projections for the OCP land use and population; Identify I&I rates across the City in accordance with the ILWRMP; Assess the hydraulic capacity of the sewer system for future conditions; Assess condition of existing sanitary infrastructure and provide a plan for a continued CCTV condition
assessment program; and Develop a Capital Plan for the City using a phased approach for short, medium, and long term projects.

Sewer Master Plan Update
WR Sewermp_Final Updated Jan7.Docx 3
1.3 Key Terms and Abbreviations
Presented in Table 1.1 is a list of key terms and abbreviations along with their definitions.
Table 1.1 – Key Terms/Abbreviations
Term Definition
Average Dry Weather Flow (ADWF)
Lowest 24-hour average sanitary flow during a 7-day period of dry weather. ADWF is base sanitary flow plus groundwater infiltration (ADWF = BSF + GWI).
Base Sanitary Flow (BSF)
All wastewater flow from residential, commercial, industrial and institutional sources that the sanitary sewer system is intended to carry. (BSF = ADWF – GWI)
Diurnal Pattern Pattern describing the variance in sewage flows over a day.
Fraser Sewer Area (FSA) Metro Vancouver’s catchment area / boundary that identifies all properties that are permitted to discharge sewage to the Regional System.
Groundwater Infiltration (GWI)
Groundwater infiltration that enters the sanitary sewer system during dry weather periods; through breaks, cracks, misaligned joints, tree root punctures and manhole joints and covers. In general, GWI = 70 - 85% of minimum night-time flow.
Hydraulic Grade Line (HGL)
The maximum level of water in the pipe system, calculated as the height that liquid will rise in a piezometer using the Bernoulli’s Equation.
Inflow Stormwater that enters the sewer through direct connections (i.e. CB leads or roof drains connected to the sanitary sewer).
Inflow and Infiltration (I&I) The total inflow and infiltration that enters the sanitary sewer system from all sources, equal to GWI + RDII.
Internal Condition Grade (ICG)
The internal condition grade ranges from 1 (good) to 5 (bad) for structural or service condition of sewers
Peak Dry Weather Flow (PDWF)
Peak instantaneous sanitary flow value during dry weather conditions (peak of the diurnally varying BSF plus normal GWI).
Peak Wet Weather Flow (PWWF)
Maximum instantaneous sanitary flow value. It represents all flow contributions carried by the sanitary sewer system (equals PDWF + RDII).
Rain Dependent Inflow and Infiltration (RDII)
All stormwater inflow (see above) into the sanitary sewer system plus increase in GWI that occurs directly due to the influence of rainfall.
RTK A synthetic unit hydrograph technique used by XPSWMM to quantify and simulate RDII. The R parameter is the fraction of rainfall volume entering the sewer system as RDII, T is the time to peak, and K is the recession time/ratio.
Sanitary Sewer Overflow (SSO)
Non-frequent occurrence when sewage backs-up, surcharges and overflows from the municipal sewer system.

Sewer Master Plan Update
WR Sewermp_Final Updated Jan7.Docx 4
2 Model Development and Calibration
This section provides a summary of the existing sanitary system, GIS data review, model software review and selection, flow monitoring data, sewage flow generation, model calibration and validation and design criteria (including I&I rates). GIS data was provided by the City’s GIS department and included shapefiles for the sanitary system, cadastral information for the lots and streets, as well as existing and future land use information. The previous sanitary sewer model was also provided but was developed using HYDRA software which is not well supported any longer nor commonly used by Municipalities in the Lower Mainland. Information extracted from the old model was limited to the pipe/MH network information as the sewer loading information from the old model was out of date given that it was based on 2001 Census information.
2.1 GIS Data Review
A review of the sanitary system GIS data was completed to identify any “data gaps” that needed to be rectified prior to development of the XPSWMM hydraulic model. A few of the GIS data gaps that were noted include the following items:
0.3 % of pipes were listed in GIS with no diameters and for these pipes we obtained information from the old HYDRA model data or inferred from upstream and downstream sewers,
4.3 % the pipes do not have an entry for the pipe age or installation date which was assumed to similar to adjacent sewers, and
pipe inverts were incorrect for a few pipes and new inverts were inferred from connecting sewers or ground elevations.
As-built drawings were also reviewed to collect information for pipes recently constructed and not yet in the GIS database and this information was entered into the hydraulic model. Model connectivity gaps were reviewed using connectivity tools available in XPSWMM to ensure all pipes are connected to manholes. For all new conduits the pipe diameters, lengths, and slopes were reviewed in GIS prior to importing into the model as well as any connectivity gaps such as:
Upstream and downstream pipe inverts being cross-referenced or switched; Manholes not connected to any pipe or pipe not having an assigned upstream/downstream manhole ID; Manhole inverts above the pipe invert; and Manhole inverts above the ground elevation.
Once the GIS data gaps were resolved, the sanitary network attributes were imported into XPSWMM. Data imported into the model included pipe ID, diameter, pipe inverts, length and material type, manhole ID, inverts, rim elevations and “X-Y” coordinates.

Sewer Master Plan Update
WR Sewermp_Final Updated Jan7.Docx 5
2.2 Model Software Review and Selection
The City of White Rock was previously using HYDRA software for the sanitary sewer model and is currently using an XPSWMM model for drainage master planning. With the development of the SWMM 5.0 engine by the USEPA there are a number of SWMM based programs now on the market (EPA SWMM, XP SWMM, PCSWMM, InfoSWMM) that offer more flexibility and superior hydraulic capabilities and accuracy over HYDRA. A SWMM based model is more applicable for the City of White Rock when considering the complex hydraulics resulting from steep sewers draining to flat sewers on Marine Drive, the Marine Drive siphon, pump stations, diversion manholes and overflows. The software review and evaluation process is an informative process that includes input from our hydraulic engineering specialists and City Staff to ensure the selected software meets the City’s immediate and long-term requirements. The software review considered the following fundamental model elements:
hydraulic capability and accuracy; graphics (interface and result output); GIS integration; cost (initial purchase & annual support); user friendliness (how easy is it to use); and what other local Cities are using.
During the evaluation each software platform was ranked based on the various categories and assigned weighting parameters depending on the importance of each one. The four main software vendors in the North American market are XP-Software, Innovyze, Bently and DHI (excluding the freeware EPA-SWMM) and there are 7 sanitary sewer software packages as listed shown in Table 2.1. InfoSEWER and HYDRA have limited hydraulic capability as they have difficulty in modelling hydraulics at pump stations, forcemains, flow diversions and storage systems, therefore these two are not recommended for the City as they move forward and continue to experience growth and development. The remaining 5 packages are all “equally proficient” however they vary in cost, GIS compatibility, user friendliness, run-time speed, hydraulic accuracy and flow generation. Table 2.1 is a summary of the key software selection findings. Although DHI’s Mike Urban is ranked No. 1 overall we are recommending the City continue to use XPSWMM. There are several reasons for this recommendation:
The drainage model is already in XPSWMM and operates well; XPSWMM is commonly used by City’s and consultants in the Lower Mainland area, and there are
numerous land development consultants who perform work in the City; Hydraulic engine can be run with either EPA SWMM5 or the full St. Venant dynamic equations that are
applicable to conditions in White Rock for effects of storage and backwater in conduits; and Relatively low cost compared to its peers for initial license cost as well as annual maintenance.
There are limitations to XPSWMM as noted in the disadvantages which can be overcome. The GIS integration can be achieved using the ODCB database import function and with XPSWMM 2011 they have increased the GIS capability. Simulation run times are long but not unreasonable compared to its peers. Similarly for exporting output data, inevitably there is some data manipulation required in Excel and GIS to generate presentable figures; however, this is not usually completed by City staff as it is generally prepared by consultants when updating the Master Plan document.

Sewer Master Plan Update
WR Sewermp_Final Updated Jan7.Docx 6
Table 2.1 – Software Review Key Findings
Vendor Software Rank Key Advantages Key Disadvantages
Inn
ovy
ze
InfoSEWER 9
Easy to use Poor hydraulics (cannot model backwater)
Good integration with GIS Poor sanitary flow generation (i.e. Excel & imported)
Moderate cost Not Standalone (requires ArcGIS to run)
InfoSWMM 3
Good hydraulic engine (SWMM 5)
Restricted or limited sanitary flow generation (i.e. Excel & imported)
Good integration with GIS Not Standalone (requires ArcGIS to run)
Moderate cost More applicable for drainage
Info Works 4
Excellent hydraulic engine Expensive (double other software costs)
Excellent flow generation Steep Learning Curve
Good scenario manager Not widely used in North America
XP
-SO
FT
WA
RE
Hydra 8
Good flow generation Poor hydraulics (particularly pump stations)
Easy to use Limited GIS integration
Low cost Poor Software Support
XP-SWMM 2
Good hydraulic engine (SWMM 5)
Limited GIS integration
Good flow generation (L/cap/day)
Long simulation run-times (two modules)
Widely used across North America
Not easy to export results
Same Software STM & SAN
Ben
tley
SewerGEMS 5
Good hydraulics Long simulation run-times
Good flow allocation Not widely used in Canada
Easy to use Moderate Software Support
DH
I Mike Urban (MOUSE)
1
Excellent hydraulic engine Can be unstable for large models
Good integration with GIS Moderate-steep learning curve
Good flow generation
Sewer Master Plan Update
WR Sewermp_Final Updated Jan7.Docx 7
2.3 Existing Sewer Infrastructure
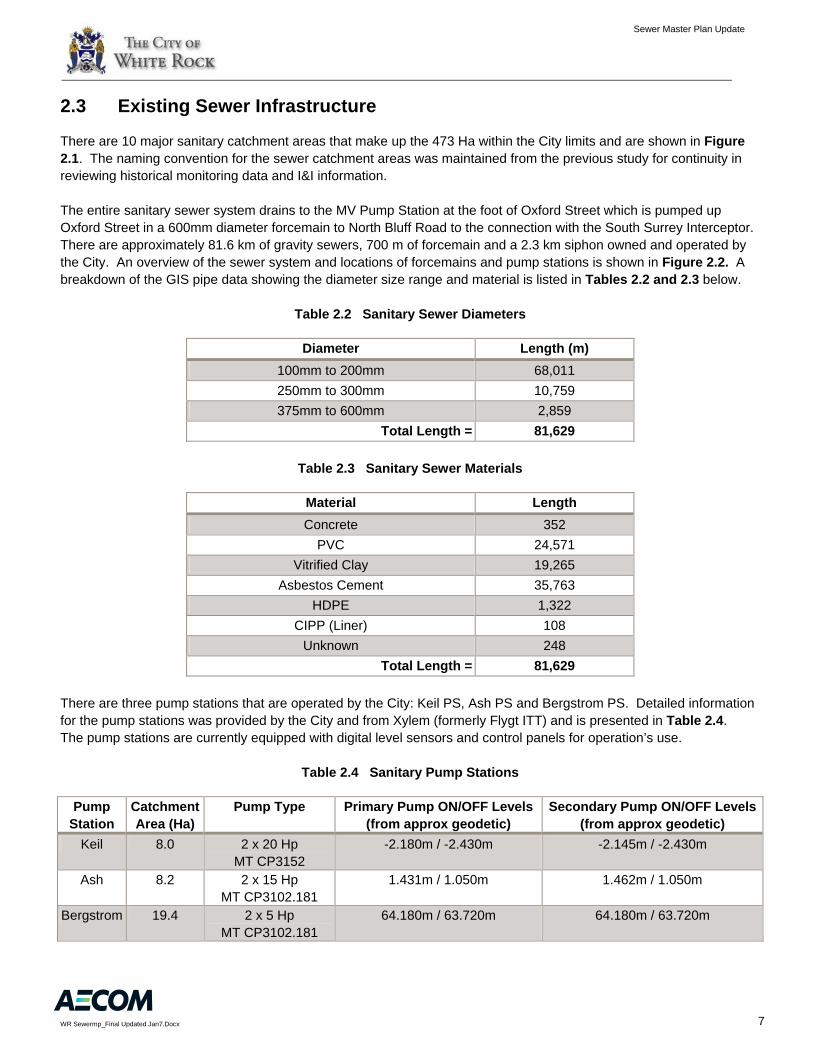
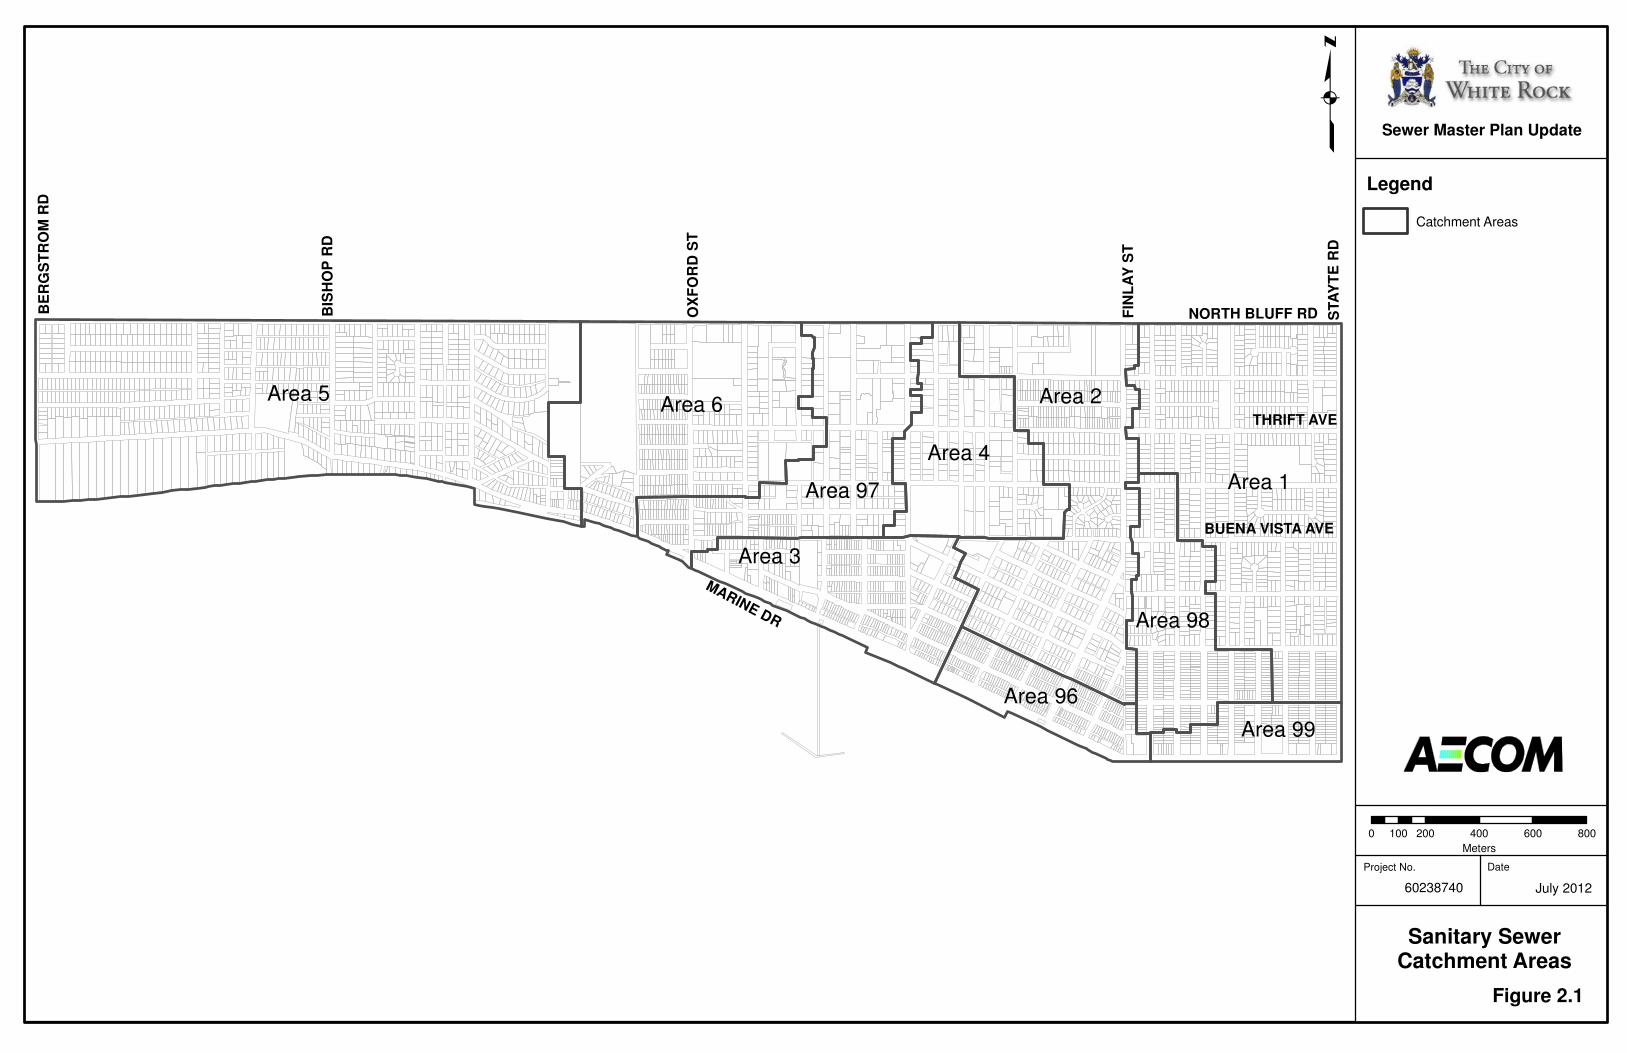
There are 10 major sanitary catchment areas that make up the 473 Ha within the City limits and are shown in Figure 2.1. The naming convention for the sewer catchment areas was maintained from the previous study for continuity in reviewing historical monitoring data and I&I information. The entire sanitary sewer system drains to the MV Pump Station at the foot of Oxford Street which is pumped up Oxford Street in a 600mm diameter forcemain to North Bluff Road to the connection with the South Surrey Interceptor. There are approximately 81.6 km of gravity sewers, 700 m of forcemain and a 2.3 km siphon owned and operated by the City. An overview of the sewer system and locations of forcemains and pump stations is shown in Figure 2.2. A breakdown of the GIS pipe data showing the diameter size range and material is listed in Tables 2.2 and 2.3 below.
Table 2.2 Sanitary Sewer Diameters
Diameter Length (m)
100mm to 200mm 68,011
250mm to 300mm 10,759
375mm to 600mm 2,859
Total Length = 81,629
Table 2.3 Sanitary Sewer Materials
Material Length
Concrete 352
PVC 24,571
Vitrified Clay 19,265
Asbestos Cement 35,763
HDPE 1,322
CIPP (Liner) 108
Unknown 248
Total Length = 81,629
There are three pump stations that are operated by the City: Keil PS, Ash PS and Bergstrom PS. Detailed information for the pump stations was provided by the City and from Xylem (formerly Flygt ITT) and is presented in Table 2.4. The pump stations are currently equipped with digital level sensors and control panels for operation’s use.
Table 2.4 Sanitary Pump Stations
Pump Station
Catchment Area (Ha)
Pump Type Primary Pump ON/OFF Levels (from approx geodetic)
Secondary Pump ON/OFF Levels (from approx geodetic)
Keil 8.0 2 x 20 Hp MT CP3152
-2.180m / -2.430m -2.145m / -2.430m
Ash 8.2 2 x 15 Hp MT CP3102.181
1.431m / 1.050m 1.462m / 1.050m
Bergstrom 19.4 2 x 5 Hp MT CP3102.181
64.180m / 63.720m 64.180m / 63.720m
Sewer Master Plan Update
Figure 2.1
Project No. Date
60238740 July 2012
q
0 200 400 600 800100
Meters
Sanitary SewerCatchment Areas
BE
RG
ST
RO
M R
D
BIS
HO
P R
D
OX
FO
RD
ST
FIN
LA
Y S
T
STA
YT
E R
D
THRIFT AVE
MARINE DR
BUENA VISTA AVE
NORTH BLUFF RD
Area 5Area 6
Area 3
Area 1
Area 2
Area 4
Legend
Area 97
Area 98
Area 99
Area 96
Catchment Areas

#
#
# #
Sewer Master Plan Update
Figure 2.2
Project No. Date
60238740 August 2012
q
0 200 400 600 800100
Meters
Existing Sanitary Sewer System
BE
RG
ST
RO
M R
D
BIS
HO
P R
D
OX
FO
RD
ST
FIN
LA
Y S
T
STA
YT
E R
D
THRIFT AVE
MARINE DR
BUENA VISTA AVE
NORTH BLUFF RD
Legend
# City Pump Stations
Gravity Main
Bergstrom RdPump Station
Metro VancouverPump Station
AshPump Station Keil
Pump Station
MV Interceptor
Forcemain
Siphon
MV Force Main
# MV Pump Station
South SurreyInterceptor

Sewer Master Plan Update
WR Sewermp_Final Updated Jan7.Docx 8
In addition, there is a siphon that conveys sewage from the eastern portion of the City at Keil Street to the MV Pump Station at Oxford Street. The siphon is 2.3 Km in length and was replaced in year 2000. It was designed for a peak wet weather flow (PWWF) capacity of 189 L/s based on 2020 population (from the previous OCP) and an I&I allowance of 22,400 L/Ha/day. As noted above, all sewage flows in White Rock drain to the Metro Vancouver Pump Station at the foot of Oxford Street. The current White Rock Pump Station has a capacity of approximately 373 L/s. Data for the MV forcemain was used to assist with the model calibration and validation along with the sewer temporary flow monitoring data discussed in the next section.
2.4 Flow Monitoring Data
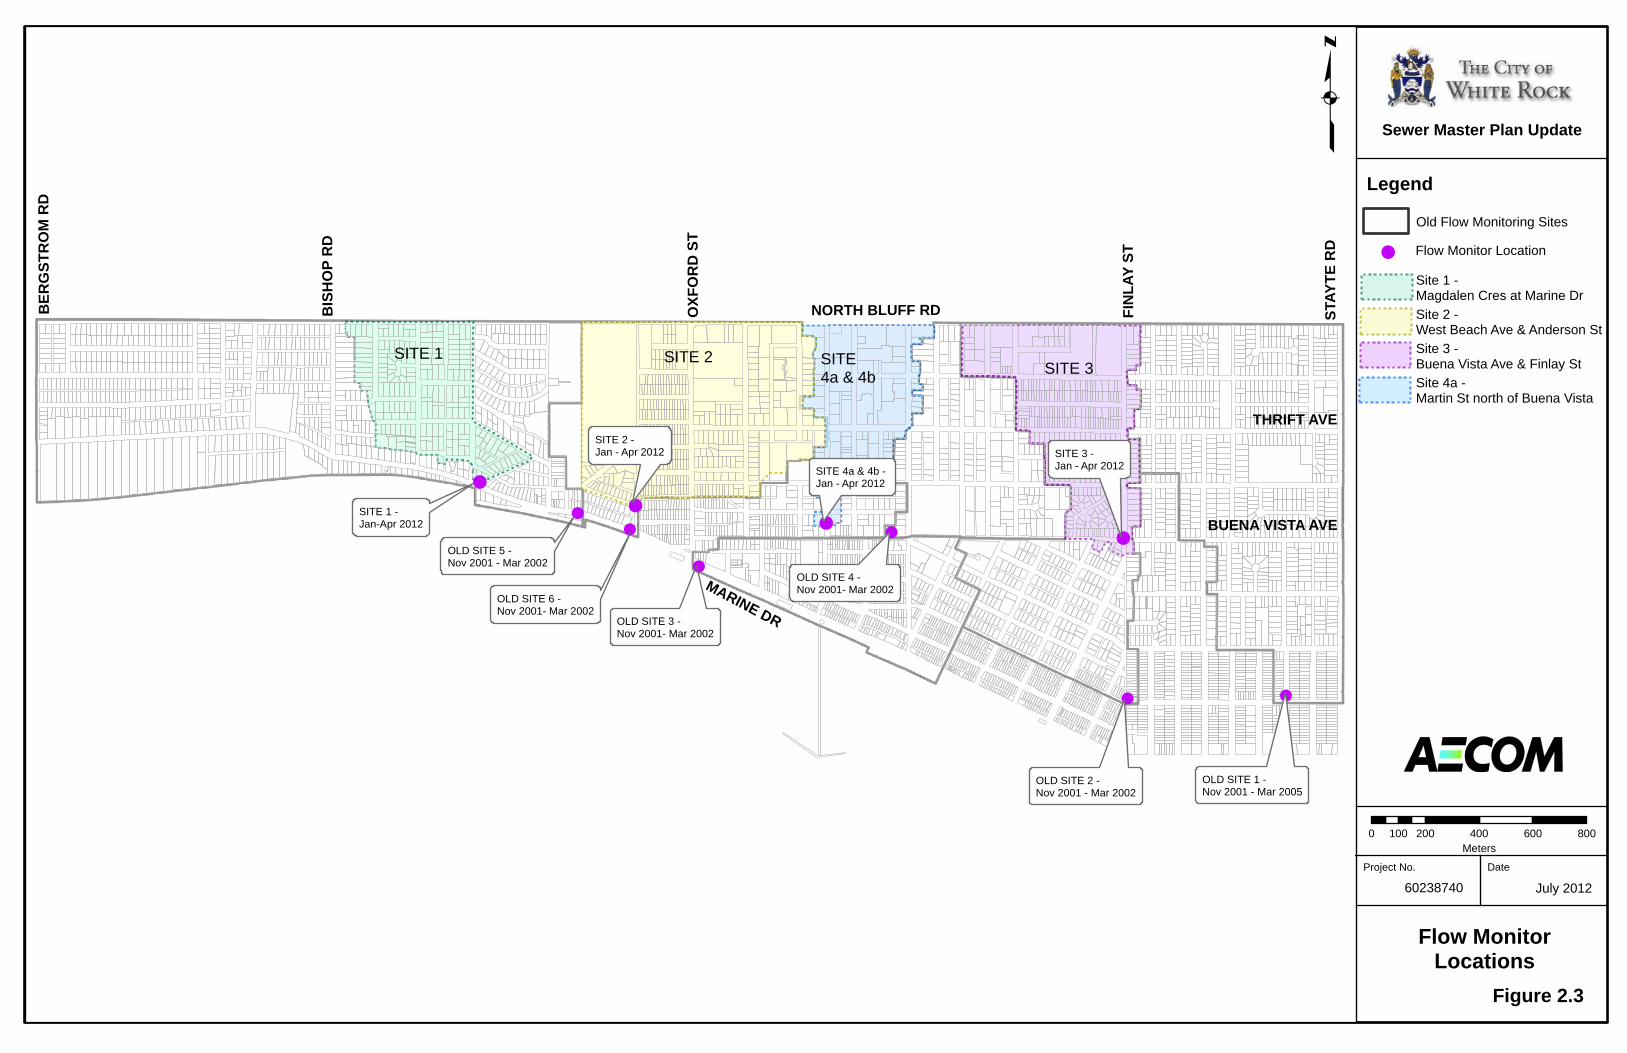
In order to calibrate and validate the updated model, SFE Global was retained to install four flow monitoring stations at predetermined locations in the City from January to March of 2012. Corresponding rainfall data was obtained from the White Rock STP rain gauge. The flow monitor and rainfall gauge locations are shown in Figure 2.3 and details of each site are summarized in Table 2.5 below. Figure 2.3 also includes the locations of the historical flow monitoring gauges used for the previous studies for reference purposes.
Table 2.5 Summary of Temporary Flow Meter Sites
Site No.
Location Catchment Area (Ha)
Flow Meter Type
Inlet Pipe Dia. (mm)
Outlet Pipe Dia. (mm)
1 Magdalen Cr at Marine Dr 16.9 Weir with Area/Velocity
250
250
2 Anderson St at W. Beach Ave
43.1 Area/Velocity 250 250
3 Finlay St at Buena Vista Ave 26.4 Weir with Area/Velocity
250 300
4a Martin St at Prospect St 16.5 Area/Velocity 200 200
4b* Buena Vista at Martin St 18.9 Area/Velocity 200 200
* 4b installed as backup for 4a Flow data was received for the months of January, February, and March of 2012 and data quality was reviewed at the end of each month by both SFE and AECOM. At Sites 1, 2 and 3 the data was of good quality while at Sites 4a and 4b the data recorded was quite variable. At Site 4a the dry weather data was of adequate quality but the wet weather data was deemed unusable. Although Site 4b was installed as a backup meter for Site 4a the dry weather flow rate at 4b was an order of magnitude greater than the more realistic values recorded at 4a such that this data was also deemed unusable. Reasons for the poor data at sites 4a and 4b are due to the steep pipe slope and turbulent flow conditions particularly at the 4b manhole site. In such case, the dry weather calibration efforts focused on using data from all four sites while the wet weather calibration and validation was completed using data from Sites 1, 2 and 3 only. Detailed results from the flow monitoring program are discussed in Sections 2.5 and 2.6. Historical flow monitoring data was also available for six locations in the City dating back to 2001. Summary information for these sites is provided in the Sanitary Sewer Rehabilitation Program Audit Update – 2011 Draft Report by KWL. Historical flow monitoring data from “Old Site 1” for 2005 was used to further refine the dry and wet weather calibration. Data from the remainder of the sites was not used for calibration purposes, but available wet weather data
!
!
!!
Sewer Master Plan Update
Figure 2.3
Project No. Date
60238740 July 2012
q
0 200 400 600 800100Meters
Flow MonitorLocations
BE
RG
ST
RO
M R
D
BIS
HO
P R
D
OX
FO
RD
ST
FIN
LA
Y S
T
STA
YT
E R
D
THRIFT AVE
MARINE DR
BUENA VISTA AVE
NORTH BLUFF RD
Legend
Site 1 - Magdalen Cres at Marine Dr
Site 2 - West Beach Ave & Anderson St
Site 3 - Buena Vista Ave & Finlay St
Site 4a - Martin St north of Buena Vista
! Flow Monitor Location
SITE 1 SITE 2SITE 3
SITE 4a & 4b
SITE 1 - Jan-Apr 2012
SITE 2 - Jan - Apr 2012
SITE 4a & 4b - Jan - Apr 2012
SITE 3 -Jan - Apr 2012
Old Flow Monitoring Sites
OLD SITE 5 - Nov 2001 - Mar 2002
OLD SITE 6 - Nov 2001- Mar 2002
OLD SITE 3 - Nov 2001- Mar 2002
OLD SITE 4 - Nov 2001- Mar 2002
OLD SITE 2 -Nov 2001 - Mar 2002
OLD SITE 1 -Nov 2001 - Mar 2005

Sewer Master Plan Update
WR Sewermp_Final Updated Jan7.Docx 9
from four of the historical sites (Old Sites 1, 2, 4 and 5) was reviewed and incorporated into the I&I analysis for this study and is presented in Section 2.7. Flow data for the MV forcemain from a gauge located at Anderson Street and North Bluff Road was also reviewed and used for the model calibration and determination of average dry weather flows, GWI and I&I rates. This data provided an overall check for the entire City as all sewage within the City limits is pumped by MV.
2.5 Sewage Flow Generation
This section describes the process used to generate sewage flows for the calibration scenarios which was translated into the flow rates for the existing and future scenarios. Sewage flows were generated on a parcel by parcel basis using the following key information:
a property identification number for each parcel; populations derived using 2011 Census Block information and assigned to parcels based on land use; and water meter records from EPCOR for 2009 used for the institutional, commercial and industrial sewer
loading. Once the residential population was assigned to each parcel an estimate for sanitary flow was generated based on the dry weather flow monitoring data discussed below. The population and sanitary loading were then allocated to the nearest fronting sewer manhole using spatial join tools in GIS. The diurnal curve for residential land use was developed using the flow meter data from Site 1 which is primarily a residential area. As shown in Figure 2.4 the weekend pattern is has a higher peaking factor than the weekday pattern, in such case we have used the weekend pattern for the system capacity analysis.
Figure 2.4 Diurnal Pattern - Residential

Sewer Master Plan Update
WR Sewermp_Final Updated Jan7.Docx 10
A separate diurnal pattern was applied to the institutional and commercial land uses which was derived from previous sanitary modelling studies for Cities in the Lower Mainland. The per capita sanitary flow rate for residential use was estimated using the dry weather flow data recorded during the 2012 monitoring period for Sites 1 to 4a (data from site 4b did not yield reasonable values and has not been included), flow data from “Old Site 1” and citywide flow data from the Metro Vancouver pump station (metered on the forcemain at North Bluff Road and Anderson Street). Using flow from consecutive dry days at each location, we were able to generate flow rates for base sanitary flows, night time low flows and groundwater infiltration (GWI) to estimate a unit rate for the sanitary flow. The GWI was initially estimated to be 80% of the night time low flow, and refined during calibration. The institutional/commercial/industrial (ICI) sanitary flow was estimated to be 85% of the ICI water meter records. As shown in Table 2.6 below, the average sanitary flow rate ranged from 115 to 458 L/cap/day which is within the typical expected range with the overall average of 210 L/cap/day at the MV forcemain. For comparison, the average water consumption based on the 2009 data from EPCOR is approximately 430 L/cap/day (including all meters regardless of land use type), and our recent work in North Vancouver and Surrey found rates in the range of 220-260 L/cap/day.
Table 2.6 Dry Weather Flow Summary
Site Location Area
(ha)
2011
Population
ADWF
(L/s)
GWI
(L/s)
GWI
(L/Ha/day)
ICI flow
(L/s)
Residential
Flow (L/s)
Sanitary Flow
(L/cap/day)
Site 1 Magdalen/
Marine
16.9 552 3.3 1.5 7,692 0 1.8 283
Site 2 Anderson/
W. Beach
43.1 2,566 21.2 6.1 12,185 1.5 13.6 458
Site 3 Finlay/
Buena Vista
26.4 1,893 14.1 4.4 14,368 2.2 7.5 343
Site 4a Martin/
Prospect
16.5 1,840 6.6 2.7 13,961 1.5 2.5 115
Old Site 1
Columbia/
Habgood
61.0 2,479 10.2 3.7 5,259 0.7 5.8 204
GVRD Forcemain 356.2 19,238 75.1 16.3 3,960 12.7 46.2 210
The GWI estimate for each monitored area is shown in Table 2.6. GWI is non-rainfall dependent flow that enters the sewer system through holes in the sewers and manholes, misaligned joints and service laterals. Determining the rate of GWI can be complicated and highly variable across the City because GWI varies with:
pipe age because as pipes age they deteriorate; material type because some pipe materials are brittle (AC and concrete), and some pipes have gasketted
joints to minimize infiltration; amount of pipe in the catchment (diameter and length), because the more pipe and surface area in contact
with groundwater will result in more infiltration; number of service connections, as more connections result in a higher rate of infiltration; and subsurface soil type and location of pipe relative to till/clay layers. If a pipe is at deeper depths and
installed above an impermeable layer, the groundwater table is most likely elevated and can cause infiltration whereas a pipe installed at shallower depths in sandy soils will tend to have a lower groundwater table since the material is free draining.

Sewer Master Plan Update
WR Sewermp_Final Updated Jan7.Docx 11
GWI also varies during periods of dry weather and wet weather as soil conditions tend to be saturated during wet-weather months, even during periods of little to no precipitation. The values summarized above represent wet weather GWI as the monitoring period was during winter months. The calculated GWI ranges from 5,259 to 14,368 L/Ha/day for a weighted average value of 9,395 L/Ha/day across the 5 monitoring catchments (including Old Site #1). This is a relatively high value for GWI and higher than the previously reported values in the 2005 KWL report that averaged approximately 5,200 L/Ha/day. The elevated values recorded during the 2012 flow monitoring period may be a result of meter error or increased GWI during wet months. As a further check we reviewed the MV forcemain data to determine a City-wide average for GWI that resulted in 3,960 L/Ha/day which was estimated using data from August 2011. Ultimately for sewer catchments that did not have flow data, the per capita rate and GWI rate applied to the model was based on the city-wide MV forcemain data.

Sewer Master Plan Update
WR Sewermp_Final Updated Jan7.Docx 12
2.6 Model Calibration and Validation
The hydraulic model of the City’s sewer system was calibrated for both dry and wet weather flow conditions and an additional wet weather event was modeled as the validation event. Time series data for calibration and validation results are shown graphically in Appendix A and summarized in Table 2.7 for four of the new flow monitoring sites, one historical monitoring site and the Metro Vancouver forcemain.
Table 2.7 Calibration and Validation Summary
Location
Dry Weather Calibration Wet Weather Calibration Wet Weather Validation
Average Flow (L/s)
Total Event
Volume (m3)
Peak Flow (L/s)
Average Flow (L/s)
Total Event
Volume (m3)
Peak Flow (L/s)
Average Flow (L/s)
Total Event
Volume (m3)
Site 1
Date Mar 21-25th, 2012 Feb 20-26th, 2012 - 55.4mm March 2-6th, 2012 - 31.8mm
Monitor 3.6 309 11.4 6.0 3,089 10.4 5.7 2,465
Model 3.5 299 9.7 5.3 2,767 10.0 4.8 2,056
% Error -3.0% -3.2% -17.1% -11.6% -11.6% -3.6% -19.8% -19.9%
Site 2
Date Mar 21-25th, 2012 Feb 20-26th, 2012 - 55.4mm March 2-6th, 2012 - 31.8mm
Monitor 21.8 1,884 50.5 24.3 12,603 43.1 22.4 9,666
Model 22.1 1,911 43.8 25.0 12,976 49.2 24.0 10,385
% Error 1.5% 1.4% -15.3% 2.9% 2.9% 12.4% 7.0% 6.9%
Site 3
Date Feb 3-6th, 2012 Feb 20-26th, 2012 - 55.4mm March 2-6th, 2012 - 31.8mm
Monitor 12.9 1,111 31.6 13.2 6,830 32.3 13.1 5,683
Model 13.0 1,118 24.5 14.0 7,259 26.7 13.7 5,906
% Error 0.7% 0.6% -28.7% 5.9% 5.9% -20.6% 3.8% 3.8%
Site 4a
Date Feb 7 -11th, 2012 -- --
Monitor 6.1 529 -- -- -- -- -- --
Model 6.4 554 -- -- -- -- -- --
% Error 4.6% 4.5% -- -- -- -- -- --
Old Site 1
Date Jan 10-14th, 2005 Jan 15-19th, 2005 - 128.2mm Dec 24-27th, 2004 - 45.0mm
Monitor 10.7 926 75.2 29.1 8,790 31.6 15.6 4,042
Model 10.8 932 68.2 31.0 9,363 32.4 17.8 5,389
% Error 0.6% 0.6% -10.1% 6.2% 6.1% 2.6% 12.5% 25.0%
MV FM
Date March 4-6th , 2010 Dec 1-7th, 2007 - 117.4mm Jan 7-14th, 2010 - 121.6mm
Monitor 75.1 6,583 366.4 185.1 47,987 372.3 126.0 87,122
Model 88.4 7,634 365.2 197.2 51,119 361.1 134.4 92,871
% Error 14.9% 13.8% -0.3% 6.1% 6.1% -3.1% 6.2% 6.2%

Sewer Master Plan Update
WR Sewermp_Final Updated Jan7.Docx 13
Dry weather flow for the meter data and model predicted values are compared using the average flow for a 5 day period. As noted in the table above, the model predicted values are within 10% of the meter data for all sites with exception of the MV forcemain. The model predicted MV forcemain total volumes are higher than metered because we have assumed a higher GWI than the overall City-wide average as we blended the this value with the data from the temporary flow monitoring sites. For the wet weather calibration and validation a comparison of the peak flow and volume for the metered data versus the modelled data for each flow monitoring site is provided. Peak flow values were difficult to compare for some sites due to spikes in the data. Overall, the wet weather calibration results are acceptable. To complete the wet weather model calibration values were input for rainfall-derived infiltration and inflow (RDII). XPSWMM uses the RTK approach, whereby:
“R” represents the percentage of rainfall that enters the sanitary sewer system; “T” represents the time from the onset of rainfall to the peak of the unit hydrograph in hours; and “K” represents the ratio of time to recession of the unit hydrograph to the time to peak.
The RTK approach has three such unit hydrographs with R1, R2 and R3 being the relative amounts that occur at various stages (i.e. fast, medium and slow response). The RTK technique is illustrated in Figure 2.5.
Figure 2.5 – RTK Parameter Description

Sewer Master Plan Update
WR Sewermp_Final Updated Jan7.Docx 14
The “R” values derived from the temporary flow monitoring sites are representative of events in the range of a 6-month to 5-Year return period while the overall “R” values derived from the White Rock Pump Station data are representative of a 50-Year return period event because the City-wide modelled was calibrated to the December 2007 storm event which was approximately a 50-Year 24-Hour storm event. Typically, as the return period increases so should the “R” value, and ultimately the “R” value will plateau once the return period becomes too large / infrequent. A summary of the total “R” values derived for each flow monitor area and applied in the model is shown in Figure 2.6. Calibrated total “R” values were applied to each flow monitoring catchment area and the overall calibrated “R” value for the White Rock Pump Station was applied to the remainder of the City. Other factors that can impact the “R” values include pipe age, material and condition information (i.e. whether rehabilitation had occurred). Further refining of the calibration could be completed with additional flow monitoring data in subsequent years as required. With the calibrated XPSWMM model, the City has the ability to input various rainfall events (historical and design storms) to assess peak flows and RDII. RDII in sanitary sewer systems is a major source of operating problems, causing poor performance of many sewer systems and is often the main cause of SSOs (Sanitary Sewer Overflows) to customer basements, streets, or nearby streams.

Sewer Master Plan Update
Figure 2.6
Project No. Date
60238740 August 2012
q
0 200 400 600 800100Meters
Model CalibrationR-Values
BE
RG
ST
RO
M R
D
BIS
HO
P R
D
OX
FO
RD
ST
FIN
LA
Y S
T
STA
YT
E R
D
THRIFT AVE
MARINE DR
BUENA VISTA AVE
NORTH BLUFF RD
Legend
Site 1 - Magdalen Cres at Marine Dr
Site 2 - West Beach Ave & Anderson St
Site 3 - Buena Vista Ave & Finlay St
Site 4a - Martin St north of Buena VistaR=0.110
R=0.038
R=0.075
R=0.064(Average)
R=0.08
Old Site 1 - Columbia & Hasgood
NOTE: Overall R-Value based on MV FM data
R-Value AreasTotal R = (R1+R2+R3)

Sewer Master Plan Update
WR Sewermp_Final Updated Jan7.Docx 15
2.7 Inflow and Infiltration Analysis
In order to evaluate the RDII rates for the City, we reviewed the historical monitoring data for Old Sites 1, 2, 4, and 5 (shown in Figure 2.3) as the storm events recorded at these sites were significantly greater than those recorded during the recent flow monitoring period from January to April 2012. Data from the Metro Vancouver forcemain was also reviewed to estimate I&I rates for the City. The resulting I&I rates are summarised in Table 2.8 and the graphs used to generate the table are provided in Appendix B. For this analysis, we determined that a logarithmic projection for RDII rates produced the “best fit” curve, with the least “R- squared” value, for the temporary flow monitoring data. This theory correlates with the fact that as the return period increases so should the RDII value and ultimately the RDII value will plateau once the return period becomes too large / infrequent. This methodology is different from the 2005 KWL Study where the system assessment was completed using a linear regression and extrapolated to a 100-Year event. While the linear regression and Envelope Method is widely used it can often result in elevated projections of RDII rates for 50-Year and 100-Year return periods. Included in the table are the RDII rates for the 5-Year and 50-Year events. We have selected these return periods as they provide a range of values from the previous Metro Vancouver I&I target for the 5-Year return period of 11,200 L/Ha/day, and the 50-Year return period was determined to be an acceptable frequency that one may anticipate localized sewer backup to occur balanced with financial capital cost for system upgrades compared to larger events. The GWI rate applied is the same as previously calculated in the 2005 KWL Study. These GWI rates are greater than the overall City-wide rate of 3,960 L/Ha/day determined from the White Rock Pump Station data but are less than the GWI rates estimated from the recent flow monitoring program as shown in Table 2.6.
Table 2.8 Summary of RDII rates per Return Period
Site # GWI (L/Ha/day) 5-Year RDII (L/Ha/day)
50-Year RDII (L/Ha/day)
5-Year Total I&I (L/Ha/day)
50-Year Total I&I (L/Ha/day)
Old Site 1 6,500 30,100 36,500 36,600 43,000
Old Site 2 7,600 66,700 83,500 74,300 91,100
Old Site 4 4,300 44,100 51,900 48,400 56,200
Old Site 5 5,259 31,900 38,000 37,159 43,259
MV FM 3,960 28,687 42,156 32,647 46,116

Sewer Master Plan Update
WR Sewermp_Final Updated Jan7.Docx 16
3 Hydraulic Analysis
3.1 Design Criteria
Sanitary sewer design criteria is based on providing a level of service to the public and the City’s current criteria is provided in Subdivision Bylaw # 777 Schedule B. The Bylaw states the ADWF is to be 360 litres per capita per day and the average “infiltration rate” is to be 0.06 L/s/Ha (or 5,184 L/Ha/day). For the system capacity assessment, we have used 360 L/cap/day for the base sanitary flow loading. The peaking factor is derived from the diurnal curve (rather than the Harmon Peaking factor as per the Bylaw) for use in the hydraulic model. This provides the City with a slightly conservative model, a representative of local sewers, as compared to the “measured” average dry weather flow of 210 L/cap/day. For the groundwater infiltration criteria, we have applied the GWI rates determined from the flow monitoring data for metered catchments and applied the Bylaw unit rate of 5,184 L/Ha/day for the remainder of the system. An overall GWI rate was determined from the Metro Vancouver forcemain data but was not used as it was slightly lower than the Bylaw rate and significantly lower than the smaller (more localized) metered subcatchment areas. The peak wet weather criteria was determined to be the 50-Year 2-Hour storm event to simulate the RDII component. The two hour event was selected based on a review of the 1, 2, 6, 12 and 24 hour storm durations as it resulted in the most severe (highest) flows in the sewer system.
3.2 Existing and Future Land Use
Existing land use within the City is predominantly low density residential with pockets of medium density residential land use and the commercial core area being the Town Centre Area and Marine Drive. As per the OCP, the following land-use types are present within the City:
Detached or Attached Residential (Low Density) Multi-Unit Residential (Low Density) Multi-Unit Residential (Medium Density) Commercial Open Space and Recreation Areas Institutional and Utility Town Centre Mixed Use
Future residential development will take the form of townhouses and apartments due to restrictions on land availability with the bulk of the development occurring in the Town Centre and North Bluff Areas. The future 2031 population is projected to be 23,500 based on the 2008 OCP and timing of development activity is dependent on market conditions. In addition, commercial development is anticipated to increase as opportunities arise in the Town Centre and the residential population increases. There is also incremental redevelopment and infill activity in areas outside of the Town Centre that will be ongoing. Future land use is shown in Figure 3.1.

City of Surrey
City of White Rock
Sewer Master Plan Update
Figure 3.1
Project No. Date
60238740 June 2012
q
0 200 400 600 800100
Meters
OCP Land Use
BIS
HO
P R
D
THRIFT AVE
FIN
LA
Y S
T
MARINE DR
NORTH BLUFF RD
BUENA VISTA AVE
BE
RG
ST
RO
M R
D
STA
YT
E R
D
OX
FO
RD
ST
LegendDetached/Attached Residential (Low Density)
Multi-Unit Residential (Low Density)
Multi-Unit Residential (Med Density)
Commercial
Open Space and Recreation Areas
Institutional and Utility
Town Centre Mixed Use

Sewer Master Plan Update
WR Sewermp_Final Updated Jan7.Docx 17
3.3 System Capacity Assessment
The primary goal for the hydraulic capacity assessment is to develop a 10-Year Capital Plan for the City based on the future OCP land-use scenario. In such case, the model was utilized to perform an analysis of the hydraulic capacity for the existing sanitary sewer system under future OCP land use conditions.
The hydraulic analysis of the sewer system was based assuming that the available pipe capacity is 80% of the theoretical pipe full capacity. In such case a ratio of Q max / Q capacity of 0.8 or greater would trigger a pipe upgrade. While the 80% threshold is not particularly conservative, it is acceptable within the industry and was selected to reflect a realistic Capital Plan for the City. The forcemain velocity threshold of 3.0m/s was selected as velocities greater than this value result in increased and undesirable headloss rates in forcemains.
Figure 3.2 shows the existing sanitary sewer system capacity assessment for the PWWF using a 50-Year I&I rate under future OCP population and land use conditions. The sewer system results are highlighted as follows:
sewer capacity as the ratio of peak flow (Qmax) to pipe capacity (Qcap): o Qmax/Qcap <0.5 o Qmax/Qcap >=0.5 to <=0.8 o Qmax/Qcap greater than 0.8
hydraulic grade line (HGL) at manholes or model nodes includes in indication of whether the manhole is surcharging to surface
forcemains and siphon velocity: o max velocity < 3.0 m/s o max velocity > 3.0 m/s
Summary tables for the length of sewers under capacity, number of surcharged MHs and velocity of forcemain/siphon are provided below.
Table 3.1 Sewer Capacity Summary
Qmax / Qcap Ratio # of Sewers Total length (m)
0-0.5 1,320 69,510
0.5 – 0.8 55 3,269
0.8 – 1.0 30 1,935
Greater than 1.0 28 1,478
As shown in Table 3.1, approximately 1,478 m of the City’s 76.2 km (or 1.9%) of sanitary sewers are undersized for the 50-Year peak wet weather flow and are likely to surcharge (i.e. Qmax/Qcap > 1.0). An additional 1,935 m of sewers have a peak wet weather flow resulting in a Qmax/Qcap ratio greater than 0.8 for a 50-Year, 2-Hour event.

#
#
# #
Sewer Master Plan Update
Figure 3.2
Project No. Date
60238740 August 2012
q0 200 400 600 800100
Meters
Existing Systemwith OCP &
50-Year, 2-Hr Event
BE
RG
ST
RO
M R
D
BIS
HO
P R
D
OX
FO
RD
ST
FIN
LA
Y S
T
STA
YT
E R
D
THRIFT AVE
MARINE DR
BUENA VISTA AVE
NORTH BLUFF RD
Legend
Pipe Capacity, Qmax/Qcap
Manhole HGL
< 1.2 m to Ground
> 1.2 m below ground
#
#
# #
MARINE DR
FIN
LA
Y S
T
KE
IL S
T
PWWF > Capacity
MARINE DRForcemain/Siphon Velocity
0.0 - 2.0 m/s
> 3.0 m/s
Bergstrom PS and Forcemain
MV, Ash, and Keil PS and Forcemain/Siphon
Above Ground
50 - 80%
0 - 50%
> 80%
2.0 - 3.0 m/s
##
PWWF < Capacity
Pump Stations

Sewer Master Plan Update
WR Sewermp_Final Updated Jan7.Docx 18
Table 3.2 summarizes the number of manholes where the sewage level is predicted to reach the ground surface. A field review of the manholes predicted to have HGLs above ground should be completed to determine whether there is evidence of the manholes surcharging at these locations.
Table 3.2 Number of Flooded MHs
Depth Below Ground # of Manholes
>1.2m below ground 1,323
<1.2m to ground 134
Above ground 9
A summary of the model predicted velocities in the forcemains and siphon is provided in Table 3.3. Velocity in the siphon ranged from 1.25 to 1.82 m/s depending on the location and corresponding pipe diameter for a PWWF of 290 L/s. The values presented in Table 3.3 for the forcemain/siphon velocities do not include the Metro Vancouver forcemain.
Table 3.3 Sewer Forcemain Velocity Summary
Velocity Range Total Length
0 – 2 m/s 5,005
2.0 to 3 m/s 0
>3 m/s 0
Total 5,005
A review of the pump station capacity was also completed and is shown in Table 3.4 below which includes a comparison of model predicted peak wet weather flow (PWWF) versus the estimated pump station capacity. The estimated pump station capacity was determined from field measurements and over laying a system curve for each pump station on the theoretical pump curve.
Table 3.4 Sanitary Pump Station Capacity
Pump Station
Catchment Area (Ha)
Model PWWF (Inflow to Stations)
Estimated Pump Capacity Range
Keil 8.0 31.0 L/s 52 - 63 L/s
Ash 8.2 30.7 L/s 49 - 52 L/s
Bergstrom 19.4 30.4 L/s 20 – 24 L/s
MV PS 356.2 521 L/s 370 L/s
Based on the estimated pump capacity information presented above for the PWWF under the 50-Year event the Bergstrom Pump Station would be undersized. Although this pump station was not identified by City Operations staff as being problematic (beyond routine maintenance issues) it has been flagged as potentially undersized. We have also summarized the Metro Vancouver PS PWWF and capacity which is also undersized as shown in Table 3.4. Further review of the pump station capacities and a detailed condition assessment are recommended and discussed in the capital plan and recommendations section. Details for pipe capacities and proposed upgrades to meet the future OCP and 50-Year I&I peak wet weather flows are provided in Section 5.0.

Sewer Master Plan Update
WR Sewermp_Final Updated Jan7.Docx 19
4 Sewer Condition Assessment
To assist with the long range capital plan, we have performed a review of the available sewer condition assessment information provided by the City and a review of the available GIS pipe age attribute data. A geodatabase of CCTV coding and condition assessment results was analysed that included data compiled since 2001. Over the last 11 years the City has completed a number of sewer condition assessment and rehabilitation projects including CCTV investigations, smoke testing, point repairs, pipe lining, lateral connection grouting and investigation, and sewer replacement with the goal of reducing inflow and infiltration. A summary of the sewer rehabilitation works completed since 2001 is presented in the Audit of Sanitary Rehabilitation Program (KWL 2011) report.
4.1 Aging Infrastructure
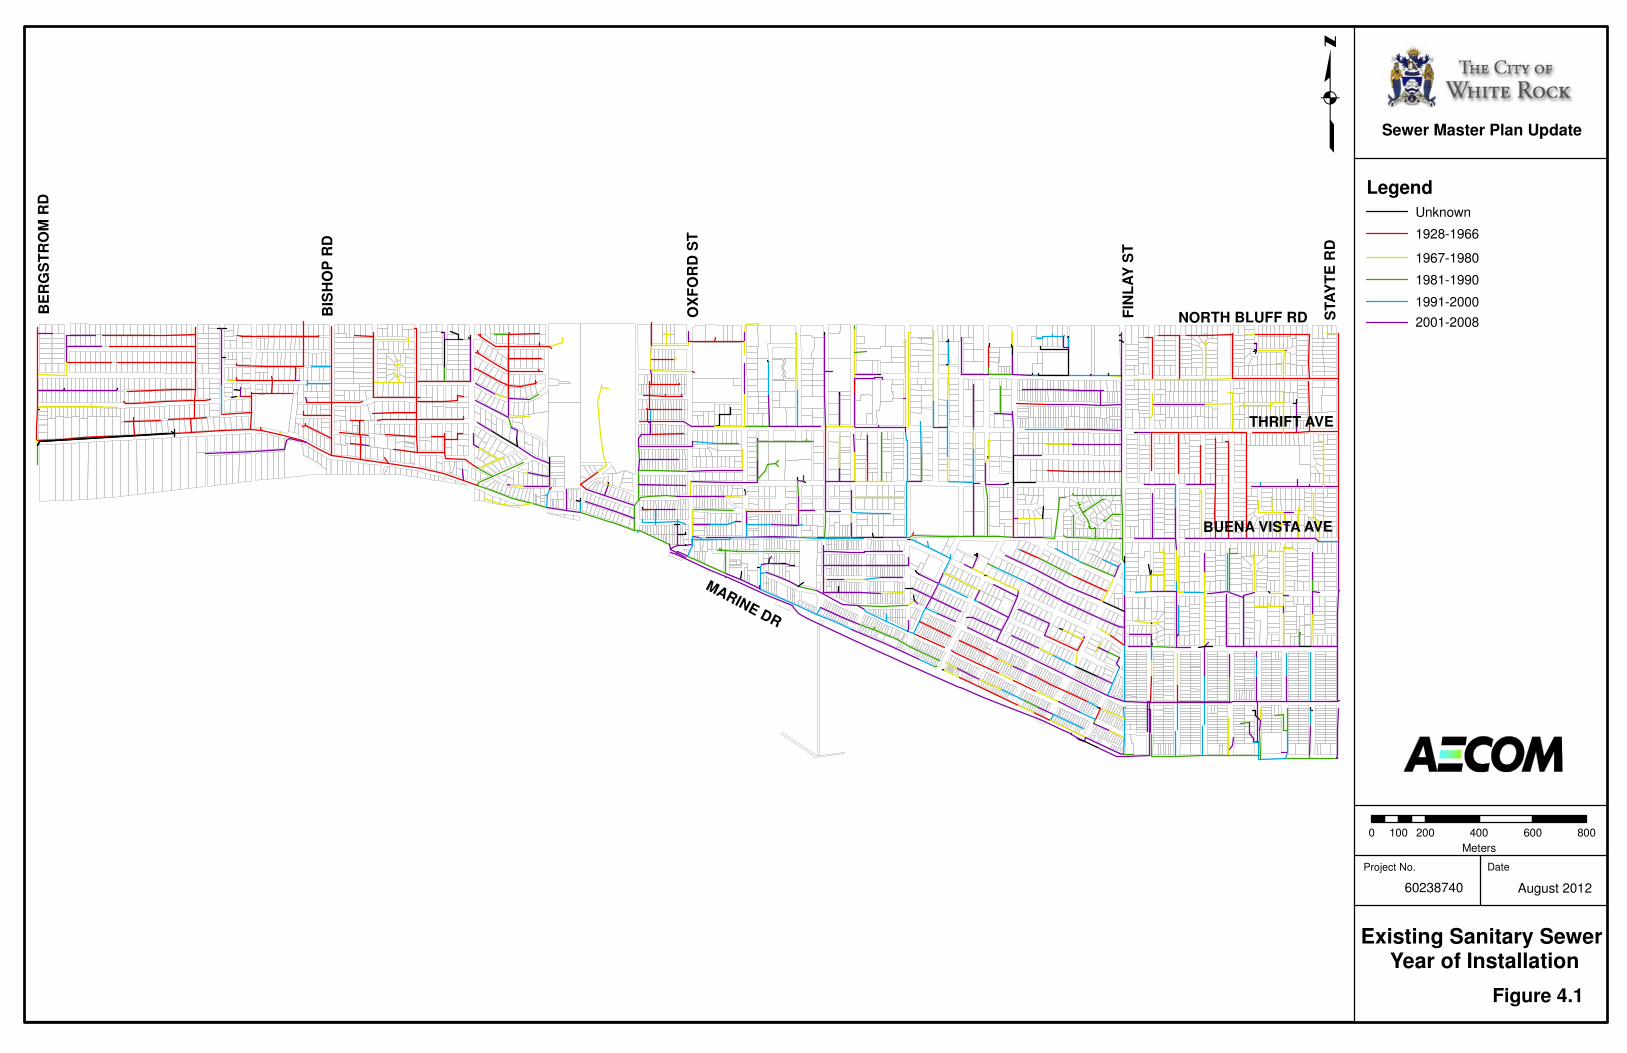
As future development continues, the need to assess the condition of aging infrastructure becomes more critical. Upon review of the City’s GIS data, only 4.3% or approximately 3.5 km of the sanitary sewer collection system did not have an entry for pipe age, and the earliest year of installation is noted as 1928. A summary of the pipe age or year of installation is shown in Figure 4.1 and in Table 4.1. In general, the following key items are required for a municipality to properly plan for existing infrastructure replacement:
When was the sewer installed? What is the expected life cycle of the sewer? Is the asset technologically or commercially obsolete?
From available GIS data, Table 4.1 categorizes the existing sewers into their corresponding year of installation.
Table 4.1 Summary of Pipe Year of Installation
Year Installed Length of Pipe (m)
2012-2001 26,301 2000-1991 8,699 1990-1981 8,547 1980-1971 6,852 1970-1961 24,821 1960-1928 2,877 Unspecified 3,533
Total 81,629 As noted in the table above, there are approximately 2.9 km of sewer pipe at least 52 years old, and some pipes dating back 84 years which is beyond the life expectancy of most sewer pipe materials. Table 4.2 below is a reference for typical sewer life cycle expectancy based on material type. A significant portion of the sanitary sewer system is between 42 to 51 years old and is most likely AC pipe. Once the oldest pipes have been replaced, the focus for sewer replacement and upgrades should be on the AC pipe. One can draw a correlation between the age of pipes as shown in Figure 4.1 and results of the condition assessment shown in Figure 4.3 in the next section. A third parameter useful for the correlation of condition vs. age is the material
Sewer Master Plan Update
Figure 4.1
Project No. Date
60238740 August 2012
q
0 200 400 600 800100
Meters
Existing Sanitary Sewer Year of Installation
BE
RG
ST
RO
M R
D
BIS
HO
P R
D
OX
FO
RD
ST
FIN
LA
Y S
T
STA
YT
E R
D
THRIFT AVE
MARINE DR
BUENA VISTA AVE
NORTH BLUFF RD
Legend
Unknown
1928-1966
1967-1980
1981-1990
1991-2000
2001-2008

Sewer Master Plan Update
WR Sewermp_Final Updated Jan7.Docx 20
types and this parameter can be found in the Audit of Sanitary Rehabilitation Program June 2011 Draft Report (KWL) as Figure 2-2 A & B.
Table 4.2 Theoretical Life Cycle of Sewer Based on Material
Material Type Estimated Life Cycle (Years)
Asbestos Cement 50 Steel 80
Concrete 75 Ductile Iron 80
HDPE 80 PVC 80
4.2 Condition Assessment
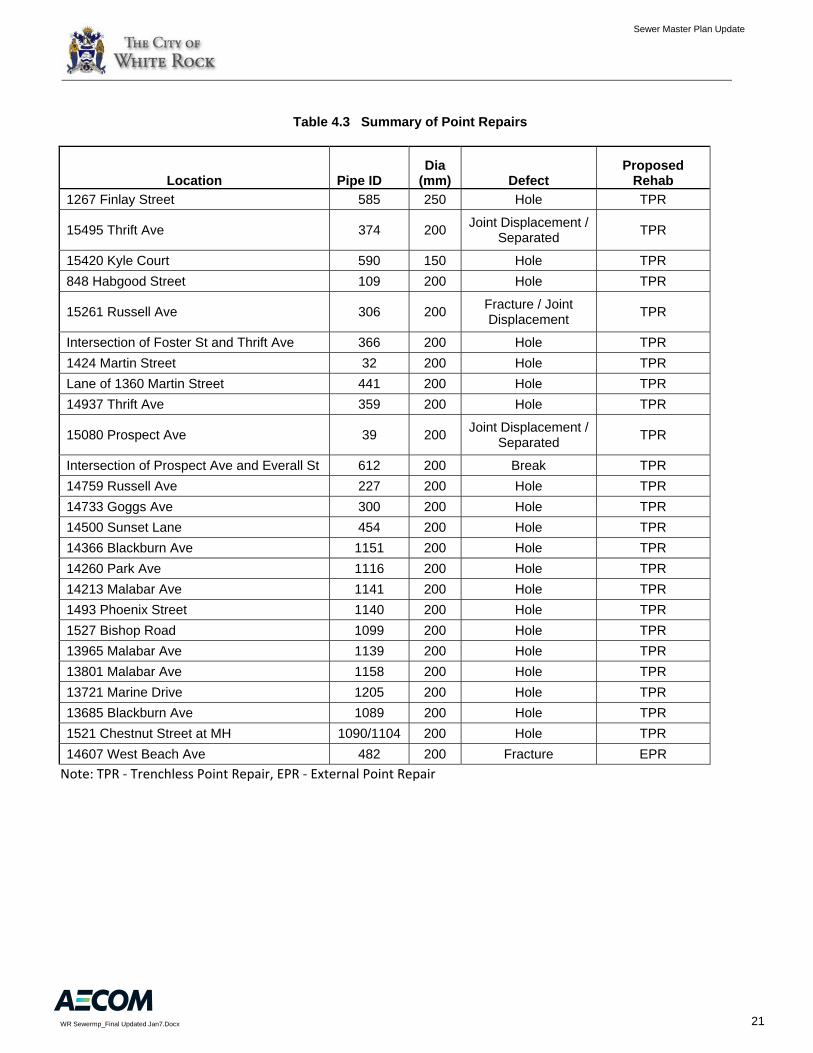
Condition assessment data was provided by the City in the form of a geodatabase containing shapefiles compiled by KWL. The data is also presented in the Audit of Sanitary Rehabilitation Program Draft Report (KWL 2011). Upon review of the report and GIS information it appears that the majority of the sewers with a structural internal condition grade (ICG) of 5 (i.e. most likely to fail) have been replaced or repaired. A significant number of sewers with an ICG of 3 or 4 remain and have been highlighted for rehabilitation in this SMP report along with several point repairs for sewers with holes or major joint displacements. The 2011 condition assessment report also highlighted sewers where inspections were either incomplete or abandoned. Reasons for the incomplete/abandoned inspections include the following items several of which are problems that should be rectified:
debris in sewer, pipe too slippery for the camera, camera underwater, intruding connections, major root intrusion, large joint deflections, unidentified obstructions, and collapsed pipes (these appear to have been repaired).
A further review of the sewers identified as having inspections that were incomplete or abandoned, yielded the results shown in Figure 4.2. There are a significantly reduced number of incomplete sewer inspections in the current figure than those shown in the 2011 KWL report which is suspect. Further review of the CCTV data and sewer condition assessment results is required to determine where the discrepancies are. A list of sewer rehabilitation projects including point repairs (external and internal) as well as full segment replacements are included in the Capital Plan and shown in Figure 4.3. A summary of the point repairs is shown in Table 4.3 and is included in the Capital Plan as a line item along with each full pipe segment replacement. It should be noted that additional inspection on any pipes recommended for replacement or rehabilitation should be completed prior to initiating any works.

Sewer Master Plan Update
Figure 4.2
Project No. Date
60238740 July 2012
q
0 200 400 600 800100
Meters
Incomplete/AbandonedCCTV Assessments
BE
RG
ST
RU
M R
D
BIS
HO
P R
D
THRIFT AVE
OX
FO
RD
ST
FIN
LA
Y S
T
STA
YT
E R
D
MARINE DR
NORTH BLUFF RD
BUENA VISTA AVE
Legend
Survey Completion Level
Survey Abandoned
Survey Inconclusive
Survey Completed

Sewer Master Plan Update
Figure 4.3
Project No. Date
60238740 July 2012
q
0 175 350 525 70087.5
Meters
Sanitary Sewer Recommended
Rehabilitation Works
BE
RG
ST
RU
M R
D
BIS
HO
P R
D
THRIFT AVE
OX
FO
RD
ST
FIN
LA
Y S
T
STA
YT
E R
D
MARINE DR
NORTH BLUFF RD
BUENA VISTA AVENOTE: SEWER UPGRADESINCLUDED IN CURRENT BUDGET
Legend
Recommended Sewer Pipe Rehabilitation
External Point Repair
Replace Segment
Trenchless Point Repair
Gravity Main
Forcemain
MV Interceptor
MV Forcemain
Siphon
Sewer Master Plan Update
WR Sewermp_Final Updated Jan7.Docx 21
Table 4.3 Summary of Point Repairs
Location Pipe ID Dia
(mm) Defect Proposed
Rehab
1267 Finlay Street 585 250 Hole TPR
15495 Thrift Ave 374 200 Joint Displacement /
Separated TPR
15420 Kyle Court 590 150 Hole TPR
848 Habgood Street 109 200 Hole TPR
15261 Russell Ave 306 200 Fracture / Joint Displacement
TPR
Intersection of Foster St and Thrift Ave 366 200 Hole TPR
1424 Martin Street 32 200 Hole TPR
Lane of 1360 Martin Street 441 200 Hole TPR
14937 Thrift Ave 359 200 Hole TPR
15080 Prospect Ave 39 200 Joint Displacement /
Separated TPR
Intersection of Prospect Ave and Everall St 612 200 Break TPR
14759 Russell Ave 227 200 Hole TPR
14733 Goggs Ave 300 200 Hole TPR
14500 Sunset Lane 454 200 Hole TPR
14366 Blackburn Ave 1151 200 Hole TPR
14260 Park Ave 1116 200 Hole TPR
14213 Malabar Ave 1141 200 Hole TPR
1493 Phoenix Street 1140 200 Hole TPR
1527 Bishop Road 1099 200 Hole TPR
13965 Malabar Ave 1139 200 Hole TPR
13801 Malabar Ave 1158 200 Hole TPR
13721 Marine Drive 1205 200 Hole TPR
13685 Blackburn Ave 1089 200 Hole TPR
1521 Chestnut Street at MH 1090/1104 200 Hole TPR
14607 West Beach Ave 482 200 Fracture EPR
Note: TPR ‐ Trenchless Point Repair, EPR ‐ External Point Repair

Sewer Master Plan Update
WR Sewermp_Final Updated Jan7.Docx 22
5 Recommendations
This section summarizes our recommendations for the Sewer Master Plan after completing the hydraulic assessment and review of available condition assessment data. The focus for the recommendations is to meet the City’s key issues and objectives outlined in Section 1.2.
5.1 Comparison with Previous Recommendations
The 2010 Capital Plan provided by KWL included several recommendations for major sanitary sewer upgrades and a proposed pump station that were designed for conveyance of the 100-Year Peak Hour I&I rates and to reduce the potential for sanitary sewer overflow (SSO) occurrence at the Metro Vancouver PS and elsewhere in the collection system. These previously proposed upgrades are discussed below along with a rationale as to how our analysis differs and why specific upgrades were modified or excluded from this Master Plan. Reduction from 100-Year to 50-Year I&I Event One of the most significant changes for the updated Master Plan is the use of a 50-Year event as opposed to 100-Year event that was previously used. Although the 50-Year event is less conservative, it was determined to be more realistic and achievable for White Rock given the limited tax base available for implementation or large scale capital projects. The 50-Year return period was also determined to be an acceptable frequency that one may anticipate localized sewer backup to occur balanced with financial capital cost for system upgrades compared to larger events. This change is further rationalized given that Metro Vancouver’s documented I&I target is for the 5-Year return period event (or 11,200 L/Ha/day) and there was no anecdotal evidence of reported overflows within the last 5 years from either the City or Metro Vancouver. Oxford Street Pump Station & Diversion A major upgrade that was proposed in the previous Capital Plan included a new diversion (from Johnston Street to Thrift Avenue) and pump station at Oxford Street and Thrift Avenue that would be tied into the Metro Vancouver forcemain. The diversion and pump station were intended to reduce flows to the Metro Vancouver Pump Station as it is currently undersized for future flow conditions. Several challenges were presented with siting of a new pump station at Oxford and Thrift included the tie-in to an aging AC MV forcemain, utility relocations, and provisions for overflows requiring connections to the gravity sewer system. The forcemain connection issue introduced the need to construct a new twin forcemain to convey flows up to the MV interceptor sewer at North Bluff Road and the associated costs for this infrastructure. Upon further review of the proposed diversion and pump station at Oxford Street we confirmed that the major benefit was a reduction in flows at the MV Pump Station and there were limited improvements to the City’s collection system. It was also determined that under the future conditions the MV Pump Station is still in need of upgrading even with a new Oxford Street Pump Station. In such case, we have not recommended that the City proceed with the new pump station or associated diversion as this would result is significant cost to the City that could be avoided by upgrading the MV Pump Station. It should also be noted that upgrades to the MV Pump Station would be funded by the Fraser Sewerage Area managed by Metro Vancouver and not directly by the City.
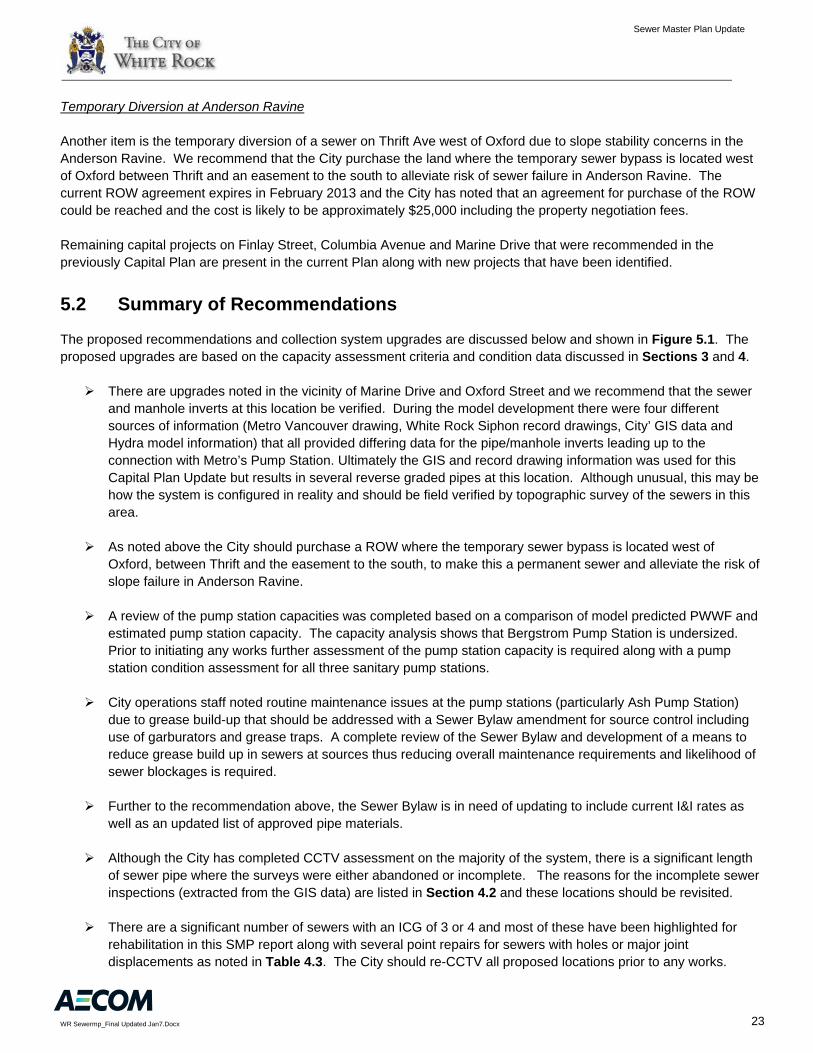
Sewer Master Plan Update
WR Sewermp_Final Updated Jan7.Docx 23
Temporary Diversion at Anderson Ravine Another item is the temporary diversion of a sewer on Thrift Ave west of Oxford due to slope stability concerns in the Anderson Ravine. We recommend that the City purchase the land where the temporary sewer bypass is located west of Oxford between Thrift and an easement to the south to alleviate risk of sewer failure in Anderson Ravine. The current ROW agreement expires in February 2013 and the City has noted that an agreement for purchase of the ROW could be reached and the cost is likely to be approximately $25,000 including the property negotiation fees. Remaining capital projects on Finlay Street, Columbia Avenue and Marine Drive that were recommended in the previously Capital Plan are present in the current Plan along with new projects that have been identified.
5.2 Summary of Recommendations
The proposed recommendations and collection system upgrades are discussed below and shown in Figure 5.1. The proposed upgrades are based on the capacity assessment criteria and condition data discussed in Sections 3 and 4.
There are upgrades noted in the vicinity of Marine Drive and Oxford Street and we recommend that the sewer and manhole inverts at this location be verified. During the model development there were four different sources of information (Metro Vancouver drawing, White Rock Siphon record drawings, City’ GIS data and Hydra model information) that all provided differing data for the pipe/manhole inverts leading up to the connection with Metro’s Pump Station. Ultimately the GIS and record drawing information was used for this Capital Plan Update but results in several reverse graded pipes at this location. Although unusual, this may be how the system is configured in reality and should be field verified by topographic survey of the sewers in this area.
As noted above the City should purchase a ROW where the temporary sewer bypass is located west of Oxford, between Thrift and the easement to the south, to make this a permanent sewer and alleviate the risk of slope failure in Anderson Ravine.
A review of the pump station capacities was completed based on a comparison of model predicted PWWF and estimated pump station capacity. The capacity analysis shows that Bergstrom Pump Station is undersized. Prior to initiating any works further assessment of the pump station capacity is required along with a pump station condition assessment for all three sanitary pump stations.
City operations staff noted routine maintenance issues at the pump stations (particularly Ash Pump Station) due to grease build-up that should be addressed with a Sewer Bylaw amendment for source control including use of garburators and grease traps. A complete review of the Sewer Bylaw and development of a means to reduce grease build up in sewers at sources thus reducing overall maintenance requirements and likelihood of sewer blockages is required.
Further to the recommendation above, the Sewer Bylaw is in need of updating to include current I&I rates as well as an updated list of approved pipe materials.
Although the City has completed CCTV assessment on the majority of the system, there is a significant length of sewer pipe where the surveys were either abandoned or incomplete. The reasons for the incomplete sewer inspections (extracted from the GIS data) are listed in Section 4.2 and these locations should be revisited.
There are a significant number of sewers with an ICG of 3 or 4 and most of these have been highlighted for rehabilitation in this SMP report along with several point repairs for sewers with holes or major joint displacements as noted in Table 4.3. The City should re-CCTV all proposed locations prior to any works.

Sewer Master Plan Update
WR Sewermp_Final Updated Jan7.Docx 24
The City should conduct condition assessment on approximately 10% or 8 km of sewers each year. The
results of the CCTV inspections should be reviewed by a qualified consultant to determine the rehabilitation works required and priority that they should be completed in. In addition to sewers, the manholes should also be inspected for both structural and service defects.
Operation and maintenance of the Siphon could be enhanced by reinstating the water level monitor for the siphon at Maple Street and Victoria Ave. We understand there was an Operations Manual for the Siphon that was completed back in 2000 when the project was completed and this document should be reviewed to assess what maintenance measures are in place and could be improved upon.

BE
RG
ST
RU
M R
D
BIS
HO
P R
D
THRIFT AVE
OX
FO
RD
ST
MARINE DR
NORTH BLUFF RD
BUENA VISTA AVE
FIN
LA
Y S
T
STA
YT
E R
D
BE
RG
ST
RO
M R
D
MARINE DR
MALABAR AVE
COLUMBIA AVE
MA
RT
IN S
T
VID
AL
ST
GOGGS AVE
FIR
ST
VICTORIA AVE
COLDICUTT AVE
LE
E S
T
ROPER AVE
LANE
BLACKBURN AVE
OXENHAM AVE
KE
IL S
T
EV
ER
AL
L S
T
KE
NT
ST
SATURNA DR VINE AVE
MA
PL
E S
T
NORTH BLUFF RD
EW
SO
N S
T
BL
AC
KW
OO
D S
T
WIN
TE
R S
T
SUNSET DR
ST
AY
TE
RD
FO
ST
ER
ST
PA
RK
ER
ST
TERRY RD
GE
OR
GE
ST
ST
EV
EN
S S
T
HARDIE AVE
ME
RK
LIN
ST
THRIFT AVE
BR
EA
RL
EY
ST
MANN PARK CRES
BLACKBURN CRES
GORDON AVE
HA
BG
OO
D S
T
CLIFF AVE
ROYAL AVE
VISTA D
R
JO
HN
ST
ON
RD
BE
ST
ST
RUSSELL AVE
PACIFIC AVE
PROSPECT CRES
WEST BEACH AVE
HIG
H S
T
EL
M S
T
BUENA VISTA AVE
MCDONALD AVE
PA
RK
ER
PL
UPPER ROPER LN
FIN
LA
Y S
T
BEACHVIEW AVE
KE
IL C
RE
S
LAUREL AVE
WHEATLEY AVE
SEMIAHMOO AVE
BA
LS
AM
ST
PA
RK
AV
E
OX
FO
RD
ST
MAGDALEN AVE
HO
SP
ITA
L S
T
MALABAR CRES
KYLE CRT
CH
ES
TN
UT
ST
NI C
HO
L R
D
BIS
HO
P R
D
AS
H S
T
MOFFAT LANE
BELLEVUE CRES
PROSPECT AVE
LA
NC
AS
TE
R S
T
BA
Y S
T
AN
DE
RS
ON
ST
CO
RY
RD
KE
RF
OO
T R
D
SEYMOUR AVE
FINLAY CRT
AR
CH
IBA
LD
RD
STOCKER CRT
MAGDALEN CRES
CE
NT
RE
ST
PA
CIF
IC P
L
DO
LP
HIN
ST
DU
PR
EZ
ST
CY
PR
ES
S S
T
BE
RG
ST
RO
M R
D
MALABAR AVE
BL
AC
KW
OO
D S
T
GOGGS AVE
ME
RK
LIN
ST
RUSSELL AVE
MARINE DR
BE
ST
ST
GOGGS AVE
OXENHAM AVE
OX
FO
RD
ST
KE
NT
ST
THRIFT AVE
COLDICUTT AVE
FO
ST
ER
ST
VID
AL
ST
BR
EA
RL
EY
ST
FO
ST
ER
ST
VINE AVE
EV
ER
AL
L S
T
MAGDALEN AVE
PR
OS
PE
CT
CR
ES
PA
RK
ER
ST
MARINE DR
RUSSELL AVE
MA
PL
E S
T
ROPER AVE
NORTH BLUFF RD
THRIFT AVEMARINE DR
HA
BG
OO
D S
T
KE
NT
ST
SUNSET DR
VICTORIA AVE
KE
NT
ST
VICTORIA AVE
ST
EV
EN
S S
T
MARINE DR
LE
E S
T
ST
AY
TE
RD
MARINE DR
MAGDALEN AVE
THRIFT AVETHRIFT AVE
MA
RT
IN S
T
LE
E S
T
ROYAL AVE
JO
HN
ST
ON
RD
PR
OS
PE
CT
CR
ES
NORTH BLUFF RD
VINE AVE
SEMIAHMOO AVE
BUENA VISTA AVE
COLUMBIA AVE
BLACKBURN AVE
BUENA VISTA AVE
VINE AVE
NORTH BLUFF RD
HA
BG
OO
D S
T
COLUMBIA AVE
ROPER AVE
GOGGS AVE
MARINE DR
MA
PL
E S
T
PACIFIC AVE
FIR
ST
FIR
ST
KE
IL S
T
VINE AVE
ST
AY
TE
RD
BE
ST
ST
ROPER AVE
BLACKBURN AVE
TE
RR
Y R
D
KE
NT
ST
MA
PL
E S
T
CLIFF AVE
GOGGS AVE
JO
HN
ST
ON
RD
FIN
LA
Y S
T
20
0
525
450
15
0
25
0
10
0
0
300
20
0
100
150
20
0
525200
100
100
200
30
0
20
0
100
200
20
0
200
15
0
200
20
02
00
200
200
200
25
0
20
0
200
200
100
20
0
525
100
200
200
200
200
20
0
20
0
20
0
150
150
20
0
150
200
200
10
0
200
250
200
20
0
25
0
20
0
200
20
0
200
200
15
0
200
200
100
20
0
200
200
20
0
200
200
20
0
300
200
15
0
200
150
20
0
2003
00
150
200
200
0
20
0
200 200
250
200
300
20
0
20
0
200
200
200
200
200
20
0
20
0
20
0
30
0
200
100
200
20
0
200
20
0
20
0
200200
200
450
20
0
200
20
0
15
0
200
200
200
200
20
0
20
0
300
200
200
200
20
0
200
20
0
0
20
0200
20
0
20
0
30
0
20
0
200
250
200
100
20
0
20
0
200
200
20
0
20
0
20
0
20
0
200
200
25
0
20
0
200
250
20
0
200
200
20
0
20
0
200
200
200
20
0
200
150
20
0
20
0
20
0
200
20
020
0
250
20
0
150
200
200
30
0
200
200
200
200
200
20
0
200
200
25
0
200
200
200
20
0
200
20
0
200
200
15
0
20
0
20
0
200
200
20
0
20
0
20
0
150
150
200
25
0
200
200
20
0
200
200
20
0
200
200
200
200
200
250
100
20
0
200
200
525
20
0
20
0
200
200
20
0
20
0
20
0
450
20
0
200
150
300
200
200
200
150
200
20
0
20
0
200
200
20
0
200
2001
00
20
0
200
20
0
200
200
200 150
200
200
20
0
200
20
0
25
0
250
25
0
20
0
150
200
20
0
200
0
200
200
25
0
200
200
25
0
200
20
0
20
0
200
20
0
20
0
20
0
20
0
200
0
200
150
20
0
200
200
20
0
200
200
20
0
200
200
200
20
0
20
0
200
450
300
150
20
0
200200
25
0
200
200
20
0
25
0
150
200
20
0
200
100
20
0
450
200
200
200
200
20
0
20
0
200
200
200
20
0
200
200
200
20
0
200
200
200
200
200
20
0
200
20
0
200
150
20
0
20
0
20
0
20
0
100
20
0
20
0
200
20
0
20
0
20
0
200
200
150
200
0
20
0
450
250
200
200
200 20
0
200
200
20
0
20
0
20
0
200
0
20
0
200
25
0
300
200
200
200
150
200
20
0
200
200
10
0
20
0
200
25
0
250
20
0
20
0
200
200
200
200
20
0
20
0
200
20
0
250
200
200
20
0
200200
150
20
0
200
200
20
0
20
0
200
200
200
20
0
100
150
20
0
200
20
0
200
200
20
0
52
5
200
150
300
20
0
15
0
20
0
20
0
20
0
200
200
200
20
0
100
200
200
25
0
200200
200
300
20
0
200
200
200
200
200
200
200200
20
0
0
20
0
20
0
25
0
20
0
20
0
20
0
200
200
200
20
0
200
200
200
200
150
200
0
200
200
20
0
20
0
20
0
200200
0
150
25
0
200200
200
0150
200
200
250
200
150
20
0
250
15
0
200
20
0200
20
0
200
250
25
0
200
200
250
200
200
20
0
20
0
100
200
20
0
20
0
300
200
200
20
0
200
15
0
30
0
20
0
200
20
0
20
0
200
300
20
0
20
0
20
0
300
150
200
20
0
20
0
200
200
200
20
0
150
20
0
20
0
200
200
200
20
0
200
20
0
200
20
0
300
20
0
200
20
0
25
0
200
200
200
200
200
20
0
20
0
100
20
0
200
200
15
0
200
200
20
0
200
20
0
200
25
0
25
0
20
0
200
200
200
200
200
200
200
200
20
0
200
200
20
0
25
0
200
200
200
200
200
20
0
200
25
0
200
200
200
200
200
200
200
20
0
20
0
200
20
0
150
20
0
200
20
0
20
0
20
0
200
200
200
20
0
200
20
0
20
0
20
0
20
0
300
20
0
25
0
20
0
200
200
20
0
20
0
200
525
20
0
200200
200
15
0
20
0
20
0
20
0
200
20
0
20
0
200
200
20
0
20
0
300
10
0
100
200
25
0
20
0
200200
200
20
0
200
0
20
0
20
0
200
20
0
450
375
25
0
200
300
450
300
30
0
375
25
0
300
250
375
250
250
375
300
375 300
250
250 250
300
375
375
250
375
250
375
250
375
300
Sewer Master Plan Update
Figure 5.1
Project No. Date
60238740 July 2012
q
0 200 400 600 800100
Meters
Proposed Upgrades
Legend
Proposed Upgrade
Existing Sewer
Prop Dia
Exist Dia
Upgrade Based On Condition
Exist Dia

Sewer Master Plan Update
WR Sewermp_Final Updated Jan7.Docx 25
6 10-Year Capital Plan
This section details the 10-year capital plan for the City of White Rock to complete the proposed sanitary sewer improvements. The capital plan has also been divided into priority items in consideration of White Rock’s allowable annual budget for sewer works. The cost estimates have been prepared based on unit rates and lump sum amounts in our possession and are in Year 2012 dollars. These costs include sanitary sewer and manhole replacement; and asphalt replacement with re-use of road gravel/structural material. Cost excludes service connection replacement to property line. A contingency allowance of 25% and an engineering allowance of 10% have been included for each year while HST is not included. The following table (Table 6.1) summarizes the unit cost used, and it is important to note these costs include sewers, manholes and road restoration.
Table 6.1 Unit Costs for Upgrades
Item / Description Unit Unit Cost
200mm sewer (c/w backfill & asphalt restoration) m $700
250mm sewer (c/w backfill & asphalt restoration) m $743
300mm sewer (c/w backfill & asphalt restoration) m $798
375mm sewer (c/w backfill & asphalt restoration) m $886
450mm sewer (c/w backfill & asphalt restoration) m $963
525mm sewer (c/w backfill & asphalt restoration) m $1,122
600mm sewer (c/w backfill & asphalt restoration) m $1,199
TPR/EPR ea $5,000
A summary of the total expenditure for capital improvements per year is provided in Table 6.2 below.
Table 6.2 Summary of Capital Plan
Year Approximate Length to
be Replaced (m) Cost Estimate
2013* 1,349 $ 1,645,800
2014 685 $ 878,400
2015 406 $ 588,000
2016 612 $ 820,900
2017 602 $ 684,500
2018 ‐ 2023 854 $ 2,509,300
Total 4,507 $ 7,126,900
* 2013 upgrades include works on Marine Drive from High Street to Bishop Road
Keeping in mind that The City’s allowable annual budget is less than $1M a year for sewer related capital improvements, we have prioritized the upgrades for each year for the first five years. All the remaining upgrades can be completed in the next five years. Figure 6.1 shows the proposed sanitary upgrades based on the year required. A detail breakdown of the proposed capital improvements for each phase is shown in Table 6.3.

Table 6.3 Details of 10-Year Capital Plan
Item # Project Location
Street/Location Model ID
Exist Dia
(mm)
Prop Dia.
(mm)
Length
(m)
50‐Year
Peak Flow
(L/s)
Max
Flow/Design
Flow
Unit Rate
($/m) Cost Estimate ($)
1.1 Russell Ave at Finlay St Russell Ave from Finlay St to 15521 Russell Ave P‐56 200 200 50.5 11.0 0.19 700$ 35,369$
1.2 Blackwood Street Blackwood Street from 1473 Blackwood St to 1521 Blackwood St P‐284 200 200 91.5 7 0.12 700$ 64,051$
1.3 Goggs Ave at Best Street Goggs Ave from 15460 Goggs Ave to Best St P‐234 200 200 115.5 3 0.06 700$ 80,857$
1.4 Lane East of Fir Street from
1360 Fir St to Thrift Ave Lane East of Fir Street from 1360 Fir St to Thrift Ave P‐414 200 200 69.0 7 0.11 700$ 48,300$
Maple Street from 976 Maple St to 990 Maple St P‐927 200 200 24.0 28 0.19 700$ 16,800$
Maple Street from 948 Maple St to 976 Maple St P‐949 200 200 61.0 30 0.24 700$ 42,700$
1.6 Victoria Ave at Finlay St Victoria Ave from Finlay St to 15574 Victoria Ave P‐1028 200 200 60.0 1 0.01 700$ 42,008$
1.7 Kent Street at Marine DriveKent Street from 15791 Marine Dr to 839 Kent St P‐1033 200 200 49.0 3 0.08 700$ 34,300$
Marine Dr from High St to 14508 Sunset Dr P‐548 200 300 55.8 92 1.11 798$ 44,496$
Marine Dr frrom 14508 Sunset Dr to 14478 Sunset Dr P‐540 200 300 77.1 106 0.94 798$ 61,550$
Marine Dr from 14478 Sunset Dr to 14436 Sunset Dr P‐531 200 300 70.9 105 1.00 798$ 56,546$
Marine Drive from 14436 Sunset Dr to Magdalen Cres P‐506 200 300 66.0 105 1.31 798$ 52,676$
Marine Dr from Magdalen Cres to 14391 Marine Dr P‐1427 200 300 56.5 79 0.98 798$ 45,119$
Marine Drive from 14391 Marine Dr to Brearley St P‐455 200 300 77.7 79 0.93 798$ 61,977$
Marine Dr from Brearley St to 14310 Sunset Dr P‐1224 200 300 84.4 79 1.27 798$ 67,327$
Marine Dr from 14310 Sunset Dr to 14283 Marine Dr P‐1223 200 300 48.8 84 0.86 798$ 38,903$
Marine Dr from 14283 Marine Dr to 14249 Marine Dr P‐1222 200 250 73.1 83 1.08 743$ 54,343$
Marine Drive from 14249 Marine Dr to 14213 Marine Dr P‐1221 200 250 79.0 82 0.92 743$ 58,705$
Marine Drive from 14213 Marine Dr to 14205 Marine Dr P‐1220 200 250 26.0 82 1.18 743$ 19,331$
Marine Drive from 14205 Marine Dr to Bishop Rd P‐1218 200 250 112.7 79 1.00 743$ 83,756$
1.9 Trenchless Point Repairs ‐ Various Locations 125,000$
1.10 Purchase of ROW for Temporary Sewer Bypass ‐ Anderson Ravine 25,000$
1.11 Annual CCTV Inspection (Approx. 8km of Storm Sewers) 7.5$ 60,000$
1,219,115$
121,911$
304,779$
1,645,805$
Columbia Ave from Kent St to 15827 Columbia Ave P‐977 250 375 62.6 116 1.06 886$ 55,437$
Columbia Ave from 15827 Columbia Ave to Keil St P‐978 200 375 39.2 115 1.05 886$ 34,740$
Columbia Ave from Keil St to Habgood St P‐8087 300 375 105.1 82 0.82 886$ 93,083$
Columbia Ave from Habgood St to Stevens St P‐980 200 375 88.5 78 1.32 886$ 78,438$
Columbia Ave from Stevens St to Stayte Rd P‐112 200 300 101.2 105 1.00 798$ 80,766$
Intersection of Columbia Ave and Parker St P‐8053 200 300 4.8 24 0.87 798$ 3,830$
Intersection of Buena Vista Ave and Johnston Rd P‐648 300 450 4.6 96 1.73 963$ 4,449$
Buena Vista Ave from Johnston Rd to 1273 Fir St P‐627 200 375 111.1 75 1.35 886$ 98,408$
Buena Vista Ave 1273 Fir St to 1225 Merkin St P‐628 200 375 116.1 75 1.41 886$ 102,882$
Buena Vista Ave from 15367 Buena Vista Ave to Best St P‐637 200 250 52.0 24 1.36 743$ 38,636$
2.3 Annual CCTV Inspection (Approx. 8km of Storm Sewers) 7.5$ 60,000$
650,669$
65,067$
162,667$
878,403$
Intersection of Finlay St and Russell Ave P‐258 200 250 3.5 33 1.15 743$ 2,623$
Russell Ave at 15521 Russell Ave P‐253 200 250 6.2 26 1.06 743$ 4,629$
Marine Dr at 14780 Marine Dr P‐8112 450 600 5.9 262 1.05 1,199$ 7,074$
Marine Dr at 14780 Marine Dr P‐8111 375 450 23.4 141 3.16 963$ 22,486$
Marine Dr from 14780 Marine Dr to Oxford St P‐8113 450 600 37.9 262 0.84 1,199$ 45,454$
Marine Dr from 14780 Marine Dr to 14757 Marine Dr P‐8109 375 450 21.0 139 0.91 963$ 20,184$
Marine Dr 14757 Marine Dr to Anderson St P‐686 375 450 123.4 191 0.94 963$ 118,834$
Marine Dr at intersection of Marine Dr and Anderson St P‐622 200 450 17.0 190 0.45 963$ 16,400$
Anderson St from Marine Dr to 1209 Anderson St P‐8 200 300 44.7 91 0.87 798$ 35,687$
Oxford St from Marine Dr to 1184 Oxford St P‐21 300 375 43.2 190 1.30 886$ 38,249$
Oxford St from 1184 Oxford St to Buena Vista Ave P‐687 200 300 28.5 81 0.91 798$ 22,743$
Buena Vista Ave from Oxford St to 14811 Buena Vista Ave P‐632 200 300 26.5 75 1.00 798$ 21,171$
Buena Vista Ave from 14811 Buena Vista Ave to 14831 Buena Vista Ave P‐633 200 300 25.1 75 0.95 798$ 19,998$
3.4 Annual CCTV Inspection (Approx. 8km of Storm Sewers) 7.5$ 60,000$
435,531$
43,553$
108,883$
587,968$
3.1
Oxford St at Buena Vista Ave
Marine Dr from Anderson St
to Oxford St3.2
3.3
2.1
Buena Vista Ave from
Johnston Rd to Best Street2.2
Russell Ave near Finlay St
Sub‐Total
Engineering 10%
Contingency 25%
Total
Year 2013 ‐ Replacement of Sewers based on Condition Assessment & Capacity
Year 2014 ‐ Replacement of Sanitary Sewers based on Capacity
Year 2015 ‐ Replacement of Sanitary Sewers based on Capacity
Maple St south of Pacific Ave1.5
Total
Sub‐Total
Engineering 10%
Contingency 25%
Total
Sub‐Total
Engineering 10%
Contingency 25%
Marine Dr from Bishop to
High St1.8
Columbia Ave from Parker to
Stayte Road

Table 6.3 Details of 10-Year Capital Plan
Item # Project Location
Street/Location Model ID
Exist Dia
(mm)
Prop Dia.
(mm)
Length
(m)
50‐Year
Peak Flow
(L/s)
Max
Flow/Design
Flow
Unit Rate
($/m) Cost Estimate ($)
Marine Dr from Oxford St to Elm St P‐756 300 375 134.3 73 1.05 886$ 118,990$
Marine Dr from Elm St to 14881 Marine Dr P‐24 300 375 62.0 62 1.19 886$ 54,941$
Marine Dr frin 14881 Marine Dr to Vidal St P‐27 300 375 76.8 61 1.15 886$ 68,009$
Marine Dr from Anderson St to 14661 Marine Dr P‐621 200 450 74.2 115 0.79 963$ 71,483$
Marine Dr 14661 Marine Dr to 14647 Marine Dr P‐608 200 375 28.9 114 0.73 886$ 25,588$
Marine Dr from 14647 Marine Dr to Bay St P‐600 200 375 109.9 113 0.79 886$ 97,327$
Marine Dr from Bay St to Duprez St P‐572 200 375 52.8 113 1.32 886$ 46,807$
Marine Dr from Duprez St to High St P‐6 200 375 73.3 110 1.65 886$ 64,944$
4.3 Annual CCTV Inspection (Approx. 8km of Storm Sewers) 7.5$ 60,000$
608,089$
60,809$
152,022$
820,921$
Marine Dr from Bishop Rd to 14123 Marine Dr P‐1217 200 250 56.6 69 0.93 743$ 42,032$
Marine Dr from 14123 Marine Dr to 14101 Marine Dr P‐8107 200 250 47.0 69 0.96 743$ 34,921$
Marine Dr from 14101 Marine Dr to 14093 Marine Dr P‐1213 200 250 17.1 60 0.91 743$ 12,698$
Marine Dr from 14093 Marine Dr to 14046 Marine Dr P‐1195 200 250 86.2 60 0.77 743$ 64,047$
Marine Dr from 14046 Marine Dr to 14008 Marine Dr P‐1193 200 250 71.3 60 1.15 743$ 52,961$
Marine Dr from 14008 Marine Dr to Nichol Rd P‐1054 200 250 39.6 57 1.78 743$ 29,453$
Marine Dr from Nichol Rd to 13937 Marine Dr P‐1192 200 250 104.0 43 1.25 743$ 77,235$
Marine Dr from 13937 Marine Dr to 13881 Marine Dr P‐1247 200 250 114.6 43 1.31 743$ 85,140$
Marine Dr from 13881 Marine Dr to 13857 Marine Dr P‐1267 200 250 65.4 30 0.83 743$ 48,570$
5.2 Annual CCTV Inspection (Approx. 8km of Storm Sewers) 7.5$ 60,000$
507,056$
50,706$
126,764$
684,525$
6.1Sunset Dr from Brearley St
to Kerfoot Rd Sunset Dr from Brearley St to Kerfoot Rd P‐1215 200 250 100.3 23 0.88 743$ 74,486$
Finlay St from Columbia Ave to 918 Finlay St P‐970 300 375 22.0 92 0.98 886$ 19,492$
Columbia from Maple St to Finlay St P‐8046 300 375 92.9 112 0.91 886$ 82,283$
6.3Pacific Ave from Stayte Rd to
Stevens St Pacific Ave from Stayte Rd to Stevens St P‐114 200 250 96.1 28 0.97 743$ 71,417$
6.4Stayte Rd from 1127 Stayte
Rd to Buena Vista AveStayte Rd from 1127 Stayte Rd to Buena Vista Ave P‐776 200 250 146.7 74 1.31 743$ 108,968$
Finlay St from 1341 Finlay St to 15590 Thrift Ave P‐451 200 250 100.0 58 0.95 743$ 74,300$
Finlay St 15590 Thrift Ave to Thrift Ave P‐79 200 250 54.0 52 0.93 743$ 40,122$
Finlay St from Thrift Ave to Goggs Ave P‐329 200 300 94.5 48 0.98 798$ 75,411$
6.6Roper Ave from Multi 52 to
15265 Roper Ave Roper Ave from Multi 52 to 15265 Roper Ave P‐52 200 300 94.3 30 0.99 798$ 75,227$
6.7Property of Centennial
Arena, Multi 76 Property of Centennial Arena, Multi 76 P‐314 150 200 52.9 16 0.92 700$ 37,044$
6.8 Bergstrom Pump Station Upgrade 900,000$ 900,000$
6.9 Annual CCTV Inspection (Approx. 8km of Storm Sewers per year) 7.5$ 300,000$
1,858,751$
185,875$
464,688$
2,509,313$ Total
Contingency 25%
Total
Sub‐Total
Engineering 10%
Contingency 25%
Years 2018‐2023 ‐ Replacement of Remaining Undersized Sanitary Sewers
Finlay St and Columbia Ave
Intersection6.2
Finlay St from Goggs Ave to
Roper Ave6.5
Engineering 10%
Contingency 25%
Total
Sub‐Total
Engineering 10%
Year 2017 ‐ Replacement of Sanitary Sewers based on Capacity
Marine Dr east of Bishop
Road5.1
Sub‐Total
Year 2016 ‐ Replacement of Sanitary Sewers based on Capacity
Marine Dr from Oxford St to
Vidal St4.1
Marine Dr from High St to
Anderson St4.2

200
200
20
0
20
0
200
20
0
20
0
450
375
250
200
600
300
375
250
250
375
300
300
25
0
300
25
0
250
250
300
375
300
300
450
300
250
250 25
0
300
250
37
5
300
250
375
375
375
250
375 375
250
375
250
300
375375
250
250
30
0
375
375
250
375
Sewer Master Plan Update
Figure 6.1
Project No. Date
60238740 July 2012
q
0 200 400 600 800100
Meters
Capital Projects
BE
RG
ST
RO
M R
D
BIS
HO
P R
D
OX
FO
RD
ST
FIN
LA
Y S
T
STA
YT
E R
D
THRIFT AVE
MARINE DR
BUENA VISTA AVE
NORTH BLUFF RD
Legend
Proposed Upgrade
2013
2014
2015
2016
2017
2018-2023
Existing Sanitary Sewer

Appendix Flysheets.Docx
Appendix A
Dry and Wet Weather Model Calibration and Validation

4
6
8
10
Flo
w (
L/s)
Figure 1a: Site 1 Dry Weather Flow Calibration
0
2
3/2
1/1
2
1
2:0
0 A
M
3/2
1/1
2
1
2:0
0 P
M
3/2
2/1
2
1
2:0
0 A
M
3/2
2/1
2
1
2:0
0 P
M
3/2
3/1
2
1
2:0
0 A
M
3/2
3/1
2
1
2:0
0 P
M
3/2
4/1
2
1
2:0
0 A
M
3/2
4/1
2
1
2:0
0 P
M
3/2
5/1
2
1
2:0
0 A
M
3/2
5/1
2
1
2:0
0 P
M
3/2
6/1
2
1
2:0
0 A
M
Monitored Flow(L/s) Modeled Flow (L/s)

0
10
206
8
10
12
14
16
18
Flo
w (
L/s)
Figure 1b: Site 1 Wet Weather Flow Calibration
Ra
infa
ll I
nte
nsi
ty (
mm
/hr)
Ra
infa
ll I
nte
nsi
ty (
mm
/hr)
Ra
infa
ll I
nte
nsi
ty (
mm
/hr)
Ra
infa
ll I
nte
nsi
ty (
mm
/hr)
300
2
4
2/2
0/1
2
1
2:0
0 A
M
2/2
0/1
2
1
2:0
0 P
M
2/2
1/1
2
1
2:0
0 A
M
2/2
1/1
2
1
2:0
0 P
M
2/2
2/1
2
1
2:0
0 A
M
2/2
2/1
2
1
2:0
0 P
M
2/2
3/1
2
1
2:0
0 A
M
2/2
3/1
2
1
2:0
0 P
M
2/2
4/1
2
1
2:0
0 A
M
2/2
4/1
2
1
2:0
0 P
M
2/2
5/1
2
1
2:0
0 A
M
2/2
5/1
2
1
2:0
0 P
M
2/2
6/1
2
1
2:0
0 A
M
2/2
6/1
2
1
2:0
0 P
M
2/2
7/1
2
1
2:0
0 A
M
Monitored Flow(L/s) Modeled Flow (L/s) Rainfall Intensity (mm/hr)
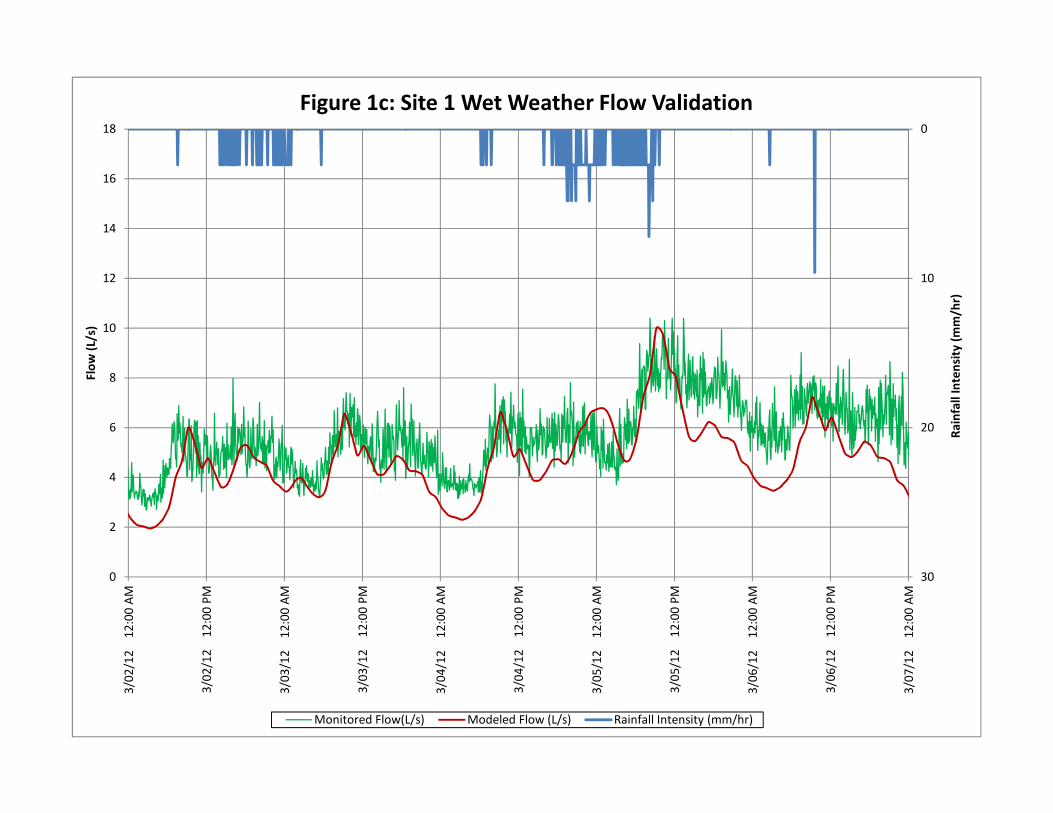
0
10
206
8
10
12
14
16
18
Flo
w (
L/s)
Figure 1c: Site 1 Wet Weather Flow Validation
Ra
infa
ll I
nte
nsi
ty (
mm
/hr)
300
2
4
3/0
2/1
2
1
2:0
0 A
M
3/0
2/1
2
1
2:0
0 P
M
3/0
3/1
2
1
2:0
0 A
M
3/0
3/1
2
1
2:0
0 P
M
3/0
4/1
2
1
2:0
0 A
M
3/0
4/1
2
1
2:0
0 P
M
3/0
5/1
2
1
2:0
0 A
M
3/0
5/1
2
1
2:0
0 P
M
3/0
6/1
2
1
2:0
0 A
M
3/0
6/1
2
1
2:0
0 P
M
3/0
7/1
2
1
2:0
0 A
M
Monitored Flow(L/s) Modeled Flow (L/s) Rainfall Intensity (mm/hr)

12
14
16
18
20
22
24
26
28
30
32
34
36
38
40
42
44
Flo
w (
L/s)
Figure 2a: Site 2 Dry Weather Flow Calibration
0
2
4
6
8
10
12
3/2
1/1
2
1
2:0
0 A
M
3/2
1/1
2
1
2:0
0 P
M
3/2
2/1
2
1
2:0
0 A
M
3/2
2/1
2
1
2:0
0 P
M
3/2
3/1
2
1
2:0
0 A
M
3/2
3/1
2
1
2:0
0 P
M
3/2
4/1
2
1
2:0
0 A
M
3/2
4/1
2
1
2:0
0 P
M
3/2
5/1
2
1
2:0
0 A
M
3/2
5/1
2
1
2:0
0 P
M
3/2
6/1
2
1
2:0
0 A
M
Monitored Flow(L/s) Modeled Flow (L/s)

0
10
30
40
50
60
70
80
Flo
w (
L/s)
Figure 2b: Site 2 Wet Weather Flow Calibration
Ra
infa
ll I
nte
nsi
ty (
mm
/hr)
200
10
20
2/2
0/1
2
1
2:0
0 A
M
2/2
0/1
2
1
2:0
0 P
M
2/2
1/1
2
1
2:0
0 A
M
2/2
1/1
2
1
2:0
0 P
M
2/2
2/1
2
1
2:0
0 A
M
2/2
2/1
2
1
2:0
0 P
M
2/2
3/1
2
1
2:0
0 A
M
2/2
3/1
2
1
2:0
0 P
M
2/2
4/1
2
1
2:0
0 A
M
2/2
4/1
2
1
2:0
0 P
M
2/2
5/1
2
1
2:0
0 A
M
2/2
5/1
2
1
2:0
0 P
M
2/2
6/1
2
1
2:0
0 A
M
2/2
6/1
2
1
2:0
0 P
M
2/2
7/1
2
1
2:0
0 A
M
Monitored Flow(L/s) Modeled Flow (L/s) Rainfall Intensity (mm/hr)

0
10
20
30
40
50
60
70
80
Flo
w (
L/s)
Figure 2c: Site 2 Wet Weather Flow Validation
Ra
infa
ll I
nte
nsi
ty (
mm
/hr)
30
400
10
20
3/0
2/1
2
1
2:0
0 A
M
3/0
2/1
2
1
2:0
0 P
M
3/0
3/1
2
1
2:0
0 A
M
3/0
3/1
2
1
2:0
0 P
M
3/0
4/1
2
1
2:0
0 A
M
3/0
4/1
2
1
2:0
0 P
M
3/0
5/1
2
1
2:0
0 A
M
3/0
5/1
2
1
2:0
0 P
M
3/0
6/1
2
1
2:0
0 A
M
3/0
6/1
2
1
2:0
0 P
M
3/0
7/1
2
1
2:0
0 A
M
Monitored Flow(L/s) Modeled Flow (L/s) Rainfall Intensity (mm/hr)

12
14
16
18
20
22
24
26
28
30
32
34
36
38
40
42
44
Flo
w (
L/s)
Figure 3a: Site 3 Dry Weather Flow Calibration
0
2
4
6
8
10
12
2/0
3/1
2
1
2:0
0 A
M
2/0
3/1
2
1
2:0
0 P
M
2/0
4/1
2
1
2:0
0 A
M
2/0
4/1
2
1
2:0
0 P
M
2/0
5/1
2
1
2:0
0 A
M
2/0
5/1
2
1
2:0
0 P
M
2/0
6/1
2
1
2:0
0 A
M
2/0
6/1
2
1
2:0
0 P
M
2/0
7/1
2
1
2:0
0 A
M
Monitored Flow(L/s) Modeled Flow (L/s)

0
5
10
15
20
25
30
35
40
45
50
Flo
w (
L/s)
Figure 3b: Site 3 Wet Weather Flow Calibration
Ra
infa
ll I
nte
nsi
ty (
mm
/hr)
15
200
5
10
2/2
0/1
2
1
2:0
0 A
M
2/2
0/1
2
1
2:0
0 P
M
2/2
1/1
2
1
2:0
0 A
M
2/2
1/1
2
1
2:0
0 P
M
2/2
2/1
2
1
2:0
0 A
M
2/2
2/1
2
1
2:0
0 P
M
2/2
3/1
2
1
2:0
0 A
M
2/2
3/1
2
1
2:0
0 P
M
2/2
4/1
2
1
2:0
0 A
M
2/2
4/1
2
1
2:0
0 P
M
2/2
5/1
2
1
2:0
0 A
M
2/2
5/1
2
1
2:0
0 P
M
2/2
6/1
2
1
2:0
0 A
M
2/2
6/1
2
1
2:0
0 P
M
2/2
7/1
2
1
2:0
0 A
M
Monitored Flow(L/s) v07-24 Rainfall Intensity (mm/hr)

0
10
15
20
25
30
35
40
45
50
Flo
w (
L/s)
Figure 3c: Site 3 Wet Weather Flow Validation
Ra
infa
ll I
nte
nsi
ty (
mm
/hr)
20
0
5
10
3/0
2/1
2
1
2:0
0 A
M
3/0
2/1
2
1
2:0
0 P
M
3/0
3/1
2
1
2:0
0 A
M
3/0
3/1
2
1
2:0
0 P
M
3/0
4/1
2
1
2:0
0 A
M
3/0
4/1
2
1
2:0
0 P
M
3/0
5/1
2
1
2:0
0 A
M
3/0
5/1
2
1
2:0
0 P
M
3/0
6/1
2
1
2:0
0 A
M
3/0
6/1
2
1
2:0
0 P
M
3/0
7/1
2
1
2:0
0 A
M
Monitored Flow(L/s) Modeled Flow (L/s) Rainfall Intensity (mm/hr)

4
6
8
10
12
Flo
w (
L/s)
Figure 4a: Site 4a Dry Weather Flow Calibration
0
2
2/0
7/1
2
1
2:0
0 A
M
2/0
7/1
2
1
2:0
0 P
M
2/0
8/1
2
1
2:0
0 A
M
2/0
8/1
2
1
2:0
0 P
M
2/0
9/1
2
1
2:0
0 A
M
2/0
9/1
2
1
2:0
0 P
M
2/1
0/1
2
1
2:0
0 A
M
2/1
0/1
2
1
2:0
0 P
M
2/1
1/1
2
1
2:0
0 A
M
2/1
1/1
2
1
2:0
0 P
M
2/1
2/1
2
1
2:0
0 A
M
Monitored Flow(L/s) Modeled Flow (L/s)

0
10
20
30
40
50
60
708
10
12
14
16
18
20
22
24
26
Flo
w (
L/s)
Figure 5a: Site 5 Dry Weather Flow Calibration
Ra
infa
ll I
nte
nsi
ty (
mm
/hr)
80
90
1000
2
4
6
1/0
9/0
5
1
2:0
0 P
M
1/1
0/0
5
1
2:0
0 A
M
1/1
0/0
5
1
2:0
0 P
M
1/1
1/0
5
1
2:0
0 A
M
1/1
1/0
5
1
2:0
0 P
M
1/1
2/0
5
1
2:0
0 A
M
1/1
2/0
5
1
2:0
0 P
M
1/1
3/0
5
1
2:0
0 A
M
1/1
3/0
5
1
2:0
0 P
M
1/1
4/0
5
1
2:0
0 A
M
Date & Time
Monitored Flow(L/s) Modeled Flow (L/s) Rainfall Intensity (mm/hr)
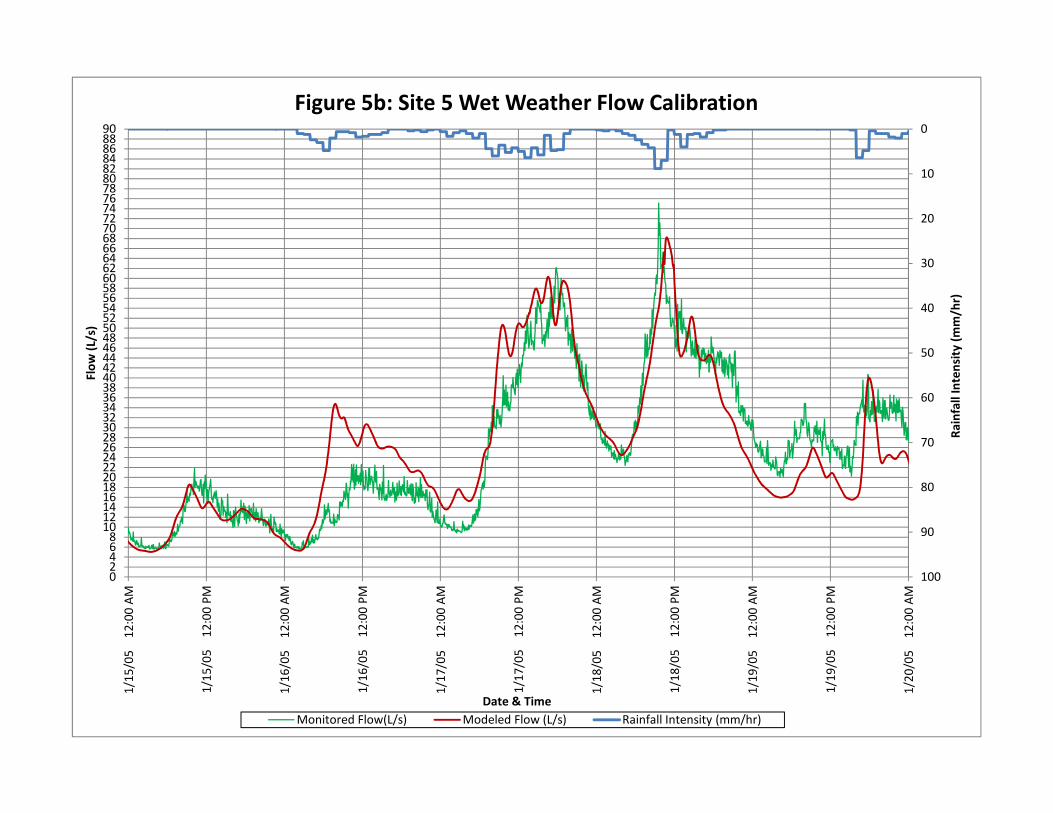
0
10
20
30
40
50
60
70
24262830323436384042444648505254565860626466687072747678808284868890
Flo
w (
L/s)
Figure 5b: Site 5 Wet Weather Flow Calibration
Ra
infa
ll I
nte
nsi
ty (
mm
/hr)
80
90
10002468
101214161820222426
1/1
5/0
5
1
2:0
0 A
M
1/1
5/0
5
1
2:0
0 P
M
1/1
6/0
5
1
2:0
0 A
M
1/1
6/0
5
1
2:0
0 P
M
1/1
7/0
5
1
2:0
0 A
M
1/1
7/0
5
1
2:0
0 P
M
1/1
8/0
5
1
2:0
0 A
M
1/1
8/0
5
1
2:0
0 P
M
1/1
9/0
5
1
2:0
0 A
M
1/1
9/0
5
1
2:0
0 P
M
1/2
0/0
5
1
2:0
0 A
M
Date & Time
Monitored Flow(L/s) Modeled Flow (L/s) Rainfall Intensity (mm/hr)

0
10
20
14
16
18
20
22
24
26
28
30
32
34
36
38
40
42
44
46
48
50
Flo
w (
L/s)
Figure 5c: Site 5 Wet Weather Flow Validation
Ra
infa
ll I
nte
nsi
ty (
mm
/hr)
300
2
4
6
8
10
12
14
12
/24
/04
12
:00
AM
12
/24
/04
12
:00
PM
12
/25
/04
12
:00
AM
12
/25
/04
12
:00
PM
12
/26
/04
12
:00
AM
12
/26
/04
12
:00
PM
12
/27
/04
12
:00
AM
Date & Time
Monitored Flow(L/s) Modeled Flow (L/s) Rainfall Intensity (mm/hr)

60
80
100
120
140
160
180
Flo
w (
L/s)
Figure 6a: Forcemain Dry Weather Flow Calibration
Ra
infa
ll I
nte
nsi
ty (
mm
/hr)
0
20
40
3/0
4/1
0
1
2:0
0 A
M
3/0
4/1
0
1
2:0
0 P
M
3/0
5/1
0
1
2:0
0 A
M
3/0
5/1
0
1
2:0
0 P
M
3/0
6/1
0
1
2:0
0 A
M
3/0
6/1
0
1
2:0
0 P
M
3/0
7/1
0
1
2:0
0 A
M
Date & Time
Modeled Hourly Flow (L/s) Monitored Hourly Flow (L/s)

0
10
20
30
40
50
60
70150
200
250
300
350
400
450
500
Flo
w (
L/s)
Figure 6b: Forcemain Wet Weather Flow Calibration
Ra
infa
ll I
nte
nsi
ty (
mm
/hr)
80
90
1000
50
100
12
/01
/07
12
:00
AM
12
/01
/07
12
:00
PM
12
/02
/07
12
:00
AM
12
/02
/07
12
:00
PM
12
/03
/07
12
:00
AM
12
/03
/07
12
:00
PM
12
/04
/07
12
:00
AM
12
/04
/07
12
:00
PM
12
/05
/07
12
:00
AM
12
/05
/07
12
:00
PM
12
/06
/07
12
:00
AM
12
/06
/07
12
:00
PM
12
/07
/07
12
:00
AM
Date & Time
Monitored (Hourly) Modeled Hourly Rainfall Intensity (mm/hr)

0
10
20
30
40
50
60150
200
250
300
350
400
450
Flo
w (
L/s)
Figure 6c: Forcemain Wet Weather Flow Validation
Ra
infa
ll I
nte
nsi
ty (
mm
/hr)
70
80
900
50
100
12
/07
/10
12
:00
AM
12
/07
/10
12
:00
PM
12
/08
/10
12
:00
AM
12
/08
/10
12
:00
PM
12
/09
/10
12
:00
AM
12
/09
/10
12
:00
PM
12
/10
/10
12
:00
AM
12
/10
/10
12
:00
PM
12
/11
/10
12
:00
AM
12
/11
/10
12
:00
PM
12
/12
/10
12
:00
AM
12
/12
/10
12
:00
PM
12
/13
/10
12
:00
AM
12
/13
/10
12
:00
PM
12
/14
/10
12
:00
AM
12
/14
/10
12
:00
PM
12
/15
/10
12
:00
AM
Date & Time
Monitored Hourly Flow (L/s) Modeled Hourly Flow (L/s) Rainfall Intensity (mm/hr)

Appendix Flysheets.Docx
Appendix B
RDII Estimation Graphs

0
5,000
10,000
15,000
20,000
25,000
30,000
35,000
40,000
45,000
0 10 20 30 40 50 60 70 80 90 100
RDII
24 hr Duration Max Total Rain (mm)
Old Site 1
Observed RDII Regression Curve

0
10,000
20,000
30,000
40,000
50,000
60,000
70,000
80,000
90,000
100,000
0 10 20 30 40 50 60 70 80 90 100
RDII
24 hr Duration Max Total Rain (mm)
Old Site 2
Observed RDII Regression Curve

0
5,000
10,000
15,000
20,000
25,000
30,000
35,000
40,000
45,000
50,000
55,000
60,000
0 10 20 30 40 50 60 70 80 90 100
RDII
24 hr Duration Max Total Rain (mm)
Old Site 4
Observed RDII Regression Curve

0
5,000
10,000
15,000
20,000
25,000
30,000
35,000
40,000
45,000
50,000
0 10 20 30 40 50 60 70 80 90 100
RDII
24 hr Duration Max Total Rain (mm)
Old Site 5
Observed RDII Regression Curve

0
10,000
20,000
30,000
40,000
50,000
60,000
70,000
0 20 40 60 80 100 120
RDII (L/H
a/da
y)
Rainfall (mm)
Metro Pump Station
Observed RDII Linear (Observed RDII)