sfd report chunar india
TRANSCRIPT
SFD Report
ChunarIndia
Final Report
This SFD Report – Comprehensive level – was prepared by Centre for Science and Environment (CSE)..
Date of production: 26/04/2017Last update: 04/05/2018
Chunar.indd 1 28/09/18 11:50 AM
SFD Report Chunar, India, 2017
Produced by: Dr Suresh Kumar Rohilla, CSEBhitush Luthra, CSEShantanu Kumar Padhi, CSEBhavik Gupta, CSE
© CopyrightAll SFD Promotion Initiative materials are freely available following the open-source concept for capacity development and non-profi t use, so long as proper acknowledgement of the source is made when used. Users should always give credit in citations to the original author, source and copyright holder.
This Executive Summary and SFD Report are available from:www.sfd.susana.org
Chunar.indd 2 28/09/18 11:50 AM
iLast Update: 04/05/2018
Produced by: CSEChunar
IndiaExecutive Summary
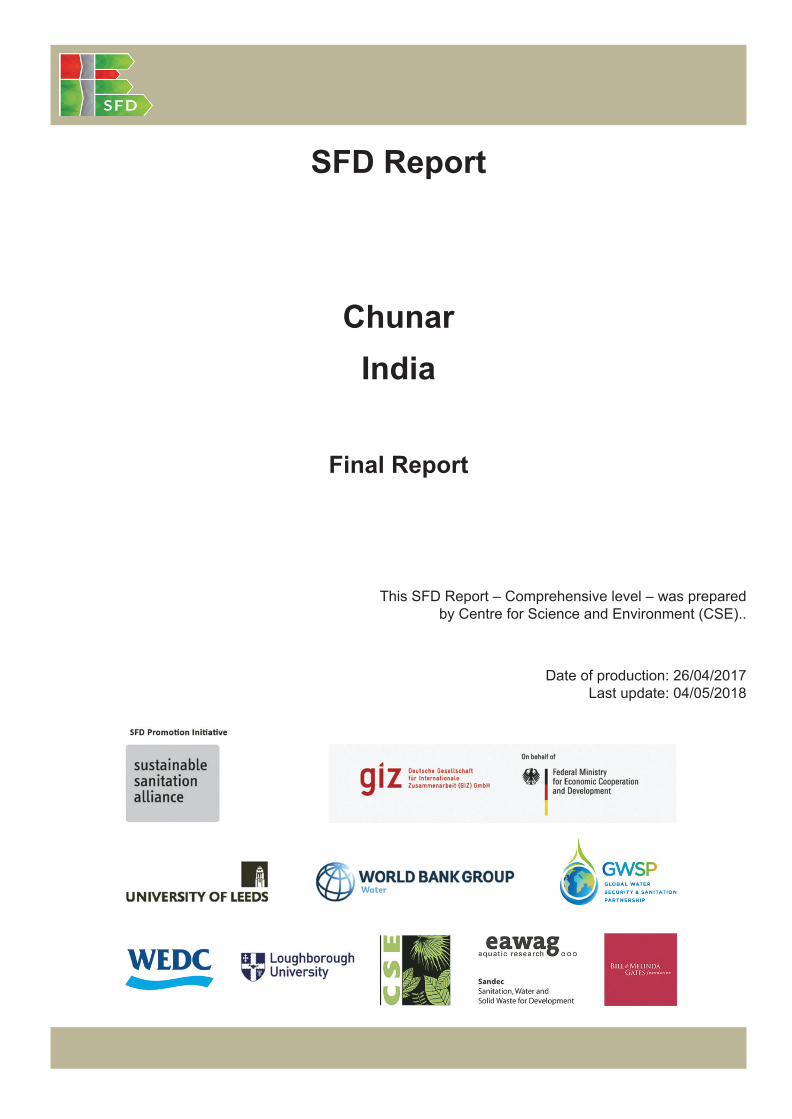
1. The SFD Graphic
2. Diagram information
SFD Level:Comprehensive
Produced by:Centre for Science and Environment (CSE), New Delhi with inputs from Chunar Nagar Palika Parishad (NPP)
Status:Reviewed SFD
Date of production: 26/04/2017
3. General city information
Chunar is situated on the banks of River Ganga and River Jirgo, in the state of Uttar Pradesh, India. City lies in the Vidhyan Range, 42 km from the district headquarters, Mirzapur and at a distance of 273 km from the state capital, Lucknow. The city is famous for pottery, especially of clay toys.
The population of the city, as per the Census of India, 2011 is 37,185. Population density of the city is 2,656 persons per sq.km, which is considerably high, when compared to that of Uttar Pradesh, i.e. 828 persons per sq.km. The slum population is 9914, representing 27% of the total population (Census, 2011).
The city has sub-tropical climate. The temperature ranges between 22°C to 46°C during summer season and 2°C to 17°C in winter season. Chunar lies in a moderate to high rainfall region, the average annual rainfall is 1,110 mm (UPJN, 2014). The administrative area of the city is 14 sq.km also chosen for the current study. The local body governing the city is called Chunar Nagar Palika Parishad (NPP) or municipal council.
Chunar.indd 1 28/09/18 11:50 AM
ii Last Update: 04/05/2018
Produced by: CSEChunar
IndiaExecutive Summary
4. Service outcome
Overview on technologies and methods used for different sanitation systems through the sanitation service chain is as follows:
Containment: There is no sewerage system in the city. 71% of the households in the city are either dependent on septic tanks or on lined pits, their sizes depend on space availability and affordability of households. Due to no standardization being followed while constructing the containment system, few households have constructed tanks/pits large in capacity irrespective of household size to decrease the emptying frequency. Rest of the 29% of population defecates in open. Open defecation is mostly practiced in the wards in close proximity to River Ganga and River Jirgo. There are ten community toilets available for urban poor (NPP, 2016).
Emptying: Chunar NPP doesn’t own a single vacuum truck. The fi eld survey revealed that most of the settlement in the city is informal and unplanned. Due to narrow and congested roads, households are dependent on manual emptying service. The manual emptying is usually carried out by 2 - 4 people, depending upon the size of the containment and the density of FS in the containment. Spade and bucket is used for emptying OSS. The charges for manual emptying ranges from INR1500 to INR 2,000 (23 USD – 30 USD).
There is no private emptier within the municipal area but private emptiers from nearby cities provides the service to households and commercial buildings. Chunar NPP shares a vacuum tanker with Ahraura Nagar Palika Parishad, which is 22 km away from Chunar. The capacity of the vacuum tanker is 2000 litres. The tanker is employed for emptying service of community toilets and containment systems of government buildings. The sanitary workers do not use any personal protective equipment (PPE) like gloves, boots and mask during emptying of OSS and cleaning of drains (NPP, 2016).
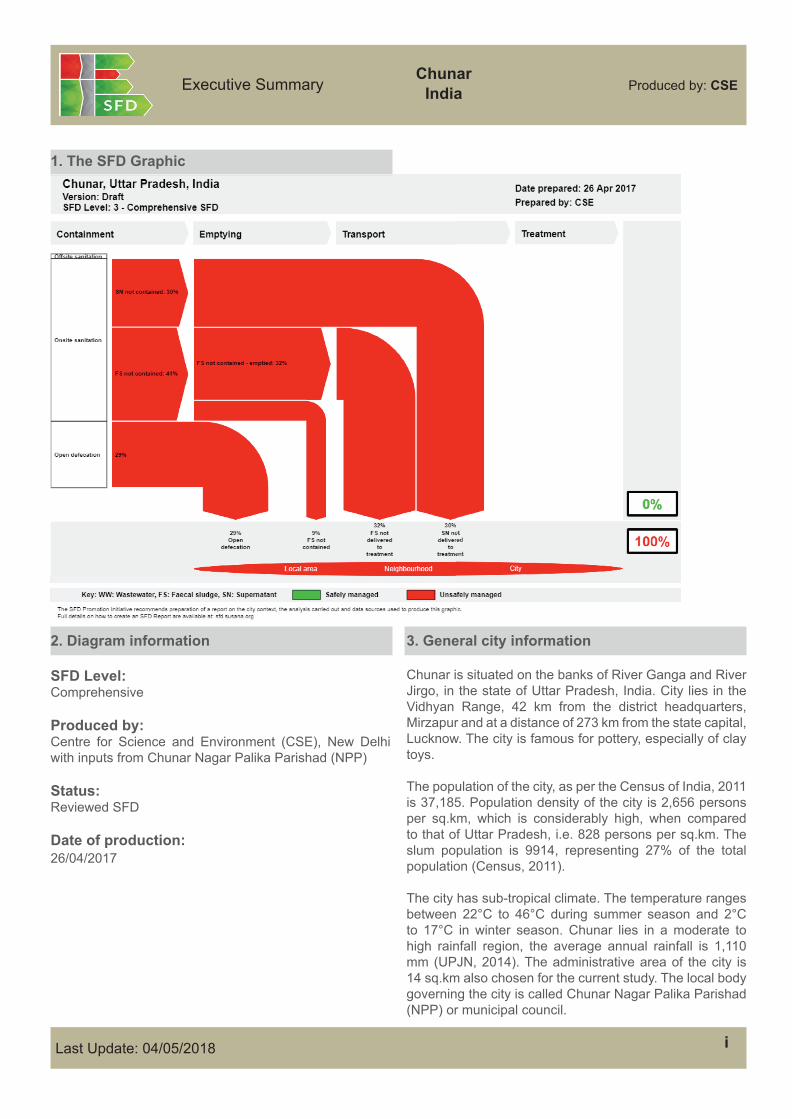
Transportation and treatment: The vacuum tankers operated by the private emptiers and Urban Local Body (ULB) are tractor mounted. Emptiers discharge septage into open drains and open fi elds, in and around the city. Wastewater (WW) and faecal sludge(FS) is conveyed through twenty seven major and minor nullahs. There is no treatment facility available for WW and FS generated in the city (NPP, 2016).End-use/Disposal: FS and WW are discharged into the rivers and agricultural fi elds through big and small nullahs. Out of the 27 major nullahs, 14 discharge into River Ganga, 8 major nullahs discharge into River Jirgo and the
rest eventually discharge at agricultural fi elds. As much as 50% of the city’s WW is disposed into River Jirgo, 25% in River Ganga and 25% on agricultural fi elds. River Jirgo meets the Ganga River during peak fl ows after fl owing 16 km away from the city (NPP, 2016).
There is no sewerage network in the city and 71% of the city is dependent on onsite sanitation systems (OSS), out of which 60% are dependent on septic tanks and around 11% on pits. According to random survey and key informant interviews (KII), community toilets are connected to the septic tanks and hence considered in onsite systems.
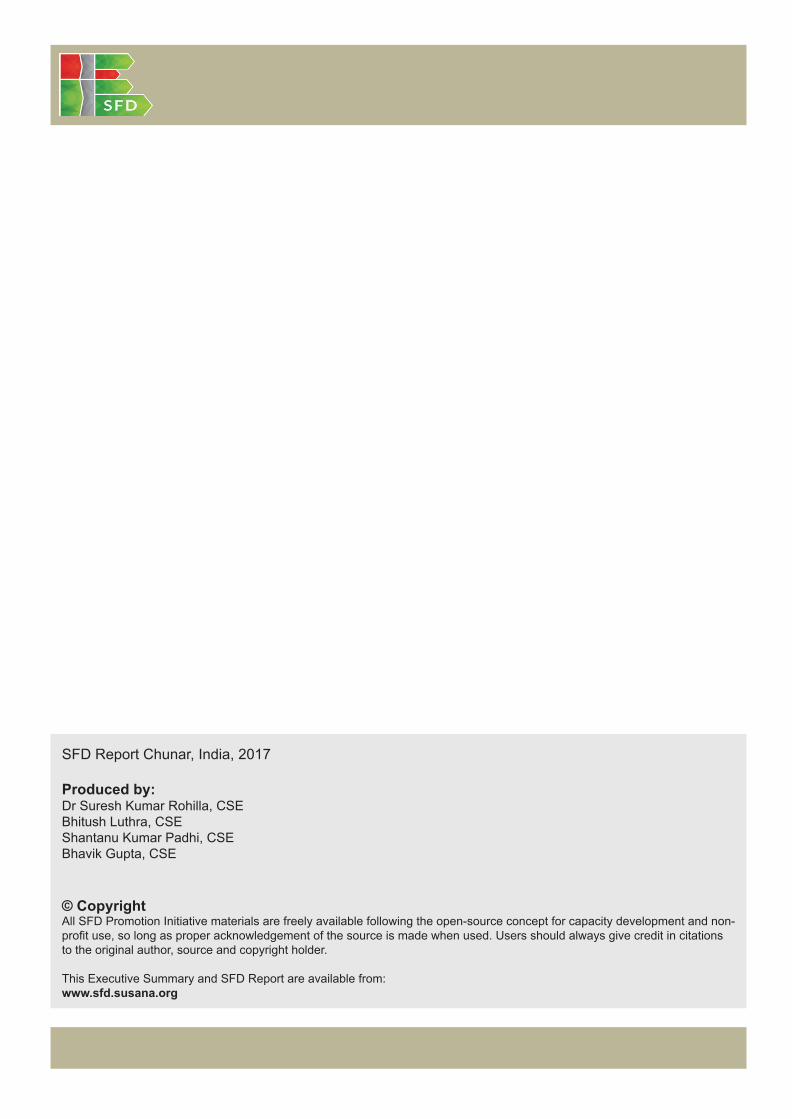
Figure 1: Septic tank connected to open drain (source: Bhavik/CSE, 2016)
Figure 2: Nullahs discharging into: from top (i) River Ganga; (ii) agricultural land (source: Shantanu/CSE, 2016)
Chunar.indd 2 28/09/18 11:50 AM

iiiLast Update: 04/05/2018
Produced by: CSEChunar
IndiaExecutive Summary
Septic tanks as well as the pits are ‘not contained’ as they are connected to open drains and causing groundwater pollution through seepage.
According to Census 2011, 29% of the population still practices open defecation, which was found true based on comprehensive study.
There is no clear differentiation between the volume of effl uent and solid FS generated from septic tanks, hence to reduce the maximum error, it’s assumed to be 50% each. Therefore, 30% of FS is assumed to be effl uent that goes into open drains and rest of FS is emptied from tanks whenever full. Even FS from pits is considered not-contained and is calculated as 11% which includes infi ltration of water as well. Some FS is always left in the tanks and pits and is assumed to be 3%.
5. Service delivery context
National Urban Sanitation Policy (NUSP) was issued in 2008, by the Ministry of Housing and Urban Affairs (MoHUA, GoI), formerly known as Ministry of Urban Development (MoUD). The policy aims to: raise awareness, promote behavior change; achieve open defecation free cities; develop citywide sanitation plans; and provide 100% safe confi nement, transport, treatment and disposal of human excreta and liquid wastes. The NUSP mandates states to develop state urban sanitation strategies and work with cities to develop City Sanitation Plans (CSPs).
NUSP identifi es the constitution of multi-stakeholder task force, known as city sanitation taskforce (CSTF) as one of the reforms to be taken up to start the city sanitation planning process. CSTF has now been renamed as Swachh Bharat City Level Task Force (SBCLTF) (MoUD, 2014)
The Environment (Protection) Act, 1986 and the Water (Prevention and Control of Pollution) Act, 1974 have provisions relating to sanitation services and environmental regulations. It applies to households and cities with regard to disposing wastes into the environment. ULBs/ utilities also have to comply with discharge norms for effl uent released from sewage treatment plants and to pay water cess under the Water Cess Act, 1977 (MoUD, 2013).
In February 2017, MoHUA issued the National Policy on Faecal Sludge and Septage Management (FSSM). The policy aims to set the context, priorities, and direction for, and to facilitate, nationwide implementation of FSSM services in all ULBs such that safe and sustainable sanitation becomes a reality for all in each and every household, street, town and city in India (MoUD, 2017).
There are various schemes launched by central government to provide basic civic amenities including improvement of urban sanitation. Under Swachh Bharat Mission (SBM), 16 individual households’ toilets and 9 community toilets have been approved but no toilet has been constructed yet. The city has proposed to National Mission for Clean Ganga (NMCG): laying of 60.7 km sewer line, installation of a 6.5 MLD Sewage Treatment Plant (STP) and interception of drains to abate pollution in the Ganga River (NPP, 2016).
The Chunar NPP did a rapid assessment of FSM in city to calculate the funds required for the same. It was estimated that INR 325 million (2.16 million USD) is required for implementation of effective FS and septage management including operation and maintenance for fi ve years (MoUD, 2016).
6. Overview of stakeholders
The 74th Constitutional Amendment Act of 1992 reformed the sector by transferring responsibility for domestic, in-dustrial, and commercial water supply and sewerage (WSS) from state agencies, such as Departments of Pub-lic Health Engineering and State Water Boards, to Urban Local Bodies (ULBs). This transfer has resulted in a variety of implementation models, as well as lack of clarity in the allocation of roles and responsibilities between state and local agencies, which sometimes result in large gaps in implementation (USAID, 2010).
UPJN is responsible for planning, designing and construction/development of the assets in water supply, sewerage and drainage sector, while NPP is responsible for operation and maintenance of assets (MoUD, 2013).
Key Stakeholders Institutions/organizations
Public institutions
Minsitry of Housing and Urban Affairs (MoHUA), National Ganga Council, Ganga Pollution Control Unit, UP Jal Nigam (UPJN), Urban Development Department (UDD), Nagar Palika Parishad-Chunar (CNPP), District Urban Development Authority (DUDA) Uttar Pradesh Pollution Control Board, Varanasi, Uttar Pradesh (UPPCB), State Level Programme Management Group (SPMG)
NGOs Centre for Science and Environment
Private Sector Private emptiers, local masons
Others SBCLTF
Table 1: Key stakeholders (Source: Compiled by CSE, 2017)
Chunar.indd 3 28/09/18 11:50 AM
iv Last Update: 04/05/2018
Produced by: CSEChunar
IndiaExecutive Summary
UDD is responsible for administrative and fi nancial management of municipalities, implementation of development programmes. UPPCB is responsible for monitoring river pollution. DUDA is responsible for the implementation of central and state government’s schemes. CNPP is responsible for septage management. SPMG coordinates and oversee the implementation of projects sanctioned by Government of India under National Ganga Council (NGC).
SBCLTF is a multi-stakeholder platform comprising representatives from different sectors of society, including agencies directly responsible for sanitation, agencies indirectly involved or impacted, eminent persons, practitioners, NGOs and sanitary workers.
7. Description of context-adapted SFD graphic
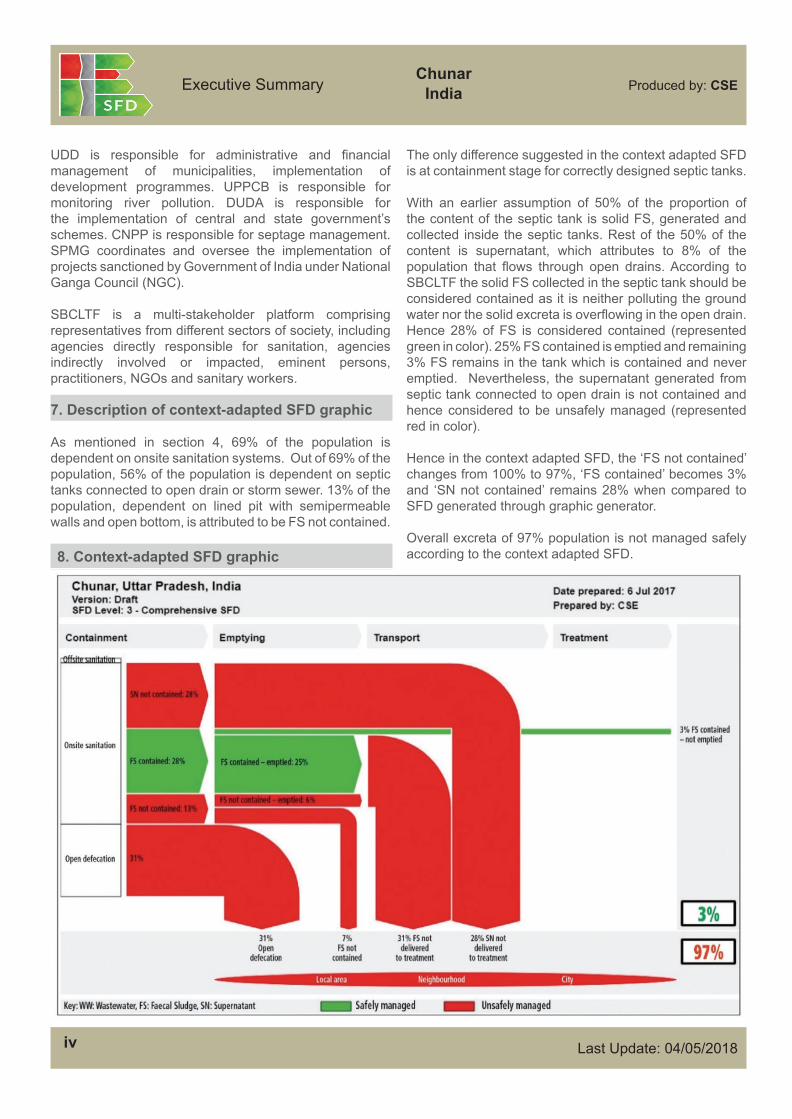
As mentioned in section 4, 69% of the population is dependent on onsite sanitation systems. Out of 69% of the population, 56% of the population is dependent on septic tanks connected to open drain or storm sewer. 13% of the population, dependent on lined pit with semipermeable walls and open bottom, is attributed to be FS not contained.
The only difference suggested in the context adapted SFD is at containment stage for correctly designed septic tanks.
With an earlier assumption of 50% of the proportion of the content of the septic tank is solid FS, generated and collected inside the septic tanks. Rest of the 50% of the content is supernatant, which attributes to 8% of the population that fl ows through open drains. According to SBCLTF the solid FS collected in the septic tank should be considered contained as it is neither polluting the ground water nor the solid excreta is overfl owing in the open drain. Hence 28% of FS is considered contained (represented green in color). 25% FS contained is emptied and remaining 3% FS remains in the tank which is contained and never emptied. Nevertheless, the supernatant generated from septic tank connected to open drain is not contained and hence considered to be unsafely managed (represented red in color).
Hence in the context adapted SFD, the ‘FS not contained’ changes from 100% to 97%, ‘FS contained’ becomes 3% and ‘SN not contained’ remains 28% when compared to SFD generated through graphic generator.
Overall excreta of 97% population is not managed safely according to the context adapted SFD.8. Context-adapted SFD graphic
Chunar.indd 4 28/09/18 11:50 AM
v
SFD Report
Last Update: 04/05/2018
Produced by: CSEChunar
IndiaExecutive Summary
9. Process of SFD development
Data is collected through secondary sources. The city is visited to conduct the surveys, FGDs and KIIs with rele-vant stakeholders, to fi ll in the data gap and to crosscheck the data collected. To start with, a relationship between sanitation technologies defi ned in Census of India and that defi ned in the project is established. The survey data is quantifi ed and crosschecked with FGDs and KIIs.
Due to lack of data available on excreta generated by fl oat-ing population in commercial areas and institutional build-ings, an assumption of 10% of total population is added with the census population in the SFD graphic generator.
The data is fed into the calculation tool to calculate the excreta fl ow in terms of percentage of the population. It can be concluded that excreta of the whole population is discharged untreated in the environment.
The SFD graphic of Chunar city, developed using graphic generator is not able to capture the correctly designed fully functional septic tanks as a contained system, as based on feedback from SBCLTF.
Hence, a context adapted city specifi c SFD graphic is manually corrected to convey the substantial picture of the excreta management in the city.
10. Credibility of data
Two key sources of data are used; Census of India, 2011 and published documents of relevant departments. Most of the data is then updated by KIIs. Overall three FGDs and one KII have been conducted with different stakeholders.
There were three major challenges to develop the SFD. Census and published/unpublished reports were not able to provide (i) up-to-date data on containment (ii) detailed typology of containment and (iii) actual information about
FSM services provided to households. For this reason, fi eld based studies were conducted to validate the data provided by secondary sources.
The Census and published/unpublished reports mostly differentiate between systems connected to the user inter-face, if any, but does not give information about the design of actual containment systems on ground level or about the disposal of septage and wastewater generated.
Therefore, random household survey was conducted stra-tegically in few wards of the city to identify and cross check the data collected from the secondary sources. 11. List of data sources
Below is the list of data sources used for the development of SFD.
o Published reports and books Census of India 2011, House listing and
housing data, Government of India
o KIIs with representatives from Chunar NPP: Sanitary Inspector
o FGDs Chunar NPP staff and council members Local masons SBCLTF members
o Random household survey
Chunar, India, 2017
Produced by: Dr Suresh Kumar Rohilla, CSEBhitush Luthra, CSEShantanu Kumar Padhi, CSEBhavik Gupta, CSE
© CopyrightThe tools and methods for SFD production were developed by the SFD Promotion Initiative and are available from: www.sfd.susana.org.
All SFD materials are freely available following the open-source concept for capacity development and non-profi t use, so long as proper acknowledgement of the source is made when used. Users should always give credit in citations to the original author, source and copyright holder.
Chunar.indd 5 28/09/18 11:50 AM
vi
SFD Report
Last Update: 04/05/2018
Produced by: CSEChunar
India
Table of contents
Executive summary ..........................................................................................................................................iTable of contents ............................................................................................................................................ viList of tables ............................................................................................................................................ viiiList of fi gures .............................................................................................................................................. ixAbbreviations ...............................................................................................................................................x1 City context ...............................................................................................................................................12 Service outcomes .....................................................................................................................................3 2.1 Overview ...........................................................................................................................................3 2.1.1 Sanitation facilities .................................................................................................................3 2.1.2 Containment ...........................................................................................................................4 2.1.3 Emptying ................................................................................................................................5 2.1.4 Transportation and treatment .................................................................................................5 2.1.5 End-use/Disposal ...................................................................................................................5 2.2 SFD matrix ........................................................................................................................................7 2.2.1 SFD matrix explanation ..........................................................................................................7 2.2.2 Risk of groundwater contamination ........................................................................................8 2.2.3 Discussion of certainty/uncertainty levels of associated data ................................................8 2.3 Context adapted SFD ........................................................................................................................93 Service delivery context description ........................................................................................................11 3.1 Policy, legislation and regulation .....................................................................................................11 3.1.1 Policy, legislations and regulations at national level ............................................................11 3.1.2 Policies, legislations and regulations at state level and ULB level .......................................12 3.1.3 Institutional roles ..................................................................................................................13 3.1.4 Service provision ..................................................................................................................14 3.1.5 Service standards ................................................................................................................15 3.2 Planning ..........................................................................................................................................15 3.2.1 Service targets .....................................................................................................................15 3.2.2 Investments ..........................................................................................................................16 3.3 Reducing inequity ............................................................................................................................17 3.3.1 Current choice of services for the urban poor ......................................................................17 3.3.2 Plans and measures to reduce inequity ...............................................................................18 3.4 Outputs ............................................................................................................................................18 3.4.1 Capacity to meet service needs, demands and targets .......................................................18 3.4.2 Monitoring and reporting access to services ........................................................................18 3.5 Expansion ........................................................................................................................................19 3.5.1 Stimulating demand for services ..........................................................................................19 3.5.2 Strengthening service provider roles ...................................................................................194 Stakeholder engagement ........................................................................................................................21
Executive Summary
Chunar.indd 6 28/09/18 11:50 AM
vii
SFD Report
Last Update: 04/05/2018
Produced by: CSEChunar
India
4.1 Key informant interviews .................................................................................................................21 4.2 Field observations ...........................................................................................................................21 4.3 Focus group discussions .................................................................................................................215 Acknowledgement ...................................................................................................................................236 References .............................................................................................................................................247 Appendix .............................................................................................................................................25 7.1 Stakeholder identifi cation ................................................................................................................25 7.2 Tracking of engagement ..................................................................................................................25 7.3 SFD graphic ....................................................................................................................................26 7.4 SFD brief explanation ......................................................................................................................27 7.5 Context adapted SFD Graphic ........................................................................................................28 7.6 SFD selection grid ...........................................................................................................................29 7.7 SFD matrix ......................................................................................................................................30 7.8 List of community/public toilets ........................................................................................................31 7.9 Swachh Bharat City Level Task Force – Chunar .............................................................................32 7.10 Photographs captured during fi eld visit ...........................................................................................33 7.11 Questionnaires for random household survey and emptiers ...........................................................34
Chunar.indd 7 28/09/18 11:50 AM
viii
SFD Report
Last Update: 04/05/2018
Produced by: CSEChunar
India
List of tables
Table 1: Population growth rate .......................................................................................................................1Table 2: Sanitation technologies and corresponding percentages of population ............................................3Table 3: Description of variables used for defi ning containment systems .......................................................7Table 4: Description of variables used in SFD .................................................................................................7Table 5: Roles and responsibilities ................................................................................................................14Table 6: Service delivery targets in accordance with SLBs ...........................................................................16Table 7: Service delivery progress in accordance with SBM. ........................................................................16Table 8: Status of fund released in the year 2015 in accordance with SBM. ................................................17Table 9: Estimate of CAPEX and OPEX for FSSM........................................................................................17Table 10: Stakeholder identifi cation. ..............................................................................................................25Table 11: Tracking of engagement. ................................................................................................................25Table 12: Percentage of the population using each system technology and method ....................................27Table 13: SFD matrix .....................................................................................................................................30Table 14: Details of community/public toilets. ................................................................................................31Table 15: Details of the community toilets proposed under SBM ..................................................................31
Chunar.indd 8 28/09/18 11:50 AM
ix
SFD Report
Last Update: 04/05/2018
Produced by: CSEChunar
India
List of fi gures
Figure 1: Ward map of Chunar city. .................................................................................................................2Figure 2: Septic tank with effl uent pipe connected to open drain ....................................................................4Figure 3: Wastewater conveyed through open storm-water drains .................................................................5Figure 4: Nullahs discharging wastewater on agriculture fi elds.......................................................................6Figure 5: Nullahs discharging wastewater into River Ganga ..........................................................................6Figure 6: Nullahs carrying wastewater ............................................................................................................6Figure 7: SFD Graphic...................................................................................................................................26Figure 8: Context adapted SFD Graphic .......................................................................................................28Figure 9: SFD selection grid ..........................................................................................................................29Figure 10: FGD with SBCLTF members ........................................................................................................32Figure 11: Community toilet at Balughat ........................................................................................................33Figure 12: Solid waste dumping site..............................................................................................................33Figure 13: Wastewater discharged at low-lying land in the city .....................................................................33
Chunar.indd 9 28/09/18 11:50 AM
x
SFD Report
Last Update: 04/05/2018
Produced by: CSEChunar
India
Abbreviations
AMRUT Atal Mission for Rejuvenation and Urban Transformation
BIS Bureau of Indian StandardCAPEX Capital ExpenditureCGWB Central Ground Water BoardCNPP Nagar Palika Parishad – ChunarCPCB Central Pollution Control Board CPHEEO Central Public Health and Environmental
Engineering OrganizationCSE Centre for Science and EnvironmentCSP City Sanitation PlanCSTF City Sanitation Task ForceCT Community Toilets DUDA District Urban Development Authority EWS Economically Weaker SectionsFC Finance CommissionFGD Focus Group DiscussionFS Faecal SludgeFSM Faecal Sludge ManagementFSSM Faecal Sludge and Septage ManagementGoI Government of IndiaGoUP Government of Uttar PradeshINR Indian RupeeKII Key Informant InterviewLPCD Litres per Capita per DayMHUPA Ministry of Housing and Urban Poverty
AlleviationMIS Management Information SystemMLD Million Litres per DayMoSJE Ministry of Social Justice and
Empowerment MoHUA Ministry of Housing and Urban Affairs
(formerly known as Ministry of Urban Development)
MoUD Ministry of Urban DevelopmentMoWRRD&GR Ministry of Water Resources, River
Development and Ganga Rejuvenation
MPS Main Pumping StationMSL Mean Sea LevelNBC National Building CodeNFSSM National Faecal Sludge and Septage
Management AllianceNGC National Ganga CouncilNIC National Informatics CentreNITI National Institution of Transforming IndiaNIUA National Institute of Urban AffairsNPP Nagar Palika ParishadOD Open DefecationOPEX Operational ExpenditureOSS Onsite Sanitation SystemPMAY Pradhan Mantri Awas YojnaPPE Personal Protective EquipmentPT Public ToiletsSBCLTF Swachh Bharat City Level Task ForceSFD Shit Flow DiagramSLB Service Level BenchmarkSN SupernatantSPS Sewage Pumping StationSTP Sewage Treatment PlantSUDA State Urban Development AgencySWM Solid Waste ManagementUDD Urban Development Department ULB Urban Local BodyUPJN Uttar Pradesh Jal NigamUPPCB Uttar Pradesh Pollution Control Board UPSIDC Uttar Pradesh State Industrial
Development CorporationUSAID United States Agency for International
DevelopmentUSD United States Dollar (1 USD = 66.5 INR) WSS Water Supply and Sewerage WW Waste Water
Chunar.indd 10 28/09/18 11:50 AM
1
SFD Report
Last Update: 04/05/2018
Produced by: CSEChunar
India
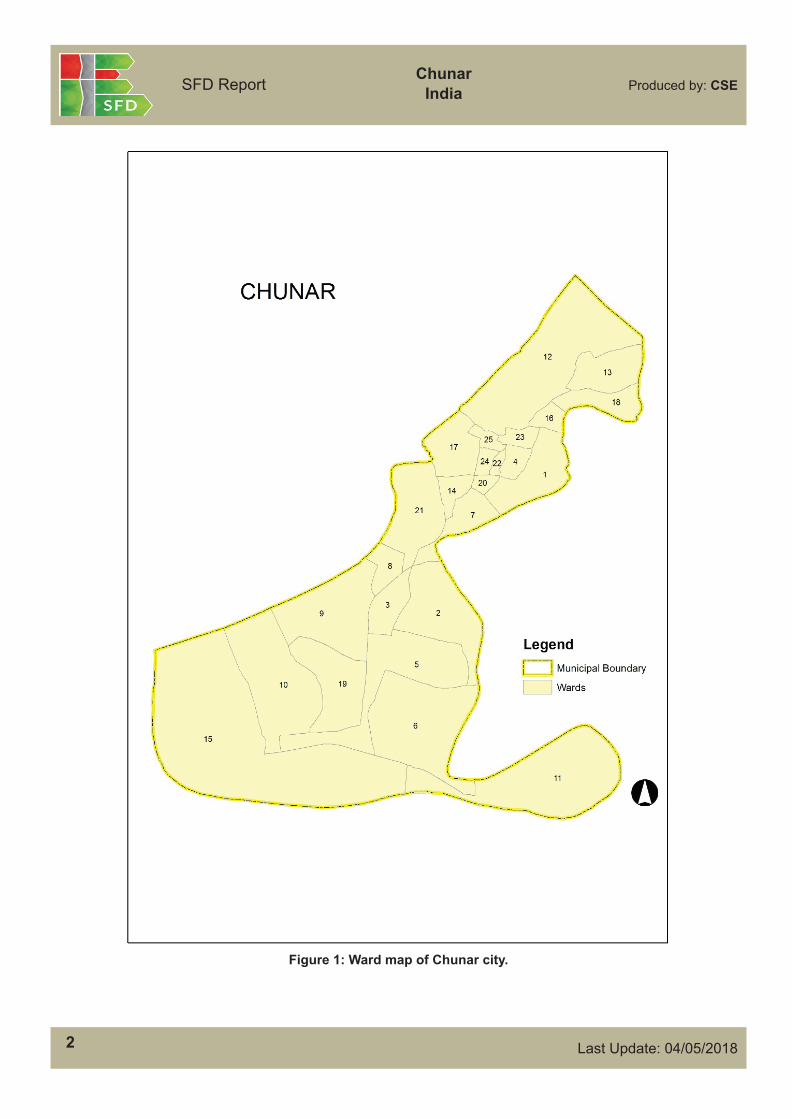
1 City context
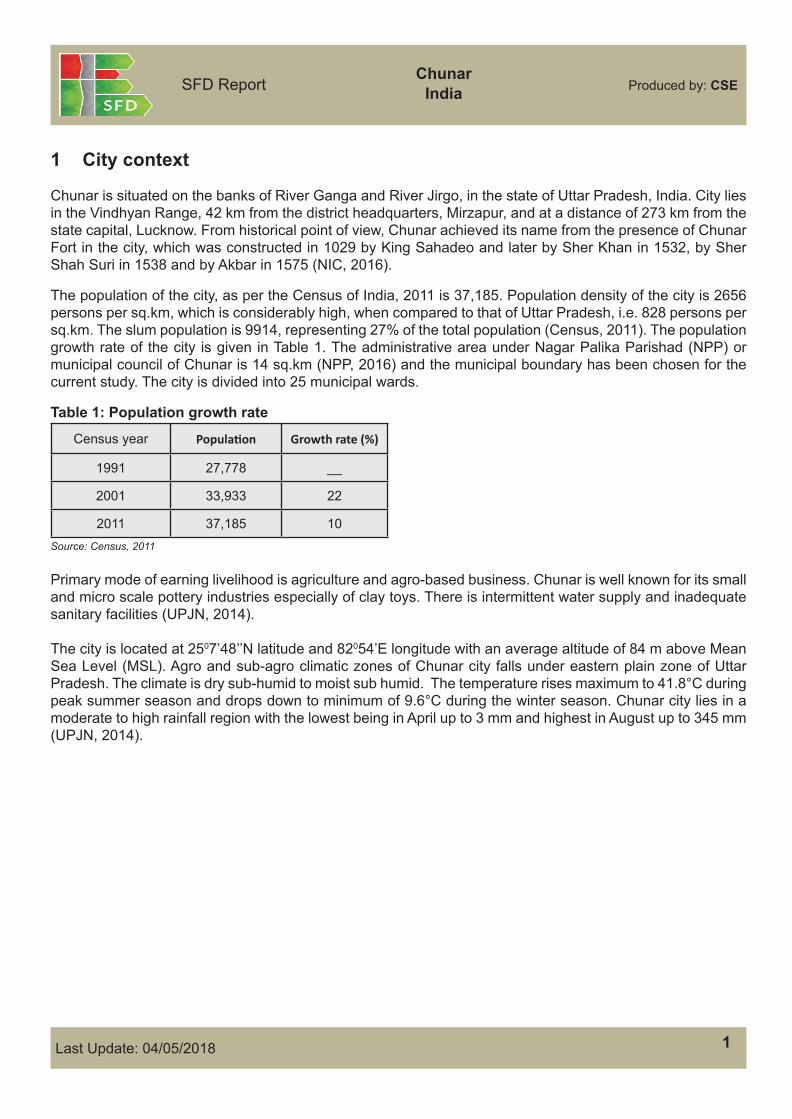
Chunar is situated on the banks of River Ganga and River Jirgo, in the state of Uttar Pradesh, India. City lies in the Vindhyan Range, 42 km from the district headquarters, Mirzapur, and at a distance of 273 km from the state capital, Lucknow. From historical point of view, Chunar achieved its name from the presence of Chunar Fort in the city, which was constructed in 1029 by King Sahadeo and later by Sher Khan in 1532, by Sher Shah Suri in 1538 and by Akbar in 1575 (NIC, 2016).
The population of the city, as per the Census of India, 2011 is 37,185. Population density of the city is 2656 persons per sq.km, which is considerably high, when compared to that of Uttar Pradesh, i.e. 828 persons per sq.km. The slum population is 9914, representing 27% of the total population (Census, 2011). The population growth rate of the city is given in Table 1. The administrative area under Nagar Palika Parishad (NPP) or municipal council of Chunar is 14 sq.km (NPP, 2016) and the municipal boundary has been chosen for the current study. The city is divided into 25 municipal wards.
Table 1: Population growth rate
Census year Populati on Growth rate (%)
1991 27,778 __
2001 33,933 22
2011 37,185 10Source: Census, 2011
Primary mode of earning livelihood is agriculture and agro-based business. Chunar is well known for its small and micro scale pottery industries especially of clay toys. There is intermittent water supply and inadequate sanitary facilities (UPJN, 2014).
The city is located at 2507’48’’N latitude and 82054’E longitude with an average altitude of 84 m above Mean Sea Level (MSL). Agro and sub-agro climatic zones of Chunar city falls under eastern plain zone of Uttar Pradesh. The climate is dry sub-humid to moist sub humid. The temperature rises maximum to 41.8°C during peak summer season and drops down to minimum of 9.6°C during the winter season. Chunar city lies in a moderate to high rainfall region with the lowest being in April up to 3 mm and highest in August up to 345 mm (UPJN, 2014).
Chunar.indd 1 28/09/18 11:50 AM
2
SFD Report
Last Update: 04/05/2018
Produced by: CSEChunar
India
Figure 1: Ward map of Chunar city.
Chunar.indd 2 28/09/18 11:50 AM
3
SFD Report
Last Update: 04/05/2018
Produced by: CSEChunar
India
2 Service outcomes
Analysis is based on data available from Census, 2011, published reports of government, non-profi t organiza-tions and random household survey. Data collected from secondary sources is triangulated in comprehensive study. Data on the containment is available in Census 2011. Data has been cross-checked and updated by Key Informant Interviews (KIIs) and Focus Group Discussions (FGDs). According to the SFD promotion ini-tiative (PI) defi nitions of sanitation systems, the types of containments prevalent in the wards are examined through household survey (for details refer Table 2). Data on emptying, transport, treatment and disposal of FS is collected through KIIs with ULB, private emptiers and parastatal body. However most of the data is qualitative.
2.1 Overview
To start with, a relationship between sanitation technologies defi ned in Census of India and the variables defi ned in the project is established. Then the population dependent on those systems is represented in terms of percentage of population, as shown in Table 2 below:
Table 2: Sanitation technologies and corresponding percentages of populationS. No. Sanitation technologies and systems as defi ned by: SFD reference
variablePercentage
of populationCensus of India SFD Promotion Initiative
1 Piped sewer system
User interface discharges directly to a centralized foul/separate sewer. T1A1C2 9
2 Septic tank Septic tank connected to open drain or storm sewer T1A2C6 53
3 Other Systems User interface discharges directly to open ground T1A2C8 2.6
4Pit latrine with slab
Lined pit with semi-permeable walls and open bottom, no outlet or overfl ow, general situation T1A5C10 0.7
5 Pit latrine without slab
Unlined pit no outlet or overfl ow, general situation T1A6C10 0.2
6Night soil disposed into open drain
User interface discharges directly to open drain or storm drain T1A1C6 0.2
7 Service latrine User interface discharges directly to ‘don�t know where� T1A1C9 0.1
8 Public latrine Septic tank connected to open drain or storm sewer T1A2C6 3.1
9 Open defecation Open defecation T1B11C7 TO C9 31
Source: Census of India, 2011
2.1.1 Sanitation facilities
This section presents on existing sanitation facilities in institutions, commercial establishments, slums and facilities for tourists.
Community/public toilets: It is reported that there are 10 community toilets and no public toilets in the city. All the community toilets are connected to septic tanks. The size and design of septic tanks of the public toilets
Chunar.indd 3 28/09/18 11:50 AM
4
SFD Report
Last Update: 04/05/2018
Produced by: CSEChunar
India
do not meet the design standards as stipulated in the CPHEEO manual on sewerage and sewage treatment systems. Septage is emptied from the community toilets in every 200 days by the NPP and the collected septage is indiscriminately disposed at any low-lying areas in the city (NPP, 2016).
School sanitation: There are a total of 22 schools in the municipal area, out which 14 are government aided and the rest 8 are privately owned. Also, there are 4 inter-colleges, of which 2 are government aided and the other 2 are privately owned. All the educational institutions have separate toilets for boys and girls. The user interface discharges the waste into septic tanks connected to soak pits. In general, the septic tanks are either 2 or 3 chambered of size 7 cu.m and soak pits are 1.8 m diameter and 2.4 m in depth (NPP, 2016).
Hospitals: There are 3 privately owned nursing homes and 1 government hospital in the municipality area. All have separate toilets for men and women; the user interface is connected to lined pits with semi-permeable wall and open bottom (NPP, 2016).
Commercial areas: Commercial areas comprise of roadside shops; informal markets; 6 government and 2 private banks; and 8 private and 10 government banquet halls. All the banks and banquet halls have toilets connected to septic tanks with outlet connected to open/ storm-water drains (NPP, 2016).
Although the city witnesses a signifi cant footfall in the fort especially during festivals. Due to lack of data on excreta generated by fl oating population in commercial areas and institutional buildings, around 10% (3,718) of total population is assumed to be the fl oating population. It is also estimated that this population is dependent on septic tanks connected to open drain, as most of the institutions and commercial areas are dependent on septic tanks. The fl oating population is also considered while developing the SFD.
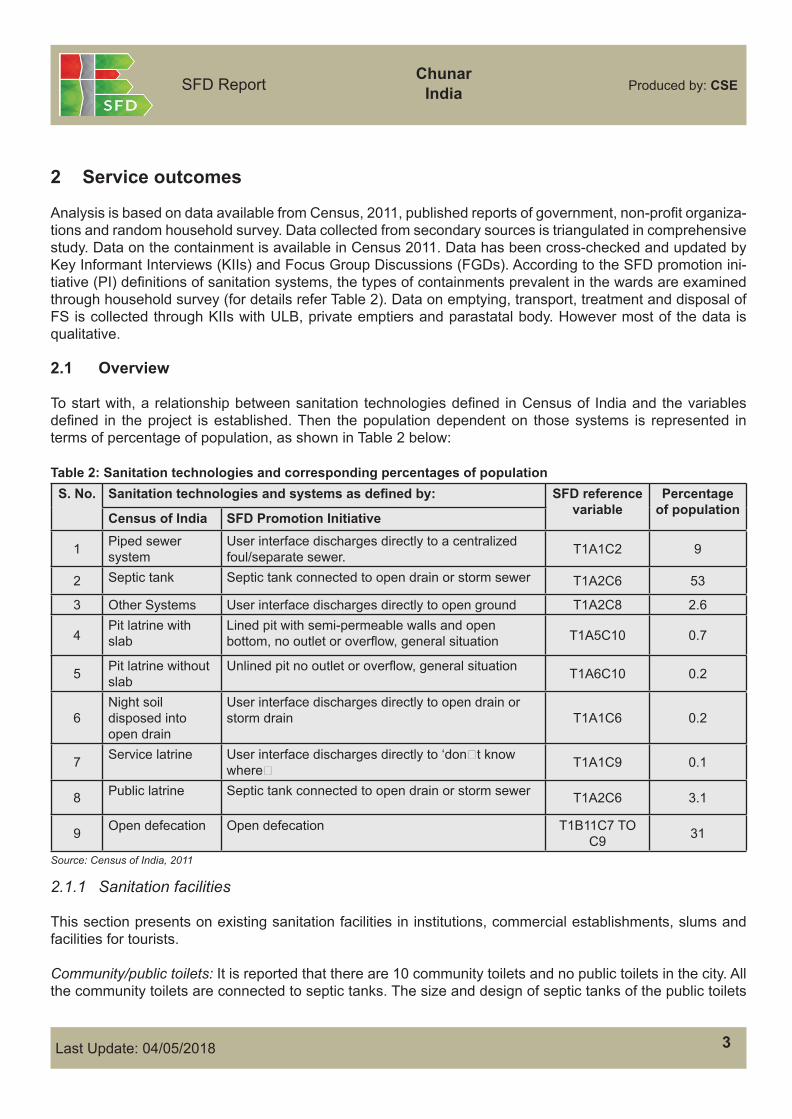
2.1.2 Containment
According to Census 2011, there is a sewer network in the city which covers about 9% of the households, but the fi eld-based study revealed that there is no sewer network. Most of the households are either dependent on septic tank or lined pit, the size of which is dependent on space availability and affordability of households. Due to no standardization being followed while constructing the containment system, often tanks and pits are constructed large in capacity irrespective of household size. A signifi cant population defecates in open. Households’ deprived of toilets practices OD in the wards that are in close proximity to River Ganga and River Jirgo.
2.1.3 Emptying
Although 71% of the population is dependent on on-site sanitation facilities, Chunar Nagar Palika Parishad (NPP) doesn’t own a single vacuum tanker. The fi eld survey revealed that most of the settlement in the city is informal and unplanned. Due to narrow and congested roads, households are dependent on manual empty-ing service through private emptiers. The manual emptying is usually carried out by 2 - 4 people, depending upon the size of the containment and the degree of density of FS in the containment. In general, frequency of emptying the containment system is more than 5 years. Manual emptying is still prevalent. Spade and bucket are used by manual emptiers for emptying OSS without any safety gears. The emptying service fee ranges from INR1500 to INR 2,000 (23 USD – 30 USD) (KII, 2016). During the random household survey, it was alleged that vacuum tankers owned by private emptiers from nearby cities also ply in the Chunar city. The private emptiers could not be tracked due to non- availability of emptiers in the city during fi eld based study by researchers.
Chunar NPP often hires a vacuum tanker from Ahraura Nagar Palika Parishad, which is 22 km away from Chunar city. The capacity of the vacuum tanker is 2,000 litres. The tanker is employed for providing empty-ing service to community toilets and government buildings. The sanitary workers of the NPP do not use any personal protective equipment(PPE) like gloves, boots and mask during emptying of OSS and cleaning of drains (NPP, 2016).
2.1.4 Transportation and treatment
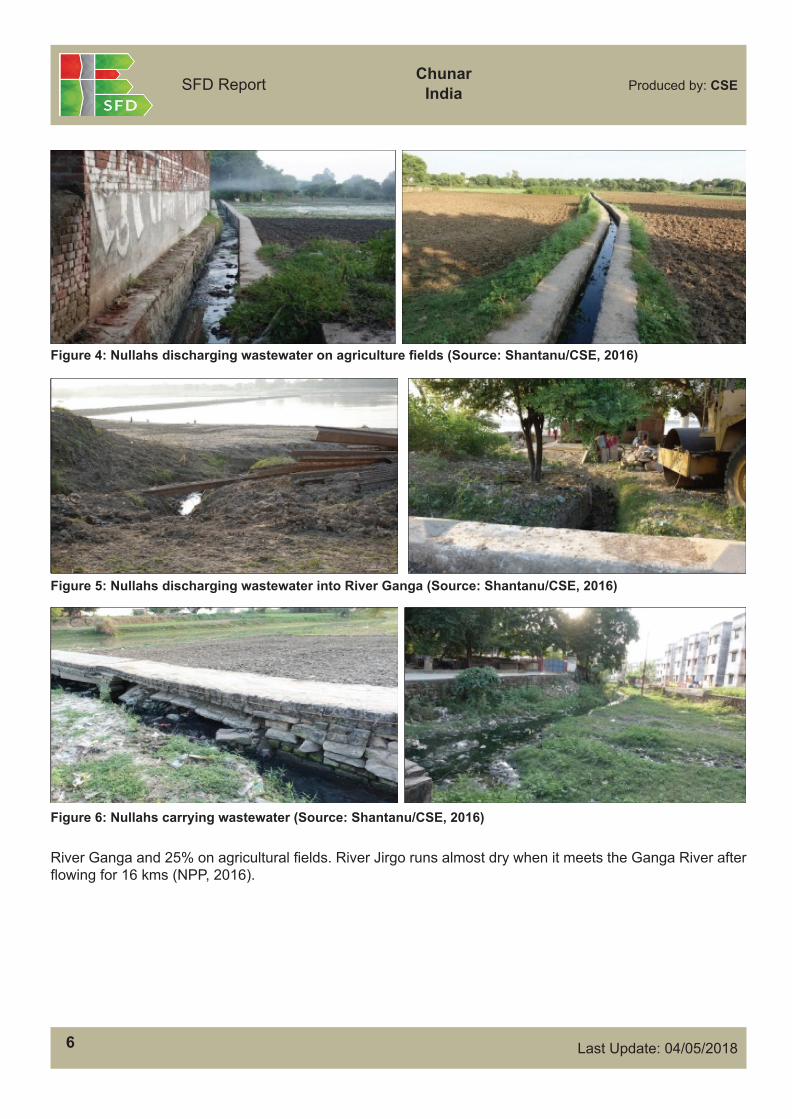
Emptiers discharge FS into open drains or any low-lying open grounds in and around the city. WW is con-veyed through open drains in the city, which fi nally converge into twenty seven major nullahs. There is no treatment of WW and FS generated in the city (NPP, 2016).
2.1.5 End-use/Disposal
At present, Chunar is completely non- sewered and emptiers discharge the faecal waste at low-lying open grounds anywhere in and around the city. Depending upon the irrigation requirement of the crops, farmers often draws WW and supernatant fl ows from big and small nullahs passing through their agriculture fi elds. Out of the 27 major nullahs, 14 discharge into River Ganga, 8 discharge into River Jirgo and the rest even-tually discharge at agricultural fi elds. As much as 50% of the city’s WW is disposed into River Jirgo, 25% in
Figure 3: Wastewater conveyed through open storm-water drains (Source: Bhavik/CSE, 2016)
Figure 2: Septic tank with effl uent pipe connected to open drain (Source: Shantanu/CSE, 2016)
Chunar.indd 4 28/09/18 11:50 AM

5
SFD Report
Last Update: 04/05/2018
Produced by: CSEChunar
India
2.1.3 Emptying
Although 71% of the population is dependent on on-site sanitation facilities, Chunar Nagar Palika Parishad (NPP) doesn’t own a single vacuum tanker. The fi eld survey revealed that most of the settlement in the city is informal and unplanned. Due to narrow and congested roads, households are dependent on manual empty-ing service through private emptiers. The manual emptying is usually carried out by 2 - 4 people, depending upon the size of the containment and the degree of density of FS in the containment. In general, frequency of emptying the containment system is more than 5 years. Manual emptying is still prevalent. Spade and bucket are used by manual emptiers for emptying OSS without any safety gears. The emptying service fee ranges from INR1500 to INR 2,000 (23 USD – 30 USD) (KII, 2016). During the random household survey, it was alleged that vacuum tankers owned by private emptiers from nearby cities also ply in the Chunar city. The private emptiers could not be tracked due to non- availability of emptiers in the city during fi eld based study by researchers.
Chunar NPP often hires a vacuum tanker from Ahraura Nagar Palika Parishad, which is 22 km away from Chunar city. The capacity of the vacuum tanker is 2,000 litres. The tanker is employed for providing empty-ing service to community toilets and government buildings. The sanitary workers of the NPP do not use any personal protective equipment(PPE) like gloves, boots and mask during emptying of OSS and cleaning of drains (NPP, 2016).
2.1.4 Transportation and treatment
Emptiers discharge FS into open drains or any low-lying open grounds in and around the city. WW is con-veyed through open drains in the city, which fi nally converge into twenty seven major nullahs. There is no treatment of WW and FS generated in the city (NPP, 2016).
2.1.5 End-use/Disposal
At present, Chunar is completely non- sewered and emptiers discharge the faecal waste at low-lying open grounds anywhere in and around the city. Depending upon the irrigation requirement of the crops, farmers often draws WW and supernatant fl ows from big and small nullahs passing through their agriculture fi elds. Out of the 27 major nullahs, 14 discharge into River Ganga, 8 discharge into River Jirgo and the rest even-tually discharge at agricultural fi elds. As much as 50% of the city’s WW is disposed into River Jirgo, 25% in
Figure 3: Wastewater conveyed through open storm-water drains (Source: Bhavik/CSE, 2016)
Figure 3: Wastewater conveyed through open storm-water drains (Source: Bhavik/CSE, 2016)
Chunar.indd 5 28/09/18 11:50 AM
6
SFD Report
Last Update: 04/05/2018
Produced by: CSEChunar
India
River Ganga and 25% on agricultural fi elds. River Jirgo runs almost dry when it meets the Ganga River after fl owing for 16 kms (NPP, 2016).
Figure 5: Nullahs discharging wastewater into River Ganga (Source: Shantanu/CSE, 2016)
Figure 4: Nullahs discharging wastewater on agriculture fi elds (Source: Shantanu/CSE, 2016)
Figure 6: Nullahs carrying wastewater (Source: Shantanu/CSE, 2016)
Chunar.indd 6 28/09/18 11:50 AM
7
SFD Report
Last Update: 04/05/2018
Produced by: CSEChunar
India
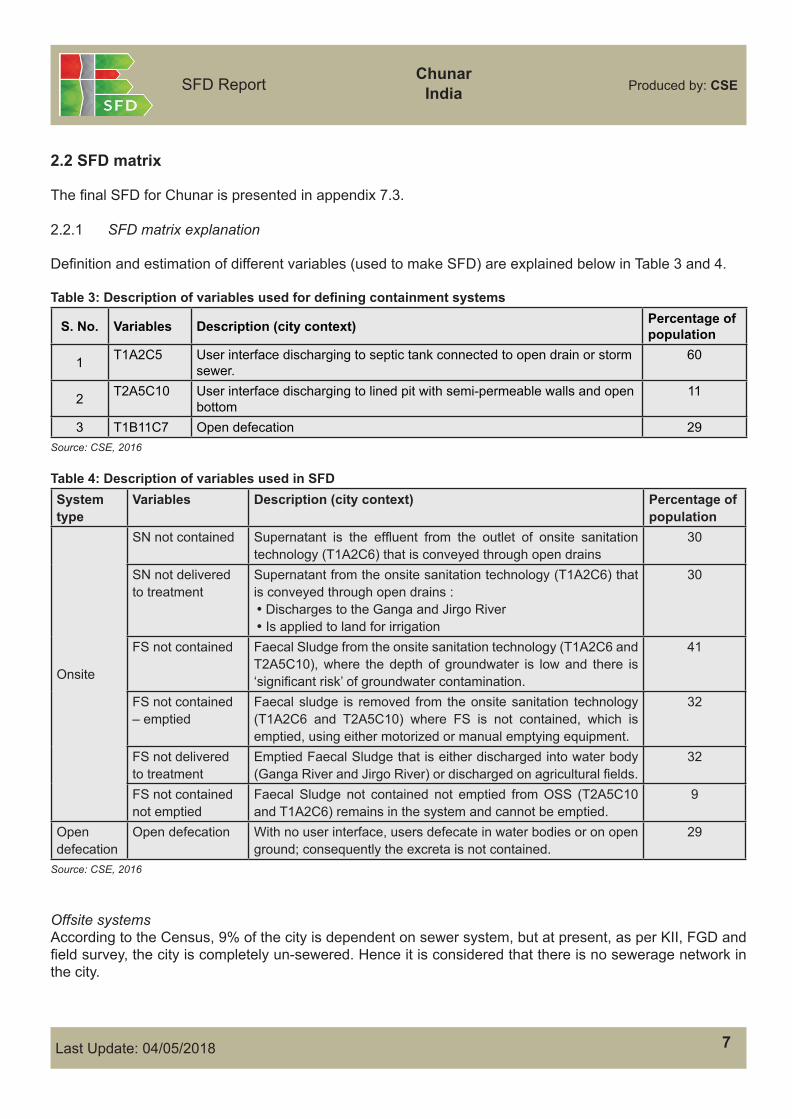
2.2 SFD matrix
The fi nal SFD for Chunar is presented in appendix 7.3.
2.2.1 SFD matrix explanation
Defi nition and estimation of different variables (used to make SFD) are explained below in Table 3 and 4.
Table 3: Description of variables used for defi ning containment systems
S. No. Variables Description (city context) Percentage of population
1 T1A2C5 User interface discharging to septic tank connected to open drain or storm sewer.
60
2 T2A5C10 User interface discharging to lined pit with semi-permeable walls and open bottom
11
3 T1B11C7 Open defecation 29Source: CSE, 2016
Table 4: Description of variables used in SFDSystem type
Variables Description (city context) Percentage of population
Onsite
SN not contained Supernatant is the effl uent from the outlet of onsite sanitation technology (T1A2C6) that is conveyed through open drains
30
SN not delivered to treatment
Supernatant from the onsite sanitation technology (T1A2C6) that is conveyed through open drains :• Discharges to the Ganga and Jirgo River • Is applied to land for irrigation
30
FS not contained Faecal Sludge from the onsite sanitation technology (T1A2C6 and T2A5C10), where the depth of groundwater is low and there is ‘signifi cant risk’ of groundwater contamination.
41
FS not contained – emptied
Faecal sludge is removed from the onsite sanitation technology (T1A2C6 and T2A5C10) where FS is not contained, which is emptied, using either motorized or manual emptying equipment.
32
FS not delivered to treatment
Emptied Faecal Sludge that is either discharged into water body (Ganga River and Jirgo River) or discharged on agricultural fi elds.
32
FS not contained not emptied
Faecal Sludge not contained not emptied from OSS (T2A5C10 and T1A2C6) remains in the system and cannot be emptied.
9
Open defecation
Open defecation With no user interface, users defecate in water bodies or on open ground; consequently the excreta is not contained.
29
Source: CSE, 2016
Offsite systemsAccording to the Census, 9% of the city is dependent on sewer system, but at present, as per KII, FGD and fi eld survey, the city is completely un-sewered. Hence it is considered that there is no sewerage network in the city.
Chunar.indd 7 28/09/18 11:50 AM
8
SFD Report
Last Update: 04/05/2018
Produced by: CSEChunar
India
Onsite sanitation systems71% of the city is dependent on onsite sanitation systems (OSS), out of which 60% are dependent on septic tanks and 11% on pits. Septic tanks are ‘not contained’ as they are connected to open drains. FS from pits is also considered ‘not contained’ as the infi ltrate pollutes the ground water.
There is no clear differentiation between the volume of effl uent and solid FS generated from septic tanks, hence to reduce the maximum error, it’s assumed to be 50% each. Therefore, 30% of FS is assumed to be effl uent (supernatant) that goes into open drains and rest 41% of FS (30% from septic tank and 11% from pits) from OSS is considered to be solid FS i.e. not contained. 50% of FS from pits, i.e. around 6% is assumed to be infi ltrating into the ground. It is also assumed that 90% of the population (dependent on onsite systems) gets their system emptied when full. Hence around 32% of FS (not contained) is emptied and 3% FS (not contained) remains in the tank. So, total FS not contained- not emptied, comes out to be 9% which includes the infi ltrate from the pits as well i.e. 6%.
Open defecation29% of the population still practices open defecation.
It can be concluded that excreta of the whole city’s population is discharged untreated in the rivers/agricul-tural fi elds therefore it is unsafely managed. The Appendix 7.4 summarizes the percentage of the population using each sanitation technology and method along the service chain.
2.2.2 Risk of groundwater contamination
Uttar Pradesh is covered with rich fertile soil and underlain by a large thickness of alluvium making it one of the richest ground water repositories of the world (CGWB, 2014).
The SFD assessment includes the risk of groundwater pollution as an important factor in determining whether excreta is contained or not contained. If the risk of contamination to groundwater is low then FS is considered “contained”. The type of onsite sanitation technology in use also has an infl uence on infi ltration of liquid into the groundwater and therefore on the potential risk of groundwater pollution.
Based on the survey with households and KIIs in Chunar, it was decided to characterize all existing sanitation containment systems as having “signifi cant risk� of groundwater pollution, as groundwater table is less than 10 mbgl (CGWB, 2014). The NPP supplies drinking water to the residents through deep tube-wells, ground-water being the most common source of water (NPP, 2016). According to the Census, 75% of the population is dependent on piped water supply and the rest on hand pumps. Household survey and FGD with NPP revealed 80% of the respondents are dependent on piped water supply through municipal bore wells, which also includes public tap water and households dependent on community based piped water connections. 20% of the respondents were depended on personal hand pumps, wells and submersible pumps. Also, 53% of the respondents dependent on piped water supply have their private hand pumps as backup.
2.2.3. Discussion of certainty/uncertainty levels of associated data
There were three major challenges to develop the SFD. Census and published/unpublished reports were not able to provide completely (i) up-to-date data on containment (ii) detailed typology of containment and (iii) actual information about FSM services provided to households. For this reason, fi eld based studies were conducted to validate the data and triangulation of data provided by secondary sources.
The Census mostly differentiate between systems connected to the user interface, if any, but does not give information about the design of actual containment systems on ground level or about the disposal of septage
Chunar.indd 8 28/09/18 11:50 AM
9
SFD Report
Last Update: 04/05/2018
Produced by: CSEChunar
India
and WW generated. Therefore, a random household sample survey was conducted in few wards of the city to identify and cross check the data collected from secondary sources. The census data is solely derived from the responses of the head of the household. Since there is no mechanism to cross verify the responses, there could be misreporting of the information due to various reasons including inadequate knowledge of the respondents or enumerators.
Although the number of households considered per ward was less to represent the whole city, the random households surveyed were from the different typology of settlements and different socio-economic back-grounds
Assumption regarding the volume of FS emptied as compared to FS generated has high impact on the overall SFD. Reliable method for estimating quantities of FS generated on a citywide scale do not yet exist, and it is complicated because the containment size and emptying period greatly varies. Since there is no clear differ-entiation between volume of effl uent/supernatant and septage generated from septic tanks and lined tanks, hence it’s assumed to be 50% each. Based on survey, it is assumed that, respondents getting their OSS emptied within 10 years are using their systems with emptying and respondents getting their OSS emptied after 10 years are using their system without emptying. In the matrix it is assumed that 90% of the population gets containment systems emptied when full.
The objective of the survey conducted was to obtain a more accurate measure of how excreta is managed through stages of sanitation service chain (from containment to end-use or disposal). To reduce the uncer-tainty around the data collected, the draft SFD was prepared and presented to the SBCLTF, based on their feedback a context adapted SFD was prepared.
2.3 Context adapted SFD
According to the SBCLTF, SFD generated by graphic generator is not suffi ciently visualizing the actual sit-uation at containment stage of sanitation chain. According to the stakeholders the properly designed septic tanks, which are regularly emptied, should be considered contained even if the supernatant is discharged into open drains. Hence, a context adapted city specifi c SFD graphic is manually corrected to convey the true picture of the excreta management in the city.
Please refer Appendix 7.5 for the context adapted SFD graphic. There is no major change done in the graphic. The only difference suggested in the context adapted SFD graphic is at containment stage, i.e. for correctly designed septic tanks. Out of 69% of the population, dependent on onsite sanitation system, 56% of the population is dependent on septic tanks connected to open drain or storm sewer. 13% of the population, dependent on lined pit with semipermeable walls and open bottom, is attributed to be FS not contained.
With an earlier assumption of 50% of the proportion of the content of the septic tank is solid FS, rest of the 50% is assumed to be supernatant, which attributes to 28% of the population, that fl ows through open drains. According to SBCLTF the solid FS collected in the septic tank (attributed to 28% population) should be considered contained as it is neither polluting the ground water nor the solid excreta is overfl owing in the open drain. Hence 28% of FS is considered contained (represented green in color). 25% FS contained is emptied and rest 3% FS remains in the tank which is contained and never emptied. Nevertheless, the supernatant generated from septic tank connected to open drain is not contained and hence considered to be unsafely managed (represented red in color).
Hence in the context adapted SFD, the ‘FS not contained’ changes from 100% to 97%, ‘FS contained’ becomes 3% and ‘SN not contained’ remains 28% when compared to SFD generated through graphic generator.
Chunar.indd 9 28/09/18 11:50 AM
10
SFD Report
Last Update: 04/05/2018
Produced by: CSEChunar
India
Overall excreta of 97% population is not managed safely according to the context adapted SFD. The graphic is well received by the stakeholder’s group and city’s authority has agreed that the context adapted SFD graphic is representing much closer picture to the ground conditions.
Chunar.indd 10 28/09/18 11:50 AM
11
SFD Report
Last Update: 04/05/2018
Produced by: CSEChunar
India
3 Service delivery context description
3.1 Policy, legislation and regulation
3.1.1 Policies, legislations and regulations at national level
In 2008, the Ministry of Housing and Urban Affairs (MoHUA), formerly known as Ministry of Urban Development (MoUD) issued the National Urban Sanitation Policy (NUSP). The policy aims to: raise awareness; promote behavior change; achieve open defecation free cities; develop citywide sanitation plans; and provide 100% safe confi nement, transport, treatment and disposal of human excreta and liquid wastes. The NUSP mandates states to develop state urban sanitation strategies and work with cities to develop City Sanitation Plans (CSPs). NUSP specifi cally highlights the importance of safe and hygienic facilities with proper disposal and treatment of sludge from on-site installations (septic tanks, pit latrines, etc.) and proper operation and maintenance (O&M) of all sanitary facilities. Furthermore, it explicitly states that cities and states must issue policies and technical solutions that address onsite sanitation, including the safe confi nement of Faecal Sludge (FS) (USAID, 2010). The objectives of NUSP are to be realized through CSPs and state sanitation strategies. NUSP identifi es the constitution of multi-stakeholder task force as one of the principal activities to be taken up to start the city sanitation planning process. As per the requirement of CSP, major role is to be played by the members of institutions, organizations, individuals, NGOs, academics, media representatives, local councilors, industry owners, consultants, representatives of private sector, etc. Constitution of Swachh Bharat City Level Task Force (SBCLTF) formerly known as City Sanitation Task Force (CSTF) is facilitated by drawing members from these groups in consensus with citizens who will be constantly supporting the CSP preparation by analyzing the strengths and competencies required to overcome the current situation and to improve sanitation facilities (MoUD, 2014).
The advisory note on septage management in urban India, issued by MoHUA in 2013, recommends supplementing CSPs with a Septage Management Sub-Plan (SMP), prepared and implemented by cities. Septage here broadly refers to not only FS removed from septic tanks but also that removed from pit latrines and similar on-site systems. This advisory provides reference to Central Public Health and Environmental Engineering Organisation (CPHEEO) guidelines, Bureau of Indian Standard (BIS), and other resources that users of this advisory may refer, for details while preparing their SMP (MoUD, 2013). The advisory clearly discusses the techno-managerial and socio-economic aspects of septage management in India and provides guidelines for Urban Local Bodies (ULBs) to plan and implement SMP. A draft of Urban and Regional Development Plan Guidelines Formulation and Implementation promotes effi cient implementation mechanisms and innovative techniques for planned socio-economic development of urban areas. Under infrastructure planning-physical infrastructure, the guidelines focus on sewage and sanitation including septage management in planning and implementation (MoUD, 2014a).
The Environment (Protection) Act, 1986 and the Water (Prevention and Control of Pollution) Act, 1974 have provisions relating to sanitation services and environmental regulations. It applies to households and cities with regard to disposing wastes into the environment. ULBs/ utilities also have to comply with discharge norms for effl uent released from sewage treatment plants and to pay water cess under the Water Cess Act, 1977. The ULB is responsible for ensuring the safe handling and disposal of septage generated within its boundaries, for complying with the Water Act and for meeting all state permit requirements and regulations (CSE, 2010). Municipal acts and regulations usually refer to management of solid and liquid wastes but may not provide detailed rules for septage management (MoUD, 2013).
Chunar.indd 11 28/09/18 11:50 AM
12
SFD Report
Last Update: 04/05/2018
Produced by: CSEChunar
India
The Prohibition of Employment as Manual Scavengers and their Rehabilitation Act is enacted in 2013. This act prohibits employment of manual scavengers and insanitary latrines - Laying strong emphasis on rehabilitation of manual scavengers. The broad objectives of the act are to eliminate insanitary latrines, prohibit the employment of manual scavengers and the hazardous manual cleaning of sewer and septic tanks, and to maintain a survey of manual scavengers and their rehabilitation (MoSJE, 2014).
In February 2017, MoUD issued the National Policy on Faecal Sludge and Septage Management (FSSM). The policy aims to set the context, priorities, and direction for, and to facilitate, nationwide implementation of FSSM services in all ULBs such that safe and sustainable sanitation becomes a reality for all in each and every household, street, town and city in India (MoUD, 2017).
The Fourteenth Finance Commission (FC-XIV) was constituted by the President of India under Article 280 of the Constitution on 2 January 2013 to make recommendations for the period 2015-20. Its assignments include: distribution of revenue between union and state; devising formula for grant; suggesting method to augment resources for local bodies; and taking care of any matter referred to it (NIUA, 2015).
Model Municipal Building Bye-laws 2016 prepared by Town and Country Planning Organization (TCPO). Building Byelaws 2016 is used to regulate coverage, height, building bulk, and architectural design and construction aspects of buildings so as to achieve orderly development of an area. They are mandatory in nature and serve to protect buildings against fi re, earthquake, noise, structural failures and other hazards. It includes chapters on green buildings and sustainability provisions, rainwater harvesting, wastewater (ww) reuse and recycle, installation of solar roof top photo voltaic norms, revised norms for adequate toilet facilities for women and public conveniences in public buildings and mandatory provisions for segregated toilet facilities for visitors in public buildings (TCPO, 2016).
3.1.2 Policies, legislations and regulations at state level and ULB level
According to the Constitution of India, water and sanitation are state subjects. Statutory powers are conferred to the state for making laws on water and sanitation. Some of the policies, laws and regulations are listed below:
The Uttar Pradesh Water Supply and Sewerage Act, 1975An act to facilitate the establishment of corporation, authorities and organizations for the development and regulation of water supply and sewerage services, related matters. According to this act the corporation has powers to fi ne the owner of the improper/damaged septic tank.
The Uttar Pradesh Urban Sanitation Policy, 2010In 2010, the Director of Local Authorities, Uttar Pradesh issued the Uttar Pradesh Urban Sanitation Policy (UPUSP). The policy is inspired from the NUSP. The UPUSP mandates the cities to establish City Sanitation Task Force (CSTF) and to elevate the consciousness about sanitation in municipal agencies, government agencies and most importantly, amongst the people of the city. UPUSP specifi cally highlights the importance of safe and hygienic facilities with proper disposal and treatment of sludge from on-site installations (septic tanks, pit latrines, etc.) and proper operation and maintenance (O&M) of all sanitary facilities. As of now there are very few cities that have fi nalized their CSPs; and it remains a major drawback in the implementation of the UPUSP.
Draft Faecal Sludge and Septage Management Guidelines, 2016The draft guidelines provide step by step approach for preparation of plan for septage management and fi nancial resource mobilization, along with a focus on existing situation across sanitation service chain and sources of revenue. The guidelines stress upon Uttar Pradesh Municipal Corporation Act, 1959, Chapter
Chunar.indd 12 28/09/18 11:50 AM
13
SFD Report
Last Update: 04/05/2018
Produced by: CSEChunar
India
IX: Corporation taxation, Section 173(d), where Conservancy tax can be levied on all the properties by the corporation where city undertakes the collection, removal and disposal of excreta and polluted matter from privies, urinals and cesspools.
Uttar Pradesh Municipal Building Bye-Laws, 2008Issued by Housing Department, Government of Uttar Pradesh. The codes specify standards and design con-sideration for installation of toilets and septic tank.
The Uttar Pradesh Finance Commission is a committee pertaining to the state of Uttar Pradesh, established with a purpose of reviewing the fi nancial implementations of the state. The main purpose of this committee is to formulate implementation of fi nancial policies pertaining to the state of Uttar Pradesh. The Finance Com-mission is set up under the Article 243 Sec I of the Indian Constitution, which orders that the Governor of the state would, at the end of every fi fth year establish a Finance Commission for the purpose of reviewing, within the introduction of the 73rd Amendment of the Constitution Act, 1992 (SFC, 2014).
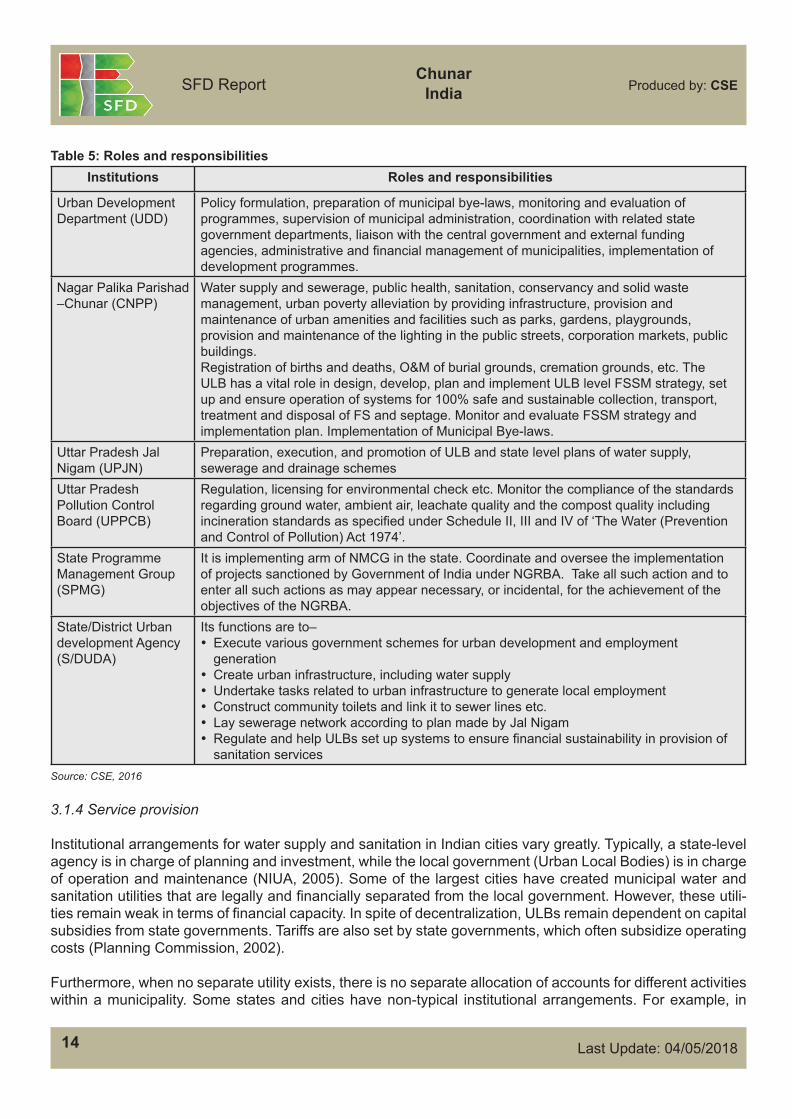
3.1.3 Institutional roles
The MoUD is the nodal ministry for policy formulation and guidance for the urban water supply and sew-erage sector. The ministry’s responsibilities include broad policy formulation, institutional and legal frame-works, setting standards and norms, monitoring, promotion of new strategies, coordination and support to state programmes through institutional expertise and fi nance. The ministry is also responsible for managing international sources of fi nance. The Central Public Health and Environmental Engineering Organization (CPHEEO), created in 1953, is the technical wing of the MoUD, which advises the ministry in all technical matters and collaborates with the State Agencies about water supply and sanitation activities. CPHEEO plays a critical role in externally funded and special programmes. CPHEEO also plays a central role in setting de-sign standards and norm setting for urban water supply and sanitation (Planning Commision, 2002).
National Council for Rejuvenation, Protection and Management of River Ganga referred as National Ganga Council formerly known as National Ganga River Basin Authority (NGRBA), which was constituted under the provisions of the Environment (Protection) Act (EPA), 1986. The council aims at ensuring effective abatement of pollution and rejuvenation of the river Ganga by adopting a river basin approach to promote inter-sectoral co-ordination for comprehensive planning and management, maintenance of minimum ecological fl ows in the River Ganga with the aim of ensuring water quality and environmentally sustainable development (NMCG, 2011).
The 74th Constitutional Amendment Act of 1992 reformed the sector by transferring responsibility for domes-tic, industrial, and commercial water supply and sewerage (WSS) from state agencies, such as Departments of Public Health Engineering and State Water Boards, to Urban Local Bodies (ULBs). This transfer has re-sulted in a variety of implementation models, as well as a lack of clarity in roles and responsibilities of state and local agencies, resulting in large gaps in implementation (USAID, 2010).
Management and delivery of urban basic services in Chunar is governed by various institutions. The following are the institutions responsible for policy making, service provision and regulation of urban services:-
Chunar.indd 13 28/09/18 11:50 AM
14
SFD Report
Last Update: 04/05/2018
Produced by: CSEChunar
India
Table 5: Roles and responsibilitiesInstitutions Roles and responsibilities
Urban Development Department (UDD)
Policy formulation, preparation of municipal bye-laws, monitoring and evaluation of programmes, supervision of municipal administration, coordination with related state government departments, liaison with the central government and external funding agencies, administrative and fi nancial management of municipalities, implementation of development programmes.
Nagar Palika Parishad –Chunar (CNPP)
Water supply and sewerage, public health, sanitation, conservancy and solid waste management, urban poverty alleviation by providing infrastructure, provision and maintenance of urban amenities and facilities such as parks, gardens, playgrounds, provision and maintenance of the lighting in the public streets, corporation markets, public buildings. Registration of births and deaths, O&M of burial grounds, cremation grounds, etc. The ULB has a vital role in design, develop, plan and implement ULB level FSSM strategy, set up and ensure operation of systems for 100% safe and sustainable collection, transport, treatment and disposal of FS and septage. Monitor and evaluate FSSM strategy and implementation plan. Implementation of Municipal Bye-laws.
Uttar Pradesh Jal Nigam (UPJN)
Preparation, execution, and promotion of ULB and state level plans of water supply, sewerage and drainage schemes
Uttar Pradesh Pollution Control Board (UPPCB)
Regulation, licensing for environmental check etc. Monitor the compliance of the standards regarding ground water, ambient air, leachate quality and the compost quality including incineration standards as specifi ed under Schedule II, III and IV of ‘The Water (Prevention and Control of Pollution) Act 1974’.
State Programme Management Group (SPMG)
It is implementing arm of NMCG in the state. Coordinate and oversee the implementation of projects sanctioned by Government of India under NGRBA. Take all such action and to enter all such actions as may appear necessary, or incidental, for the achievement of the objectives of the NGRBA.
State/District Urban development Agency (S/DUDA)
Its functions are to– • Execute various government schemes for urban development and employment
generation• Create urban infrastructure, including water supply• Undertake tasks related to urban infrastructure to generate local employment• Construct community toilets and link it to sewer lines etc.• Lay sewerage network according to plan made by Jal Nigam• Regulate and help ULBs set up systems to ensure fi nancial sustainability in provision of
sanitation servicesSource: CSE, 2016
3.1.4 Service provision
Institutional arrangements for water supply and sanitation in Indian cities vary greatly. Typically, a state-level agency is in charge of planning and investment, while the local government (Urban Local Bodies) is in charge of operation and maintenance (NIUA, 2005). Some of the largest cities have created municipal water and sanitation utilities that are legally and fi nancially separated from the local government. However, these utili-ties remain weak in terms of fi nancial capacity. In spite of decentralization, ULBs remain dependent on capital subsidies from state governments. Tariffs are also set by state governments, which often subsidize operating costs (Planning Commission, 2002).
Furthermore, when no separate utility exists, there is no separate allocation of accounts for different activities within a municipality. Some states and cities have non-typical institutional arrangements. For example, in
Chunar.indd 14 28/09/18 11:50 AM
15
SFD Report
Last Update: 04/05/2018
Produced by: CSEChunar
India
Rajasthan the sector is more centralized and the state government is also in charge of operation and main-tenance while in Mumbai the sector is more decentralized and local government is also in charge of planning and investment (NIUA, 2005).
In Chunar, public health, sanitation, conservancy, and solid waste management services are delivered by Health and Sanitation Department of CNPP. Septage management is also the responsibility of the same de-partment, headed by the Sanitary Offi cer.
3.1.5 Service standards
1. Service Level Benchmarks (SLB), 2008: Issued by the Ministry of Urban Development in 2008, the SLB seek to (i) identify a minimum set of standard performance parameters for the water and sanitation sector that are commonly understood and used by all stakeholders across the country; (ii) defi ne a common minimum framework for monitoring and reporting on these indicators and (iii) set out guidelines on how to operationalize this framework in a phased manner. The SLB refers to improving service through bet-ter provision and delivery. It evaluates the performance of urban services provided by different ULBs throughout the country.
2. General Standards for Discharge of Environmental Pollutants – The Environment (Protection) Rules, 1986 (Schedule VI): Issued by Central Pollution Control Board (CPCB), a statutory organisation consti-tuted in September, 1974 under the Water (Prevention and Control of Pollution) Act, 1974. General stan-dards are notifi ed with respect to parameters for safe discharge of effl uent to inland surface water/public sewers/land for irrigation/ marine coastal areas.
3. Manual on Sewerage and Sewage Treatment, Second Edition, 2013: This manual was developed by Central Public Health and Environmental Engineering Organization (CPHEEO). It provides detailed de-signs and guidelines for various technologies of WW management.
4. Code of Practice for Installation of Septic Tanks, 1985: Issued by, Bureau of Indian Standards. The code specifi es standards and design consideration for installation of septic tanks.
3.2 Planning
3.2.1 Service targets
State governments must put in place targets for delivery of essential services provided by the local bodies for four services viz., water supply, sewerage, solid waste management and storm water drains on lines of handbook for SLB by MoUD. State government must notify or cause all ULBs to notify by the end of a fi scal year the service standards and targets (PAS, 2009-16).
The Swachh Bharat Mission (SBM), one of the fl agship programmes of the Government of India, launched on October 2nd 2014 by the Ministry of Housing and Urban Affairs. SBM-Urban aims to eliminate open defeca-tion, eradicate manual scavenging, capacity augmentation of ULBs and generate awareness about sanitation and its linkage with public health during the mission period till 2019. The SBM (urban) aims to ensure that no new insanitary toilets are constructed during the mission period and that pit latrines should be converted into sanitary latrines. The target group for construction of household units of toilets thus is (i) 80% of urban house-holds engaging in open defecation, remaining 20% of households practicing open defecation are assumed to be catered by community toilets due to constraints of space (ii) all households with insanitary latrines (iii) all households with single-pit latrines (MoUD, 2014). Table 6 provides an overview of service delivery progress in accordance with SBM.
Chunar.indd 15 28/09/18 11:50 AM

16
SFD Report
Last Update: 04/05/2018
Produced by: CSEChunar
India
Table 6: Service delivery targets in accordance with SLBsSanitation service
chain Parameter National benchmark
Timeframe to achieve benchmark
Containment Coverage of toilets 100% 2019
TransportCoverage of sewer network services 100% 2031
Collection effi ciency of the sewerage network 100% 2031
TreatmentAdequacy of sewage treatment capacity 100% 2031
Quality of sewage treatment 100% 2031
End-use/disposal Reuse and recycling 20% 2031
Other
Cost recovery 100% 2031
Effi ciency of collection of charges 100% 2031
Redressal of customer complaints 80% 2031Source: Adapted from MoUD 2008 and MoUD 2010
Table 7: Service delivery progress in accordance with SBM
SBM HeadOnline application status
Received Verifi ed Approved Rejected
IHHT 2907 29 16 344
CT 9 9 9 0
PT 0 0 0 0Source: NPP, 2016
According to rapid assessment of FSM in the city done by NPP, they would need six emptying trucks, which will improve the emptying services provided by them extending to households. Each vehicle is expected to complete 2 trips per day with an average distance of round trip being 12 km. Along with the emptying trucks, the NPP also needs one or more FSTP in the municipal area, which is expected to treat 41 cum/day initially and 45 cum/day after a period of 5 years (MoUD, 2016).
3.2.2 Investments
An investment of INR 53.66 crores (8.07 Million USD) was proposed for the project “Interception Diversion and Treatment Works at Chunar - Mirzapur”. The project proposed to intercept ten major drains fl owing into River Ganga and two major drains fl owing into River Jirgo. The interceptor trunk sewer has been proposed to divert the fl ow of the nullahs. It is also proposed to construct an intermediate pumping station at Tambal Ganj Nullah and one main pumping station at the STP site. The discharge from the twelve nullahs is proposed to be conveyed to 6.5 MLD STP through MPS (UPJN, 2015). Table 8 provides a status of funds released by central government under SBM to the ULB for construction of toilets.
Chunar.indd 16 28/09/18 11:50 AM
17
SFD Report
Last Update: 04/05/2018
Produced by: CSEChunar
India
Table 8: Status of fund released in the year 2015 in accordance with SBMIndividual Household Toilets (IHHT) Community Toilets (CT) Total fund
(INR)GoI share GoUP share GoI share GoUP shareNo. of
approved applications
INR 2000 per toilet
No. of approved
applications
INR 2000 per Toilet
No. of CT seats
INR 13000
per Seat
No. of CT seats
INR 13000
per Seat1 2000 1 2000 42 546,000 42 546,000 1,096,000
Source: SBM, 2016
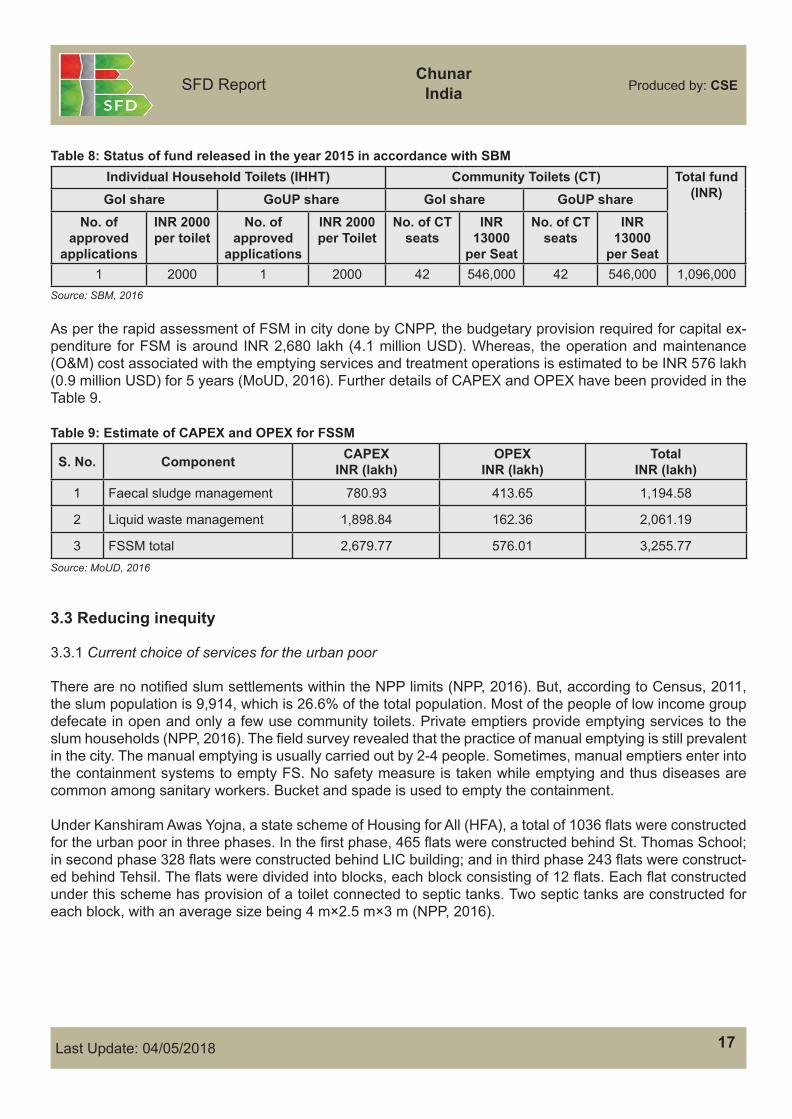
As per the rapid assessment of FSM in city done by CNPP, the budgetary provision required for capital ex-penditure for FSM is around INR 2,680 lakh (4.1 million USD). Whereas, the operation and maintenance (O&M) cost associated with the emptying services and treatment operations is estimated to be INR 576 lakh (0.9 million USD) for 5 years (MoUD, 2016). Further details of CAPEX and OPEX have been provided in the Table 9.
Table 9: Estimate of CAPEX and OPEX for FSSM
S. No. Component CAPEXINR (lakh)
OPEXINR (lakh)
TotalINR (lakh)
1 Faecal sludge management 780.93 413.65 1,194.58
2 Liquid waste management 1,898.84 162.36 2,061.19
3 FSSM total 2,679.77 576.01 3,255.77Source: MoUD, 2016
3.3 Reducing inequity
3.3.1 Current choice of services for the urban poor
There are no notifi ed slum settlements within the NPP limits (NPP, 2016). But, according to Census, 2011, the slum population is 9,914, which is 26.6% of the total population. Most of the people of low income group defecate in open and only a few use community toilets. Private emptiers provide emptying services to the slum households (NPP, 2016). The fi eld survey revealed that the practice of manual emptying is still prevalent in the city. The manual emptying is usually carried out by 2-4 people. Sometimes, manual emptiers enter into the containment systems to empty FS. No safety measure is taken while emptying and thus diseases are common among sanitary workers. Bucket and spade is used to empty the containment.
Under Kanshiram Awas Yojna, a state scheme of Housing for All (HFA), a total of 1036 fl ats were constructed for the urban poor in three phases. In the fi rst phase, 465 fl ats were constructed behind St. Thomas School; in second phase 328 fl ats were constructed behind LIC building; and in third phase 243 fl ats were construct-ed behind Tehsil. The fl ats were divided into blocks, each block consisting of 12 fl ats. Each fl at constructed under this scheme has provision of a toilet connected to septic tanks. Two septic tanks are constructed for each block, with an average size being 4 m×2.5 m×3 m (NPP, 2016).
Chunar.indd 17 28/09/18 11:50 AM
18
SFD Report
Last Update: 04/05/2018
Produced by: CSEChunar
India
3.3.2 Plans and measures to reduce inequity
Pradhan Mantri Aawas Yojna (PMAY), a national scheme of HFA (Urban) project is aimed for urban areas with following components: (i) Slum rehabilitation of slum dwellers with participation of private developers using land as a resource; (ii) Promotion of affordable housing for weaker section through credit linked subsi-dy; (iii) Affordable housing in partnership with public and private sectors; and (iv) Subsidy for benefi ciary-led individual house construction or enhancement.
All houses built or expanded under the mission should essentially have toilets facility. The mission has provi-sion of civic infrastructure as per applicable state norms/CPHEEO norms/IS Code/NBC for connection sewer, if existing or has to be made through convergence of other national or state schemes (MHUPA, 2016).
Under PMAY, 3,683 application forms were fi lled and submitted by NPP to SUDA, out of which 3,029 have been inspected. (NPP, 2016). Also, 2,907 application forms for construction of toilets were fi lled under SBM, of which 29 have been verifi ed and 16 approved.
3.4 Outputs
3.4.1 Capacity to meet service needs, demands and targets
NPP has insuffi cient fund to meet the demand of providing basic sanitation services and amenities through the revenue it is generating. NPP is majorly dependent on state and central schemes for fund. It is learnt during the focus group discussion with the NPP that there is often delay in the disbursement of fund through state fi nance department (NPP, 2016).
Municipal expenditures in India account for 1.1% of the country’s GDP, compared to 6.9% in South Africa and 9.7% in Switzerland. ULBs therefore rely mainly on national or state grants (AFD, 2014). In the context of Chunar, the major source of income (both revenue and capital) is through grants from Finance Commis-sion and the remaining is generated through taxes and user charges. NPP also received funds for sanitation infrastructure development which came through SBM.
Shortage of human resource can be witnessed in the NPP. It is largely relied on staff hired on contractual basis to provide the daily service needs to the public. Also, the staff lacks the basic know-how and technical skills (NPP, 2016).
3.4.2 Monitoring and reporting access to services
Data on service levels should be collected, documented and reported to MoUD according to the format pre-scribed by SLB framework.
Progress of toilet coverage gets refl ected on SBM-Urban dashboard of the website. Of 4041+ Municipalities in 650+ districts, 3,802 ULBs are active. 75 million plus cities are being monitored separately (MoUD, 2014). Under SBM, no toilets have been constructed yet in the city of Chunar (NPP, 2016).
The sanitary inspector is supposed to inspect the design of septic tanks and their adherence to standards at the time of house/building construction but this is not done most of the times (NPP, 2016).
Chunar.indd 18 28/09/18 11:50 AM
19
SFD Report
Last Update: 04/05/2018
Produced by: CSEChunar
India
3.5 Expansion
In 2016, MoUD initiated rapid assessment of 131 fl agship cities to estimate the budgetary requirement for implementing Faecal Sludge and Septage Management (FSSM) in selected cities across the country, sup-ported by the National Alliance for Faecal Sludge and Septage Management (NFSSM). The fl agship cities include 100 smart cities, 12 cities in Ganga basin and others across India. A declaration was signed – for cities journey beyond Open Defecation Free (ODF) - mainstreaming effective FS and septage management by key decision makers and NFSSM alliance members.
Chunar is one of the fl agship city and has undergone the assessment but since it is not covered under the AMRUT programme, the NPP has to look for other sources of funding like NMCG/ FC/ donor agencies etc.
National Mission for Clean Ganga, develop such infrastructure or make such infrastructure functional, as the case may be, for collection, storage, transportation and disposal of sewage in the territorial area of the local authority through its Namami Gange programme- an integrated Ganga conservation programme (NMCG, 2014). Under this mission, 118 towns have been identifi ed as priority towns for the interventions near main stem of Ganga. Chunar city is one of the cities listed in 118 urban habitations.
Nirmal Dhara is proposed under Namami Gange Programme – an initiative ensuring sustainable municipal sewage management which plans for (NMCG, 2014):-• Project prioritization in coordination with MoUD• Incentive for states to take up projects on Ganga Main-stem by providing an additional share of central
grants for sewerage infrastructure. • Uniform standards for both MoUD scheme and Namami Gange programme, 10 years mandatory O&M by
the same service provider at par with NGRBA programme and Public- Private Partnership (PPP), Manda-tory reuse of treated water.
• Expanding coverage of sewerage infrastructure in 118 urban habitations on banks of Ganga- estimated cost by MoWRRD&GR is INR 51,000 crores (7.6 Billion USD).
3.5.1 Stimulating demand for services
The following activities may stimulate demand for services:• Awareness generation on septic tank construction, regular emptying of septic tanks through awareness
campaigns• Awareness campaigns on ill effects of environmental degradation because of disposal of untreated sep-
tage into local environment • Capacity building of ULB staff on septage management• Skill development for local masons and plumbers• Monitoring and regulation of private emptiers
It is recognized that the end objectives and corresponding benefi ts of SBM and NMCG cannot be achieved without proper management of FS and septage across the sanitation service chain. Further, it is well under-stood that sewerage coverage will not meet the complete sanitation needs in all areas, and a strategy which is a combination of OSS and off-site (decentralised and centralised) must co-exist in all cities and must be given equal attention. However, the current policies are not explicit enough and also do not provide an out-come-focused direction on this issue (MoUD, 2017).
3.5.2 Strengthening service provider roles
Funding is estimated for septage management initiatives under rapid assessment for FSSM supported by the
Chunar.indd 19 28/09/18 11:50 AM
20
SFD Report
Last Update: 04/05/2018
Produced by: CSEChunar
India
MoUD, GoI through NFSSM. These funds can be used to buy vacuum tankers, building treatment facility, etc. CNPP has to make use of these funds to strengthen the services. At present, there are no detailed plans for strengthening service delivery.
SBM majorly provides funds for access to toilets but thereafter lacks funds for treatment and disposal of sew-age and FS throughout the service chain. The service delivery of sewage and FS treatment and disposal can be meet through converging the two national fl agship programmes – SBM and NMCG. The ULB can take the benefi t of the programmes and strengthen the services along the value chain and achieve the goals of both programmes.
Chunar.indd 20 28/09/18 11:50 AM
21
SFD Report
Last Update: 04/05/2018
Produced by: CSEChunar
India
4 Stakeholder engagement
4.1 Key informant interviews
The KIIs were conducted with the stakeholders having a role or interest in sanitation and FSM services within the city. The relevant departments were contacted through e-mail, letter, and call to visit to the concerned departments. The purpose of the SFD study and depth of data required was conveyed through an introduc-tory letter to respective departments. One KII was conducted with three sanitary supervisors (see Appendix 7.2). Apart from KII, survey was also conducted, which included interviews with representative from NGOs, institutions and other commercial establishments. Indeterminate information was available prior to the fi eld based research about the type of containment, emptying service, transportation and disposal of sewage generated by the city. The visit enabled in enhancing data collection through gathering progress details of SBM, published and unpublished reports like CDP, DPRs etc. Interview with the private emptiers and other stakeholders provided additional insight into the service delivery context.
4.2 Field observations
In order to get a better picture of variety/typology of onsite sanitation system, primary surveys were con-ducted. Random sample was carefully chosen to get good spatial representation, from each ward, of OSS dependence based on Census, 2011. At-least 5-6 households were surveyed in each of the selected wards of Chunar. It was made sure that respondents from slums are surveyed as well. The surveyor also recorded the fi eld observations related to sanitation. Such surveys, observations and KIIs helped to produce a more credible and accurate SFD, provides qualitative data and perhaps more precise quantitative data relating to the service delivery. Some of the observations are listed below.
It was observed that few economically weaker section (EWS) households have poorly constructed toilets. The toilet is generally constructed for the females in the house, males and children practice open defecation. The households situated near the bank of Ganga River practice open defecation. The households in dense and core areas of the city were observed to have access to toilets and were found using it. The containment system varies according to the economic condition of the society. A visit was done to observe the various discharge points of sewage and septage in the city. Observation in the city also helped in sample selection as it gave a better understanding of the city context.
Most of the settlement in the city is informal and unplanned. Due to narrow and congested roads, households are dependent on manual emptying service through private emptiers.
4.3 Focus group discussions
Four FGDs were conducted with slum dwellers, BMC administration and sanitary workers to complement, validate and challenge data collected during literature review and interviews. One fact which emerged from focus group discussion was the lack of knowledge and awareness about the ill-effect on the environment and human health due to the uncouth discharge of untreated FS and WW.
The fi ndings from the FGD sessions revealed information that increased the understanding of the sanitation and septage management in Buxar. FGDs were useful in data triangulation. Random survey helped in validating secondary data and data provided by different stakeholders. It resulted in actual and true SFD of the city.
Stakeholders were identifi ed and the taskforce was formulated and notifi ed under the mandate by NUSP
Chunar.indd 21 28/09/18 11:50 AM
22
SFD Report
Last Update: 04/05/2018
Produced by: CSEChunar
India
(refer appendix 7.10 for more details). An FGD was conducted with the SBCLTF’s members and the draft SFD was presented and analyzed. SBCLTF’s members validated the collected data and the fi nal SFD graphic (SBCLTF, 2017).
Chunar.indd 22 28/09/18 11:50 AM

23
SFD Report
Last Update: 04/05/2018
Produced by: CSEChunar
India
5 Acknowledgement
This report was compiled as part of the SFD promotion initiative project funded by the Bill and Melinda Gates foundation (BMGF). We would like to thank Mr Shamsher Singh, Water works In-charge, Jal Nigam and Mr. Mithilesh Kumar, Sanitary and Food Inspector, NPP for providing information for this assessment. A special thanks to Dr Suresh Kumar Rohilla, Programme Director, CSE, for his supervision and guidance at every step of the assessment and report writing.
Chunar.indd 23 28/09/18 11:50 AM
24
SFD Report
Last Update: 04/05/2018
Produced by: CSEChunar
India
6 References• AFD. 2014. Panorama of the Urban and Municipal Sector in India. Agence Française de Développement (AFD).
• BMOI. 2016. Uttar Pradesh Finance Commission. [online]. [Accessed 15 February 2017]. Available from World Wide Web: <http://business.mapsofi ndia.com/fi nance-commission/state/uttar-pradesh.html>
• Census of India. 2011. District Census Handbook - Mirzapur. Directorate of Census Operations - Uttar Pradesh.
• CGWB. 2014. Groundwater Year Book. Uttar Pradesh: Central Ground Water Board. Ministry of Water Resources, River Development and Ganga Rejuvenation
• Chunar. 2016. [online]. [Accessed 15 December 2016]. Available from World Wide Web: <https://en.wikipedia.org/wiki/Chunar>
• CSE. 2010. Policy Paper on Septage Management in India. New Delhi: Centre for Science and Environment.
• Demographics of Uttar Pradesh. 2017. [online]. [Accessed 2017 January 2017]. Available from World Wide Web: <https://en.wikipedia.org/wiki/Demographics_of_Uttar_Pradesh>
• KII. 2016. Key Informant Interview conducted with Sanitary Supervisors of Chunar-Nagar Palika Parishad. Uttar Pradesh
• MHUPA. 2016. Pradhan Mantri Awas Yojna, Housing for All (Urban) Scheme guidelines. Ministry of Housing and Urban Poverty Alleviation. GoI.
• MoSJE. 2014. The Prohibition of Employment as Manual Scavengers and their Rehabilitation Act, 2013 [18th September, 2013]. Ministry of Social Justice and Empowerment, GoI.
• MoUD. 2008. Handbook on Service Level Benchmarking. Ministry of Urban Development, GoI.
• MoUD. 2010. Service Level Benchmarking Data book - Improving Service Outcomes. Ministry of Urban Development. GoI.
• MoUD. 2013. Septage Management in Urban India. Ministry of Urban Development. GoI.
• MoUD. 2014. Guidelines for Swachh Bharat Mission. Ministry of Urban Development. GoI.
• MoUD. 2014a. Urban and Regional Development Plans Formulation and Implementation Guidelines: Volume 1 Final draft report. Ministry of Urban Development. GoI.
• MoUD. 2015. City Development Plan for Varanasi, 2041. Varanasi: Ministry of Urban Development. GoI.
• MoUD. 2016. Rapid Financial Estimate for FSSM Infrastructure for the city of Chunar. Ministry of Urban Development. GoI.
• MoUD. 2017. National Policy on Faecal Sludge and Septage Management. Ministry of Urban Development. GoI.
• NIC. 2016. Chunar. [online]. [Accessed 15 February 2017] National Informatics Centre. Available from World Wide Web: <http://varanasi.nic.in/tourist/tourist8.html> Last Update: 27/04/2017
• NIC. 2016. Chunar. [online]. [Accessed 15 February 2017] National Informatics Centre. Available from World Wide Web: <http://varanasi.nic.in/tourist/tourist8.html> Last Update: 27/04/2017
• NIUA. 2015. Fourteenth Finance Commission (2015-2020) - Report. [online]. [Accessed 19 January 2017]. Available from World Wide Web: <https://smartnet.niua.org/content/1aa83088-04ef-4e97-be11-9d4d93abc210>
• NMCG. 2011. National Mission for Clean Ganga. [online]. [Accessed 15 February 2017]. Available from World Wide Web: http://nmcg.nic.in/about_nmcg.aspx
• NMCG. 2014. Namami Gange programme. [online]. [Accessed 15 February 2017]. Available from World Wide Web: <http://nmcg.nic.in/Nama-miGanga.aspx>
• NPP. 2016. Focus Group Discussions conducted with Chunar Nagar Palika Parishad. Uttar Pradesh.
• PAS. 2009-16. Service Level Benchmarking - Maharashtra. CEPT University.
• Planning Commission 2002. Tenth Five Year Plan- 2002 to 2007.Vol 2. Planning Commission, GoI.
• SBCLTF. 2017. Minutes of the Swachh Bharat City level Task Force meeting. In: Swachh Bharat City Level Task Force. Chunar.
• SFC. 2014. 4th State Finanace Commssion- Panchayati Raj and urban local body fi nal report. [online]. [Accessed 23 January 2017]. Available from World Wide Web: <http://sfc.up.nic.in/FourththSFC.aspx>
• TCPO. 2016. Model Building Bye-Laws. Town and Country Planning Organization, Ministry of Urban Development, Government of India.
• UPJN. 2014. Sewarage works in Chunar (NP) for Abatement of Pollution of River Ganga. Mirzapur-Detailed Project Report: Uttar Pradesh Jal Nigam. GoUP.
• UPJN. 2015. Interception, Diversion and Treatment Works at Chunar, Mirzapur. Mirzapur: Uttar Pradesh Jal Nigam.
• USAID. 2010. A Rapid Assessment of Septage management in Asia: Policies and Practices in India, Indonesia, Malaysia, the Philippines, Sri Lanka, Thailand and Vietnam. Bangkok: United States Agency for International Development (USAID).
• VC. 2016. Chunar Fort-Varanasi City. [online]. [Accessed 20 January 2017]. Available from World Wide Web: <http://www.varanasicity.com/chunar-fort.html>
Chunar.indd 24 28/09/18 11:50 AM
25
SFD Report
Last Update: 04/05/2018
Produced by: CSEChunar
India
7 Appendix
7.1 Stakeholder identifi cation
Table 10: Stakeholder identi fi cati onS. No. Stakeholder group In Chunar context
1 City council / Municipal authority / Utility Nagar Palika Parishad, Chunar
2 Ministry in charge of urban sanitation and sewerage Urban Development Department, GoUP
3 Ministry in charge of urban solid waste Urban Development Department, GoUP
4
Ministries in charge of urban planning fi nance and economic development
Urban Development Department, GoUP
Ministries in charge of environmental protection/ Environment Department, GoUP
Ministries in charge of health Department of Medical Health and Family Welfare, GoUP
5 Service provider for construction of onsite sanitation technologies
Local masons
6 Service provider for emptying and transport of faecal sludge Private emptiers
7 Service provider for operation and maintenance of treatment infrastructure
N/A
8 Market participants practicing end-use of faecal sludge end products
N/A
9 Service provider for disposal of faecal sludge (sanitary landfi ll management)
Nagar Palika Parishad, Chunar
10External agencies associated with FSM services: e.g. NGOs, academic institutions, donors.
Swachh Bharat City Level Task Force, Centre for Science and Environment, New Delhi
Source: CSE, 2016
7.2 Tracking of engagement
Table 11: Tracking of engagementS. No. Name of
OrganisationDesignation Date of
engagementPurpose of engagement
1CNPP
Mayor 20/10/2016 Introduction of SFD and permission to conduct FGDs in the offi ces and municipal wards.
2CNPP
Chairman
20/10/2016 FGD3 Accountant and offi ce superintendent4 Tax inspector4 CNPP Sanitary and food inspector5 CNPP Ward representatives (Ward no. 13,
14 8) 20/10/2016 FGD
6 CNPP Three Sanitary supervisors of NPP 21/10/2016 KII7 SBCLTF 11 Members of SBCLTF 21/03/2017 FGD
Source: CSE, 2016
Chunar.indd 25 28/09/18 11:50 AM
26
SFD Report
Last Update: 04/05/2018
Produced by: CSEChunar
India
7.3 SFD graphic
Figure 7: SFD Graphic (Source: Graphic generator)
Chunar.indd 26 28/09/18 11:50 AM
27
SFD Report
Last Update: 04/05/2018
Produced by: CSEChunar
India
7.4 SFD brief explanation
Table 12: Percentage of the populati on using each system technology and methodSystem
Type Containment Emptying Transport Treatment and End Use
Onsite
T1A2C6: 60% of population is dependent on septic tank connected to open drain.T2A5C10: 11% of population is dependent on lined pit with semi-permeable walls and open bottom.
Since there is no clear differentiation between % of septage and effl uent, it is assumed to be 50% each. FS not contained is 41%.Since most of the population is getting their systems emptied, it is assumed 90% of population has their onsite sanitation systems emptied. - FS not contained and emptied is comes out to be 32% and FS not contained-not emptied comes out to be 9%
No treatment facility exists hence no FS is transported to treatment plant therefore FS not delivered to treatment plant is 31%.
No treatment facility exists hence no FS is treated; therefore FS treated is 0%.All the FS emptied ends up in local area without any treatment. Sometimes WW fl owing through open drains is used at agriculture fi elds by farmers
Open Defecation
29% of population practice open defecation.
Source: CSE, 2016
Chunar.indd 27 28/09/18 11:50 AM
28
SFD Report
Last Update: 04/05/2018
Produced by: CSEChunar
India
7.5 Context-adapted SFD graphic
Figure 8: Context adapted SFD Graphic (Source: CSE)
Chunar.indd 28 28/09/18 11:50 AM
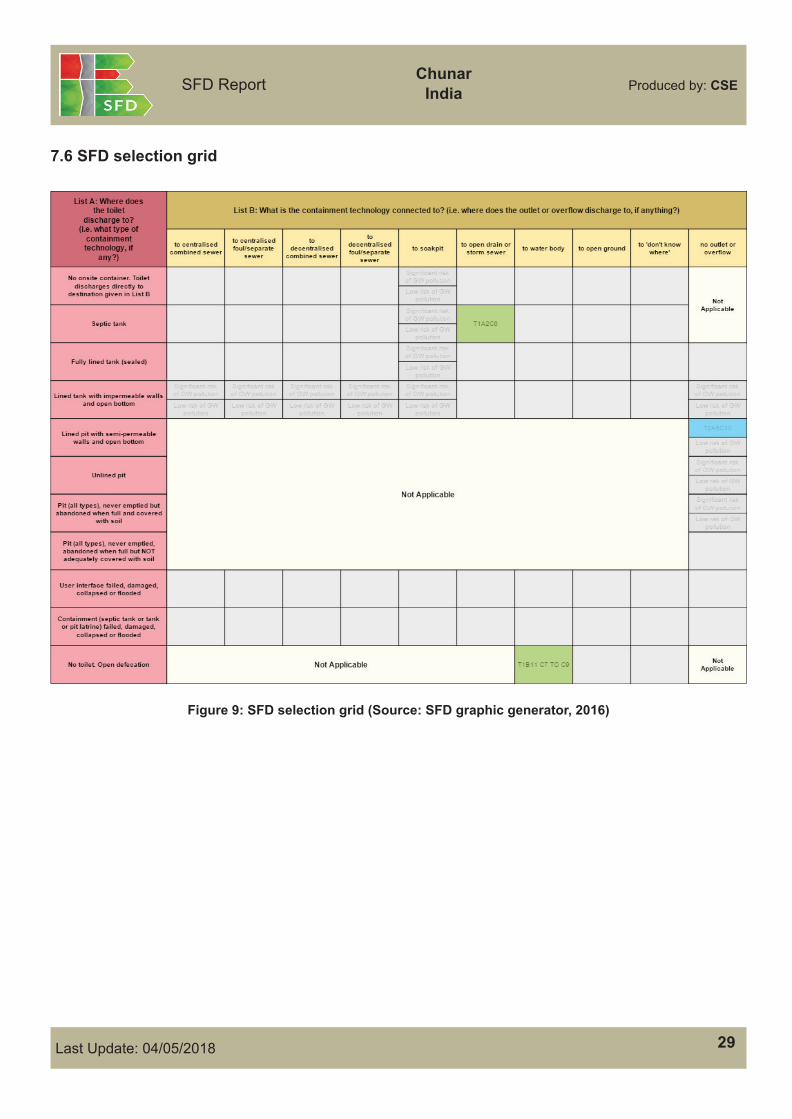
29
SFD Report
Last Update: 04/05/2018
Produced by: CSEChunar
India
7.6 SFD selection grid
Figure 9: SFD selection grid (Source: SFD graphic generator, 2016)
Chunar.indd 29 28/09/18 11:50 AM
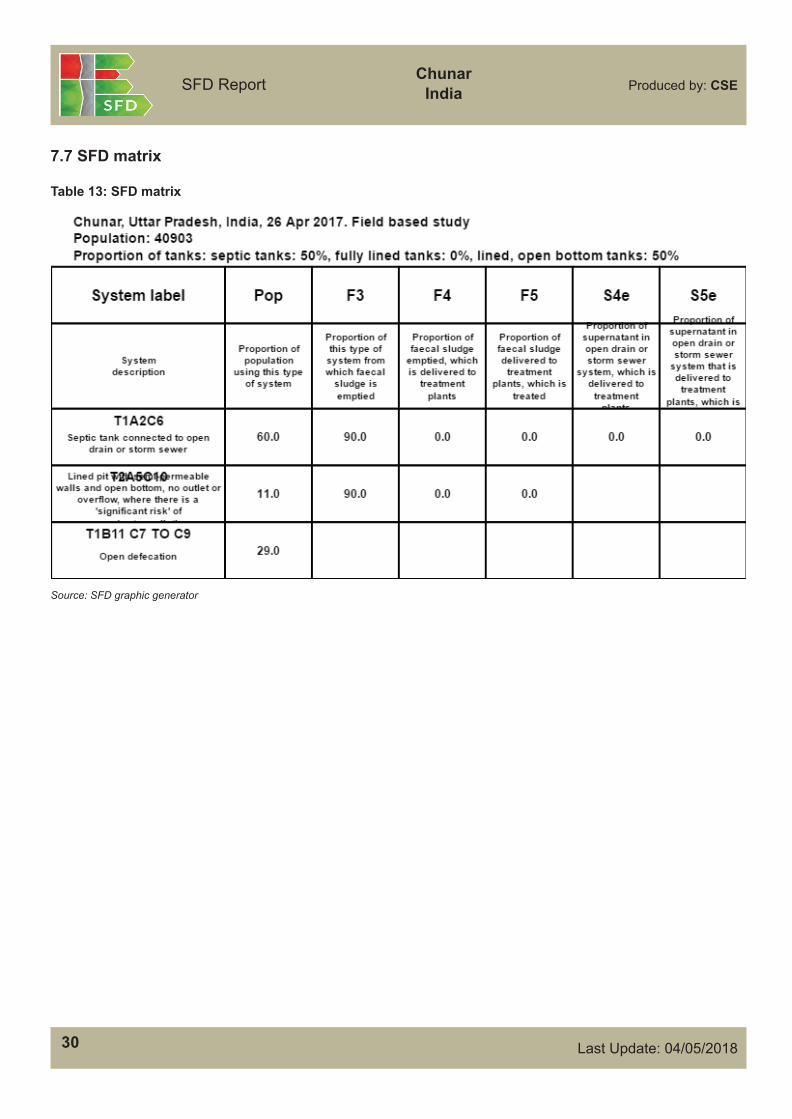
30
SFD Report
Last Update: 04/05/2018
Produced by: CSEChunar
India
7.7 SFD matrix
Table 13: SFD matrix
Source: SFD graphic generator
Chunar.indd 30 28/09/18 11:50 AM
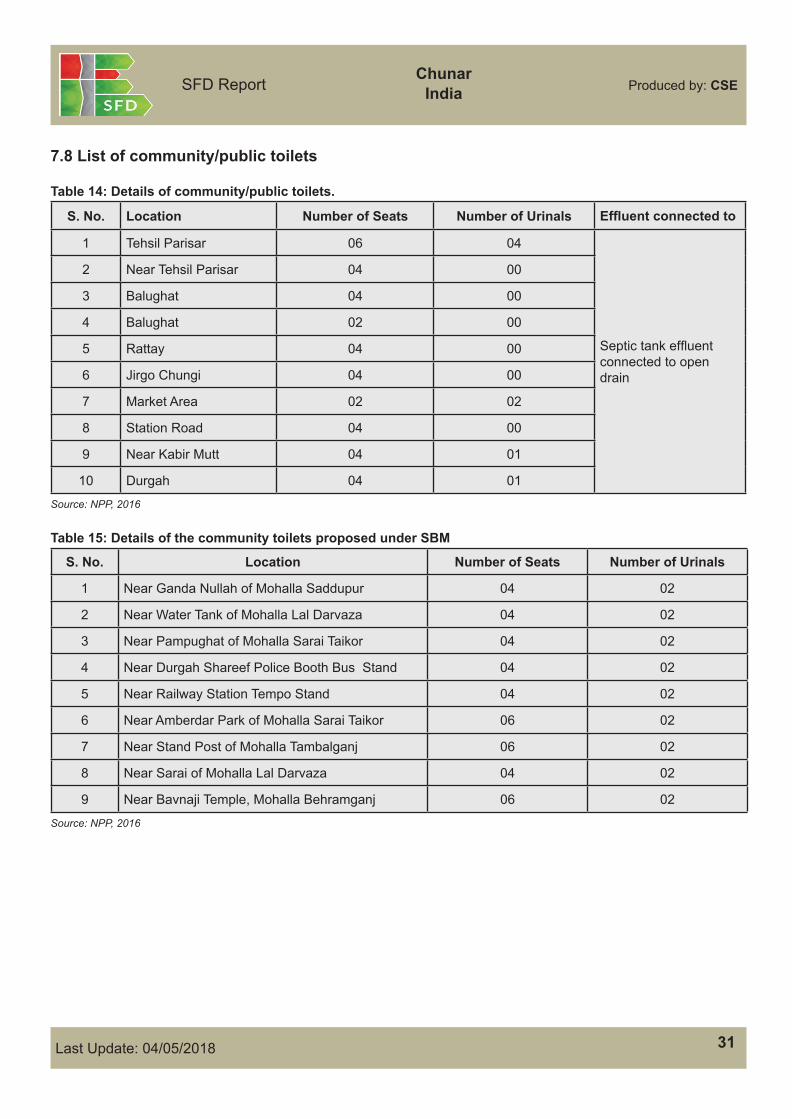
31
SFD Report
Last Update: 04/05/2018
Produced by: CSEChunar
India
7.8 List of community/public toilets
Table 14: Details of community/public toilets.
S. No. Location Number of Seats Number of Urinals Effl uent connected to
1 Tehsil Parisar 06 04
Septic tank effl uent connected to open drain
2 Near Tehsil Parisar 04 00
3 Balughat 04 00
4 Balughat 02 00
5 Rattay 04 00
6 Jirgo Chungi 04 00
7 Market Area 02 02
8 Station Road 04 00
9 Near Kabir Mutt 04 01
10 Durgah 04 01
Source: NPP, 2016
Table 15: Details of the community toilets proposed under SBM
S. No. Location Number of Seats Number of Urinals
1 Near Ganda Nullah of Mohalla Saddupur 04 02
2 Near Water Tank of Mohalla Lal Darvaza 04 02
3 Near Pampughat of Mohalla Sarai Taikor 04 02
4 Near Durgah Shareef Police Booth Bus Stand 04 02
5 Near Railway Station Tempo Stand 04 02
6 Near Amberdar Park of Mohalla Sarai Taikor 06 02
7 Near Stand Post of Mohalla Tambalganj 06 02
8 Near Sarai of Mohalla Lal Darvaza 04 02
9 Near Bavnaji Temple, Mohalla Behramganj 06 02
Source: NPP, 2016
Chunar.indd 31 28/09/18 11:50 AM
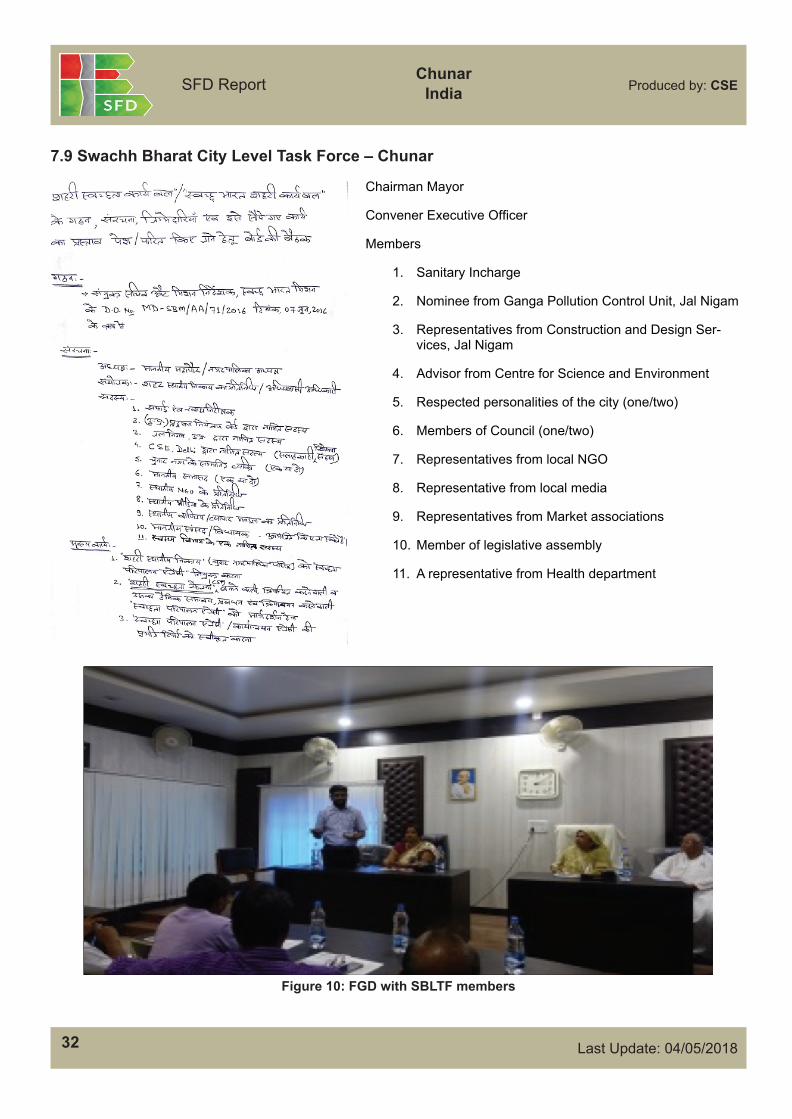
32
SFD Report
Last Update: 04/05/2018
Produced by: CSEChunar
India
7.9 Swachh Bharat City Level Task Force – Chunar
7.9 Photographs from fi eld visit
7.10 Maps of Buxar
1.1 SBCLTF meeting
Chairman Mayor
Convener Executive Offi cer
Members
1. Sanitary Incharge
2. Nominee from Ganga Pollution Control Unit, Jal Nigam
3. Representatives from Construction and Design Ser-vices, Jal Nigam
4. Advisor from Centre for Science and Environment
5. Respected personalities of the city (one/two)
6. Members of Council (one/two)
7. Representatives from local NGO
8. Representative from local media
9. Representatives from Market associations
10. Member of legislative assembly
11. A representative from Health department
Figure 10: FGD with SBLTF members
Chunar.indd 32 28/09/18 11:50 AM
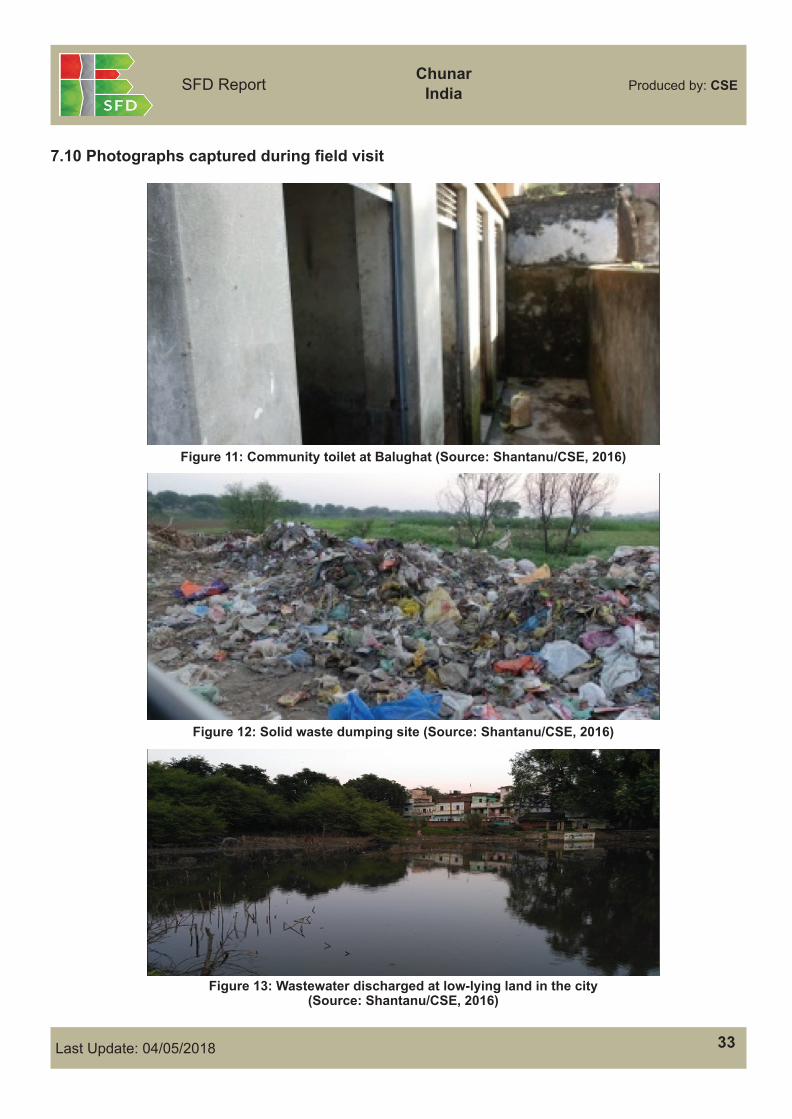
33
SFD Report
Last Update: 04/05/2018
Produced by: CSEChunar
India
7.10 Photographs captured during fi eld visit
Figure 11: Community toilet at Balughat (Source: Shantanu/CSE, 2016)
Figure 12: Solid waste dumping site (Source: Shantanu/CSE, 2016)
Figure 13: Wastewater discharged at low-lying land in the city (Source: Shantanu/CSE, 2016)
Chunar.indd 33 28/09/18 11:50 AM
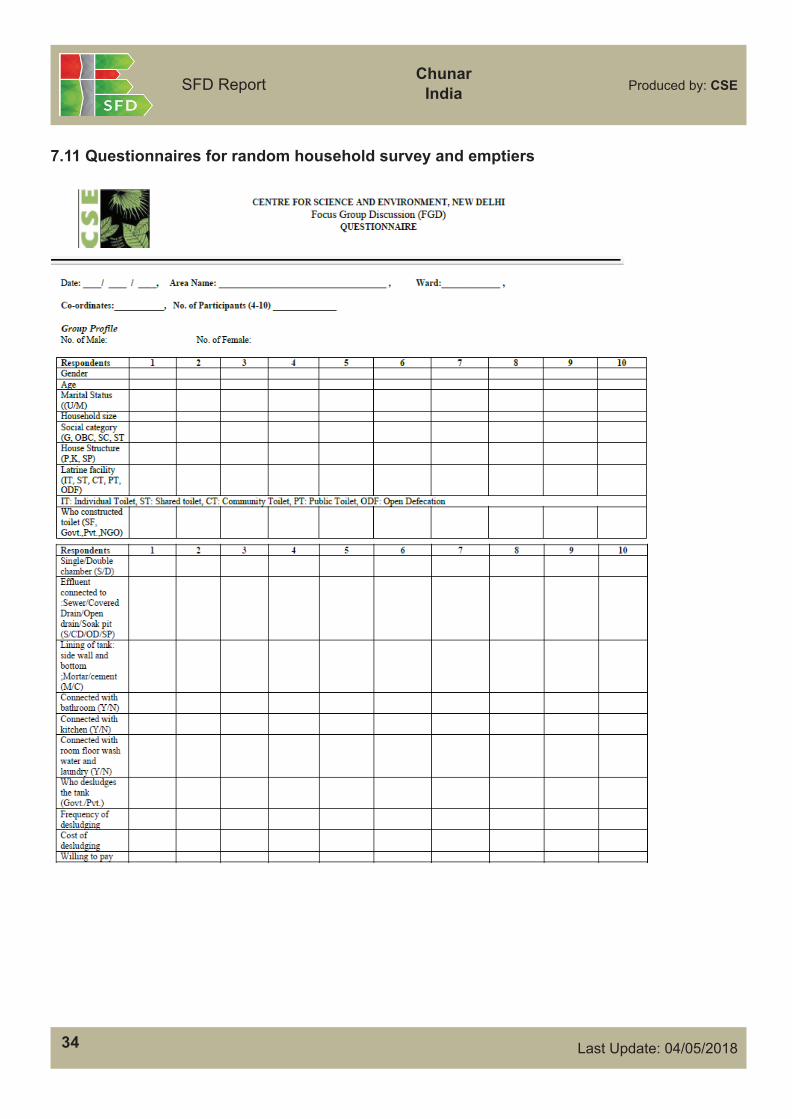
34
SFD Report
Last Update: 04/05/2018
Produced by: CSEChunar
India
7.11 Questionnaires for random household survey and emptiers
Chunar.indd 34 28/09/18 11:50 AM
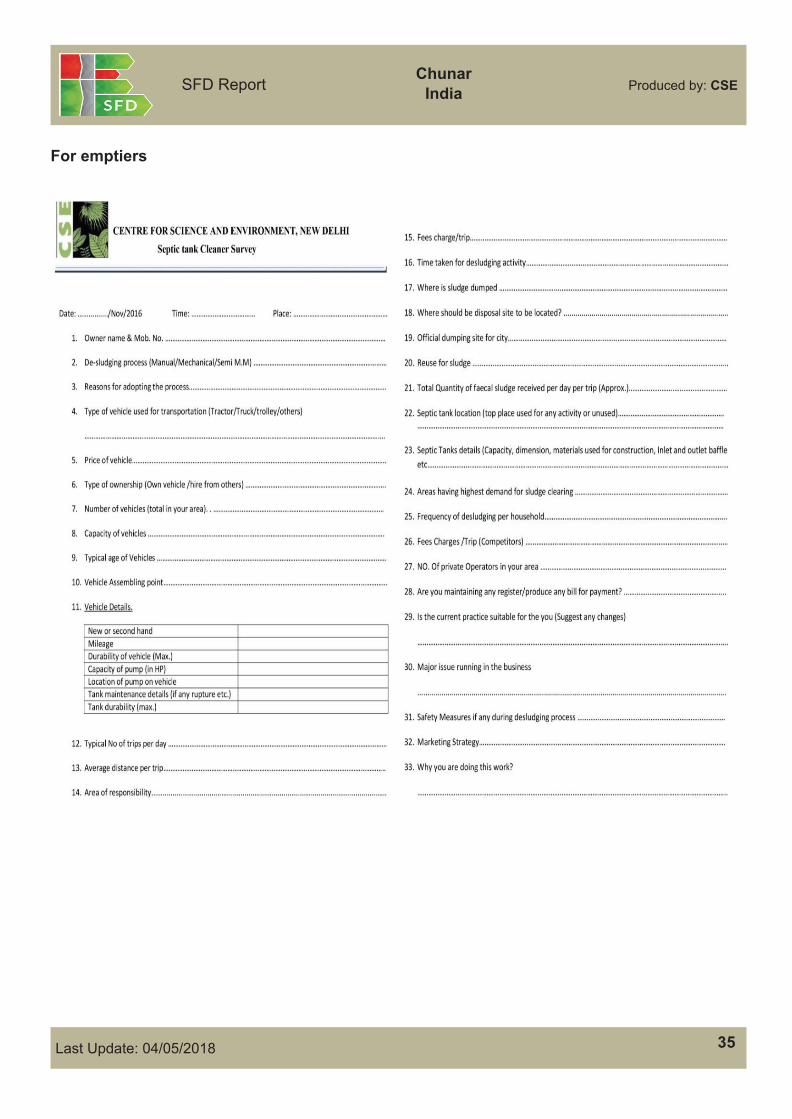
35
SFD Report
Last Update: 04/05/2018
Produced by: CSEChunar
India
For emptiers
Chunar.indd 35 28/09/18 11:50 AM
36
Centre for Science and Environment41, Tughlakabad Institutional Area, New Delhi 110 062Ph: +91-11-40616000 Fax: +91-11-29955879E-mail: [email protected] Website: www.cseindia.org
FOR SFD INFORMATION CONTACT
Chunar.indd 36 28/09/18 11:50 AM