sgbw 1422
DESCRIPTION
SGB Weekly 1422 I June 2, 2014TRANSCRIPT
ISSUE 1422JUNE 2 2014
The Weekly Digital Magazine for the Sporting Goods Industry
BrandStrength
Report2014
Topline
Compiled and presented by The SportsOneSource Consumer Research Group to gauge the strength of sporting goods brands in
the overall US market
BrandStrengthReportcom
2 SGBWeeklycom | JUNE 2 20141
Tefl onreg BrandThe Element of Protection
Products that carry the DuPonttrade Tefl onreg fabric protector brand not only stand up to the environment but can use less energy less natural resources and reduce your carbon footprint
With Tefl onreg fabric protector textiles require less washing and lower wash- and dry-temperatures which extend the life of the clothing and reduce the impact on the environment
Tefl onreg fabric protectormdashnow more sustainable than ever
tefl oncomsgb
Carbon footprint claim based on testing which demonstrates that treated products require lower wash temperatures and 40 less drying time Capstonereg repellents for Tefl onreg fabric protector utilize short-chain molecules that cannot break down to PFOA in the environment Capstonereg repellents meet the goals of the US EPA 201015 PFOA Stewardship Program
Copyright copy 2014 DuPont All rights reserved The DuPont Oval Logo DuPonttrade Capstonereg and Tefl onreg are trademarks or registered trademarks of EI du Pont de Nemours and Company or its affi liates
1
Tefl onreg BrandThe Element of Protection
Products that carry the DuPonttrade Tefl onreg fabric protector brand not only stand up to the environment but can use less energy less natural resources and reduce your carbon footprint
With Tefl onreg fabric protector textiles require less washing and lower wash- and dry-temperatures which extend the life of the clothing and reduce the impact on the environment
Tefl onreg fabric protectormdashnow more sustainable than ever
tefl oncomsgb
Carbon footprint claim based on testing which demonstrates that treated products require lower wash temperatures and 40 less drying time Capstonereg repellents for Tefl onreg fabric protector utilize short-chain molecules that cannot break down to PFOA in the environment Capstonereg repellents meet the goals of the US EPA 201015 PFOA Stewardship Program
Copyright copy 2014 DuPont All rights reserved The DuPont Oval Logo DuPonttrade Capstonereg and Tefl onreg are trademarks or registered trademarks of EI du Pont de Nemours and Company or its affi liates
4 SGBWeeklycom | JUNE 2 2014
INTRODUCINGAIR-CONDITIONEDRECOVERY COMPRESSION
in sleeves socks shorts and shirts
GO FOR IT
100 MADE IN USA
GO FOR ITFind out more8008383906insoles-sorbothanecom
GO FOR ITFind out more8008383906insoles-sorbothanecom
GO FOR ITFind out more8008383906insoles-sorbothanecom
Take the demanding trail - Sorbothanereg Performance Insoles will be with you step after step bull Sorbothanereg Makes The Difference bull Actually cradling the foot in natural comfort bull Sorbothanereg protects the entire body by absorbing up to 947 of impact shock bull Recommended for over 30 yearsSorbothanereg insoles provide comfort and are your best defense against impact related pain and injury
Sorbothane_Hiking-SGB-DigitalAdindd 1 41714 1019 AM
JUNE 2 2014 | SGBWeeklycom 5
INTRODUCINGAIR-CONDITIONEDRECOVERY COMPRESSION
in sleeves socks shorts and shirts
P 382P 021 P 285P 877 100 K
copy2014 Implus Corporation Sof Solereg is a registered trademark of Implus Corporation 214
bull Helps alleviate pain associated with Plantar Fasciitis
bull Fits any shoe type
bull 30-day money-back performance guarantee
Heel cup provides motion control and stability
Gel in heel relieves pain from heel spurs
Plantar Relief Bridge provides sturdy support to painful arches
Durable nylon composite plate
Plantar FasciitisOrthOtic insOle
wwwSofSolecom
Copyright 2014 SportsOneSource LLC All rights reserved The opinions expressed by writers and contributors to SGB WEEKLY are not necessarily those of the editors or publishers SGB WEEKLY is not responsible for unsolicited manuscripts photographs or artwork Articles appearing in SGB WEEKLY may not be reproduced in whole or in part without the express permission of the publisher SGB WEEKLY is published weekly by SportsOneSource LLC 2151 Hawkins Street Suite 200 Charlotte NC 28203 7049873450 Send address changes to SGB WEEKLY 2151 Hawkins Street Suite 200 Charlotte NC 28203 7049873450
Senior Business Editor
Thomas J Ryan
tryansportsonesourcecom
9173754699
Contributing Editors
Scott Boulbol Fernando J Delgado Bill Kendy Charlie Lunan
Editorial amp Creative Director
Teresa Hartford
teresasportsonesourcecom
Senior Graphic Designer
Camila Amortegui
camilasportsonesourcecom
Director Media amp Event Development
Candice L Smith
West Coast and Rockies
candicesportsonesourcecom
6033615762
Advertising Sales Account Managers
Buz Keenan
Northeast
buzsportsonesourcecom
2018875112
Katie ODonohue
SoutheastMidwest
katieosportsonesourcecom
8282443043
Circulation amp Subscriptions
subssportsonesourcecom
Group PublisherEditor In ChiefJames Hartford
jamessportsonesourcecom
3039977302
2151 Hawkins St bull Suite 200 bull Charlotte bull NC bull 28203t 7049873450 bull f 7049873455
SportsOneSourcecom
SportsOneSource Publications
Print Magazines SGB SGB PerformanceDigital Magazine SGB Weekly
Newsletters The BOSS ReportSports Executive Weekly
News Updates SGB SGB Footwear SGB Outdoor SGB Sportsmanrsquos SGB Team Sports
Job Market SOS Research
SportsOneSource ResearchBrand Strength Report OIA VantagePoint
SOS Research SportScanInfo
Career ServicesSportsJobSourcecom
JUNE 2 2014ISSUE 1422
The Weekly Digital Magazine for the Sporting Goods Industry
BrandStrengthTopline Report
2014
Consumers continue to place the greatest importance on quality of product in the active lifestyle market paying more for quality to receive the longer use benefit
The 2014 Brand Strength Report conducted by The SportsOneSource Group measures consumers awareness attitude and intent to purchase active lifestyle product from specific brands with consumers offering their feedback on an expanded brand list
For details on how to order The Brand Strength Report contact Bethany Cooner Director of Market Research The SportsOneSource Group 30399767302 or email BSRSportsOneSourcecom
BrandStrengthReportcom
JUNE 2 2014 | SGBWeeklycom 7
8 SGBWeeklycom | JUNE 2 2014
copy2014 Yupoong and Flexfitreg are registered trademarks of Yupoong Inc
New York 8004244464 California 8669412555 blanksalesflexfitcom flexfitcom
6572
6577CD
6599
Performance Flexfit Styles110CCT 6077 6572 6577CD 6580W 6595 6597 6599
For more styles visit flexfitcom
JUNE 2 2014 | SGBWeeklycom 9
Contact 3039977302 or email SportsJobssportsonesourcecom
FREE ACCESS TO THE LATEST
JOB LISTINGS
REACHING THE MOST CONNECTED BEST INFORMED AND HIGHEST
CALIBER PROFESSIONALS IN THE ACTIVE LIFESTYLE MARKET
THE INTERSECTION OF
CAREER AND LIFESTYLE
A Service of The SportsOneSource Group
10 SGBWeeklycom | JUNE 2 2014
BrandStrength
Reportonsumers in 2014 continue their post-recessionary behavior by placing the greatest importance on quality of product when purchasing footwear
apparel and equipment to support their active lifestyle Quality of product continues to be the highest rated factor influencing consumerrsquos purchase of all three categories Consumers have a strong preference to pay more for quality and receive the benefit of its longer use
Consumers rely on their own personal experience with brands placing greater importance in 2014 on their knowledge and trust of certain brands than they did in 2011 Fewer consumers are influenced by price which continues to drop in importance over time and is surpassed in influence by innovationtechnology in 2014 Consumers want product that enhances their activities allows them to perform better and gives them an edge over the competition or
C their own personal best In the current environment where social media apps such as Strava continue to play an increased role in the way in which an active consumer participates in sporting activities the return to the brands is an increased trust factor from the consumer and the subsequent benefits that go along with it
Nearly half of all active consumers believe a brandrsquos environmental initiatives are important in 2014 which is a substantial rise from 2011 Consumers place a high expectation on the brands that they trust to also be focused on minimizing their environmental impact
For details on how to order the full Brand Strength Reportcontact Bethany Cooner Director of Market Research
The SportsOneSource Group 3039977302 or email BSRSportsOneSourcecom
BrandStrengthReportcom
These observations are highlighted in this yearrsquos Brand Strength Report which summarizes the bi-annual consumer survey conducted by The SportsOneSource Group to measure consumer awareness attitude and intent to purchase active lifestyle product from specific brands The Brand Strength Report was expanded in 2014 to include sports and outdoor equipment and consumers were also asked to offer their feedback on an expanded brand list
The following is a sampling from the complete Brand Strength Report
Topline
JUNE 2 2014 | SGBWeeklycom 11
The centerpiece of the Brand Strength Report is the Brand Strength Index (BSI) a rating system developed more than seven years ago by The SportsOneSource Group to more effectively measure and assess the overall consumer perception of a specific brand Each brand measured was tested across four main criteria and those criteria individually weighted to reflect their importance in the overall indexing formula
Key factors influencing the BSI included awareness both unaided and aided In an effort to measure a brandrsquos mindshare for the consumer the survey respondents were first asked open-ended questions to name five footwear apparel or equipment brands in the sports or outdoor category Respondents were then provided a list of 108 brands and asked about awareness levels for each brand Respondents were then asked if they had purchased these brands and to answer questions about their experiences
The next factor used to formulate the BSI was a respondentrsquos likelihood to purchase a specific brand again in the future For each brand that a respondent mentioned having purchased in the last year the respondent was asked on a scale of 1 to 5 ndashwith 1 representing ldquoDefinitely Would Notrdquo and 5 representing ldquoDefinitely Wouldrdquo ndashhow likely he or she would be to purchase that brand again in the future Brands earned points for positive responses while points were subtracted for negative responses
The attribute with the greatest importance in the BSI formula is a consumerrsquos uncompromising commitment to a brand Respondents were first asked if they would leave a specific retailer if a particular brand were not carried by that retailer The respondents answering ldquoyesrdquo were then asked (unaided) which brands were so important to them that they would leave a retail location if that brand were not available
The above criteria were then combined using The SportsOneSource Grouprsquos proprietary
formula to generate a single BSI for each qualifying brand
In 2014 the studyrsquos methodological approach to gathering awareness and purchase was revised to accommodate
a broader brand list As a result brands cannot be compared directly to their 2011 BSI scores awareness or purchase data However recurring brands can be compared to past year Brand Strength Reports based on their relative position to each other
Brand Strength Index
Nike 775
Adidas 687
ReebokRBK 620
Under Armour 607
New Balance 599
Puma 580
The North Face 567
Columbia 549
Converse 545
Asics 537
Skechers 536
Champion 535
Coleman 519
Jordan 517
Timberland 514
Speedo 512
LL Bean 510
Vans 506
Merrell 495
Dickies 493
Carhartt 491
Brooks 490
Ugg 488
Ray-Ban 487
Swiss Army 487
REI 486
Oakley 486
Danskin 481
Crocs 476
Lululemon 475
Russell Athletic 474
Patagonia 471
Saucony 468
Birkenstock 467
Keds 466
Billabong 463
K-Swiss 463
Roxy 461
Fila 457
Clif Bar 456
Sperry Top-Sider 455
Timex 453
Burton 452
Quiksilver 451
Mizuno 451
Powerbar 448
Smartwool 447
Toms 446
Keen 446
Garmin 444
Brand Index Brand Index
BRAND STRENGTH INDEX - OVERALL TOP 50 BRANDS
Index out of 1000
The Nike brand in 2014 once again ranks first in BSI ratings by a wide margin With a score of 775 (out of 1000) Nike is again nearly 100 points higher than the second highest scoring brand Adidas Nikersquos dominant position continues to reflect overwhelming consumer brand awareness both
aided (95 percent) and unaided (85 percent) With nearly 100 percent awareness among active consumers Nikersquos reign is unlikely to waiver in the near future
Adidasrsquo BSI score of 687 is 88 points lower than Nike With aided awareness at 89 percent Adidas has some catching up to do to achieve similar mindshare of the active consumer
Reebok ranks third on the BSI behind Nike and Adidas Under Armour took the number four position and New Balance rounded out the top five brands in 2014
Columbia moved up into the Top 10 position in 2014 decreasing their gap with The North Face Converse retained its Top 10 position and Asics moved up to join the Top 10 strongest brands among active consumers
Added to the list in 2014 are specific equipment brands that scored high in brand awareness recently as well as private label retail brands that are included for the first time in this expanded report
Notable additions to the Top 50 on the BSI list in 2014 include at number 13 Coleman LL Bean at number 17 Ray-Ban at number 24 and Swiss Army at number 25 Dickies and Carhartt two brands that are ubiquitous in the
workwear market were measured for their appeal as active lifestyle brands Both companies landed in the Top 25 with Dickies coming in at number 20 and Carhartt at number 21
In addition to Coleman Ray-Ban and Swiss Army other non-softline brands to make the Top 50 include Oakley Clif Bar Timex Powerbar and Garmin
12 SGBWeeklycom | JUNE 2 2014
In the Brand Awareness section of the study respondents were asked about their recognition of brand names on two levels - unaided and aided First respondents were asked an open-ended question to identify sports and outdoor brands including footwear apparel and equipment that came to mind to determine the unaided level of awareness The respondents were later asked to select from a randomized list of 108 brands to determine their recognition of each brand The tables below show total awareness which combines both lines of questions
Respondents that mentioned a specific brand in the unaided awareness section of the survey automatically selected those specific brands during the aided portion of the survey
Brand Awareness
Nike 95
Adidas 89
ReebokRBK 81
Puma 78
New Balance 74
Converse 71
Skechers 71
Under Armour 67
Timberland 63
LL Bean 63
Champion 62
The North Face 62
Speedo 61
Crocs 57
K-Swiss 56
Columbia 56
Ray-Ban 56
Dickies 55
Swiss Army 55
Keds 54
Asics 51
Vans 51
Fila 51
Ugg 51
Oakley 48
BRAND AWARENESS - OVERALL TOP 50 BRANDS
Jordan 48
Coleman 48
Danskin 46
Timex 45
Jansport 44
Russell Athletic 41
Stride Rite 40
Garmin 38
Birkenstock 38
Quiksilver 36
Toms 36
Carhartt 36
Powerbar 36
REI 35
Airwalk 35
Clif Bar 34
Ocean Pacific (OP) 34
Billabong 34
Igloo 34
Avia 34
Saucony 34
Hurley 33
Body Glove 31
Wolverine 30
DC Shoes 29
Brand Percentage Brand Percentage
MOST RECOGNIZED BRAND NAMES
Nike 93
Adidas 87
ReebokRBK 76
Puma 74
New Balance 68
Under Armour 64
Converse 64
Skechers 61
Timberland 60
LL Bean 57
Champion 56
The North Face 56
Speedo 54
K-Swiss 54
Ray-Ban 53
Swiss Army 53
Dickies 52
Columbia 51
Asics 49
Fila 48
Oakley 47
Russell Athletic 47
Coleman 47
Crocs 47
Jordan 45
Nike 97
Adidas 91
ReebokRBK 85
Puma 83
Skechers 79
New Balance 79
Converse 76
Under Armour 70
LL Bean 69
Champion 67
The North Face 67
Speedo 66
Crocs 66
Timberland 66
Keds 65
Ugg 64
Danskin 61
Columbia 60
Vans 59
K-Swiss 58
Ray-Ban 58
Dickies 58
Swiss Army 57
Asics 54
Fila 54
Brand Percentage Brand Percentage
FEMALEMALE
BRAND AWARENESS - BY GENDER
Note The Full Report Core Report Young Consumer Report Outdoor BSR and Sportsmanrsquos BSR (all versions of the Brand Strength Report) provide Brand Awareness levels by specific demographic segments For details contact Bethany Cooner
Director of Market Research The SportsOneSource Group 3039977302 or email BSRSportsOneSourcecom
Not surprisingly Nike leads in overall Brand Awareness followed by Adidas Reebok Puma and New Balance The top five brands in overall awareness have not changed since 2011 though Puma and New Balance have switched positions
For female active consumers New Balance shares the number five spot in Brand Awareness with Skechers with both registering Brand Awareness at 79 percent
Based on a preliminary review of the Brand Awareness data female consumers are far more aware of the brands in the active lifestyle market than men The variance for an individual brand is four to 12 percentage points higher for females than for men for the Top 12 brands For Crocs the Brand Awareness is 20 percentage points higher for females
Only four brands - Oakley Russell Coleman and Jordan - made the male Top 25 in Brand Awareness that were not included in the female Top 25 chart
JUNE 2 2014 | SGBWeeklycom 13
Nike dominates as the top purchased brand in the past year of all surveyed brands Almost half of all active lifestyle consumer re-spondents purchased Nike in the past year a full 24 points higher than second-highest brand Adidas Under Armour jumped from tenth position in 2011 to third in 2014 The North Face also rises landing in the Top 10 in 2014 Female active consumers rank Skech-ers in their top five brands purchased in the past year and 15 percent of females purchased The North Face in the past year
Only Nike and Under Armour share the same purchase percentage for both male and female respondents in the Top 10 purchased brands Female respondents were twice as likely as males to have purchased Skechers in the past year Other Top 25 brands that were more likely to be purchased by females in the past year include
The North Face Vans and Converse Toms Keds Roxy REI and Ugg were rated in the Top 25 by females but not by males
Another key metric recorded in the 2014 Brand Strength Report was conversion rate or the percentage of respondents that said they were aware of the brand and purchased the brand in the past year
Driving awareness through strong messaging using advertising and promotion is key but converting those newly aware consumers into purchasers is the catch to long-term success
Under Armour continues to have an extremely high conversion rate as noted in the Brand Strength Report in 2011 Thirty-three percent of those aware of Under Armour purchased the brand in the past year With awareness rising to levels that has put Under Armour in the Top 10 for the active consumer in 2014 coupled with a con-tinuing strong conversion rate the brand has exponentially increased its overall strength as forecasted in the 2011 Brand Strength Report
Brand Purchasing
Nike 49
Adidas 25
Under Armour 22
New Balance 20
Skechers 14
ReebokRBK 14
The North Face 13
Champion 13
Converse 12
Puma 12
Columbia 12
Asics 9
LL Bean 9
Vans 9
Timberland 8
Clif Bar 8
Jordan 7
Danskin 6
Coleman 6
Ugg 6
Dickies 6
Carhartt 6
Ray-Ban 6
Fila 6
Powerbar 6
Brand Percentage
BRAND PURCHASING - OVERALL TOP 50 BRANDS
Toms 5
Crocs 5
REI 5
Russell Athletic 5
Oakley 4
Keds 4
Swiss Army 4
Speedo 4
Sperry Top-Sider 4
Garmin 4
Roxy 4
Saucony 4
K-Swiss 4
Timex 4
DC Shoes 4
Hurley 4
Quiksilver 4
Jansport 4
Merrell 4
Lululemon 3
Starter 3
Life is good 3
Igloo 3
Avia 3
Billabong 3
Brand Percentage
Nike 49
Adidas 28
Under Armour 22
New Balance 20
ReebokRBK 16
Puma 13
Champion 13
Columbia 12
Timberland 11
The North Face 11
Converse 10
Skechers 9
LL Bean 9
Asics 9
Jordan 9
Clif Bar 8
Coleman 8
Dickies 8
Powerbar 7
Vans 7
Carhartt 7
Ray-Ban 7
Russell Athletic 7
Fila 7
Oakley 6
BRAND PURCHASING - BY GENDER
Nike 49
Adidas 22
Under Armour 22
New Balance 19
Skechers 18
The North Face 15
Converse 14
Champion 13
ReebokRBK 12
Columbia 11
Puma 11
Danskin 11
Vans 10
Asics 10
Ugg 9
LL Bean 9
Clif Bar 8
Toms 7
Crocs 6
Jordan 6
Timberland 6
Keds 6
Roxy 5
Carhartt 5
REI 5
Brand Percentage Brand Percentage
FEMALEMALE
14 SGBWeeklycom | JUNE 2 2014
Brand Strength Report survey respondents were asked to rate a list of footwear purchase factors on a scale of 1-to-10 to identify how each factor influenced their footwear purchase Some of the most influential factors from the survey are as follows
raquo ldquoProduct Qualityrdquo rated as the most influential factor with an average of 89 driven by 92 percent of respondents rating it as at least somewhat important This rating mirrors the active consumerrsquos mindset in 2011 because consumers prefer to pay more for a product of higher quality with the perceived benefit of both value and longer use
raquo ldquoValue for the Pricerdquo was again rated as the second most influential factor with an average rating of 85
raquo ldquoPast Experience with Brandrdquo moves up to third most influential position with an average rating of 81 and almost half of all active consumers citing it extremely important This shows the importance consumerrsquos place on their own knowledge and commitment to specific brands and their preference to spend more money less frequently for higher quality products from trusted brands
raquo Supporting this trend is that ldquoLow Pricerdquo drops again in 2014 ranking sixth in importance to consumers with just 65 percent citing it somewhat important in 2014 compared to 68 percent in 2011 and 71 percent in 2010
Inf luences On Footwear Purchases
1613
2313
2913
3413
3413
4713
4813
5813
7013
1313
2413
3213
3113
3313
3213
3513
3113
2213
1513
2613
2313
2213
2213
1413
1313
913
613
1213
1213
813
813
613
4313
1513
813
513
513
013 1013 2013 3013 4013 5013 6013 7013 8013 9013 10013
AthleteCelebrity13 Sponsorship13
Environmental13 IniBaBves13
Brand13 Name13
Low13 Price13
InnovaBonTechnology13
StyleFashionFit13
Past13 Experience13 with13 Brand13
Value13 for13 the13 Price13
Product13 Quality13
INFLUENCES13 ON13 FOOTWEAR13 PURCHASES13 -shy‐13 OVERALL13
Extremely13 Important13 Somewhat13 Important13 Neutral13 Somewhat13 Unimportant13 Not13 At13 All13 Important13
INFLUENCES ON FOOTWEAR PURCHASES - OVERALL
raquo ldquoInnovationTechnologyrdquo surpassed ldquoLow Pricerdquo in 2014 Active consumers want to take advantage of advancements in footwear and the perceived benefit of improved personal performance outweighs the cost savings
raquo The 2014 study also shows an increase in the influence of ldquoEnvironmental Initiativesrdquo with nearly half of all active consumers rating it at least somewhat important and earning an average of 60 By comparison in 2011 only 38 percent of active consumers rated ldquoEnvironmental Initiativesrdquo as at least somewhat important earning an average of 55
raquo In 2011 just 19 percent of active consumers rated ldquoAthleteCelebrity Sponsorshiprdquo as at least somewhat important earning an average of 36 In 2014 ldquoAthleteCelebrity Sponsorshiprdquo is rated at least somewhat important by 29 percent of active consumers earning an average of 43 As brands focus on fewer but more visible and credible endorsers to promote their products will this factor of influence on footwear purchase continue to grow
JUNE 2 2014 | SGBWeeklycom 15
16 SGBWeeklycom | JUNE 2 2014
7313
7213
7213
7213
7613
7113
7813
8213
8313
8813
2213
2213
2313
2413
2013
2713
1713
1413
1413
1113
613
513
413
213
413
413
513
113
013 1013 2013 3013 4013 5013 6013 7013 8013 9013 10013
Wolverine13
Under13 Armour13
Nike13
Keen13
Timberland13
The13 North13 Face13
Jordan13
LL13 Bean13
Birkenstock13
Merrell13
FOOTWEAR13 RATINGS13 BY13 ATTRIBUTE13 -shy‐13 PRODUCT13 QUALITY13
Extremely13 PosiNve13 Somewhat13 PosiNve13 Neutral13 Somewhat13 NegaNve13 Extremely13 NegaNve13
For each brand of footwear that the Brand Strength Report survey respondents said they purchased in the past year they were asked to rate each brand on six attributes on a scale of 1-to-10 Categories included ldquoValue for the Pricerdquo ldquoProduct Qualityrdquo ldquoStyleFashionFitrdquo ldquoPast Experience with Brandrdquo ldquoInnovative Technologyrdquo and ldquoEnvironmental Initiativesrdquo To qualify for each of these ratings the brands had to receive a minimum number of responses
The Footwear Ratings By Attribute ndash Product Quality graph shows the Top 10 rated brands for ldquoProduct Qualityrdquo The Brand Strength Report Full Report and Core Report include the Top 20 brands for each attribute in addition to the Top 10 rated brands for ldquoProduct Qualityrdquo
Merrell Jordan The North Face Timberland Keen Nike and Under Armour all return in 2014 in the Top 10 footwear brands rated by ldquoProduct Qualityrdquo Birkenstock LL Bean and Wolverine join the list for 2014
Merrell ranks highest in 2014 for ldquoProduct Qualityrdquo among footwear brands with an average ranking of 95 A full 88 percent of active consumers who purchased Merrell footwear in the past year rated the brandrsquos footwear extremely positive for ldquoProduct Qualityrdquo
Footwear Ratings By Attribute
FOOTWEAR RATINGS BY ATTRIBUTE - PRODUCT QUALITY
JUNE 2 2014 | SGBWeeklycom 17
Because purchase decisions vary when deciding on footwear apparel or equipment the questions about purchasing were asked separately for each category For the 2014 Brand Strength Report respondents were asked to rate the same list of factors using a scale of 1-to-10 on the influence of each factor when purchasing apparel
raquo The responses for footwear and apparel are fairly similar with ldquoProduct Qualityrdquo ranking as the most influential for both While ldquoProduct Qualityrdquo continues to rank as the highest influence on active consumerrsquos apparel purchases in 2014 the overall mean score declined from 89 in 2011 to 87 in 2014 Sixty-six percent of active consumers rate the attribute extremely important compared to 70 percent in 2011
raquo ldquoEnvironmental Initiativesrdquo shows an increase in apparel influence as it does in footwear compared to 2011 With 48 percent of active consumers rating it at least somewhat important ldquoEnvironmental Initiativesrdquo earns an average ranking of 60 in 2014 compared to 55 in 2011
raquo ldquoAthleteCelebrity Sponsorshiprdquo continues to rank last for influence on apparel purchases but earns an average ranking of 44 in 2014 compared to 36 in 2011 Thirty-one percent of active consumers rate ldquoAthleteCelebrity Sponsorshiprdquo at least somewhat important in 2014 compared to 21 percent in 2011
Inf luences On Apparel Purchases
1713
2413
2913
3313
3813
4513
5013
5913
6613
1413
2413
3113
3213
3213
3413
3213
3013
2513
1513
2513
2213
2213
1913
1513
1313
913
713
1113
1113
813
613
613
4313
1613
913
613
513
013 1013 2013 3013 4013 5013 6013 7013 8013 9013 10013
AthleteCelebrity13 Sponsorship13
Environmental13 IniBaBves13
Brand13 Name13
InnovaBonTechnology13
Low13 Price13
Past13 Experience13 with13 Brand13
StyleFashionFit13
Value13 for13 the13 Price13
Product13 Quality13
INFLUENCES13 ON13 APPAREL13 PURCHASES13 -shy‐13 OVERALL13
Extremely13 Important13 Somewhat13 Important13 Neutral13 Somewhat13 Unimportant13 Not13 At13 All13 Important13
INFLUENCES ON APPAREL PURCHASES - OVERALL
5613
7013
7513
7313
6713
8413
6313
6713
5813
8013
4413
2913
2213
2313
2413
1113
3013
2813
3813
1613
013
113
313
413
713
313
613
313
413
413
013 1013 2013 3013 4013 5013 6013 7013 8013 9013 10013
Under13 Armour13
Timberland13
Columbia13
LL13 Bean13
Oakley13
The13 North13 Face13
Smartwool13
Jordan13
Patagonia13
CarharL13
APPAREL13 RATINGS13 BY13 ATTRIBUTE13 -shy‐13 PRODUCT13 QUALITY13
Extremely13 PosiPve13 Somewhat13 PosiPve13 Neutral13 Somewhat13 NegaPve13 Extremely13 NegaPve13
Jordan The North Face Columbia Timberland and Under Armour return in 2014 as Top 10 apparel brands rated by ldquoProduct Qualityrdquo Carhartt Patagonia Smartwool Oakley and LL Bean join the Top 10 apparel brands for 2014 Carhartt is the highest rated brand in 2014 with 80 percent of respondents rating the brandrsquos apparel extremely positive for ldquoProduct Qualityrdquo
Apparel Ratings By Attribute
APPAREL RATINGS BY ATTRIBUTE - PRODUCT QUALITY
18 SGBWeeklycom | JUNE 2 2014
1913
2613
3013
3613
3913
4213
4413
5813
6513
1413
2413
3113
3013
3113
3213
3313
2813
2313
1513
2413
2313
2113
1913
1813
1713
1013
913
1013
1013
713
613
513
4313
1613
913
713
513
013 1013 2013 3013 4013 5013 6013 7013 8013 9013 10013
AthleteCelebrity13 Sponsorship13
Environmental13 IniBaBves13
Brand13 Name13
StyleFashionFit13
Low13 Price13
InnovaBonTechnology13
Past13 Experience13 with13 Brand13
Value13 for13 the13 Price13
Product13 Quality13
INFLUENCES13 ON13 EQUIPMENT13 PURCHASES13 -shy‐13 OVERALL13
Extremely13 Important13 Somewhat13 Important13 Neutral13 Somewhat13 Unimportant13 Not13 At13 All13 Important13
INFLUENCES ON EQUIPMENT PURCHASES - OVERALL
New in 2014 the survey asked respondents to rank the same list of factors on a scale of 1-to-10 on the influence of each factor when purchasing equipment Similar to footwear and apparel ldquoProduct Qualityrdquo and ldquoValue For The Pricerdquo are the highest ranking factors influencing purchase of equipment
ldquoInnovationTechnologyrdquo ranks fourth on equipment purchase among active consumers earning an average of 76 with over 4-in-10 rating it extremely important ldquoPast Experience With Brandrdquo ranks third highlighting the importance trust in a brand is on high dollar product
Inf luences On Equipment Purchases
JUNE 2 2014 | SGBWeeklycom 19
20 SGBWeeklycom | JUNE 2 2014
6913
7313
6813
7213
6913
7413
7413
7513
7813
7413
2113
2013
2713
2313
2813
2313
2213
2213
1813
2113
1013
613
513
213
413
413
313
413
013 1013 2013 3013 4013 5013 6013 7013 8013 9013 10013
Swiss13 Army13
LL13 Bean13
Garmin13
Ray-shy‐Ban13
Coleman13
The13 North13 Face13
Under13 Armour13
Nike13
adidas13
Timex13
EQUIPMENT13 RATINGS13 BY13 ATTRIBUTE13 -shy‐13 PRODUCT13 QUALITY13
Extremely13 PosiNve13 Somewhat13 PosiNve13 Neutral13 Somewhat13 NegaNve13 Extremely13 NegaNve13
EQUIPMENT RATINGS BY ATTRIBUTE - PRODUCT QUALITY
Timex is the highest rated brand for product quality in 2014 with 74 percent of respondents rating the brandrsquos equipment extremely positive for ldquoProduct Qualityrdquo
Adidas Nike Under Armour and The North Face join Timex as the top five equipment brands with over 70 percent of respondents ranking them extremely positive for ldquoProduct Qualityrdquo in 2014 Coleman Ray-Ban Garmin LL Bean and Swiss Army round out the Top 10 in 2014
Equipment Ratings By Attribute
For the final and most heavily weighted component of the BSI respondents were first asked if there were specific brands which would cause them to shop somewhere else if those brands were unavailable The respondents who answered lsquoYesrsquo were directed to a follow-up question asking which brands would prompt that response Those brands were determined to be ldquonon-negotiable brandsrdquo in the eyes of that consumer If a consumer leaves a store because that store doesnrsquot carry the brand they want the Brand Strength Report shows that as a leading indicator of brand value
Nike was the most non-negotiable brand with 20 percent of active consumers citing it Adidas moves up from fourth position in 2011 to second position in 2014 supplanting New Balance and leap-frogging Reebok Under Armour and Puma also rise substantially ranking in the Top 10 in 2014
Puma ranks in the top five non-negotiable brands among male active consumers while Skechers ranks in the top five for female active consumers however Skechers has fallen from second position among females in 2011 (at the height of impact of the Shape-Ups product) to fifth in 2014
Nike 20
Adidas 7
New Balance 4
Puma 2
Under Armour 2
ReebokRBK 2
Jordan 2
Asics 1
The North Face 1
Timberland 1
Brand Percentage
MALE FEMALE
NON-NEGOTIABLE BRANDS - BY GENDER
Nike 20
Adidas 5
Under Armour 4
New Balance 4
Skechers 4
ReebokRBK 2
Vans 2
The North Face 2
Jordan 2
Converse 2
Brand Percentage
Nike 20
Adidas 6
New Balance 4
Under Armour 3
Skechers 2
ReebokRBK 2
Puma 2
Jordan 2
The North Face 2
Vans 2
Brand Percentage
NON-NEGOTIABLE BRANDS - OVERALL
Non-Negotiable Brands
JUNE 2 2014 | SGBWeeklycom 21
Methodology
The Brand Strength Report compiled and presented by The SportsOneSource Group consumer research team was designed to gauge the strength of sporting goods brands in the overall US market Respondents were asked a variety of questions relating to brand perception and individual products pertaining to their sporting goodsrsquo purchases in the twelve months preceding the study which took place in March and April 2014
The 2014 Brand Strength Report focuses primarily on Footwear Apparel and Equipment brands across various segments of the sporting goods market including Outdoors and Sportsmanrsquos categories
To qualify for the Brand Strength Report each respondent must have purchased athletic footwear or apparel in the past year A total of 4201 responses were received providing detailed information on awareness levels purchasing trends and brand allegiance to more than 300 Athletic Outdoor and Sportsmanrsquos brands
The Brand Strength Report includes the responses from consumerrsquos age 13 and older all of who were surveyed through a third-party Internet panel provider The SportsOneSource Group made every effort to control the demographics to best represent the US population however as is the case with all Internet-based surveys the demographics and psychographics tend to skew toward older more affluent households
The results of the survey can be projected to the US population with a margin of error of +- 134 percent
Survey respondents were asked a series of questions to determine the strength of each brand The factors that were used to build the index are listed in order of importance
1 Non-Negotiable Brands2 Likelihood To Repurchase (on a scale of 1-to-5 with 1 meaning would not and 5 meaning definitely would)3 Unaided Awareness4 Aided Awareness
To qualify for the BSI a brand had to be purchased by a minimum number of respondents so that each answer did not over-represent the perceptions of the total population
FORMULATING THE BRAND STRENGTH INDEX
Gender
Male 50
Female 50
Mean Age 396
Age
13-17 10
18-34 37
35-54 33
55 and Older 20
Race
Non-Hispanic White 73
African-American 10
Hispanic 9
Asian 6
American Indian 1
Other 1
Marital Status
Married 64
Single 25
SeparatedDivorced 8
WidowedWidower 2
Prefer Not to Answer 1
KEY DEMOGRAPHICS
Employment Status
Full-time 52
Part-time 11
Self Employed 6
Unemployed 5
Retired 13
Student 4
Homemaker 9
Prefer Not to Answer 1
Household Income
Less than $40K 21
$40 - $60K 19
$60 - $80K 19
$80 - $100K 14
$100 - $149K 17
$150K+ 7
Prefer Not to Answer 4
US Region
Northeast 21
Midwest 24
South 32
West 23
22 SGBWeeklycom | JUNE 2 2014
JUNE 2 2014 | SGBWeeklycom 23
ldquoA brand for a company is like a reputation for a person You earn
reputation by trying to do hard things wellrdquo - JEFF BEZOS
BrandStrength
ReportComprehensive Nationwide Survey Brand Strength Index ListingIn-Depth Consumer Behavior Analysis Detailed Individual Brand Analysis Customizable Format
For inquiries or to customize your personal report contact Bethany Cooner Director Market Research
The SportsOneSource Group 3039977302 or BSRSportsOneSourcecom
BrandStrengthReportcom
2014
Pre-Order Your Copy
Today
TR
AD
E A
SS
OC
IAT
ION
S |
BU
YIN
G G
RO
UP
S
JUNE
11-12 Altanta Shoe Market Atlanta GA
17-19 Licensing International Expo Las Vegas NV
26-28 Sports Inc Summer Team Dealer Show Nashville TN
JULY
8-11 NBS Summer Market Austin TX
10-13 European Outdoor Trade Fair Friedrichshafen Germany
15-17 ASI Chicago Chicago IL
18-20 ADA Spring Show Reno Nevada
AUGUST
6-9 Outdoor Retailer Summer Market Salt Lake City UT
14-16 Sports Inc Outdoor Show Nashville TN
24 Tennis Industry Association The Tennis Show New York NY
SEPTEMBER
3-8 NBS Fall Semi - Annual Market Fort Worth Texas
4-6 Imprinted Sportswear Show (ISS) Orlando FL
10-12 Interbike International Trade Expo Las Vegas NV
16-17 SFIA Industry Leaders Summit Chicago IL
OCTOBER
7-9 OIA Rendezvous Asheville North Carolina
NOVEMBER
3-5 NBS Fall Athletic Market Ft Worth TX
15-16 ADA Fall Show Palm Springs California
23-25 Sports Inc Fall Team Dealer Show Las Vegas NV
Athletic Dealers of America1395 Highland AvenueMelbourne FL 32935t 3212540091f 3212427419athleticdealersofamericacom
National Shooting Sports FoundationFlintlock Ridge Office Center11 Mile Hill RoadNewtown CT 06470t 2034261320 f 2034261087nssforg
National Sporting Goods Association1601 Feehanville Drive Suite 300Mount Prospect IL 60056t 8472966742f 8473919827nsgaorg
Nationrsquos Best Sports4216 Hahn BlvdFt Worth TX 76117t 8177880034f 8177888542nbscom
Outdoor Industry Association4909 Pearl East Circle Suite 300Boulder CO 80301t 3034443353f 3034443284outdoorindustryorg
Sports amp Fitness Industry Association8505 Fenton St Suite 211Silver Spring MD 20910t 3014956321f 3014956322sfiaorg
Snow Sports Industries America8377-B Greensboro DriveMcLean VA 22102t 7035569020f 7038218276snowsportsorg
Sports Inc333 2nd Avenue NorthLewistown MT 59457t 4065383496f 4065382801sportsinccom
Sports Specialists Ltd590 Fishers Station Drive Suite 110Victor NY 14564t 5857421010f 5857422645sportsspecialistsltdcom
Team Athletic Goods629 Cepi DriveChesterfield MO 63005t 6365303710f 6365303711tag1com
Tennis Industry Association1 Corpus Christi Place Suite 117Hilton Head Island SC 29928t 8436863036f 8436863078tennisIndustryorg
Worldwide 8211 South 194thKent WA 98032t 2538728746f 2538727603wdi-wdicom
CALENDAR For full year calendar go to sportsonesourcecomeventsa
24 SGBWeeklycom | JUNE 2 2014
Access the weekly sales landscape of the outdoor industry and be outfitted with data to guide your companyrsquos strategic decisions with OIA VantagePointtrade The only weekly retail point-of-sale reporting platform exclusively for the active outdoor lifestyle industry We swiftly deliver critical trend and detailed business data to brands and retailers
START SEEING CLEARLY
SHARPEN YOUR PERSPECTIVE
OIAVantagePointcom bull oiavantagepointsportsonesourcecom bull 3039977302
SportScanInfocomA Service of The SportsOneSource Group
ACHIEVE YOUR GOALS
SportScanInfo is the only weekly retail sales
trend reporting solution for the active lifestyle market
3039977302SportScanSportsOneSourcecom
BREADTH OF DATA DEPTH OF DATA TIMELINESS OF DATA
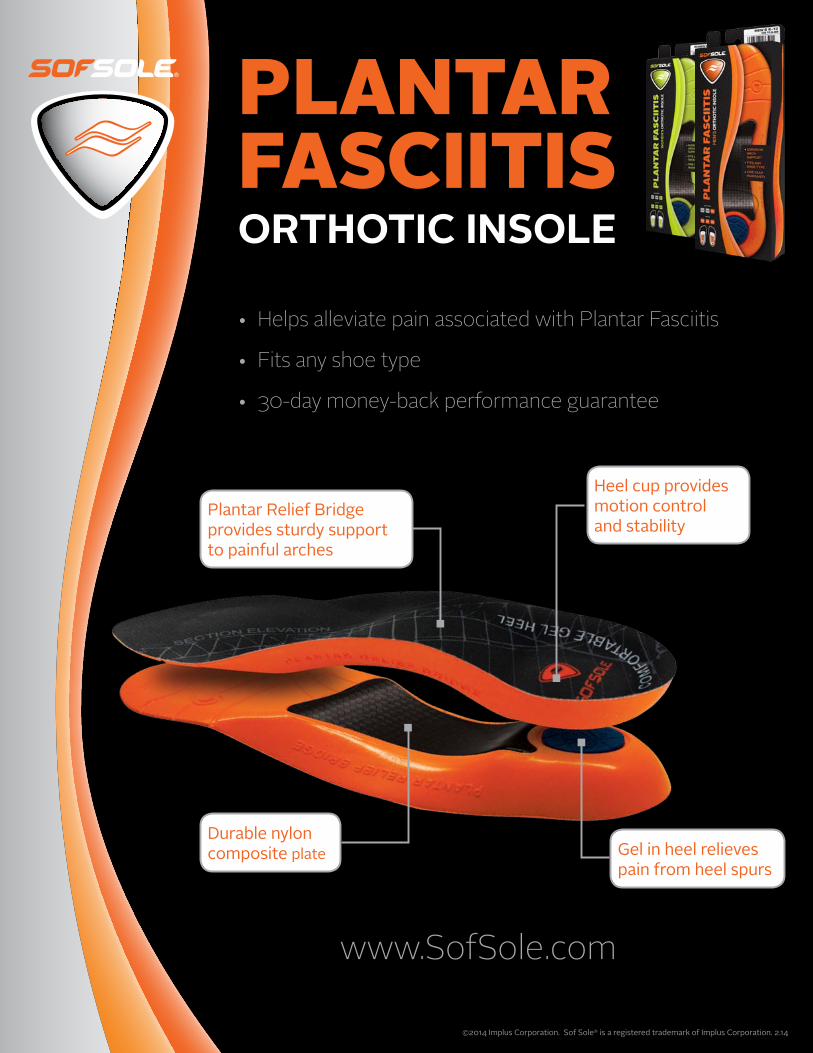
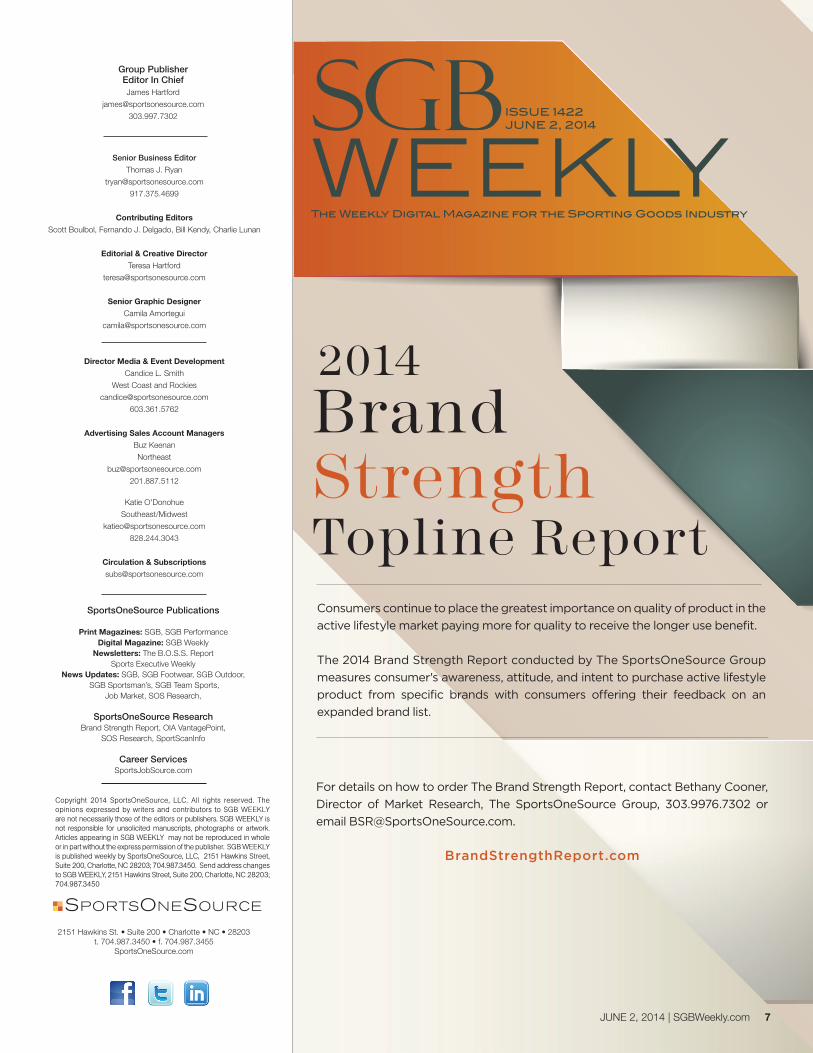
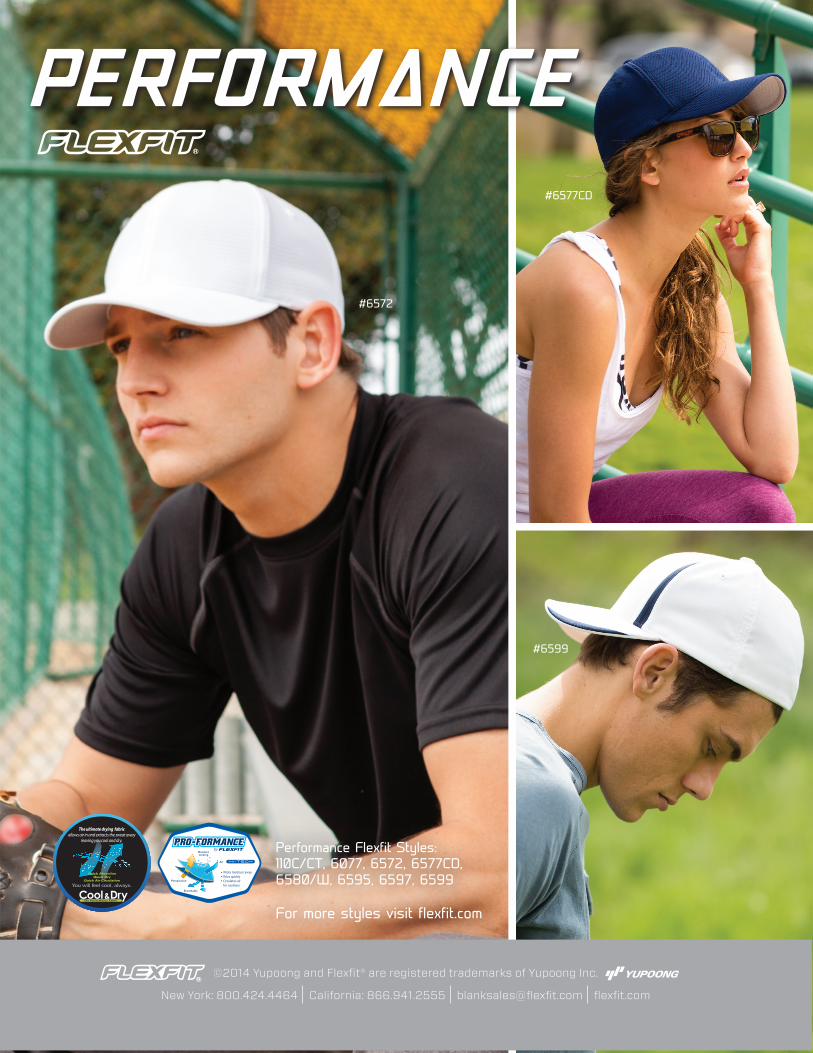
BrandStrength
Reportonsumers in 2014 continue their post-recessionary behavior by placing the greatest importance on quality of product when purchasing footwear
apparel and equipment to support their active lifestyle Quality of product continues to be the highest rated factor influencing consumerrsquos purchase of all three categories Consumers have a strong preference to pay more for quality and receive the benefit of its longer use
Consumers rely on their own personal experience with brands placing greater importance in 2014 on their knowledge and trust of certain brands than they did in 2011 Fewer consumers are influenced by price which continues to drop in importance over time and is surpassed in influence by innovationtechnology in 2014 Consumers want product that enhances their activities allows them to perform better and gives them an edge over the competition or
C their own personal best In the current environment where social media apps such as Strava continue to play an increased role in the way in which an active consumer participates in sporting activities the return to the brands is an increased trust factor from the consumer and the subsequent benefits that go along with it
Nearly half of all active consumers believe a brandrsquos environmental initiatives are important in 2014 which is a substantial rise from 2011 Consumers place a high expectation on the brands that they trust to also be focused on minimizing their environmental impact
For details on how to order the full Brand Strength Reportcontact Bethany Cooner Director of Market Research
The SportsOneSource Group 3039977302 or email BSRSportsOneSourcecom
BrandStrengthReportcom
These observations are highlighted in this yearrsquos Brand Strength Report which summarizes the bi-annual consumer survey conducted by The SportsOneSource Group to measure consumer awareness attitude and intent to purchase active lifestyle product from specific brands The Brand Strength Report was expanded in 2014 to include sports and outdoor equipment and consumers were also asked to offer their feedback on an expanded brand list
The following is a sampling from the complete Brand Strength Report
Topline
JUNE 2 2014 | SGBWeeklycom 11
The centerpiece of the Brand Strength Report is the Brand Strength Index (BSI) a rating system developed more than seven years ago by The SportsOneSource Group to more effectively measure and assess the overall consumer perception of a specific brand Each brand measured was tested across four main criteria and those criteria individually weighted to reflect their importance in the overall indexing formula
Key factors influencing the BSI included awareness both unaided and aided In an effort to measure a brandrsquos mindshare for the consumer the survey respondents were first asked open-ended questions to name five footwear apparel or equipment brands in the sports or outdoor category Respondents were then provided a list of 108 brands and asked about awareness levels for each brand Respondents were then asked if they had purchased these brands and to answer questions about their experiences
The next factor used to formulate the BSI was a respondentrsquos likelihood to purchase a specific brand again in the future For each brand that a respondent mentioned having purchased in the last year the respondent was asked on a scale of 1 to 5 ndashwith 1 representing ldquoDefinitely Would Notrdquo and 5 representing ldquoDefinitely Wouldrdquo ndashhow likely he or she would be to purchase that brand again in the future Brands earned points for positive responses while points were subtracted for negative responses
The attribute with the greatest importance in the BSI formula is a consumerrsquos uncompromising commitment to a brand Respondents were first asked if they would leave a specific retailer if a particular brand were not carried by that retailer The respondents answering ldquoyesrdquo were then asked (unaided) which brands were so important to them that they would leave a retail location if that brand were not available
The above criteria were then combined using The SportsOneSource Grouprsquos proprietary
formula to generate a single BSI for each qualifying brand
In 2014 the studyrsquos methodological approach to gathering awareness and purchase was revised to accommodate
a broader brand list As a result brands cannot be compared directly to their 2011 BSI scores awareness or purchase data However recurring brands can be compared to past year Brand Strength Reports based on their relative position to each other
Brand Strength Index
Nike 775
Adidas 687
ReebokRBK 620
Under Armour 607
New Balance 599
Puma 580
The North Face 567
Columbia 549
Converse 545
Asics 537
Skechers 536
Champion 535
Coleman 519
Jordan 517
Timberland 514
Speedo 512
LL Bean 510
Vans 506
Merrell 495
Dickies 493
Carhartt 491
Brooks 490
Ugg 488
Ray-Ban 487
Swiss Army 487
REI 486
Oakley 486
Danskin 481
Crocs 476
Lululemon 475
Russell Athletic 474
Patagonia 471
Saucony 468
Birkenstock 467
Keds 466
Billabong 463
K-Swiss 463
Roxy 461
Fila 457
Clif Bar 456
Sperry Top-Sider 455
Timex 453
Burton 452
Quiksilver 451
Mizuno 451
Powerbar 448
Smartwool 447
Toms 446
Keen 446
Garmin 444
Brand Index Brand Index
BRAND STRENGTH INDEX - OVERALL TOP 50 BRANDS
Index out of 1000
The Nike brand in 2014 once again ranks first in BSI ratings by a wide margin With a score of 775 (out of 1000) Nike is again nearly 100 points higher than the second highest scoring brand Adidas Nikersquos dominant position continues to reflect overwhelming consumer brand awareness both
aided (95 percent) and unaided (85 percent) With nearly 100 percent awareness among active consumers Nikersquos reign is unlikely to waiver in the near future
Adidasrsquo BSI score of 687 is 88 points lower than Nike With aided awareness at 89 percent Adidas has some catching up to do to achieve similar mindshare of the active consumer
Reebok ranks third on the BSI behind Nike and Adidas Under Armour took the number four position and New Balance rounded out the top five brands in 2014
Columbia moved up into the Top 10 position in 2014 decreasing their gap with The North Face Converse retained its Top 10 position and Asics moved up to join the Top 10 strongest brands among active consumers
Added to the list in 2014 are specific equipment brands that scored high in brand awareness recently as well as private label retail brands that are included for the first time in this expanded report
Notable additions to the Top 50 on the BSI list in 2014 include at number 13 Coleman LL Bean at number 17 Ray-Ban at number 24 and Swiss Army at number 25 Dickies and Carhartt two brands that are ubiquitous in the
workwear market were measured for their appeal as active lifestyle brands Both companies landed in the Top 25 with Dickies coming in at number 20 and Carhartt at number 21
In addition to Coleman Ray-Ban and Swiss Army other non-softline brands to make the Top 50 include Oakley Clif Bar Timex Powerbar and Garmin
12 SGBWeeklycom | JUNE 2 2014
In the Brand Awareness section of the study respondents were asked about their recognition of brand names on two levels - unaided and aided First respondents were asked an open-ended question to identify sports and outdoor brands including footwear apparel and equipment that came to mind to determine the unaided level of awareness The respondents were later asked to select from a randomized list of 108 brands to determine their recognition of each brand The tables below show total awareness which combines both lines of questions
Respondents that mentioned a specific brand in the unaided awareness section of the survey automatically selected those specific brands during the aided portion of the survey
Brand Awareness
Nike 95
Adidas 89
ReebokRBK 81
Puma 78
New Balance 74
Converse 71
Skechers 71
Under Armour 67
Timberland 63
LL Bean 63
Champion 62
The North Face 62
Speedo 61
Crocs 57
K-Swiss 56
Columbia 56
Ray-Ban 56
Dickies 55
Swiss Army 55
Keds 54
Asics 51
Vans 51
Fila 51
Ugg 51
Oakley 48
BRAND AWARENESS - OVERALL TOP 50 BRANDS
Jordan 48
Coleman 48
Danskin 46
Timex 45
Jansport 44
Russell Athletic 41
Stride Rite 40
Garmin 38
Birkenstock 38
Quiksilver 36
Toms 36
Carhartt 36
Powerbar 36
REI 35
Airwalk 35
Clif Bar 34
Ocean Pacific (OP) 34
Billabong 34
Igloo 34
Avia 34
Saucony 34
Hurley 33
Body Glove 31
Wolverine 30
DC Shoes 29
Brand Percentage Brand Percentage
MOST RECOGNIZED BRAND NAMES
Nike 93
Adidas 87
ReebokRBK 76
Puma 74
New Balance 68
Under Armour 64
Converse 64
Skechers 61
Timberland 60
LL Bean 57
Champion 56
The North Face 56
Speedo 54
K-Swiss 54
Ray-Ban 53
Swiss Army 53
Dickies 52
Columbia 51
Asics 49
Fila 48
Oakley 47
Russell Athletic 47
Coleman 47
Crocs 47
Jordan 45
Nike 97
Adidas 91
ReebokRBK 85
Puma 83
Skechers 79
New Balance 79
Converse 76
Under Armour 70
LL Bean 69
Champion 67
The North Face 67
Speedo 66
Crocs 66
Timberland 66
Keds 65
Ugg 64
Danskin 61
Columbia 60
Vans 59
K-Swiss 58
Ray-Ban 58
Dickies 58
Swiss Army 57
Asics 54
Fila 54
Brand Percentage Brand Percentage
FEMALEMALE
BRAND AWARENESS - BY GENDER
Note The Full Report Core Report Young Consumer Report Outdoor BSR and Sportsmanrsquos BSR (all versions of the Brand Strength Report) provide Brand Awareness levels by specific demographic segments For details contact Bethany Cooner
Director of Market Research The SportsOneSource Group 3039977302 or email BSRSportsOneSourcecom
Not surprisingly Nike leads in overall Brand Awareness followed by Adidas Reebok Puma and New Balance The top five brands in overall awareness have not changed since 2011 though Puma and New Balance have switched positions
For female active consumers New Balance shares the number five spot in Brand Awareness with Skechers with both registering Brand Awareness at 79 percent
Based on a preliminary review of the Brand Awareness data female consumers are far more aware of the brands in the active lifestyle market than men The variance for an individual brand is four to 12 percentage points higher for females than for men for the Top 12 brands For Crocs the Brand Awareness is 20 percentage points higher for females
Only four brands - Oakley Russell Coleman and Jordan - made the male Top 25 in Brand Awareness that were not included in the female Top 25 chart
JUNE 2 2014 | SGBWeeklycom 13
Nike dominates as the top purchased brand in the past year of all surveyed brands Almost half of all active lifestyle consumer re-spondents purchased Nike in the past year a full 24 points higher than second-highest brand Adidas Under Armour jumped from tenth position in 2011 to third in 2014 The North Face also rises landing in the Top 10 in 2014 Female active consumers rank Skech-ers in their top five brands purchased in the past year and 15 percent of females purchased The North Face in the past year
Only Nike and Under Armour share the same purchase percentage for both male and female respondents in the Top 10 purchased brands Female respondents were twice as likely as males to have purchased Skechers in the past year Other Top 25 brands that were more likely to be purchased by females in the past year include
The North Face Vans and Converse Toms Keds Roxy REI and Ugg were rated in the Top 25 by females but not by males
Another key metric recorded in the 2014 Brand Strength Report was conversion rate or the percentage of respondents that said they were aware of the brand and purchased the brand in the past year
Driving awareness through strong messaging using advertising and promotion is key but converting those newly aware consumers into purchasers is the catch to long-term success
Under Armour continues to have an extremely high conversion rate as noted in the Brand Strength Report in 2011 Thirty-three percent of those aware of Under Armour purchased the brand in the past year With awareness rising to levels that has put Under Armour in the Top 10 for the active consumer in 2014 coupled with a con-tinuing strong conversion rate the brand has exponentially increased its overall strength as forecasted in the 2011 Brand Strength Report
Brand Purchasing
Nike 49
Adidas 25
Under Armour 22
New Balance 20
Skechers 14
ReebokRBK 14
The North Face 13
Champion 13
Converse 12
Puma 12
Columbia 12
Asics 9
LL Bean 9
Vans 9
Timberland 8
Clif Bar 8
Jordan 7
Danskin 6
Coleman 6
Ugg 6
Dickies 6
Carhartt 6
Ray-Ban 6
Fila 6
Powerbar 6
Brand Percentage
BRAND PURCHASING - OVERALL TOP 50 BRANDS
Toms 5
Crocs 5
REI 5
Russell Athletic 5
Oakley 4
Keds 4
Swiss Army 4
Speedo 4
Sperry Top-Sider 4
Garmin 4
Roxy 4
Saucony 4
K-Swiss 4
Timex 4
DC Shoes 4
Hurley 4
Quiksilver 4
Jansport 4
Merrell 4
Lululemon 3
Starter 3
Life is good 3
Igloo 3
Avia 3
Billabong 3
Brand Percentage
Nike 49
Adidas 28
Under Armour 22
New Balance 20
ReebokRBK 16
Puma 13
Champion 13
Columbia 12
Timberland 11
The North Face 11
Converse 10
Skechers 9
LL Bean 9
Asics 9
Jordan 9
Clif Bar 8
Coleman 8
Dickies 8
Powerbar 7
Vans 7
Carhartt 7
Ray-Ban 7
Russell Athletic 7
Fila 7
Oakley 6
BRAND PURCHASING - BY GENDER
Nike 49
Adidas 22
Under Armour 22
New Balance 19
Skechers 18
The North Face 15
Converse 14
Champion 13
ReebokRBK 12
Columbia 11
Puma 11
Danskin 11
Vans 10
Asics 10
Ugg 9
LL Bean 9
Clif Bar 8
Toms 7
Crocs 6
Jordan 6
Timberland 6
Keds 6
Roxy 5
Carhartt 5
REI 5
Brand Percentage Brand Percentage
FEMALEMALE
14 SGBWeeklycom | JUNE 2 2014
Brand Strength Report survey respondents were asked to rate a list of footwear purchase factors on a scale of 1-to-10 to identify how each factor influenced their footwear purchase Some of the most influential factors from the survey are as follows
raquo ldquoProduct Qualityrdquo rated as the most influential factor with an average of 89 driven by 92 percent of respondents rating it as at least somewhat important This rating mirrors the active consumerrsquos mindset in 2011 because consumers prefer to pay more for a product of higher quality with the perceived benefit of both value and longer use
raquo ldquoValue for the Pricerdquo was again rated as the second most influential factor with an average rating of 85
raquo ldquoPast Experience with Brandrdquo moves up to third most influential position with an average rating of 81 and almost half of all active consumers citing it extremely important This shows the importance consumerrsquos place on their own knowledge and commitment to specific brands and their preference to spend more money less frequently for higher quality products from trusted brands
raquo Supporting this trend is that ldquoLow Pricerdquo drops again in 2014 ranking sixth in importance to consumers with just 65 percent citing it somewhat important in 2014 compared to 68 percent in 2011 and 71 percent in 2010
Inf luences On Footwear Purchases
1613
2313
2913
3413
3413
4713
4813
5813
7013
1313
2413
3213
3113
3313
3213
3513
3113
2213
1513
2613
2313
2213
2213
1413
1313
913
613
1213
1213
813
813
613
4313
1513
813
513
513
013 1013 2013 3013 4013 5013 6013 7013 8013 9013 10013
AthleteCelebrity13 Sponsorship13
Environmental13 IniBaBves13
Brand13 Name13
Low13 Price13
InnovaBonTechnology13
StyleFashionFit13
Past13 Experience13 with13 Brand13
Value13 for13 the13 Price13
Product13 Quality13
INFLUENCES13 ON13 FOOTWEAR13 PURCHASES13 -shy‐13 OVERALL13
Extremely13 Important13 Somewhat13 Important13 Neutral13 Somewhat13 Unimportant13 Not13 At13 All13 Important13
INFLUENCES ON FOOTWEAR PURCHASES - OVERALL
raquo ldquoInnovationTechnologyrdquo surpassed ldquoLow Pricerdquo in 2014 Active consumers want to take advantage of advancements in footwear and the perceived benefit of improved personal performance outweighs the cost savings
raquo The 2014 study also shows an increase in the influence of ldquoEnvironmental Initiativesrdquo with nearly half of all active consumers rating it at least somewhat important and earning an average of 60 By comparison in 2011 only 38 percent of active consumers rated ldquoEnvironmental Initiativesrdquo as at least somewhat important earning an average of 55
raquo In 2011 just 19 percent of active consumers rated ldquoAthleteCelebrity Sponsorshiprdquo as at least somewhat important earning an average of 36 In 2014 ldquoAthleteCelebrity Sponsorshiprdquo is rated at least somewhat important by 29 percent of active consumers earning an average of 43 As brands focus on fewer but more visible and credible endorsers to promote their products will this factor of influence on footwear purchase continue to grow
JUNE 2 2014 | SGBWeeklycom 15
16 SGBWeeklycom | JUNE 2 2014
7313
7213
7213
7213
7613
7113
7813
8213
8313
8813
2213
2213
2313
2413
2013
2713
1713
1413
1413
1113
613
513
413
213
413
413
513
113
013 1013 2013 3013 4013 5013 6013 7013 8013 9013 10013
Wolverine13
Under13 Armour13
Nike13
Keen13
Timberland13
The13 North13 Face13
Jordan13
LL13 Bean13
Birkenstock13
Merrell13
FOOTWEAR13 RATINGS13 BY13 ATTRIBUTE13 -shy‐13 PRODUCT13 QUALITY13
Extremely13 PosiNve13 Somewhat13 PosiNve13 Neutral13 Somewhat13 NegaNve13 Extremely13 NegaNve13
For each brand of footwear that the Brand Strength Report survey respondents said they purchased in the past year they were asked to rate each brand on six attributes on a scale of 1-to-10 Categories included ldquoValue for the Pricerdquo ldquoProduct Qualityrdquo ldquoStyleFashionFitrdquo ldquoPast Experience with Brandrdquo ldquoInnovative Technologyrdquo and ldquoEnvironmental Initiativesrdquo To qualify for each of these ratings the brands had to receive a minimum number of responses
The Footwear Ratings By Attribute ndash Product Quality graph shows the Top 10 rated brands for ldquoProduct Qualityrdquo The Brand Strength Report Full Report and Core Report include the Top 20 brands for each attribute in addition to the Top 10 rated brands for ldquoProduct Qualityrdquo
Merrell Jordan The North Face Timberland Keen Nike and Under Armour all return in 2014 in the Top 10 footwear brands rated by ldquoProduct Qualityrdquo Birkenstock LL Bean and Wolverine join the list for 2014
Merrell ranks highest in 2014 for ldquoProduct Qualityrdquo among footwear brands with an average ranking of 95 A full 88 percent of active consumers who purchased Merrell footwear in the past year rated the brandrsquos footwear extremely positive for ldquoProduct Qualityrdquo
Footwear Ratings By Attribute
FOOTWEAR RATINGS BY ATTRIBUTE - PRODUCT QUALITY
JUNE 2 2014 | SGBWeeklycom 17
Because purchase decisions vary when deciding on footwear apparel or equipment the questions about purchasing were asked separately for each category For the 2014 Brand Strength Report respondents were asked to rate the same list of factors using a scale of 1-to-10 on the influence of each factor when purchasing apparel
raquo The responses for footwear and apparel are fairly similar with ldquoProduct Qualityrdquo ranking as the most influential for both While ldquoProduct Qualityrdquo continues to rank as the highest influence on active consumerrsquos apparel purchases in 2014 the overall mean score declined from 89 in 2011 to 87 in 2014 Sixty-six percent of active consumers rate the attribute extremely important compared to 70 percent in 2011
raquo ldquoEnvironmental Initiativesrdquo shows an increase in apparel influence as it does in footwear compared to 2011 With 48 percent of active consumers rating it at least somewhat important ldquoEnvironmental Initiativesrdquo earns an average ranking of 60 in 2014 compared to 55 in 2011
raquo ldquoAthleteCelebrity Sponsorshiprdquo continues to rank last for influence on apparel purchases but earns an average ranking of 44 in 2014 compared to 36 in 2011 Thirty-one percent of active consumers rate ldquoAthleteCelebrity Sponsorshiprdquo at least somewhat important in 2014 compared to 21 percent in 2011
Inf luences On Apparel Purchases
1713
2413
2913
3313
3813
4513
5013
5913
6613
1413
2413
3113
3213
3213
3413
3213
3013
2513
1513
2513
2213
2213
1913
1513
1313
913
713
1113
1113
813
613
613
4313
1613
913
613
513
013 1013 2013 3013 4013 5013 6013 7013 8013 9013 10013
AthleteCelebrity13 Sponsorship13
Environmental13 IniBaBves13
Brand13 Name13
InnovaBonTechnology13
Low13 Price13
Past13 Experience13 with13 Brand13
StyleFashionFit13
Value13 for13 the13 Price13
Product13 Quality13
INFLUENCES13 ON13 APPAREL13 PURCHASES13 -shy‐13 OVERALL13
Extremely13 Important13 Somewhat13 Important13 Neutral13 Somewhat13 Unimportant13 Not13 At13 All13 Important13
INFLUENCES ON APPAREL PURCHASES - OVERALL
5613
7013
7513
7313
6713
8413
6313
6713
5813
8013
4413
2913
2213
2313
2413
1113
3013
2813
3813
1613
013
113
313
413
713
313
613
313
413
413
013 1013 2013 3013 4013 5013 6013 7013 8013 9013 10013
Under13 Armour13
Timberland13
Columbia13
LL13 Bean13
Oakley13
The13 North13 Face13
Smartwool13
Jordan13
Patagonia13
CarharL13
APPAREL13 RATINGS13 BY13 ATTRIBUTE13 -shy‐13 PRODUCT13 QUALITY13
Extremely13 PosiPve13 Somewhat13 PosiPve13 Neutral13 Somewhat13 NegaPve13 Extremely13 NegaPve13
Jordan The North Face Columbia Timberland and Under Armour return in 2014 as Top 10 apparel brands rated by ldquoProduct Qualityrdquo Carhartt Patagonia Smartwool Oakley and LL Bean join the Top 10 apparel brands for 2014 Carhartt is the highest rated brand in 2014 with 80 percent of respondents rating the brandrsquos apparel extremely positive for ldquoProduct Qualityrdquo
Apparel Ratings By Attribute
APPAREL RATINGS BY ATTRIBUTE - PRODUCT QUALITY
18 SGBWeeklycom | JUNE 2 2014
1913
2613
3013
3613
3913
4213
4413
5813
6513
1413
2413
3113
3013
3113
3213
3313
2813
2313
1513
2413
2313
2113
1913
1813
1713
1013
913
1013
1013
713
613
513
4313
1613
913
713
513
013 1013 2013 3013 4013 5013 6013 7013 8013 9013 10013
AthleteCelebrity13 Sponsorship13
Environmental13 IniBaBves13
Brand13 Name13
StyleFashionFit13
Low13 Price13
InnovaBonTechnology13
Past13 Experience13 with13 Brand13
Value13 for13 the13 Price13
Product13 Quality13
INFLUENCES13 ON13 EQUIPMENT13 PURCHASES13 -shy‐13 OVERALL13
Extremely13 Important13 Somewhat13 Important13 Neutral13 Somewhat13 Unimportant13 Not13 At13 All13 Important13
INFLUENCES ON EQUIPMENT PURCHASES - OVERALL
New in 2014 the survey asked respondents to rank the same list of factors on a scale of 1-to-10 on the influence of each factor when purchasing equipment Similar to footwear and apparel ldquoProduct Qualityrdquo and ldquoValue For The Pricerdquo are the highest ranking factors influencing purchase of equipment
ldquoInnovationTechnologyrdquo ranks fourth on equipment purchase among active consumers earning an average of 76 with over 4-in-10 rating it extremely important ldquoPast Experience With Brandrdquo ranks third highlighting the importance trust in a brand is on high dollar product
Inf luences On Equipment Purchases
JUNE 2 2014 | SGBWeeklycom 19
20 SGBWeeklycom | JUNE 2 2014
6913
7313
6813
7213
6913
7413
7413
7513
7813
7413
2113
2013
2713
2313
2813
2313
2213
2213
1813
2113
1013
613
513
213
413
413
313
413
013 1013 2013 3013 4013 5013 6013 7013 8013 9013 10013
Swiss13 Army13
LL13 Bean13
Garmin13
Ray-shy‐Ban13
Coleman13
The13 North13 Face13
Under13 Armour13
Nike13
adidas13
Timex13
EQUIPMENT13 RATINGS13 BY13 ATTRIBUTE13 -shy‐13 PRODUCT13 QUALITY13
Extremely13 PosiNve13 Somewhat13 PosiNve13 Neutral13 Somewhat13 NegaNve13 Extremely13 NegaNve13
EQUIPMENT RATINGS BY ATTRIBUTE - PRODUCT QUALITY
Timex is the highest rated brand for product quality in 2014 with 74 percent of respondents rating the brandrsquos equipment extremely positive for ldquoProduct Qualityrdquo
Adidas Nike Under Armour and The North Face join Timex as the top five equipment brands with over 70 percent of respondents ranking them extremely positive for ldquoProduct Qualityrdquo in 2014 Coleman Ray-Ban Garmin LL Bean and Swiss Army round out the Top 10 in 2014
Equipment Ratings By Attribute
For the final and most heavily weighted component of the BSI respondents were first asked if there were specific brands which would cause them to shop somewhere else if those brands were unavailable The respondents who answered lsquoYesrsquo were directed to a follow-up question asking which brands would prompt that response Those brands were determined to be ldquonon-negotiable brandsrdquo in the eyes of that consumer If a consumer leaves a store because that store doesnrsquot carry the brand they want the Brand Strength Report shows that as a leading indicator of brand value
Nike was the most non-negotiable brand with 20 percent of active consumers citing it Adidas moves up from fourth position in 2011 to second position in 2014 supplanting New Balance and leap-frogging Reebok Under Armour and Puma also rise substantially ranking in the Top 10 in 2014
Puma ranks in the top five non-negotiable brands among male active consumers while Skechers ranks in the top five for female active consumers however Skechers has fallen from second position among females in 2011 (at the height of impact of the Shape-Ups product) to fifth in 2014
Nike 20
Adidas 7
New Balance 4
Puma 2
Under Armour 2
ReebokRBK 2
Jordan 2
Asics 1
The North Face 1
Timberland 1
Brand Percentage
MALE FEMALE
NON-NEGOTIABLE BRANDS - BY GENDER
Nike 20
Adidas 5
Under Armour 4
New Balance 4
Skechers 4
ReebokRBK 2
Vans 2
The North Face 2
Jordan 2
Converse 2
Brand Percentage
Nike 20
Adidas 6
New Balance 4
Under Armour 3
Skechers 2
ReebokRBK 2
Puma 2
Jordan 2
The North Face 2
Vans 2
Brand Percentage
NON-NEGOTIABLE BRANDS - OVERALL
Non-Negotiable Brands
JUNE 2 2014 | SGBWeeklycom 21
Methodology
The Brand Strength Report compiled and presented by The SportsOneSource Group consumer research team was designed to gauge the strength of sporting goods brands in the overall US market Respondents were asked a variety of questions relating to brand perception and individual products pertaining to their sporting goodsrsquo purchases in the twelve months preceding the study which took place in March and April 2014
The 2014 Brand Strength Report focuses primarily on Footwear Apparel and Equipment brands across various segments of the sporting goods market including Outdoors and Sportsmanrsquos categories
To qualify for the Brand Strength Report each respondent must have purchased athletic footwear or apparel in the past year A total of 4201 responses were received providing detailed information on awareness levels purchasing trends and brand allegiance to more than 300 Athletic Outdoor and Sportsmanrsquos brands
The Brand Strength Report includes the responses from consumerrsquos age 13 and older all of who were surveyed through a third-party Internet panel provider The SportsOneSource Group made every effort to control the demographics to best represent the US population however as is the case with all Internet-based surveys the demographics and psychographics tend to skew toward older more affluent households
The results of the survey can be projected to the US population with a margin of error of +- 134 percent
Survey respondents were asked a series of questions to determine the strength of each brand The factors that were used to build the index are listed in order of importance
1 Non-Negotiable Brands2 Likelihood To Repurchase (on a scale of 1-to-5 with 1 meaning would not and 5 meaning definitely would)3 Unaided Awareness4 Aided Awareness
To qualify for the BSI a brand had to be purchased by a minimum number of respondents so that each answer did not over-represent the perceptions of the total population
FORMULATING THE BRAND STRENGTH INDEX
Gender
Male 50
Female 50
Mean Age 396
Age
13-17 10
18-34 37
35-54 33
55 and Older 20
Race
Non-Hispanic White 73
African-American 10
Hispanic 9
Asian 6
American Indian 1
Other 1
Marital Status
Married 64
Single 25
SeparatedDivorced 8
WidowedWidower 2
Prefer Not to Answer 1
KEY DEMOGRAPHICS
Employment Status
Full-time 52
Part-time 11
Self Employed 6
Unemployed 5
Retired 13
Student 4
Homemaker 9
Prefer Not to Answer 1
Household Income
Less than $40K 21
$40 - $60K 19
$60 - $80K 19
$80 - $100K 14
$100 - $149K 17
$150K+ 7
Prefer Not to Answer 4
US Region
Northeast 21
Midwest 24
South 32
West 23
22 SGBWeeklycom | JUNE 2 2014
JUNE 2 2014 | SGBWeeklycom 23
ldquoA brand for a company is like a reputation for a person You earn
reputation by trying to do hard things wellrdquo - JEFF BEZOS
BrandStrength
ReportComprehensive Nationwide Survey Brand Strength Index ListingIn-Depth Consumer Behavior Analysis Detailed Individual Brand Analysis Customizable Format
For inquiries or to customize your personal report contact Bethany Cooner Director Market Research
The SportsOneSource Group 3039977302 or BSRSportsOneSourcecom
BrandStrengthReportcom
2014
Pre-Order Your Copy
Today
TR
AD
E A
SS
OC
IAT
ION
S |
BU
YIN
G G
RO
UP
S
JUNE
11-12 Altanta Shoe Market Atlanta GA
17-19 Licensing International Expo Las Vegas NV
26-28 Sports Inc Summer Team Dealer Show Nashville TN
JULY
8-11 NBS Summer Market Austin TX
10-13 European Outdoor Trade Fair Friedrichshafen Germany
15-17 ASI Chicago Chicago IL
18-20 ADA Spring Show Reno Nevada
AUGUST
6-9 Outdoor Retailer Summer Market Salt Lake City UT
14-16 Sports Inc Outdoor Show Nashville TN
24 Tennis Industry Association The Tennis Show New York NY
SEPTEMBER
3-8 NBS Fall Semi - Annual Market Fort Worth Texas
4-6 Imprinted Sportswear Show (ISS) Orlando FL
10-12 Interbike International Trade Expo Las Vegas NV
16-17 SFIA Industry Leaders Summit Chicago IL
OCTOBER
7-9 OIA Rendezvous Asheville North Carolina
NOVEMBER
3-5 NBS Fall Athletic Market Ft Worth TX
15-16 ADA Fall Show Palm Springs California
23-25 Sports Inc Fall Team Dealer Show Las Vegas NV
Athletic Dealers of America1395 Highland AvenueMelbourne FL 32935t 3212540091f 3212427419athleticdealersofamericacom
National Shooting Sports FoundationFlintlock Ridge Office Center11 Mile Hill RoadNewtown CT 06470t 2034261320 f 2034261087nssforg
National Sporting Goods Association1601 Feehanville Drive Suite 300Mount Prospect IL 60056t 8472966742f 8473919827nsgaorg
Nationrsquos Best Sports4216 Hahn BlvdFt Worth TX 76117t 8177880034f 8177888542nbscom
Outdoor Industry Association4909 Pearl East Circle Suite 300Boulder CO 80301t 3034443353f 3034443284outdoorindustryorg
Sports amp Fitness Industry Association8505 Fenton St Suite 211Silver Spring MD 20910t 3014956321f 3014956322sfiaorg
Snow Sports Industries America8377-B Greensboro DriveMcLean VA 22102t 7035569020f 7038218276snowsportsorg
Sports Inc333 2nd Avenue NorthLewistown MT 59457t 4065383496f 4065382801sportsinccom
Sports Specialists Ltd590 Fishers Station Drive Suite 110Victor NY 14564t 5857421010f 5857422645sportsspecialistsltdcom
Team Athletic Goods629 Cepi DriveChesterfield MO 63005t 6365303710f 6365303711tag1com
Tennis Industry Association1 Corpus Christi Place Suite 117Hilton Head Island SC 29928t 8436863036f 8436863078tennisIndustryorg
Worldwide 8211 South 194thKent WA 98032t 2538728746f 2538727603wdi-wdicom
CALENDAR For full year calendar go to sportsonesourcecomeventsa
24 SGBWeeklycom | JUNE 2 2014
Access the weekly sales landscape of the outdoor industry and be outfitted with data to guide your companyrsquos strategic decisions with OIA VantagePointtrade The only weekly retail point-of-sale reporting platform exclusively for the active outdoor lifestyle industry We swiftly deliver critical trend and detailed business data to brands and retailers
START SEEING CLEARLY
SHARPEN YOUR PERSPECTIVE
OIAVantagePointcom bull oiavantagepointsportsonesourcecom bull 3039977302
Access the weekly sales landscape of the outdoor industry and be outfitted with data to guide your companyrsquos strategic decisions with OIA VantagePointtrade The only weekly retail point-of-sale reporting platform exclusively for the active outdoor lifestyle industry We swiftly deliver critical trend and detailed business data to brands and retailers
START SEEING CLEARLY
SHARPEN YOUR PERSPECTIVE
OIAVantagePointcom bull oiavantagepointsportsonesourcecom bull 3039977302
SportScanInfocomA Service of The SportsOneSource Group
ACHIEVE YOUR GOALS
SportScanInfo is the only weekly retail sales
trend reporting solution for the active lifestyle market
3039977302SportScanSportsOneSourcecom
BREADTH OF DATA DEPTH OF DATA TIMELINESS OF DATA
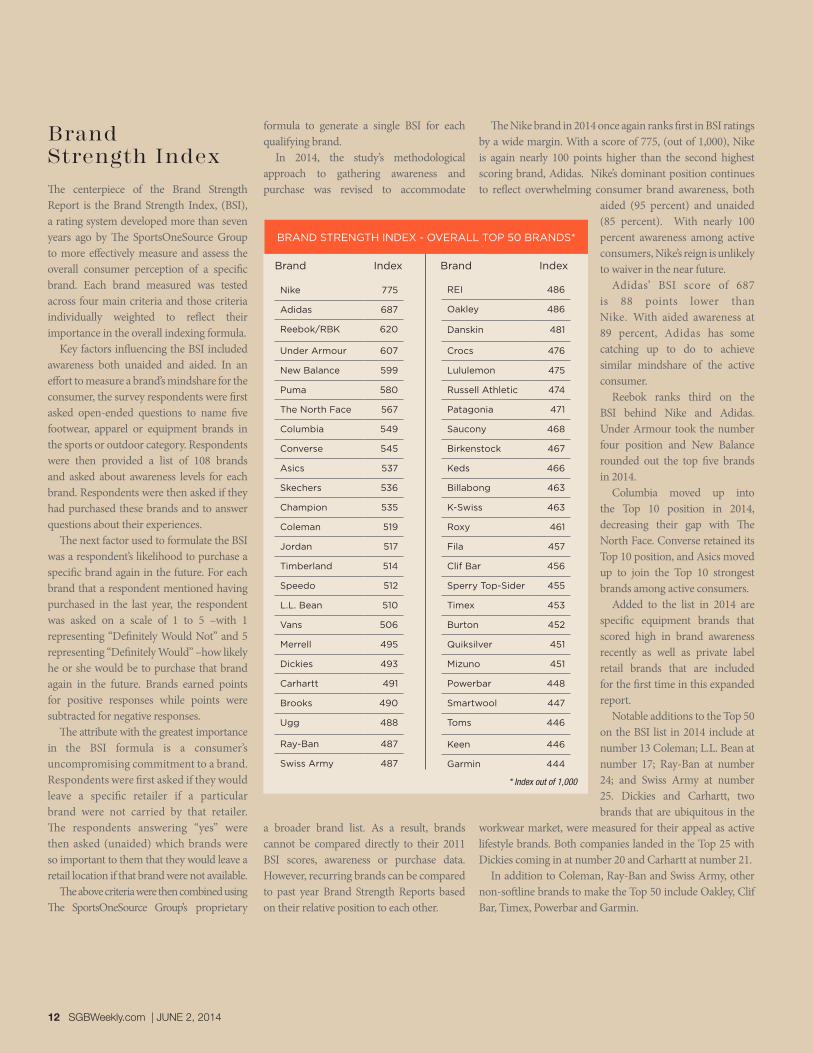
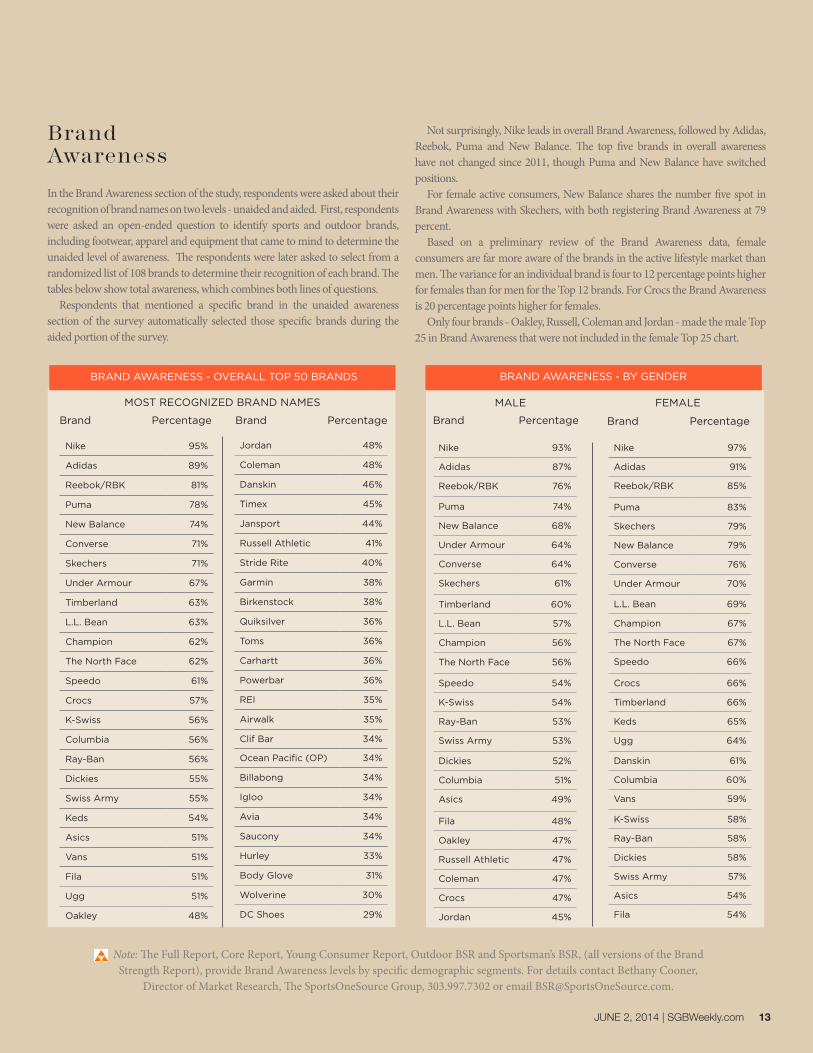
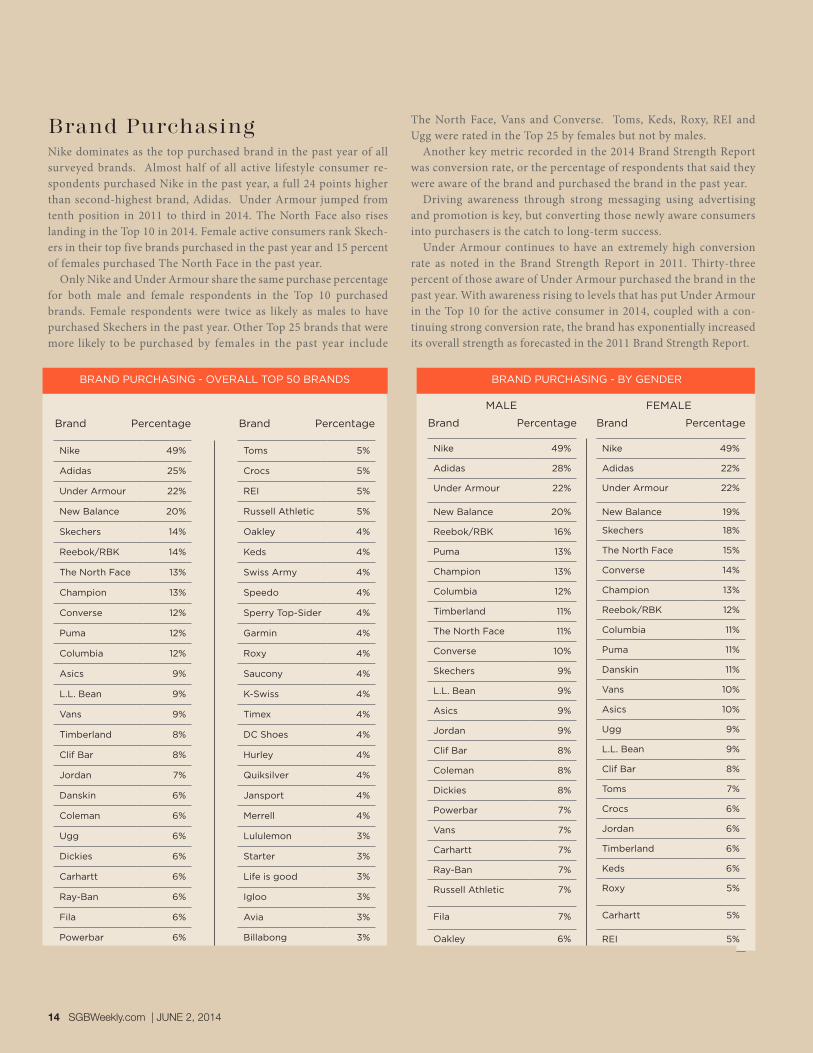
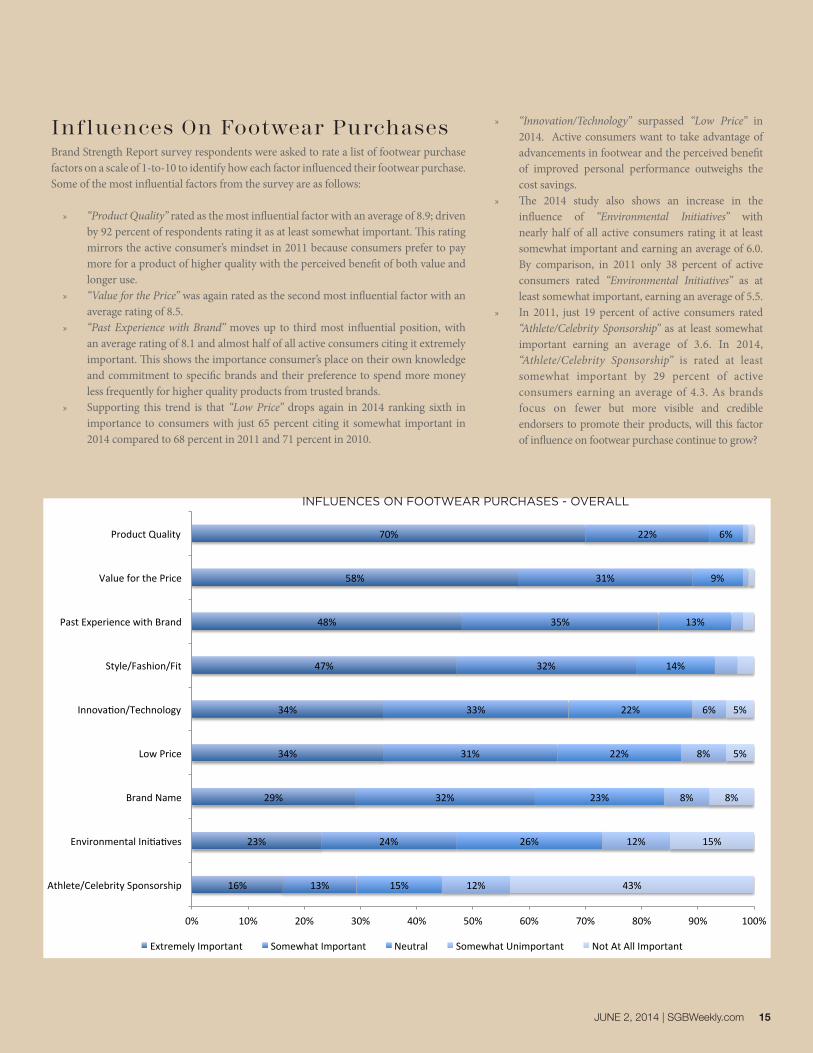
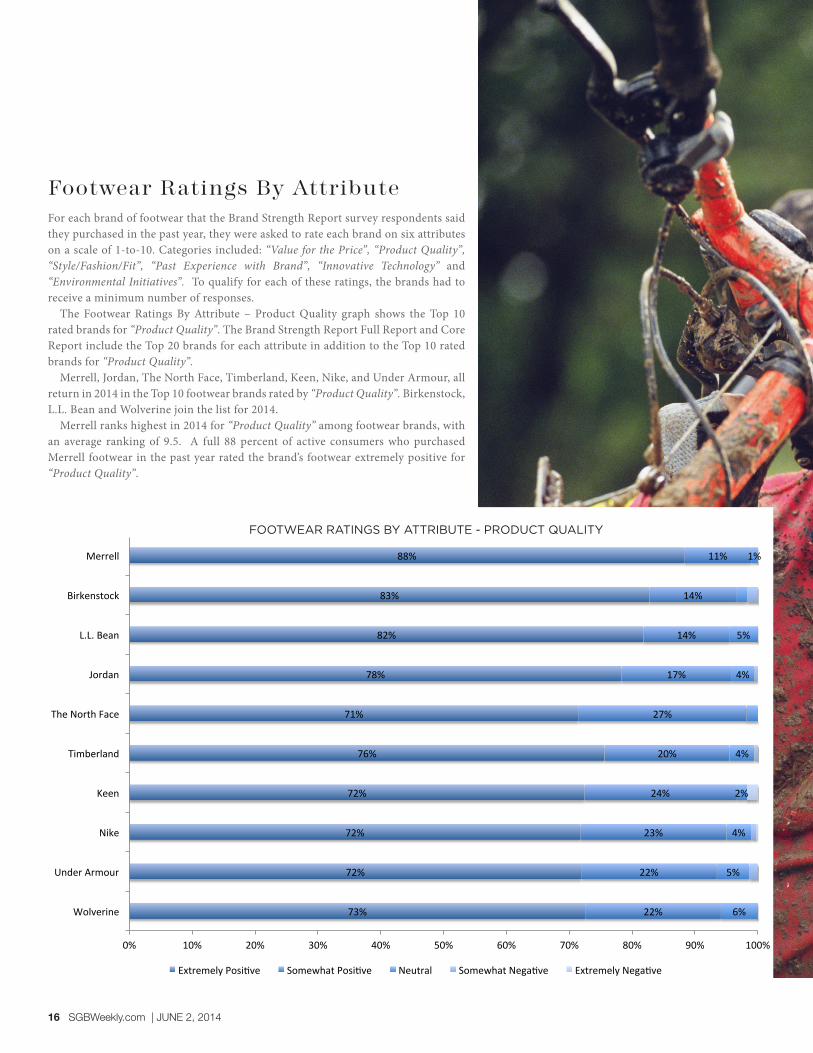
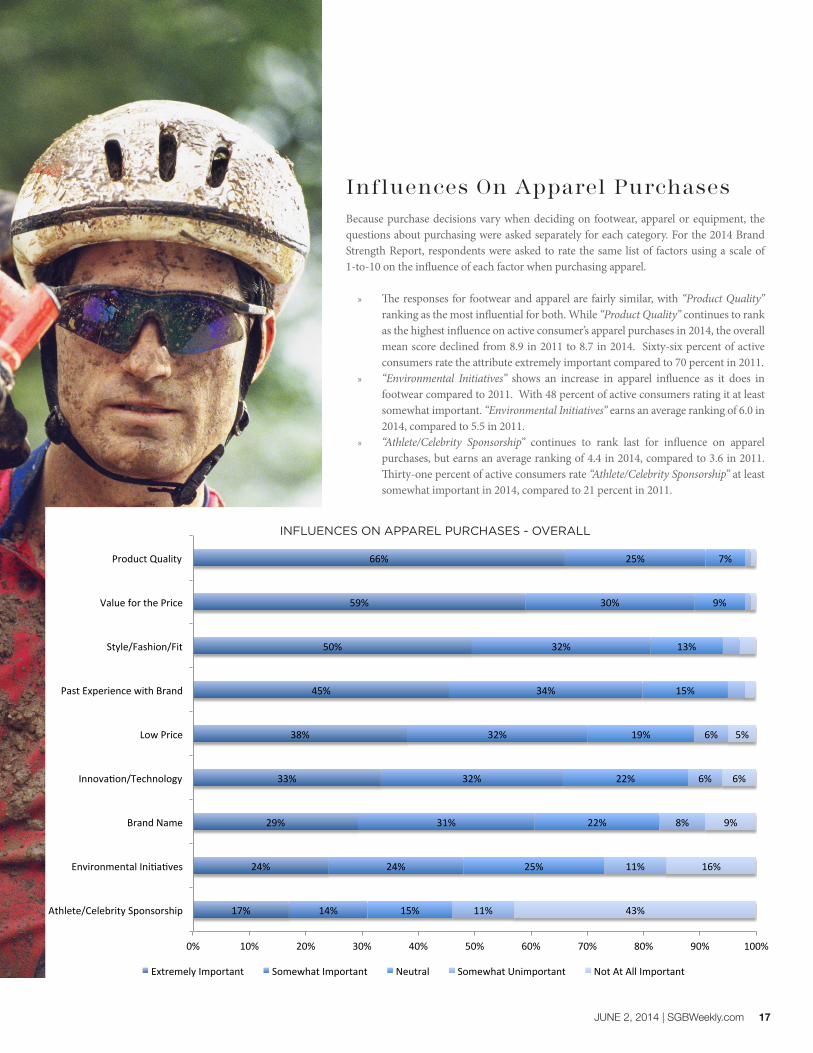
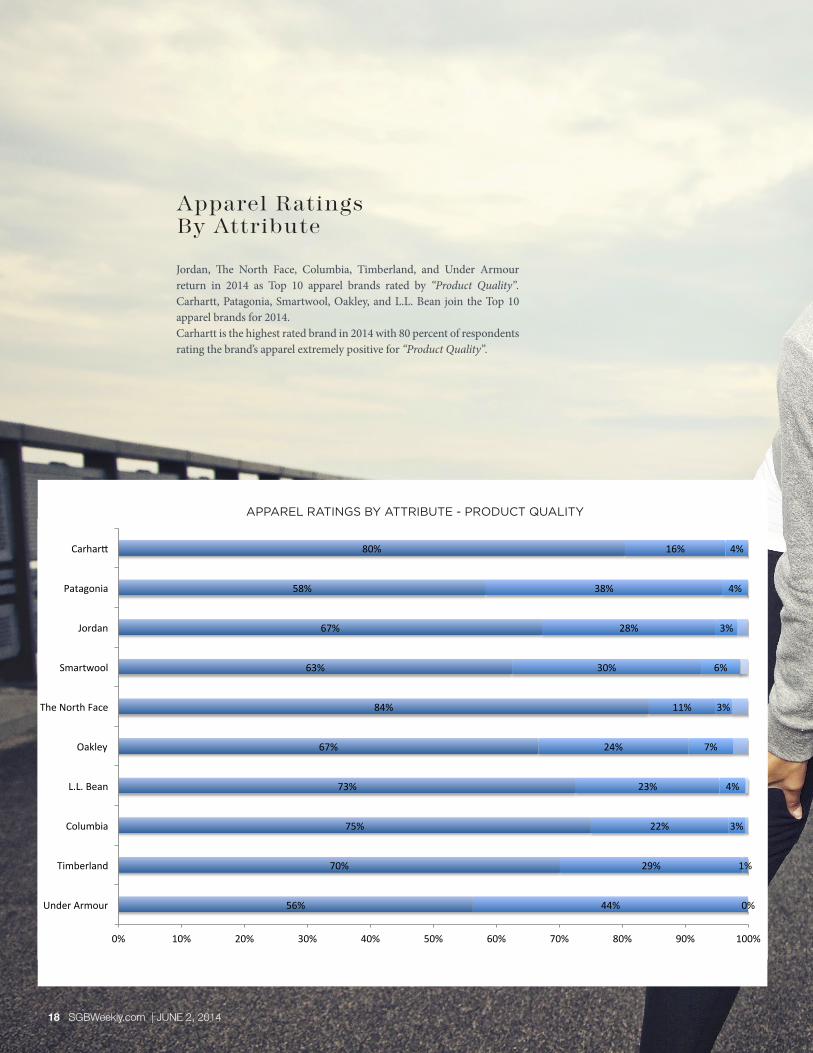
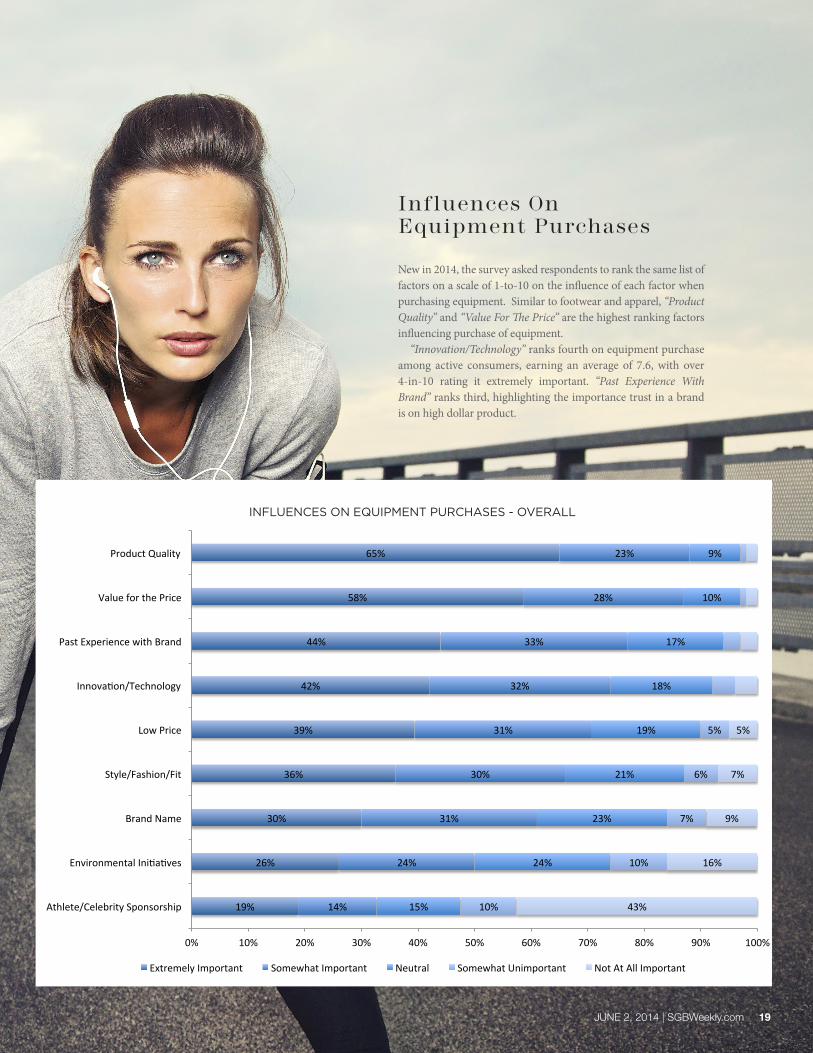
1913
2613
3013
3613
3913
4213
4413
5813
6513
1413
2413
3113
3013
3113
3213
3313
2813
2313
1513
2413
2313
2113
1913
1813
1713
1013
913
1013
1013
713
613
513
4313
1613
913
713
513
013 1013 2013 3013 4013 5013 6013 7013 8013 9013 10013
AthleteCelebrity13 Sponsorship13
Environmental13 IniBaBves13
Brand13 Name13
StyleFashionFit13
Low13 Price13
InnovaBonTechnology13
Past13 Experience13 with13 Brand13
Value13 for13 the13 Price13
Product13 Quality13
INFLUENCES13 ON13 EQUIPMENT13 PURCHASES13 -shy‐13 OVERALL13
Extremely13 Important13 Somewhat13 Important13 Neutral13 Somewhat13 Unimportant13 Not13 At13 All13 Important13
INFLUENCES ON EQUIPMENT PURCHASES - OVERALL
New in 2014 the survey asked respondents to rank the same list of factors on a scale of 1-to-10 on the influence of each factor when purchasing equipment Similar to footwear and apparel ldquoProduct Qualityrdquo and ldquoValue For The Pricerdquo are the highest ranking factors influencing purchase of equipment
ldquoInnovationTechnologyrdquo ranks fourth on equipment purchase among active consumers earning an average of 76 with over 4-in-10 rating it extremely important ldquoPast Experience With Brandrdquo ranks third highlighting the importance trust in a brand is on high dollar product
Inf luences On Equipment Purchases
JUNE 2 2014 | SGBWeeklycom 19
20 SGBWeeklycom | JUNE 2 2014
6913
7313
6813
7213
6913
7413
7413
7513
7813
7413
2113
2013
2713
2313
2813
2313
2213
2213
1813
2113
1013
613
513
213
413
413
313
413
013 1013 2013 3013 4013 5013 6013 7013 8013 9013 10013
Swiss13 Army13
LL13 Bean13
Garmin13
Ray-shy‐Ban13
Coleman13
The13 North13 Face13
Under13 Armour13
Nike13
adidas13
Timex13
EQUIPMENT13 RATINGS13 BY13 ATTRIBUTE13 -shy‐13 PRODUCT13 QUALITY13
Extremely13 PosiNve13 Somewhat13 PosiNve13 Neutral13 Somewhat13 NegaNve13 Extremely13 NegaNve13
EQUIPMENT RATINGS BY ATTRIBUTE - PRODUCT QUALITY
Timex is the highest rated brand for product quality in 2014 with 74 percent of respondents rating the brandrsquos equipment extremely positive for ldquoProduct Qualityrdquo
Adidas Nike Under Armour and The North Face join Timex as the top five equipment brands with over 70 percent of respondents ranking them extremely positive for ldquoProduct Qualityrdquo in 2014 Coleman Ray-Ban Garmin LL Bean and Swiss Army round out the Top 10 in 2014
Equipment Ratings By Attribute
For the final and most heavily weighted component of the BSI respondents were first asked if there were specific brands which would cause them to shop somewhere else if those brands were unavailable The respondents who answered lsquoYesrsquo were directed to a follow-up question asking which brands would prompt that response Those brands were determined to be ldquonon-negotiable brandsrdquo in the eyes of that consumer If a consumer leaves a store because that store doesnrsquot carry the brand they want the Brand Strength Report shows that as a leading indicator of brand value
Nike was the most non-negotiable brand with 20 percent of active consumers citing it Adidas moves up from fourth position in 2011 to second position in 2014 supplanting New Balance and leap-frogging Reebok Under Armour and Puma also rise substantially ranking in the Top 10 in 2014
Puma ranks in the top five non-negotiable brands among male active consumers while Skechers ranks in the top five for female active consumers however Skechers has fallen from second position among females in 2011 (at the height of impact of the Shape-Ups product) to fifth in 2014
Nike 20
Adidas 7
New Balance 4
Puma 2
Under Armour 2
ReebokRBK 2
Jordan 2
Asics 1
The North Face 1
Timberland 1
Brand Percentage
MALE FEMALE
NON-NEGOTIABLE BRANDS - BY GENDER
Nike 20
Adidas 5
Under Armour 4
New Balance 4
Skechers 4
ReebokRBK 2
Vans 2
The North Face 2
Jordan 2
Converse 2
Brand Percentage
Nike 20
Adidas 6
New Balance 4
Under Armour 3
Skechers 2
ReebokRBK 2
Puma 2
Jordan 2
The North Face 2
Vans 2
Brand Percentage
NON-NEGOTIABLE BRANDS - OVERALL
Non-Negotiable Brands
JUNE 2 2014 | SGBWeeklycom 21
Methodology
The Brand Strength Report compiled and presented by The SportsOneSource Group consumer research team was designed to gauge the strength of sporting goods brands in the overall US market Respondents were asked a variety of questions relating to brand perception and individual products pertaining to their sporting goodsrsquo purchases in the twelve months preceding the study which took place in March and April 2014
The 2014 Brand Strength Report focuses primarily on Footwear Apparel and Equipment brands across various segments of the sporting goods market including Outdoors and Sportsmanrsquos categories
To qualify for the Brand Strength Report each respondent must have purchased athletic footwear or apparel in the past year A total of 4201 responses were received providing detailed information on awareness levels purchasing trends and brand allegiance to more than 300 Athletic Outdoor and Sportsmanrsquos brands
The Brand Strength Report includes the responses from consumerrsquos age 13 and older all of who were surveyed through a third-party Internet panel provider The SportsOneSource Group made every effort to control the demographics to best represent the US population however as is the case with all Internet-based surveys the demographics and psychographics tend to skew toward older more affluent households
The results of the survey can be projected to the US population with a margin of error of +- 134 percent
Survey respondents were asked a series of questions to determine the strength of each brand The factors that were used to build the index are listed in order of importance
1 Non-Negotiable Brands2 Likelihood To Repurchase (on a scale of 1-to-5 with 1 meaning would not and 5 meaning definitely would)3 Unaided Awareness4 Aided Awareness
To qualify for the BSI a brand had to be purchased by a minimum number of respondents so that each answer did not over-represent the perceptions of the total population
FORMULATING THE BRAND STRENGTH INDEX
Gender
Male 50
Female 50
Mean Age 396
Age
13-17 10
18-34 37
35-54 33
55 and Older 20
Race
Non-Hispanic White 73
African-American 10
Hispanic 9
Asian 6
American Indian 1
Other 1
Marital Status
Married 64
Single 25
SeparatedDivorced 8
WidowedWidower 2
Prefer Not to Answer 1
KEY DEMOGRAPHICS
Employment Status
Full-time 52
Part-time 11
Self Employed 6
Unemployed 5
Retired 13
Student 4
Homemaker 9
Prefer Not to Answer 1
Household Income
Less than $40K 21
$40 - $60K 19
$60 - $80K 19
$80 - $100K 14
$100 - $149K 17
$150K+ 7
Prefer Not to Answer 4
US Region
Northeast 21
Midwest 24
South 32
West 23
22 SGBWeeklycom | JUNE 2 2014
JUNE 2 2014 | SGBWeeklycom 23
ldquoA brand for a company is like a reputation for a person You earn
reputation by trying to do hard things wellrdquo - JEFF BEZOS
BrandStrength
ReportComprehensive Nationwide Survey Brand Strength Index ListingIn-Depth Consumer Behavior Analysis Detailed Individual Brand Analysis Customizable Format
For inquiries or to customize your personal report contact Bethany Cooner Director Market Research
The SportsOneSource Group 3039977302 or BSRSportsOneSourcecom
BrandStrengthReportcom
2014
Pre-Order Your Copy
Today
TR
AD
E A
SS
OC
IAT
ION
S |
BU
YIN
G G
RO
UP
S
JUNE
11-12 Altanta Shoe Market Atlanta GA
17-19 Licensing International Expo Las Vegas NV
26-28 Sports Inc Summer Team Dealer Show Nashville TN
JULY
8-11 NBS Summer Market Austin TX
10-13 European Outdoor Trade Fair Friedrichshafen Germany
15-17 ASI Chicago Chicago IL
18-20 ADA Spring Show Reno Nevada
AUGUST
6-9 Outdoor Retailer Summer Market Salt Lake City UT
14-16 Sports Inc Outdoor Show Nashville TN
24 Tennis Industry Association The Tennis Show New York NY
SEPTEMBER
3-8 NBS Fall Semi - Annual Market Fort Worth Texas
4-6 Imprinted Sportswear Show (ISS) Orlando FL
10-12 Interbike International Trade Expo Las Vegas NV
16-17 SFIA Industry Leaders Summit Chicago IL
OCTOBER
7-9 OIA Rendezvous Asheville North Carolina
NOVEMBER
3-5 NBS Fall Athletic Market Ft Worth TX
15-16 ADA Fall Show Palm Springs California
23-25 Sports Inc Fall Team Dealer Show Las Vegas NV
Athletic Dealers of America1395 Highland AvenueMelbourne FL 32935t 3212540091f 3212427419athleticdealersofamericacom
National Shooting Sports FoundationFlintlock Ridge Office Center11 Mile Hill RoadNewtown CT 06470t 2034261320 f 2034261087nssforg
National Sporting Goods Association1601 Feehanville Drive Suite 300Mount Prospect IL 60056t 8472966742f 8473919827nsgaorg
Nationrsquos Best Sports4216 Hahn BlvdFt Worth TX 76117t 8177880034f 8177888542nbscom
Outdoor Industry Association4909 Pearl East Circle Suite 300Boulder CO 80301t 3034443353f 3034443284outdoorindustryorg
Sports amp Fitness Industry Association8505 Fenton St Suite 211Silver Spring MD 20910t 3014956321f 3014956322sfiaorg
Snow Sports Industries America8377-B Greensboro DriveMcLean VA 22102t 7035569020f 7038218276snowsportsorg
Sports Inc333 2nd Avenue NorthLewistown MT 59457t 4065383496f 4065382801sportsinccom
Sports Specialists Ltd590 Fishers Station Drive Suite 110Victor NY 14564t 5857421010f 5857422645sportsspecialistsltdcom
Team Athletic Goods629 Cepi DriveChesterfield MO 63005t 6365303710f 6365303711tag1com
Tennis Industry Association1 Corpus Christi Place Suite 117Hilton Head Island SC 29928t 8436863036f 8436863078tennisIndustryorg
Worldwide 8211 South 194thKent WA 98032t 2538728746f 2538727603wdi-wdicom
CALENDAR For full year calendar go to sportsonesourcecomeventsa
24 SGBWeeklycom | JUNE 2 2014
Access the weekly sales landscape of the outdoor industry and be outfitted with data to guide your companyrsquos strategic decisions with OIA VantagePointtrade The only weekly retail point-of-sale reporting platform exclusively for the active outdoor lifestyle industry We swiftly deliver critical trend and detailed business data to brands and retailers
START SEEING CLEARLY
SHARPEN YOUR PERSPECTIVE
OIAVantagePointcom bull oiavantagepointsportsonesourcecom bull 3039977302
Access the weekly sales landscape of the outdoor industry and be outfitted with data to guide your companyrsquos strategic decisions with OIA VantagePointtrade The only weekly retail point-of-sale reporting platform exclusively for the active outdoor lifestyle industry We swiftly deliver critical trend and detailed business data to brands and retailers
START SEEING CLEARLY
SHARPEN YOUR PERSPECTIVE
OIAVantagePointcom bull oiavantagepointsportsonesourcecom bull 3039977302
SportScanInfocomA Service of The SportsOneSource Group
ACHIEVE YOUR GOALS
SportScanInfo is the only weekly retail sales
trend reporting solution for the active lifestyle market
3039977302SportScanSportsOneSourcecom
BREADTH OF DATA DEPTH OF DATA TIMELINESS OF DATA
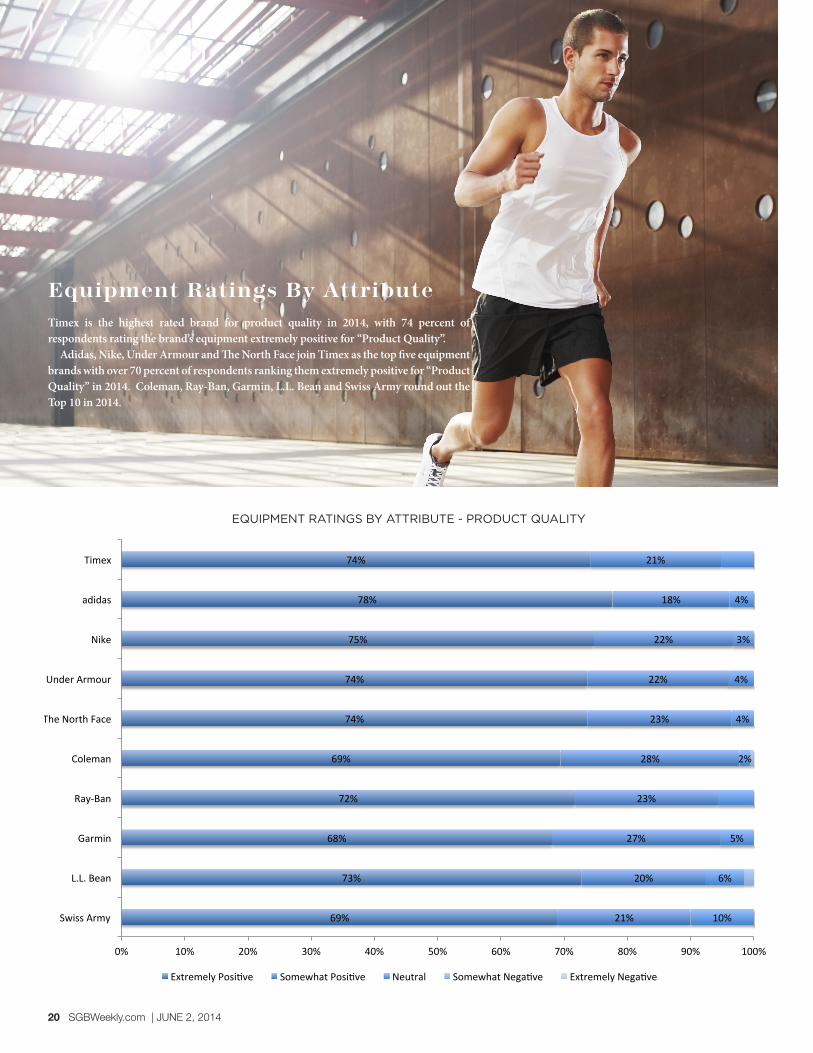
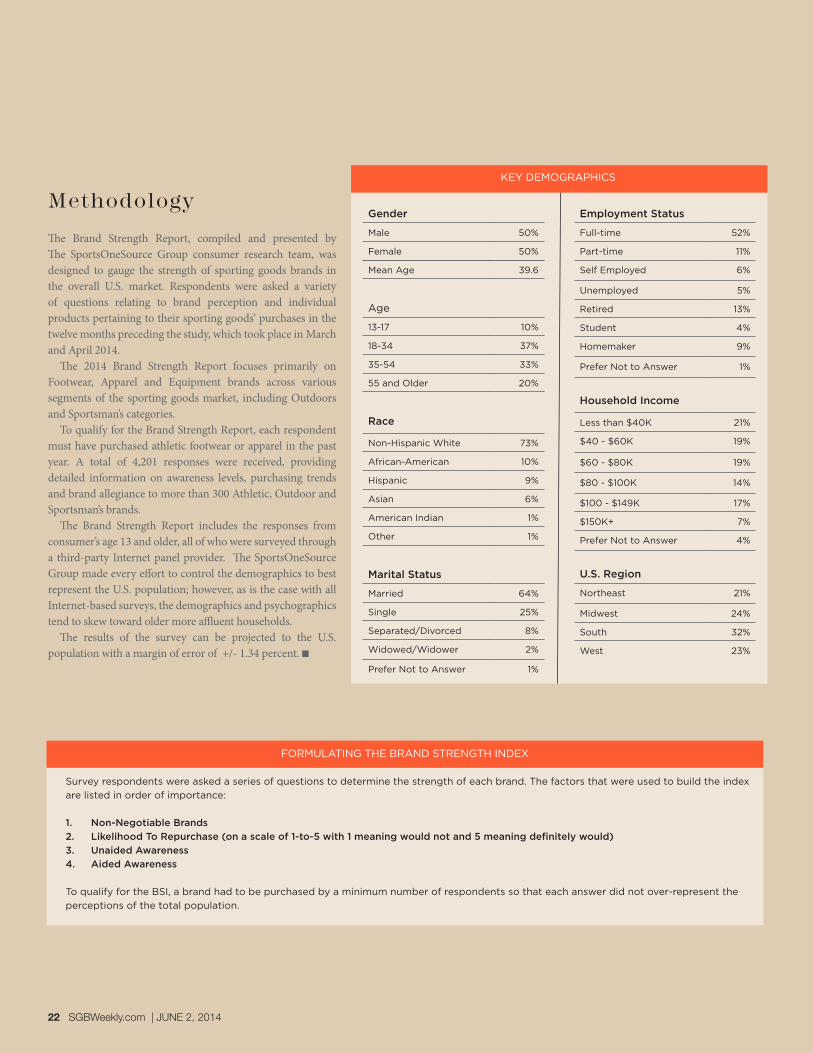
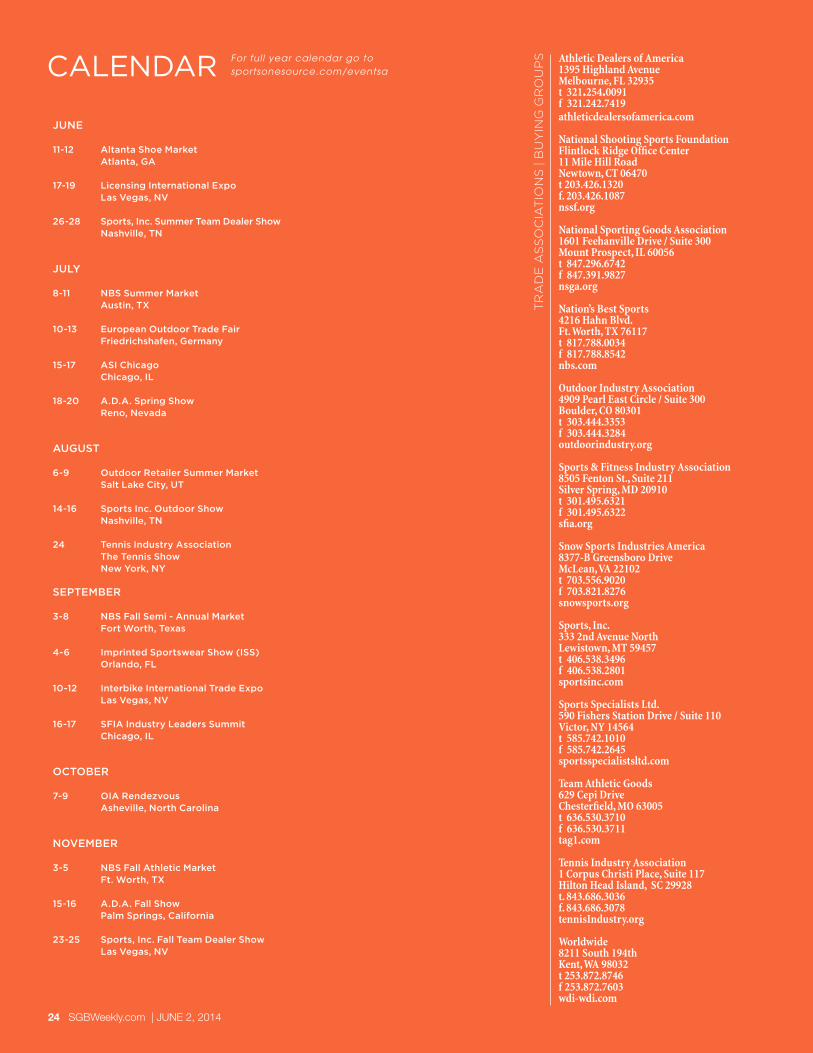
SportScanInfocomA Service of The SportsOneSource Group
ACHIEVE YOUR GOALS
SportScanInfo is the only weekly retail sales
trend reporting solution for the active lifestyle market
3039977302SportScanSportsOneSourcecom
BREADTH OF DATA DEPTH OF DATA TIMELINESS OF DATA