sgh ice momentum - equity trustees/media/equitytrustees/files/cts/... · 2015. 10. 27. · fy 2009...
TRANSCRIPT
1
SGH ICE – Momentum
* *** **
Callum Burns – Founder & Portfolio Manager
October 2015
SGH ICE
“Investing in more Certain Earnings growth”
3
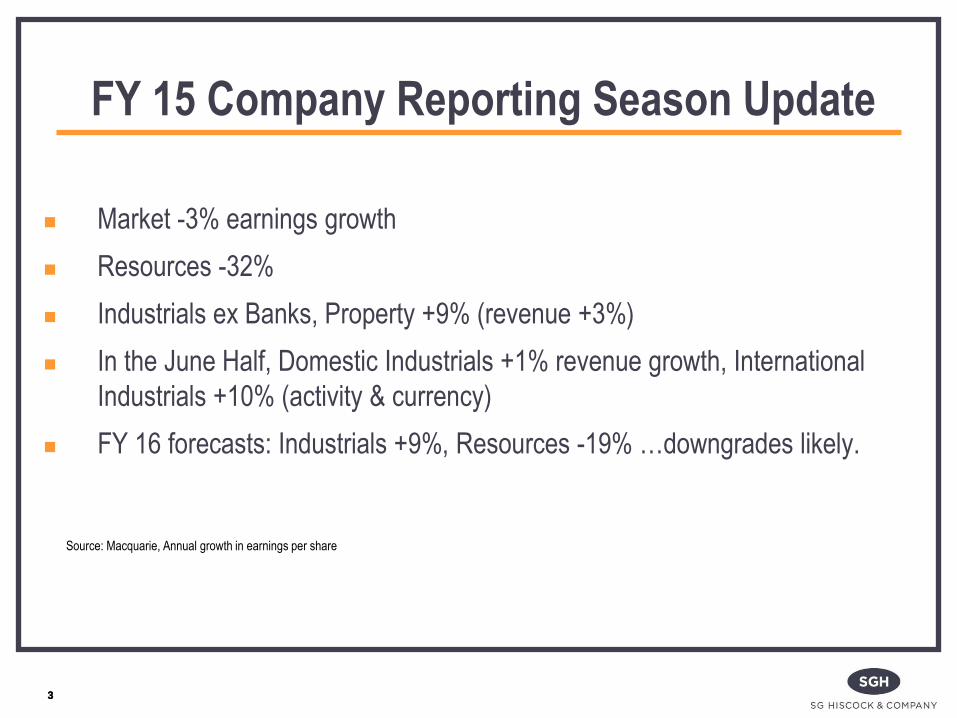
FY 15 Company Reporting Season Update
Market -3% earnings growth
Resources -32%
Industrials ex Banks, Property +9% (revenue +3%)
In the June Half, Domestic Industrials +1% revenue growth, International
Industrials +10% (activity & currency)
FY 16 forecasts: Industrials +9%, Resources -19% …downgrades likely.
3
Source: Macquarie, Annual growth in earnings per share
4 4
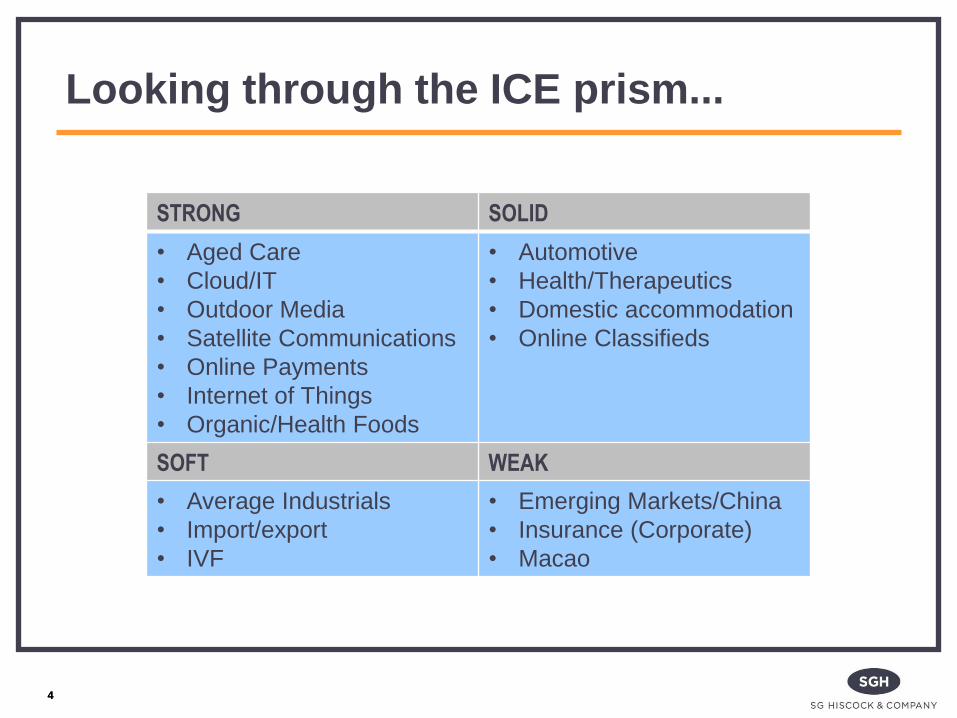
STRONG SOLID
• Aged Care
• Cloud/IT
• Outdoor Media
• Satellite Communications
• Online Payments
• Internet of Things
• Organic/Health Foods
• Automotive
• Health/Therapeutics
• Domestic accommodation
• Online Classifieds
SOFT WEAK
• Average Industrials
• Import/export
• IVF
• Emerging Markets/China
• Insurance (Corporate)
• Macao
Looking through the ICE prism...
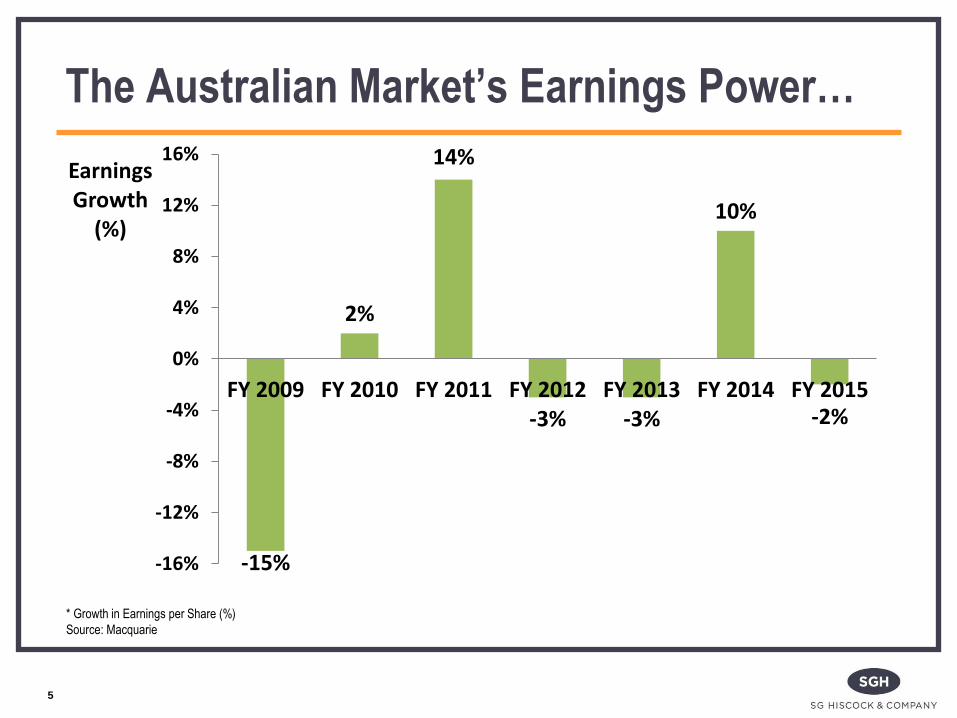
The Australian Market’s Earnings Power…
5
* Growth in Earnings per Share (%)
Source: Macquarie
-15%
2%
14%
-3% -3%
10%
-2%
-16%
-12%
-8%
-4%
0%
4%
8%
12%
16%
FY 2009 FY 2010 FY 2011 FY 2012 FY 2013 FY 2014 FY 2015
Earnings Growth
(%)
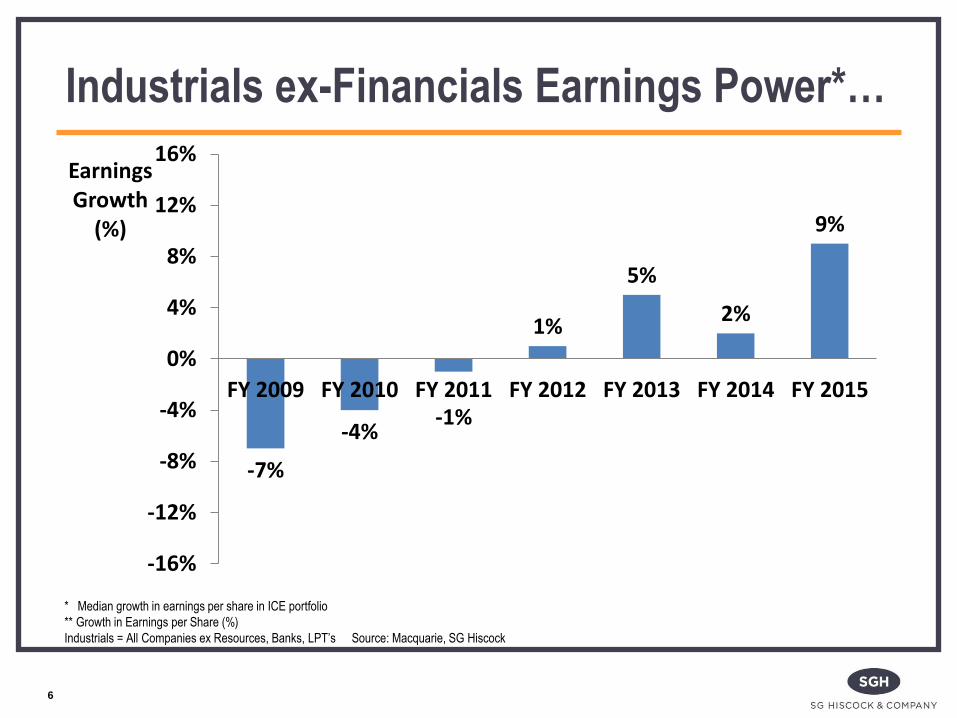
Industrials ex-Financials Earnings Power*…
6
* Median growth in earnings per share in ICE portfolio
** Growth in Earnings per Share (%)
Industrials = All Companies ex Resources, Banks, LPT’s Source: Macquarie, SG Hiscock
-7%
-4% -1%
1%
5%
2%
9%
-16%
-12%
-8%
-4%
0%
4%
8%
12%
16%
FY 2009 FY 2010 FY 2011 FY 2012 FY 2013 FY 2014 FY 2015
Earnings Growth
(%)
7
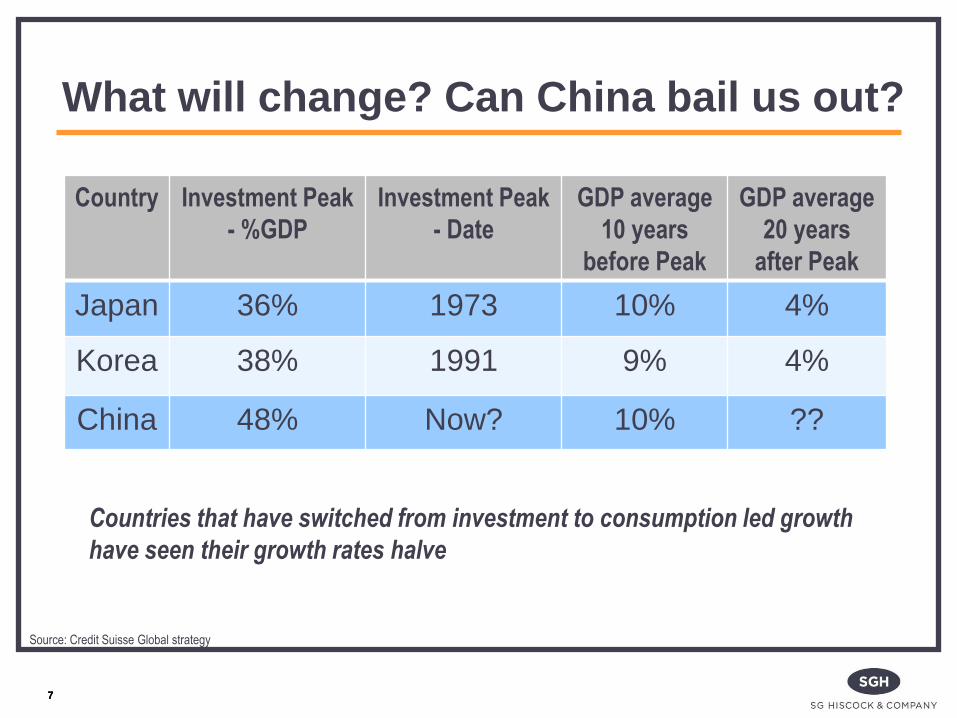
What will change? Can China bail us out?
7
Country Investment Peak
- %GDP
Investment Peak
- Date
GDP average
10 years
before Peak
GDP average
20 years
after Peak
Japan 36% 1973 10% 4%
Korea 38% 1991 9% 4%
China 48% Now? 10% ??
Countries that have switched from investment to consumption led growth
have seen their growth rates halve
Source: Credit Suisse Global strategy
8
Can China bail us out? No-one knows…
8
No-one knows…it may but
is it wise to rely on it?
9
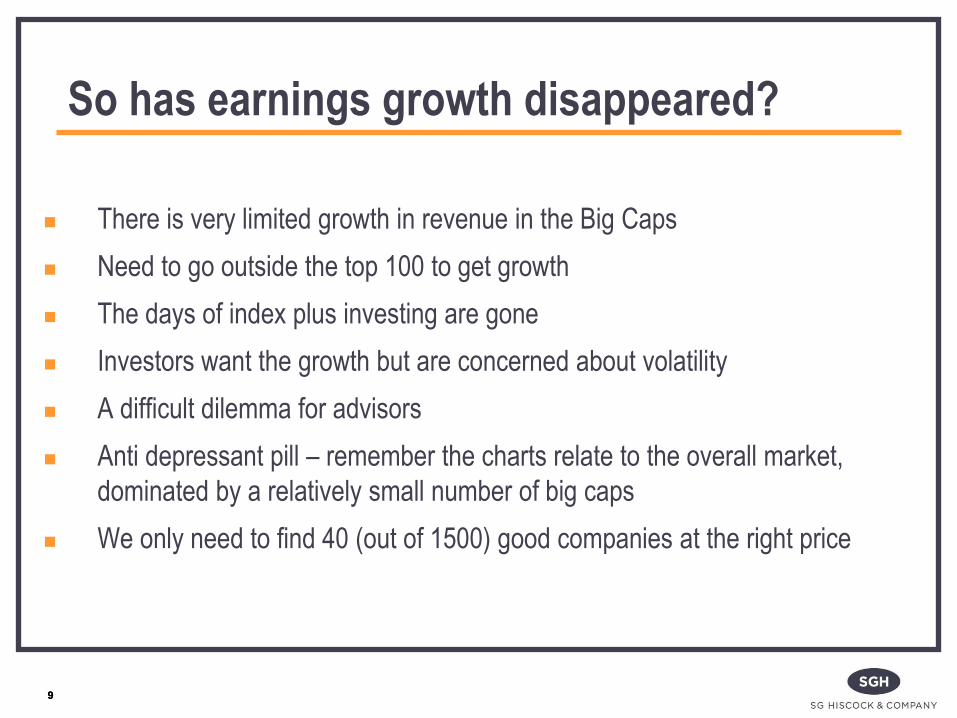
So has earnings growth disappeared?
There is very limited growth in revenue in the Big Caps
Need to go outside the top 100 to get growth
The days of index plus investing are gone
Investors want the growth but are concerned about volatility
A difficult dilemma for advisors
Anti depressant pill – remember the charts relate to the overall market,
dominated by a relatively small number of big caps
We only need to find 40 (out of 1500) good companies at the right price
9
10
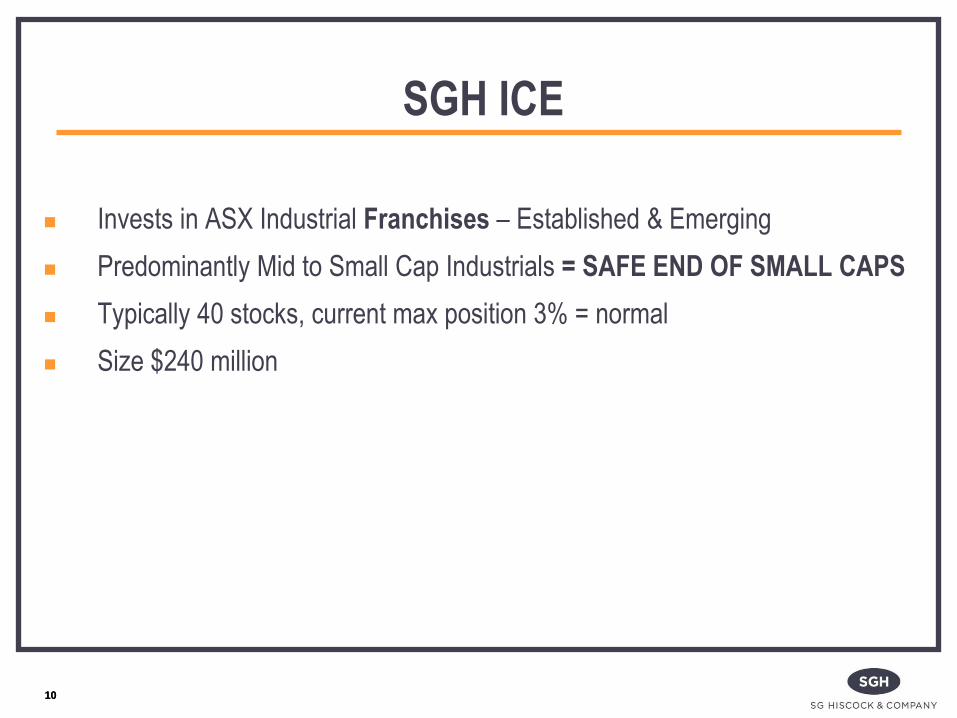
SGH ICE
Invests in ASX Industrial Franchises – Established & Emerging
Predominantly Mid to Small Cap Industrials = SAFE END OF SMALL CAPS
Typically 40 stocks, current max position 3% = normal
Size $240 million
10
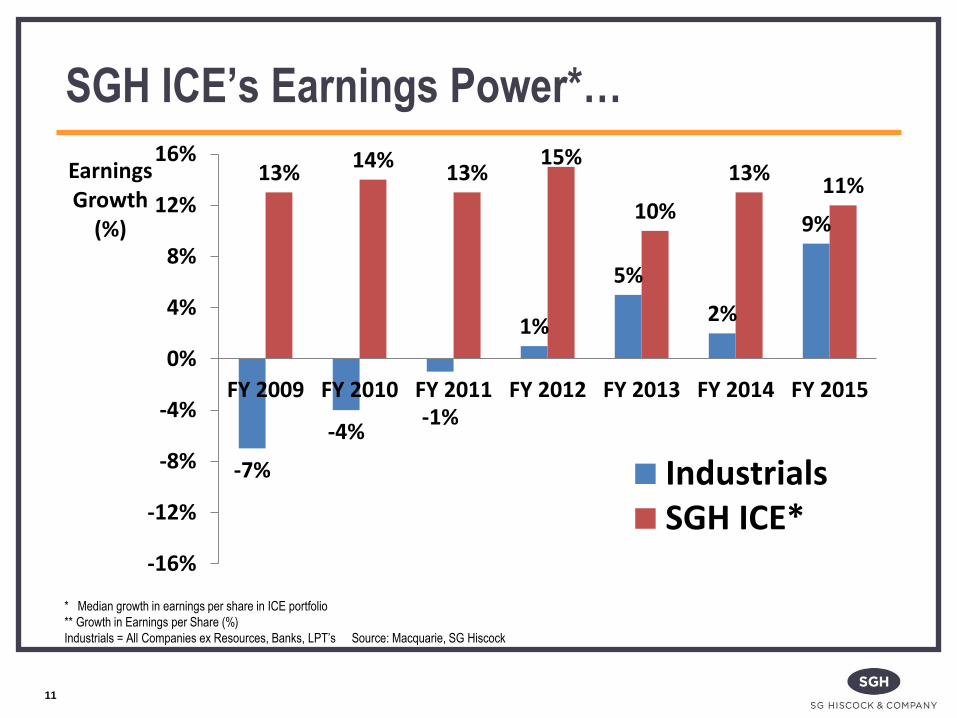
SGH ICE’s Earnings Power*…
11
* Median growth in earnings per share in ICE portfolio
** Growth in Earnings per Share (%)
Industrials = All Companies ex Resources, Banks, LPT’s Source: Macquarie, SG Hiscock
-7%
-4% -1%
1%
5%
2%
9%
13% 14%
13% 15%
10%
13% 11%
-16%
-12%
-8%
-4%
0%
4%
8%
12%
16%
FY 2009 FY 2010 FY 2011 FY 2012 FY 2013 FY 2014 FY 2015
Earnings Growth
(%)
IndustrialsSGH ICE*
=EARNINGS POWER
12
SGH ICE Business Franchise
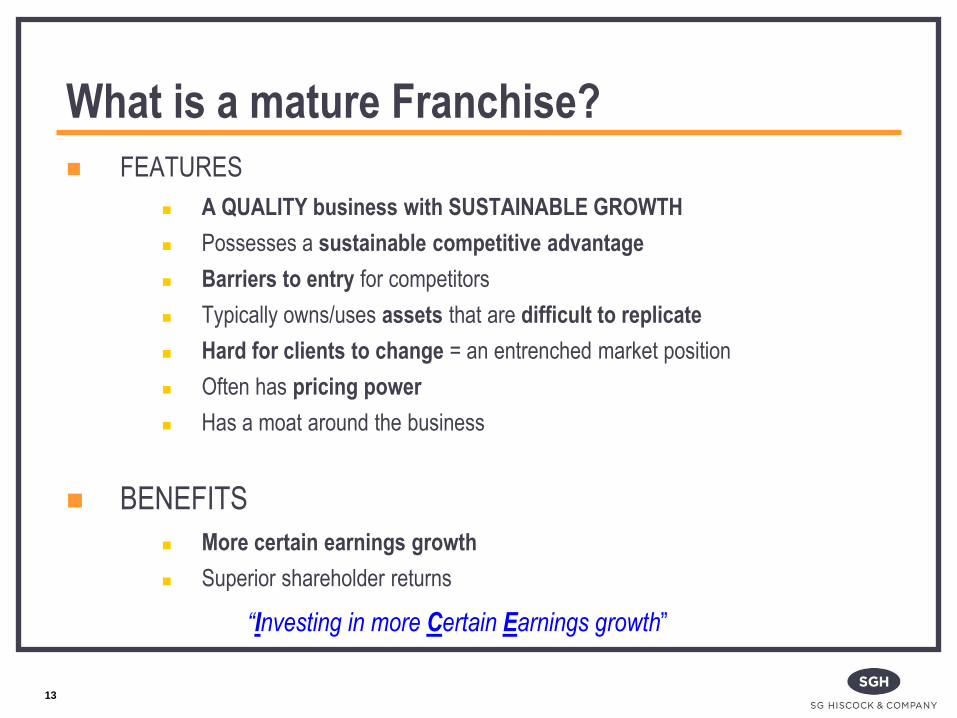
What is a mature Franchise?
FEATURES
A QUALITY business with SUSTAINABLE GROWTH
Possesses a sustainable competitive advantage
Barriers to entry for competitors
Typically owns/uses assets that are difficult to replicate
Hard for clients to change = an entrenched market position
Often has pricing power
Has a moat around the business
BENEFITS
More certain earnings growth
Superior shareholder returns
13
“Investing in more Certain Earnings growth”
14
Examples of franchises
14
Investment Decision Process
16
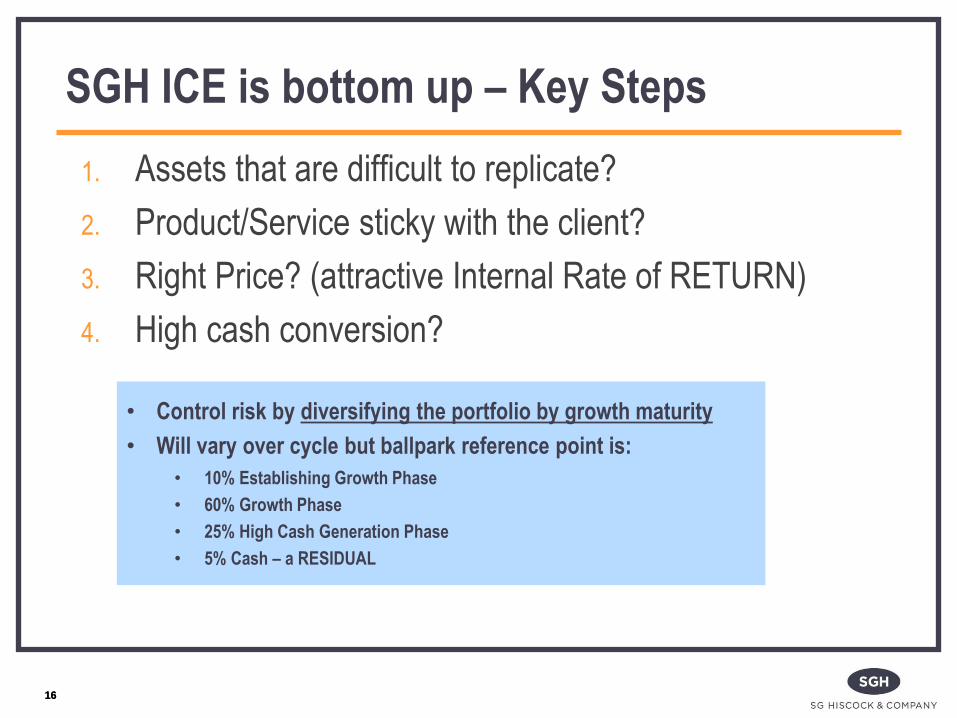
SGH ICE is bottom up – Key Steps
1. Assets that are difficult to replicate?
2. Product/Service sticky with the client?
3. Right Price? (attractive Internal Rate of RETURN)
4. High cash conversion?
• Control risk by diversifying the portfolio by growth maturity
• Will vary over cycle but ballpark reference point is:
• 10% Establishing Growth Phase
• 60% Growth Phase
• 25% High Cash Generation Phase
• 5% Cash – a RESIDUAL
16
17
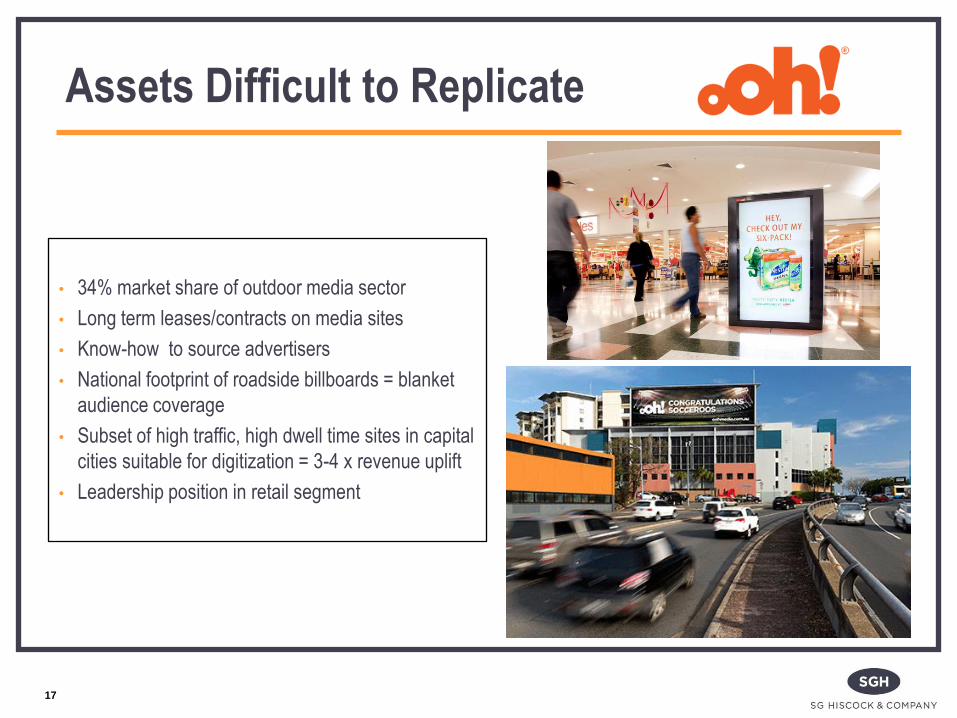
• 34% market share of outdoor media sector
• Long term leases/contracts on media sites
• Know-how to source advertisers
• National footprint of roadside billboards = blanket
audience coverage
• Subset of high traffic, high dwell time sites in capital
cities suitable for digitization = 3-4 x revenue uplift
• Leadership position in retail segment
Assets Difficult to Replicate
• Outdoor now one of the only categories of media
with broad/national audience reach
• Digitisation of outdoor allows the advertiser to more
effectively reach its audience
• If you want that location you have to deal withOoh
* As at 28 September 2015
18
Sticky Customers
• IRR Valuation = 11 -14%
• Digital conversions offer 3-4x revenue uplifts,
rents not kept pace yet.
19
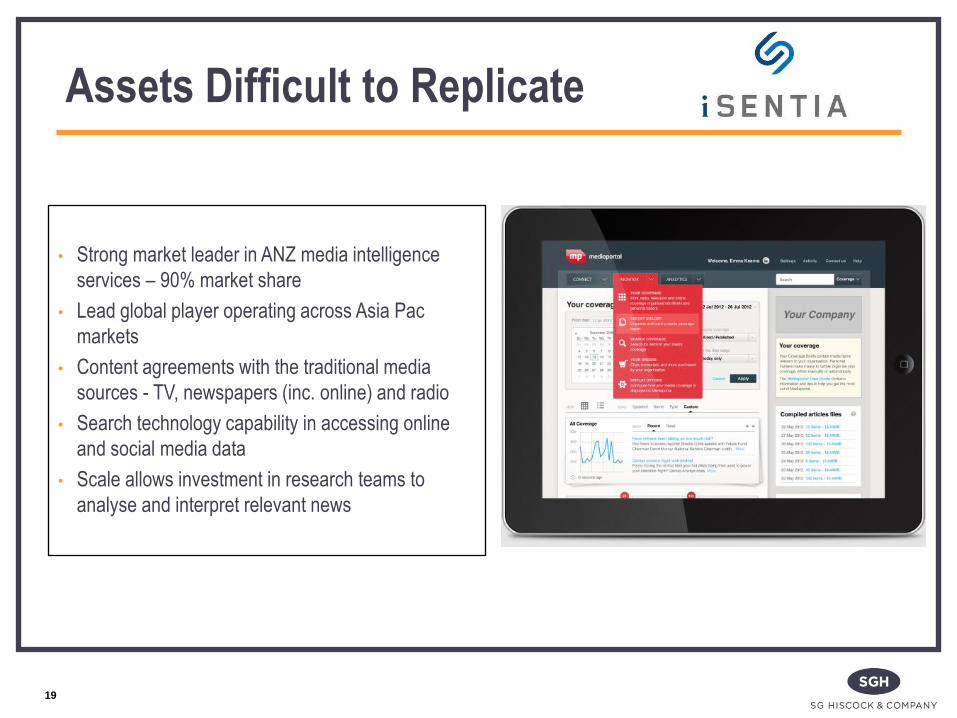
• Strong market leader in ANZ media intelligence
services – 90% market share
• Lead global player operating across Asia Pac
markets
• Content agreements with the traditional media
sources - TV, newspapers (inc. online) and radio
• Search technology capability in accessing online
and social media data
• Scale allows investment in research teams to
analyse and interpret relevant news
Assets Difficult to Replicate
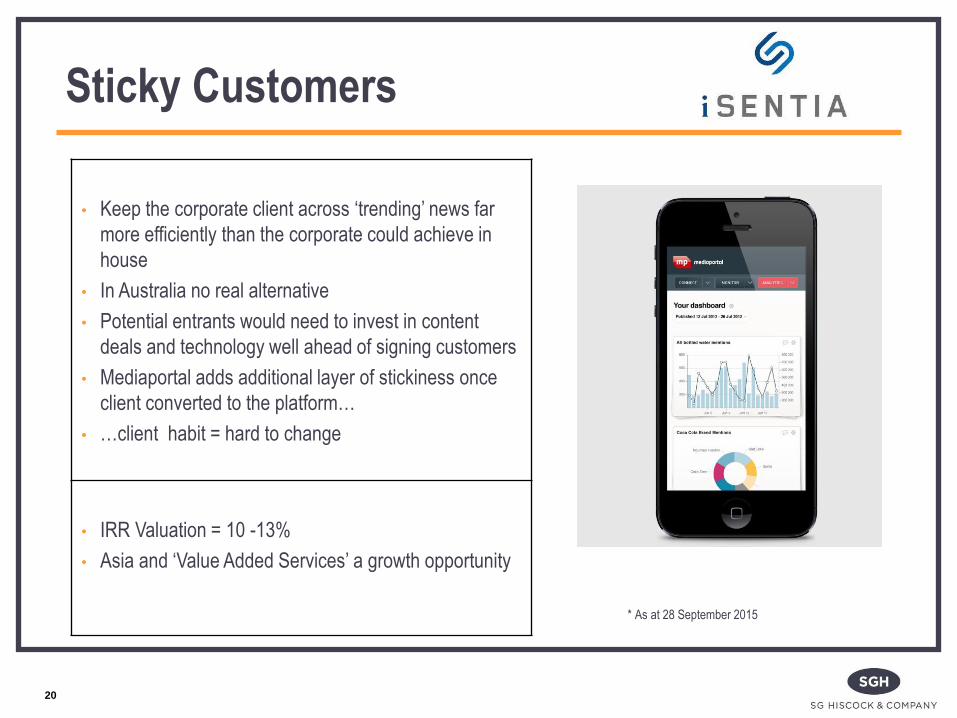
• Keep the corporate client across ‘trending’ news far
more efficiently than the corporate could achieve in
house
• In Australia no real alternative
• Potential entrants would need to invest in content
deals and technology well ahead of signing customers
• Mediaportal adds additional layer of stickiness once
client converted to the platform…
• …client habit = hard to change
• IRR Valuation = 10 -13%
• Asia and ‘Value Added Services’ a growth opportunity
* As at 28 September 2015
20
Sticky Customers
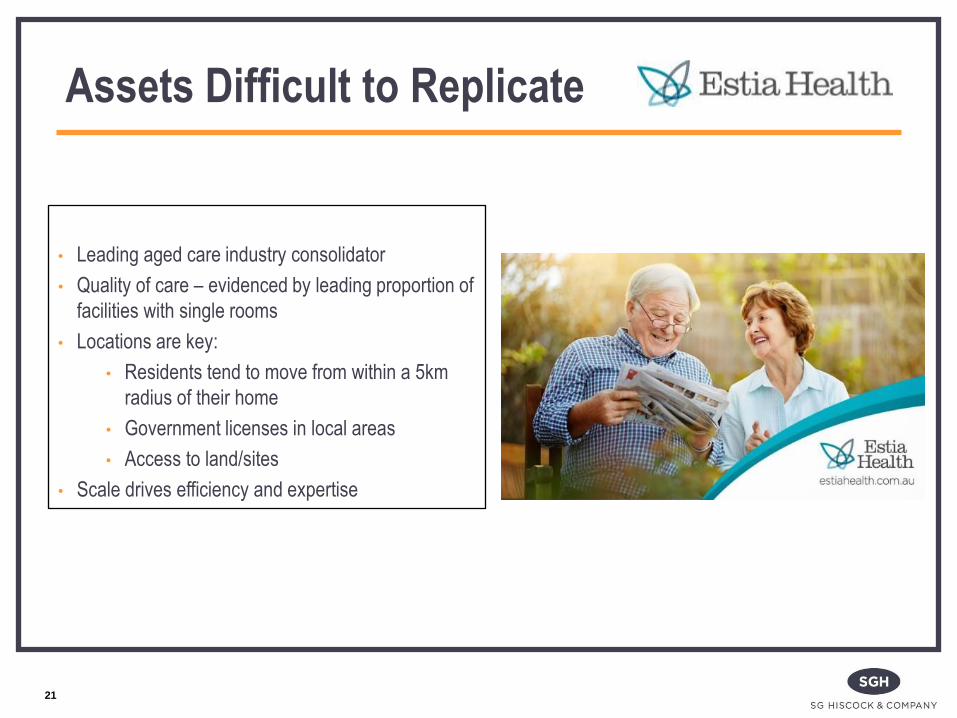
21
• Leading aged care industry consolidator
• Quality of care – evidenced by leading proportion of
facilities with single rooms
• Locations are key:
• Residents tend to move from within a 5km
radius of their home
• Government licenses in local areas
• Access to land/sites
• Scale drives efficiency and expertise
Assets Difficult to Replicate
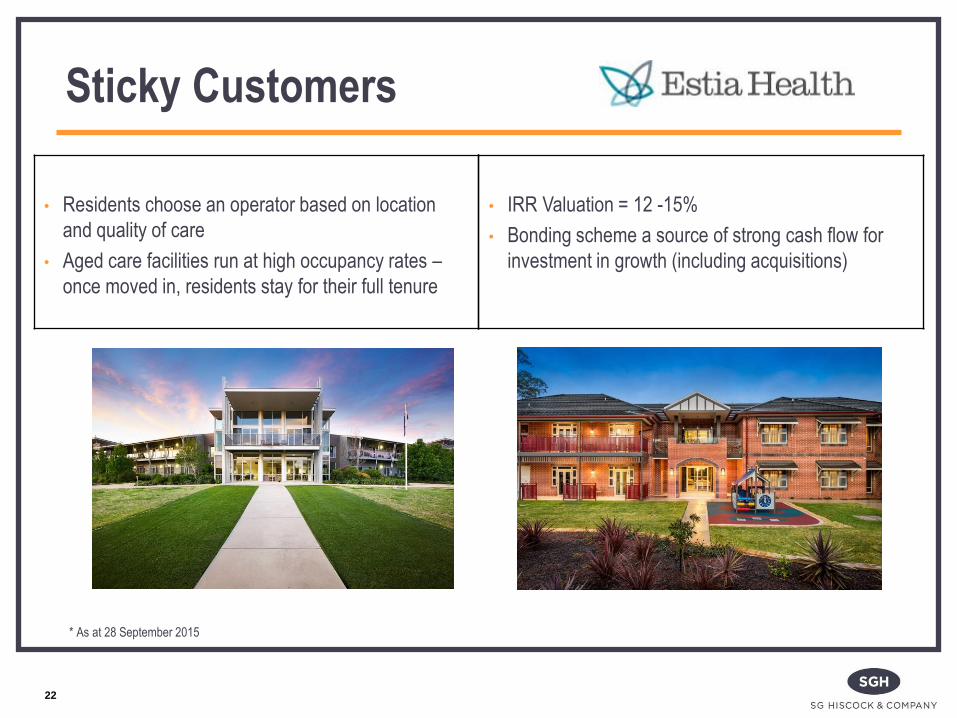
• Residents choose an operator based on location
and quality of care
• Aged care facilities run at high occupancy rates –
once moved in, residents stay for their full tenure
* As at 28 September 2015
22
Sticky Customers
• IRR Valuation = 12 -15%
• Bonding scheme a source of strong cash flow for
investment in growth (including acquisitions)
23
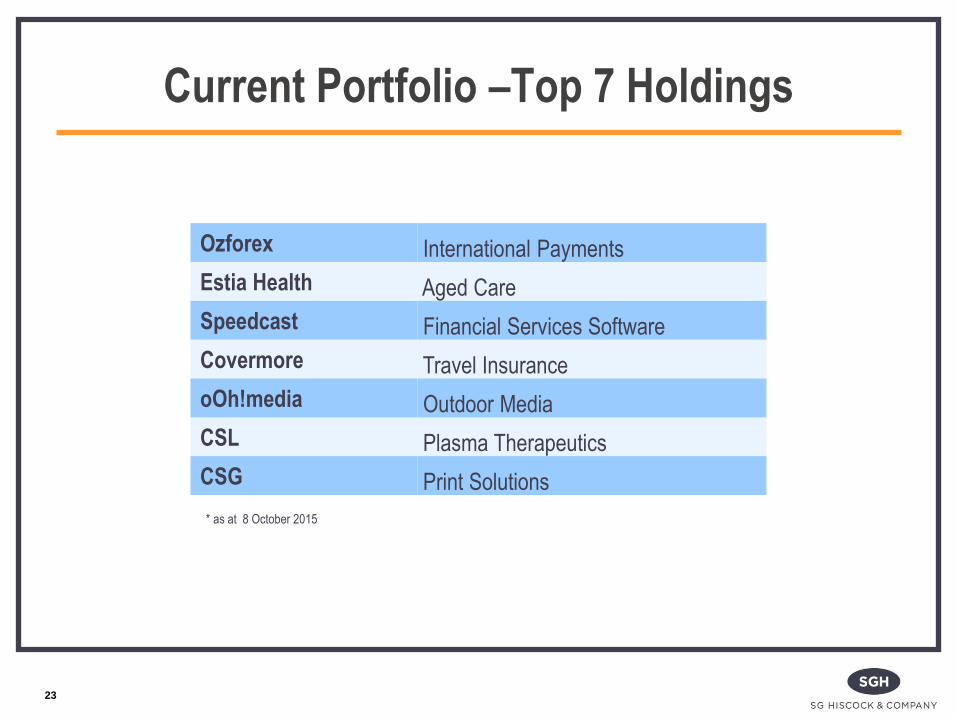
Current Portfolio –Top 7 Holdings
Ozforex International Payments
Estia Health Aged Care
Speedcast Financial Services Software
Covermore Travel Insurance
oOh!media Outdoor Media
CSL Plasma Therapeutics
CSG Print Solutions
* as at 8 October 2015
Performance
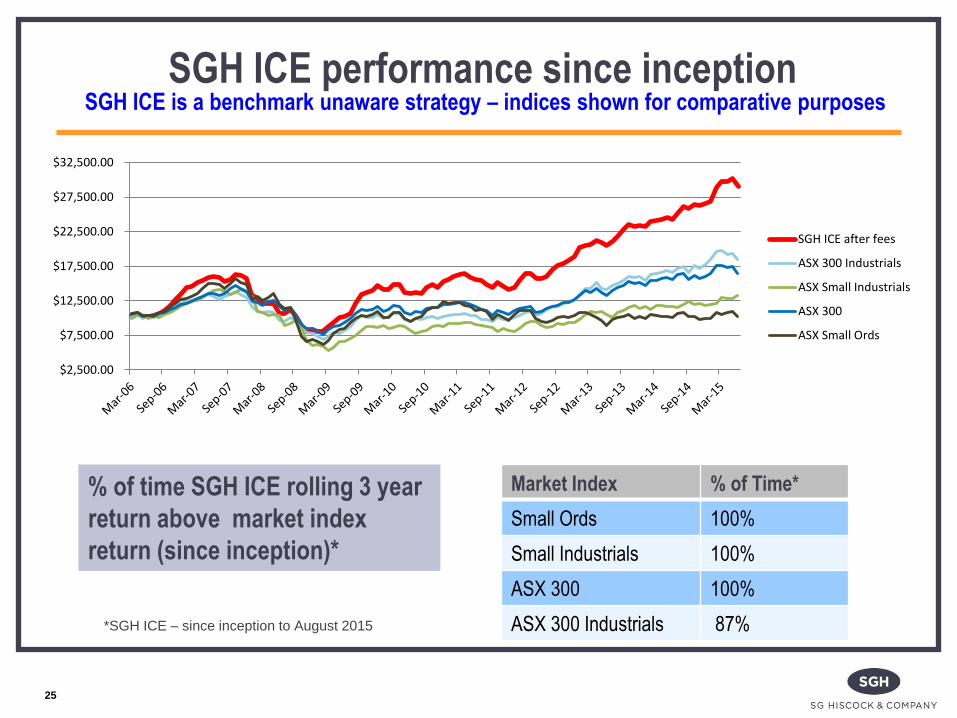
SGH ICE performance since inception SGH ICE is a benchmark unaware strategy – indices shown for comparative purposes
*SGH ICE – since inception to August 2015
25
$2,500.00
$7,500.00
$12,500.00
$17,500.00
$22,500.00
$27,500.00
$32,500.00
SGH ICE after fees
ASX 300 Industrials
ASX Small Industrials
ASX 300
ASX Small Ords
% of time SGH ICE rolling 3 year
return above market index
return (since inception)*
Market Index % of Time*
Small Ords 100%
Small Industrials 100%
ASX 300 100%
ASX 300 Industrials 87%
26
1 mth
(%) 1 year
(%)
2 years (%) pa
3 years (%) pa
5 years (%) pa
7 years (%) pa
Since
Inception
(%) pa
Feb 2006
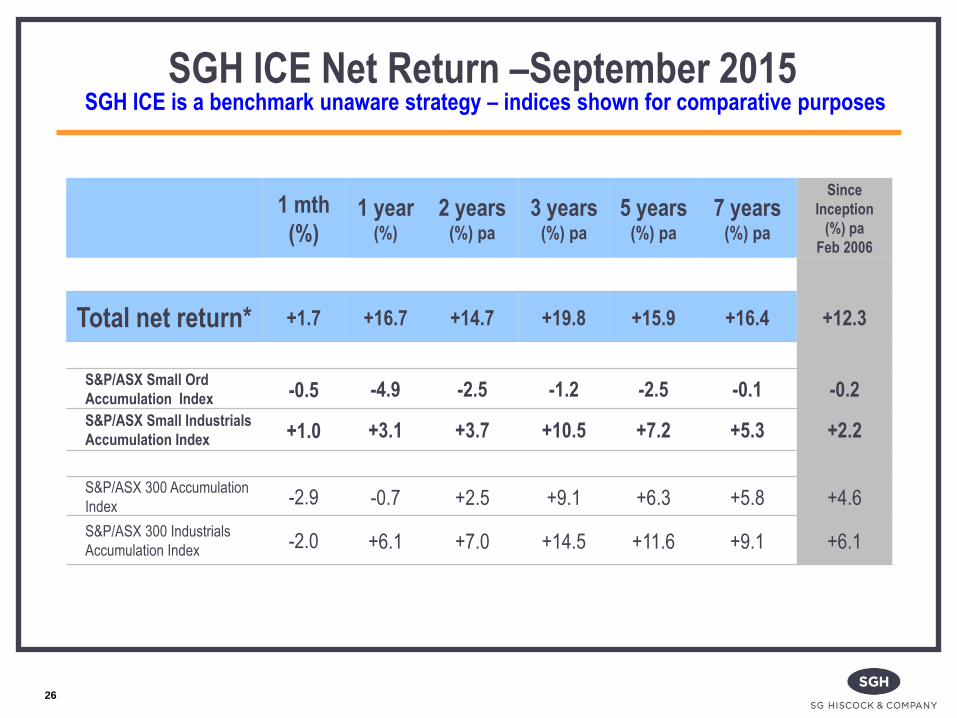
Total net return* +1.7 +16.7 +14.7 +19.8 +15.9 +16.4 +12.3
S&P/ASX Small Ord
Accumulation Index -0.5 -4.9 -2.5 -1.2 -2.5 -0.1 -0.2
S&P/ASX Small Industrials
Accumulation Index +1.0 +3.1 +3.7 +10.5 +7.2 +5.3 +2.2
S&P/ASX 300 Accumulation
Index -2.9 -0.7 +2.5 +9.1 +6.3 +5.8 +4.6
S&P/ASX 300 Industrials
Accumulation Index -2.0 +6.1 +7.0 +14.5 +11.6 +9.1 +6.1
SGH ICE Net Return –September 2015 SGH ICE is a benchmark unaware strategy – indices shown for comparative purposes
Relative
Performance* vs
1 mth (%)
1 year (%)
2 years (%) pa
3 years (%) pa
5 years (%) pa
7 years (%) pa
Since Inception
(%) pa
Feb 2006
S&P/ASX Small Ord
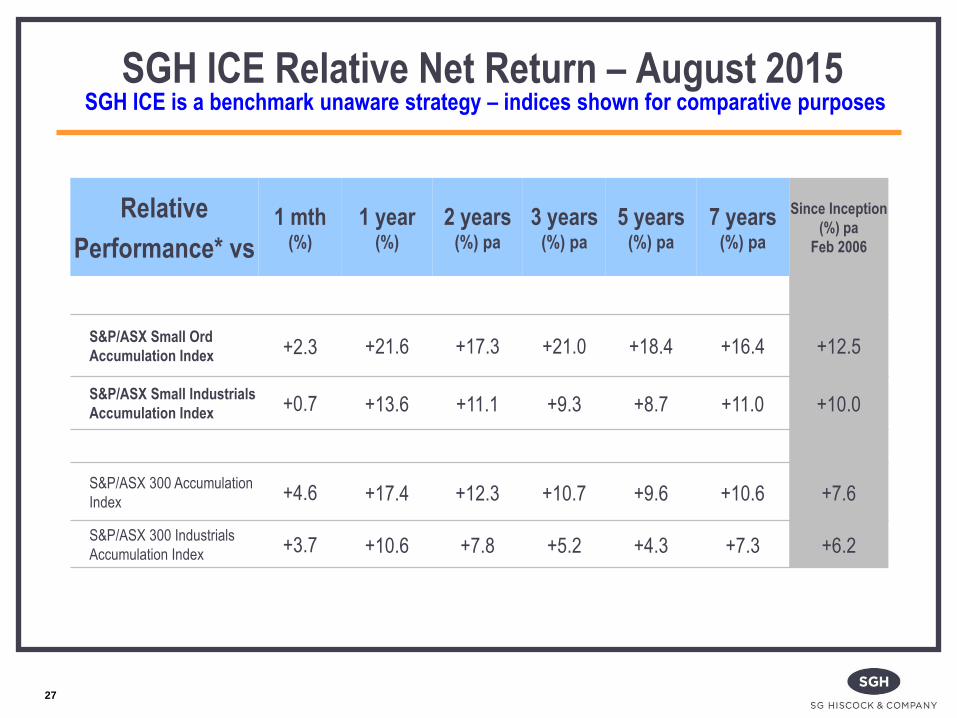
Accumulation Index +2.3 +21.6 +17.3 +21.0 +18.4 +16.4 +12.5
S&P/ASX Small Industrials
Accumulation Index +0.7 +13.6 +11.1 +9.3 +8.7 +11.0 +10.0
S&P/ASX 300 Accumulation
Index +4.6 +17.4 +12.3 +10.7 +9.6 +10.6 +7.6
S&P/ASX 300 Industrials
Accumulation Index +3.7 +10.6 +7.8 +5.2 +4.3 +7.3 +6.2
27
SGH ICE Relative Net Return – August 2015 SGH ICE is a benchmark unaware strategy – indices shown for comparative purposes
28
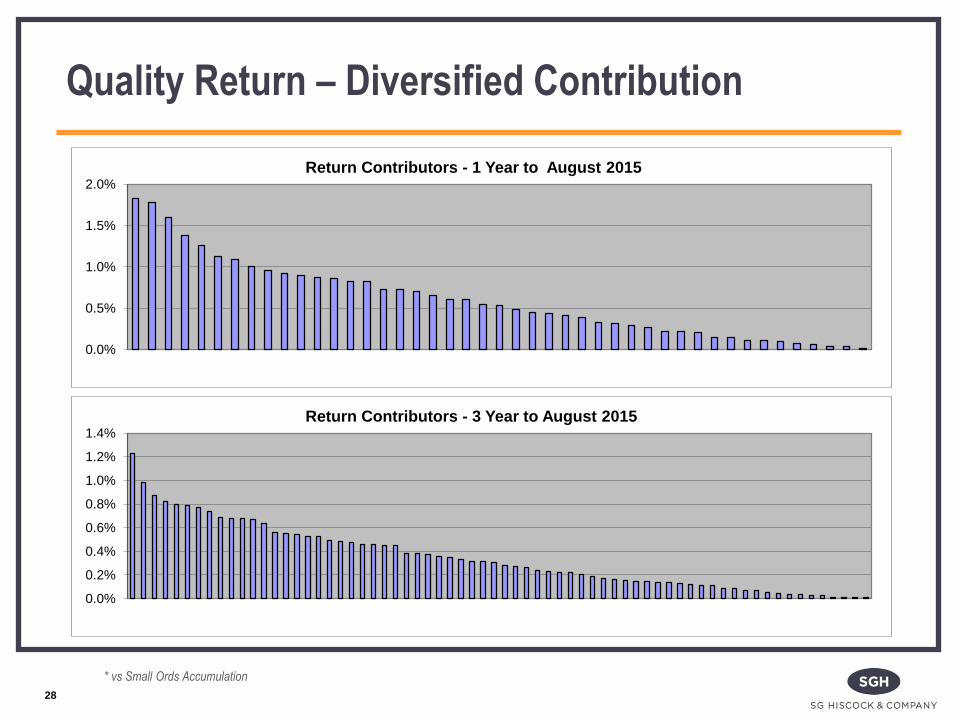
Quality Return – Diversified Contribution
* vs Small Ords Accumulation
0.0%
0.5%
1.0%
1.5%
2.0%
Return Contributors - 1 Year to August 2015
0.0%
0.2%
0.4%
0.6%
0.8%
1.0%
1.2%
1.4%
Return Contributors - 3 Year to August 2015
Source: Morningstar Direct, updated August 2015
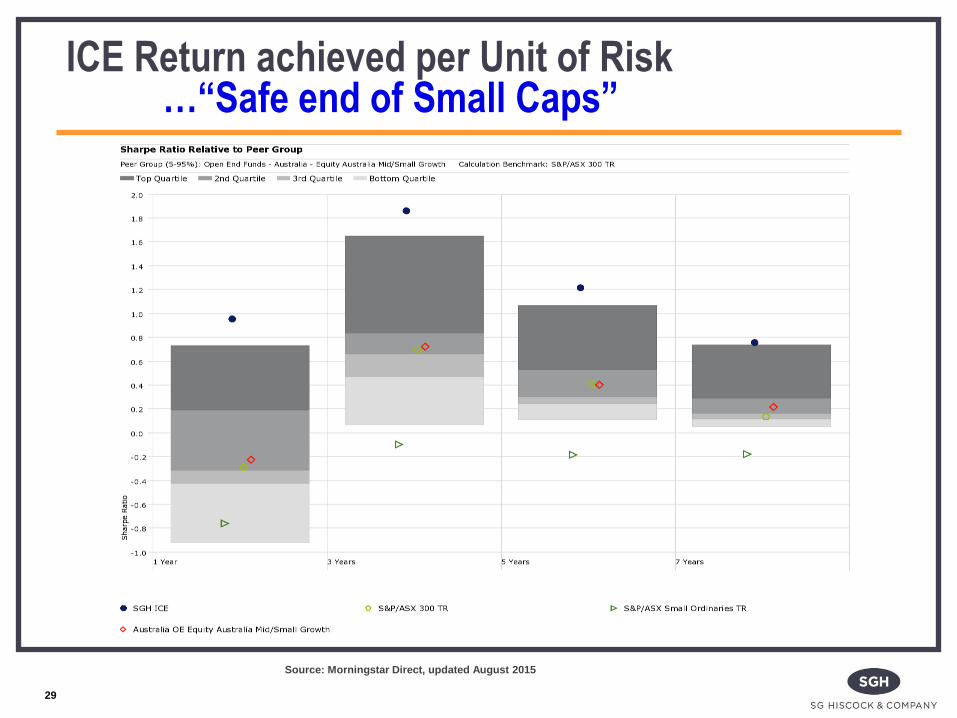
ICE Return achieved per Unit of Risk …“Safe end of Small Caps”
29
Source: Morningstar Direct, updated August 2015
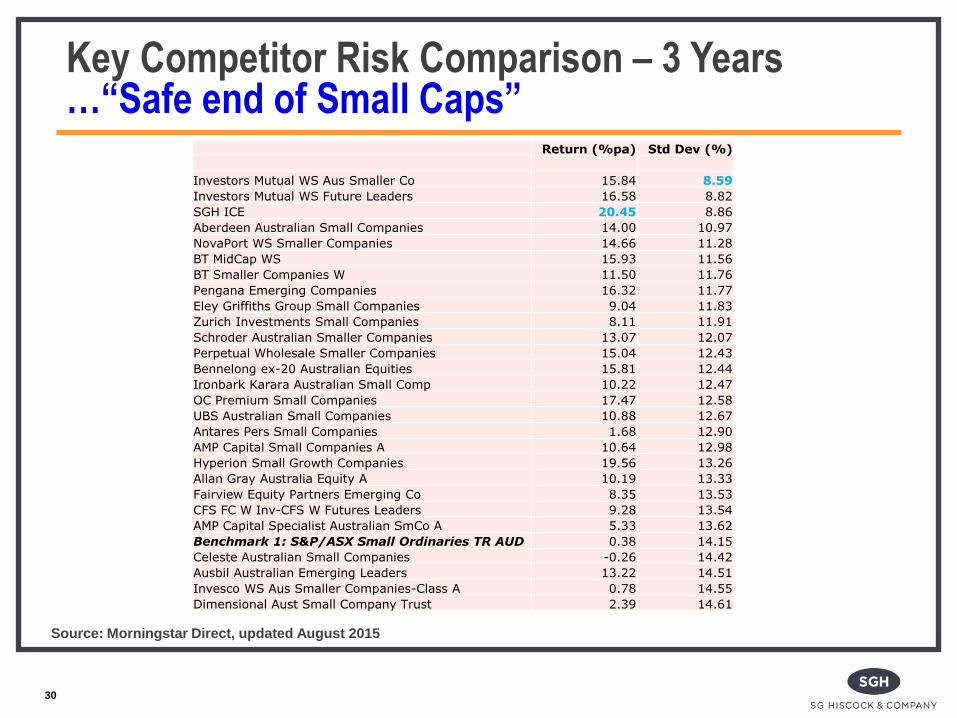
Key Competitor Risk Comparison – 3 Years …“Safe end of Small Caps” Return (%pa) Std Dev (%)
Investors Mutual WS Aus Smaller Co 15.84 8.59
Investors Mutual WS Future Leaders 16.58 8.82
SGH ICE 20.45 8.86
Aberdeen Australian Small Companies 14.00 10.97
NovaPort WS Smaller Companies 14.66 11.28
BT MidCap WS 15.93 11.56
BT Smaller Companies W 11.50 11.76
Pengana Emerging Companies 16.32 11.77
Eley Griffiths Group Small Companies 9.04 11.83
Zurich Investments Small Companies 8.11 11.91
Schroder Australian Smaller Companies 13.07 12.07
Perpetual Wholesale Smaller Companies 15.04 12.43
Bennelong ex-20 Australian Equities 15.81 12.44
Ironbark Karara Australian Small Comp 10.22 12.47
OC Premium Small Companies 17.47 12.58
UBS Australian Small Companies 10.88 12.67
Antares Pers Small Companies 1.68 12.90
AMP Capital Small Companies A 10.64 12.98
Hyperion Small Growth Companies 19.56 13.26
Allan Gray Australia Equity A 10.19 13.33
Fairview Equity Partners Emerging Co 8.35 13.53
CFS FC W Inv-CFS W Futures Leaders 9.28 13.54
AMP Capital Specialist Australian SmCo A 5.33 13.62
Benchmark 1: S&P/ASX Small Ordinaries TR AUD 0.38 14.15
Celeste Australian Small Companies -0.26 14.42
Ausbil Australian Emerging Leaders 13.22 14.51
Invesco WS Aus Smaller Companies-Class A 0.78 14.55
Dimensional Aust Small Company Trust 2.39 14.61
30
KEY DIFFERENTIATORS
Franchise style in Australian/NZ Equities
Focus on business model attributes
Ability to assess customer stickiness
Earnings certainty
Strong performance – absolute & risk adjusted
Look through earnings stream of SGH ICE portfolio is different = good for blending/diversification
Safe end of small caps – low volatility compared to small cap peers
31
Appendix
32
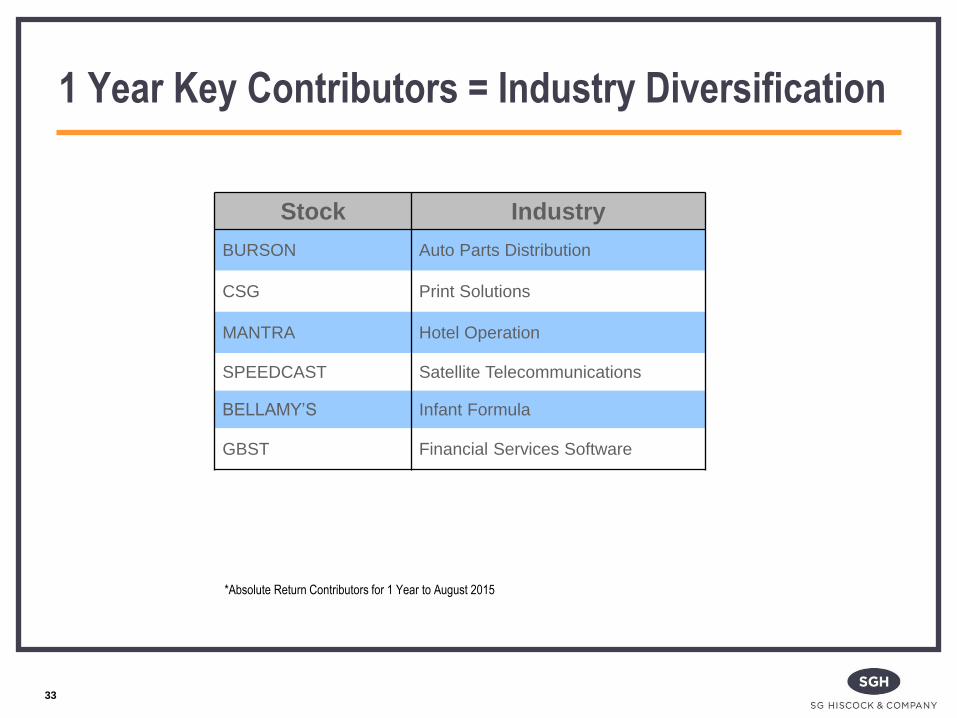
1 Year Key Contributors = Industry Diversification
33
Stock Industry
BURSON Auto Parts Distribution
CSG Print Solutions
MANTRA Hotel Operation
SPEEDCAST Satellite Telecommunications
BELLAMY’S Infant Formula
GBST Financial Services Software
*Absolute Return Contributors for 1 Year to August 2015
34
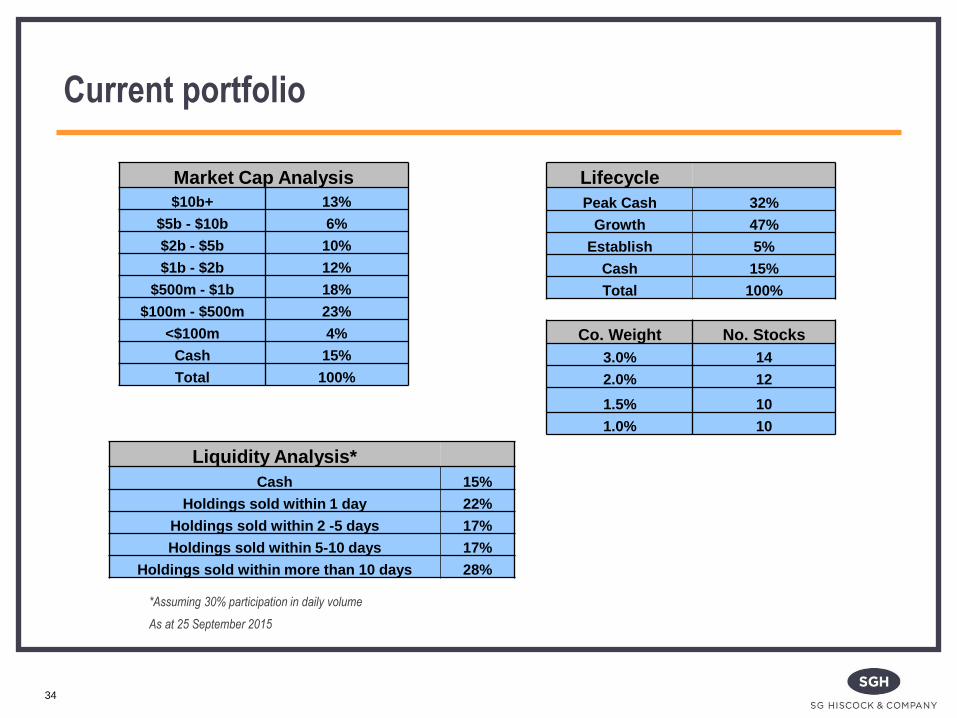
Current portfolio
*Assuming 30% participation in daily volume
As at 25 September 2015
Market Cap Analysis
$10b+ 13%
$5b - $10b 6%
$2b - $5b 10%
$1b - $2b 12%
$500m - $1b 18%
$100m - $500m 23%
<$100m 4%
Cash 15%
Total 100%
Liquidity Analysis*
Cash 15%
Holdings sold within 1 day 22%
Holdings sold within 2 -5 days 17%
Holdings sold within 5-10 days 17%
Holdings sold within more than 10 days 28%
Lifecycle
Peak Cash 32%
Growth 47%
Establish 5%
Cash 15%
Total 100%
Co. Weight No. Stocks
3.0% 14
2.0% 12
1.5% 10
1.0% 10
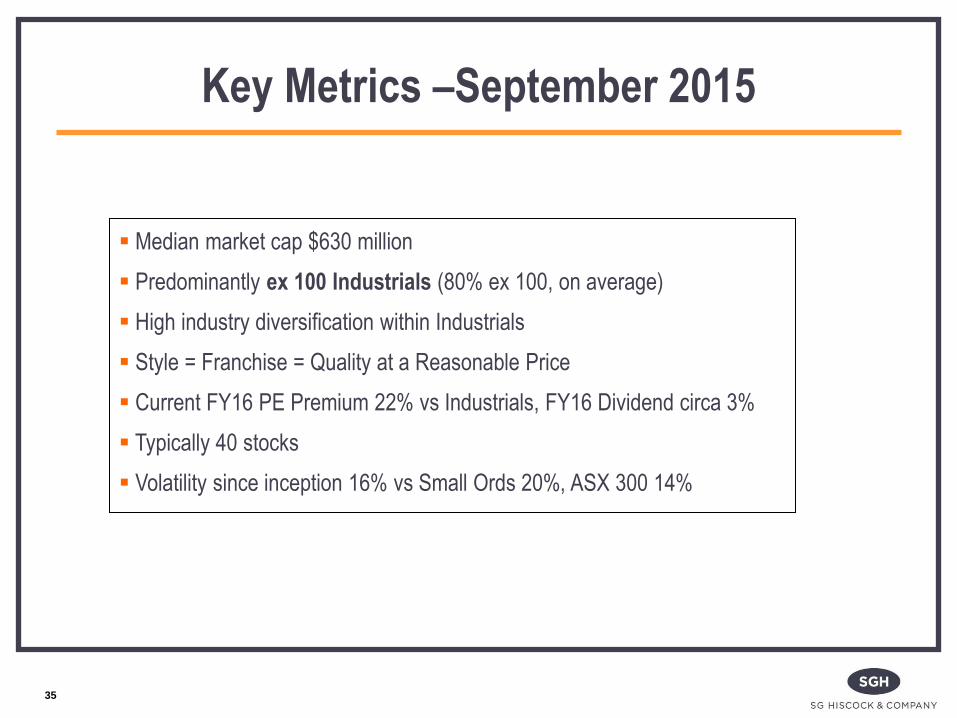
Median market cap $630 million
Predominantly ex 100 Industrials (80% ex 100, on average)
High industry diversification within Industrials
Style = Franchise = Quality at a Reasonable Price
Current FY16 PE Premium 22% vs Industrials, FY16 Dividend circa 3%
Typically 40 stocks
Volatility since inception 16% vs Small Ords 20%, ASX 300 14%
35
Key Metrics –September 2015
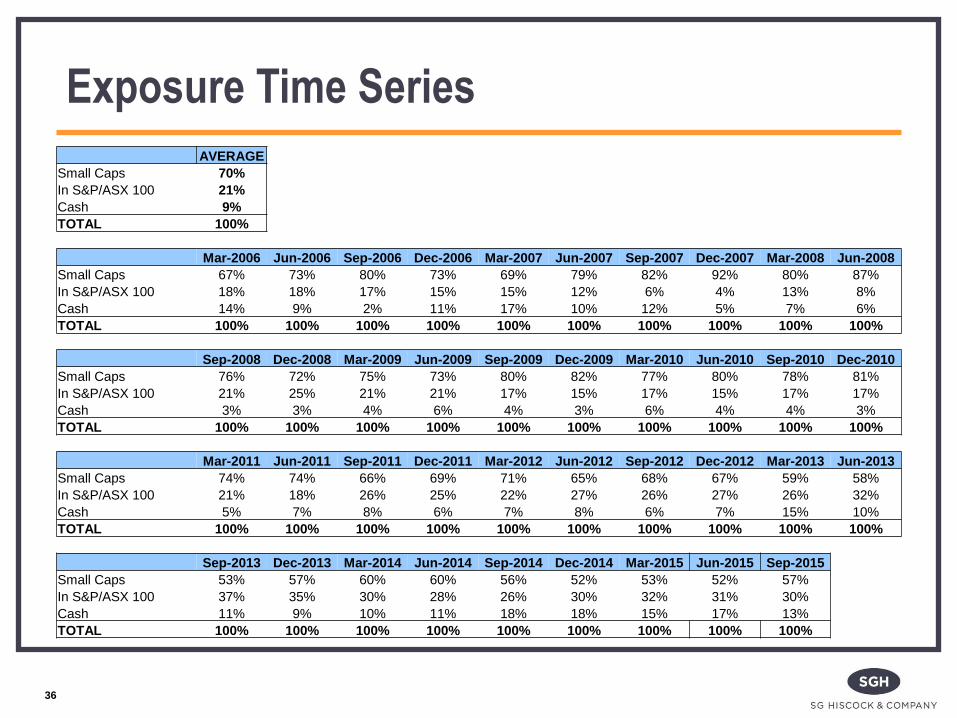
Exposure Time Series
AVERAGE
Small Caps 70%
In S&P/ASX 100 21%
Cash 9%
TOTAL 100%
Mar-2006 Jun-2006 Sep-2006 Dec-2006 Mar-2007 Jun-2007 Sep-2007 Dec-2007 Mar-2008 Jun-2008
Small Caps 67% 73% 80% 73% 69% 79% 82% 92% 80% 87%
In S&P/ASX 100 18% 18% 17% 15% 15% 12% 6% 4% 13% 8%
Cash 14% 9% 2% 11% 17% 10% 12% 5% 7% 6%
TOTAL 100% 100% 100% 100% 100% 100% 100% 100% 100% 100%
Sep-2008 Dec-2008 Mar-2009 Jun-2009 Sep-2009 Dec-2009 Mar-2010 Jun-2010 Sep-2010 Dec-2010
Small Caps 76% 72% 75% 73% 80% 82% 77% 80% 78% 81%
In S&P/ASX 100 21% 25% 21% 21% 17% 15% 17% 15% 17% 17%
Cash 3% 3% 4% 6% 4% 3% 6% 4% 4% 3%
TOTAL 100% 100% 100% 100% 100% 100% 100% 100% 100% 100%
Mar-2011 Jun-2011 Sep-2011 Dec-2011 Mar-2012 Jun-2012 Sep-2012 Dec-2012 Mar-2013 Jun-2013
Small Caps 74% 74% 66% 69% 71% 65% 68% 67% 59% 58%
In S&P/ASX 100 21% 18% 26% 25% 22% 27% 26% 27% 26% 32%
Cash 5% 7% 8% 6% 7% 8% 6% 7% 15% 10%
TOTAL 100% 100% 100% 100% 100% 100% 100% 100% 100% 100%
Sep-2013 Dec-2013 Mar-2014 Jun-2014 Sep-2014 Dec-2014 Mar-2015 Jun-2015 Sep-2015
Small Caps 53% 57% 60% 60% 56% 52% 53% 52% 57%
In S&P/ASX 100 37% 35% 30% 28% 26% 30% 32% 31% 30%
Cash 11% 9% 10% 11% 18% 18% 15% 17% 13%
TOTAL 100% 100% 100% 100% 100% 100% 100% 100% 100%
36
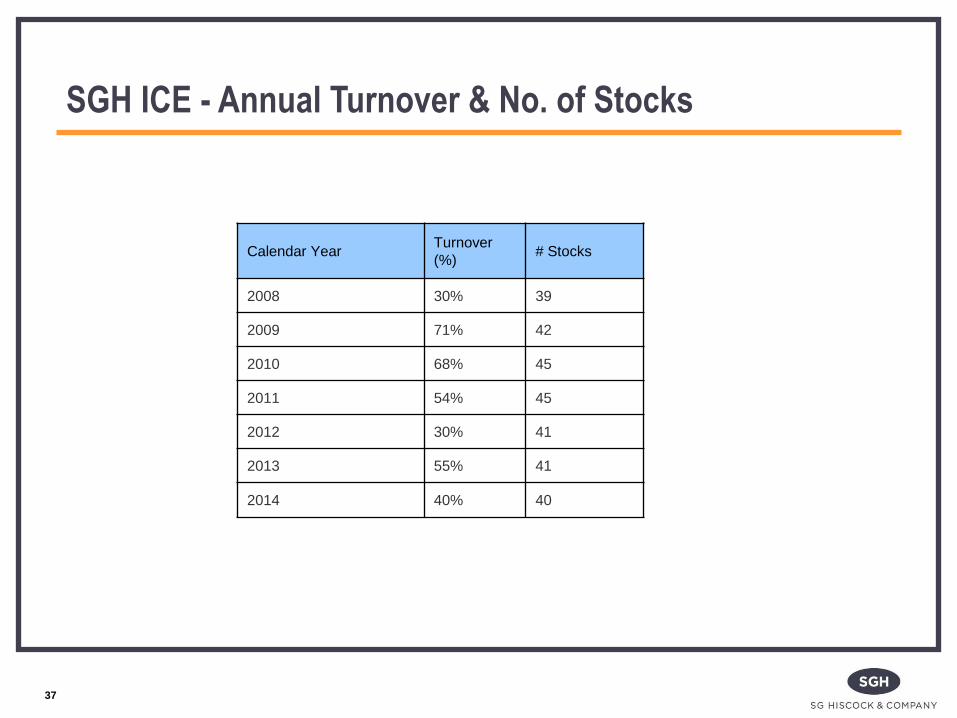
SGH ICE - Annual Turnover & No. of Stocks
Calendar Year Turnover
(%) # Stocks
2008 30% 39
2009 71% 42
2010 68% 45
2011 54% 45
2012 30% 41
2013 55% 41
2014 40% 40
37
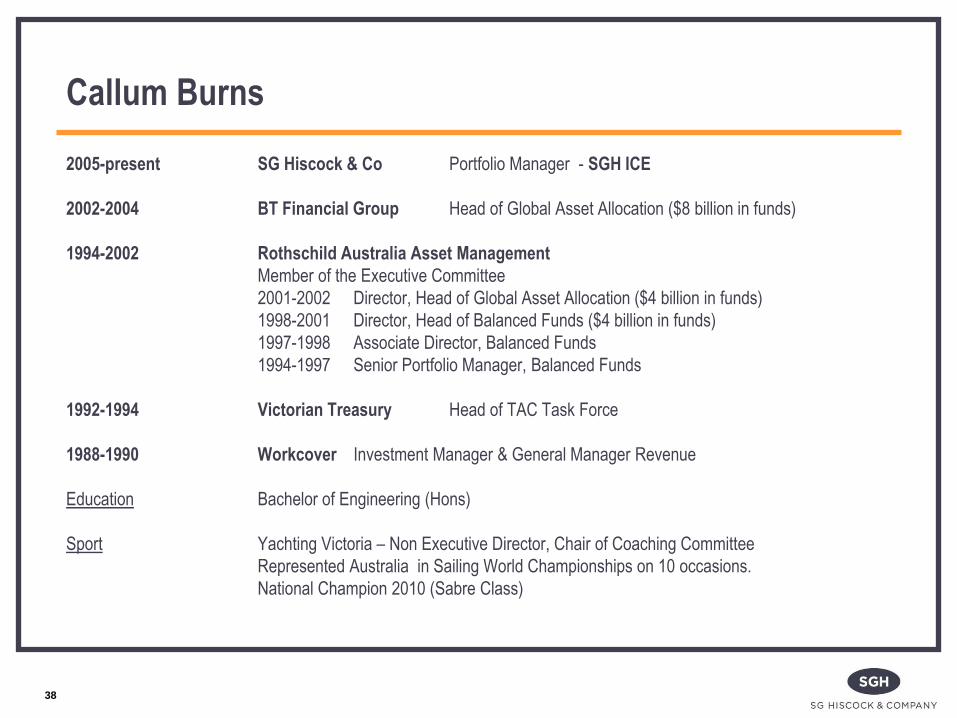
Callum Burns
2005-present SG Hiscock & Co Portfolio Manager - SGH ICE
2002-2004 BT Financial Group Head of Global Asset Allocation ($8 billion in funds)
1994-2002 Rothschild Australia Asset Management
Member of the Executive Committee
2001-2002 Director, Head of Global Asset Allocation ($4 billion in funds)
1998-2001 Director, Head of Balanced Funds ($4 billion in funds)
1997-1998 Associate Director, Balanced Funds
1994-1997 Senior Portfolio Manager, Balanced Funds
1992-1994 Victorian Treasury Head of TAC Task Force
1988-1990 Workcover Investment Manager & General Manager Revenue
Education Bachelor of Engineering (Hons)
Sport Yachting Victoria – Non Executive Director, Chair of Coaching Committee
Represented Australia in Sailing World Championships on 10 occasions.
National Champion 2010 (Sabre Class)
38
SG Hiscock & Co
Boutique specialising in REITs & Australian Equity strategies
Established in 2001
100% owned by its staff
Majority of the team has worked together for 19 years
Shareholding / profit sharing structures specifically designed to ensure longevity of
staff tenure
Policy of outsourcing all non-core activities
Joint venture with LaSalle Investment Management
FUM of $2.2 billion
39
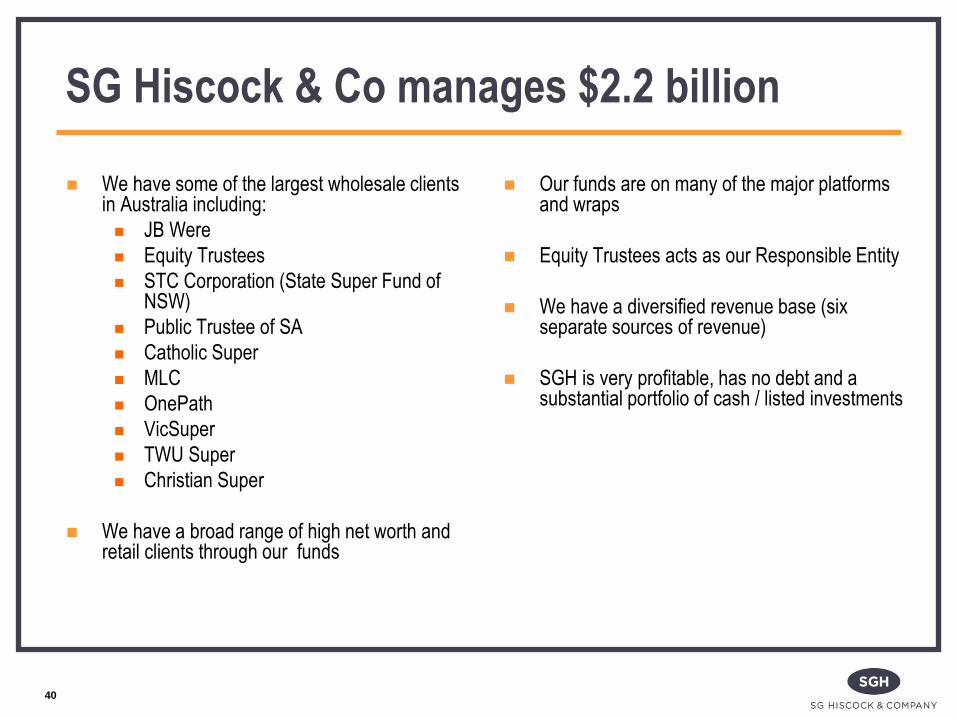
We have some of the largest wholesale clients in Australia including:
JB Were
Equity Trustees
STC Corporation (State Super Fund of NSW)
Public Trustee of SA
Catholic Super
MLC
OnePath
VicSuper
TWU Super
Christian Super
We have a broad range of high net worth and retail clients through our funds
Our funds are on many of the major platforms and wraps
Equity Trustees acts as our Responsible Entity
We have a diversified revenue base (six separate sources of revenue)
SGH is very profitable, has no debt and a substantial portfolio of cash / listed investments
40
SG Hiscock & Co manages $2.2 billion
41
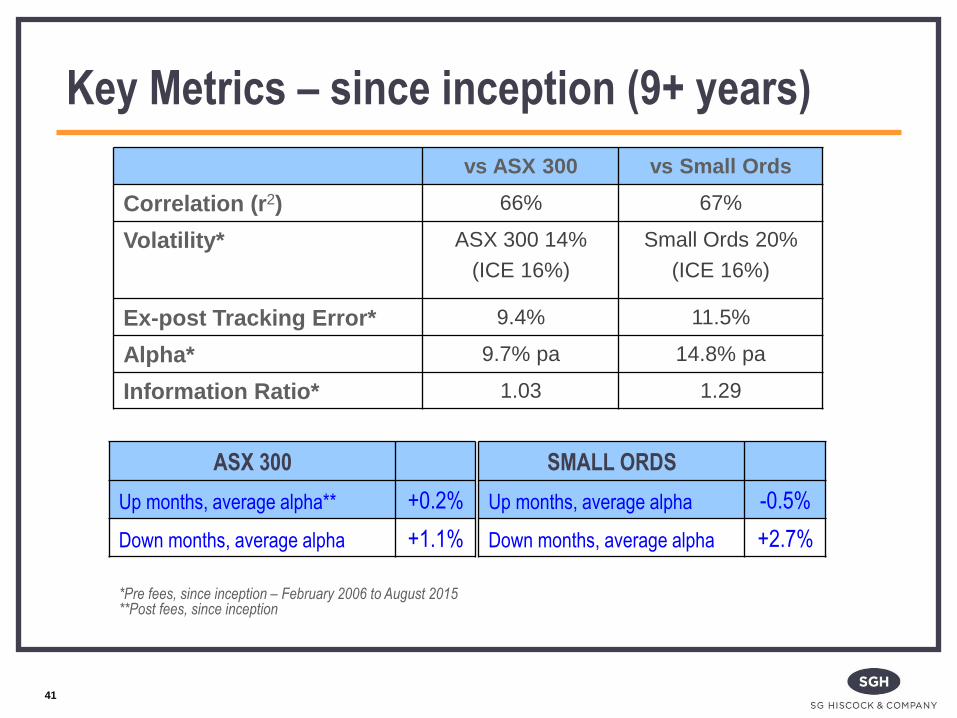
Key Metrics – since inception (9+ years)
vs ASX 300 vs Small Ords
Correlation (r2) 66% 67%
Volatility* ASX 300 14%
(ICE 16%)
Small Ords 20%
(ICE 16%)
Ex-post Tracking Error* 9.4% 11.5%
Alpha* 9.7% pa 14.8% pa
Information Ratio* 1.03 1.29
*Pre fees, since inception – February 2006 to August 2015 **Post fees, since inception
SMALL ORDS
Up months, average alpha -0.5%
Down months, average alpha +2.7%
ASX 300
Up months, average alpha** +0.2%
Down months, average alpha +1.1%
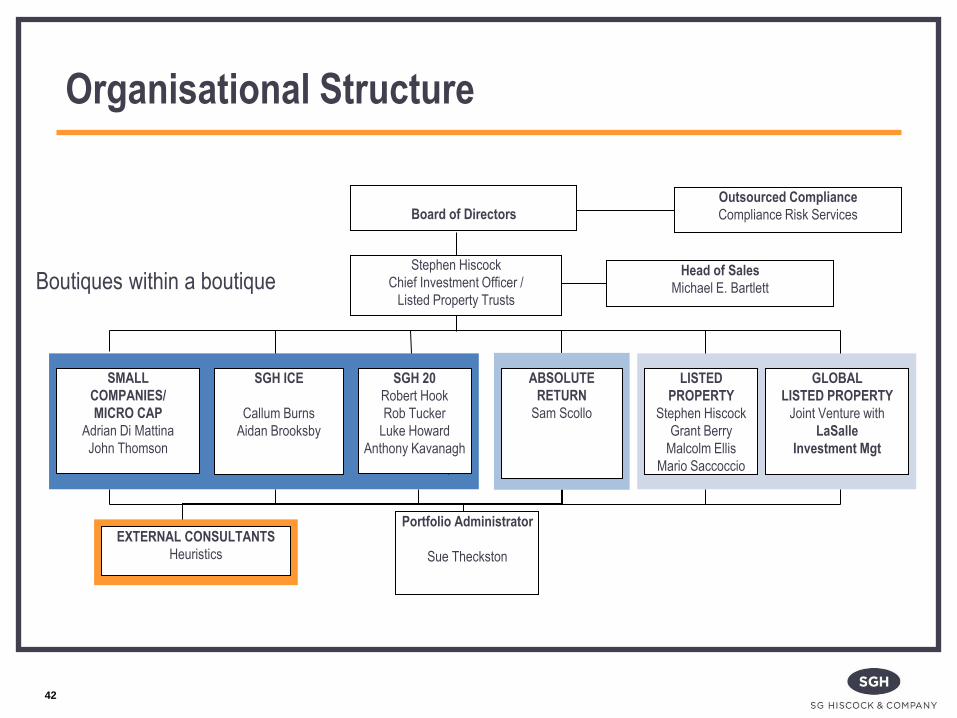
Organisational Structure
EXTERNAL CONSULTANTS
Heuristics
Board of Directors
SMALL
COMPANIES/
MICRO CAP
Adrian Di Mattina
John Thomson
LISTED
PROPERTY
Stephen Hiscock
Grant Berry
Malcolm Ellis
Mario Saccoccio
SGH 20
Robert Hook
Rob Tucker
Luke Howard
Anthony Kavanagh
GLOBAL
LISTED PROPERTY
Joint Venture with
LaSalle
Investment Mgt
Portfolio Administrator
Sue Theckston
Outsourced Compliance
Compliance Risk Services
SGH ICE
Callum Burns
Aidan Brooksby
Stephen Hiscock
Chief Investment Officer /
Listed Property Trusts
ABSOLUTE
RETURN
Sam Scollo
Head of Sales
Michael E. Bartlett
Boutiques within a boutique
42
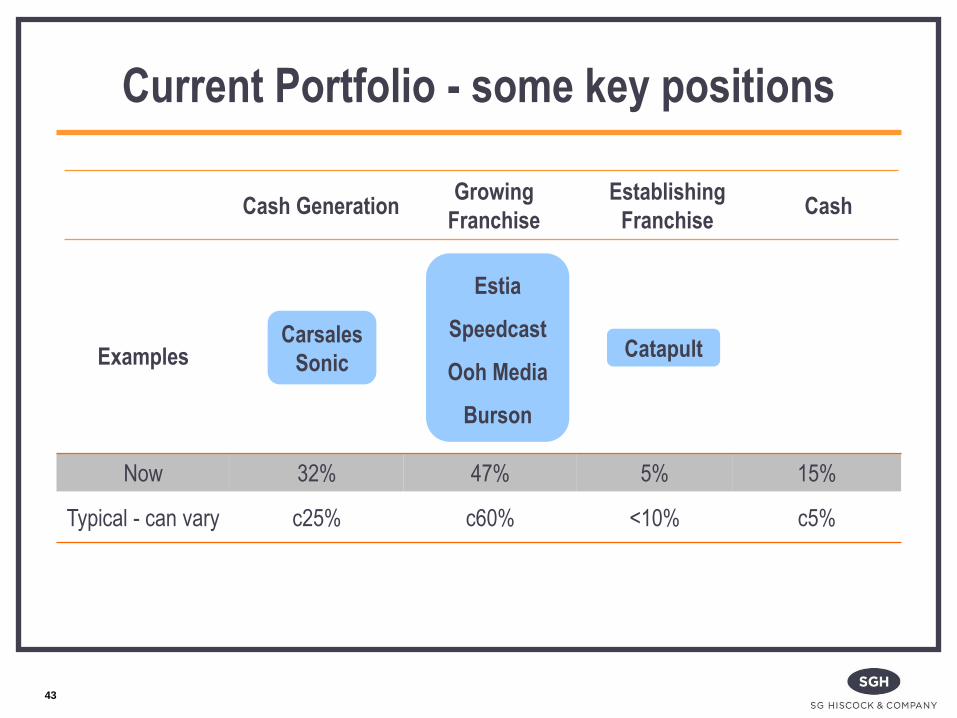
43
Current Portfolio - some key positions
Carsales
Sonic
Catapult
Estia
Speedcast
Ooh Media
Burson
Examples
Now 32% 47% 5% 15%
Typical - can vary c25% c60% <10% c5%
Cash Generation Growing
Franchise
Establishing
Franchise Cash
44
Further information
For further information contact Equity Trustees
distribution partner for SG Hiscock & Company
T: 1300 555 511
W: www.eqt.com.au
45
*The Lonsec Rating (assigned February 2015) presented in this document is published by Lonsec Research Pty Ltd ABN 11 151 658 561 AFSL 421445. The Rating is a
“class service” (as defined in the Financial Advisers Act 2008 (NZ)) or is limited to “General Advice” (as defined in the Corporations Act 2001 (Cth)) and based solely on
consideration of the investment merits of the financial product(s). In New Zealand it must only be provided to “wholesale clients” (as defined in the Financial Advisers Act
2008 (NZ)). Past performance information is for illustrative purposes only and is not indicative of future performance. It is not a recommendation to purchase, sell or hold SG
Hiscock & Company product(s), and you should seek independent financial advice before investing in this product(s). The Rating is subject to change without notice and
Lonsec assumes no obligation to update the relevant document(s) following publication. Lonsec receives a fee from the Fund Manager for researching the product(s) using
comprehensive and objective criteria.
For further information regarding Lonsec’s Ratings methodology, please refer to our website at: http://www.beyond.lonsec.com.au/intelligence/lonsec-ratings
**Morningstar – © 2015 Morningstar, Inc. All rights reserved. Neither Morningstar, its affiliates, nor the content providers guarantee the data or content contained herein to be
accurate, complete or timely nor will they have any liability for its use or distribution. Any general advice or 'class service' have been prepared by Morningstar Australasia Pty
Ltd (ABN: 95 090 665 544, AFSL: 240892) and/or Morningstar Research Ltd, subsidiaries of Morningstar, Inc, without reference to your objectives, financial situation or
needs. Refer to our Financial Services Guide (FSG) for more information at www.morningstar.com.au/s/fsg.pdf. You should consider the advice in light of these matters and if
applicable, the relevant Product Disclosure Statement (Australian products) or Investment Statement (New Zealand products) before making any decision to invest. Our
publications, ratings and products should be viewed as an additional investment resource, not as your sole source of information. Past performance does not necessarily
indicate a financial product's future performance. To obtain advice tailored to your situation, contact a professional financial adviser. Some material is copyright and published
under licence from ASX Operations Pty Ltd ACN 004 523 782 ("ASXO").
**Morningstar Awards 2014(c). Morningstar, Inc. All Rights Reserved. Awarded to SGH ICE for Fund Manager of the Year 2014 - Undiscovered Manager Category, Australia.
**Morningstar Awards 2015(c). Morningstar, Inc. All Rights Reserved. Awarded to SGH ICE for Fund Manager of the Year 2015 - Small Companies Category, Australia.
***The Zenith Investment Partners (“Zenith”) Australian Financial Services License No. 226872 rating (assigned June 2015) referred to in this document is limited to “General
Advice” (as defined by the Corporations Act 2001) for Wholesale clients only. This advice has been prepared without taking into account the objectives, financial situation or
needs of any individual. It is not a specific recommendation to purchase, sell or hold the relevant product(s). Investors should seek independent financial advice before
making an investment decision and should consider the appropriateness of this advice in light of their own objectives, financial situation and needs. Investors should obtain a
copy of, and consider the PDS or offer document before making any decision and refer to the full Zenith Product Assessment available on the Zenith website. Zenith usually
charges the product issuer, fund manager or a related party to conduct Product Assessments. Full details regarding Zenith’s methodology, ratings definitions and regulatory
compliance are available on our Product Assessment’s and at http://www.zenithpartners.com.au/RegulatoryGuidelines.
September 2015
45
Disclaimers
Important Information:
This presentation has been prepared by SG Hiscock & Company
Limited (ABN 51 097 263 628, AFSL 240679) which are responsible
for its contents. Neither SG Hiscock & Company Limited nor its related
entities, directors or officers guarantees the performance of, or the
repayment of capital or income invested in the funds. Applications for
investment in the Fund may only be made on the application form
attached to the current fund’s PDS available from Equity Trustees.
You should consider the PDS when deciding whether to acquire or to
continue to hold units in the funds.
46