shades of green - which low-carbon cars are the most eco-friendly?
TRANSCRIPT

Shades of GreenWhich low-carbon cars are the most eco-friendly?
May 2011
ForewordThe Royal Automobile Club’s RAC Brighton to London Future Car Challenge was unique.
It showcased scores of the most advanced green vehicles in front of hundreds of thousands of eager spectators – the very people who must buy the cars on display if there is to be a green transport revolution. If the event achieved only one thing, it was to demonstrate that determining how drivers can realistically do their bit to save the planet is a complex matter. There is no simple answer, in part because we have yet to adequately define the question.
Is the most eco-friendly car the one which uses the least energy, or the one generating fewest CO2 emissions? Should environmental impact be considered solely in relation to each journey a vehicle makes? What about the manufacture and distribution of fuel?
This report graphically illustrates how the green credentials of cars alter significantly depending on which angle you view them from.
For all of us who run a car this is not an academic exercise. Over the coming decades the make-up of the vehicle parc will change dramatically as manufacturers encourage us to buy their latest electric, hybrid or hydrogen-powered cars on the basis of their environmental performance.
Since the beginning of this year the Government has been offering grants of up to £5,000 for those early adopters who are ready to take the plunge and commit to buying an ultra-green car – that which produces 75 gCO2/km or less.
For these pioneers there is plainly a lot to consider. Cutting through the jargon – CO2 equivalents, tank-to-wheel, well-to-wheel – is only part of the problem. Even once a driver has made a theoretical choice, he or she is then likely to be confronted with the not insignificant practical problem of how to afford the object of their desire: while green cars might be cheap to run, many are anything but cheap to buy.
What happens when an owner finally wants to swap his now not-so-young automobile for something new? How will the used-car market price what is very much unproven technology? The questions are legion, but this report – and the event its launch coincides with – goes some way first to better defining them, and then answering them.
One thing is clear: when it comes to environmentally friendly vehicles, there’s green and then there’s green.
David Quarmby
Chairman, RAC Foundation
i
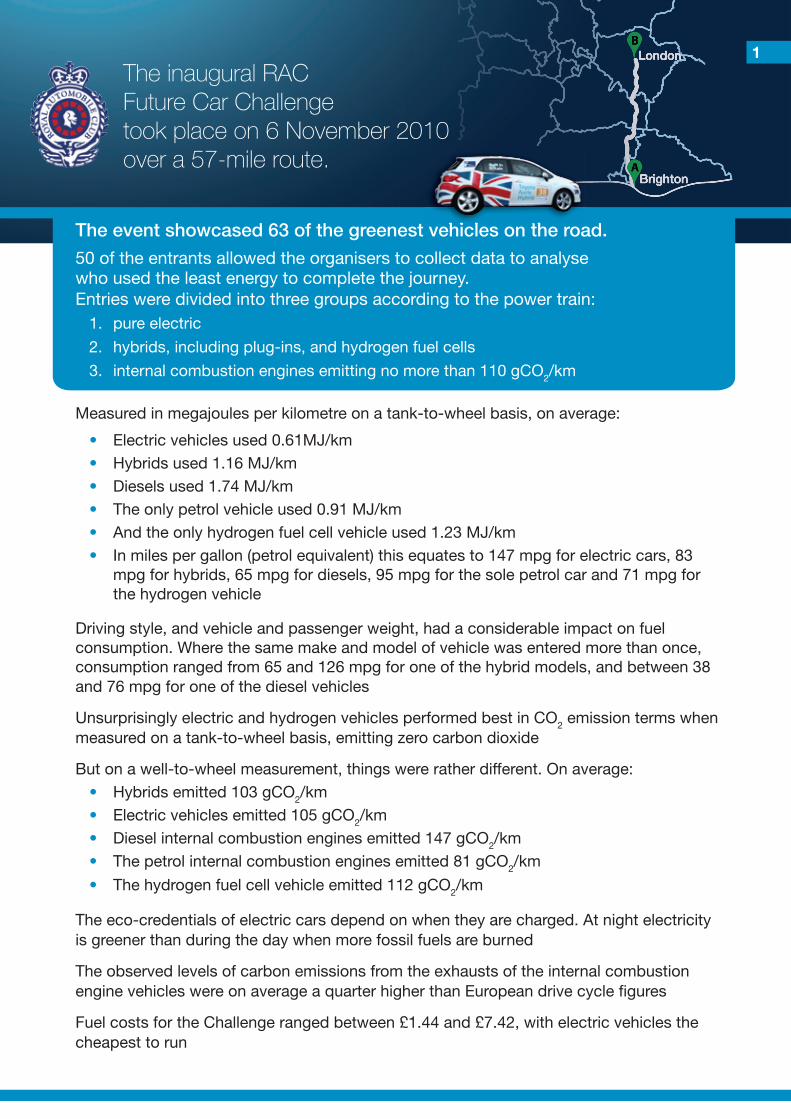
The inaugural RAC Future Car Challenge took place on 6 November 2010 over a 57-mile route.
The event showcased 63 of the greenest vehicles on the road.
50 of the entrants allowed the organisers to collect data to analyse who used the least energy to complete the journey. Entries were divided into three groups according to the power train:
1. pure electric
2. hybrids, including plug-ins, and hydrogen fuel cells
3. internal combustion engines emitting no more than 110 gCO2/km
Measured in megajoules per kilometre on a tank-to-wheel basis, on average:
• Electric vehicles used 0.61MJ/km• Hybrids used 1.16 MJ/km • Diesels used 1.74 MJ/km• The only petrol vehicle used 0.91 MJ/km • And the only hydrogen fuel cell vehicle used 1.23 MJ/km• In miles per gallon (petrol equivalent) this equates to 147 mpg for electric cars, 83
mpg for hybrids, 65 mpg for diesels, 95 mpg for the sole petrol car and 71 mpg for the hydrogen vehicle
Driving style, and vehicle and passenger weight, had a considerable impact on fuel consumption. Where the same make and model of vehicle was entered more than once, consumption ranged from 65 and 126 mpg for one of the hybrid models, and between 38 and 76 mpg for one of the diesel vehicles
Unsurprisingly electric and hydrogen vehicles performed best in CO2 emission terms when measured on a tank-to-wheel basis, emitting zero carbon dioxide
But on a well-to-wheel measurement, things were rather different. On average:• Hybrids emitted 103 gCO2/km• Electric vehicles emitted 105 gCO2/km• Diesel internal combustion engines emitted 147 gCO2/km• The petrol internal combustion engines emitted 81 gCO2/km
• The hydrogen fuel cell vehicle emitted 112 gCO2/km
The eco-credentials of electric cars depend on when they are charged. At night electricity is greener than during the day when more fossil fuels are burned
The observed levels of carbon emissions from the exhausts of the internal combustion engine vehicles were on average a quarter higher than European drive cycle fi gures
Fuel costs for the Challenge ranged between £1.44 and £7.42, with electric vehicles the cheapest to run
BrightonBrighton
LondonLondon
A
B
The event showcased 63 of the greenest vehicles on the road.
1
The RunIn its fi rst year, the RAC Future Car Challenge attracted 63 entries from a wide range of manufacturers – from large to small volume as well as niche manufacturers. The vehicles were divided into three categories and in several cases there was more than one instance of a particular model in a given category:
Table 1: Power train types
Power trainNumber of vehicles(analysed: see section below)
Category 1 Pure electric vehicles 21 (16)
Category 2 Hybrid, plug-in hybrid, extended-range and hydrogen fuel cell vehicles
26 (20)
Category 3 Pure internal combustion engine (ICE) vehicles 16 (14)
Entrants had to agree to a set of regulations covering technical and competition requirements. All vehicles had to be road-legal, and vehicles in Category 3 were not permitted to exceed a maximum of 110 gCO2/km as measured by the offi cial European drive cycle. As for the competition, the organisers stipulated a minimum and maximum time for completing the course, and a half-way stop at Crawley.
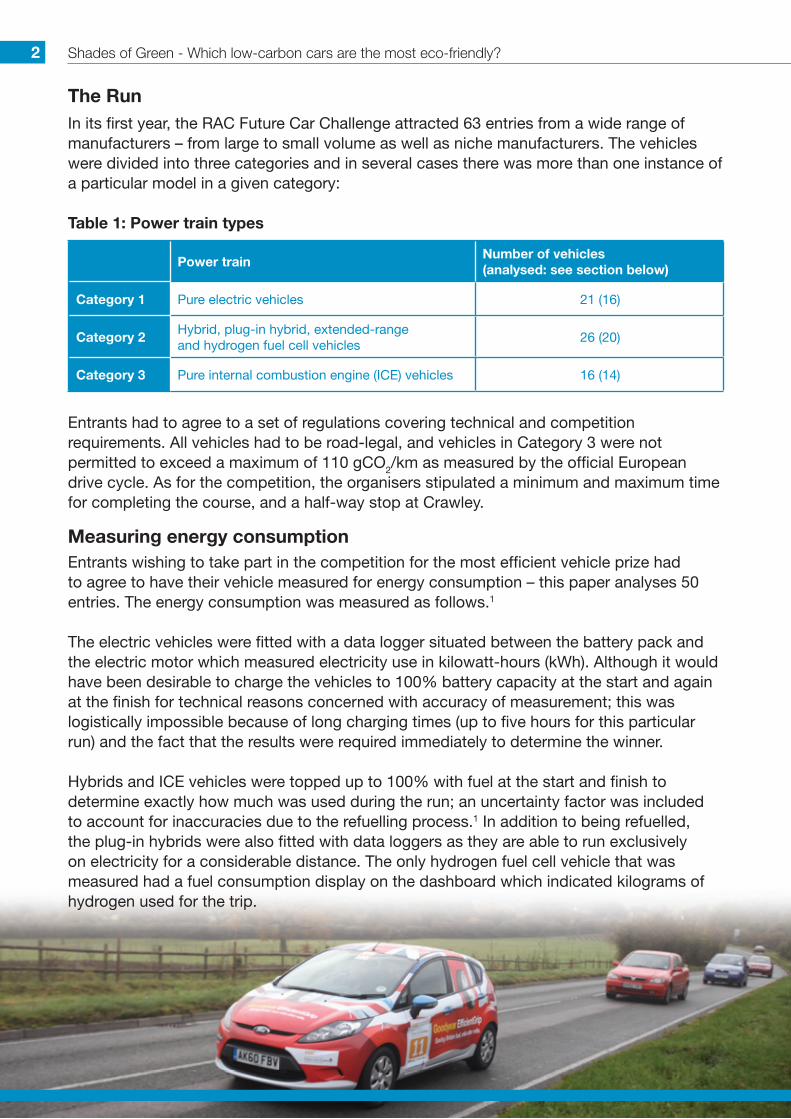
Measuring energy consumptionEntrants wishing to take part in the competition for the most effi cient vehicle prize had to agree to have their vehicle measured for energy consumption – this paper analyses 50 entries. The energy consumption was measured as follows.1
The electric vehicles were fi tted with a data logger situated between the battery pack and the electric motor which measured electricity use in kilowatt-hours (kWh). Although it would have been desirable to charge the vehicles to 100% battery capacity at the start and again at the fi nish for technical reasons concerned with accuracy of measurement; this was logistically impossible because of long charging times (up to fi ve hours for this particular run) and the fact that the results were required immediately to determine the winner.
Hybrids and ICE vehicles were topped up to 100% with fuel at the start and fi nish to determine exactly how much was used during the run; an uncertainty factor was included to account for inaccuracies due to the refuelling process.1 In addition to being refuelled, the plug-in hybrids were also fi tted with data loggers as they are able to run exclusively on electricity for a considerable distance. The only hydrogen fuel cell vehicle that was measured had a fuel consumption display on the dashboard which indicated kilograms of hydrogen used for the trip.
Shades of Green - Which low-carbon cars are the most eco-friendly?2
Energy ConsumptionTo make a like-for-like comparison, energy consumption has to be expressed in a consistent metric: the chosen denominator is megajoules per kilometre (MJ/km) which can be easily converted into miles per gallon (mpg) petrol equivalent for ease of understanding.
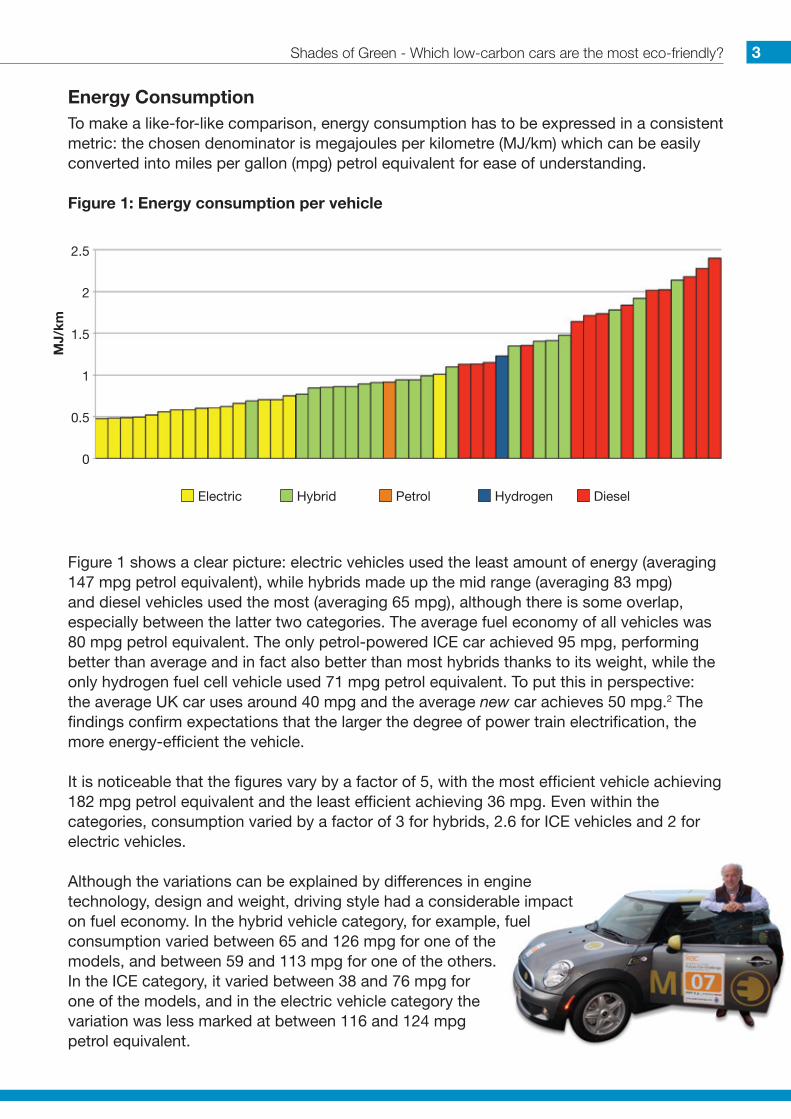
Figure 1: Energy consumption per vehicle
Figure 1 shows a clear picture: electric vehicles used the least amount of energy (averaging 147 mpg petrol equivalent), while hybrids made up the mid range (averaging 83 mpg) and diesel vehicles used the most (averaging 65 mpg), although there is some overlap, especially between the latter two categories. The average fuel economy of all vehicles was 80 mpg petrol equivalent. The only petrol-powered ICE car achieved 95 mpg, performing better than average and in fact also better than most hybrids thanks to its weight, while the only hydrogen fuel cell vehicle used 71 mpg petrol equivalent. To put this in perspective: the average UK car uses around 40 mpg and the average new car achieves 50 mpg.2 The findings confirm expectations that the larger the degree of power train electrification, the more energy-efficient the vehicle.
It is noticeable that the figures vary by a factor of 5, with the most efficient vehicle achieving 182 mpg petrol equivalent and the least efficient achieving 36 mpg. Even within the categories, consumption varied by a factor of 3 for hybrids, 2.6 for ICE vehicles and 2 for electric vehicles.
Although the variations can be explained by differences in engine technology, design and weight, driving style had a considerable impact on fuel economy. In the hybrid vehicle category, for example, fuel consumption varied between 65 and 126 mpg for one of the models, and between 59 and 113 mpg for one of the others. In the ICE category, it varied between 38 and 76 mpg for one of the models, and in the electric vehicle category the variation was less marked at between 116 and 124 mpg petrol equivalent.
2.5
2
1.5
1
0.5
0
Electric Hybrid Petrol Hydrogen Diesel
MJ/
kmShades of Green - Which low-carbon cars are the most eco-friendly? 3
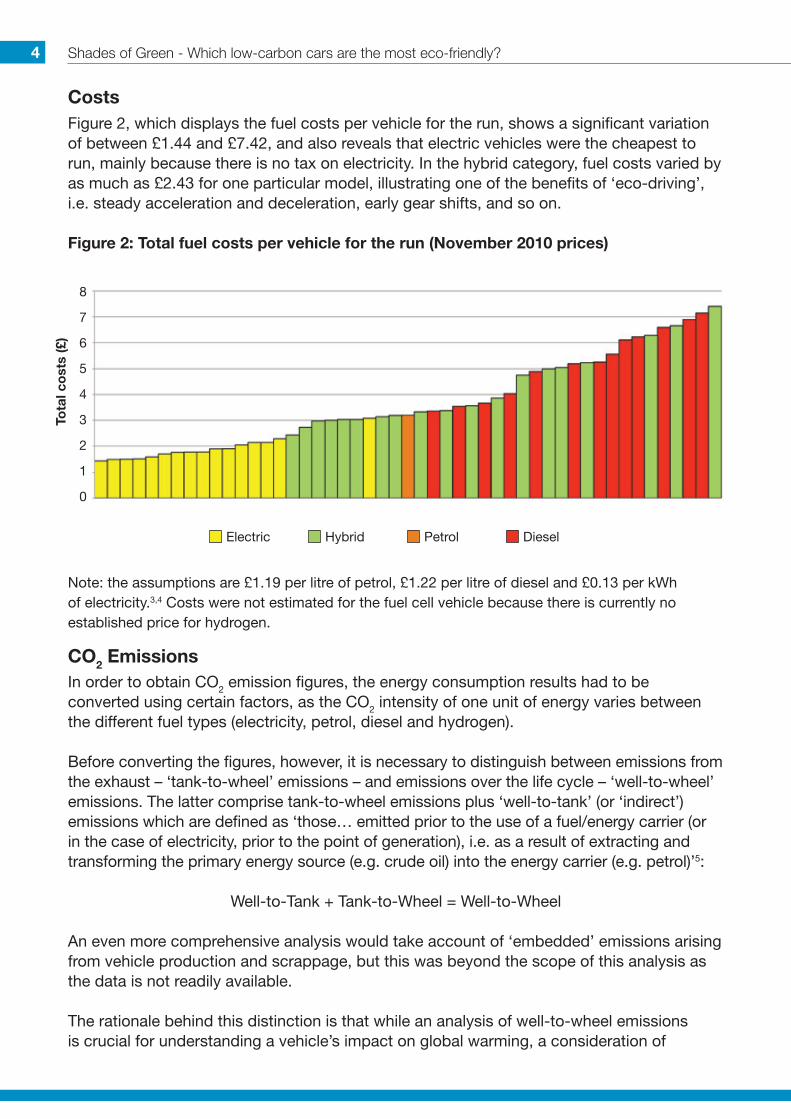
CostsFigure 2, which displays the fuel costs per vehicle for the run, shows a significant variation of between £1.44 and £7.42, and also reveals that electric vehicles were the cheapest to run, mainly because there is no tax on electricity. In the hybrid category, fuel costs varied by as much as £2.43 for one particular model, illustrating one of the benefits of ‘eco-driving’, i.e. steady acceleration and deceleration, early gear shifts, and so on.
Figure 2: Total fuel costs per vehicle for the run (November 2010 prices)
Note: the assumptions are £1.19 per litre of petrol, £1.22 per litre of diesel and £0.13 per kWh of electricity.3,4 Costs were not estimated for the fuel cell vehicle because there is currently no established price for hydrogen.
CO2 EmissionsIn order to obtain CO2 emission figures, the energy consumption results had to be converted using certain factors, as the CO2 intensity of one unit of energy varies between the different fuel types (electricity, petrol, diesel and hydrogen).
Before converting the figures, however, it is necessary to distinguish between emissions from the exhaust – ‘tank-to-wheel’ emissions – and emissions over the life cycle – ‘well-to-wheel’ emissions. The latter comprise tank-to-wheel emissions plus ‘well-to-tank’ (or ‘indirect’) emissions which are defined as ‘those… emitted prior to the use of a fuel/energy carrier (or in the case of electricity, prior to the point of generation), i.e. as a result of extracting and transforming the primary energy source (e.g. crude oil) into the energy carrier (e.g. petrol)’5:
Well-to-Tank + Tank-to-Wheel = Well-to-Wheel
An even more comprehensive analysis would take account of ‘embedded’ emissions arising from vehicle production and scrappage, but this was beyond the scope of this analysis as the data is not readily available.
The rationale behind this distinction is that while an analysis of well-to-wheel emissions is crucial for understanding a vehicle’s impact on global warming, a consideration of
8
7
6
5
4
3
2
1
0
Tota
l co
sts
(£)
Electric Hybrid Petrol Diesel
Shades of Green - Which low-carbon cars are the most eco-friendly?4
only tank-to-wheel emissions highlights the often-ignored issue of local air quality. Road vehicles, particularly diesels, are the main emitters of pollutants in urban areas, and are estimated to cause 50,000 premature deaths per year. In fact, the UK could face sanctions of the order of £300 million from the EU for continuously breaching its national air quality targets.6 This is a clear benefit of electric vehicles, which have zero emissions at the exhaust, and hydrogen fuel cells which emit only water vapour.
Tank-to-wheel CO2 emissionsAs electric vehicles have no emissions at the exhaust, and hydrogen fuel cell vehicles emit merely water vapour, tank-to-wheel emissions only have to be calculated for all the vehicles that used petrol or diesel, i.e. all ICE vehicles and hybrids. The conversion is straightforward, as petrol and diesel have a specific volumetric energy content and CO2 intensity, so emissions can be calculated directly from the amount of energy used. While the former was provided by the fuel supplier, official government estimates were used for the CO2 intensity per litre5:
Table 2: Tank-to-wheel CO2 conversion factors
CO2 emissions (g/MJ) Assumption
Petrol 74.7Calorific value of 30.8 MJ/litre and CO2 emissions of 2.30 kgCO2/litre
Diesel 70.3Calorific value of 37.6 MJ/litre and CO2 emissions of 2.64 kgCO2/litre
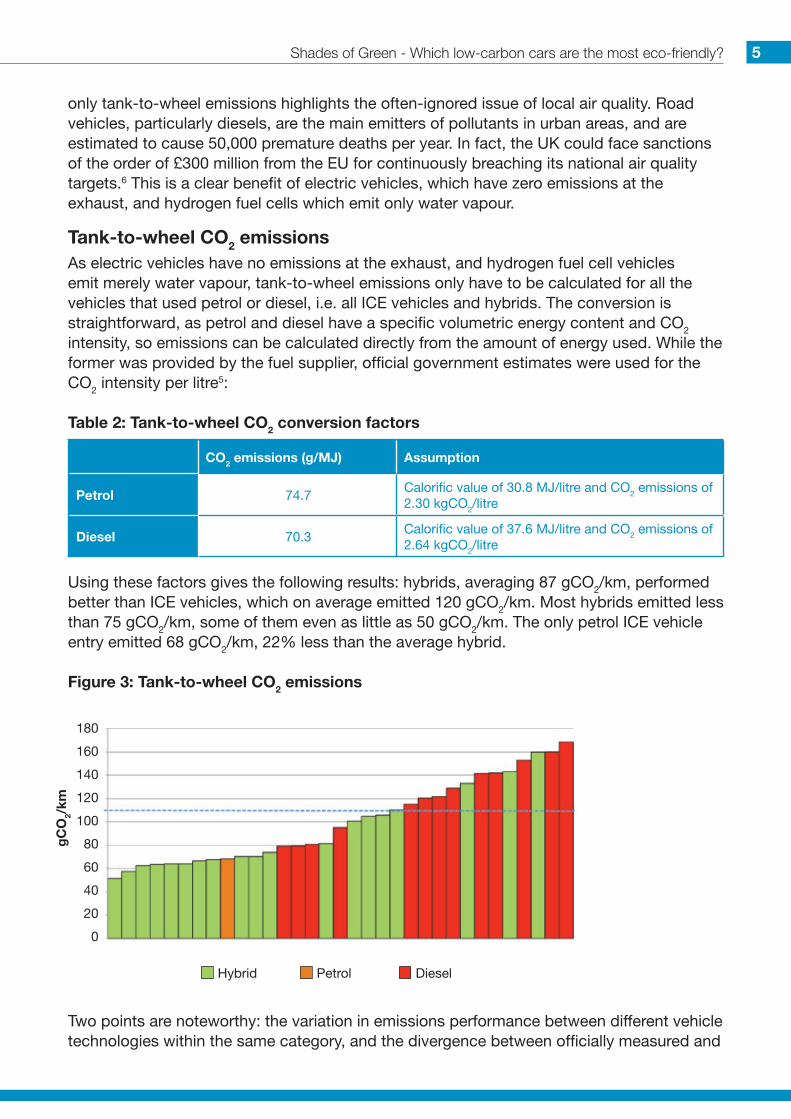
Using these factors gives the following results: hybrids, averaging 87 gCO2/km, performed better than ICE vehicles, which on average emitted 120 gCO2/km. Most hybrids emitted less than 75 gCO2/km, some of them even as little as 50 gCO2/km. The only petrol ICE vehicle entry emitted 68 gCO2/km, 22% less than the average hybrid.
Figure 3: Tank-to-wheel CO2 emissions
Two points are noteworthy: the variation in emissions performance between different vehicle technologies within the same category, and the divergence between officially measured and
180
160
140
120
100
80
60
40
20
0
gC
O2/
km
Hybrid Petrol Diesel
Shades of Green - Which low-carbon cars are the most eco-friendly? 5
actual emissions. Whereas the variation between the different models in the ICE vehicle category is over twofold, the variation within the hybrid category is as high as threefold between the different models. This confi rms one of the King Review’s fi ndings that buying best-in-class vehicle models can reduce emissions by 25% compared to the class average7 – in this case even more.
The second point is that although the entry regulations specifi ed a maximum of 110 gCO2/km for ICE vehicles as measured by the offi cial European drive cycle (indicated by the dotted blue line in Figure 3), 9 out of 14 entries actually exceeded this threshold despite the fact that the nature of the event encouraged eco-driving. Equally, some of the ICE vehicles and in fact the majority of hybrids performed better than was offi cially claimed.
Well-to-wheel CO2 emissionsIn the case of electric vehicles, well-to-wheel emissions depend on the assumptions made about ‘grid carbon intensity’ – this refers to the CO2 content of one unit of electricity from the plug commonly measured in grams of CO2 equivalents per kWh (gCO2e/kWh). The measure is expressed in CO2 equivalents as it not only takes into account CO2 emissions but also methane and nitrous oxide, weighted according to their global warming potential.5
The diffi culty arises because grid carbon intensity varies: during the day it is high since electricity is produced from more abundant and carbon-intensive resources such as gas and coal to meet higher demand, while at night it is less carbon-intensive because lower demand means that a greater proportion of supply can be met by electricity generated from nuclear baseload.8
There is also the issue of whether to use an average emissions factor (AEF) or marginal emissions factor (MEF). The AEF takes into account the average electricity mix and associated emissions over a longer period of time. It typically fl uctuates between 470 gCO2/kWh at night and 550 gCO2/kWh during the day9,10; the Government uses a rolling average of 542 gCO2/kWh.5 The MEF, on the other hand, captures the emissions from the ‘marginal’ power plant. The rationale is that rather than looking at the average, it is necessary to take into account the emissions from generating the extra electricity that is specifi cally used for an additional load. Currently the MEF is around 690 gCO2/kWh8; it is higher than the AEF because peak demand is met through the use of more abundant, carbon-intensive sources
such as coal and gas. This paper will not argue the case for one over the other – instead, it will illustrate the implications
of assuming different factors at different times of day.
Indirect emissions add 75 gCO2e/kWh to the rolling average of 542 gCO2/kWh, giving a fi gure of 617 gCO2e/kWh for electricity, adding also around 20% to
the petrol and diesel factors used to calculate tank-to-
wheel emissions5,11:
other – instead, it will illustrate the implications of assuming different factors at different
times of day.
used to calculate tank-to-wheel emissions
Shades of Green - Which low-carbon cars are the most eco-friendly?6
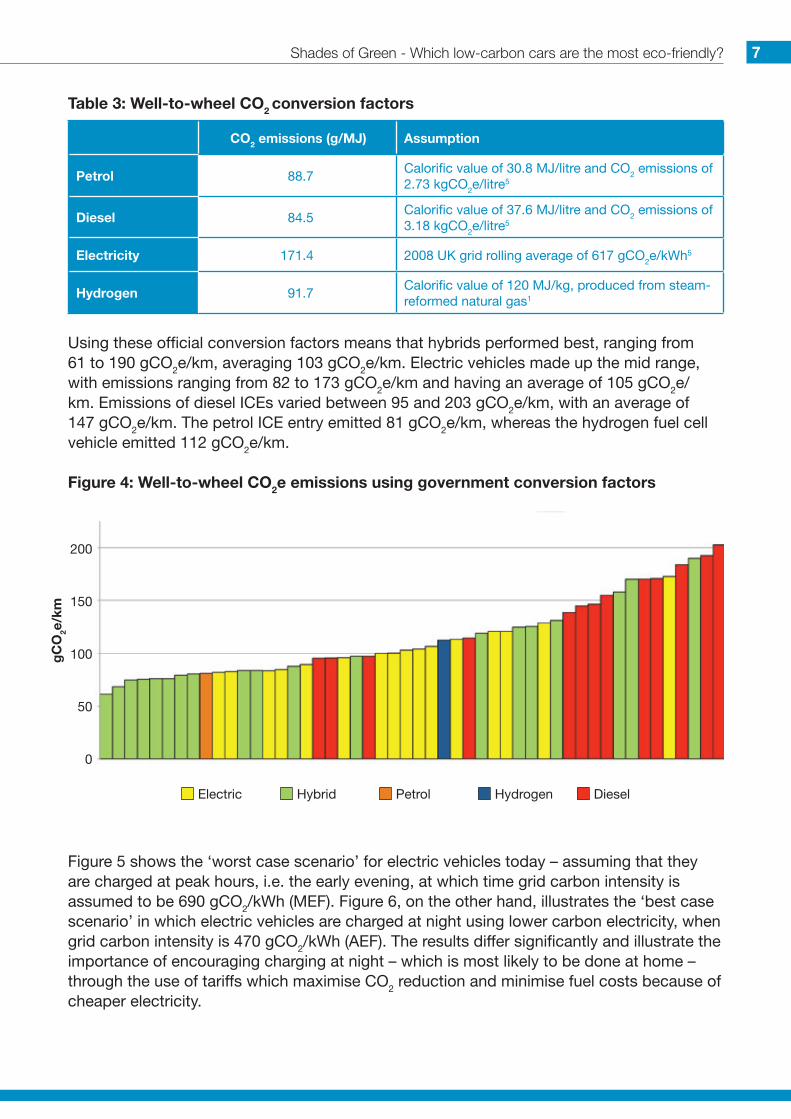
Table 3: Well-to-wheel CO2 conversion factors
CO2 emissions (g/MJ) Assumption
Petrol 88.7Calorific value of 30.8 MJ/litre and CO2 emissions of 2.73 kgCO2e/litre5
Diesel 84.5Calorific value of 37.6 MJ/litre and CO2 emissions of 3.18 kgCO2e/litre5
Electricity 171.4 2008 UK grid rolling average of 617 gCO2e/kWh5
Hydrogen 91.7Calorific value of 120 MJ/kg, produced from steam-reformed natural gas1
Using these official conversion factors means that hybrids performed best, ranging from 61 to 190 gCO2e/km, averaging 103 gCO2e/km. Electric vehicles made up the mid range, with emissions ranging from 82 to 173 gCO2e/km and having an average of 105 gCO2e/km. Emissions of diesel ICEs varied between 95 and 203 gCO2e/km, with an average of 147 gCO2e/km. The petrol ICE entry emitted 81 gCO2e/km, whereas the hydrogen fuel cell vehicle emitted 112 gCO2e/km.
Figure 4: Well-to-wheel CO2e emissions using government conversion factors
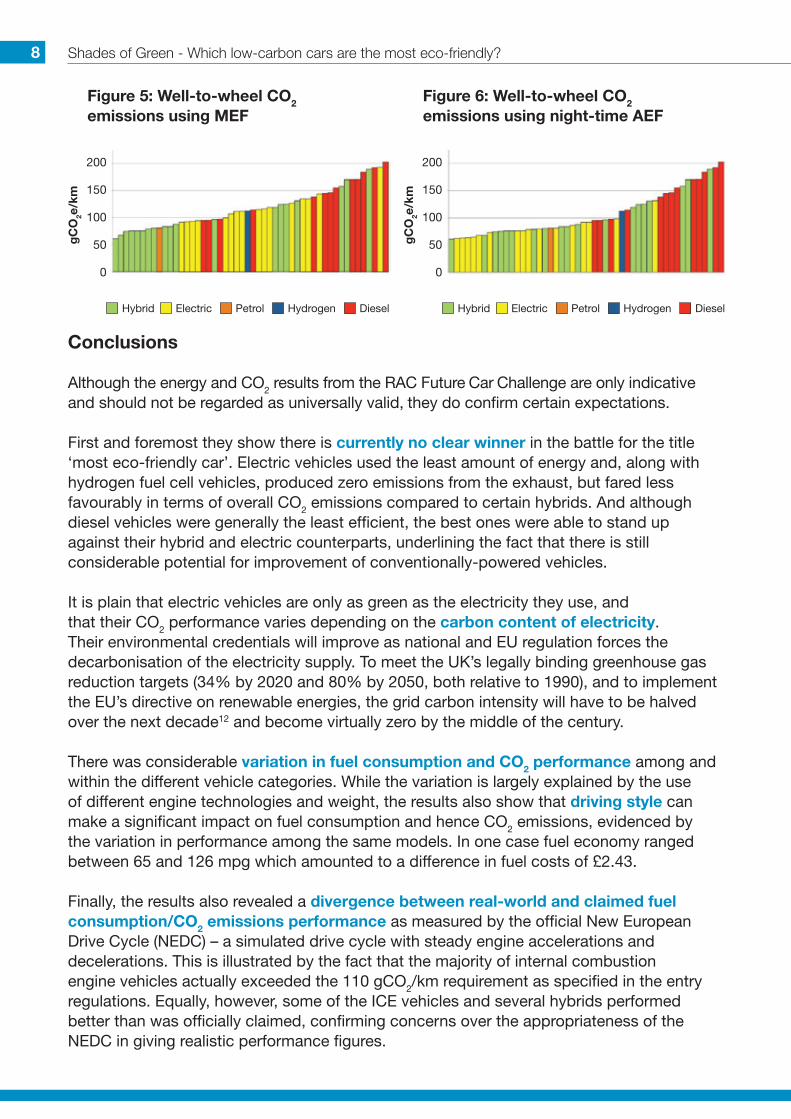
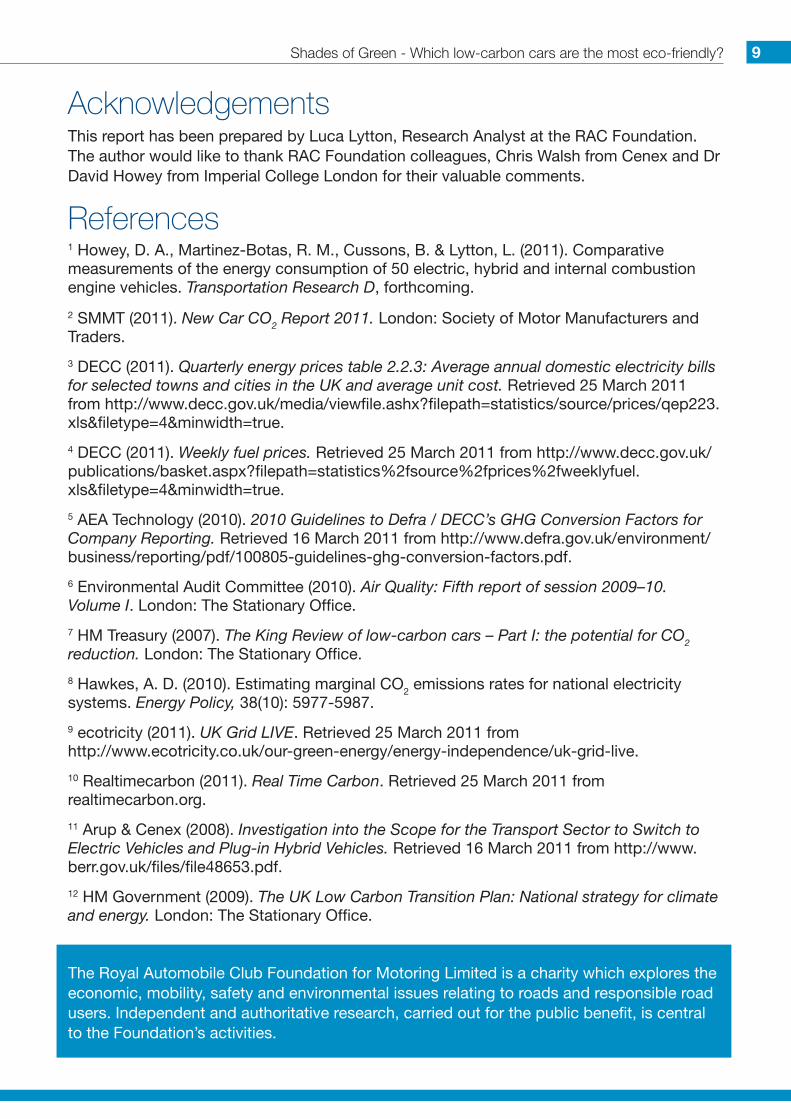
Figure 5 shows the ‘worst case scenario’ for electric vehicles today – assuming that they are charged at peak hours, i.e. the early evening, at which time grid carbon intensity is assumed to be 690 gCO2/kWh (MEF). Figure 6, on the other hand, illustrates the ‘best case scenario’ in which electric vehicles are charged at night using lower carbon electricity, when grid carbon intensity is 470 gCO2/kWh (AEF). The results differ significantly and illustrate the importance of encouraging charging at night – which is most likely to be done at home – through the use of tariffs which maximise CO2 reduction and minimise fuel costs because of cheaper electricity.
200
150
100
50
0
gC
O2e
/km
Electric Hybrid Petrol Hydrogen Diesel
Shades of Green - Which low-carbon cars are the most eco-friendly? 7
Conclusions
Although the energy and CO2 results from the RAC Future Car Challenge are only indicative and should not be regarded as universally valid, they do confirm certain expectations.
First and foremost they show there is currently no clear winner in the battle for the title ‘most eco-friendly car’. Electric vehicles used the least amount of energy and, along with hydrogen fuel cell vehicles, produced zero emissions from the exhaust, but fared less favourably in terms of overall CO2 emissions compared to certain hybrids. And although diesel vehicles were generally the least efficient, the best ones were able to stand up against their hybrid and electric counterparts, underlining the fact that there is still considerable potential for improvement of conventionally-powered vehicles.
It is plain that electric vehicles are only as green as the electricity they use, and that their CO2 performance varies depending on the carbon content of electricity. Their environmental credentials will improve as national and EU regulation forces the decarbonisation of the electricity supply. To meet the UK’s legally binding greenhouse gas reduction targets (34% by 2020 and 80% by 2050, both relative to 1990), and to implement the EU’s directive on renewable energies, the grid carbon intensity will have to be halved over the next decade12 and become virtually zero by the middle of the century.
There was considerable variation in fuel consumption and CO2 performance among and within the different vehicle categories. While the variation is largely explained by the use of different engine technologies and weight, the results also show that driving style can make a significant impact on fuel consumption and hence CO2 emissions, evidenced by the variation in performance among the same models. In one case fuel economy ranged between 65 and 126 mpg which amounted to a difference in fuel costs of £2.43.
Finally, the results also revealed a divergence between real-world and claimed fuel consumption/CO2 emissions performance as measured by the official New European Drive Cycle (NEDC) – a simulated drive cycle with steady engine accelerations and decelerations. This is illustrated by the fact that the majority of internal combustion engine vehicles actually exceeded the 110 gCO2/km requirement as specified in the entry regulations. Equally, however, some of the ICE vehicles and several hybrids performed better than was officially claimed, confirming concerns over the appropriateness of the NEDC in giving realistic performance figures.
200
150
100
50
0
gC
O2e
/km
Hybrid Electric Petrol Hydrogen Diesel
Figure 5: Well-to-wheel CO2 emissions using MEF
200
150
100
50
0
gC
O2e
/km
Hybrid Electric Petrol Hydrogen Diesel
Figure 6: Well-to-wheel CO2 emissions using night-time AEF
Shades of Green - Which low-carbon cars are the most eco-friendly?8
AcknowledgementsThis report has been prepared by Luca Lytton, Research Analyst at the RAC Foundation. The author would like to thank RAC Foundation colleagues, Chris Walsh from Cenex and Dr David Howey from Imperial College London for their valuable comments.
References1 Howey, D. A., Martinez-Botas, R. M., Cussons, B. & Lytton, L. (2011). Comparative measurements of the energy consumption of 50 electric, hybrid and internal combustion engine vehicles. Transportation Research D, forthcoming.
2 SMMT (2011). New Car CO2 Report 2011. London: Society of Motor Manufacturers and Traders.
3 DECC (2011). Quarterly energy prices table 2.2.3: Average annual domestic electricity bills for selected towns and cities in the UK and average unit cost. Retrieved 25 March 2011 from http://www.decc.gov.uk/media/viewfile.ashx?filepath=statistics/source/prices/qep223.xls&filetype=4&minwidth=true.
4 DECC (2011). Weekly fuel prices. Retrieved 25 March 2011 from http://www.decc.gov.uk/ publications/basket.aspx?filepath=statistics%2fsource%2fprices%2fweeklyfuel.xls&filetype=4&minwidth=true.
5 AEA Technology (2010). 2010 Guidelines to Defra / DECC’s GHG Conversion Factors for Company Reporting. Retrieved 16 March 2011 from http://www.defra.gov.uk/environment/ business/reporting/pdf/100805-guidelines-ghg-conversion-factors.pdf.
6 Environmental Audit Committee (2010). Air Quality: Fifth report of session 2009–10. Volume I. London: The Stationary Office.
7 HM Treasury (2007). The King Review of low-carbon cars – Part I: the potential for CO2 reduction. London: The Stationary Office.
8 Hawkes, A. D. (2010). Estimating marginal CO2 emissions rates for national electricity systems. Energy Policy, 38(10): 5977-5987.
9 ecotricity (2011). UK Grid LIVE. Retrieved 25 March 2011 from http://www.ecotricity.co.uk/our-green-energy/energy-independence/uk-grid-live.
10 Realtimecarbon (2011). Real Time Carbon. Retrieved 25 March 2011 from realtimecarbon.org.
11 Arup & Cenex (2008). Investigation into the Scope for the Transport Sector to Switch to Electric Vehicles and Plug-in Hybrid Vehicles. Retrieved 16 March 2011 from http://www.berr.gov.uk/files/file48653.pdf.
12 HM Government (2009). The UK Low Carbon Transition Plan: National strategy for climate and energy. London: The Stationary Office.
The Royal Automobile Club Foundation for Motoring Limited is a charity which explores the economic, mobility, safety and environmental issues relating to roads and responsible road users. Independent and authoritative research, carried out for the public benefit, is central to the Foundation’s activities.
Shades of Green - Which low-carbon cars are the most eco-friendly? 9
Overall winner: VW Golf Blue-e-MotionCategory 1: Pure electric vehiclesFord Transit Connect Electric Proton Saga ElectricLiberty E-Cars Electric Range Rover smart electric driveLiberty E-Cars Electric Range Rover Tata Indica VistaLotus Elise S1 Electric Tesla Roadster SportMaxEV VW Caddy Maxi Tesla Roadster SportMG MG-F Electric Tesla Roadster SportMini E Electric Tesla RoadsterMitsubishi i-MiEV Vince NemesisNicholson McLaren Citroën Nemo Van VW Golf Blue-e-MotionNicholson McLaren Citroën Nemo Van Zytek Mercedes Benz Vito TaxiNissan Leaf
Category 2: Hybrid, plug-in hybrid, extended-range and hydrogen fuel cell vehiclesHonda CR-Z Hybrid Toyota Auris HybridHonda CR-Z Hybrid Toyota Auris HybridHonda FCX Clarity Toyota FCHV-ADV Fuel Cell HighlanderMercedes Benz B-Class F-Cell Toyota Prius Hybrid (1st generation)Proton Exora E-REV Toyota Prius Hybrid (2nd generation)Toyota Auris Hybrid Toyota Prius Hybrid (2nd generation)Toyota Auris Hybrid Toyota Prius Hybrid (3rd generation)Toyota Auris Hybrid Toyota Prius Hybrid (3rd generation)Toyota Auris Hybrid Toyota Prius Hybrid (3rd generation)Toyota Auris Hybrid Toyota Prius Hybrid (3rd generation)Toyota Auris Hybrid Toyota Prius Plug-In HybridToyota Auris Hybrid Toyota Prius Plug-In HybridToyota Auris Hybrid Vauxhall Ampera E-REV
Category 3: Pure internal combustion engine vehiclesBMW 320d Effi cientDynamics Renault Clio 1.5 dciBMW 320d Effi cientDynamics Skoda Fabia Greenline IIFord Fiesta 1.6 TDCi/DPF ECOnetic Vauxhall Astra 1.3 CDTi ecoFlexFord Fiesta Van 1.6 TDCi ECOnetic Vauxhall Corsa 1.3 CDTi ecoFlex Start/StopFord Focus 1.6 TDCi ECOnetic Vauxhall Corsa 1.3 CDTi ecoFlex Start/StopGordon Murray Design T.25 VW Golf BlueMotionMini Cooper Diesel VW Golf BlueMotionRenault Clio 1.5 dci VW Polo BlueMotion
RAC Foundation89-91 Pall MallLondonSW1Y 5HS
Tel no: 020 7747 3445www.racfoundation.org
Registered Charity No. 1002705May 2011 © Copyright Royal Automobile Club Foundation for Motoring Limited
Designed and printed by The Javelin Partnership Ltd Tel: 01189 303 123
Produced on paper from a managed sustainable source, using pulp that is ECF, also FSC certifi ed as containing 50% recycled waste.
Fore more information about the RAC Future Car Challenge please visit www.futurecarchallenge.com.
The event is organised and promoted by Motion Works - 01327 856 024 / [email protected].