shadow economies internationaleconomicjournal … · indications for an increase of the shadow...
TRANSCRIPT
New Estimates for the Shadow Economies all over the World 1
Friedrich Schneider2, Andreas Buehn3, and Claudio E. Montenegro4
This Version: October, 2010
Abstract
This paper presents estimations of the shadow economies for 162 countries, including developing, Eastern
European, Central Asian, and high income OECD countries over 1999 to 2006/2007. According to our
estimations, the weighted average size of the shadow economies (as a percentage of "official" gross
domestic product) in Sub-Saharan Africa is 38.4 percent; in Europe and Central Asia (mostly transition
countries) 36.5 percent, and in high-income OECD countries 13.5 percent.. We find that an increased burden
of taxation (direct and indirect ones), combined with (labor market) regulations and the quality of public goods
and services as well as the state of the “official” economy are the driving forces of the shadow economy.
JEL-class: O17, O5, D78, H2, H11, H26.
Keywords: Shadow Economy of 162 Countries, Tax Burden, Quality of State Institutions, Regulation, MIMIC
Model
1 Responsibility for the content of this paper is ours and should not be attributed to our affiliated institutions. We would like to thank suggestions and comments received at the 2010 Annual Meeting of the Public Choice Society (Monterrey, CA), the 2010 Annual Meeting of the European Public Choice Society (Izmir, Turkey), the workshop Shadow Economy, Tax Policy, and Labour Markets in International Comparison: Options for Economic Policy, and the 2010 Annual Meeting of the International Institute of Public Finance (Uppsala, Sweden). 2 Friedrich Schneider, Department of Economics, Johannes Kepler University of Linz, A-4040 Linz-Auhof, Austria. Phone: +43-732-2468-8210, Fax: +43-732-2468-8209. E-mail: [email protected]. 3 Andreas Buehn, Technische Universität Dresden, Faculty of Business and Economics, Chair for Economics, esp. Monetary Economics, 01062 Dresden, Email: [email protected]. 4 Claudio E. Montenegro, Development Research Group, Poverty and Inequality Unit, The World Bank; and Department of Economics, Universidad de Chile. Email: [email protected].
2
1. Introduction
Information about the extent of the shadow economy, who is engaged, the frequency of these activities, and their
magnitude is crucial for making effective and efficient decisions regarding the allocations of a country’s resources
in this area. Unfortunately, it is very difficult to get accurate information about shadow economy activities on the
goods and labor market, because all individuals engaged in these activities do not wish to be identified. Hence,
doing research in this area can be considered as a scientific passion for knowing the unknown.
Although substantial literature exists on single aspects of the hidden or shadow economy and comprehensive
surveys have been written by Schneider and Enste (2000), and Feld and Schneider (2010), the subject is still quite
controversial as there are disagreements about the definition of shadow economic activities, the estimation
procedures and the use of their estimates in economic analysis and policy aspects.5 Nevertheless, there are some
indications for an increase of the shadow economy around the world, but little is known about the development and
the size of the shadow economies in developing, Eastern European and Central Asian (mostly the former transition
countries), and high income OECD countries over the period 1999 to 2007. This paper is an attempt to fill this gap
by using the same estimation technique and almost the same data sample.
Hence, the goal of this paper is twofold: (i) to undertake the challenging task of estimating the shadow economy
for 162 countries all over the world and (ii) to provide some insights into the main causes of the shadow economy
and a unique database of the size and trend of the shadow economy for 162 countries between 1999 and 2007. This
is an improvement compared to previous work, because we successfully “created” a unique dataset and used the
MIMIC estimation method for all countries with the explicit goal to have a comparable shadow economy data set.
2. Some Theoretical Considerations about the Shadow Economy
One commonly used working definition of the shadow economy is all currently unregistered economic activities
that contribute to the officially calculated (or observed) Gross National Product.6 Smith (1994, p. 18) defines it as
“market-based production of goods and services, whether legal or illegal, that escapes detection in the official
estimates of GDP.” In this paper the following more narrow definition of the shadow economy is used: the shadow
economy includes all market-based legal production of goods and services that are deliberately concealed from
public authorities to avoid payment of income, value added or other taxes; to avoid payment of social security
contributions; having to meet certain legal labor market standards, such as minimum wages, maximum working
5 Compare the different opinions of Tanzi (1999), Thomas (1999), Giles (1999a,b) and Pedersen (2003). 6 This definition is used for example, by Feige (1989, 1994), Schneider (2005, 2007), Feld and Schneider (2010) and Frey and Pommerehne (1984). Do-it-yourself activities are not included. For estimates of the shadow economy
3
hours, safety standards, etc.; and complying with certain administrative procedures, such as completing statistical
questionnaires or administrative forms. Given this definition, important determinants of the shadow economy are:
a) Tax and Social Security Contribution Burdens
It has been ascertained that the overall tax and social security contribution burdens are among the main causes for
the existence of the shadow economy.7. The bigger the difference between the total cost of labor in the official
economy and the after-tax earnings (from work), the greater is the incentive to avoid this difference and to work in
the shadow economy. Since this difference depends broadly on the social security burden/payments and the overall
tax burden, the latter are key features of the existence and the increase of the shadow economy.
The concrete measurement of the tax and social security contribution burdens is not easy to define, because the tax
and social security systems are vastly different among the countries. In order to have some general comparable
proxies, we use the following causal variables: (1) Indirect taxes as a proportion of total overall taxation (positive
sign expected); (2) Share of direct taxes: direct taxes as proportion of overall taxation (positive sign expected); (3)
Size of government: general government final consumption expenditures (in percent of GDP, which includes all
government current expenditures for purchases of goods and services; positive sign expected); (4) Fiscal freedom
as subconent of the Heritage Foundation’s economic freedom index measures the fiscal burden in an economy; i.e.
top tax rates on individual and corporate income. The index ranges from 0 to 100, where 0 is least fiscal freedom
and 100 maximum degree of fiscal freedom (negative sign expected).
b) Intensity of Regulations
Increased intensity of regulations is another important factor which reduces the freedom (of choice) for individuals
engaged in the official economy. One can think of labor market regulations such as minimum wages or dismissal
protections, trade barriers such as import quotas, and labor market restrictions for foreigners such as restrictions
regarding the free movement of foreign workers. Johnson et al. (1998b) find significant overall empirical evidence
of the influence of (labor) regulations on the shadow economy; and the impact is clearly described and theoretically
derived in other studies, e.g. for Germany (Deregulation Commission 1990/91). Regulations lead to a substantial
increase in labor costs in the official economy. But since most of these costs can be shifted to the employees, these
costs provide another incentive to work in the shadow economy, where they can be avoided. Their empirical
and the do-it-yourself activities for Germany see Buehn et al. (2009). 7 See Schneider (1986, 2005, 2007); Johnson et al. (1998a,1998b); Tanzi (1999); Giles (1999a); Giles and Tedds (2002); Feld and Schneider (2010).
4
evidence supports the model of Johnson et al. (1997), which predicts, inter alia, that countries with more general
regulation of their economies tend to have a higher share of the unofficial economy in total GDP.
To measure the intensity of regulation or the impact of regulation on the decision of whether to work in the official
or unofficial economy is a difficult task, and we try to model this by using the following causal variables: (1)
Business freedom: it is a subcomponent of the Heritage Foundation’s economic freedom index; it measures the
time and efforts of business activity. It ranges from 0 to 100, where 0 is least business freedom and 100 maximum
business freedom (negative sign expected); (2) Economic freedom: Heritage Foundation economic freedom index
which ranges from 0 to 100, where 0 is least economic freedom and 100 maximum economic freedom (negative
sign expected); (3) Regulatory quality: World Bank´s regulatory quality index including measures of the incidents
of market-unfriendly policies, such as price controls or inadequate bank supervision, as well as perceptions of the
burdens imposed by excessive regulation in areas, such as foreign trade and business development. It scores
between -2.5 and +2.5 with higher scores corresponding to better outcomes (negative sign expected).
c) Public Sector Services
An increase of the shadow economy can lead to reduced state revenues which in turn reduce the quality and
quantity of publicly provided goods and services. Ultimately, this can lead to an increase in the tax rates for firms
and individuals in the official sector, quite often combined with a deterioration in the quality of the public goods
(such as the public infrastructure) and of the administration, with the consequence of even stronger incentives to
participate in the shadow economy. The provision and especially the quality of the public sector services is thus
also a crucial causal variable for people’s decision to work or not work in the shadow economy. To capture this
effect, we have the following variable: Government Effectiveness from the World Bank´s Worldwide Governance
Indicators. It captures perceptions of the quality of public services, the quality of the civil service and the degree of
its independence from political pressures, the quality of policy formulation and implementation, and the credibility
of government’s commitment to such policies. The scores of this index lie between -2.5 and +2.5 with higher
scores corresponding to better outcomes (negative sign expected).
d) Official Economy
As it has been shown in a number of studies (Enste and Schneider, 2006; Feld and Schneider, 2010) the situation of
the official economy also plays a crucial role of people’s decision to work or not to work in the shadow economy.
In a booming official economy, people have a lot of opportunities to earn a good salary and “extra money” in the
5
official economy. This is not the case in an economy facing a recession and more people try to compensate their
losses of income from the official economy through additional shadow economy activities. In order to capture this,
we will use the following variables: (1) GPD per capita based on Purchasing Power Parity (PPP), measured in
constant 2005 US$ (negative sign expected); (2) Unemployment rate defined as total unemployment in percent of
total labour force (positive sign expected); (3) Inflation rate: GDP deflator (annual rate in percent); inflation is
measured by the annual growth rate of the GDP implicit deflator, it shows the rate of price changes in the economy
as a whole (positive sign expected); (4) Openness: openness corresponds to trade (in percent of GDP). Trade is the
sum of exports and imports of goods and services, measured as a share of gross domestic product (negative sign
expected).
Because the shadow economy cannot be directly measured, we have to use indicators in which shadow economy
activities are reflected. Here, we use the following indicators:
e) Monetary Indicators
Given that people who engage in shadow economy transactions do not want to leave traces, they conduct these
activies in cash. Hence, most shadow economy activities are reflected in an additional use of cash (or currency). To
take into account this, we use the following two indicators: (1) M0 / M1: M0 corresponds to the currency outside
the banks; the usual definition for M1 is M0 plus deposits; (2) Currency / M2: It corresponds to the currency
outside the banks as a proportion of M2.
f) Labour Market Indicators
Shadow economy activities are also reflected in labour market indicators. We use the following two: (1) Labour
force participation rate: Labour force participation rate is a proportion of the population that is economically active,
supply of labour for the production of goods and services during a specified period; (2) Growth rate of the total
labour force: Total labour force compromises people aging 15 and older who meet the International Labor
Organisation´s (ILO) definition of the economically active population: all people who supply labour for the
production of goods and services during a specified period.
g) State of the Official Economy
Also, shadow economy activities are reflected in the state of the official economy. For this reason, we include the
6
following two indicators: (1) GDP per capita: GDP per capita is gross domestic product converted to international
dollars using Purchasing Power Parity rates, divided by the population; (2) Growth rate of GDP per capita, as (1),
but the annual growth rate of the GDP per capita.
3. The Size of the Shadow Economy for 162 Countries
3.1 Econometric Methodology
Estimating the size and trend of a shadow economy is a difficult and challenging task. Methods – designed to
estimate the size and trend of the shadow economy – such as the currency demand approach or the electricity
approach consider just one indicator that ”must” capture all effects of the shadow economy. However, it is obvious
that shadow economy effects show up simultaneously in the production, labor, and money markets. The empirical
method used in this paper is based on the statistical theory of unobserved variables, which considers multiple
causes and multiple indicators of the phenomenon to be measured, i.e. it explicitly considers multiple causes
leading to the existence and growth of the shadow economy, as well as the multiple effects of the shadow economy
over time.8 In particular, we use a Multiple Indicators Multiple Causes (MIMIC) model – a Structural Equation
Model (SEM) with one latent variable – for the empirical analysis.
The main idea behind an SEM is to examine the relationships among unobserved variables in terms of the
relationships among a set of observed variables by using the covariance information of the latter. In particular, an
SEM compares a sample covariance matrix, i.e. the covariance matrix of the observed variables, with the
parametric structure imposed on it by a hypothesized model.9 The relationships among the observed variables are
described in terms of their covariances and it is assumed that they are generated by (a usually smaller number of)
unobserved variables. In the MIMIC model presented in this paper, the shadow economy is the unobserved
variable and is analyzed with respect to its relationship to the observed variables using the covariance matrix of the
latter. For this purpose, the unobserved variable is in a first step linked to the observed indicator variables in a
factor analytical model also called measurement model. Second, the relationships between the unobserved variable
and the observed explanatory (causal) variables are specified through a structural model. Thus, a MIMIC model is
the simultaneous specification of a factor model and a structural model. In this sense, the MIMIC model tests the
consistency of a “structural” theory through data and has two goals: (i) estimating the parameters (coefficients,
variances, etc.) and (ii) assessing the fit of the model. Applying this to the shadow economy research, these two
8 The pioneers of this approach are Frey and Weck-Hannemann (1984) who applied this approach to cross-section data from the 24 OECD countries for various years. 9 A general overview about the SEM approach is given in e.g. Bollen (1989).
7
goals mean (i) measuring the relationships of a set of observed causes and indicators to the shadow economy
(latent variable), and (ii) testing if the researcher’s theory or the derived hypotheses, as a whole, fit the data used.
3.2 Econometric Results
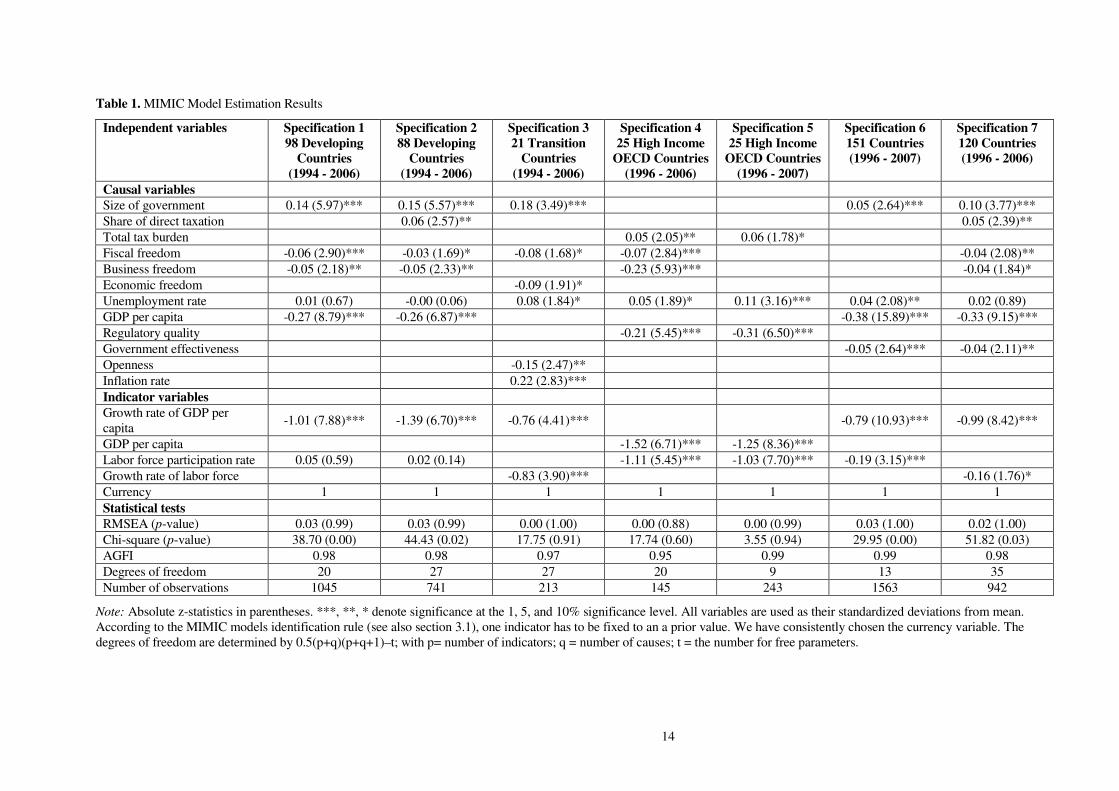
Table 1 presents seven different specifications because we think it is interesting to see which variables turn out to
be significant, especially if one uses subsamples of countries, where more and different causal variables are
available. We believe that it is interesting to see which variables have an influence on the size and trend of the
shadow economy, if we have more and better data available. The ideal situation of course would be, if a large data
set would be available for all countries over the total period 1996 up to 2007, but this is unfortunately not the case.
For the total sample two estimations are shown, one for the 151 countries over 1996 to 2007 and, with more causal
variables, one sample for 120 countries over 1996 to 2006. In addition to the total sample estimations, econometric
estimations using the MIMIC approach are presented for 98 (88) developing countries, 21 Eastern European and
Central Asian (mostly former transition) countries; and 25 high income OECD-countries. For the developing
countries, two estimations with and without the direct tax burden rate as causal variable are presented; without
direct tax burden rate the number of development countries increase from 88 to 98. For the high income OECD
countries again two estimations are shown, one over the period 1996 to 2006 and one over the period 1996 to 2007.
For the 98 (88) developing countries and the 21 Eastern European and Central Asian countries, the estimation was
done over the period 1994 to 2006 and for the 25 OECD countries over the period 1996 to 2007. For the total
sample of 151(120) countries we use data for the period from 1996 up to 2007(2006).
For the developing countries we use as cause variables the following six: share of direct taxation (direct taxes in
percent of overall taxation), size of government (general government final consumption expenditure, in percent of
GDP) as proxy for indirect taxation and a variable, fiscal freedom (an index consisting of top individual income tax
rate, top individual corporal tax rate, and total tax revenues as percent of GDP) as three tax burden variables in a
wide sense; regulatory intensity for state regulation, and the business freedom index (which is composed of the
following components: time to open a business, financial costs to start a business, minimum capital stock to start a
business, and costs for obtaining a licence), the state of economy with the two variables: the unemployment rate
and GDP per capita. As indicator variables we use growth rate of GDP per capita, the labor force participation rate
(people over 15 economically active in % of total population), and as currency we use M0 divided by M1. For the
Eastern European and Central Asian (mostly former transition) countries, we use as cause variables the size of
government, the fiscal freedom index, for state regulation the business freedom index, and for the state of the
8
economy the unemployment rate, inflation rate and openness (sum of export and imports of goods and services, in
percent of GDP). As indicators, we use the growth rate of GDP per capita, the growth rate of total labor force, and
the ratio M0 over M1. For the 25 OECD countries, we use the total tax burden (total tax revenues in percent of
GDP), the fiscal and business freedom indices, a regulatory quality index, and the unemployment rate. As indicator
variables, we use GDP per capita, the labor force participation rate and a measure for currency (M0 over M2). For
the total sample of 151 countries we use as cause variables the size of the government, the unemployment rate,
government effectiveness, and the GDP per capita. As indicators we use currency (M0 over M1), the growth rate of
GDP per capita, and the labor force participation rate. For the 120 countries, we have additional causal variables.
Here we include the size of the government, the fiscal freedom index, the share of direct taxation, the business
freedom index, the unemployment rate, government effectiveness, and the GDP per capita. As indicator variables
we use currency (M0 over M1), the growth rate of GDP per capita, and the growth rate of total labor force.
The estimations results for the 98 developing countries over the period 1994 to 2006 are shown in specification 1,
and the estimation results for the 88 developing countries (including direct taxation) over the same period are
shown in specification 2. In both estimations, all estimated coefficients of the cause variables have the theoretically
expected signs. Except for the unemployment rate, all other cause variables are statistically significant, at least at
the 90-percent confidence level. The share of direct taxation and the size of government are highly statistically
significant, as well as the fiscal freedom and the business freedom variable. Also, the GDP per capita is in both
equations highly statistically significant with the expected negative sign. If we turn to the indicator variables, the
labor force participation rate and the growth rate of GDP per capita are in both equations highly statistically
significant. The test statistics are also quite satisfactory.
In specification 3, the MIMIC estimation result for the 21 Eastern European and Central Asian (mostly former
transition) countries over the period 1994 to 2006 is shown. The size of government and the fiscal freedom variable
(both capturing the overall state burden), they are highly statistically significant causes and have the expected
signs. Turning to regulation, the economic freedom variable has the expected negative significant sign. As these
countries experienced periods of high inflation, we include the inflation rate which has the expected positive,
highly significant sign. The variable openness, modelling in a certain way the transition process, is also statistically
significant. Considering the indicator variables, the growth rate of the total labor force is statistically significant, as
well as the growth rate of GDP per capita. Also, here the test statistics are quite satisfactory.
9
In specifications 4 and 5, the estimation results for the 25 high income OECD countries are shown over the period
1996 to 2006 and 1996 to 2007.10 In specification 4, the two variables capturing government burden (total tax
burden and fiscal freedom) are highly statistically significant and have the expected sign. The unemployment rate
has the expected sign and is at 95 percent confidence level statistically significant. The two variables capturing the
regulatory burden, i.e., business freedom and regulatory quality, have the expected signs and are highly statistically
significant. Turning to the indicator variables, the labor force participation rate and currency (ratio of M0 over M2)
are both highly statistically significant. Also, the test statistics for this equation are quite satisfactory. Specification
5 excludes fiscal and business freedom which allows us to estimate the model up to the year 2007. All causal
variables are highly statistically significant and have the expected signs. as the same is true for the indicators.
Specifications 6 and 7 present two estimations of 151 and 120 countries. In specification 6 we present the results of
151 countries estimated over the period 1996 to 2007. Turning first to the causal variables, we see that the size of
government has the expected positive sign and is highly statistically significant. The same holds for the two
variables which describe the state of the economy, the unemployment variable, statistically significant with a
positive sign, and GDP per capita, which is highly statistically significant with the expected negative sign. Turning
to the indicator variables, the growth rate of GDP per capita and the labor force participation rate have the expected
signs and are highly statistically significant. If we reduce this sample to 120 countries, we can include more causal
variables and the results are presented in specification 7. Here, we see that as we have three variables capturing the
burden of taxation (in a wide sense): the size of government, fiscal freedom and share of direct taxation. All three
have the expected signs and are statistically significant. As regulatory variables we have business freedom and
government effectiveness which, again, have the expected negative signs and are statistically significant. For the
state of the economy, we have the unemployment rate, which is not statistically significant, and GDP per capita,
statistically significant with the expected negative sign. For the indicators, we have currency (M0 over M1), the
labour force participation rate and GDP per capita, being statistically significant and showing the expected sign.
Summarizing the results, we can say that for all groups of countries, the theoretical considerations of the causes of
the shadow economy in section 2 behave according to our expectations. However, the estimated coefficients in
table 1 are quite different in magnitude from one specification to the next. Because it is rather difficult to come up
with an explanation for the exact differences in the magnitude of the coefficients, we only present a general
interpretation for this observation. With respect to the indices measuring regulation in one way or the other, i.e the
fiscal freedom and business/economic freedom indices, our results suggest that regulation is a much more
10 A number of variables is not available for 2007, hence we have two different sets of cause variables.
10
important determinant in developed and transition countries than in developing ones. It seems that – for the reason
that the burden of regulation is on average higher in developed and transition countries as more rules, regulations,
and administrative procedures are in place – the importance of regulation being a determinant of the shadow
economy increases with the level of development. On the contrary, in developing countries in which regulation is
often less burdensome, the coefficients of the fiscal and business freedom indices are much smaller and hence
regulation is a less important determinant of the shadow economy. Regarding the unemployment rate, the results
are comparable. It does not influence the shadow economies in developing countries but in transition and the
OECD countries. It seems that higher unemployment rates due to on average more regulated and hence less
flexible labor markets significantly contribute to the size and trend of the shadow economies in OECD countries. In
developing countries however, unemployment is not a significant determinant of the shadw economy. In these
countries, the income earned in the shadow economy guarantees subsistence of families. Comparing specifications
3 and 5, the unemployment rate seems to be a more important determinant in OECD than in transition countries.
The estimation results further show a slightly different impact of “policy” causal variables compared to non-policy
“economic” causal variables across the different groups of countries. In general economic variables, i.e. the level of
development and the state of the economy measured by the GDP per capital and the unemployment rate are very
important determinants of the shadow economy. The estimated coefficient indicate that an improvement of
economic conditions would reduce the size of the shadow economy at most. Of course, for the unemployment rate
this is only true for transition and highly developed OECD countries. Comparing the impact of the policy variables
such as the different measures of the tax burdern and regulation on the shadow economy across the estimated
specifications also reveals interesting results. A reduction of the regulatory burden and improvement of
business/economic freedom in transition and OECD countries leads to a much higher reduction of the shadow
economy than it would in developing countries; which is clearly indicated by the (much) larger coefficients of
these variables. Fiscal freedom, however, is similarily important across all groups of countries.
[Table 1 here]
3.2 The Size of the Shadow Economies for 162 Countries from 1999 to 2007
The estimated MIMIC coefficients allow us to determine only relatively estimated sizes of the shadow economy,
which describe the pattern of the shadow economy in a particular country over time. In order to calculate the size
and trend of the shadow economy, we must convert the MIMIC index into “real world” figures measured in
percentage of official GDP. This final step requires an additional procedure so called benchmarking or calibration
11
procedure. Unfortunately, no consensus exists in the literature which benchmarking procedure to use. The
methodology we use was promoted by Dell’Anno (2007) and Dell’Anno and Solomon (2008). In the first step, the
MIMIC model index of the shadow economies is calculated using the structural equation (1), i.e. by multiplying
the coefficients of the significant causal variables with the respective time series. For the numerical example of
specification 1 the structural equation is given as
t 1t 2t 3t 4t0.14 x 0.06 x 0.05 x 0.27 xη = ⋅ − ⋅ − ⋅ − ⋅% .11 (1)
Secondly, this index is converted into absolute values of the shadow economies taking a base values in a particular
base year. The base values necessary for this final step of the calibration procedure are from the year 2000 and
taken from Schneider (2007) who estimated the shadow economies in 145 countries around the world using the
MIMIC and the currency demand approach. Thus, the size of the shadow economy tη̂ at time t is given as:
tt 2000
2000
ˆη
η ηη
∗=
%
%, (2)
where tη% denotes the value of the MIMIC index at t according to equation (1), 2000η% is the value of this index in
the base year 2000, and 2000η∗ is the exogenous estimate (base value) of the shadow economies in 2000. Applying
this benchmarking procedure, the final estimates of the shadow economies can be calculated.12
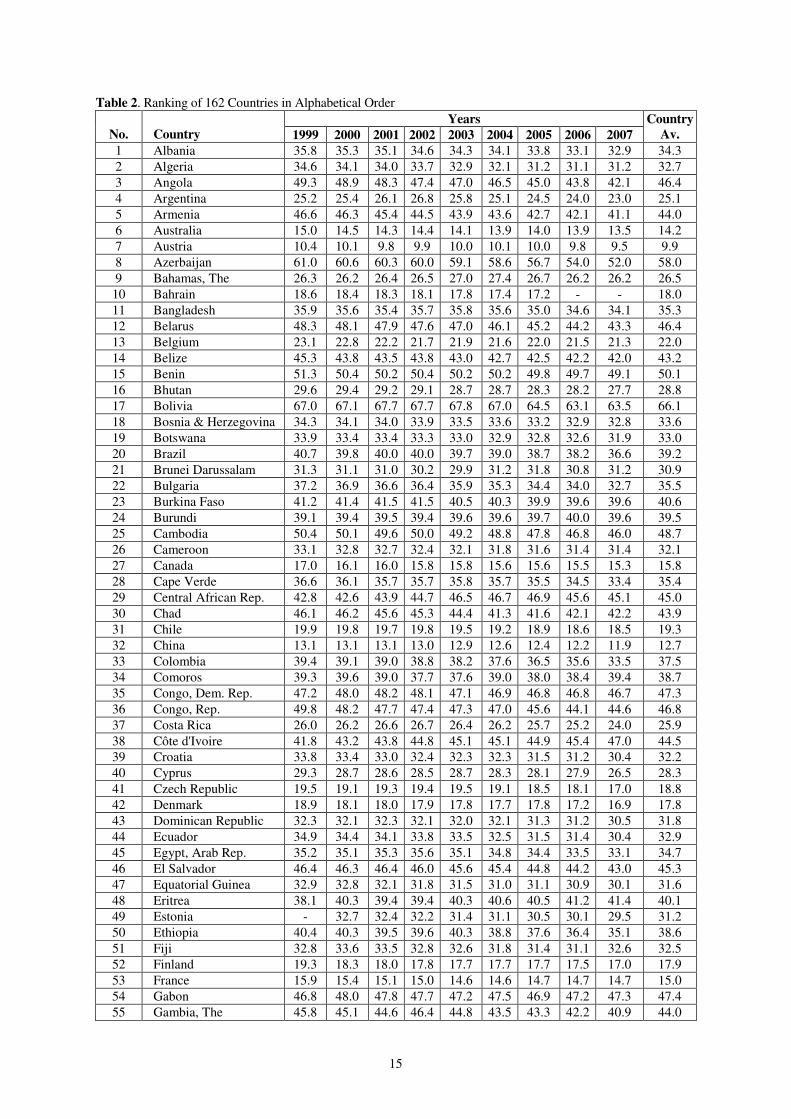
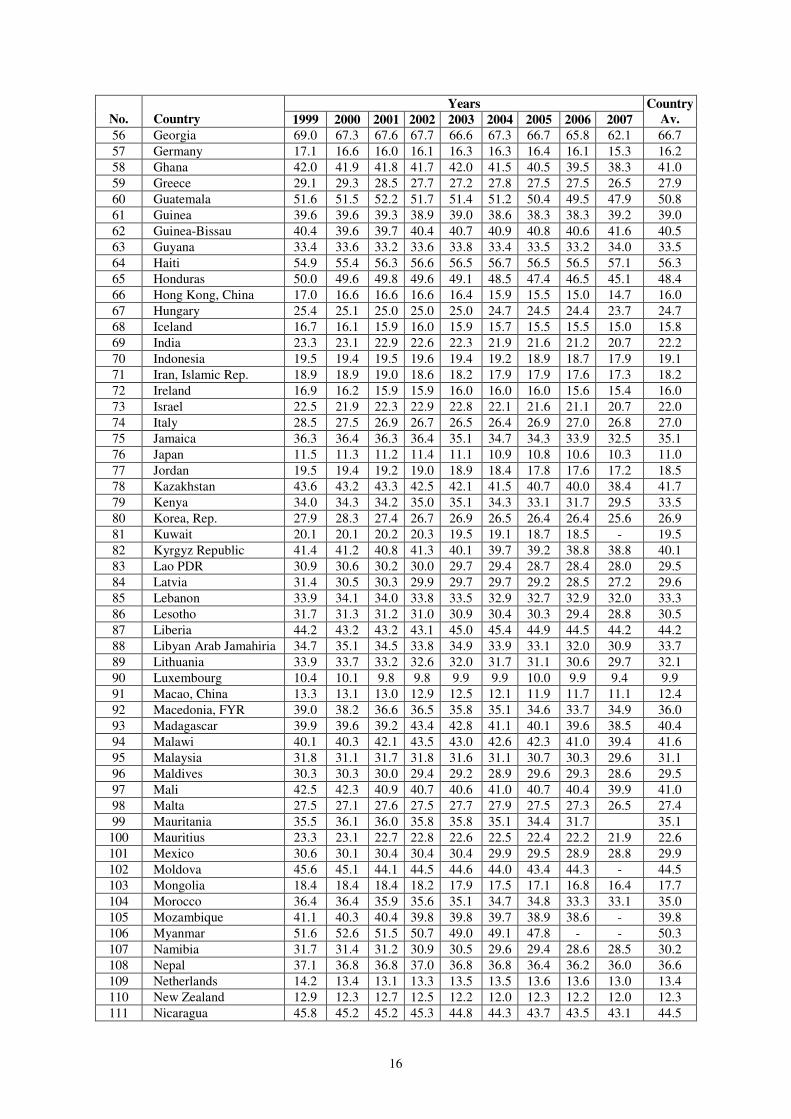
Of course, when showing the size of the shadow economies for countries which are quite different in location and
developing stage, one should be aware that such country comparisons give only a rough picture of the ranking of
the size of the shadow economy in these countries and over time, because the MIMIC and the currency demand
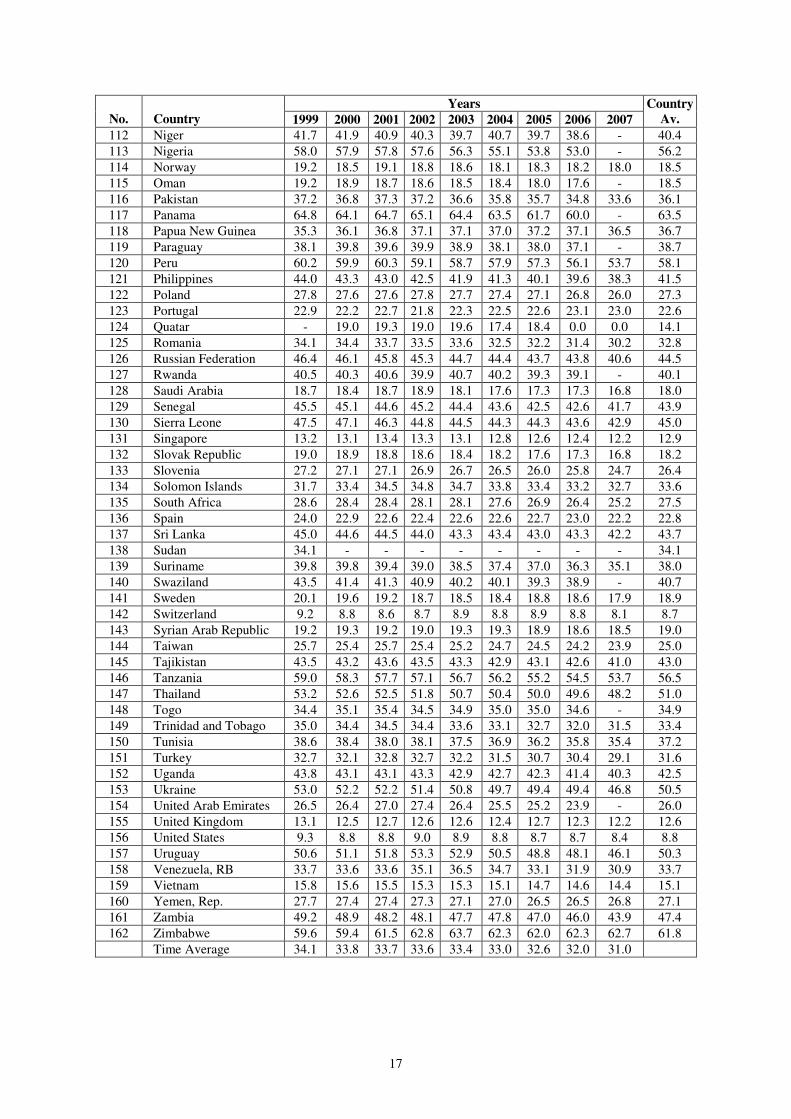
methods have shortcomings (see e.g. Breusch (2005) and Ahumada et al. (2007). Table 2 shows (in alphabetical
order) the development of the shadow economy in 162 countries between 1999 and 2007.
[Table 2 here]
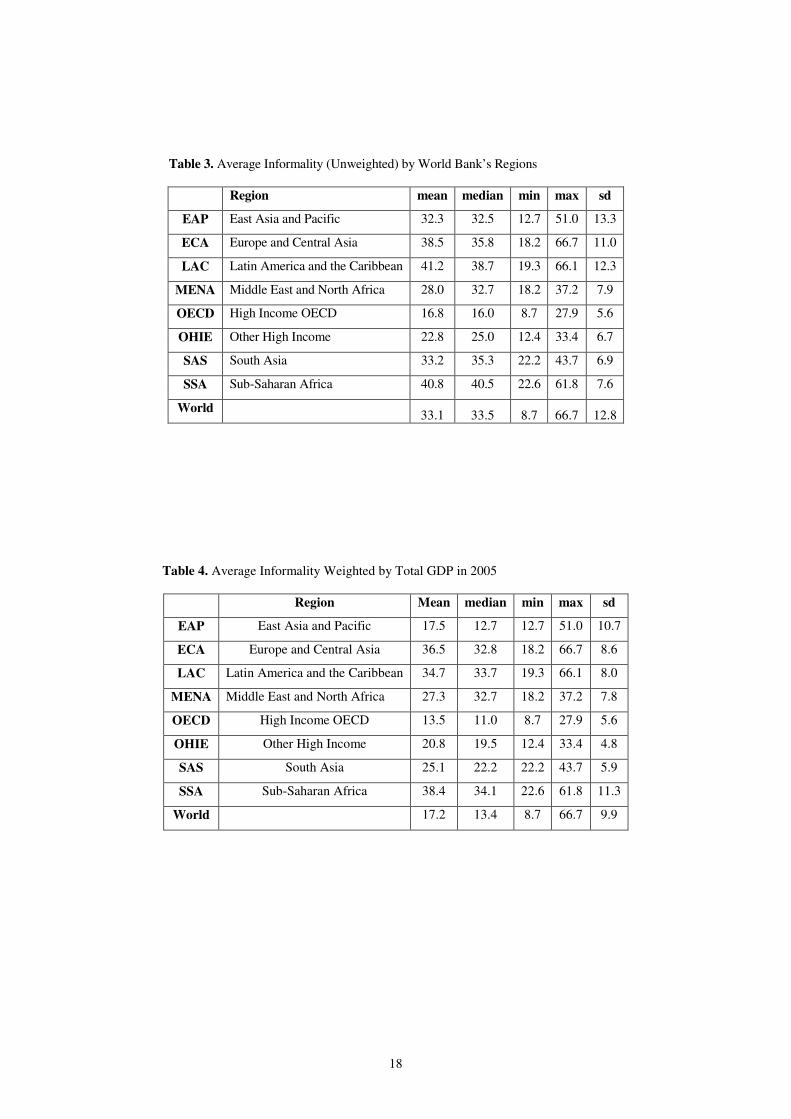
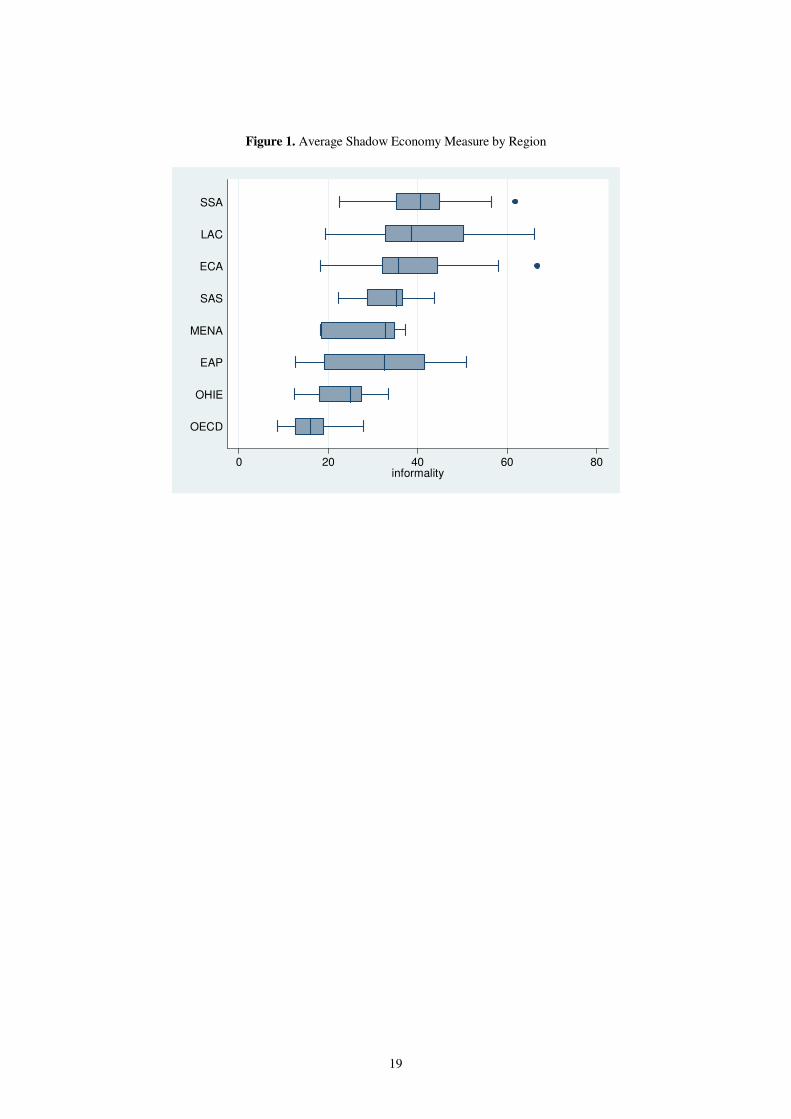
We turn now to analyze the measurement estimates by regions using the regions as defined by the World Bank.
The World Bank distinguishes eight world regions. The mean, median, minimum, maximum, standard deviation
and number of observations (countires) in each region are presented in table 3. The medians by region are ploted in
Figure 1 ordered from the highest at the top to the lowest at the bottom. The regional results are very clear: Sub-
Saharan Africa has the highest estimates of the shadoe economy (with a median of 40.5) followed by Latin
America and the Carribean (38.7) and Europe and Central Asia (35.8). At the bottom of the distribution we find the
11 x1t is size of government, x2t and x3t are the fiscal and business freedom index, and x4t represents GDP per capita. According to the MIMIC approach, all series are standardized deviations from mean. 12 The base values originate from the year 2000 except for some developing countries, for which we sometimes used base values from the year 2005 because of data availability. The MIMIC index has been adjusted to the positive range by adding a positive constant.
12
OECD countries with a median of 16.0. The table also shows that there are big disparities among the same region.
Finally table 3 also shows that 8.1 is the lowest level of informality for any country in the world (Switzerland), and
the highest is 63.5 (Bolivia) in 2007.
[Table 3 and Figure 1 here]
While Table 3 presents at its bottom line the simple unweighted yearly average which is not the average
informality for the World but the average World’s informality when one weights every country equally. In order to
measure how much of the GDP in the world is really informal, we weighted by total country GDP. In particular,
for every country/year we weighted the rate of informality by the total GDP. This gives us the GDP in current
Billion US dollars that is informal for each country/year. Then we added up this amount and divided it by the total
GDP of the sample. The same had also been done for the sub-samples of the eight world regions the World Bank
distinguishes. According to these calculations Tabe 4 shows much lower rates of informal GDP for the world as a
whole, with an average of 17.2%. The results with respect to the countries’ development stage are very impressive
too: the averages of the weighted yearly informality estimates demonstrate that Sub-Saharan Africa has the largest
shadow economies (with an average of 38.4%) followed by Europe and Central Asia (with an average of 36.5%).
At the bottom of the distribution we find the OECD countries with and average of 13.5%, which is consistent with
the fact that richer economies have lower informality rates.
[Table 4 here]
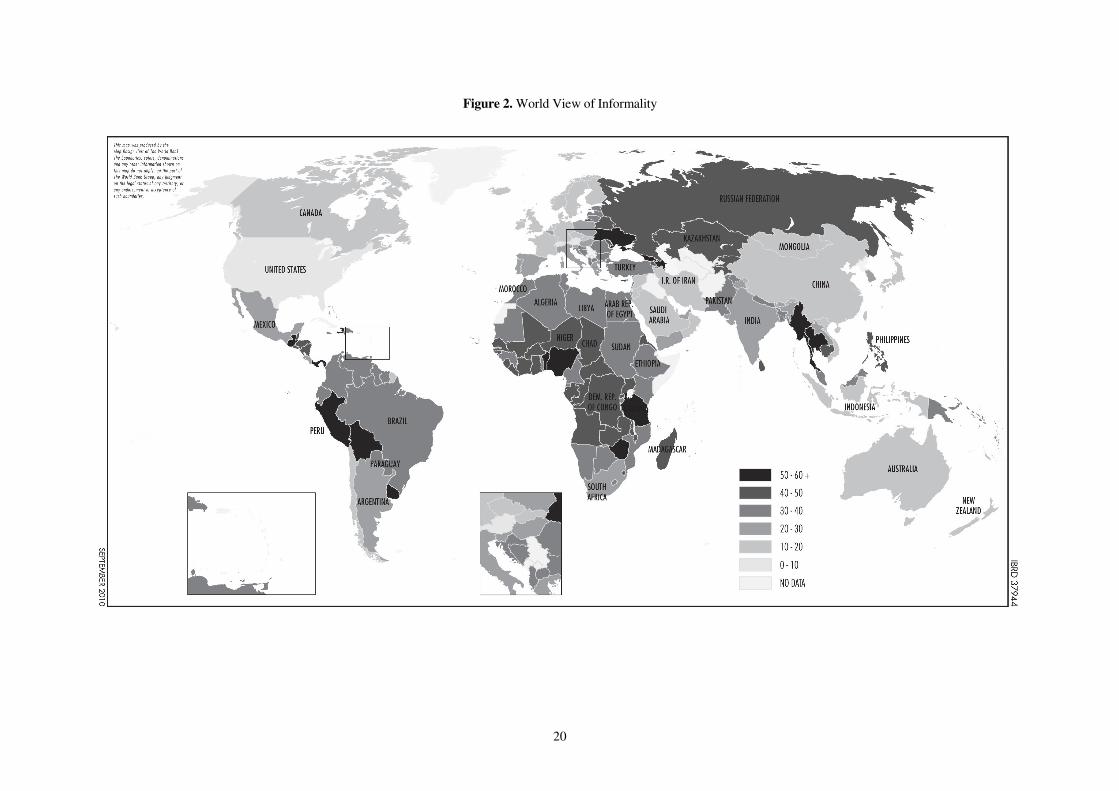
Finally, we present the informality measurement country by country in a world map view. Countries shown with
darker colors in figure 2 indicate countries with higher level of informality. Among them: Azerbaijan, Bolivia,
Peru, Panama, Tanzania, and Zimbabwe. Countries shown with ligther color indicate countries with lower levels of
informality. Among them: Austria, Japan, Luxembourg, Switzerland, the United States, and the United Kingdom.
[Figure 2 here]
5. Summary and Conclusions
There are many obstacles to overcome when measuring the size of the shadow economy and when analyzing its
consequences on the official economy. But, as this paper shows, some progress can be made. We provide estimates
of the size of the shadow economies for 162 countries over the period 1999 to 2007 using the MIMIC procedure
for the econometric estimation; and a benchmarking procedure for calibrating the estimated MIMIC into absolute
values of the size of the shadow economy. The new knowledge/insights gained with respect to the size and trend of
the shadow economy of 162 countries lead to three conclusions:
13
The first conclusion from these results is that for all countries investigated the shadow economy has reached a
large size of a weighted average value of 17.2% of official GDP over 162 countries over 1999 to 2007. However,
the unweighted average size of the shadow economies of all of these 162 countries (developing, Eastern European
and Central Asian and high income OECD countries) decreased from 34.1% of official GDP in 1999 to 31.0% of
official GDP in 2007. The second conclusion is that shadow economies are a complex phenomenon present to an
important extent in all type of economies (developing, transition and highly developed). People engage in shadow
economic activities for a variety of reasons. Among the most important are government actions, most notably,
taxation and regulation. The third conclusion is that there are regional disparities in the level of informality, but
obvious regional clusters. At the top level of informality we find Sub-Saharan Africa, and at the lowest level of
informality we find the OECD countries.
Considering these three conclusions, it is obvious that one of the big challenges for every government is to
undertake efficient incentive orientated policy measures in order to make work less attractive in the shadow
economy and, hence, to make the work in the official economy more attractive. Successful implementation of such
policies may lead to a stabilization, or even reduction, of the size of the shadow economy. Of course, even after 20
years of intensive research the size, causes, and consequences of the shadow economy is still controversily debated
in the literature and further research is necessary to improve our understanding about the shadow economy.
14
Table 1. MIMIC Model Estimation Results
Independent variables Specification 1
98 Developing
Countries
(1994 - 2006)
Specification 2
88 Developing
Countries
(1994 - 2006)
Specification 3
21 Transition
Countries
(1994 - 2006)
Specification 4
25 High Income
OECD Countries
(1996 - 2006)
Specification 5
25 High Income
OECD Countries
(1996 - 2007)
Specification 6
151 Countries
(1996 - 2007)
Specification 7
120 Countries
(1996 - 2006)
Causal variables
Size of government 0.14 (5.97)*** 0.15 (5.57)*** 0.18 (3.49)*** 0.05 (2.64)*** 0.10 (3.77)***
Share of direct taxation 0.06 (2.57)** 0.05 (2.39)**
Total tax burden 0.05 (2.05)** 0.06 (1.78)*
Fiscal freedom -0.06 (2.90)*** -0.03 (1.69)* -0.08 (1.68)* -0.07 (2.84)*** -0.04 (2.08)**
Business freedom -0.05 (2.18)** -0.05 (2.33)** -0.23 (5.93)*** -0.04 (1.84)*
Economic freedom -0.09 (1.91)*
Unemployment rate 0.01 (0.67) -0.00 (0.06) 0.08 (1.84)* 0.05 (1.89)* 0.11 (3.16)*** 0.04 (2.08)** 0.02 (0.89)
GDP per capita -0.27 (8.79)*** -0.26 (6.87)*** -0.38 (15.89)*** -0.33 (9.15)***
Regulatory quality -0.21 (5.45)*** -0.31 (6.50)***
Government effectiveness -0.05 (2.64)*** -0.04 (2.11)**
Openness -0.15 (2.47)**
Inflation rate 0.22 (2.83)***
Indicator variables
Growth rate of GDP per capita
-1.01 (7.88)*** -1.39 (6.70)*** -0.76 (4.41)*** -0.79 (10.93)*** -0.99 (8.42)***
GDP per capita -1.52 (6.71)*** -1.25 (8.36)***
Labor force participation rate 0.05 (0.59) 0.02 (0.14) -1.11 (5.45)*** -1.03 (7.70)*** -0.19 (3.15)***
Growth rate of labor force -0.83 (3.90)*** -0.16 (1.76)*
Currency 1 1 1 1 1 1 1
Statistical tests
RMSEA (p-value) 0.03 (0.99) 0.03 (0.99) 0.00 (1.00) 0.00 (0.88) 0.00 (0.99) 0.03 (1.00) 0.02 (1.00)
Chi-square (p-value) 38.70 (0.00) 44.43 (0.02) 17.75 (0.91) 17.74 (0.60) 3.55 (0.94) 29.95 (0.00) 51.82 (0.03)
AGFI 0.98 0.98 0.97 0.95 0.99 0.99 0.98
Degrees of freedom 20 27 27 20 9 13 35
Number of observations 1045 741 213 145 243 1563 942
Note: Absolute z-statistics in parentheses. ***, **, * denote significance at the 1, 5, and 10% significance level. All variables are used as their standardized deviations from mean. According to the MIMIC models identification rule (see also section 3.1), one indicator has to be fixed to an a prior value. We have consistently chosen the currency variable. The degrees of freedom are determined by 0.5(p+q)(p+q+1)–t; with p= number of indicators; q = number of causes; t = the number for free parameters.
15
Table 2. Ranking of 162 Countries in Alphabetical Order
Years
No. Country 1999 2000 2001 2002 2003 2004 2005 2006 2007
Country
Av.
1 Albania 35.8 35.3 35.1 34.6 34.3 34.1 33.8 33.1 32.9 34.3
2 Algeria 34.6 34.1 34.0 33.7 32.9 32.1 31.2 31.1 31.2 32.7
3 Angola 49.3 48.9 48.3 47.4 47.0 46.5 45.0 43.8 42.1 46.4
4 Argentina 25.2 25.4 26.1 26.8 25.8 25.1 24.5 24.0 23.0 25.1
5 Armenia 46.6 46.3 45.4 44.5 43.9 43.6 42.7 42.1 41.1 44.0
6 Australia 15.0 14.5 14.3 14.4 14.1 13.9 14.0 13.9 13.5 14.2
7 Austria 10.4 10.1 9.8 9.9 10.0 10.1 10.0 9.8 9.5 9.9
8 Azerbaijan 61.0 60.6 60.3 60.0 59.1 58.6 56.7 54.0 52.0 58.0
9 Bahamas, The 26.3 26.2 26.4 26.5 27.0 27.4 26.7 26.2 26.2 26.5
10 Bahrain 18.6 18.4 18.3 18.1 17.8 17.4 17.2 - - 18.0
11 Bangladesh 35.9 35.6 35.4 35.7 35.8 35.6 35.0 34.6 34.1 35.3
12 Belarus 48.3 48.1 47.9 47.6 47.0 46.1 45.2 44.2 43.3 46.4
13 Belgium 23.1 22.8 22.2 21.7 21.9 21.6 22.0 21.5 21.3 22.0
14 Belize 45.3 43.8 43.5 43.8 43.0 42.7 42.5 42.2 42.0 43.2
15 Benin 51.3 50.4 50.2 50.4 50.2 50.2 49.8 49.7 49.1 50.1
16 Bhutan 29.6 29.4 29.2 29.1 28.7 28.7 28.3 28.2 27.7 28.8
17 Bolivia 67.0 67.1 67.7 67.7 67.8 67.0 64.5 63.1 63.5 66.1
18 Bosnia & Herzegovina 34.3 34.1 34.0 33.9 33.5 33.6 33.2 32.9 32.8 33.6
19 Botswana 33.9 33.4 33.4 33.3 33.0 32.9 32.8 32.6 31.9 33.0
20 Brazil 40.7 39.8 40.0 40.0 39.7 39.0 38.7 38.2 36.6 39.2
21 Brunei Darussalam 31.3 31.1 31.0 30.2 29.9 31.2 31.8 30.8 31.2 30.9
22 Bulgaria 37.2 36.9 36.6 36.4 35.9 35.3 34.4 34.0 32.7 35.5
23 Burkina Faso 41.2 41.4 41.5 41.5 40.5 40.3 39.9 39.6 39.6 40.6
24 Burundi 39.1 39.4 39.5 39.4 39.6 39.6 39.7 40.0 39.6 39.5
25 Cambodia 50.4 50.1 49.6 50.0 49.2 48.8 47.8 46.8 46.0 48.7
26 Cameroon 33.1 32.8 32.7 32.4 32.1 31.8 31.6 31.4 31.4 32.1
27 Canada 17.0 16.1 16.0 15.8 15.8 15.6 15.6 15.5 15.3 15.8
28 Cape Verde 36.6 36.1 35.7 35.7 35.8 35.7 35.5 34.5 33.4 35.4
29 Central African Rep. 42.8 42.6 43.9 44.7 46.5 46.7 46.9 45.6 45.1 45.0
30 Chad 46.1 46.2 45.6 45.3 44.4 41.3 41.6 42.1 42.2 43.9
31 Chile 19.9 19.8 19.7 19.8 19.5 19.2 18.9 18.6 18.5 19.3
32 China 13.1 13.1 13.1 13.0 12.9 12.6 12.4 12.2 11.9 12.7
33 Colombia 39.4 39.1 39.0 38.8 38.2 37.6 36.5 35.6 33.5 37.5
34 Comoros 39.3 39.6 39.0 37.7 37.6 39.0 38.0 38.4 39.4 38.7
35 Congo, Dem. Rep. 47.2 48.0 48.2 48.1 47.1 46.9 46.8 46.8 46.7 47.3
36 Congo, Rep. 49.8 48.2 47.7 47.4 47.3 47.0 45.6 44.1 44.6 46.8
37 Costa Rica 26.0 26.2 26.6 26.7 26.4 26.2 25.7 25.2 24.0 25.9
38 Côte d'Ivoire 41.8 43.2 43.8 44.8 45.1 45.1 44.9 45.4 47.0 44.5
39 Croatia 33.8 33.4 33.0 32.4 32.3 32.3 31.5 31.2 30.4 32.2
40 Cyprus 29.3 28.7 28.6 28.5 28.7 28.3 28.1 27.9 26.5 28.3
41 Czech Republic 19.5 19.1 19.3 19.4 19.5 19.1 18.5 18.1 17.0 18.8
42 Denmark 18.9 18.1 18.0 17.9 17.8 17.7 17.8 17.2 16.9 17.8
43 Dominican Republic 32.3 32.1 32.3 32.1 32.0 32.1 31.3 31.2 30.5 31.8
44 Ecuador 34.9 34.4 34.1 33.8 33.5 32.5 31.5 31.4 30.4 32.9
45 Egypt, Arab Rep. 35.2 35.1 35.3 35.6 35.1 34.8 34.4 33.5 33.1 34.7
46 El Salvador 46.4 46.3 46.4 46.0 45.6 45.4 44.8 44.2 43.0 45.3
47 Equatorial Guinea 32.9 32.8 32.1 31.8 31.5 31.0 31.1 30.9 30.1 31.6
48 Eritrea 38.1 40.3 39.4 39.4 40.3 40.6 40.5 41.2 41.4 40.1
49 Estonia - 32.7 32.4 32.2 31.4 31.1 30.5 30.1 29.5 31.2
50 Ethiopia 40.4 40.3 39.5 39.6 40.3 38.8 37.6 36.4 35.1 38.6
51 Fiji 32.8 33.6 33.5 32.8 32.6 31.8 31.4 31.1 32.6 32.5
52 Finland 19.3 18.3 18.0 17.8 17.7 17.7 17.7 17.5 17.0 17.9
53 France 15.9 15.4 15.1 15.0 14.6 14.6 14.7 14.7 14.7 15.0
54 Gabon 46.8 48.0 47.8 47.7 47.2 47.5 46.9 47.2 47.3 47.4
55 Gambia, The 45.8 45.1 44.6 46.4 44.8 43.5 43.3 42.2 40.9 44.0
16
Years
No. Country 1999 2000 2001 2002 2003 2004 2005 2006 2007
Country
Av.
56 Georgia 69.0 67.3 67.6 67.7 66.6 67.3 66.7 65.8 62.1 66.7
57 Germany 17.1 16.6 16.0 16.1 16.3 16.3 16.4 16.1 15.3 16.2
58 Ghana 42.0 41.9 41.8 41.7 42.0 41.5 40.5 39.5 38.3 41.0
59 Greece 29.1 29.3 28.5 27.7 27.2 27.8 27.5 27.5 26.5 27.9
60 Guatemala 51.6 51.5 52.2 51.7 51.4 51.2 50.4 49.5 47.9 50.8
61 Guinea 39.6 39.6 39.3 38.9 39.0 38.6 38.3 38.3 39.2 39.0
62 Guinea-Bissau 40.4 39.6 39.7 40.4 40.7 40.9 40.8 40.6 41.6 40.5
63 Guyana 33.4 33.6 33.2 33.6 33.8 33.4 33.5 33.2 34.0 33.5
64 Haiti 54.9 55.4 56.3 56.6 56.5 56.7 56.5 56.5 57.1 56.3
65 Honduras 50.0 49.6 49.8 49.6 49.1 48.5 47.4 46.5 45.1 48.4
66 Hong Kong, China 17.0 16.6 16.6 16.6 16.4 15.9 15.5 15.0 14.7 16.0
67 Hungary 25.4 25.1 25.0 25.0 25.0 24.7 24.5 24.4 23.7 24.7
68 Iceland 16.7 16.1 15.9 16.0 15.9 15.7 15.5 15.5 15.0 15.8
69 India 23.3 23.1 22.9 22.6 22.3 21.9 21.6 21.2 20.7 22.2
70 Indonesia 19.5 19.4 19.5 19.6 19.4 19.2 18.9 18.7 17.9 19.1
71 Iran, Islamic Rep. 18.9 18.9 19.0 18.6 18.2 17.9 17.9 17.6 17.3 18.2
72 Ireland 16.9 16.2 15.9 15.9 16.0 16.0 16.0 15.6 15.4 16.0
73 Israel 22.5 21.9 22.3 22.9 22.8 22.1 21.6 21.1 20.7 22.0
74 Italy 28.5 27.5 26.9 26.7 26.5 26.4 26.9 27.0 26.8 27.0
75 Jamaica 36.3 36.4 36.3 36.4 35.1 34.7 34.3 33.9 32.5 35.1
76 Japan 11.5 11.3 11.2 11.4 11.1 10.9 10.8 10.6 10.3 11.0
77 Jordan 19.5 19.4 19.2 19.0 18.9 18.4 17.8 17.6 17.2 18.5
78 Kazakhstan 43.6 43.2 43.3 42.5 42.1 41.5 40.7 40.0 38.4 41.7
79 Kenya 34.0 34.3 34.2 35.0 35.1 34.3 33.1 31.7 29.5 33.5
80 Korea, Rep. 27.9 28.3 27.4 26.7 26.9 26.5 26.4 26.4 25.6 26.9
81 Kuwait 20.1 20.1 20.2 20.3 19.5 19.1 18.7 18.5 - 19.5
82 Kyrgyz Republic 41.4 41.2 40.8 41.3 40.1 39.7 39.2 38.8 38.8 40.1
83 Lao PDR 30.9 30.6 30.2 30.0 29.7 29.4 28.7 28.4 28.0 29.5
84 Latvia 31.4 30.5 30.3 29.9 29.7 29.7 29.2 28.5 27.2 29.6
85 Lebanon 33.9 34.1 34.0 33.8 33.5 32.9 32.7 32.9 32.0 33.3
86 Lesotho 31.7 31.3 31.2 31.0 30.9 30.4 30.3 29.4 28.8 30.5
87 Liberia 44.2 43.2 43.2 43.1 45.0 45.4 44.9 44.5 44.2 44.2
88 Libyan Arab Jamahiria 34.7 35.1 34.5 33.8 34.9 33.9 33.1 32.0 30.9 33.7
89 Lithuania 33.9 33.7 33.2 32.6 32.0 31.7 31.1 30.6 29.7 32.1
90 Luxembourg 10.4 10.1 9.8 9.8 9.9 9.9 10.0 9.9 9.4 9.9
91 Macao, China 13.3 13.1 13.0 12.9 12.5 12.1 11.9 11.7 11.1 12.4
92 Macedonia, FYR 39.0 38.2 36.6 36.5 35.8 35.1 34.6 33.7 34.9 36.0
93 Madagascar 39.9 39.6 39.2 43.4 42.8 41.1 40.1 39.6 38.5 40.4
94 Malawi 40.1 40.3 42.1 43.5 43.0 42.6 42.3 41.0 39.4 41.6
95 Malaysia 31.8 31.1 31.7 31.8 31.6 31.1 30.7 30.3 29.6 31.1
96 Maldives 30.3 30.3 30.0 29.4 29.2 28.9 29.6 29.3 28.6 29.5
97 Mali 42.5 42.3 40.9 40.7 40.6 41.0 40.7 40.4 39.9 41.0
98 Malta 27.5 27.1 27.6 27.5 27.7 27.9 27.5 27.3 26.5 27.4
99 Mauritania 35.5 36.1 36.0 35.8 35.8 35.1 34.4 31.7 35.1
100 Mauritius 23.3 23.1 22.7 22.8 22.6 22.5 22.4 22.2 21.9 22.6
101 Mexico 30.6 30.1 30.4 30.4 30.4 29.9 29.5 28.9 28.8 29.9
102 Moldova 45.6 45.1 44.1 44.5 44.6 44.0 43.4 44.3 - 44.5
103 Mongolia 18.4 18.4 18.4 18.2 17.9 17.5 17.1 16.8 16.4 17.7
104 Morocco 36.4 36.4 35.9 35.6 35.1 34.7 34.8 33.3 33.1 35.0
105 Mozambique 41.1 40.3 40.4 39.8 39.8 39.7 38.9 38.6 - 39.8
106 Myanmar 51.6 52.6 51.5 50.7 49.0 49.1 47.8 - - 50.3
107 Namibia 31.7 31.4 31.2 30.9 30.5 29.6 29.4 28.6 28.5 30.2
108 Nepal 37.1 36.8 36.8 37.0 36.8 36.8 36.4 36.2 36.0 36.6
109 Netherlands 14.2 13.4 13.1 13.3 13.5 13.5 13.6 13.6 13.0 13.4
110 New Zealand 12.9 12.3 12.7 12.5 12.2 12.0 12.3 12.2 12.0 12.3
111 Nicaragua 45.8 45.2 45.2 45.3 44.8 44.3 43.7 43.5 43.1 44.5
17
Years
No. Country 1999 2000 2001 2002 2003 2004 2005 2006 2007
Country
Av.
112 Niger 41.7 41.9 40.9 40.3 39.7 40.7 39.7 38.6 - 40.4
113 Nigeria 58.0 57.9 57.8 57.6 56.3 55.1 53.8 53.0 - 56.2
114 Norway 19.2 18.5 19.1 18.8 18.6 18.1 18.3 18.2 18.0 18.5
115 Oman 19.2 18.9 18.7 18.6 18.5 18.4 18.0 17.6 - 18.5
116 Pakistan 37.2 36.8 37.3 37.2 36.6 35.8 35.7 34.8 33.6 36.1
117 Panama 64.8 64.1 64.7 65.1 64.4 63.5 61.7 60.0 - 63.5
118 Papua New Guinea 35.3 36.1 36.8 37.1 37.1 37.0 37.2 37.1 36.5 36.7
119 Paraguay 38.1 39.8 39.6 39.9 38.9 38.1 38.0 37.1 - 38.7
120 Peru 60.2 59.9 60.3 59.1 58.7 57.9 57.3 56.1 53.7 58.1
121 Philippines 44.0 43.3 43.0 42.5 41.9 41.3 40.1 39.6 38.3 41.5
122 Poland 27.8 27.6 27.6 27.8 27.7 27.4 27.1 26.8 26.0 27.3
123 Portugal 22.9 22.2 22.7 21.8 22.3 22.5 22.6 23.1 23.0 22.6
124 Quatar - 19.0 19.3 19.0 19.6 17.4 18.4 0.0 0.0 14.1
125 Romania 34.1 34.4 33.7 33.5 33.6 32.5 32.2 31.4 30.2 32.8
126 Russian Federation 46.4 46.1 45.8 45.3 44.7 44.4 43.7 43.8 40.6 44.5
127 Rwanda 40.5 40.3 40.6 39.9 40.7 40.2 39.3 39.1 - 40.1
128 Saudi Arabia 18.7 18.4 18.7 18.9 18.1 17.6 17.3 17.3 16.8 18.0
129 Senegal 45.5 45.1 44.6 45.2 44.4 43.6 42.5 42.6 41.7 43.9
130 Sierra Leone 47.5 47.1 46.3 44.8 44.5 44.3 44.3 43.6 42.9 45.0
131 Singapore 13.2 13.1 13.4 13.3 13.1 12.8 12.6 12.4 12.2 12.9
132 Slovak Republic 19.0 18.9 18.8 18.6 18.4 18.2 17.6 17.3 16.8 18.2
133 Slovenia 27.2 27.1 27.1 26.9 26.7 26.5 26.0 25.8 24.7 26.4
134 Solomon Islands 31.7 33.4 34.5 34.8 34.7 33.8 33.4 33.2 32.7 33.6
135 South Africa 28.6 28.4 28.4 28.1 28.1 27.6 26.9 26.4 25.2 27.5
136 Spain 24.0 22.9 22.6 22.4 22.6 22.6 22.7 23.0 22.2 22.8
137 Sri Lanka 45.0 44.6 44.5 44.0 43.3 43.4 43.0 43.3 42.2 43.7
138 Sudan 34.1 - - - - - - - - 34.1
139 Suriname 39.8 39.8 39.4 39.0 38.5 37.4 37.0 36.3 35.1 38.0
140 Swaziland 43.5 41.4 41.3 40.9 40.2 40.1 39.3 38.9 - 40.7
141 Sweden 20.1 19.6 19.2 18.7 18.5 18.4 18.8 18.6 17.9 18.9
142 Switzerland 9.2 8.8 8.6 8.7 8.9 8.8 8.9 8.8 8.1 8.7
143 Syrian Arab Republic 19.2 19.3 19.2 19.0 19.3 19.3 18.9 18.6 18.5 19.0
144 Taiwan 25.7 25.4 25.7 25.4 25.2 24.7 24.5 24.2 23.9 25.0
145 Tajikistan 43.5 43.2 43.6 43.5 43.3 42.9 43.1 42.6 41.0 43.0
146 Tanzania 59.0 58.3 57.7 57.1 56.7 56.2 55.2 54.5 53.7 56.5
147 Thailand 53.2 52.6 52.5 51.8 50.7 50.4 50.0 49.6 48.2 51.0
148 Togo 34.4 35.1 35.4 34.5 34.9 35.0 35.0 34.6 - 34.9
149 Trinidad and Tobago 35.0 34.4 34.5 34.4 33.6 33.1 32.7 32.0 31.5 33.4
150 Tunisia 38.6 38.4 38.0 38.1 37.5 36.9 36.2 35.8 35.4 37.2
151 Turkey 32.7 32.1 32.8 32.7 32.2 31.5 30.7 30.4 29.1 31.6
152 Uganda 43.8 43.1 43.1 43.3 42.9 42.7 42.3 41.4 40.3 42.5
153 Ukraine 53.0 52.2 52.2 51.4 50.8 49.7 49.4 49.4 46.8 50.5
154 United Arab Emirates 26.5 26.4 27.0 27.4 26.4 25.5 25.2 23.9 - 26.0
155 United Kingdom 13.1 12.5 12.7 12.6 12.6 12.4 12.7 12.3 12.2 12.6
156 United States 9.3 8.8 8.8 9.0 8.9 8.8 8.7 8.7 8.4 8.8
157 Uruguay 50.6 51.1 51.8 53.3 52.9 50.5 48.8 48.1 46.1 50.3
158 Venezuela, RB 33.7 33.6 33.6 35.1 36.5 34.7 33.1 31.9 30.9 33.7
159 Vietnam 15.8 15.6 15.5 15.3 15.3 15.1 14.7 14.6 14.4 15.1
160 Yemen, Rep. 27.7 27.4 27.4 27.3 27.1 27.0 26.5 26.5 26.8 27.1
161 Zambia 49.2 48.9 48.2 48.1 47.7 47.8 47.0 46.0 43.9 47.4
162 Zimbabwe 59.6 59.4 61.5 62.8 63.7 62.3 62.0 62.3 62.7 61.8
Time Average 34.1 33.8 33.7 33.6 33.4 33.0 32.6 32.0 31.0
18
Table 3. Average Informality (Unweighted) by World Bank’s Regions
Region mean median min max sd
EAP East Asia and Pacific 32.3 32.5 12.7 51.0 13.3
ECA Europe and Central Asia 38.5 35.8 18.2 66.7 11.0
LAC Latin America and the Caribbean 41.2 38.7 19.3 66.1 12.3
MENA Middle East and North Africa 28.0 32.7 18.2 37.2 7.9
OECD High Income OECD 16.8 16.0 8.7 27.9 5.6
OHIE Other High Income 22.8 25.0 12.4 33.4 6.7
SAS South Asia 33.2 35.3 22.2 43.7 6.9
SSA Sub-Saharan Africa 40.8 40.5 22.6 61.8 7.6
World 33.1 33.5 8.7 66.7 12.8
Table 4. Average Informality Weighted by Total GDP in 2005
Region Mean median min max sd
EAP East Asia and Pacific 17.5 12.7 12.7 51.0 10.7
ECA Europe and Central Asia 36.5 32.8 18.2 66.7 8.6
LAC Latin America and the Caribbean 34.7 33.7 19.3 66.1 8.0
MENA Middle East and North Africa 27.3 32.7 18.2 37.2 7.8
OECD High Income OECD 13.5 11.0 8.7 27.9 5.6
OHIE Other High Income 20.8 19.5 12.4 33.4 4.8
SAS South Asia 25.1 22.2 22.2 43.7 5.9
SSA Sub-Saharan Africa 38.4 34.1 22.6 61.8 11.3
World 17.2 13.4 8.7 66.7 9.9
19
Figure 1. Average Shadow Economy Measure by Region
0 20 40 60 80informality
OECD
OHIE
EAP
MENA
SAS
ECA
LAC
SSA
20
Figure 2. World View of Informality
21
References
Ahumada, Hildegart, Facundo Alvaredo, and Alfredo Canavese, (2007), “The Monetary Method and the Size of
the Shadow Economy: A Critical Assessment,” Review of Income and Wealth, 53(2), 363-71.
Bhattacharyya, Dilip K., (1999), “On the Economic Rationale of Estimating the Hidden Economy,” The Economic
Journal, 109(456), 348–359.
Bollen, Kenneth A. (1989), Structural Equations with Latent Variables, New York: Wiley.
Breusch, Trevor, (2005), “The Canadian Underground Economy: An Examination of Giles and Tedds,” Canadian
Tax Journal, 53(2), 367–391.
Buehn, Andreas, Alexander Karmann and Friedrich Schneider, (2009), “Shadow Economy and do-it-yourself
Activities: The German Case,” Journal of Institutional and Theoretical Economics, 164(4), 701-722.
Dell’Anno, Roberto, (2007), “The Shadow Economy in Portugal: An Analysis with the MIMIC Approach,”
Journal of Applied Economics, 10, 253-277.
Dell’Anno, Roberto and Offiong H Solomon, (2008), “Shadow Economy and Unemployment Rate in USA: Is
there a Structural Relationship? An Empirical Analysis,” Applied Economics, 40, 2537-2555.
Enste, Dominik and Friedrich Schneider, (2006), “Wie groß ist die Schattenwirtschaft? Des Rätsels Lösung,“
Wirtschaftsdienst—Zeitschrift für Wirtschaftspolitik, 86(2), 185–191.
Feige, Edgar L. (1989), The Underground Economies. Tax Evasion and Information Distortion, Cambridge:
Cambridge University Press.
Feige, Edgar L., (1994), “The underground economy and the currency enigma,” Supplement to Public Finance/
Finances Publiques, 49, 119-136.
Feld, Lars and Friedrich Schneider, (2010), “Survey on the Shadow Economy and Undeclared Earnings in OECD
Countries,” German Economic Review, 11(2), 109-149.
Frey, Bruno. S. and Hannelore Weck-Hannemann, (1984), “The Hidden Economy as an “Unobserved” Variable,”
European Economic Review, 26(1), 33–53.
Frey, Bruno S. and Werner Pommerehne, (1984), “The Hidden Economy: State and Prospect for Measurement,”
Review of Income and Wealth, 30(1), 1–23.
Giles, David, E.A., (1999a), “Measuring the Hidden Economy: Implications for Econometric Modelling,” The
Economic Journal, 109(456), 370–380.
22
Giles, David, E.A., (1999b), “Modelling the Hidden Economy in the Tax-Gap in New Zealand,” Empirical
Economics, 24(4), 621–640.
Giles, David, E.A. and Lindsay M. Tedds (2002), Taxes and the Canadian Underground Economy,
Toronto/Ontario: Canadian Tax Foundation.
Johnson, Simon, Daniel Kaufmann, and Andrei Shleifer, (1997), “The Unofficial Economy in Transition,”
Brookings Papers on Economic Activity, 2, 159-221.
Johnson, Simon, Daniel Kaufmann, and Pablo Zoido-Lobatón, (1998a), “Regulatory Discretion and the Unofficial
Economy,” The American Economic Review, 88(2), 387–392.
Johnson, Simon, Daniel Kaufmann, and Pablo Zoido-Lobatón (1998b), Corruption, Public Finances and the
Unofficial Economy, Washington, D.C.: The World Bank.
Pedersen, Søren (2003), The Shadow Economy in Germany, Great Britain and Scandinavia: A Measurement Based
on Questionnaire Survey, Copenhagen: The Rockwoll Foundation Research Unit.
Schneider, Friedrich, (1986), “Estimating the Size of the Danish Shadow Economy Using the Currency Demand
Approach: An Attempt,” The Scandinavian Journal of Economics, 88(4), 643–668.
Schneider, Friedrich, (1997), “The Shadow Economies of Western Europe,” Journal of the Institute of Economic
Affairs, 17(3), 42–48.
Schneider, Friedrich, (2005), “Shadow Economies Around the World: What do we Really Know?,” European
Journal of Political Economy, 21(3), 598–642.
Schneider, Friedrich, (2007), “Shadow Economies and Corruption all Over the World: New Estimates for 145
Countries,” Economics, 2007–9, July 2007.
Schneider, Friedrich and Dominik Enste, (2000), “Shadow Economies: Size, Causes, and Consequences,” The
Journal of Economic Literature, 38(1), 77–114.
Smith, Philip, (1994), “Assessing the Size of the Underground Economy: The Statistics Canada Perspectives,”
Canadian Economic Observer, 7, 3.16-3.33.
Tanzi, Vito, (1999), “Uses and Abuses of Estimates of the Underground Economy,” The Economic Journal,
109(456), 338–340.
Thomas, Jim J., (1999), Quantifying the Black Economy: Measurement without Theory Yet Again?,” The
Economic Journal, 109(456), 381–389.