shahaboddin resalati - radar.brookes.ac.uk
TRANSCRIPT

An Assessment Methodology for Enviro-Economic Justification of Low and Zero Carbon Building Technologies
Shahaboddin Resalati
School of Architecture Oxford Brookes University
Sponsored by TATA Steel Group Submitted in partial fulfilment of the requirements of Oxford
Brookes University for the degree of Doctor of Philosophy
May 2015


An Assessment Methodology for Enviro-Economic Justification of Low and Zero Carbon Building Technologies
i
Abstract
The imperative to reduce the carbon footprint of buildings will inevitably require
adopting higher levels of insulation and on-site low and zero carbon technologies. This
will significantly increase the embodied carbon of materials and products that have been
used in the building. With buildings requiring less operational energy, future low and
zero carbon buildings could see equivalence between operational and embodied carbon.
It is essential therefore that embodied carbon is factored into carbon reduction
strategies. Hence, this research has established an assessment methodology based on a
combined operational and embodied carbon analyses as means of providing more
representative assessments of life cycle carbon burdens and cost appraisals for low and
zero carbon building technologies.
The methodology has been applied to a series of case studies of low and zero carbon
building technologies to provide exemplar quantified appraisals of selected products.
The case studies include insulation materials (Polyurethane, mineral wool, VIP and
hemp) and renewable technologies (Photovoltaics and Transpired Solar Collectors)
applied with different operational scenarios to selected industrial (small and medium
warehouses and retail sheds), residential (semidetached house) and office (typical 4
storey) buildings.
The application of the methodology identifies how the inclusion of embodied CO2 in
carbon reduction equations can suggest ‘death points’ (points beyond which associated
embodied carbon outweighs the operational carbon savings) for conventional building
technologies and ‘birth points’ (points beyond which novel technologies are required to
offset the carbon disbenefit of conventional technologies) for novel products. This for
the first time introduces sensible ‘maximum’ level of insulation that can be incorporated
into buildings or required by standards, and sets limits to the amount by which current
approaches to carbon thrift can be escalated.
The study demonstrates the absolute significance of combining operational and
embodied carbon analyses in demonstrating the effectiveness of carbon reduction
strategies and requirements to shift away from ‘operational carbon only’ methods. The
approach must be an integral part of any holistic appraisal of low and zero carbon
performance.

An Assessment Methodology for Enviro-Economic Justification of Low and Zero Carbon Building Technologies
ii
CONTENTS PAGE CHAPTER 1: Introduction ............................................................................................ 1
1.1 Greenhouse Gas (GHG) emissions and global warming ............................................ 1
1.2 Reduction targets of GHG emissions .......................................................................... 5
1.2.1 The European 20-20-20 targets ................................................................................ 6
1.2.2 The European Union Emissions Trading System (EU ETS) ................................... 6
1.2.3 The Effort Sharing Decision .................................................................................... 7
1.3 UK national carbon reduction strategies ..................................................................... 8
1.3.1 UK Climate Change Act .......................................................................................... 8
1.3.2 UK energy efficiency schemes................................................................................. 9
1.3.2.1 UK Green Deal ...................................................................................................... 9
1.3.2.2 The Energy Companies Obligation (ECO) ......................................................... 10
1.4 Investment on renewable energies ............................................................................ 10
1.5 Reducing energy use from the built environment ..................................................... 11
1.5.1 Existing buildings .................................................................................................. 12
1.5.1.1 Residential sector ................................................................................................ 13
1.5.1.2 Non–residential sector ......................................................................................... 13
1.5.2 New buildings ........................................................................................................ 14
1.5.2.1 Residential buildings ........................................................................................... 14
1.5.2.2 Non-residential buildings .................................................................................... 14
1.6 Effective whole life carbon reduction ....................................................................... 15
1.7 Aim and objectives of the research ........................................................................... 17
1.8 Structure of thesis ...................................................................................................... 18
CHAPTER 2: Regulatory Approaches to Anthropogenic Gas Emission Reduction
................................................................................................................. 20
2.1 Introduction ............................................................................................................... 20
2.2 Building Regulations ................................................................................................. 21
2.2.1 Building Regulations Part L ................................................................................... 22
2.2.2 How Building Regulations evolved ....................................................................... 22
2.2.3 Meeting the carbon reduction targets ..................................................................... 24
2.2.3.1 Operational energy/carbon .................................................................................. 24
2.2.3.2 Embodied energy/carbon .................................................................................... 24

An Assessment Methodology for Enviro-Economic Justification of Low and Zero Carbon Building Technologies
iii
2.2.3.3 Carbon intensity and energy to carbon conversion factors ................................. 26
2.3 Total carbon (combined operational and embodied carbon) approach; the likely
future requirement ............................................................................................ 27
2.3.1 Previous work concerning total carbon approaches ............................................... 30
2.4 Financial justification of effective new low and zero carbon building technologies 32
2.5 Conclusion ................................................................................................................ 33
CHAPTER 3: Available Cost and Carbon Quantification Approaches .................. 35
3.1 Available cost and carbon quantification methods ................................................... 35
3.2 Life cycle approaches ................................................................................................ 35
3.2.1 Life Cycle Assessment ........................................................................................... 36
3.2.1.1 System boundaries .............................................................................................. 38
Cradle-to-grave ................................................................................................. 38
Cradle-to-cradle (closed loop production) ........................................................ 38
Cradle-to-gate ................................................................................................... 38
Gate-to-gate....................................................................................................... 39
3.2.1.2 Quantifying embodied and operational carbon ................................................... 39
Available approaches for quantifying embodied carbon .................................. 39
Available approaches for calculating operational (in-use phase) carbon ......... 42
3.2.2 Life Cycle Costing ................................................................................................. 44
3.2.2.1 Net benefit/Net saving......................................................................................... 45
3.2.2.2 Internal Rate of Return ........................................................................................ 46
3.2.3 Saving-to-Investment Ratio ................................................................................... 46
3.2.3.1 Annual Equivalent Value .................................................................................... 46
3.2.3.2 Net Present Value ................................................................................................ 46
3.3 Chapter summary ...................................................................................................... 47
CHAPTER 4: Development and Application of Methodology ................................. 48
3.4 Main principles of the developing methodology ...................................................... 48
3.5 The developed methodology ..................................................................................... 50
3.5.1 Carbon efficiency ................................................................................................... 51
3.5.1.1 System boundaries .............................................................................................. 51
3.5.1.2 Embodied carbon quantification ......................................................................... 52
3.5.1.3 Operational carbon quantification ....................................................................... 53

An Assessment Methodology for Enviro-Economic Justification of Low and Zero Carbon Building Technologies
iv
3.5.2 Cost effectiveness................................................................................................... 54
3.6 Application of methodology ..................................................................................... 55
3.7 General building description and performance specification.................................... 56
3.7.1 Domestic buildings ................................................................................................ 56
3.7.1.1 Orientation........................................................................................................... 57
Front door of the house is facing south. .......................................................................... 57
3.7.1.2 Construction ........................................................................................................ 57
3.7.1.3 Modelling assumptions ....................................................................................... 58
Airtightness ....................................................................................................... 58
Internal gains ..................................................................................................... 59
Heating ............................................................................................................ 59
Occupation ........................................................................................................ 59
Location ............................................................................................................ 59
Ventilation......................................................................................................... 59
3.7.2 Non-domestic buildings ......................................................................................... 59
3.7.2.1 Construction and modelling assumptions for industrial buildings ...................... 61
3.7.2.2 Construction and modelling assumptions for offices .......................................... 63
3.8 Design service life ..................................................................................................... 64
3.9 Conclusion ................................................................................................................ 66
CHAPTER 5: Total Carbon Quantification of Insulation Materials for New and
Retrofitted Buildings ............................................................................. 67
4.1 New build .................................................................................................................. 67
4.1.1 Introduction ............................................................................................................ 67
4.1.2 Insulation specifications for minimum carbon: mineral wool and PUR systems .. 69
4.1.2.1 Industrial buildings ............................................................................................. 70
Minimum aggregated carbon analyses for industrial buildings ........................ 71
4.1.2.2 Residential buildings ........................................................................................... 76
Minimum aggregated carbon analysis .............................................................. 78
4.1.2.3 Office buildings ................................................................................................... 81
Minimum aggregated carbon analysis .............................................................. 82
4.1.3 Role of novel insulation materials: vacuum insulation panels and hemp .............. 84
4.1.3.1 Vacuum Insulation Panels ................................................................................... 85
Minimum aggregated carbon analyses of VIPs in industrial claddings ............ 87

An Assessment Methodology for Enviro-Economic Justification of Low and Zero Carbon Building Technologies
v
Minimum aggregated carbon analyses of VIP in residential claddings ............ 89
Minimum aggregated carbon analyses of VIPs in office buildings .................. 91
4.1.3.2 Hemp insulation .................................................................................................. 92
Minimum aggregated carbon analyses of hemp in industrial claddings ........... 93
Minimum aggregated carbon analyses of hemp in residential claddings ......... 95
Minimum aggregated carbon analyses of hemp in office buildings ................. 96
4.2 Thermally retrofitted buildings ................................................................................. 98
4.2.1 Introduction ............................................................................................................ 98
4.2.2 Quantification of the carbon limits of conventional and alternative insulation
technology for industrial buildings .................................................................. 99
4.2.3 Quantification of the Carbon Limits of Conventional and Alternative Insulation
Technology for Residential Buildings ........................................................... 100
4.2.4 Quantification of the Carbon Limits of Conventional and Alternative Insulation
Technology for Office Buildings ................................................................... 103
4.3 Technical Conclusions ............................................................................................ 103
CHAPTER 6: Insulation Specifications for Minimum Life-Cycle Costs ............... 105
5.1 Introduction ............................................................................................................. 105
5.2 Industrial buildings ................................................................................................. 107
5.2.1 Minimum Life Cycle Cost analyses ..................................................................... 107
5.2.1.1 NPV analyses for conventional insulation materials: mineral wool and PUR.. 107
Interpretation of NPV analyses of novel insulation materials: VIPs .............. 111
5.3 Office buildings ....................................................................................................... 113
5.3.1 NPV results .......................................................................................................... 114
5.4 Residential buildings ............................................................................................... 117
5.4.1 Interpretation of the NPV analyses ...................................................................... 118
5.5 Conclusions ............................................................................................................. 121
CHAPTER 7: On-site low and zero carbon technologies ........................................ 123
6.1 Introduction ............................................................................................................. 123
6.2 Photovoltaic cells .................................................................................................... 124
6.2.1 Technology options (packages)............................................................................ 125
6.2.1.1 Distribution warehouses .................................................................................... 128
6.2.1.2 Retail sheds ....................................................................................................... 130

An Assessment Methodology for Enviro-Economic Justification of Low and Zero Carbon Building Technologies
vi
6.2.1.3 Office buildings ................................................................................................. 132
Cost analysis of office buildings taking into account the rental value loss .... 134
6.3 Summarising ‘PV + building fabric’ packages ....................................................... 136
6.4 Transpired Solar Collectors .................................................................................... 136
6.4.1 Technology options (packages) including TSCs ................................................. 139
6.4.2 Application of TSCs to the investigated buildings .............................................. 139
6.5 ‘PV + TSC + Insulation’ packages ......................................................................... 145
6.5.1 Technology options (packages)............................................................................ 145
6.5.1.1 Application of the introduced packages to the investigated building types ...... 145
Warehouse....................................................................................................... 146
Retail shed ....................................................................................................... 147
Offices .......................................................................................................... 148
6.6 Summarising ‘PV + TSC + building fabric’ packages ........................................... 149
6.7 Carbon offsetting through exporting electricity to the gird and conclusions .......... 151
CHAPTER 8: Total Energy Assessment Methodology (TEAM) Tool ................... 153
7.1 General description ................................................................................................. 153
7.2 Operational carbon evaluation module ................................................................... 154
7.3 Environmental evaluation module .......................................................................... 154
7.4 Economic evaluation module .................................................................................. 155
7.5 User Interface (UI) module ..................................................................................... 155
7.5.1 Building type ........................................................................................................ 156
7.5.2 Size ....................................................................................................................... 156
7.5.3 Rooflight percentage ............................................................................................ 157
7.5.4 Fabric U-value ...................................................................................................... 157
7.5.5 Liner type ............................................................................................................. 158
7.5.6 Air permeability level .......................................................................................... 159
7.5.7 Insulation type ...................................................................................................... 159
7.5.8 Renewable technologies ....................................................................................... 159
7.6 Results module ........................................................................................................ 160
7.7 Total carbon analyses in relation to zero carbon performance ............................... 161
CHAPTER 9: Conclusions and Recommendations for further research .............. 164
8.1 Conclusions ............................................................................................................. 164

An Assessment Methodology for Enviro-Economic Justification of Low and Zero Carbon Building Technologies
vii
8.2 Contribution to knowledge ...................................................................................... 170
8.3 Limitations and recommendations for further research .......................................... 171
8.3.1 Scale of the study ................................................................................................. 171
8.3.2 System boundaries ............................................................................................... 171
8.3.3 Total Energy Assessment Methodology .............................................................. 171
8.3.4 TSCs ..................................................................................................................... 171
8.3.5 Consistent embodied CO2 database ..................................................................... 172
8.3.6 Cost databases ...................................................................................................... 173
8.4 Future significance .................................................................................................. 173

An Assessment Methodology for Enviro-Economic Justification of Low and Zero Carbon Building Technologies
viii
LIST OF FIGURES
Figure 1.1 The greenhouse effect (source: www.epa.gov) ............................................... 2
Figure 1.2 Global CO2 levels (source: NASA GISS database) ......................................... 3
Figure 1.3 Temperature rise pattern since year 1880 (source: NASA GISS database) .... 4
Figure 1.4 Temperature projections to the year 2100 based on a range of emission
scenarios and global climate models. Source: NASA (adapted from IPCC,
2007) .............................................................................................................. 4
Figure 1.5 Global sea level rise pattern (NASA GISS database) ...................................... 5
Figure 1.6 World CO2 emissions by country (Source: the Ministry of the
Environment, Japan (partially supplemented by UNFCCC data)) ................ 7
Figure 1. 7 Final energy consumption in the world (Source: IEA 2012) ........................ 12
Figure 2. 1 Likely embodied to operational carbon proportion for future buildings ...... 25
Figure 2.2 Example of typical linear relationship between CO2 emissions associated
with operational carbon, and envelope U-value. ......................................... 28
Figure 2.3 Example of typical non-linear relationship between embodied CO2 (and
combined embodied and operational CO2) based on PUR insulation. ........ 30
Figure 3.1 End of life scenarios ...................................................................................... 39
Figure 4. 1 Interaction between stages introduced in the methodology .......................... 51
Figure 4.2 Ground and first floor plan ............................................................................ 57
Figure 4.3 Simulated building ......................................................................................... 57
Figure 4. 4 Office plan .................................................................................................... 60
Figure 4. 5 Office building .............................................................................................. 60
Figure 4. 6 Industrial warehouse ..................................................................................... 60
Figure 4.7 Built-up cladding system Figure 4.8 PUR composite cladding ..................... 61
Figure 4.9 Categories of design life for buildings (BS 7543:2003) ................................ 64
Figure 5.1 Carbon results of 3000m2 warehouse insulated with mineral wool for 25, 40
and 60 years design life ............................................................................... 71

An Assessment Methodology for Enviro-Economic Justification of Low and Zero Carbon Building Technologies
ix
Figure 5.2 Carbon results of 3000m2 retail shed insulated with mineral wool for 25, 40
and 60 years design life ............................................................................... 72
Figure 5.3 Carbon results of 1000m2 warehouse insulated with mineral wool for 25, 40
and 60 years design life ............................................................................... 72
Figure 5.4 Carbon results of 3000m2 warehouse insulated with PUR for 25, 40 and 60
years design life ........................................................................................... 73
Figure 5.5 Carbon results of 3000m2 retail shed insulated with PUR for 25, 40 and 60
years design life ........................................................................................... 73
Figure 5.6 Carbon results of 1000m2 warehouse insulated with PUR for 25, 40 and 60
years design life ........................................................................................... 73
Figure 5.7 Carbon results of residential buildings insulated with mineral wool for 30
years design life ........................................................................................... 79
Figure 5.8 Carbon results of residential buildings insulated with mineral wool for 60
years design life ........................................................................................... 79
Figure 5.9 Carbon results of residential buildings insulated with PUR for 30 years
design life .................................................................................................... 80
Figure 5.10 Carbon results of residential buildings insulated with PUR for 60 years
design life .................................................................................................... 80
Figure 5.11 Carbon results of commercial buildings insulated with Mineral wool for 30
years design life ........................................................................................... 82
Figure 5.12 Carbon results of commercial buildings insulated with Mineral wool for 60
years design life ........................................................................................... 83
Figure 5.13 Carbon results of commercial buildings insulated with PUR for 30 years
design life .................................................................................................... 83
Figure 5.14 Carbon results of commercial buildings insulated with PUR for 60 years
design life .................................................................................................... 84
Figure 5.15 VIP panel components ................................................................................. 85
Figure 5.16 Comparison of thickness of VIP and PUR insulation of equivalent U-value
..................................................................................................................... 86
Figure 5.17 Comparison of thickness of VIP and mineral wool insulation of equivalent
U-value ........................................................................................................ 86
Figure 5.18 Carbon results of 3000m2 warehouse insulated with VIP for 25, 40 and 60
years design life ........................................................................................... 87

An Assessment Methodology for Enviro-Economic Justification of Low and Zero Carbon Building Technologies
x
Figure 5.19 Carbon results of 3000m2 retail shed insulated with VIP for 25, 40 and 60
years design life ........................................................................................... 88
Figure 5.20 Carbon results of 1000m2 warehouse insulated with VIP for 25, 40 and 60
years design life ........................................................................................... 88
Figure 5.21 Carbon results of residential buildings insulated with VIP for 30 years
design life .................................................................................................... 90
Figure 5.22 Carbon results of residential buildings insulated with VIP for 60 years
design life .................................................................................................... 90
Figure 5.23 Carbon results of commercial buildings insulated with VIP for 30 years
design life .................................................................................................... 92
Figure 5.24 Carbon results of commercial buildings insulated with VIP for 60 years
design life .................................................................................................... 92
Figure 5.25 Hemp insulation (source: homesinharmony.co.uk) ..................................... 93
Figure 5.26 Carbon results of 3000m2 warehouse building insulated with hemp for 25
years design life ........................................................................................... 94
Figure 5.27 Carbon results of 1000m2 warehouse building insulated with hemp for 25
years design life ........................................................................................... 94
Figure 5.28 Carbon results of 3000m2 retail shed insulated with hemp for 25 years
design life .................................................................................................... 95
Figure 5.29 Carbon results of residential building insulated with hemp for 30 years
design life .................................................................................................... 96
Figure 5. 30 Carbon results of residential building insulated with hemp for 60 years
design life .................................................................................................... 96
Figure 5.31Carbon results of commercial building insulated with hemp for 30 years
design life .................................................................................................... 97
Figure5.32 Carbon results of commercial building insulated with hemp for 60 years
design life .................................................................................................... 97
Figure 6.1NPV results of 3000m2 warehouse insulated by mineral wool for 25, 40 and
60 years design life .................................................................................... 108
Figure 6.2NPV results of 3000m2 retail shed insulated by mineral wool for 25, 40 and
60 years design life .................................................................................... 109
Figure 6.3 NPV results of 1000m2 warehouse insulated by mineral wool for 25, 40 and
60 years design life .................................................................................... 109

An Assessment Methodology for Enviro-Economic Justification of Low and Zero Carbon Building Technologies
xi
Figure 6.4 NPV results of 3000m2 warehouse insulated by PUR for 25, 40 and 60 years
design life .................................................................................................. 110
Figure 6.5 NPV results of 3000m2 retail shed insulated by PUR for 25, 40 and 60 years
design life .................................................................................................. 110
Figure 6.6 NPV results of 1000m2 warehouse insulated by PUR for 25, 40 and 60 years
design life .................................................................................................. 111
Figure 6.7 NPV results of 3000m2 warehouse insulated with VIP for 25, 40 and 60 years
design life .................................................................................................. 112
Figure 6.8 NPV results of 3000m2 retail shed insulated with VIP for 25, 40 and 60 years
design life .................................................................................................. 112
Figure 6.9 NPV results of 1000m2 warehouse insulated with VIP for 25, 40 and 60 years
design life .................................................................................................. 113
Figure 6.10 NPV results of the office building insulated with PUR for 30 and 60 years
design life in London City ......................................................................... 115
Figure 6.11 NPV results of the office building insulated with PUR for 30 and 60 years
design life in London West-End ................................................................ 116
Figure 6.12 NPV results of the office building insulated with mineral wool for 30 and
60 years design life in London City .......................................................... 116
Figure 6.13 NPV results of the office building insulated with mineral wool for 30 and
60 years design life in London West End ................................................. 116
Figure 6.14 NPV results of the office building insulated with VIP for 30 and 60 years
design life in London City ......................................................................... 117
Figure 6.15 NPV results of the office building insulated with VIP for 30 and 60 years
design life in London West End ................................................................ 117
Figure 6.16 NPV results of the residential building insulated with mineral wool for 30
and 60 years design life in London- Croydon ........................................... 120
Figure 6.17 NPV results of the residential building insulated with PUR for 30 and 60
years design life in London- Croydon ....................................................... 120
Figure 6.18 NPV results of the residential building insulated with VIP for 30 and 60
years design life in London- Croydon ....................................................... 120
Figure7.1 NPV and CO2 savings associated with ‘PV+ mineral wool Insulation’
package for distribution warehouse (NB: Notional Building) .................. 129

An Assessment Methodology for Enviro-Economic Justification of Low and Zero Carbon Building Technologies
xii
Figure 7.2 NPV and CO2 savings associated with ‘PV+ PUR Insulation’ package for
distribution warehouse (NB: Notional Building) ...................................... 130
Figure 7.3 NPV and CO2 savings associated with ‘PV+ mineral wool Insulation’
package for retail shed (NB: Notional Building) ...................................... 131
Figure 7.4 NPV and CO2 savings associated with ‘PV+ PUR Insulation’ package for
retail shed (NB: Notional Building) .......................................................... 132
Figure 7.5 NPV and CO2 savings associated with ‘PV+ mineral wool Insulation’
package for offices (NB: Notional Building) ............................................ 133
Figure 7.6 NPV and CO2 savings associated with ‘PV+ PUR Insulation’ package for
offices (NB: Notional Building) ................................................................ 134
Figure 7.7 NPV and CO2 savings associated with ‘PV+ mineral wool Insulation’
package for offices including rental value loss ......................................... 135
Figure 7.8 NPV and CO2 savings associated with ‘PV+ PUR Insulation’ package for
offices including rental value loss ............................................................. 135
Figure 7.9 TSC performance diagram (source: Solarwall) ........................................... 137
Figure 7.10 Buildings with (left) and without (right) de-stratification fans (or TSCs). 138
Figure 7.11 NPV and CO2 savings associated with package G, mineral wool ............. 140
Figure 7.12 NPV and CO2 savings associated with package G, PUR .......................... 140
Figure 7.13 NPV and CO2 savings associated with package H, mineral wool ............. 141
Figure 7.14 NPV and CO2 savings associated with package H, PUR .......................... 142
Figure 7.15 Payback period associated with TSC and mineral wool insulation for
distribution warehouses ............................................................................. 143
Figure 7.16 Payback period associated with TSC and mineral wool insulation for retail
sheds .......................................................................................................... 144
Figure 7.17 Payback period associated with TSC and mineral wool insulation for offices
................................................................................................................... 144
Figure 7.18 NPV analysis associated with different FiT scenarios in a distribution
warehouse .................................................................................................. 147
Figure 7.19 NPV and CO2 saving analysis associated with different FiT scenarios in a
retail shed .................................................................................................. 148
Figure 7.20 NPV and CO2 savings associated with different packages, office ............ 149
Figure 7.21 Maximum achievable CO2 saving associated with each package ............. 150
Figure 7.22 Carbon offsetting analysis, Distribution Warehouse ................................. 151
Figure 7.23 Carbon offsetting analysis, Retail shed ..................................................... 151

An Assessment Methodology for Enviro-Economic Justification of Low and Zero Carbon Building Technologies
xiii
Figure 7.24 Carbon offsetting analysis, Office ............................................................. 152
Figure 8.1 Screenshot of the lighting demand database for different operational
scenarios .................................................................................................... 154
Figure 8.2 Screenshot of the embodied carbon database .............................................. 155
Figure 8.3 Screenshot of the User Interface (UI) module ............................................. 156
Figure 8.4 Screenshot of the PV daily calculations ...................................................... 160
Figure 8.5 Screenshot of the Results module ................................................................ 161

An Assessment Methodology for Enviro-Economic Justification of Low and Zero Carbon Building Technologies
xiv
LIST OF TABLES Table 2.1 Changes in thermal performance standards of Building Regulations since
1985 ............................................................................................................. 23
Table 4. 1 Main principles of the developing methodology in summary ....................... 49
Table 4.2 External wall material layout (inside to outside) ............................................ 58
Table 4.3 Building specifications .................................................................................... 58
Table 4. 4 Building element U-Values ............................................................................ 58
Table 4.5 Building specifications .................................................................................... 61
Table 4.6 Base case U-values and thicknesses................................................................ 62
Table 4.7 Operational parameters for simulation modelling .......................................... 62
Table 4. 8 Modelling assumption .................................................................................... 63
Table 4.9 Typical external wall thickness ....................................................................... 63
Table 4. 10 U-value specifications .................................................................................. 63
Table 5.1 Limits of conventional insulation materials in terms of minimum carbon
emission for 25, 40 and 60 years design life ............................................... 75
Table 5.2 Associated U-values with insulated cavity widths (fully filled) ..................... 78
Table 5.3 Limits of conventional insulation materials in terms of minimum carbon
emission for 30 and 60 years design life ..................................................... 81
Table 5.4 Limits of conventional insulation materials in terms of minimum carbon
emission for 30 and 60 years design life ..................................................... 84
Table 5.5 Minimum achievable carbon emissions of conventional insulation materials in
comparison to VIP for 25 years design life ................................................. 89
Table 5.6 Limits of VIP in terms of minimum carbon emission for 25, 40 and 60 years
design life (residential) ................................................................................ 91
Table 5.7 Limits of VIPs in terms of minimum carbon emission for 25, 40 and 60 years
design life (office buildings) ....................................................................... 91
Table 5.8 Net Global Warming Potential associated with hemp farming and processing
..................................................................................................................... 93
Table 5.9 U-values associated with insulated cavity widths ......................................... 101

An Assessment Methodology for Enviro-Economic Justification of Low and Zero Carbon Building Technologies
xv
Table 5.10 Minimum aggregated CO2 burden associated with embodied carbon of
mineral wool, PUR and VIP and operational carbon required for heating
(by building type and service life). ............................................................ 102
Table 6. 1 Average cost of renewable technologies and insulation materials supplied by
various manufacturers in the UK .............................................................. 106
Table 6.2Typical rental values for office accommodation (property market report 2011)
................................................................................................................... 114
Table 6.3 Office building specifications ....................................................................... 114
Table 6.4 The NPV of the additional rental income of VIP in comparison to
conventional insulations ............................................................................ 115
Table 6. 5 Rental value (residential buildings) ............................................................. 118
Table 6.6The NPV of the additional rental income of VIP in comparison to
conventional insulations ............................................................................ 119
Table 6.7 Payback periods associated with initial cost of thermal performance
improvements and energy savings ............................................................ 121
Table 7.1 Maximum CO2 savings associated with improving the building fabric U-value
................................................................................................................... 123
Table 7.2 Investigated packages in summary ............................................................... 127
Table 7.3 NPV and CO2 savings associated with selected technology packages ......... 127
Table 7.4 CO2 savings associated with different packages and building types ............ 136
Table 7.5 Investigated packages ................................................................................... 139
Table 7.6 NPV and CO2 savings associated with package G and different building types,
mineral wool .............................................................................................. 141
Table 7.7 NPV and CO2 savings associated with package G and different building types,
PUR ........................................................................................................... 141
Table 7.8 NPV and CO2 savings associated with package H and different building types,
mineral wool .............................................................................................. 142
Table 7.9 NPV and CO2 savings associated with package H and different building types,
PUR ........................................................................................................... 142
Table 7.10 Maximum CO2 savings achievable with the investigated packages for
analysed building types ............................................................................. 145

An Assessment Methodology for Enviro-Economic Justification of Low and Zero Carbon Building Technologies
xvi
Table 7.11 Investigated packages including current and future FiT scenarios ............. 145
Table 7.12 NPV and CO2 savings associated with different packages, medium sized
warehouse .................................................................................................. 146
Table 7.13 NPV and CO2 savings associated with different packages, retail shed ...... 148
Table 7.14 NPV and CO2 savings associated with different packages, office .............. 149
Table 7.15 Maximum achievable CO2 saving associated with each package ............... 150
Table 8.1 Fabric U-value scenarios ............................................................................... 158
Table 8.2 Air permeability standards for industrial buildings ...................................... 159
Table 8.3 Notional Building fabric U-value specifications .......................................... 161
Table 8.4 Embodied and operational carbon proportions in relation to different building
fabric only scenarios .................................................................................. 162
Table 8.5 Embodied and operational carbon proportions in relation to different scenarios
in order to achieve zero carbon performance ............................................ 162

An Assessment Methodology for Enviro-Economic Justification of Low and Zero Carbon Building Technologies
xvii
Acknowledgments
I would like to express my special gratitude and appreciation to my Director of Studies
Professor Ray Ogden. He has been a tremendous mentor and a great friend to me. I
would like to thank him for being generously supportive and for keeping me motivated
throughout my study. It was a great honour for me to have him as my Director of
Studies.
I would also like to thank my second supervisor, Christopher Kendrick for his patience
and his priceless technical support and Dr Shaun Wang who helped me with my
software analyses in the first year of my study. I would also like to thank my dear
friends and colleagues at the Architectural Engineering Group at Oxford Brookes
University, Prof. Nick Whitehouse, Dr Nicholas Walliman, Dr Martin Heywood, Dr
Bousmaha Baiche, Dimitrious Moutaftsis, Sadjad Tajdaran and Helen Tanner for their
encouragement and support.
A special thanks to TATA Steel Group for giving me the opportunity to pursue my
education by sponsoring this research.
My sincere thanks to Dr. Farooq Awan who has kindly proof-read my thesis.
A special thanks to my parents and my brother and sister. Words cannot express how
grateful I am to you for your endless love and support.
Last but not least, a very special thanks to my beloved wife Shahrzad, who has been my
dearest friend and my biggest motivation for finishing my PhD. Thank you for being
there for me days and nights and keeping me sane in my most difficult moments.

1
CHAPTER 1: Introduction UK, EU and international targets for the reduction of anthropogenic carbon and
Greenhouse Gas emissions necessitate fundamental changes to the ways that buildings
are designed and operated. As the international targets on reducing carbon emissions
become stricter, so does the imperative for better performing carbon efficiency
technologies in the most carbon intensive sectors such as buildings and industrial
activities.
This chapter provides an overview of the environmental concerns that are driving the
energy and carbon reduction targets and the associated legislative frameworks that have
emerged with which buildings are required to comply. This is a vast and rapidly
developing field and it is therefore neither possible nor desirable to be comprehensive.
Therefore the intention is instead to highlight the significance of adopting whole life
carbon approaches in building performance standards, and how it is anticipated that
compliance with carbon targets will need to be demonstrated.
1.1 Greenhouse Gas (GHG) emissions and global warming
The term ‘Greenhouse Gas’ refers to various heat-trapping trace gases which are present
in the Earth’s atmosphere and have the potential to cause atmospheric warming. The
contribution that individual GHGs make to the greenhouse effect depends on how much
heat each absorbs and subsequently re-radiates.
Notable GHGs include:
• Carbon Dioxide (CO2): Carbon dioxide is generated by burning of fossil fuels
(oil, natural gas, and coal), solid waste, trees and wood products, and also
chemical reactions such as those associated with production of cement.

CHAPTER 1: Introduction
2
• Methane (CH4): Methane is emitted during the production and transportation of
fossil fuels. Methane emissions also result from livestock and other agricultural
practices and by the decay of organic waste in solid waste landfills.
• Nitrous Oxide (N2O): Nitrous oxide is emitted during agricultural and industrial
activities, and also in the process of combustion of fossil fuels and solid waste.
• Fluorinated Gases: Hydro fluorocarbons, perfluorocarbons, and sulphur
hexafluoride are powerful, artificial greenhouse gases emitted from a variety of
industrial processes.
The presence of greenhouse gases in the atmosphere shifts the proportion of solar
radiation that is reflected into space in comparison to the component that is transmitted,
thus increasing the total amount of radiation entering the atmosphere. Once radiation
has entered the atmosphere, greenhouse gases absorb the reflected long-wave radiation
from the Earth’s surface. In tandem these effects cause a trapping of heat in the
atmosphere and net temperature increases (Figure 1.1).
Figure 1.1 The greenhouse effect (source: www.epa.gov)
Levels of atmospheric greenhouse gases are essential to the way that the atmosphere
functions. It is however increasingly accepted that elevated levels of anthropogenic

CHAPTER 1: Introduction
3
gases produced as a result of human activities are problematic. These combine with the
gases that are naturally present in the atmosphere with significant adverse effect.
Although carbon dioxide is not on a volume or weight basis, the most powerful of the
gases in terms of GWP (Global Warming Potential), is believed to be responsible for
60% of the greenhouse effect (unfccc.int, 2012). Current levels of carbon dioxide
exceed 380 parts per million, a figure which appears to be beyond long term norms
generally ranging between approximately 180 and 300 parts per million (Figure 1.2).
Figure 1.2 Global CO2 levels (source: NASA GISS database)
The International Panel for Climate Change (IPCC) in their 2007 annual report
influentially stated that if the greenhouse gases emission trend continues at or above the
current pace, an average global temperature increase of 3 to 7°C is likely to happen by
2100.
The IPCC's Fifth Assessment Report, Working Group 1 (2013, p.5) further noted that:
Even if emissions are stopped immediately, temperatures will remain elevated
for centuries due to the effect of greenhouse gases from past human emissions
already present in the atmosphere. Past, present and future emissions of carbon
dioxide represent a substantial multi-century climate change commitment.
Also according to the IPCC report (2014, p.1):

CHAPTER 1: Introduction
4
Scenarios show that to have a likely chance of limiting the increase in global
mean temperature to two degrees Celsius, means lowering global greenhouse
gas emissions by 40 to 70 percent compared with 2010 by mid-century, and to
near-zero by the end of this century.
Figure 1.3 Temperature rise pattern since year 1880 (source: NASA GISS database)
According to NASA’s GISS database, the global surface temperature of the earth has
risen by 0.7 C since 1950s. The finding agrees with results from both the Japanese
Meteorological Agency and the UK Climatic Research Unit (Figure 1.3). Based on
these trends it is believed that even if greenhouse gas emissions were significantly
reduced to year 2000 levels, the Earth is still likely to warm by approximately 1°C over
the next 100 years (Figure 1.4) (IPCC, 2007).
Figure 1.4 Temperature projections to the year 2100 based on a range of emission
scenarios and global climate models. Source: NASA (adapted from IPCC, 2007)

CHAPTER 1: Introduction
5
Current upward trend in the global temperature can lead to serious climate disruptions
such as rises in sea level (Figure 1.5) (global sea level rose about 17 centimetres in the
last century), increasing volumes and intensity of rainfall, changes in weather, higher
summer temperatures (ten of the warmest years occurred between 2002 and 2013),
ocean acidification, declining Arctic sea ice and increased frequency of extreme weather
events.
Figure 1.5 Global sea level rise pattern (NASA GISS database)
1.2 Reduction targets of GHG emissions
It is increasingly evident that one of the world’s most serious long-term challenges is
climate change. Evidence gathered by various climatic research institutions has
demonstrated the seriousness and urgency of this issue. The debate has effectively
moved from whether or not the climate change is happening to what we need to do to
control it and how we adapt to live with it (Zero carbon building definition, 2008). As
an international response to the problem, carbon reduction targets were agreed in place
to put heavier burden on developed and industrialised countries for 150 years of their
industrial activities.
The world’s first climate conference took place in 1979 in Geneva sponsored by World
Meteorological Organization (WMO). In 1988 the Intergovernmental Panel on Climate
Change (IPCC) was set up focusing on the science of climate change. The IPCC's first
assessment report was released in time for the second climate conference in 1990 which

CHAPTER 1: Introduction
6
highlighted the risks. In 1994 the United Nations Framework Convention on Climate
Change (UNFCCC) came into force and an ‘overall framework for intergovernmental
efforts to tackle the challenge posed by climate’ was set up. This led to the Kyoto
Protocol which was formally adopted in 1997 as the world’s first international
agreement on tackling climate change. Most recently however the Paris summit is to be
held in December 2015, to ensure meaningful action on climate change.
According to the Green alliance 2014 report, getting a global agreement on climate
change, the deal must contain the following elements:
• ambitious action before and after 2020
• a strong legal framework and clear rules
• a central role for equity
• a long term approach
• public finance for adaptation and the low carbon transition
• a framework for action on deforestation and land use
• clear links to the 2015 Sustainable Development Goals
1.2.1 The European 20-20-20 targets
In order to achieve the committed carbon reduction targets, the European countries set a
series of demanding energy targets to be met by 2020, known as the ‘20-20-20’ targets
(http://unfccc.int, 2012). Targets include:
• Reduction in EU greenhouse gas emissions of at least 20% below 1990 levels.
• 20% of EU energy consumption to come from renewable resources.
• 20% reduction in primary energy use compared with projected levels, to be
achieved by improving energy efficiency.
1.2.2 The European Union Emissions Trading System (EU ETS)
The EU ETS, also known as the European Union Emissions Trading Scheme, was the
first large emissions trading scheme in the world (EU-ETS fact sheet, 2013). The

CHAPTER 1: Introduction
7
scheme was launched in 2005 to reduce industrial greenhouse gas emissions cost
effectively (European Commission Climate Action, Emissions Trading System).
Under the EU-ETS, large European emitters of CO2 must monitor their CO2 emissions,
and report them annually. They are obliged to pay an amount of emission allowance to
the government equivalent to their CO2 emissions in that year.
1.2.3 The Effort Sharing Decision
The Effort Sharing Decision establishes binding annual greenhouse gas emission targets
for the period 2013–2020. These targets concern emissions from sectors that are not
included in the EU Emissions Trading System (EU ETS). This includes transport,
buildings, agriculture and waste. The Effort Sharing Decision requires 10% reduction
from all sectors not included in the EU-ETS.
Figure 1.6 World CO2 emissions by country (Source: the Ministry of the
Environment, Japan (partially supplemented by UNFCCC data))

CHAPTER 1: Introduction
8
1.3 UK national carbon reduction strategies
Carbon dioxide accounts for 82% of greenhouse gas emissions in the UK (DECC,
2014). The UK Government has taken a number of steps to reduce the UK’s emissions
of greenhouse gases (as agreed in the Kyoto Protocol) through legally binding targets.
1.3.1 UK Climate Change Act
The UK Climate Change Act was introduced in 2008 and established a framework to
develop an economically credible emissions reduction path in the UK as the world’s
first legally binding framework to tackle the climate change (Climate Change Act,
2008). The key aim of the Act is to improve carbon management strategies, helping the
transition towards a low-carbon economy in the UK.
The act sets a legally binding target of at least an 80% cut in greenhouse gas emissions
by 2050 and a reduction in emissions of at least 34% by 2020 against 1990 levels. In
respect of this, the Government has set specific principles to ensure that the policies
contribute effectively to the greenhouse gas reduction targets. Features of these policies
include:
• Setting ‘carbon budgets’1 to limit the amount of greenhouse gases the UK is
allowed to emit over a specified time.
• Using statistics on greenhouse gas emissions and further evidence, analysis and
research to inform energy and climate change policy.
1 Carbon budgeting is designed by UK government to limit the total amount of greenhouse gases that can
be emitted over a 5-year period. It considers the greenhouse gases emitted between now and 2050. Where
emissions rise in one sector, corresponding falls need to be achieved in other sectors to recover the rise.
‘Carbon budgets’ is introduced as part of the Climate Change Act 2008 to help the UK reduce greenhouse
gas emissions by at least 80% by 2050. A 35% greenhouse gas emission reduction is targeted in the
‘carbon budgets’ in the UK by 2027 relative to 2012 levels.

CHAPTER 1: Introduction
9
• Using the ‘EU Emissions Trading System (EU ETS)’ (introduced in section
2.1.3) to deliver a significant proportion of the UK’s carbon emission reductions
between 2013 and 2020.
• Using the ‘2050 Calculator’ which is a tool to let policy makers and the public
explore the different options for meeting the 2050 emissions reduction targets.
1.3.2 UK energy efficiency schemes
The energy efficiency schemes in order to contribute to UK global carbon reduction
targets are introduced by UK Government. Schemes include:
1.3.2.1 UK Green Deal
The Green Deal was a government scheme to reduce the UK’s carbon emissions by
improving the energy efficiency of buildings (the Green Deal Home Improvement
Fund (GDHIF) is closed to new applications). Many buildings in the UK are poorly
insulated and have inefficient heating systems resulting in high energy bills. The
associated energy use is responsible for millions of tonnes of unnecessary CO2 being
released to the atmosphere. Improving the thermal efficiency of buildings is progressing
slowly due to the high capital cost. The Green Deal scheme supports the initiative by
financing thermal efficiency improvements with no upfront cost to the house owner.
The cost of the work is repaid over time from the energy cost savings due to the
efficiency measures.
Despite the unsatisfactory statistics (only 1,612 homes had Green Deal plans in progress
as of December 2013) recent Government reports suggest that more than 150,000
assessments have been carried out since January 2013. The main difficulty though
seems to be quantifying projected energy use reduction and also the confusion caused
by the planning of the scheme between both home owners and the supply chain.

CHAPTER 1: Introduction
10
1.3.2.2 The Energy Companies Obligation (ECO)
The Energy Companies Obligation (ECO) was a programme administered by Ofgem
(Office of Gas and Electricity Markets) for the UK Government to place legal
obligations on the larger energy suppliers to deliver energy efficiency measures to
domestic energy users from 2013 until 31 March 2015. ECO was designed to work
alongside the Green Deal with a particular focus on vulnerable consumers.
The scheme requires energy suppliers with more than 250,000 domestic customers to
provide free or subsidised home energy efficiency measures in harder-to-treat homes
and to support the installation of efficient boilers.
1.4 Investment on renewable energies
The growth of renewable energies such as solar and wind energy has increased
significantly in the last few decades as renewables are now considered essential toward
achieving the carbon reduction targets. According to the International Energy Agency
(IEA), approximately 22% of world energy is generated using renewables. According to
a report released by IEA in 2013, more than $250 billion has been invested in renewable
energy generation. Investment is still less than UN targets. In April 2014 the United
Nations warned that to mitigate climate change, investment in renewable energies
should be at least three times greater than at present. Although the use of renewable
energies is growing, investment has fallen compared to 2011 when the total investment
reached a peak of $280 billion.
The cost effectiveness of renewable technologies is being questioned. IEA however
argues that the cost of renewable energy generation reduces with scale and that
economic incentives can be used effectively to stimulate growth. The UK renewable
energy roadmap states that the costs of renewable energy technologies are uncertain but
are expected to fall over time as supply chains develop and technical challenges are
overcome (DECC, 2011). This has already happened to solar PVs and costs have fallen
by factor of four over ten years.
CHAPTER 1: Introduction
11
The European Wind Energy Association believes that if there is any intention by
European countries to achieve energy and carbon security, a minimum of 30%
renewable energy target is required to be defined. The current trend determines a
compelling case for uptake of novel energy thrift technologies and methodologies
through a global determination to tackle climate change (Netherlands Environmental
Assessment Agency, 2012).
1.5 Reducing energy use from the built environment There are compelling rationales for reducing energy use in the built environment. These include:
• Buildings are major contributors to anthropogenic greenhouse gas emissions
believed to be responsible for climate change
• Carbon based fuel reserves are depleting and alternative energy sources are
proving difficult to develop safely and in sufficient volume to meet demand
• Many countries are faced with major issues of energy security
• Energy costs are increasing prejudicing economic development and raising
concerns regarding fuel poverty
• Future global development and population growth appears likely to exasperate
current issues.
As a consequence in the UK and in most developed countries building standards
increasingly require improved standards of energy thrift. From the perspective of the
construction sector supply chain this means that many existing building systems will
become obsolete on the grounds that they are uncompetitive or unable to meet new
standards, whilst new products with superior performance will become commercially
viable in ways that they are not at present. This research addresses the need to identify
when products will experience ‘death’ and ‘birth’ points in relation to progressively
changing standards.
According to the IEA (International Energy Agency), the building sector represents
around 30-40% of the world’s final energy consumption, and is a significant contributor
to CO2 emissions (CO2 being a key metric and currently accepted proxy for greenhouse

CHAPTER 1: Introduction
12
gas emissions in the built environment). The overall global position is echoed in the
European Union where buildings account for 40% of energy consumption and 36% of
CO2 emissions (Buildings Energy Data book, 2006), (US Department of Energy and
Annual Energy Review, 2007). In the UK the position is slightly worse than the
European average with buildings accounting for approximately 45% of total CO2
emissions (27% from the domestic sector and 18% from the non-domestic sector), with
energy principally being used for space heating and cooling, water heating and lighting.
Figure 1. 7 Final energy consumption in the world (Source: IEA 2012)
1.5.1 Existing buildings The majority of buildings that will be in use in 2050 have already been constructed
(UNEP 2009, Carbon trust 2007) and will generally have lower standards of energy
thrift than buildings constructed to current standards, and buildings that will be
constructed to future standards. Whilst therefore the performance standards against
which new buildings are designed are important, effective strategies need to be found
for improving the existing stock, and it may reasonably be anticipated that future
government policies will reflect this.
Whilst progress is being made in reducing carbon, it is not yet commensurate with the
scale of the transformation required to ensure transition to a low carbon built

CHAPTER 1: Introduction
13
environment (in line with international carbon reduction targets). Detailed issues
associated with the necessary transition vary between sectors.
1.5.1.1 Residential sector
According to the Office for National Statistics, almost 40% of the housing stock in
England and Wales was built before 1944 with 23% and 33% respectively built before
1919. Scotland’s and Northern Ireland’s housing stock are slightly newer on average,
with only a third built before 1944, and nearly half of the stock (47%) built since 1965
(The UK State of Housing, 2000).
In England, only 50% of post-1990 dwellings have insulated cavities or over 150mm of
loft insulation. The relative figures for pre 1944 dwellings are 28% and 40%
respectively (UK national statistics, 2010). Whilst thermal retrofitting of existing
buildings appears under-represented, in 2010 over 400,000 existing homes in the UK
received cavity wall insulation (11 million since 1990) and over 1 million received loft
insulation (9 million since 1990) (DECC 2011) and major Government sponsored
schemes are beginning to appear aimed at promoting more general retrofitting (for
example ‘Green Deal’ see Chapter 3).
1.5.1.2 Non–residential sector
17% of UK emissions come from non-domestic buildings. Of these only 2% are less
than five years old and a large proportion of the remaining stock is characterised by
poor standards of energy performance. Around 31% of existing non-domestic buildings
were completed prior to 1939, 46% between 1940-1985 and 23% from 1985 onwards
(Carbon trust, 2009). It has been estimated that 80% of all existing commercial
buildings would be rated below C using the Energy Performance Certificate scale
(Caleb Management Services, 2010).
In the case of industrial buildings, currently, only about 30% of the annual market for
profiled roofing and cladding is used for refurbishment, representing just 1-2% of the
CHAPTER 1: Introduction
14
existing ‘cladding area’ in the UK. At these rates, and recognising the inaccuracies and
uncertainties of future trends, it may reasonably be expected that replacement of 50% of
the existing building stock with upgraded systems compliant with current and future
building standards is likely to take a period of the order of 100 years. Better and more
effective thermal retrofit strategies may accelerate this transformation.
1.5.2 New buildings
1.5.2.1 Residential buildings There were an estimated 23.2 million dwellings in England and Wales at the end of
March 2013, an increase of 125000 dwellings (0.54% of the total existing homes) on the
previous year (Office for National Statistics). In 2007 the UK Government set a target
of increasing the supply of housing to 240,000 additional homes per year (1% of the
total existing homes) by 2016 (Health, 2014). Whilst such targets are currently not
being met carbon reduction in this sector is important given the large numbers of
buildings in the category.
1.5.2.2 Non-residential buildings According to the UK Green Building Council, there are 1.8 million non-domestic
buildings in the UK. The energy used by non-domestic buildings accounts for
approximately 18% of UK carbon emissions. Again, given the large size of the sector,
energy saving potential is considerable. Estimations suggest that measures in non-
domestic buildings could potentially save 18MtCO2 by 2020 and 86 MtCO2 by 2050,
depending upon the level at which the carbon reduction measures are adopted (LCICG,
2012). Furthermore the sector is anticipated to grow substantially. By 2050 total UK
non-domestic floor area is predicted to increase by 35% (DCLG, 2013).

CHAPTER 1: Introduction
15
1.6 Effective whole life carbon reduction
While the UK CO2 emissions have dropped by 26% in the past 20 years, research
carried out at the University of Leeds has demonstrated that underlying emissions are
rising as the burdens associated with goods imported from countries such as China are
omitted from current calculations. Research suggests that the 194 M tonnes CO2
emission reduction claimed by the UK in 2012 (compared with 1990 levels) has been
outweighed by a rise of 280M tonnes CO2 associated with imported goods to the UK
(Scott and Barrett, 2015).
UK Regulations have so far tended to focus on reducing the operational energy of
buildings. As a consequence better and more effective technologies (including improved
insulation levels, energy efficient lighting, heat recovery systems, and renewable
technologies) have reduced operational energy but have tended to increase embodied
energy as a result of increased material usage in areas such as insulation. Issues are
therefore emerging as to the validity of the approach and methods to facilitate more
comprehensive appraisal are likely to be required in the future, and are the broad
concern of this thesis.
Carbon reduction strategies in the future will need to adopt ‘whole life’ perspectives
taking full account of all aspects of energy including operational carbon and the energy
associated with the extraction, processing, manufacture and transportation of the
materials and products that constitute the building (known as embodied energy). This is
evident in various research studying the significance of including embodied carbon into
carbon reduction equations. The literature includes:
The Low Carbon Construction Innovation and Growth Team (IGT) final report in 2010
provides a series of recommendations aiming at supporting the UK government’s
transition to a low carbon economy. The report considers embodied CO2 as a
progressively more important aspect of effective carbon reduction strategies. The IGT
(2010) states:
Recommendation 2.1: That as soon as a sufficiently rigorous assessment system
is in place, the Treasury should introduce into the Green Book a requirement to

CHAPTER 1: Introduction
16
conduct a whole-life (embodied + operational) carbon appraisal and that this is
factored into feasibility studies on the basis of a realistic price for carbon.
Recommendation 2.2: That the industry should agree with Government a standard
method of measuring embodied carbon for use as a design tool and for the
purposes of scheme appraisal.
Also the ‘Embodied Carbon Industry Task Force Recommendations’ report by Guy
Battle, 2014, recommends to the Government that:Embodied Carbon be included as an
Allowable Solution within the Zero Carbon Building Regulations for both Homes and
Commercial Development. It also suggests that Government should support and fund
the development of a UK wide materials database (similar to those developed in
Germany and the Netherlands), the development and upkeep of the WRAP Buildings
Database, include whole life carbon emission in the Building Regulations and support
further research on the benefits of managing and reducing embodied carbon.
Also internationally, there are several studies considering and suggesting a whole life
carbon approach for reducing carbon emissions from the building sector. This includes:
The Athena Sustainable Materials Institute which is a non-profit research collaborative
considers whole life carbon approaches as the effective approach. The Athena SMI
offers green labelling programs to reduce the carbon footprints in the production and
consumption of construction materials considering a whole life carbon approach.
The US Institute for Passive House (PHIUS) has also undertaken a comprehensive
study considering whole life views (cost and carbon) of achieving ‘Passive house’ level
efficiencies. The embodied CO2 of buildings constructed under Passivehaus standards
has also been studied in several studies including McHendry (2013) and the results
suggest that embodied CO2 accounts for approximately 25% of the estimated lifetime
energy demand of a house.
The UK Government is acknowledging the significance of embodied carbon and this
research is intended to support improved practice. It suggests that combined embodied
and operational CO2 approaches should logically be the basis of all strategic decision
making.

CHAPTER 1: Introduction
17
This research has therefore addressed the use of combined operational and embodied
carbon approaches as means of providing true life cycle carbon appraisals for low and
zero carbon building technologies.
1.7 Aim and objectives of the research
The aim of this research is to establish an assessment methodology for appraising the
commercial and carbon advantages of new low and zero carbon building technologies.
This will enable manufacturers and producers to assess their potential and
competitiveness with established products, on grounds of combined operational and
embodied CO2 and in terms of cost effectiveness.
The objectives in support of the aim are to:
1. Identify and review current new product development demands relating to low and
zero carbon building technologies and the economic cases on which they are based.
2. Identify optimal approaches to:
a. Assessing the relative financial competitiveness of comparator new and existing
products based on ‘first’ and ‘life cycle’ cost (using appropriate future value
discounting procedures).
b. Quantifying relative carbon efficiencies of new products for low and zero carbon
buildings based on computer modelling and best practice modelling assumptions.
This identifies ‘death points’ beyond which existing products become obsolete as
new products present definitive advantages on the basis of carbon.
c. Determining the physical limitations of comparator products such that financial
and carbon comparisons are considered only where there is genuine product
competition, and the limits of technologies are fully recognised.

CHAPTER 1: Introduction
18
3. Apply the methodology to a series of selected case studies of novel low and zero
carbon building technologies and identify the threshold where these technologies will
present financial advantage (in relation to energy costs), or carbon advantage (in
relation to meeting tightening regulations for energy thrift).
4. Develop an Excel-based assessment tool based on the proposed methodology
(Chapter 8).
1.8 Structure of thesis
An overview of the Chapters is as follows in this section.
Chapter 1 provided an overview of the environmental concerns that are driving the
energy and carbon reduction targets. Aim and objectives of the research were defined in
Chapter 1.
Chapter 2 reviews the improvement of the thermal performance standards within
Building Regulations since 1985 and determines the limits of existing regulatory
approaches concerning the combined approach.
Chapter 3 reviews the available approaches concerning cost and carbon quantification
methods.
Chapter 4, Informed by the available approaches reviewed in Chapter 3, describes the
assessment methodology used in the course of this research. The buildings analysed in
accordance with this methodology and the assumptions used to assess a series of case
studies of low and zero carbon building technologies is also described.
Chapter 5 investigates the effect of adding embodied CO2 to carbon reduction analyses
associated with a highly insulated building envelope comparing mainstream
conventional insulation materials with novel insulation materials for new and thermally
retrofitted domestic and non-domestic buildings.

19
Chapter 6 presents the Life Cycle Costing analysis associated with the building fabric
energy efficiency investigated in Chapter 5.
Chapter 7 determines the maximum level of carbon reductions achievable through a
combination of fabric energy efficiency and onsite low and zero carbon solutions. The
analyses will include industrial and office buildings as exemplar building types for
application of the methodology.
Chapter 8 describes the development of an Excel-based assessment tool which has
been developed to enable manufacturers to determine the most cost effective ways of
achieving zero carbon non-domestic buildings using different design scenarios and
service lives.
Chapter 9 presents the thesis conclusions and recommendations for further research.
2

CHAPTER 2: Regulatory Approaches to Anthropogenic Gas Emission Reduction
20
CHAPTER 2: Regulatory Approaches to Anthropogenic Gas
Emission Reduction Chapter 1 reviewed the UK, EU and international targets for the reduction of
anthropogenic carbon and Greenhouse Gas emissions necessitating fundamental
changes to the ways that buildings are designed and operated. This chapter provides an
overview of how the thermal performance standards within Building Regulations have
been improved since 1985 and determines the limits of existing regulatory approaches
concerning the combined operational and embodied CO2.
2.1 Introduction
There is a strong argument being made by the Government for regulating at the point of
design. The cost of upgrading buildings after construction, aggregated with their initial
construction cost is much higher than designing to an appropriate initial standard. As
the price of energy rises, the cost of running less efficient buildings increases
significantly, but technologies are effectively locked in and difficult to replace at
acceptable cost. Improving the thermal performance could prove difficult subsequently
(DCLG, 2013).
Apart from very energy intensive industries, the overall consumption patterns of
businesses are generally not hugely affected by energy bills, reducing the incentive to
pay for a highly carbon efficient building. Application of energy reduction measures in
existing commercial buildings is affected by the split incentive between landlords and
tenants. Tenants are usually reluctant to invest on improving energy efficiency measures
due to the short lease periods and owners are only obliged to improve the energy
efficiency of buildings that are rated below E of Energy Performance Certificate (EPC)
(Energy Act 2011).

CHAPTER 2: Regulatory Approaches to Anthropogenic Gas Emission Reduction
21
The Government has gathered evidence (DCLG, 2013) showing that the market will not
make the required changes voluntarily even with the influence of market-focused
policies such as the EU Emissions Trading Scheme (EU ETS) and the CRC. The
Government therefore, legislated the building related regulations to reduce the carbon
emissions associated with new and retrofitted domestic and non-domestic buildings as
an integrated part of the overall carbon reduction targets.
2.2 Building Regulations
The first mandatory Building Regulations, enforced by local authorities, were
introduced in 1966. These were revised in 1972 and then again in 1976. The 1985
Building Regulations were the first to include the modern system of building control
(Strickland, 2014). In 1984 the Building Act, changed the form of regulations
introducing a system of Approved Documents (England & Wales) and Technical
Standards (Scotland and Northern Ireland). This defined those subject to statutory
control (McAdam, 2007).
Building Regulations through Approved Documents support fourteen technical ‘Parts’
including; structural safety, fire safety, resistance to contaminants and moisture, toxic
substance, resistance to sound, ventilation, sanitation, drainage and waste disposal, heat
producing appliances, protection from falling, conservation of fuel and power, access to
use of buildings, glazing safety (only relevant to Wales) and electrical safety together
with Regulation 7 (workmanship and materials) (available at:
http://www.planningportal.gov.uk).
The energy and carbon reduction targets are set for each type of building individually in
Part L (Conservation of Fuel and Power) of the Building Regulations through which
planned reductions are expected to be achieved.

CHAPTER 2: Regulatory Approaches to Anthropogenic Gas Emission Reduction
22
2.2.1 Building Regulations Part L
The Building Regulations Part L2 introduces targets to reduce carbon emissions per
square meter by a certain percentage with respect to those of a notional building defined
in previous version of the Building Regulations (Building Regulations Part L, 2010).
The calculation procedure includes space heating and cooling, hot water and fixed
lighting and pertains to all types of buildings including new and substantially modified
existing, domestic and non-domestic.
2.2.2 How Building Regulations evolved
The thermal performance standards set by Building Regulations have been
progressively improved in each revision since 1985.
Historically, the Building Regulations simply prescribed minimum level of thermal
performance for each building element individually. Factors such as the ratio of
building volume to surface area were not acknowledged. Also good performance in one
area could not be offset against weaker performance in another. Given that only
relatively low standards of thermal engineering were required, such principles were
generally adequate.
More recently however, codes and regulations have evolved to better address total
carbon reductions. The new approach allows good performance in one area to offset
2 Part L of the Building Regulations controls: insulation requirements limitation of openings of the building fabric (door and window apertures) solar heating and heat gains to structures heating mechanical ventilation and air conditioning systems lighting efficiency space heating controls air permeability solar emission the certification, testing and commissioning of heating and ventilation systems requirements for energy meters

CHAPTER 2: Regulatory Approaches to Anthropogenic Gas Emission Reduction
23
lesser performance in other areas. Whilst flexible methods have been introduced,
minimum backstop U-Values3 have also been applied to key building elements (Table
2.1).
Table 2.1 Changes in thermal performance standards of Building Regulations since
1985
Element
1985 1991 2002
2006 2010 2013
Notional
Building
Backstop
value
Notional
Building
Backstop
value
Notional
Building
Backstop
value
Wall
(W/m2.K) 0.45 0.45 0.35 0.35 0.7 0.2 0.3 0.18 0.3
Roof
(W/m2.K) 0.25 0.25 0.25 0.25 0.35 0.13 0.2 0.13 0.2
Floor
(W/m2.K) 0.45 0.35 0.25 0.25 0.7 0.2 0.25 0.13 0.25
Windows
(W/m2.K) - 3 2.2 2.2 3.3 1.5 2 1.4 2
In 2010, differentiated performance standards were presented to the regulations, with
targets differing according to building type (sizes of buildings and different occupancy
patterns), on grounds of their respective carbon reduction potential. This allowed
standards to be flexible without forcing reduction levels for which the cost-effective
approaches were not available.
In the case of housing for example, apartments and mid-terrace houses have lower
external floor/wall/roof area per dwelling (and thus lower conductive heat loss through
the building fabric) than semi-detached and detached houses. This change maximises
the level of carbon reduction that can be achieved cost effectively.
The change away from prescriptive standards (strictly defined building element thermal
specifications) to total carbon reduction target based approaches, poses important issues
for the effective engineering of building technologies. For example, building envelope
systems that incorporate thermal insulation have historically been matched to the U-
3 U-value, is the total amount of heat loss (in watts) per square metre of building element (for example wall, roof, floor etc.) when the temperature (k) outside is at least one degree lower.

CHAPTER 2: Regulatory Approaches to Anthropogenic Gas Emission Reduction
24
values required by building regulations, and the specification of these components
would be adjusted with consecutive iterations of building regulations. Currently
however, only backstop values are standard and specifiers of building envelopes are
able to design to any U-value equal to or exceeding these. Identification of optimised
insulation values for standard building envelope products is therefore difficult. This
allows design and construction flexibility to meet a host of economic, functional and
architectural criteria but is a more complex paradigm for manufacturers to address.
2.2.3 Meeting the carbon reduction targets
Building Regulations have sought to reduce the energy needs of new buildings, and
buildings subject to major alterations, by setting performance standards. Their approach
has been to focus on ‘operational energy’ whilst ignoring ‘embodied energy’.
2.2.3.1 Operational energy/carbon
Operational energy is the amount of energy consumed during the ‘in-use’ phase of
building operation. Operational energy can be considered as comprising two parts,
‘regulated’ and ‘unregulated’. Only regulated energy is considered by Building
Regulations and refers principally to the energy used for heating, hot water, cooling,
and fixed lighting. Unregulated energy includes that used by appliances such as
televisions, cookers, computers and fridges and most ‘small power’ applications.
Regulated operational energy consumption is influenced by factors such as: hours of
operation, occupation levels, building use and occupant behaviour.
2.2.3.2 Embodied energy/carbon
‘Embodied energy’ can be defined as ‘the sum of the energy requirements associated,
directly or indirectly, with the delivery of a good or service’ (Cleveland & Morris,
2009). In practice however, there are various methods of defining embodied energy
contingent on the chosen boundaries of the study. The three most common options are:

CHAPTER 2: Regulatory Approaches to Anthropogenic Gas Emission Reduction
25
cradle-to-gate, cradle-to-site, and cradle-to-grave (Tingley & Davison, 2011) (refer
Chapter 3, Section 2.1 for definitions).
Embodied energy can be converted to embodied carbon using the same conversion
factors as cited in relation to operational energy. For the purposes of this study
‘embodied Carbon’ is defined to include all CO2 and CO2-equivalent emissions
associated with the above definitions (viz: cradle-to-gate, cradle-to-site, and cradle-to-
grave) excluding those associated with operational carbon as defined above.
Embodied/operational carbon and embodied/operational CO2 have been used
interchangeably in this research. Embodied carbon therefore includes burdens such as
those associated with resource extraction, transportation, and processing, and potentially
with delivery, installation, and end-of-life treatments, disposal, incineration and
recycling. Embodied carbon can also refer to the indirect emission of carbon related to
the chemical reactions in the manufacturing stages of materials such as cement (when
calcium carbonate is thermally decomposed, lime and carbon dioxide is produced).
In the 1980s operational carbon of buildings was assumed to be around ten times greater
than their embodied carbon burdens. However, as building energy efficiencies have
improved this ratio has shifted very considerably. Regulatory requirements together
with the increased use of renewables as energy sources have reduced operational carbon
whilst embodied carbon has remained essentially unchanged (apart potentially from that
associated with increased insulation). This trend appears likely to continue. If so, future
low and zero carbon buildings will achieve relative parity between operational and
embodied carbon (RICS, 2012).
Figure 2. 1 Likely embodied to operational carbon proportion for future buildings
For example, according to the RICS Information Paper ‘Methodology to Calculate the
Embodied Carbon of Materials), the embodied carbon of materials and products

CHAPTER 2: Regulatory Approaches to Anthropogenic Gas Emission Reduction
26
accounted for more than a third of the total carbon emissions associated with housing
(built to 2006 Building Regulations requirements) over a 30 year service life. This
figure will have increased further under current design codes. Similarly, the ratio of
embodied carbon to operational carbon for office buildings is around 1:3, and 1:5 for
typical supermarkets where the operational carbon needs are particularly high.
Given the shift that has occurred, it is arguably no longer justifiable to consider energy
efficiency in terms of ‘Operational Carbon only’. In order to properly assess carbon
burdens, it is the contention of this study that a whole-life carbon accounting method
must be applied. It would appear entirely reasonable to suppose that such methods will
be a feature of future carbon appraisals, and indeed that consideration of Embodied
Carbon may appear, in some form, in regulations potentially including Building
Regulations.
2.2.3.3 Carbon intensity and energy to carbon conversion factors
Energy can be converted to carbon but the conversion depends on the energy source
since some sources of energy are more carbon intensive than others. Different
conversion factors therefore apply to different energy sources, for example fossil fuels
will have a far higher embodied carbon burdens than those of renewable energies such
as wind or hydroelectric power. The associated carbon intensity of different sources of
energy can affect the potential carbon savings when considering application of low and
zero carbon solutions to buildings.
This research assumes Defra’s 2015 energy to carbon conversion factors as follows:
• Natural gas: 0.184 kgCO2/kWh
• Electricity: 0.462 kgCO2/kWh
Conversion factors (expressed as kg carbon dioxide equivalents), are available at:
www.ukconversionfactorscarbonsmart.co.uk.
The UK electricity conversion factor fluctuates from year to year as the fuel mix
consumed in UK power stations (and auto-generators) and the proportion of net

CHAPTER 2: Regulatory Approaches to Anthropogenic Gas Emission Reduction
27
imported electricity changes. These annual changes can be large as the factor depends
very heavily on the relative proportion of coal and natural gas as well as fluctuations in
peak demand and renewables. For example, in the 2014 GHG conversion factors there
was an 11% increase in the UK electricity factor from the previous year due to the
significant increase in coal powered electricity generation share in 2012. In 2015
however, the factor has decreased (versus 2014) by 6.5% which is due to a decrease in
coal powered electricity generation in 2013.
Note that Current conversion factors in the UK are in favour of technologies that save
electricity comparing with gas saving technologies. Electric heating systems for
instance could potentially result in different carbon savings. Also the analyses presented
in chapter 7, can be different if the carbon intensity of the source of electricity
generation is lower than fossil fuels i.e., from renewable energies such as wind or
hydroelectric powers.
This study assumes natural gas for heating and hot water systems and electricity for
lighting as the most common sources of heating and electricity consumption in the UK.
Cooling is not included in the analysis.
2.3 Total carbon (combined operational and embodied carbon) approach; the likely future requirement
At present, UK building regulations, and comparable international regulations largely
ignore embodied energy/carbon, but for the reasons already noted in the context of true
low carbon design this lack of consideration appears irrational.
This can be due to the unreliability or/and inconsistency of existing databases. The UK
Green Building Council 2015 report on ‘tackling embodied carbon from buildings’
suggests that the complexity of embodied carbon data arises from the fact that sources
of accurate and exhaustive data are based on different parameters of assessment. Carbon
factors for materials/products consider different end of life boundaries i.e., ‘cradle to
gate’, ‘cradle to grave’ and ‘cradle to cradle’. The report suggests ensuring consistency

CHAPTER 2: Regulatory Approaches to Anthropogenic Gas Emission Reduction
28
of data throughout the analysis before a comprehensive and consistent database is
developed.
Proper consideration of embodied carbon will potentially have a significant effect upon
building specifications. Many common conventional products with high embodied
carbon may well become obsolete in the context of true low carbon design, being
superseded by products with lower embodied carbon but with comparable performance
characteristics. Insulation is perhaps the most obvious area in this regard (where low
U-values are required, the embodied CO2 of conventional insulation materials can
significantly offset the operational CO2 benefits, or cause a net CO2 disbenefit), but the
logic applies broadly across all areas of building specification.
Whilst there is an essentially linear relationship between U-values and heat losses
through building fabric, embodied carbon tends to increase in an accelerating fashion as
levels of insulation increase. Figure 2.2 describes a typical relationship between
operational CO2 emissions and U-value for a selected building example (a 3000m2
industrial warehouse in southern England). The operational CO2 is positively correlated
only to thermal conductance (i.e. the graph is independent of the insulation material
used).
Figure 2.2 Example of typical linear relationship between CO2 emissions associated with operational carbon, and envelope U-value.
0
4
8
12
16
20
0 0.1 0.2 0.3 0.4 0.5 0.6
U-value (W/m2 K)
Oper
atio
nal C
O 2 (k
g CO
2/m2 /yr
)

CHAPTER 2: Regulatory Approaches to Anthropogenic Gas Emission Reduction
29
In contrast, embodied carbon profiles are neither linear, nor independent of insulation
material as:
a. required insulation thicknesses increase progressively more steeply as U-value is
reduced, and
b. embodied carbon and thermal conductivity of individual insulation materials
vary considerably. For example the embodied CO2 of polyurethane (PUR) is
3.48 kgCO2/kg and k-value 0.025 W/mK whilst those of mineral wool are 1.2
kgCO2/kg and 0.04 W/mK.
Figure 2.3 illustrates a typical curve for embodied CO2 (in this case associated with
PUR insulation), and also the combined operational and embodied CO2 arising for a
notional building. The key feature is that the aggregate of a linear and non-linear
relationship is by definition non-linear. Reductions in combined operational and
embodied CO2 become considerably more difficult to achieve as insulation thicknesses
increase. This introduces ‘death points’ for conventional insulation materials and ‘birth
points’ for novel products that offer significant advantages on grounds of carbon
efficiency.
The concept of ‘Death point’ is for the first time developed in this study and is defined
as the point beyond which carbon disbenefit occurs. In case of insulation material ‘death
point’ can be defined as the thickness of insulation beyond which the amount of
embodied carbon associated with thicker panel exceeds the related operational savings.
This can vary for different building types and operational scenarios but is within a range
of thicknesses that seem entirely possible to be the requirement of regulations in future.
Death point for other low and zero carbon building technologies is defined as the point
at which the carbon payback period is beyond the acceptable norms i.e., varying
depending on the related service lives.
‘Birth point’ in context is referring to the same concept as ‘death point’ but is defined as
the point at which the conventional solutions fail to comply with regulations and the
development of new novel solutions is required. The development and availability of
effective new low carbon building technologies is strategically important toward
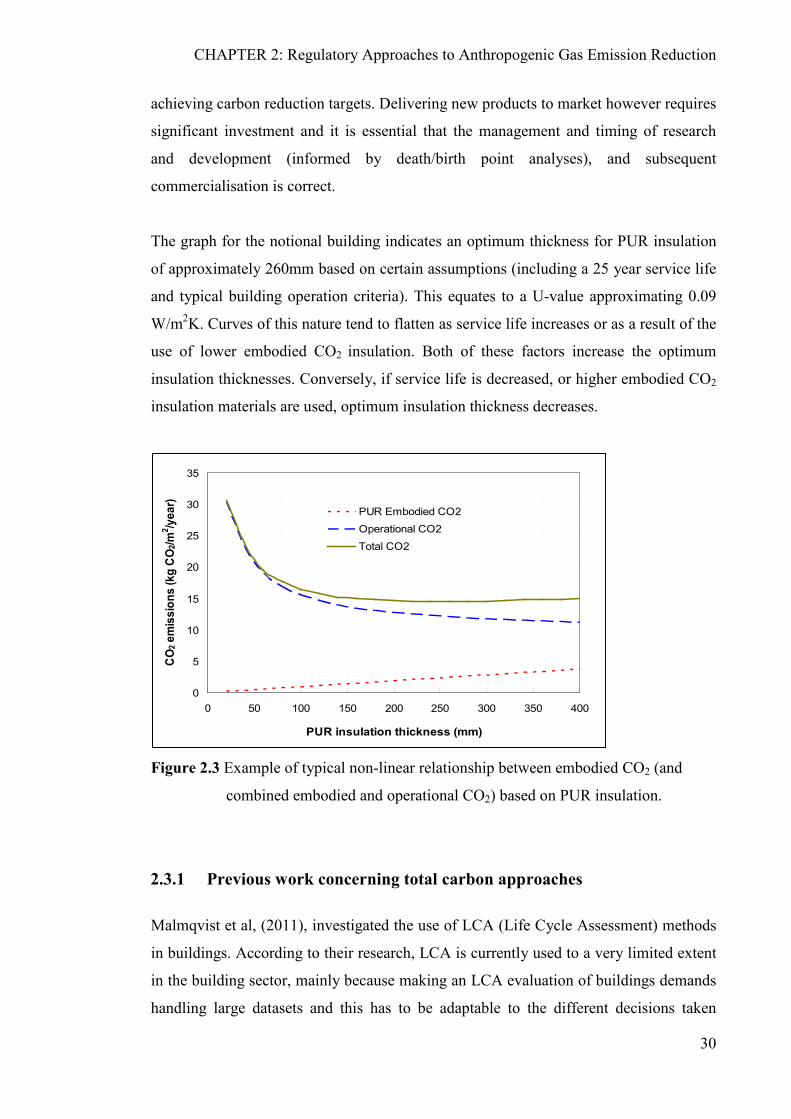
CHAPTER 2: Regulatory Approaches to Anthropogenic Gas Emission Reduction
30
achieving carbon reduction targets. Delivering new products to market however requires
significant investment and it is essential that the management and timing of research
and development (informed by death/birth point analyses), and subsequent
commercialisation is correct.
The graph for the notional building indicates an optimum thickness for PUR insulation
of approximately 260mm based on certain assumptions (including a 25 year service life
and typical building operation criteria). This equates to a U-value approximating 0.09
W/m2K. Curves of this nature tend to flatten as service life increases or as a result of the
use of lower embodied CO2 insulation. Both of these factors increase the optimum
insulation thicknesses. Conversely, if service life is decreased, or higher embodied CO2
insulation materials are used, optimum insulation thickness decreases.
Figure 2.3 Example of typical non-linear relationship between embodied CO2 (and
combined embodied and operational CO2) based on PUR insulation.
2.3.1 Previous work concerning total carbon approaches
Malmqvist et al, (2011), investigated the use of LCA (Life Cycle Assessment) methods
in buildings. According to their research, LCA is currently used to a very limited extent
in the building sector, mainly because making an LCA evaluation of buildings demands
handling large datasets and this has to be adaptable to the different decisions taken
0
5
10
15
20
25
30
35
0 50 100 150 200 250 300 350 400
PUR insulation thickness (mm)
CO2 e
mis
sion
s (k
g CO
2/m2 /y
ear)
PUR Embodied CO2
Operational CO2
Total CO2

CHAPTER 2: Regulatory Approaches to Anthropogenic Gas Emission Reduction
31
throughout the life cycle of the building. They propose a simplified methodology that
adopts a systematic approach guiding the user through the Life Cycle process and
clarifying key issues such as choice of assessment tool, definition of system boundaries
and options for simplifying the process. In a similar approach, Dixit et al, 2012,
provided a literature review of the current embodied CO2 standards and determined
current interpretations of embodied CO2 to be unclear and embodied CO2 databases to
suffer from problems of variation and incomparability. They contended that current
LCA standards fail to provide complete guidance.
Yohanis and Norton (2002) discuss that improved energy efficiency measures make
embodied carbon considerations increasingly important. It is discussed that reliable and
accurate embodied carbon data is not easily accessible to do the wide variation in the
data available. The variations of life-cycle operational and embodied carbon and capital
cost as a function of building parameters (such as glazing ratio and insulation levels) are
explored in their study.
Gustavsson and Joelsson, (2010) analysed primary energy use and CO2 emissions
associated with the production and operation of conventional and low-energy residential
buildings. They demonstrated that for conventional and low-energy buildings, the
primary energy use for production can be up to 45% and 60% respectively, of total
whole life energy needs, depending on the energy supply system.
Rossi et al (2012) dealt with the development of a basic tool for life cycle assessment of
residential buildings located in three different European towns. The tool focused on the
structure and the materials of the buildings and permitted evaluation of the embodied
carbon and yearly energy consumption. The tool took account of factors such as
monthly temperatures, energy mix, heating and cooling systems.
Blengini and Di Carlo (2009) conducted a detailed life cycle assessment analysis
comparing the energy consumption of a low energy house with that of a house built to
comply with legal standard insulation in northern Italy. Whilst the operational carbon
consumption of the low energy house was one tenth of that of the conventionally
specified house (1:10), they demonstrated that factoring in the embodied CO2 of
materials and systems, shifted this ratio to 1:2.

CHAPTER 2: Regulatory Approaches to Anthropogenic Gas Emission Reduction
32
Thormak (2002) studied the effect of material choice and recycling potential on the total
energy needs of a building. It was demonstrated that embodied energy accounted for
45% of total energy demand of a very energy efficient apartment housing in Sweden (45
KWh/m2) over a 50 year buiding life. The study demonstrated that through material
substitution, embodied carbon could be decreased by approximately 17% or increased
by about 6%.
Monahan and Powell (2010), Ramesh et al (2010), Yan and Zheng (2011) and Hacker et
al (2008) also carried out life cycle energy studies combining operational and embodied
carbon.
None of the existing approaches reviewed, investigated how the inclusion of embodied
CO2 into total carbon equations can push the use of mainstream conventional building
technologies to their ‘death points’ where the development of new solutions are vital
toward achieving the carbon reduction targets.
2.4 Financial justification of effective new low and zero carbon building technologies
Whilst it is very complicated to predict the future trend of the energy prices, it is highly
likely that energy prices will continue their generally upward trend in the future
(www.worldwatch.org, 2015), (www.carbonbrief.org, 2015), (www.ukpower.co.uk,
2015). Building owners therefore should logically plan ‘future-proofing’ the operational
costs of their buildings by committing to required or better than required thermal
standards in the regulations.
However, as many conventional insulation materials are proved to be unable to achieve
the anticipated performance standards due to their high associated embodied CO2, better
performing low and zero carbon solutions are required to contribute to carbon reduction
targets effectively.

CHAPTER 2: Regulatory Approaches to Anthropogenic Gas Emission Reduction
33
There is a recognised concept, supported by suppliers and manufacturers of construction
products, of ‘market pull’ supported by ‘technology push’. ‘Technology push’ is
facilitated by products and systems that have potential to deliver better building
technologies, but which require market acceptance and demand in order to become
established. Technically the approach may be feasible but there isn’t enough market
potential for it. On the other hand, ‘market pull’ represents the genuine need for
products that satisfy demands but the available solutions fail to fully satisfy. The market
pull will drive the translation of viable technology into commercialisable products.
Products, for which there is current limited economic or other demand, may well form
the basis of future innovation as requirements create demand. Conventional 1960s
products and techniques in much of Europe such as compressed strawboard roofing
panels, steel framed single glazed windows and cementitious roof sheeting have given
over to alternative products such as insulated roof decks, thermally broken double
glazing systems and composite cladding panels. Revisions to regulations and
subsequent demand for improved performance have driven this change.
2.5 Conclusion
New products that can potentially replace conventional solutions have to be developed
and introduced in a way that is aligned to demand (market pull), and at a point where
they become commercially viable (Kennedy, Whiteman and Van den Ende, 2013),
(Davey, 2013). Accurately identifying this point is difficult as the demand is often a
consequence of regulation, and the relative competitive advantages that exist between
comparator products and solutions at any given time. Providers must therefore be
equipped to analyse regulatory frameworks in relation to existing and proposed
comparator offerings in order to inform their strategic planning processes.
Therefore in conclusion it seems to be essential that an assessment methodology is
developed through which the ‘death points’ of existing technologies can be determined
and the use of new technologies justified on grounds of both carbon efficiency and cost
effectiveness. Within this, any methodology must take into account the technical
CHAPTER 2: Regulatory Approaches to Anthropogenic Gas Emission Reduction
34
feasibilities and manufacturing constraints that apply in order to ensure the practical
feasibility of assessments. Technologies are generally limited by a range of performance
or manufacturing constraints which establish ‘bounds of applicability’ for the
technology. Broadly, these may be characterised as upper and lower thresholds beyond
which the technology becomes insecure or unsuitable. For example, a basic timber beam
can span distances up to 4.5m, beyond which deflection and strength criteria will
become excessive. Limitations of this kind establish zones within which a product is
potentially competitive and consideration of the product outside of these limits is
inappropriate.
Simply stated, assessment methodologies should take account of:
• Carbon efficiency
• Economic and financial viability
• Technical constraints

35
3
CHAPTER 3: Available Cost and Carbon Quantification
Approaches
As has been discussed in Chapter 2, cost and carbon quantifications need to be
considered in the developing methodology. Available methods therefore need to be
reviewed and the most appropriate approaches adopted.
The following chapter hence, provides an overview of the available approaches
concerning cost and carbon quantification methods.
3.1 Available cost and carbon quantification methods
A comprehensive literature search has been conducted to investigate the current
available ‘whole life’ cost and carbon quantification approaches.
Available approaches include:
3.2 Life cycle approaches
These include the tools, programs and procedures used to support decisions based on
whole life analysis. They are principally categorised into two main groups: practical and
analytical approaches.
Practical life cycle approaches are designed to translate theory from the use of analytical
tools into practices such as policy programs, corporate programs and procedural tools.
Analytical approaches are used to assess the effects of planned decisions or
improvement scenarios made on a project. These approaches include analytical tools

CHAPTER 3: Available Cost and Carbon Quantification Approaches
36
such as Life Cycle Costing (LCC) and Life Cycle Assessment (LCA) which are of
interest to this research (UNEP, 2005).
3.2.1 Life Cycle Assessment
Life Cycle Assessment (LCA) is a whole life approach aimed at investigating the
variable range of environmental impacts associated with products and services in order
to improve processes, support policies and provide an effective basis for informed
decision making (Brander, 2013). LCA approaches can specify the environmental
consequences of products or services from cradle (extraction of raw materials) to gate
(relevant processes to the factory doors), or cradle to grave (the end of life stages).
The LCA approaches have in the last decade become standard procedures for exploring
the environmental impacts of construction products and materials. Their origins
however can be traced back to analyses carried out in the 1960s and 70s aimed at
optimizing direct energy consumption. The technique was then developed to take
account of raw material consumption and emissions along the full ‘life cycle’ of a
product, from material extraction and processing, to manufacturing and installation and
the end-of-life stages. LCA is now standardised by ISO norms 14040-14044, and,
specifically for the construction sector, by the European standards EN 158044 and EN
159785.
Based on a survey of LCA practitioners carried out in 2006 (Cooper and Feva, 2006),
LCA is mostly used to support business strategy (18%), R&D (18%), as input to
product or process design (15%), in education (13%) and for labeling or product
declarations (11%).
The use of LCA for ISO Type III labels called Environmental Product Declarations is
also growing considerably (Singh and Bakshi, 2009). An environmental declaration is
defined in ISO 14025 as ‘quantified environmental data for a product with pre-set
4 Published in 2012 by the European Committee for standardisation (CEN), EN 15804 is part of a suite of standards for the assessment of the sustainability of construction works at product and building levels. 5 Sustainability of construction works - Assessment of environmental performance of buildings (calculation methods).

CHAPTER 3: Available Cost and Carbon Quantification Approaches
37
categories of parameters based on the ISO 14040 series of standards, but not excluding
additional environmental information’ (Environdec.com, 2014).
Third-party certified LCA-based labels also are more recently providing an important
basis for assessing the relative environmental merits of products and providing
credibility in industry competitiveness. Independent certification can demonstrate
companies’ dedication to environmentally friendlier products (SGS, 2013).
The ISO 14040 describes the limitations of a LCA approach as:
• The nature of choices and assumptions made in LCA (e.g. system boundary
setting, selection of data sources and impact categories) may be subjective.
• Models used for inventory analysis or to assess environmental impacts are
limited by their assumptions, and may not be available for all potential impacts
or applications.
• Results of LCA studies focused on global and regional issues may not be
appropriate for local applications, i.e. local conditions might not be adequately
represented by regional or global conditions.
• The accuracy of LCA studies may be limited by accessibility or availability of
relevant data, or by data quality, e.g. gaps, types of data, aggregation, and
average site-specific.
• The lack of spatial and temporal dimensions in the inventory data used for
impact assessment introduces uncertainty in impact results. This uncertainty
varies with the spatial and temporal characteristics of each impact category.
The limitations stated by the ISO 14040 implies that he accuracy of any LCA analysis
including embodied carbon can only be as good as the data available for embodied
carbon measures. Comparing results of different LCA studies therefore is only possible
if the assumptions, context of study and embodied carbon sources are the consistent.

CHAPTER 3: Available Cost and Carbon Quantification Approaches
38
3.2.1.1 System boundaries
System boundaries define the processes which are included/excluded in a LCA or
embodied carbon study. Different factors can be considered in a system boundary
amongst which, determining the end of life stages within the system boundary are
particularly important. Common examples of the end of life stage approaches include
‘cradle-to-gate’, ‘cradle-to-cradle’, ‘gate-to-gate’ and ‘cradle-to-grave’ (Figure 3.1).
System boundaries and specifically end of life stages need to be defined clearly when
undertaking comparative LCA or embodied carbon assessments.
Cradle-to-grave
Cradle-to-grave is the full Life Cycle Assessment from raw resource extraction (cradle)
to use and disposal phases (grave). For instance paper (produced from trees) can be
reused as low energy recycled insulation, thus operational carbon savings can be
considered against embodied carbon associated with the production of the material. In
this form of analysis all energy inputs and outputs are considered across all phases of
the life cycle.
Cradle-to-cradle (closed loop production)
Cradle-to-cradle is a type of cradle-to-grave assessment, where the end-of-life disposal
stage for the product is a recycling process.. Recycling helps effective reduction of the
environmental impacts of products and materials.
Cradle-to-gate
Cradle-to-gate is a partial assessment of a product life cycle from resource extraction
(cradle) to the factory gate (i.e., before it is delivered to the consumer). The use phase
and disposal phase of the product are omitted from cradle-to-gate assessment, hence it
has limitations. However the technique is highly useful, for instance in situations where
transportation from factory to point of use is impossible to predict or is highly variable.
The majority of the available embodied carbon databases include cradle-to-gate values.

CHAPTER 3: Available Cost and Carbon Quantification Approaches
39
Gate-to-gate
Gate-to-gate is a partial LCA looking at only the ‘manufacturing’ stage of the whole life
processes. Gate-to-gate analysis results may also be linked in their appropriate
production chain to form a complete cradle-to-gate assessment (Jiménez-González et al,
2000).
Figure 3.1 End of life scenarios
3.2.1.2 Quantifying embodied and operational carbon
As it has been discussed in Chapter 2, the UK Building Regulations and comparable
international regulations pay little attention to embodied energy. As the required
standards become more demanding this lack of consideration becomes increasingly
concerning. The proposed methodology will include quantification of carbon emissions
as an integral part of the combined operational and embodied analysis. An effective and
accurate means of quantifying both the operational and embodied components is
therefore required.
Available approaches for quantifying embodied carbon
There are a range of methods of calculating embodied CO2.
Sophisticated commercially available software exists for life cycle analysis which is
able to apportion a wide range of environmental impacts. Software includes: Envest 2,
SimaPro, Impact and Gabi. Simpler software and approaches include embodied carbon

CHAPTER 3: Available Cost and Carbon Quantification Approaches
40
calculators which simply assign embodied carbon on the basis of measured quantities of
materials and databases. Examples of this latter class are the University of Bath’s
Inventory of Carbon and Energy (ICE) and WRAP databases.
Envest II
Envest II is a software tool intended to simplify the design of low environmental impact
buildings and forecast whole life costs allowing clients and designers to optimise whole
life cost value.
The users can either use the default environmental and financial data to provide an
estimate of relative whole life costs for different designs through ‘Envest Estimator’
module or enter their own capital and lifetime financial cost information using ‘Envest
Calculator’ module.
This provides a good basis for design teams who have their own specific data available.
IMPACT
IMPACT is a database for software developers to enable consistent LCA and LCC
assessments. It was developed by BRE in collaboration with IES, Wilmott Dixon,
AEC3 and Whole Life Ltd.
It multiplies quantity information from the BIM (Building Information Modelling) by
environmental impact and cost data to produce an overall impact and cost evaluation for
the design.
The generated results allow users to analyse their design to optimise cost and
environmental impacts and compare whole-building results to a suitable benchmark to
assess performance.

CHAPTER 3: Available Cost and Carbon Quantification Approaches
41
SimaPro
SimaPro is a LCA tool aimed at quantifying and analysing environmental impacts of
processes and products.
SimaPro allows users to build complex models using different features introduced in the
tool such as Parameters (to change values and assumptions in the model) and Monte
Carlo analysis. The Ecoinvent database (the Swiss life cycle data inventory) is fully
incorporated into SimaPro. It is used for a variety of applications, such as:
• Carbon footprint calculation
• Product design and eco-design
• Environmental Product Declarations (EPD)
• Environmental impact of products or services
• Environmental reporting (GRI)
• Determining of key performance indicator
GaBi
GaBi is a Life Cycle Assessment engine aimed at product sustainability solutions.
GaBi quantifies environmental impacts of every element of a product or system to
facilitate the best informed decision making on grounds of manufacturing and life cycle
evaluations.
It provides an easily accessible cost and environmental database. GaBi also presents
alternative low impact options for manufacturing, distribution, recyclability, pollution
and sustainability.
GaBi supports the following business applications:
• Developing products that meet environmental regulations with smaller
environmental footprints such as fewer GHG emissions, reduced water
consumption and waste.

CHAPTER 3: Available Cost and Carbon Quantification Approaches
42
• Eco-efficiency: reducing material, energy and resource use in the most cost-
effective way.
• Efficient value chains: enhancing efficiency of value chains e.g. R&D, design,
production, suppliers, distribution.
• Sustainable Product Marketing: product sustainability labels & claims,
Environmental Product Declarations (EPDs).
• Sustainability Reporting: environmental communication & product
sustainability reporting.
• LCA knowledge sharing: reporting and analysis for internal departments,
management and supply chain.
Inventory of Carbon and Energy (ICE)
ICE is the University of Bath's embodied energy & embodied carbon database. It was
designed to create an inventory of embodied energy and carbon coefficients for building
materials. The data has been collected from secondary resources in the public domain,
including journal articles, Life Cycle Assessments (LCA’s), books, conference papers
etc. to create a comprehensive embodied carbon database.
ICE provides a transparent data collection methodology and can be easily incorporated
into complex weight-based carbon analyses.
WRAP database
WRAP and the UK Green Building Council have designed a database to capture
embodied carbon data for whole buildings. Their aim was to create an open, web-based
resource facilitating consistency of available data. The database focusses mainly on
building applications.
Available approaches for calculating operational (in-use phase) carbon
Building simulation concept can be traced back to the 1960s when the US government
evaluated the thermal environment in fallout shelters (Attia et al, 2012). Since then, the
principles used for building simulation have evolved considerably, and due to the

CHAPTER 3: Available Cost and Carbon Quantification Approaches
43
increasing significance of the decisions made early in the design process, dynamic
simulation tools have been developed (Hensen, 2004). In the late 90s, the building
simulation Virtual Environment (VE) tools were introduced to address measures such as
thermal comfort and energy demand of buildings.
Whole building dynamic energy simulation packages focus on essential building
performance parameters such as energy demand, temperature, humidity and cost
(Crawley et al, 2008). Dynamic simulation methods are based on hourly (or even
shorter) external data in order to solve the conduction, radiation and convective
processes in relation to heat transfer and storage in a designed space. The fluctuations of
internal and external variables are represented in the simulation methods, based on their
accurate rates of alteration (Doyle, 2008). These can be used to compare different
building specifications, service systems and control regimes.
There are several internationally accepted software packages available that calculate the
operational energy/carbon requirements, environmental performance and thermal
comfort of buildings. Leading software includes packages such as IES-VE, Tas,
DesignBuilder, TRNSYS, EnergyPlus, DOE-2, eQUEST and Ecotect (based on full
thermal dynamic simulation approaches), and simpler packages including SAP and
SBEM (based on simplified, and therefore potentially less accurate approaches). There
are also simple Excel-based calculating tools such as RETscreen for simulating the
performance of specific renewable technologies such as Transpired Solar Collectors
(TSCs).
The strengths, weaknesses and a comprehensive comparison of these software packages
have been investigated in a joint report by US Department of Energy, University of
Strathclyde, University of Wisconsin-Madison and the US National Renewable Energy
Laboratory (Crawley et al, 2008). Also another comprehensive comparison has been
provided by Stanford University considering the building energy performance
simulation tools (Maile, Fischer and Bazjanac, 2007).

CHAPTER 3: Available Cost and Carbon Quantification Approaches
44
The referenced reports conclude that all of the investigated packages are capable of
simulating the likely detailed analytical requirements in compliance with CIBSE6 and
NCM7 guidance regardless of their advantages and disadvantages. The required criteria
include the general modelling features such as;
Zone loads, building envelope and daylighting, infiltration, ventilation and multi-zone
airflow, renewable energy systems, environmental emissions, climate data availability,
results reporting, and Validation and User interface.
RETScreen
There are also simple Excel-based tools such as RETScreen that are available for
modelling various renewable technologies including Transpired Solar Collectors.
RETScreen is an Excel-based renewable technology analysis tool enabling the users to
conduct energy analysis, emission analysis, financial analysis, and sensitivity/risk
analysis (www.retscreen.net, 2014). This is facilitated by incorporating a number of
databases into the tool, including a comprehensive database of weather data obtained
from 6,700 ground-based stations and NASA's satellite data and hydrology database.
3.2.2 Life Cycle Costing
Cost effectiveness models need to be undertaken in order to assess the financial
competiveness of new and existing products. Comparative cost assessments that take
account of all relevant economic factors (e.g. initial costs and future operational costs)
are a useful method of ascertaining whether a solution is financially efficient (Gluch and
Baumann, 2004).
LCC is a financial analysis technique that considers total aggregated costs (including
the initial and on-going costs) associated with an activity during the estimated service
time of it (Manuilova et al., 2005). In case of a building, LCC analysis can be used to
6 The Chartered Institution of Building Service Engineers 7 National Calculation Method

CHAPTER 3: Available Cost and Carbon Quantification Approaches
45
take full account of the initial cost of energy efficiency improvements and the on-going
operational carbon savings associated with those improvements. When properly applied,
LCC can be used to evaluate different investment scenarios.
LCC is especially useful in analysing a project when various scenarios that potentially
meet the same performance requirements but differ in terms of initial and on-going
costs have to be compared. This can be used to calculate the most cost effective
scenario. For example, it will help determine whether the incorporation of a highly
insulated building fabric or double glazing system, which may increase initial cost but
result in potential reduced operational costs, is cost-effective or not.
Lowest life cycle cost is the simplest interpretable measure of financial evaluation when
energy efficiency scenarios are being investigated. The literature provides an extensive
variation of economic assessment methods for LCC analysis created for different
purposes (Schade, 2010). All have advantages and disadvantages but are consistent with
the lowest LCC measures if identical parameters are applied (NIBC, 2013).
There are five main economic evaluation methods for undertaking LCC analyses based
on research carried out by Gorgolewski (1995). Methods include: Net Benefit (NB) or
Net Savings (NS), Net Present Value (NPV), Internal Rate of Return (IRR), Saving-to-
Investment Ratio (SIR) and Annual Equivalent Value (AEV).
3.2.2.1 Net benefit/Net saving
The Net Benefit (NB) approach calculates the difference between the present value of
all on-going savings and costs incurred during a project. It identifies whether a project is
cost effective or not i.e., the capital cost of the project will be recovered by on-going
savings associated with the investment. This is particularly informing when sizing a
project.

CHAPTER 3: Available Cost and Carbon Quantification Approaches
46
3.2.2.2 Internal Rate of Return
Internal Rate of Return (IRR) is the rate of growth a project is expected to achieve. The
results in this method are presented as a percentage rate of return that is expected from
an investment. The actual rate of return that is achieved often differ from its estimated
IRR rate, but a project with a substantially higher IRR value would be the best available
option. IRR is a more objective metric than NPV, as NPV depends on an arbitrarily
chosen discount rate, while IRR is determined entirely by the cash flow figures and their
timing. IRR is often used for evaluating investments and business case scenarios.
3.2.3 Saving-to-Investment Ratio
Saving to Investment Ratio (SIR) is recommended for establishing priorities among
projects for producing the largest savings for a given budget considering the ratio of
savings to investment cost. The Saving-to-Investment Ratio that provides cost
effectiveness targets of greater than 1 shows that the project is profitable; the larger the
SIR the greater its profitability.
3.2.3.1 Annual Equivalent Value
Annual Equivalent Value (AEV) is the cost per year of operating a project over its
entire lifespan. It is calculated by dividing the Net Present Value of a project by the
present value of annuity factor (cumulative discount factor when the capital cost is the
same for each year through the project). This works well for assessing alternative
projects with different expected service lives (where only the costs are relevant).
3.2.3.2 Net Present Value
Net Present Value (NPV) is a means of expressing the present value (PV) of initial and
future cash flows. Future cash flows are discounted to better reflect their value at the
point that the investment is made. When all future cash flows are incoming and the only

CHAPTER 3: Available Cost and Carbon Quantification Approaches
47
outflow of cash is the initial cost of investment, the NPV is simply the present value of
future cash flows (energy savings) minus the initial cost of insulation improvement.
3.3 Chapter summary Several approaches for cost and carbon quantifications have been explored in this
Chapter. Each of these approaches can be used for conducting research in support of
building applications. Informed by the investigated approaches and the detailed
requirements of the research, the most suitable approaches for undertaking the required
analyses will be selected and explained within the context of the developing
methodology in the next Chapter.

4
48
4 CHAPTER 4: Development and Application of Methodology
This chapter describes the assessment methodology used in the course of this research.
It describes the buildings analysed in accordance with this methodology and the
assumptions used to assess a series of case studies of low and zero carbon building
technologies.
3.4 Main principles of the developing methodology
In Chapter 2, the significance of adopting an effective ‘total carbon’ approach in any
holistic carbon reduction analysis (where all of the components of carbon footprints are
appropriately represented) was addressed. In the following chapter, the proposed
assessment methodology has been developed in relation to the aim and objectives of this
project. Main principles of the developing methodology (summarising Chapter 2,
Sections 4 and 5) is presented in Table 4.1.
• Relevant carbon efficiency of products and materials on grounds of combined
operational and embodied carbon.
Whilst current methods fail to address how the inclusion of embodied carbon
may affect the decision making process, the proposed ‘total carbon’ analysis
(associated with incremental increase in the thickness of insulation and also
application of low and zero carbon technologies) identifies materials’ ‘death
points’ beyond which embodied CO2 measures outweigh the operational CO2
savings.
The total carbon approach considers both embodied and operational carbon
emissions associated with applied thermal improvement measures.
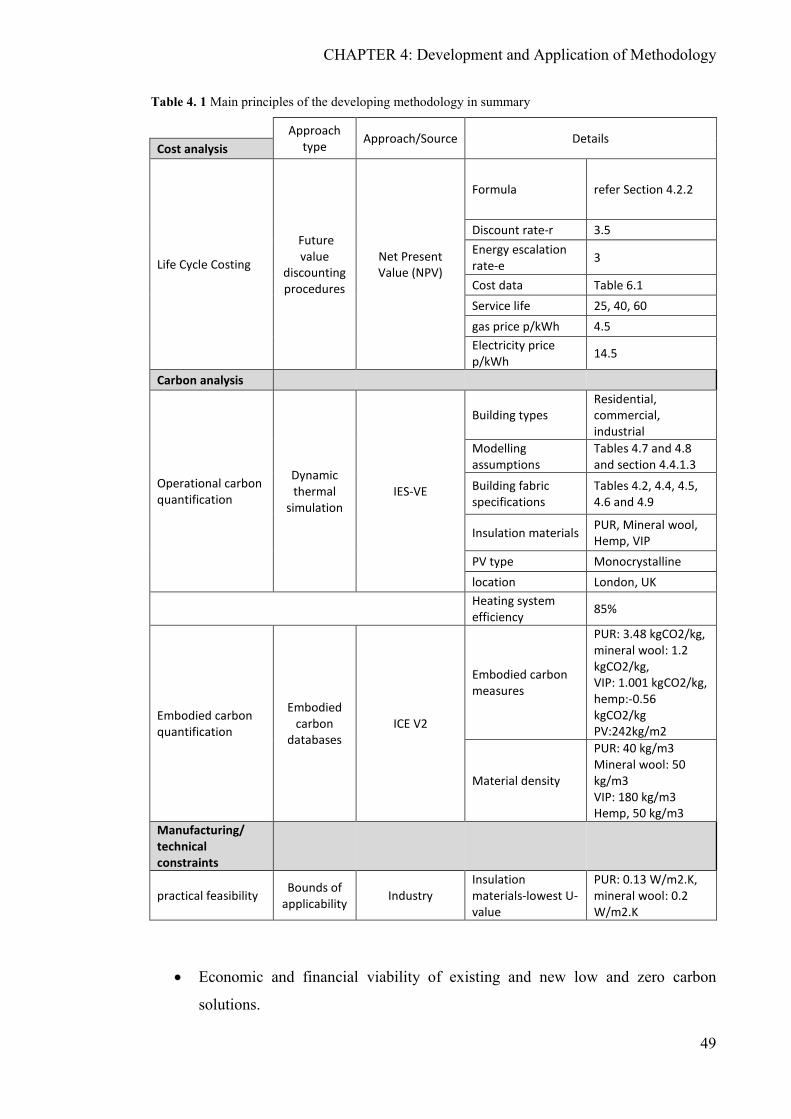
CHAPTER 4: Development and Application of Methodology
49
Table 4. 1 Main principles of the developing methodology in summary
Approach type Approach/Source Details
Cost analysis
Life Cycle Costing
Future value
discounting procedures
Net Present Value (NPV)
Formula refer Section 4.2.2
Discount rate-r 3.5 Energy escalation rate-e 3
Cost data Table 6.1 Service life 25, 40, 60 gas price p/kWh 4.5 Electricity price p/kWh 14.5
Carbon analysis
Operational carbon quantification
Dynamic thermal
simulation IES-VE
Building types Residential, commercial, industrial
Modelling assumptions
Tables 4.7 and 4.8 and section 4.4.1.3
Building fabric specifications
Tables 4.2, 4.4, 4.5, 4.6 and 4.9
Insulation materials PUR, Mineral wool, Hemp, VIP
PV type Monocrystalline location London, UK
Heating system efficiency 85%
Embodied carbon quantification
Embodied carbon
databases ICE V2
Embodied carbon measures
PUR: 3.48 kgCO2/kg, mineral wool: 1.2 kgCO2/kg, VIP: 1.001 kgCO2/kg, hemp:-0.56 kgCO2/kg PV:242kg/m2
Material density
PUR: 40 kg/m3 Mineral wool: 50 kg/m3 VIP: 180 kg/m3 Hemp, 50 kg/m3
Manufacturing/ technical constraints
practical feasibility Bounds of applicability Industry
Insulation materials-lowest U-value
PUR: 0.13 W/m2.K, mineral wool: 0.2 W/m2.K
• Economic and financial viability of existing and new low and zero carbon
solutions.

CHAPTER 4: Development and Application of Methodology
50
Carbon efficiency graphs in combination with cost effectiveness results can
provide optimum ranges in which applied products can save CO2 in the most
cost effective way.
• Relevant technical difficulties.
The bounds of applicability (which has been described in Chapter2 section 4) of
materials and products need to be recognised and informed by practical limits to
analyses. The methodology recognises bounds of applicability (the nature of
which will be different for every technology) and within these limits establishes
the ‘optimum net benefit’ ranges of each solution, in terms of both carbon and
cost effectiveness.
3.5 The developed methodology
The developed methodology is simply applicable to a wide range of building types and
applications that benefit from carbon or cost savings in different time periods
comparable by either expressing their values in present terms (financially) or a carbon
payback period (environmentally) i.e., thermal energy improvements such as windows
upgrade or energy efficient lighting can be simply analysed using the developed
methodology.
The methodology can be defined using three main stages: The total carbon stage (which
is following a combined operational and embodied carbon approach), the financial
assessment stage (which is adopting future discounting approaches) and the current
technical restrictions stage.
Figure 4.1 clearly demonstrates how these three stages interact to inform the analysis. In
this example, adding to the thickness of insulation beyond 100mm results in financial
disbenefit (NPV purple line) whilst this improvement is beneficial in terms of CO2
savings. The analysis then explores whether the additional 15% CO2 savings associated
with adding to the thickness of insulation (from 100 to 160mm insulation) can be

CHAPTER 4: Development and Application of Methodology
51
achieved by taking a more cost effective approach (this is explained in more detail in
Chapter 7).
Figure 4. 1 Interaction between stages introduced in the methodology
The software packages and approaches adopted within the assessment methodology are
as follows:
3.5.1 Carbon efficiency
An effective and accurate means of quantifying both the operational and embodied
components has been developed based on the reliable information from the literature
review. The existing best practice where this is available is presented under the
following categories.
3.5.1.1 System boundaries
A cradle-to-gate approach has been selected. The benefit of this is that stages included
in this approach are defined and do not change, whereas project specific stages (such as
transportation and construction) once a product leaves the factory gate will differ
considerably.
Furthermore, many manufacturers provide cradle-to-gate LCA information thus this
approach is implementable with a relatively high level of data certainty. Databases such
-160000
-140000
-120000
-100000
-80000
-60000
-40000
-20000
0
20000
0
2
4
6
8
10
12
14
16
18
20 40 60 80 100 120 140 160 180 200 220 240 260 280 300 320 340 360 380 400
NPV
(£)
Carb
on k
gCO
2/m
2.yr
Insulation thickness (mm)
Nat. Gas CO2 Insulation ECO2 Total CO2 NPV

CHAPTER 4: Development and Application of Methodology
52
as Bath University’s Inventory of Carbon and Energy (ICE) also presents the embodied
energy/CO2 data based on a ‘cradle to gate’ approach.
If end of life stages were included in analysis, numerous unresolved issues arise which
in themselves are specialist research areas.
As has been discussed in Chapter 3, this is however acknowledged that a combined
approach can use a cradle-to-gate measure for embodied carbon and model how a
material or component has been processed during and after its life separately and then
combining them to give a cradle-to-grave insight for further investigations. This might
be necessary for insulation materials such as hemp that end of life stages effect the
overall carbon burdens significantly.
3.5.1.2 Embodied carbon quantification
Taking into account the complex nature of the analyses and the complexity of using
related software packages to calculate the embodied CO2 of materials, the University of
Bath’s inventory of carbon and energy database has been adopted into the methodology.
Process energy calculation techniques (where reliable data is not available) and LCA
EPDs (Environmental Product Declaration) also have been used as complementary
sources.
Calculating the embodied carbon of products for which reliable data is not available,
requires compiling complete inventories of greenhouse gas (GHG) emissions arising
from all the industrial processes that are directly and indirectly required for their
production, delivery, installation, and end-of-life treatment (thus notably including the
indirect emissions associated to thermal and electrical energy production and use). Non-
CO2 GHG emissions are then to be converted into CO2-equivalents by means of
appropriate equivalency factors provided by the Intergovernmental Panel on Climate
Change (IPCC). Whilst some of the necessary emission data may be directly available, a
very significant proportion of that will need to be estimated by combining first principle
calculations based on ‘process energy calculation techniques’ and other criteria
including typical fuel splits and local emission factors, with database information on
CHAPTER 4: Development and Application of Methodology
53
representative background processes (e.g. nation-specific electricity generation
mixtures, etc.).
As an example, this technique has been employed to determine the minimum combined
operational and embodied carbon for VIPs (novel insulation systems), for which no data
is available from standard sources due to the uncommon nature of materials (e.g., fumed
silica and the uniqueness of the manufacturing process; refer to Appendix A).
The embodied CO2 calculations for PVs are extracted from ICE database which
complies with ISO 14040 and ISO 14044 standards. The embodied carbon data used for
PUR, mineral wool and PV are collected from the same source (ICE database) to
provide consistency in the calculations. In case of VIP also, apart from the energy
consumption during relevant manufacturing stages, the embodied carbon of the
materials are extracted from ICE database in compliance with ISO standards.
Different embodied carbon figures for the investigated materials could move the
minimum carbon point on the graphs toward thicker or thinner panel (depending on the
embodied carbon value) but do not compromise the existence of a minimum carbon
point (death point) on the graph.
3.5.1.3 Operational carbon quantification
The most suitable packages for software analysis based on appraisal of likely detailed
analytical requirements, complexity of the tool and software usage methods (compliant
with CIBSE guidance) have been selected. Taking into account the low level of
accuracy in SBEM and SAP, dynamic thermal simulation packages were employed. All
of the investigated packages are capable of generating reliable demanded data despite
the mentioned limitations. IES-VE however, as one of the most reliable existing
packages and also Tas were the financially available packages during conducting the
research and have been used for dynamic thermal analysis to calculate the operational
CO2 in investigated buildings. RETScreen (crosschecked with SWIFT and CRAFT)
also has been used for simulations related to Transpired Solar Collectors.

CHAPTER 4: Development and Application of Methodology
54
3.5.2 Cost effectiveness
Amongst various cost analysis methods, an appropriate Net Present Value component as
the most commonly used method in building related projects (Schade, 2007)(Rum and
Akasah, 2011)(UNEP, 2003)(Target zero, 2011) has been incorporated into the
developed methodology. The detail of which has been informed by review of best
practice and use of the technique in relation to parallel modelling problems.
When the only outflow is the initial/capital cost of the project and all ongoing cash
flows are incoming (savings) the NPV (Net Present Value) is simply the present value
of all on-going savings minus the capital cost.
A recommended discount rate is given by the HM Treasury Green Book each year.
Energy prices are more volatile than general inflation and tend to escalate at a higher
rate (escalation rate). This will need to be acknowledged in any cost methodology in
addition to any discounting procedures. For building services applications the CIBSE
guide recommends energy price escalation rates.
The currently recommended discount rate given by the HM Treasury Green Book 2013
is 3.5%. The CIBSE guide also recommended an energy price escalation figure of 3%
(over-and-above general inflation).
A suitable formula (Gorgolewski, 1995) to determine PV (that accounts for energy cost
escalation and discount rates) is:
PV (A) = A × [(1 + e) ÷ (r ˗ e)] × [1 ˗ {(1 + e) ÷ (1 + r)}n]
Where PV(A) is the present value of an annually occurring energy savings of A,
appearing for n number of years, with a general discount rate of r, and a constant annual
rate of change in the cost of energy compared to general inflation, of e.
Complicated spreadsheets have been designed based on initial and life cycle cost of
applying low and zero carbon products. Extracted values from spreadsheets are used to
generate graphs to demonstrate the optimum financial benefit of applying each

CHAPTER 4: Development and Application of Methodology
55
technology to buildings (a range of results in relation to various design criteria, building
type and service life scenarios is expected).
The cost analysis of low and zero carbon implementation has been carried out at the
individual building level, but the energy saving measures for which engagements with
regional scale is inevitable, such as exporting electricity from Photovoltaic cells to the
grid, have been taken into account in the cost and carbon analyses. According to the
2010 Building Regulations, to deliver the targeted improvement in new build, individual
buildings will be required to contribute to different levels of carbon efficiency based
upon cost-effectiveness. Analyses at single buildings scale can examine the initial cost
of low and zero carbon improvements, the cost of building energy price in operational
stage, or include the energy embodied in materials used to construct the building
(extraction and production stages), its services (maintenance stage) and any recycling
options (end of life stage). These analyses can be based on new build or retrofitting
existing buildings.
3.6 Application of methodology
The developed methodology has been applied to a series of case studies of low and zero
carbon building technologies such as insulation materials (including Mineral wool,
PUR, VIP and Hemp), Heat generating technologies (Transpired Solar Collectors) and
Electricity generating technologies (Photovoltaic cells) to identify the levels where these
technologies present financial and carbon advantage in a global system. The analysis is
carried out for three building types of residential (a typical semi-detached house),
industrial (standard single storey portal frame warehouse) and commercial (typical open
plan four storey office).
Selected case studies are aimed at achieving zero carbon performance on grounds of
combined operational and embodied carbon emissions. Achieving the zero carbon
building was categorised into three parts of fabric energy efficiency (insulation
materials), renewable technologies (on-site low carbon heat (TSC) and power (PV)) on
single building scale and renewable technologies on regional scale (i.e. exporting
energy from PVs to grid).

CHAPTER 4: Development and Application of Methodology
56
The results are extracted from more than 6000 computer simulations and analysed
against a range of design scenarios (variables such as airtightness, rooflight area, liners
reflectivity etc) and service life options.
Note that as thermal performance of building fabric improves the proportion of heat loss
through windows increases. The U-value of windows therefore has been assumed as 1
W/m2.K for all cases.
3.7 General building description and performance specification
Principles of thermal dynamic simulation modelling are now embodied into regulation,
whereby the energy needs and comfort standards of buildings, subject to local climates
and set operating regimes, can be predicted. A performance specification for software
analysis needs to be developed during the research based on appraisal of likely detailed
requirements and appropriate software, and software usage methods (compliant with
CIBSE8 and NCM9 guidance).
3.7.1 Domestic buildings
According to the UK Office for National statistics, 26% of the existing UK houses are
semi-detached. Hence, a typical three bedroom semi-detached house built to the latest
UK Part L Building Regulations with a total floor area of approximately 80m2 has been
used for the analyses.
8 The Chartered Institution of Building Service Engineers 9 National Calculation Method
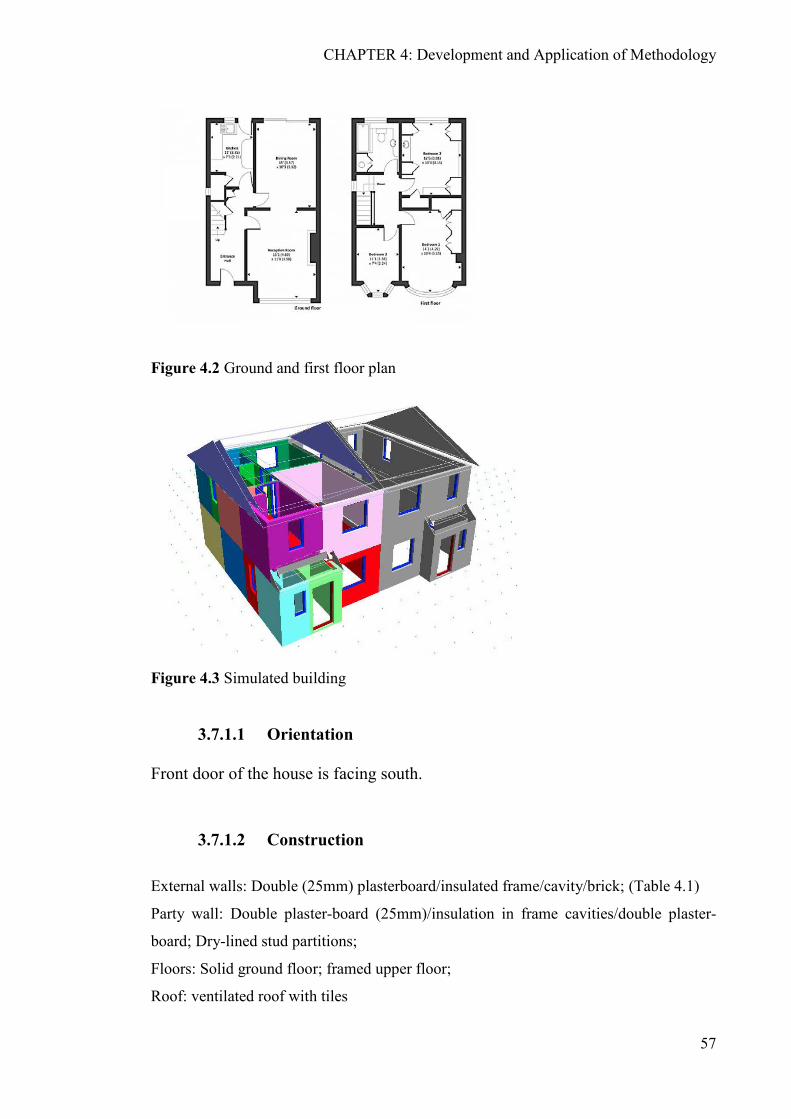
CHAPTER 4: Development and Application of Methodology
57
Figure 4.2 Ground and first floor plan
Figure 4.3 Simulated building
3.7.1.1 Orientation Front door of the house is facing south.
3.7.1.2 Construction
External walls: Double (25mm) plasterboard/insulated frame/cavity/brick; (Table 4.1)
Party wall: Double plaster-board (25mm)/insulation in frame cavities/double plaster-
board; Dry-lined stud partitions;
Floors: Solid ground floor; framed upper floor;
Roof: ventilated roof with tiles

CHAPTER 4: Development and Application of Methodology
58
Table 4.2 External wall material layout (inside to outside)
mm
Thermal
conductivity
(W/mK)
Density
(kg/m3)
Specific heat
capacity
(J/kgK)
Plasterboard 2x12.5 0.21 960 837
Block 100 1.2 2000 960
PUR insulation 100 0.025 30 1260
Air cavity 50 - - -
Brick 102 0.77 2050 920
Table 4.3 Building specifications
Windows: Double glazed low e with timber frames (U = 1W/m2K), approximately
25% opening area.
All U-values are based on 2010 Building Regulations Part L1a (Table 4.4).
Table 4. 4 Building element U-Values
3.7.1.3 Modelling assumptions
Airtightness A value for air infiltration of 0.25 air changes per hour was used, conforming in this
case to an air permeability of 5m3/h/m2.
Semi-detached house
Ceiling area (m²) 40
Rooflight area (m²) 0
Ext. Wall area (m²) 262.8
Total floor area (m²) 80
Building height (m) 8
Building volume (m³) 668.5

CHAPTER 4: Development and Application of Methodology
59
Internal gains The house is occupied by two adults and two children (out during weekdays) who are
assumed to use lighting and appliances in the living room and kitchen during scheduled
occupancy
Heating Gas condensing boiler with radiator system (22°C for living areas, 18°C for bedrooms),
scheduled (off at nights).
Occupation Living room: 1700-2300h weekdays, 0700-2300h weekends
Bedrooms: 2300-0700h weekdays and weekends
Location London ASHRAE weather database is used for thermal simulations
Ventilation Weekdays: Living room windows start to open after 1700h when temperature exceeds
24°C, and are fully open (30% open area) when temp reaches 26°C. Closed at 2300h.
Bedroom windows start to open after 1700 when temp exceeds 18°C and are fully open
(30% open area) when temp reaches 20°C, remaining open all night until 0700h
Weekends: Living room windows open 0700-2300h (temp control as above) Bedroom
windows open 24 hours (temp control as above).
3.7.2 Non-domestic buildings Industrial and office buildings have been analysed as non-domestic buildings. Standard
single span portal frame warehouses of 1000 (25*40) and 3000 (40*75) square metre
and a similar 3000m2 retail outlet have been modelled as industrial buildings. A typical
2400 m2 four story office building (13.5*48) has been modelled. Mineral wool, PUR,
hemp and VIP as insulation materials have been used for the analysis. The office is

CHAPTER 4: Development and Application of Methodology
60
assumed to be an open-plan office as presented in Figures 4.3 and 4.4.
Figure 4. 4 Office plan
Figure 4. 5 Office building
The industrial warehouses are also as demonstrated in Figure 4.6.
Figure 4. 6 Industrial warehouse

CHAPTER 4: Development and Application of Methodology
61
3.7.2.1 Construction and modelling assumptions for industrial buildings
Built up cladding systems with mineral wool and composite PUR cladding systems as
conventional insulation materials have been used for industrial buildings. The analyses
assume the general systems parameters described in Tables 4.4 & 4.5.
Built-up cladding systems for mineral wool and composite cladding systems for PUR
insulation have been used. Built-up cladding systems comprise inner and outer profiled
metal cladding sheets (steel or aluminium), separated by spacer systems, with insulation
(normally mineral wool laid between them). Composite cladding systems also comprise
two metal sheets but are bonded together with a foam material such that all parts of the
panel are attached.
Figure 4.7 Built-up cladding system Figure 4.8 PUR composite cladding
(source: Tata Steel)
Buildings are assumed to be heated to 18°C during daytime occupation. 10-12% of the
roof area is allocated to rooflights. Generated heat from lights, appliances and occupants
(internal gains) has been taken into account when determining heating demands. The
Building Regulations Part L 2010 backstop U-value was assumed as the base-case for
calculations (Table 4.5).
Table 4.5 Building specifications
1000 m² warehouse 3000 m² warehouse & retail shed
Roof area (m²) 1003.76 3010.5
Rooflight area (m²) 110 360
Ext. wall area (m²) 1327.34 2369.991
Floor area (m²) 1000 3000
Building height (m) 6 10.5
Building volume (m³) 6000 32624

CHAPTER 4: Development and Application of Methodology
62
Table 4.6 Base case U-values and thicknesses
Mineral wool PUR
Wall Thickness : 100 mm Thickness : 70 mm
U-Value : 0.35 W/m²K
Roof Thickness : 140 mm Thickness : 100 mm
U-Value : 0.25 W/m²K
Floor U-Value fixed for all cases at 0.25 W/m²K
Rooflight U-Value fixed for all cases at 1W/m².K assumes triple glazed rooflight
Table 4.7 Operational parameters for simulation modelling
3000 m² Warehouse 1000 m² Warehouse 3000 m2 Retail shed
Heating Natural gas - Industrial heating system - heated to
18 °C from 8am-6pm
Natural gas - Industrial
heating system - heated to
18 °C from 9am-9pm
Internal gain
LED lighting up to
12000W - people with 20
m²/person density
LED lighting up to
4000W -people with
20 m²/person density
LED lighting up to
12000W and displayed
lighting up to 5W/m²
-people with 5 m²/person
density
Occupation 8am-6pm with 20 m²/person 9am-9pm with 5 m²/person
Ventilation
mechanical ventilation
with maximum flow of
3ach over 25°C
mechanical
ventilation with
maximum flow of 1.5
ach over 25°C
mechanical ventilation
with maximum flow of
3ach over 25°C
Lighting controlled by sensors set at 300 lux
controlled by sensors set at
300 lux and displayed
lighting up to 5w/m²
Airtightness
air infiltration value of
0.19 ach is used with 7.5
m³/h/m² air permeability
rate
air infiltration value
of 0.16 ach is used
with 7.5 m³/h/m² air
permeability rate
air infiltration value of
0.19 ach is used with 7.5
m³/h/m² air permeability
rate

CHAPTER 4: Development and Application of Methodology
63
3.7.2.2 Construction and modelling assumptions for offices
Stick system curtain wall has been assumed to be the construction for the office
buildings. NCM guidance has been used for simulation assumptions (Table 4.8).
Table 4. 8 Modelling assumption
The overall thickness of wall technology has been used for the base case construction
(Table 4.9):
Table 4.9 Typical external wall thickness
Aluminium sheet
Insulation (PUR)
Aluminium sheet
Cavity
Aluminium Sheet (Black painted)
1mm
55mm
0.5mm
50 mm
2.5mm
Total 109mm
U-value 0.35 W/m2K (2010 backstop U-value)
Table 4. 10 U-value specifications
Wall U-Value : 0.26 W/m²K
Roof U-Value : 0.2 W/m²K
Floor U-Value fixed for all cases at 0.22 W/m²K
Rooflight U-Value fixed for all cases at 1 W/m².K assumes triple glazed rooflight

CHAPTER 4: Development and Application of Methodology
64
3.8 Design service life The durability of building materials and products is a key component in the building
design and lifetime performance taking effect from the selection and installation of
materials and construction systems.
There are various environmental and chemical factors which can affect the durability of
a material or component during its service life (such as being periodically exposed to
moisture, humidity, temperature, wind and rain, chemical pollutants, solar radiation and
site conditions). The durability of a material or component will be affected by some or a
combination of these factors (www.sbsa.gov.uk, 2007).
Design service life according to the Scottish Building Standard Agency (SBSA) is
defined as ‘The assessment of a structure, both as a complete building and individual
components, which predicts its potential lifetime based on levels of design,
workmanship, maintenance and the environment’ (2007, BRE design life of buildings:
p1). Requirements for durability vary depending on building type (Figure 4.7) and
component and concern the intended use, finance or periods for maintenance, repair and
replacement.
Figure 4.9 Categories of design life for buildings (BS 7543:2003)
CHAPTER 4: Development and Application of Methodology
65
Specific service lives can be determined for particular buildings, provided they do not
exceed the period proposed for the next building type on the table; for instance most of
the retail and warehouse buildings are expected to have a service life of 20-30 years.
An average of 25 year service life is often used for warehouse, industrial and retail
premises but would be unusually short for housing and commercial buildings.
Traditionally housing has been constructed to a notional 60 year service life, but in all
application true service life can depart significantly and unpredictably from design life
making calculations difficult. The notional 60 year service life (based around 2
mortgage periods and adopted by the council of mortgage lenders in the UK) is in many
respects an arbitrary target but one that is nonetheless commonly adopted within the
sector. Less clear still are the appropriate service life extensions that should be delivered
by retrofit measures, whether these should essentially ‘reset the clock’, or whether they
should extend service lives by a shorter period.
For the purposes of this research building envelope refurbishment assumes 25, 40 and
60 year service lives as different possible scenarios for industrial buildings and 30 and
60 year service lives for residential and office buildings. This is critical to ‘net benefit’
carbon calculations as the shorter the service life the greater is the impact of embodied
carbon (i.e. annualising embodied carbon = total carbon / n years where n is the design
life). Refurbishment applications where service lives are of the order of 25 years can
therefore be significantly more susceptible to the effects of embodied carbon than new
build applications where design lives are longer.
The maximum service life for VIPs is unknown at present but various studies are
considering different methods of estimating the service life of VIPs. One of the most
recent studies carried out by Yrieix et al (2014) suggests that four components should
be considered with regard to lifetime of VIPs. They have demonstrated that the
characteristics of the core material, the barrier envelope, service conditions and the
thickness of the panels are considerably important when estimating the life expectancy.
Consequently, any assessment method of lifetime which does not take into account
these four components is likely to be partially wrong and thus not as reliable as
expected. Therefore due to the uncertainties and complexities of estimating the service

CHAPTER 4: Development and Application of Methodology
66
life of VIPs, in this study, it is assumed that insulation materials are not going to be
replaced during the service life of the building.
Also in case of PV panels, UK Feed-in Tariffs for PV are calculated for an economic
lifetime of 25 years, indicating that the Department of Energy and Climate Change
believes that panels will produce for at least that long. However PVs are only used in
the analyses with 25yeas design life and therefore are not required to be replaced.
3.9 Conclusion The developing methodology has been discussed in detail and its main principles as
well as the interaction between stages have been set out using an example. The
developed methodology will be applied to a series of case studies of low and zero
carbon building technologies the detail of which is described in the next Chapter.

67
4 CHAPTER 5: Total Carbon Quantification of Insulation
Materials for New and Retrofitted Buildings
The following chapter investigates the effect of inclusion of embodied CO2 in carbon
analyses associated with a highly insulated building envelope, comparing mainstream
conventional insulation materials with novel insulation materials for new and thermally
retrofitted domestic and non-domestic buildings.
4.1 New build
4.1.1 Introduction
The UK Government is adopting regulations to reduce carbon emissions which will
inevitably make low and zero carbon buildings a requirement (refer to Chapter 2). The
imperative to reduce the carbon footprint of buildings will require higher levels of
‘fabric energy efficiency’ and ‘application of low and zero carbon technologies’ to
minimise operational energy demand as an integrated part of any low and zero carbon
performance.
The DCLG phase 3 final report (DCLG, 2011) in reference to ‘zero carbon non-
domestic buildings’ supports a ‘fabric first’ approach through 4 main principles:
1. Building envelope energy efficiency measures principally involve lower whole
life cycle costs than low and zero carbon (LZC) solutions due to maintenance
and replacement costs (it is argued that the capital cost of low and zero carbon
technologies are not fully reflected in the market price of buildings normally).
2. Building envelope energy efficiency measures are not as dependent as low and
zero carbon technologies on the behaviour of occupants in achieving the targeted
carbon thrifts. For example, occupants cannot change the settings of the
insulation in an exterior wall in order to maintain its effectiveness. The

CHAPTER 5: Total Carbon Quantification of Insulation Materials for New and Retrofitted Buildings
68
complexity of zero carbon technologies and need of maintenance can also
contribute to larger gaps between predicted and actual energy consumption (real
monitored data extracted from AIMC4 project (aimc4.com, 2014) is showing up
to 3 times higher ‘as built’ energy consumption in comparison to ‘as designed’
figures in some cases).
3. Buildings are generally used for long terms, (although non-domestic buildings
such as industrial buildings and supermarkets tend to be retrofitted or rebuilt
more frequently than houses) and the cost of retrofitting is higher than building
to higher standards at the time of build.
4. Reducing energy load demands by higher fabric standards at the time of build is
more cost effective than supplying high energy demand with on-site low and
zero carbon technologies.
The argument is that a minimum fabric energy efficiency standard works as a
foundation for higher levels of carbon emission reductions using renewable
technologies. A ‘fabric first’ approach should logically be the basis of any holistic
energy efficiency strategy.
A ‘zero carbon buildings policy’ was introduced to form a part of Government’s wider
strategy to achieving carbon reduction targets. It also supports the ‘fabric first’
approach. It comprises three main principles through which a building should have net
carbon emission:
a. The fabric performance must, at a minimum, comply with the defined standard
known as the Fabric Energy Efficiency Standard (FEES)
b. Any CO2 emissions that remain after consideration of heating, cooling, fixed
lighting and ventilation, must be less than or equal to the Carbon Compliance
limit established for zero carbon homes

CHAPTER 5: Total Carbon Quantification of Insulation Materials for New and Retrofitted Buildings
69
c. Any remaining CO2 emissions, from regulated energy sources (after
requirements a and b have been met), must be reduced to zero using on-site
and/or off-site solutions (known as allowable solutions).
The zero carbon policy initially required all new homes from 2016, and all new non-
domestic buildings from 2019, to be built to zero carbon standards (net carbon emission
associated with only regulated energy use). The latest revision stated that small sites
(developments with fewer than 50 homes), and also larger developers, are exempt from
having to meet the highest energy efficiency standards. Larger developers, are able to
offset carbon by paying into a Government fund for energy efficiency projects (The
Telegraph, 2014). The UK’s carbon reduction policy is in line with European policy
(specifically the Energy Performance of Buildings Directive) which requires all new
buildings to be nearly ‘zero energy’ buildings from 2020 (Zero Carbon Hub, 2014).
4.1.2 Insulation specifications for minimum carbon: mineral wool and PUR systems
Whilst cost criteria on life-cycle cost basis tend to dominate commercial specification
decisions, carbon reduction is a primary driver of building codes and regulations and
ultimately is probably the more important criterion. As already stated in Chapter 2,
current legislation is founded on control of operational energy but as this is reduced the
importance of embodied carbon becomes proportionately greater. The targets set by
future regulations should logically be formed with reference to combined operational
and embodied carbon analysis.
It is essential that the embodied carbon investments are entirely offset by operational
carbon savings (arising as a result of improved standards of thermal insulation). If
embodied carbon investments cannot be fully offset, moving to higher levels of thermal
insulation represents an overall carbon disbenefit rather than the carbon benefit which is
the over-riding aim of thermal standards. Given the relatively high embodied carbon
investment in conjunction with high thermal conductivity of many conventional
insulation materials, including mineral wool and PUR foam, overall carbon disbenefits

CHAPTER 5: Total Carbon Quantification of Insulation Materials for New and Retrofitted Buildings
70
can be achieved within the ranges of U-value that may increasingly be considered in
relation to low and zero carbon performance relative to different service lives.
The point of minimum combined operational and embodied carbon, which will vary for
individual buildings and building types, and will be influenced by factors including
building operation regimes, represents the optimum building envelope specification.
Critically it will also be influenced by insulation material types that offer high levels of
thermal resistance relative to the embodied carbon investment. These are able to deliver
better standards of energy thrift than materials that offer lower levels of thermal
resistance relative to embodied carbon investments.
Applications for highly energy efficient building envelopes potentially include:
• Industrial buildings (where in terms of cost and performance any novel
insulation systems must be competitive with conventional technologies),
• Residential and commercial buildings (where the combined performance and
slimness of external walls can affect the net to gross area and consequently
rental value of buildings).
4.1.2.1 Industrial buildings
A key and obvious market where highly insulated building envelope systems are
required is industrial warehouses and retail sheds. Currently this sector produces and
installs around 16 M m2 of cladding, of which 13 M m2 comprises insulated built-up or
composite systems. These products service the industrial and retail sectors whose
building related carbon emissions represent around 7.5% of total UK carbon emissions
(Carbon Trust, 2009) i.e., a large proportion of total national energy related carbon
emissions based almost entirely on standard product offerings, the engineering and
specification of which is essential to achieving nationally agreed carbon reduction
targets.

CHAPTER 5: Total Carbon Quantification of Insulation Materials for New and Retrofitted Buildings
71
Minimum aggregated carbon analyses for industrial buildings
The following graphs (Figures 5.1 to 5.6) illustrate the range of insulation thicknesses
and U-values around the point of minimum combined operational and embodied carbon
for the standard single span portal frame warehouses of 1000 and 3000m2 and similar
3000m2 retail shed, based on explained modelling assumptions in Chapter 4. Embodied
carbon measures for mineral wool and PUR insulation are extracted from the University
of Bath’s Inventory of Carbon and Energy (ICE) database. Only incremental increases
in insulations embodied carbon has been taken into account in the analyses. Thicker
insulation panels can require additional structural elements. This has been discounted in
the analyses as the effect on the overall embodied carbon is negligible.
As previously stated, the proportion of embodied to operational carbon can shift
considerably in buildings with lower operational carbon. As an example of this, Figures
5.1 and 5.2 demonstrate how lower operational carbon in 3000 m2 retail shed in
comparison to the same size warehouse, caused a life cycle carbon disbenefit beyond
260mm of mineral wool insulation panel (due to the high embodied carbon investment).
In Figure 5.3 in contrast, the smaller warehouse is showing no difference in the
optimum panel thickness comparing with the larger warehouse as the operational
scenarios and the proportion of lighting and heating demands are the same.
Figure 5.1 Carbon results of 3000m2 warehouse insulated with mineral wool for 25, 40
and 60 years design life
0
5
10
15
20
25
30
35
40
1.40
7
0.79
9
0.55
8
0.42
8
0.35
0.29
3
0.25
2
0.22
2
0.19
8
0.17
9
0.16
3
0.15
0.13
8
0.12
9
0.12
0.11
3
0.10
6
0.10
1
0.09
5
0.09
1
0.08
7
0.08
31
0.07
95
0.07
63
0.07
32
20 40 60 80 100 120 140 160 180 200 220 240 260 280 300 320 340 360 380 400 420 440 460 480 500
kgCO
2/m
2 .yr
25 years ECO2
25 years totalCO240 years ECO2
40 years totalCO260 years ECO2
60 years totalCO2Operational CO2
Insulation Thickness (mm)
U-Value
Minimum carbon
(25 years service life)
Minimum carbon
(40 years service life)
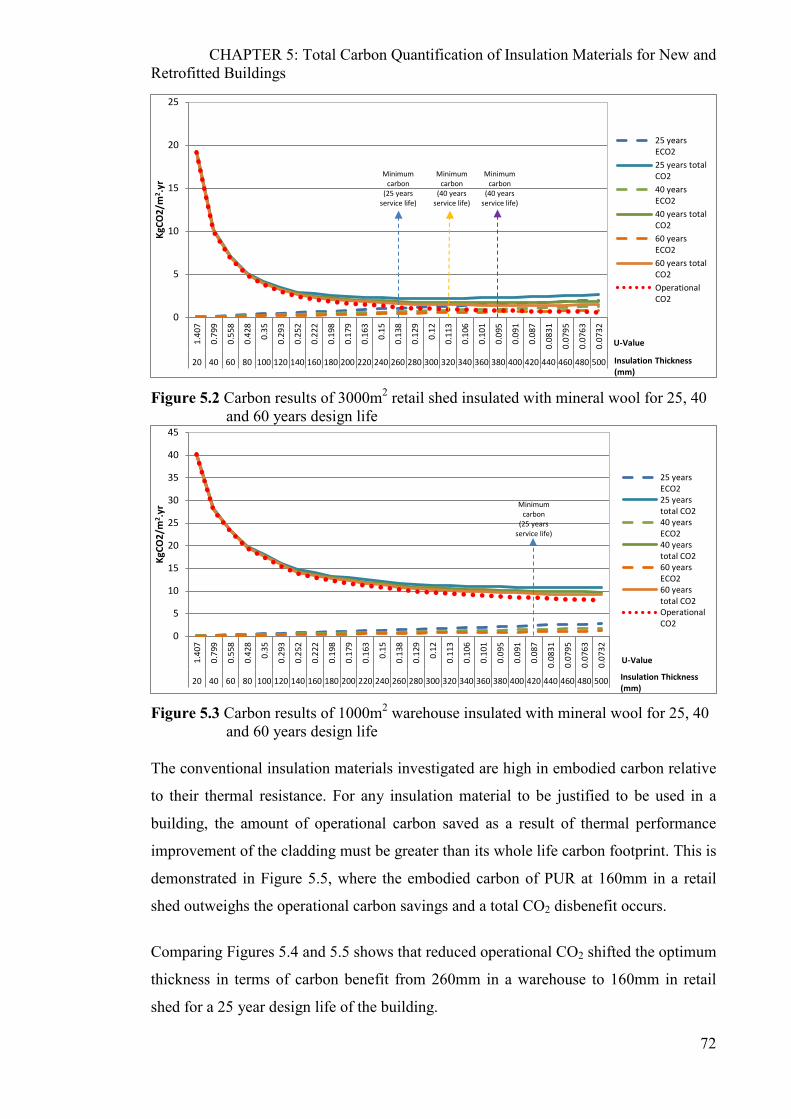
CHAPTER 5: Total Carbon Quantification of Insulation Materials for New and Retrofitted Buildings
72
Figure 5.2 Carbon results of 3000m2 retail shed insulated with mineral wool for 25, 40
and 60 years design life
Figure 5.3 Carbon results of 1000m2 warehouse insulated with mineral wool for 25, 40
and 60 years design life The conventional insulation materials investigated are high in embodied carbon relative
to their thermal resistance. For any insulation material to be justified to be used in a
building, the amount of operational carbon saved as a result of thermal performance
improvement of the cladding must be greater than its whole life carbon footprint. This is
demonstrated in Figure 5.5, where the embodied carbon of PUR at 160mm in a retail
shed outweighs the operational carbon savings and a total CO2 disbenefit occurs.
Comparing Figures 5.4 and 5.5 shows that reduced operational CO2 shifted the optimum
thickness in terms of carbon benefit from 260mm in a warehouse to 160mm in retail
shed for a 25 year design life of the building.
0
5
10
15
20
25
1.40
7
0.79
9
0.55
8
0.42
8
0.35
0.29
3
0.25
2
0.22
2
0.19
8
0.17
9
0.16
3
0.15
0.13
8
0.12
9
0.12
0.11
3
0.10
6
0.10
1
0.09
5
0.09
1
0.08
7
0.08
31
0.07
95
0.07
63
0.07
32
20 40 60 80 100 120 140 160 180 200 220 240 260 280 300 320 340 360 380 400 420 440 460 480 500
KgCO
2/m
2 .yr
25 yearsECO225 years totalCO240 yearsECO240 years totalCO260 yearsECO260 years totalCO2OperationalCO2
Insulation Thickness (mm)
U-Value
Minimum carbon
(25 years service life)
Minimum carbon
(40 years service life)
Minimum carbon
(40 years service life)
0
5
10
15
20
25
30
35
40
45
1.40
7
0.79
9
0.55
8
0.42
8
0.35
0.29
3
0.25
2
0.22
2
0.19
8
0.17
9
0.16
3
0.15
0.13
8
0.12
9
0.12
0.11
3
0.10
6
0.10
1
0.09
5
0.09
1
0.08
7
0.08
31
0.07
95
0.07
63
0.07
32
20 40 60 80 100 120 140 160 180 200 220 240 260 280 300 320 340 360 380 400 420 440 460 480 500
KgCO
2/m
2 .yr
25 yearsECO225 yearstotal CO240 yearsECO240 yearstotal CO260 yearsECO260 yearstotal CO2OperationalCO2
Insulation Thickness (mm)
U-Value
Minimum carbon
(25 years service life)

CHAPTER 5: Total Carbon Quantification of Insulation Materials for New and Retrofitted Buildings
73
Figure 5.4 Carbon results of 3000m2 warehouse insulated with PUR for 25, 40 and 60
years design life
Figure 5.5 Carbon results of 3000m2 retail shed insulated with PUR for 25, 40 and 60
years design life
Figure 5.6 Carbon results of 1000m2 warehouse insulated with PUR for 25, 40 and 60 years design life
0
5
10
15
20
25
30
35
1.06
4
0.57
5
0.39
4
0.29
9
0.24
2
0.20
2
0.17
4
0.15
3
0.13
6
0.12
3
0.11
2
0.10
3
0.09
5
0.08
8
0.08
2
0.07
7
0.07
3
0.06
9
0.06
5
0.06
2
20 40 60 80 100 120 140 160 180 200 220 240 260 280 300 320 340 360 380 400
KgCO
2/m
2.yr
25 yearsECO225 yearstotal CO240 yearsECO240 yearstotal CO260 yearsECO260 yearstotal CO2OperationalCO2
Insulation Thickness (mm)
U-Value
Minimum carbon
(25 years service life)
Minimum carbon
(40 years service life)
0
2
4
6
8
10
12
14
16
18
1.06
4
0.57
5
0.39
4
0.29
9
0.24
2
0.20
2
0.17
4
0.15
3
0.13
6
0.12
3
0.11
2
0.10
3
0.09
5
0.08
8
0.08
2
0.07
7
0.07
3
0.06
9
0.06
5
0.06
2
20 40 60 80 100 120 140 160 180 200 220 240 260 280 300 320 340 360 380 400
KgCO
2/m
2.yr
25 years ECO2
25 years totalCO240 years ECO2
40 years totalCO260 years ECO2
60 years totalCO2OperationalCO2
Insulation Thickness (mm)
U-Value
Minimum carbon
(40 years service life)
Minimum carbon
(25 years service life)
Minimum carbon
(60 years service life)
0
5
10
15
20
25
30
35
1.06
4
0.57
5
0.39
4
0.29
9
0.24
2
0.20
2
0.17
4
0.15
3
0.13
6
0.12
3
0.11
2
0.10
3
0.09
5
0.08
8
0.08
2
0.07
7
0.07
3
0.06
9
0.06
5
0.06
2
20 40 60 80 100 120 140 160 180 200 220 240 260 280 300 320 340 360 380 400
KgCO
2/m
2.yr
25 yearsECO225 yearstotal CO240 yearsECO240 yearstotal CO260 yearsECO260 yearstotal CO2OperationalCO2
Insulation Thickness (mm)
U-Value
Minimum carbon
(40 years service life)
Minimum carbon
(25 years service life)

CHAPTER 5: Total Carbon Quantification of Insulation Materials for New and Retrofitted Buildings
74
For PUR insulation as well, as presented in Figure 5.6, the smaller warehouse is
performing similarly to the larger warehouse in terms of the optimum insulation
thickness associated with the minimum carbon. Interpretation of Table 5.1 presents a number of key issues associated with conventional
insulation technology:
1. A lower ratio of operational to embodied CO2 restricts the maximum carbon
benefit to thinner panels. Therefore, to reach the optimum carbon benefit,
insulation materials with higher thermal resistance and lower associated
embodied CO2 are required to keep the operational to embodied CO2 ratio high.
As a result of that, the life cycle carbon disbenefit associated with combined
operational and embodied CO2 shifts towards thicker panels. Design life is also
critical to optimum carbon benefit results as the shorter the design life the
greater is the impact of embodied carbon (annualising embodied carbon being
total embodied carbon divided by number of years life span).
2. Factoring embodied carbon into an aggregated analysis serves to limit the
minimum CO2 levels that can be justified. Higher embodied carbon insulation
materials become more difficult to justify than lower embodied carbon materials
as they more rapidly lead to a CO2 disbenefit. Lower embodied carbon
insulation materials allow for lower U-values (up to the point where the practical
engineering difficulties prohibit effective adoption) whilst still presenting a CO2
benefit, so more onerous insulation standards, giving improved energy thrift, can
be achieved.
3. The R value (thermal resistance) of particular insulation materials is also a
significant factor. It indicates how much insulation is required to deliver any
prescribed U-value. The higher the R value, the lower the amount of insulation
material needed, generating a corresponding reduction in embodied carbon.
Critically therefore insulation with low embodied carbon coupled with high R
value will achieve the lowest minimal CO2. The relative carbon intensity of the
investigated insulation materials as a measure of R-value to embodied CO2 per
metre square insulation material (associated with 0.1 W/m2.K U-value) has been

CHAPTER 5: Total Carbon Quantification of Insulation Materials for New and Retrofitted Buildings
75
calculated. The level of carbon intensity is 26.1 kgCO2/m2 and 13.32 kgCO2/m2
for PUR and mineral wool respectively.
4. Greyed out cells on table 5.1 indicate where the values cannot be achieved using
currently available systems, i.e. where the insulation and building envelope
technology is unable to provide the required U-values due normally to the
physical thickness of the required insulation (causing practical engineering
difficulties). In these situations the optimal achievable values are reduced and
the lowest CO2 level is unachievable.
Table 5.1 Limits of conventional insulation materials in terms of minimum carbon emission for 25, 40 and 60 years design life
Mineral Wool PUR
3000
m2
Ret
ail s
hed
3000
m2
war
ehou
se
1000
m2
war
ehou
se
3000
m2
Ret
ail s
hed
3000
m2
war
ehou
se
1000
m2
war
ehou
se
25 Y
EA
RS
DE
SIG
N
LIF
E
Minimum CO2
(kgCO2/m2.yr) 2.19 13.5 10.74 3.97 14.48 12.08
Roof Thickness (mm) 280 460 440 160 260 260
Wall Thickness (mm) 200 330 320 115 185 185
Roof U-value W/m2.K 0.13 0.08 0.08 0.15 0.09 0.09
Wall U-value W/m2.K 0.18 0.111 0.116 0.21 0.14 0.14
40 Y
EA
RS
DE
SIG
N
LIF
E
Minimum CO2
(kgCO2/m2.yr) 1.71
NO MINIMUM UP
TO 500 mm AND
0.07 W/m2.K
3.28 13.5 10.69
Roof Thickness (mm) 340 220 300 300
Wall Thickness (mm) 245 155 215 215
Roof U-value W/m2.K 0.106 0.111 0.08 0.08
Wall U-value W/m2.K 0.15 0.15 0.115 0.11
60 Y
EA
RS
DE
SIG
N
LIF
E
Minimum CO2
(kgCO2/m2.yr) 1.41
NO MINIMUM UP
TO 500 mm AND
0.07 W/m2.K
2.8
NO MINIMUM
UP TO 400 mm
AND 0.06 W/m2.K
Roof Thickness (mm) 380 280
Wall Thickness (mm) 270 200
Roof U-value W/m2.K 0.09 0.08
Wall U-value W/m2.K 0.13 0.12
Current manufacturing limitations
Lowest possible U-Value: 0.2
W/m2.K for wall and 0.09 for
Roof
Lowest possible U-Value:
0.13 W/m2.K for Wall and
Roof

CHAPTER 5: Total Carbon Quantification of Insulation Materials for New and Retrofitted Buildings
76
Where very high levels of thermal insulation are able to deliver net carbon benefits on
the basis of aggregated operational and embodied carbon analysis, practical technical
constraints can become limiting. Two of the most common insulation materials, mineral
wool and PUR foam, both have limitations that can constrain their usage.
PUR foam relies on a reaction between its constituent chemicals to cause the formation
of cells and expansion (foaming) of the material (Jelle 2011, Al-Homoud 2005).
Beyond around 170mm this reaction is slow and becomes difficult to control. 170mm of
PUR foam equates to a U-value of 0.147 W/m2.K. The maximum thickness of PUR that
appears possible to obtain from standard sources at present appears to be around 200mm
with U-value of 0.125 W/m2.K with 170mm being significantly more common.
Mineral wool can be produced to any thickness (if necessary in multiple layers) but
where low U-values are required the necessary dimensions can become difficult to
accommodate within construction systems (the support systems in built-up cladding
becomes too large and problematic) (Papadopoulos 2005, Al-Homoud 2005). 280mm of
mineral wool is required to achieve the same U-value as 170mm of PUR, whilst to
achieve a U-value of 0.1 W/m2·K requires 360mm. This over-sizing has an adverse
effect on net to gross internal area ratios, increases cost and presents significant
engineering difficulties (including excessive eccentricities in spacer systems particularly
on walls and inclined roofs). The transportation and handling of deep insulation systems
can also be problematic. On these grounds very thick mineral wool assemblies are
usually discounted although the maximum thickness that is acceptable is more difficult
to identify precisely.
4.1.2.2 Residential buildings
Energy consumption in houses accounts for 27% of the total national energy
consumption in the UK (DECC, 2010). Building codes and compliances therefore
require performance standards to be met by residential building envelopes. This
inevitably requires incremental increases in insulation thicknesses (to reduce the heat

CHAPTER 5: Total Carbon Quantification of Insulation Materials for New and Retrofitted Buildings
77
loss through building fabric) that consequently result in thick cladding systems using
conventional insulation materials.
Traditionally, the external walls of residential buildings in the UK were constructed of
solid brickwork. The cavity wall was designed to keep the majority of moisture at bay,
whilst the ventilated cavity facilitates evaporation of any moisture that does penetrate to
the cavity. The first experiments with insulated cavities however occurred in the 1950s
in the UK when regulations dictated higher levels of insulation (Energy saving trust,
2009). Over the years, Building codes and Regulations have led to an incremental
increase in the total cavity width from 35 to 100mm in accordance with insulation
requirements.
More recently however as even higher insulated building fabric is required, the
feasibility of wider cavities is being debated. The industry is keen on the 100 mm cavity
width which provides approximately 0.25-0.2 W.m2k U-value (using mineral wool and
PUR as insulation materials and when the cavity is fully filled). This makes it difficult
to achieve lower U-values using conventional insulation materials. There are number of
reasons why industry supports 100 mm cavity:
1. The first consideration is the cost effectiveness of 100mm cavities as they are
widely accepted by the industry as being easily constructed.
2. A consequence of increased wall thickness could be the loss of the area of a
house from the plot on a large building site in an extreme case. In cases where
the land size is limited, increased wall thickness could lead to loss of livable area
and to lower rental value per site. Flats and terraced houses (as most constructed
types of housing since 2003 in the UK) are not extremely affected by this
scenario.
3. In addition, thermal bridging needs to be investigated as higher number of steel
ties are required to penetrate through the insulation to support wider cavities.
A 100mm insulated cavity supported by other carbon reduction technologies, can meet
the requirements for compliance with Code for Sustainable Homes levels 3 and 4.
However to achieve levels 5 and 6, it will be necessary to improve the U-value in a cost-

CHAPTER 5: Total Carbon Quantification of Insulation Materials for New and Retrofitted Buildings
78
effective way. The England and Wales Building Regulations Approved Document A
presents guidelines for cavities up to 300mm width. Evidence from the Modern
Masonry Alliance (MMA) suggests that cavities of 125-150mm are gaining acceptance
(due to energy efficiency concerns) and being used more frequently by developers in the
self-build market (energy saving trust, 2009). However, for the above reasons going
beyond 100-150 mm cavity is not seen as a preferred route by much of the construction
industry.
Calculations show limits for conventional insulation materials in achieving required low
U-values at an industry level accepted cavity width (Table 5.2).
Table 5.2 Associated U-values with insulated cavity widths (fully filled)
U-value W/m2K Insulated cavity
mm mineral
wool PUR
50 0.389 0.31 100 0.255 0.19 150 0.189 0.138
Minimum aggregated carbon analysis The following analyses illustrate the range of insulation thicknesses and U-values
around the point of minimum combined operational and embodied carbon for a semi-
detached residential building, based on NCM modelling assumptions. Embodied carbon
figures for mineral wool and PUR insulation are extracted from the University of Bath’s
Inventory of Carbon and Energy (ICE) database.
Mineral wool is limited to 0.15 W/m2K U-value for 30 years design life requiring a 200
mm cavity which is not seen as a preferred solution by industry (Figure 5.7). The U-
value for 150mm of mineral wool is approximately 0.19 W/m2K. For a 60 year design
life however, no minimum carbon point is observed due to lower embodied CO2 (Figure
5.8).

CHAPTER 5: Total Carbon Quantification of Insulation Materials for New and Retrofitted Buildings
79
Figure 5.7 Carbon results of residential buildings insulated with mineral wool for 30 years design life
Figure 5.8 Carbon results of residential buildings insulated with mineral wool for 60
years design life
The graphs for the investigated residential buildings indicate an optimum thickness for
PUR insulation of approximately 100mm and 150mm for 30 and 60 years design life
assumptions respectively (Figures 5.9 and 5.10). This is based on typical building
operational criteria described in Chapter 4. This equates to a U-value of approximately
0.19 W/m2K for 30 years design life and 0.13 W/m2K for 60 years design life. Both
PUR and mineral wool are limited to 0.19 W/m2K due to the structural issues and
potential carbon disbenefit at 30 years design life. In case of 60 years design life, PUR
is limited to 0.13 W/m2K. Mineral wool is not showing any carbon disbenefit down to
0.1 W/m2K U-value.
0
0.5
1
1.5
2
2.5
3
3.5
4
0 25 50 75 100 125 150 175 200 225 250 275 300
0.2845 0.2845 0.2845 0.3095 0.3345 0.3595 0.3845 0.4095 0.4345 0.4595 0.4845 0.5095 0.5345
0.7162 0.4826 0.3895 0.3083 0.2552 0.2176 0.1897 0.1682 0.151 0.137 0.1254 0.1156 0.1072
KgCO
2/m
2 .yr
Insulation thickness (mm), External wall thickness (m), Wall U-Value
OperationalCO2
InsulationEmbodiedCO2
Total CO2
Minimum combined
carbon
0
0.5
1
1.5
2
2.5
3
3.5
4
0 25 50 75 100 125 150 175 200 225 250 275 300
0.2845 0.2845 0.2845 0.3095 0.3345 0.3595 0.3845 0.4095 0.4345 0.4595 0.4845 0.5095 0.5345
0.7162 0.4826 0.3895 0.3083 0.2552 0.2176 0.1897 0.1682 0.151 0.137 0.1254 0.1156 0.1072
KgCO
2/m
2.yr
Insulation thickness (mm), External wall thickness (m), Wall U-Value
OperationalCO2
InsulationEmbodiedCO2Total CO2

CHAPTER 5: Total Carbon Quantification of Insulation Materials for New and Retrofitted Buildings
80
Figure 5.9 Carbon results of residential buildings insulated with PUR for 30 years design life
Figure 5.10 Carbon results of residential buildings insulated with PUR for 60 years design life
Note that curves of this nature tend to flatten as service life increases or as a result of the
use of lower embodied carbon insulation. Both of these factors increase the optimum
insulation thicknesses. Conversely, if service life is decreased, or higher embodied
carbon insulation materials are used, optimum insulation thickness decreases.
Greyed out cells on Table 5.3 indicate where the values cannot be achieved using
conventional insulation materials, i.e. where the insulation and building envelope
technology is unable to provide the required U-values due normally to the physical
thickness of the required insulation (causing the practical engineering difficulties
0
0.5
1
1.5
2
2.5
3
3.5
4
0 25 50 75 100 125 150 175 200 225 250 275 300
0.2845 0.2845 0.2845 0.3095 0.3345 0.3595 0.3845 0.4095 0.4345 0.4595 0.4845 0.5095 0.5345
0.7162 0.4173 0.3109 0.2372 0.1917 0.1609 0.1386 0.1217 0.1085 0.0979 0.0892 0.0819 0.0757
KgCO
2/m
2.yr
Insulation thickness (mm), External wall thickness (m), Wall U-Value
OperationalCO2
InsulationEmbodiedCO2Total CO2
Minimum combined
0
0.5
1
1.5
2
2.5
3
3.5
4
0 25 50 75 100 125 150 175 200 225 250 275 300
0.2845 0.2845 0.2845 0.3095 0.3345 0.3595 0.3845 0.4095 0.4345 0.4595 0.4845 0.5095 0.5345
0.7162 0.4173 0.3109 0.2372 0.1917 0.1609 0.1386 0.1217 0.1085 0.0979 0.0892 0.0819 0.0757
KgCO
2/m
2.yr
Insulation thickness (mm), External wall thickness (m), Wall U-Value
OperationalCO2
InsulationEmbodiedCO2
Total CO2
Minimum combined
carbon

CHAPTER 5: Total Carbon Quantification of Insulation Materials for New and Retrofitted Buildings
81
previously described). In these situations the optimum achievable values are reduced
and the lowest CO2 level is unachievable.
Table 5.3 Limits of conventional insulation materials in terms of minimum carbon emission for 30 and 60 years design life
Mineral Wool PUR
30 Y
EA
RS
DE
SIG
N
LIF
E
Minimum CO2 (kgCO2/m2.yr) 1.944 2.25
Total wall Thickness (mm) 434 334
Roof U-value W/m2.K 0.113 0.136
Total roof thickness 450 340
Wall U-value W/m2.K 0.151 0.191
60 Y
EA
RS
DE
SIG
N L
IFE
Minimum CO2 (kgCO2/m2.yr) NO MINIMUM CO2 UP TO 300
mm INSULATION WITH 0.1
W/m2.K U-VALUE
1.89
Total wall Thickness (mm) 334
Roof U-value W/m2.K 0.136
Wall U-value W/m2.K 0.19
4.1.2.3 Office buildings
According to the DCLG report on 2014 build rate assumptions (DCLG, 2014), 44% of
new non-domestic buildings are going to be Offices by 2050. Commercial office
buildings therefore are a key sector in achieving the committed energy thrift targets. A
survey commissioned by BCSA and Tata Steel (steelconstruction.info, 2015) shows that
on average across the last 30 years steel frames have accounted for 70% of all non-
domestic framed multi-storey UK commercial construction. Steel framed systems
coupled with novel insulation solutions can lead to the expected slimness ideal for
commercial buildings.
The slimness of cladding systems for commercial buildings and specifically offices are
crucial as when the thickness of commercial building cladding systems increase, the
ratio of net to gross floor area which is calculated on a building perimeter basis is
adversely affected. The impacts of adjustments in net to gross floor areas that may be
achieved by reducing the width of external walls are significant in rental value of
buildings.
Therefore, in order to identify the optimum thickness on grounds of carbon efficiency
and slimness of the cladding using mainstream conventional insulation materials

CHAPTER 5: Total Carbon Quantification of Insulation Materials for New and Retrofitted Buildings
82
(considering meeting the fabric energy efficiency standards), thermal performance of a
typical four story office building has been modelled using dynamic thermal modelling
software (IES-VE). Mineral wool and PUR as conventional insulation materials have
been used for the analysis.
Minimum aggregated carbon analysis
The following analyses illustrate the range of insulation thicknesses and U-values
around the point of minimum combined operational and embodied carbon for an office
building, based on CIBSE modelling assumptions.
Mineral wool shows results limited to 0.13 W/m2.K U-value for 30 years design life
requiring 240 mm insulation thickness (Figure 5.11). In case of a 60 year design life, no
minimum carbon point occurs down to 0.09 W/m2.K U-value (Figure 5.12).
Figure 5.11 Carbon results of commercial buildings insulated with Mineral wool for 30
years design life
0123456789
10
15 25 40 55 70 85 100 115 125 140 155 170 185 200 215 225 240 255 270 285 300 320 330 340 350
290 300 315 330 345 360 375 390 400 415 430 445 460 475 490 500 515 530 545 560 575 595 605 615 625
0.820.670.530.350.320.280.250.240.21 0.2 0.180.170.160.150.140.130.130.120.110.11 0.1 0.1 0.1 0.1 0.09
External Wall footprint area (m2)
KgCO
2/m
2 .yr
Insulation thickness (mm), Wall thickness (mm), Wall U-Value (W/m2.K)
OperationalCO2
InsulationECO2
Total CO2
Minimum combined
carbon

CHAPTER 5: Total Carbon Quantification of Insulation Materials for New and Retrofitted Buildings
83
Figure 5.12 Carbon results of commercial buildings insulated with Mineral wool for 60
years design life
The PUR insulation results for the investigated office building demonstrate an optimum
thickness of approximately 220mm and 280mm based on design life assumptions of 30
and 60 year respectively. This equates to a U-value of 0.1 and 0.08 W/m2.K respectively
(Figures 5.13 and 5.14).
Figure 5.13 Carbon results of commercial buildings insulated with PUR for 30 years design life
0123456789
10
15 25 40 55 70 85 100 115 125 140 155 170 185 200 215 225 240 255 270 285 300 320 330 340 350
290 300 315 330 345 360 375 390 400 415 430 445 460 475 490 500 515 530 545 560 575 595 605 615 625
0.82 0.67 0.53 0.35 0.32 0.28 0.25 0.24 0.21 0.2 0.18 0.17 0.16 0.15 0.14 0.13 0.13 0.12 0.11 0.11 0.1 0.1 0.1 0.1 0.09
External Wall footprint area (m2)
KgCO
2/m
2 /yr
Insulation thickness (mm), Wall thickness (mm), Wall U-Value (W/m2.K)
OperationalCO2
InsulationECO2
Total CO2
0123456789
10
15 25 40 55 70 85 100 115 125 140 155 170 185 200 215 225 240 255 270 285
125 135 150 165 180 195 210 225 235 250 265 280 295 310 325 335 350 365 380 395
0.71 0.55 0.41 0.35 0.27 0.2 0.18 0.17 0.15 0.14 0.13 0.12 0.11 0.11 0.1 0.1 0.09 0.09 0.08 0.08
External wall footprint area (m2)
KgCO
2/m
2 .yr
Insulation thickness (mm), Wall thickness (mm), Wall U-Value (W/m2.K)
OperationalCO2
InsulationEmbodiedCO2Total CO2
Minimum combined
carbon

CHAPTER 5: Total Carbon Quantification of Insulation Materials for New and Retrofitted Buildings
84
Figure 5.14 Carbon results of commercial buildings insulated with PUR for 60 years
design life
Table 5.4 indicates where the values can theoretically be achieved using conventional
insulation materials but are not normally used due to the unacceptable physical
thickness of the required insulation and also the significant amount of lost rental values
associated with thick insulation panels. In these situations the minimum achievable
values are reduced and the lowest CO2 level is unachievable.
Table 5.4 Limits of conventional insulation materials in terms of minimum carbon
emission for 30 and 60 years design life
Mineral Wool PUR
30 Y
EA
RS
DE
SIG
N
LIF
E Minimum CO2 (kgCO2/m2.yr) 1.007 1.87
Wall Thickness (mm) 515 330 Roof U-value W/m2.K 0.106 0.08 Wall U-value W/m2.K 0.13 0.109
60 Y
EA
RS
DE
SIG
N
LIF
E Minimum CO2 (kgCO2/m2.yr)
NO MINIMUM CO2 UP TO 350 mm INSULATION WITH 0.09
W/m2.K U-VALUE
1.29
Wall Thickness (mm) 390 Roof U-value W/m2.K 0.064 Wall U-value W/m2.K 0.086
4.1.3 Role of novel insulation materials: vacuum insulation panels and hemp
Certain modern insulation materials appear to have good potential to provide U-values
better than those provided by conventional materials such as mineral wool and PUR,
without there being a net carbon disbenefit arising from their embodied carbon. These
0123456789
10
15 25 40 55 70 85 100 115 125 140 155 170 185 200 215 225 240 255 270 285
125 135 150 165 180 195 210 225 235 250 265 280 295 310 325 335 350 365 380 395
0.71 0.55 0.41 0.35 0.27 0.2 0.18 0.17 0.15 0.14 0.13 0.12 0.11 0.11 0.1 0.1 0.09 0.09 0.08 0.08
External wall footprint area (m2)
KgCO
2/m
2 .yr
Insulation thickness (mm), Wall thickness (mm), Wall U-Value (W/m2.K)
OperationalCO2
InsulationEmbodiedCO2Total CO2
Minimum combined
carbon

CHAPTER 5: Total Carbon Quantification of Insulation Materials for New and Retrofitted Buildings
85
materials essentially provide higher levels of thermal insulation relative to the embodied
carbon investment. Some possible examples include Vacuum Insulation Panels and
Hemp.
4.1.3.1 Vacuum Insulation Panels
Vacuum panels typically comprise 3 components (Figure 5.15):
• A core material which provides structural integrity and resistance to heat transfer.
• A thin film barrier or envelope to preserve the vacuum and reduce radiative heat
losses.
• A ‘getter’ or desiccant material to absorb any residual water or gas inside the sealed
envelope, as well as any water vapour or gases which may permeate the envelope.
Thermal conductivities of less than 0.004 W/m.K can be achieved. U-values associated
with VIPs therefore, are typically 4-7 times better than conventional insulation
materials.
Figure 5.15 VIP panel components
Figures 5.16 and 5.17 present the differences in thickness of Vacuum Insulation Panels
(VIPs) and PUR/mineral wool insulation for equivalent U-values. It schedules the
specific dimensional reductions achieved for U-values in the range 1.1 to 0.1 W/m2 K
(the greatest differences occurring at the lowest U-values). Results are based on centre
panel calculations, i.e. without edge effects.

CHAPTER 5: Total Carbon Quantification of Insulation Materials for New and Retrofitted Buildings
86
VIP Thickness
(mm)
PUR Thickness
(mm)
Difference in thickness
3.4 19.7 3.8 21.8 4.2 24.4 4.7 27.6 5.4 31.7 6.3 37.3 7.6 45.2 9.6 57.1
12.8 77.2 19.3 118.1 38.8 244.5
Figure 5.16 Comparison of thickness of VIP and PUR insulation of equivalent U-value
VIP Thickness
(mm)
MW Thickness
(mm)
3.4 28.3 3.8 31.3 4.2 35.1 4.7 39.8 5.4 45.9 6.3 54.1 7.6 65.8 9.6 83.6
12.8 113.8 19.3 175.7 38.8 369.1
Figure 5.17 Comparison of thickness of VIP and mineral wool insulation of equivalent U-value
In conventional insulation materials, such as mineral wool and PUR, a large proportion
of the total heat transfer is due to conduction across (non-convective) gas pockets within
the material. Eliminating the conduction effects of such gas pockets improves resistance
of the insulation to heat transfer (HiPTI IEA/ECBCS Annex 39, 2005). Vacuum
Insulation Panels (VIPs) are a highly efficient form of thermal insulation comprising an
open-celled core (fumed silica or mineral wool) and a sealed and evacuated air-tight
membrane (normally multiple alternating layers of metallic and polymeric materials).
Conventional vacuum insulation panels (VIPs) based on evacuated fumed silica within
metallised polymeric membranes have been considered for the analyses. This form of
vacuum panel is now used in different industries including refrigerators, packaging,
16
18
20
23
26
31
38
48
64
99
206
1.1
1
0.9
0.8
0.7
0.6
0.5
0.4
0.3
0.2
0.1
U-va
lue
(W/m
2 K)

CHAPTER 5: Total Carbon Quantification of Insulation Materials for New and Retrofitted Buildings
87
pipework wrapping and construction, to provide high levels of insulation at minimal
thickness.
This should be noted that the edge effect in conventional vacuum insulations can affect
the effective U-value of the panel significantly depending on the panel size and
thickness. Due to the uncertainties associated with quantifying the edge effect the centre
of the panel U-value has been used in the analyses.
Minimum aggregated carbon analyses of VIPs in industrial claddings
High thermal resistance of VIPs coupled with low embodied CO2 implies a net benefit
up to and beyond the levels of insulation that may be reasonably anticipated (i.e.
extremely low U-values). Figures 5.18 to 5.20 demonstrate the optimum level of carbon
efficiency which is achievable using VIP insulation.
Figure 5.18 Carbon results of 3000m2 warehouse insulated with VIP for 25, 40 and 60 years design life
0
5
10
15
20
25
30
0.7 0.37 0.25 0.193 0.1565 0.1309 0.098 0.065 0.049 0.039
5 10 15 20 25 30 40 60 80 100
KgCO
2/m
2 .yr
U-Value (W/m2.K), Insulation thickness (mm)
25 years ECO2
25 years total CO2
40 years ECO2
40 years total CO2
60 years ECO2
60 years total CO2
Operational CO2

CHAPTER 5: Total Carbon Quantification of Insulation Materials for New and Retrofitted Buildings
88
Figure 5.19 Carbon results of 3000m2 retail shed insulated with VIP for 25, 40 and 60
years design life
Figure 5.20 Carbon results of 1000m2 warehouse insulated with VIP for 25, 40 and 60
years design life Only in one of the cases analysed, that of a retail shed with a 25, 40 and 60 year design
life, embodied CO2 reaches a point where it offsets the savings associated with
incremental increase of insulation material. In all other cases increasing the level of
insulation provided by VIP continues to reduce the combined operational and embodied
carbon requirements (Table 5.5).
According to the DCLG report on 2014 build rate assumptions (DCLG, 2014), 43% of
new non-domestic buildings will be distribution and retail warehouses by 2050. This
figure equates to 3.3 million square meters of warehouse buildings. The minimum
achievable CO2 associated with using VIPs in comparison to investigated conventional
insulation materials saves about 3.8-9 thousand tonnes of CO2 per annum (depending on
0
1
2
3
4
5
6
7
8
9
10
0.7 0.37 0.25 0.193 0.1565 0.1309 0.098 0.065 0.049 0.039
5 10 15 20 25 30 40 60 80 100
KgCO
2/m
2 .yr
U-Value (W/m2.K), Insulation thickness (mm)
25 years ECO2
25 years total CO2
40 years ECO2
40 years total CO2
60 years ECO2
60 years total CO2
Operational CO2
Minimum carbon
25 years design life
Minimum carbon
40 years design life
Minimum carbon
60 years design life
0
5
10
15
20
25
30
35
0.7 0.37 0.25 0.193 0.1565 0.1309 0.098 0.065 0.049 0.039
5 10 15 20 25 30 40 60 80 100
KgCO
2/m
2 .yr
U-Value (W/m2.K), Insulation thickness (mm)
25 years ECO2
25 years total CO2
40 years ECO2
40 years total CO2
60 years ECO2
60 years total CO2
Operational CO2

CHAPTER 5: Total Carbon Quantification of Insulation Materials for New and Retrofitted Buildings
89
building size and operation criteria) which is about 4-10% of total non-residential
buildings in-use phase CO2 emissions (Table 5.5) (BIS, 2010).
Table 5.5 Minimum achievable carbon emissions of conventional insulation materials
in comparison to VIP for 25 years design life
25 YEARS DESIGN LIFE (minimum achievable)
Mineral Wool PUR VIP
Ret
ail s
hed
3000
m2
war
ehou
se
1000
m2
war
ehou
se
Ret
ail s
hed
3000
m2
war
ehou
se
1000
m2
war
ehou
se
Ret
ail s
hed
3000
m2
war
ehou
se
1000
m2
war
ehou
se
Minimum CO2 (kgCO2/m2.yr) 2.25 14 11.5 3.97 14.5 12.2 1.27 11.76 11.05
Roof Thickness (mm) 280 400 400 160 170 170 80 110 110
Wall Thickness (mm) 170 170 170 115 170 170 60 100 100
Roof U-value W/m2.K 0.13 0.09 0.09 0.15 0.13 0.13 0.049 0.03 0.03
Wall U-value W/m2.K 0.2 0.2 0.2 0.21 0.13 0.13 0.068 0.039 0.039
Minimum aggregated carbon analyses of VIP in residential claddings
Vacuum Insulation Panels with 4 to 7 times better thermal resistance than conventional
insulation materials enable building owners to gain higher rental value associated with
thinner external walls. This also provides the industry with a solution to meet the
thermal performance requirements with maximum 100 mm cavity width. The results
from Figures 5.21 and 5.22 indicate a carbon disbenefit at 0.087 and 0.07 W/m2.K
U-value for VIP for 30 and 60 years design life respectively. Such low U-values were
achieved with only 40 and 60mm of insulation.

CHAPTER 5: Total Carbon Quantification of Insulation Materials for New and Retrofitted Buildings
90
Figure 5.21 Carbon results of residential buildings insulated with VIP for 30 years
design life
Figure 5.22 Carbon results of residential buildings insulated with VIP for 60 years design life
The average floor area of houses in the UK is about 80 m2 (RIBA, 2008) which,
multiplied by the average 100 thousand of new houses being built each year (DCLG,
2012), results in 8M m2 of new domestic buildings. The minimum achievable combined
operational and embodied CO2 associated with VIPs in comparison to investigated
conventional insulation materials shows between 4-6 thousand tonnes CO2 savings per
annum which is about 2.7- 4 % of total residential buildings in-use phase CO2 emissions
(BIS, 2010) (Table 5.6).
0
0.5
1
1.5
2
2.5
3
3.5
4
0 5 10 20 30 40 50 60 70 80 90 100
0.2845 0.2845 0.2845 0.2845 0.2845 0.2845 0.2845 0.2945 0.3045 0.3145 0.3245 0.3345
0.7162 0.3779 0.2567 0.1563 0.1124 0.0877 0.0729 0.0617 0.0534 0.0471 0.0422 0.0381
KgCO
2/m
2.yr
Insulation thickness (mm), Wall thickness (m), U-Value (W/m2.K)
Operational CO2
InsulationEmbodied CO2
Total CO2
Minimum combined
carbon
0
0.5
1
1.5
2
2.5
3
3.5
4
0 5 10 20 30 40 50 60 70 80 90 100
0.2845 0.2845 0.2845 0.2845 0.2845 0.2845 0.2845 0.2945 0.3045 0.3145 0.3245 0.3345
0.7162 0.3779 0.2567 0.1563 0.1124 0.0877 0.0729 0.0617 0.0534 0.0471 0.0422 0.0381
KgCO
2/m
2.yr
Insulation thickness (mm), Wall thickness (m), U-Value (W/m2.K)
OperationalCO2
InsulationEmbodiedCO2Total CO2
Minimum combined
carbon

CHAPTER 5: Total Carbon Quantification of Insulation Materials for New and Retrofitted Buildings
91
Table 5.6 Limits of VIP in terms of minimum carbon emission for 25, 40 and 60 years design life (residential)
VIP
30 Y
EA
RS
DE
SIG
N
LIF
E Minimum CO2 (kgCO2/m2.yr) 1.5
Wall Thickness (mm) 284 Roof U-value W/m2.K 0.06 Wall U-value W/m2.K 0.08
60 Y
EA
RS
DE
SIG
N
LIF
E Minimum CO2 (kgCO2/m2.yr) 1.3
Wall Thickness (mm) 294 Roof U-value W/m2.K 0.045 Wall U-value W/m2.K 0.061
Current manufacturing constraints No relevant technical limitations
Minimum aggregated carbon analyses of VIPs in office buildings
High thermal resistance of VIPs coupled with low embodied CO2 investments results in
very low achievable minimum carbon. Minimum achievable CO2 for VIPs is 3 to 4
times lower than that associated with investigated conventional insulation materials
(Figures 5.23 and 5.24). This equates to about 3000 tonnes CO2/pa. Multiplying this
figure by the 2 million m2 floor area of office buildings results in about 3% reduction in
total non-residential buildings in-use phase CO2 emissions (BIS, 2010) (Table 5.7).
Table 5.7 Limits of VIPs in terms of minimum carbon emission for 25, 40 and 60 years design life (office buildings)
VIP
30 Y
EA
RS
DE
SIG
N
LIF
E Minimum CO2 (kgCO2/m2.yr) 0.6
Wall Thickness (mm) 320 Roof U-value W/m2.K 0.065
Wall U-value W/m2.K 0.08
60 Y
EA
RS
DE
SIG
N
LIF
E
Minimum CO2 (kgCO2/m2.yr) 0.45
Wall Thickness (mm) 342
Roof U-value W/m2.K 0.05
Wall U-value W/m2.K 0.045 Current manufacturing constraints No relevant technical limitations

CHAPTER 5: Total Carbon Quantification of Insulation Materials for New and Retrofitted Buildings
92
Figure 5.23 Carbon results of commercial buildings insulated with VIP for 30 years design life
Figure 5.24 Carbon results of commercial buildings insulated with VIP for 60 years design life
4.1.3.2 Hemp insulation
What makes hemp a novel insulation material is its environmental performance. Like
other Natural Fibre Insulation (NFI) materials, hemp during its growth stage locks away
up to two tonnes of CO2 per tonne of fibre harvested which has a significant positive
impact on the environment. (www.hemptechnology.co.uk, 2013).
The CO2 will remain stored in the hemp fibre throughout the life of the product. If the
embodied CO2 of the material is calculated on a cradle to gate basis (which is the case in
this research) then the sequestered CO2 in a hemp plant in its growth stage and low
0
1
2
3
4
5
3.5 7 11 15 18 21 30 37 45 52 60 67 75
278.5 282 286 290 293 296 305 312 320 327 335 342 350
0.6 0.4 0.28 0.21 0.18 0.16 0.12 0.1 0.08 0.07 0.06 0.05 0.05
KgCO
2/m
2 .yr
Insulation thickness (mm), Wall thickness (mm), U-Value (W/m2.K)
OperationalCO2
Insulationembodied CO2
Total CO2
Minimum combined
carbon
0
1
2
3
4
5
3.5 7 11 15 18 21 30 37 45 52 60 67 75
278.5 282 286 290 293 296 305 312 320 327 335 342 350
0.6 0.4 0.28 0.21 0.18 0.16 0.12 0.1 0.08 0.07 0.06 0.05 0.05
KgCO
2/m
2 .yr
Insulation thickness (mm), Wall thickness (mm), U-Value (W/m2.K)
OperationalCO2
InsulationembodiedCO2
Total CO2
Minimum combined
carbon

CHAPTER 5: Total Carbon Quantification of Insulation Materials for New and Retrofitted Buildings
93
energy demand in farming and processing stages results in a negative embodied CO2
value for hemp insulation (Table 5.8).
Table 5.8 Net Global Warming Potential associated with hemp farming and processing
(hemptechnology.co.uk, 2012)
Hemp farming Hemp processing Total
Energy (MJ/kg straw) 1.86 1.92 3.78
IPCC GWP 100 (kgCO2/kg straw) 0.11 0.11 0.22
Net GWP inc. sequestered carbon (kgCO2/kg straw)
-1.56 0.11 -1.46
Hemp insulation is produced from the long fibres obtained from hemp plants (Figure
5.25). After the hemp is harvested and dried, the dried hemp plant is separated into
wood, fibres (used to create insulation), leaves, seeds and leftover dust. To hold the
‘wool’ together, strengthening polyester fibres are used that cannot be composted and
should be treated as household waste (Duijve, 2012). Hemp has the ability to help
manage condensation levels which not only decreases the risk of moisture damage but
also improves indoor air quality by allowing the building to breathe. Hemp insulation is
a hygroscopic material and is able to absorb, store and release over 20% of its weight in
moisture without affecting product performance.
Figure 5.25 Hemp insulation (source: homesinharmony.co.uk)
The density of Hemp insulation is approximately 40 kg/m3 and its thermal conductivity
is 0.039 W/m.K (Hock, 2009) which in comparison to other novel insulation
technologies is high.
Minimum aggregated carbon analyses of hemp in industrial claddings Whilst the thermal conductivity of hemp insulation is similar to conventional insulation
material such as mineral wool, negative embodied carbon implies a net carbon benefit

CHAPTER 5: Total Carbon Quantification of Insulation Materials for New and Retrofitted Buildings
94
down to the maximum levels of insulation that may be reasonably anticipated (i.e.
extremely low U-values) (Figures 5.26 to 5.28).
Figure 5.26 Carbon results of 3000m2 warehouse building insulated with hemp for 25
years design life
Figure 5.27 Carbon results of 1000m2 warehouse building insulated with hemp for 25
years design life
-5
0
5
10
15
20
25
30
35
40
45
1.80
3
1.06
47
0.83
0.63
28
0.54
45
0.44
77
0.36
41
0.33
44
0.29
63
0.27
54
0.24
9
0.23
41
0.20
35
0.18
87
0.17
6
0.16
84
0.15
5
0.14
91
0.14
1
0.13
61
0.12
72
0.11
94
0.11
59
0.11
25
0.10
94
15 30 40 55 65 80 100110125135150160185200215225245255270280300320330340350
KgCO
2/m
2/yr
U-Value (W/m2.K), Insulation thickness (mm)
OperationalCO2
InsulationECO2
Total CO2
-5
0
5
10
15
20
25
30
35
1.80
31.
0647
0.83
0.63
280.
5445
0.44
770.
3641
0.33
440.
2963
0.27
540.
249
0.23
410.
2035
0.18
870.
176
0.16
840.
155
0.14
910.
141
0.13
610.
1272
0.11
940.
1159
0.11
250.
1094
15 30 40 55 65 80 100110125135150160185200215225245255270280300320330340350
KgCO
2/m
2/yr
U-Value (W/m2.K), Insulation thickness (mm)
OperationalCO2
InsulationECO2
Total CO2

CHAPTER 5: Total Carbon Quantification of Insulation Materials for New and Retrofitted Buildings
95
Figure 5.28 Carbon results of 3000m2 retail shed insulated with hemp for 25 years
design life
As previously stated, 3.3 M m2 of new buildings will be distribution warehouses and
retail sheds. Non-domestic buildings are responsible for 100.7 MtCO2 per year (during
their in-use phase) (BIS, 2010). The minimum achievable CO2 associated with using
hemp insulation (using the cradle to gate figure for embodied CO2) in comparison to
investigated conventional insulation materials saves about 5-7.7 kgCO2 per square
meter per annum depending on building size and operation criteria. This is about 17-25
million tonnes of CO2 for 3.3 M m2 of new non-residential buildings which is 16.8-
24.8% of total non-residential buildings in-use phase CO2 emissions (BIS, 2010).
Minimum aggregated carbon analyses of hemp in residential claddings
Approximately 8 M m2 of new domestic buildings are going to be built each year
(DCLG, 2012). The minimum achievable combined operational and embodied CO2
analyses using hemp (assuming negative embodied carbon) in comparison to
investigated conventional insulation materials shows between 1.55-1.85 kgCO2/m2
savings per annum. This multiplied by the floor area of new buildings equates to
approximately 8.5-10% of total semidetached buildings CO2 emissions associated with
heating demand (BIS, 2010) (Figures 5.29 and 5.30).
-4-202468
1012141618
1.80
3
1.06
47
0.83
0.63
28
0.54
45
0.44
77
0.36
41
0.33
44
0.29
63
0.27
54
0.24
9
0.23
41
0.20
35
0.18
87
0.17
6
0.16
84
0.15
5
0.14
91
0.14
1
0.13
61
0.12
72
0.11
94
0.11
59
0.11
25
0.10
94
15 30 40 55 65 80 100110125135150160185200215225245255270280300320330340350
KgCO
2/m
2/yr
U-Value (W/m2.K), Insulation thickness (mm)
OperationalCO2
InsulationECO2
Total CO2

CHAPTER 5: Total Carbon Quantification of Insulation Materials for New and Retrofitted Buildings
96
Figure 5.29 Carbon results of residential building insulated with hemp for 30 years
design life
Figure 5. 30 Carbon results of residential building insulated with hemp for 60 years
design life Minimum aggregated carbon analyses of hemp in office buildings
Optimum CO2 values for hemp insulation in comparison to investigated conventional
insulation materials are about 1-1.15 kgCO2/m2 per annum. Multiplying this figure to 2
million m2 floor area of office buildings (build rate assumptions for 2050) saves up to
3% of total non-residential buildings in-use phase CO2 emissions (BIS, 2010) (Figures
5.31 and 5.32).
-1.5
-1
-0.5
0
0.5
1
1.5
2
2.5
3
3.5
4
0 25 50 75 100 125 150 175 200 225 250 275 300
0.28 0.28 0.28 0.31 0.33 0.36 0.38 0.41 0.43 0.46 0.48 0.51 0.53
0.72 0.48 0.39 0.31 0.26 0.22 0.19 0.17 0.15 0.14 0.13 0.12 0.11
KgCO
2/m
2 .yr
Insulation thickness - wall thickness - wall U-Value
OperationalCO2
InsulationEmbodiedCO2
Total CO2
-1
-0.5
0
0.5
1
1.5
2
2.5
3
3.5
4
0 25 50 75 100 125 150 175 200 225 250 275 300
0.28 0.28 0.28 0.31 0.33 0.36 0.38 0.41 0.43 0.46 0.48 0.51 0.53
0.72 0.48 0.39 0.31 0.26 0.22 0.19 0.17 0.15 0.14 0.13 0.12 0.11
KgCO
2/m
2 .yr
Insulation thickness - wall thicknss - wall U-Value
OperationalCO2
InsulationEmbodiedCO2Total CO2

CHAPTER 5: Total Carbon Quantification of Insulation Materials for New and Retrofitted Buildings
97
Figure 5.31Carbon results of commercial building insulated with hemp for 30 years
design life
Figure5.32 Carbon results of commercial building insulated with hemp for 60 years
design life
The benefit of hemp insulation when the embodied CO2 calculation is based on the
cradle to gate approach is the negative embodied CO2 measure. At the end-of-life stage
of hemp material however, it can be remixed with new material, used as biomass or
otherwise sawn up to be returned to the soil. At this point as the hemp fibre is
biodegradable it slowly releases the carbon through decomposition while also returning
other nutrients to the soil. Because the material eventually releases the stored CO2 back
-1
0
1
2
3
4
5
6
7
8
15 30 40 55 65 80 100 110 125 135 150 160 185 200 215 225 245 255 270 280
290 305 315 330 340 355 375 385 400 410 425 435 460 475 490 500 520 530 545 555
1.80 1.06 0.83 0.63 0.54 0.45 0.36 0.33 0.30 0.28 0.25 0.23 0.20 0.19 0.18 0.17 0.16 0.15 0.14 0.14
External wall footprint area (m2)
KgCO
2/m
2 /yr
Insulation thickness (mm) - wall thickness (mm) - wall U-Value (W/m2.K)
OperationalCO2
InsulationEmbodiedCO2
Total CO2
-1
0
1
2
3
4
5
6
7
8
15 30 40 55 65 80 100 110 125 135 150 160 185 200 215 225 245 255 270 280
290 305 315 330 340 355 375 385 400 410 425 435 460 475 490 500 520 530 545 555
1.80 1.06 0.83 0.63 0.54 0.45 0.36 0.33 0.30 0.28 0.25 0.23 0.20 0.19 0.18 0.17 0.16 0.15 0.14 0.14
External wall footprint area (m2)
KgCO
2/m
2 /yr
Insulation thickness (mm) - wall thickness (mm) - wall U-Value (W/m2.K)
OperationalCO2
InsulationEmbodiedCO2
Total CO2

CHAPTER 5: Total Carbon Quantification of Insulation Materials for New and Retrofitted Buildings
98
to the environment, the actual embodied CO2 of the material taking into account the raw
material processing energy and transportation to site is not negative as all other
insulation materials. This should be taken into account in studies which are using hemp
and are based on cradle to gate life cycle analysis as assuming negative carbon footprint
for hemp insulation suggests very thick building fabric that can be misleading in a
global building performance analysis.
4.2 Thermally retrofitted buildings
4.2.1 Introduction
It is estimated that 70% of the buildings that will be in use in 2050 have already been
constructed (UNEP, 2009)(Carbon trust, 2007) and so, whilst the performance standards
of new buildings are important, it is arguably more critical that effective strategies are
found for improving the thermal performance of existing stock. However currently,
thermal retrofitting of existing buildings appears under-represented in the effort to meet
carbon reduction targets.
At present there are around 8000 dwelling demolitions per year accounting for only
0.03% of the total stock (Ravetz 2008). The equivalent rate for industrial and
commercial premises is difficult to estimate. However based on there being 597 million
m2 of industrial and commercial premises in 2007 (CLG and ONS, 2008) and £6 billion
of non-domestic construction in the same year (ONS, 2010) coupled with little net
growth in the stock, and an assumed average construction cost of £1800 per m2 the
equivalent demolition figure can be estimated as being around 0.5%. At these rates, and
recognising the inaccuracies and uncertainties of future trends, it may reasonably be
expected that replacement of 50% of the existing building stock with new construction
complying with improved current and future building standards is likely to take a period
of the order of 100 years. In view of this slow rate of change it is essential that effective
thermal retrofit strategies are developed but limitations in the existing technologies pose
serious issues not least in terms of the embodied carbon associated with insulation
materials and techniques.
CHAPTER 5: Total Carbon Quantification of Insulation Materials for New and Retrofitted Buildings
99
As previously stated in Chapter 2, it is essential that embodied carbon is factored into
carbon reduction equations especially for refurbishment scenarios with particularly
shorter service lives. If so, a compelling case begins to emerge for the development of
high performance insulation materials. Of the known possible alternatives vacuum
insulation and hemp insulation are considered to be amongst the most promising as
discussed previously (DTI project 2007, Caps 2001, Fine 1989, Materna 2001, Zwerger
2005).
Even disregarding considerations of embodied carbon, many existing insulation
materials appear likely to struggle to meet future demands. Issues appear to be
particularly acute in refurbishment markets where buildings may be dimensionally
restricted or where structural issues may preclude certain solutions. Two of the most
common insulation materials, mineral wool and PUR foam, both have significant
performance limitations when used within composite or built-up systems as stated in
Section 1.2.1.
The development of novel insulation materials that combine higher thermal
performance with relatively low embodied carbon seems therefore to be essential. The
case is particularly strong for retrofit applications where design lives tend to be less than
those for new build, and where embodied carbon can offset a greater proportion of the
total operational carbon savings.
4.2.2 Quantification of the carbon limits of conventional and alternative insulation technology for industrial buildings
Generally, there are two dominant categories of building envelope refurbishment for
industrial buildings; re-sheeting and over cladding (Tata steel, 2013). In re-sheeting the
existing building envelope is replaced completely with a new cladding system, but in
over cladding, the existing envelope of the building is used as a base layer for
installation of new cladding. The choice between the two options is dependent on
individual project requirements and circumstances. One of the most commonly
employed refurbishment solution is re-sheeting with profiled built-up and composite
panel systems which are assumed to be the case for this study.

CHAPTER 5: Total Carbon Quantification of Insulation Materials for New and Retrofitted Buildings
100
The following analyses are associated with re-sheeting of standard single span portal
frame warehouses of 1000 and 3000m2 and a similar 3000m2 retail sheds similar to
those analysed in Section 1 of this Chapter. As re-sheeting has been used as the
retrofitting method in the present study, the CO2 savings are assumed to be the same as
new build analysis for industrial buildings. The service life associated with thermal
retrofitting analysis is assumed to be 25 years.
According to the UK National Statistics Publication Hub, there are approximately 466
thousand warehouses and factories existing in the UK. This figure equates to 370 M m2
of warehouse buildings. The minimum achievable CO2 associated with using VIPs in
comparison to investigated conventional insulation materials saves about 0.4-1 million
tonnes of CO2 per annum (depending on building size and operation criteria) which is
about 5-12.6% of associated CO2 with total space heating demand of industrial
buildings (about 40 TWh/year) (DECC, 2013). The saving associated with improving
the fabric U-value down to 0.25 W/m2K (assuming 0.35 as the base-case) is
approximately between 2.5-9.5% and to 0.15 W/m2K is in range of 0.63-10.7%.
The minimum achievable CO2 associated with using hemp insulation in comparison to
the investigated conventional insulation materials saves about 1.9-2.5 million tonnes of
CO2 per annum (depending on building size and operation criteria) which is about 22-
29% of associated CO2 with total space heating demand of industrial buildings.
Currently about 30% of the annual market for profiled roofing and cladding is allocated
to refurbishment which is only about 1-2% of existing cladding area. This slow paced
process needs a significant change to contribute to achieving the carbon reduction
targets.
4.2.3 Quantification of the Carbon Limits of Conventional and Alternative Insulation Technology for Residential Buildings
Residential buildings are responsible for 26% of UK emissions. It is estimated that 40%
of available buildings in 2050 will be pre 1985. It is also estimated that about 30% of
current housing stock do not have cavity walls and around 42% of houses with cavity

CHAPTER 5: Total Carbon Quantification of Insulation Materials for New and Retrofitted Buildings
101
walls are not insulated (Energy saving trust, 2011). The Environmental Change Institute
reports that to achieve the carbon reduction targets, 100% of cavity walls are required to
be insulated by 2050 (ECI, 2005). In 2009 30% of English homes failed the decent
home standard and in approximately a quarter of cases this was due to poor fabric
thermal performance. This highlights the importance of thermal retrofit solutions
(DCLG, 2010).
The first step in retrofitting houses is to understand that there is no single solution
applicable to all cases. Thermal retrofitting of the building fabric is fundamental in
achieving carbon reduction targets in a cost and performance effective approach. Many
basic retrofit solutions, such as loft insulation and cavity wall insulation are relatively
cheap and effective and offer reasonable payback periods which make them suitable
solutions economically. It is increasingly reported that a significant proportion of cavity
walls are not suitable for cavity wall insulation (The centre for low carbon future, 2011).
This is mainly due to potential problems such as areas of missing insulation, insulation
material slippage and variations in density or incomplete filling of cavities. This is also
believed that in the majority of existing cases, cavities are about 50mm wide which is
not sufficient in achieving lower targeted U-values using conventional insulation
materials (Table 5.9). These cases will normally require solid wall insulation as for non-
cavity wall houses.
Table 5.9 U-values associated with insulated cavity widths
Semidetached buildings account for about 26% of existing housing stock of which
about 25.5% are built with non-cavity walls and 28.9% are un-insulated cavity walls.
43.9% of existing non-cavity walls was built between years 1919 to 1944 (ONS, 2008).
A typical 1930’ semi-detached house therefore (as the most common existing non-
cavity wall building type) was selected to be simulated. It was assumed that all cases are
externally insulated with mainstream conventional insulation materials such as mineral
wool and PUR in comparison to hemp insulation and VIPs as novel solutions. The
following analyses investigate the results associated with thermal retrofitting of typical
U-value W/m2K
Insulated cavity mm
Mineral wool PUR
50 0.389 0.31
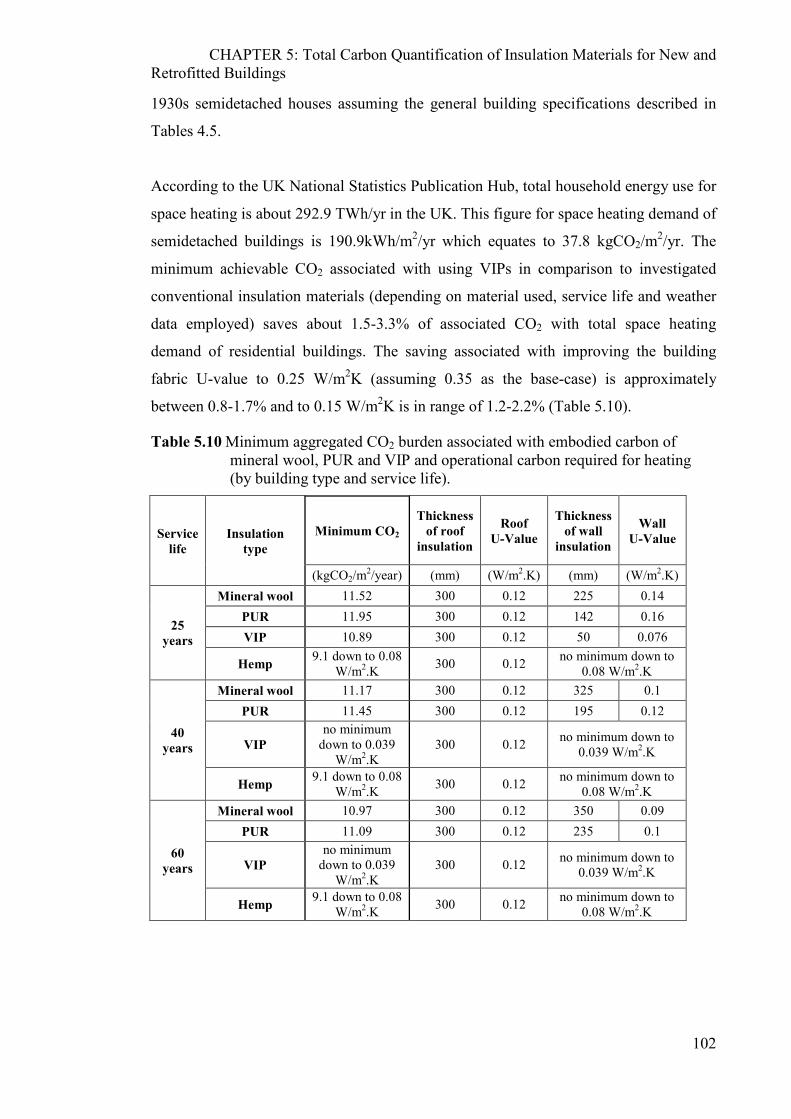
CHAPTER 5: Total Carbon Quantification of Insulation Materials for New and Retrofitted Buildings
102
1930s semidetached houses assuming the general building specifications described in
Tables 4.5.
According to the UK National Statistics Publication Hub, total household energy use for
space heating is about 292.9 TWh/yr in the UK. This figure for space heating demand of
semidetached buildings is 190.9kWh/m2/yr which equates to 37.8 kgCO2/m2/yr. The
minimum achievable CO2 associated with using VIPs in comparison to investigated
conventional insulation materials (depending on material used, service life and weather
data employed) saves about 1.5-3.3% of associated CO2 with total space heating
demand of residential buildings. The saving associated with improving the building
fabric U-value to 0.25 W/m2K (assuming 0.35 as the base-case) is approximately
between 0.8-1.7% and to 0.15 W/m2K is in range of 1.2-2.2% (Table 5.10).
Table 5.10 Minimum aggregated CO2 burden associated with embodied carbon of mineral wool, PUR and VIP and operational carbon required for heating (by building type and service life).
Service life
Insulation type
Minimum CO2 Thickness
of roof insulation
Roof U-Value
Thickness of wall
insulation
Wall U-Value
(kgCO2/m2/year) (mm) (W/m2.K) (mm) (W/m2.K)
25 years
Mineral wool 11.52 300 0.12 225 0.14 PUR 11.95 300 0.12 142 0.16 VIP 10.89 300 0.12 50 0.076
Hemp 9.1 down to 0.08 W/m2.K 300 0.12 no minimum down to
0.08 W/m2.K
40 years
Mineral wool 11.17 300 0.12 325 0.1 PUR 11.45 300 0.12 195 0.12
VIP no minimum
down to 0.039 W/m2.K
300 0.12 no minimum down to 0.039 W/m2.K
Hemp 9.1 down to 0.08 W/m2.K 300 0.12 no minimum down to
0.08 W/m2.K
60 years
Mineral wool 10.97 300 0.12 350 0.09 PUR 11.09 300 0.12 235 0.1
VIP no minimum
down to 0.039 W/m2.K
300 0.12 no minimum down to 0.039 W/m2.K
Hemp 9.1 down to 0.08 W/m2.K 300 0.12 no minimum down to
0.08 W/m2.K

CHAPTER 5: Total Carbon Quantification of Insulation Materials for New and Retrofitted Buildings
103
Replacing the conventional insulation materials with hemp insulation results in 6.5-
7.5% CO2 saving associated with total heating demand of investigated semidetached
buildings (assuming negative embodied CO2 for hemp insulation).
4.2.4 Quantification of the Carbon Limits of Conventional and Alternative Insulation Technology for Office Buildings
Retrofitting solutions for commercial buildings have not been widely adopted. More
than two-thirds of commercial properties are owned by short-term tenants who tend not
to be willing to sustain the high upfront cost of improvements (Energy Saving Trust,
2011). This is becoming more acute due to reducing lease terms (currently on average in
the UK, 4.8 years) which do not provide sufficient timescale for payback (Dixon, 2013).
Energy costs also account for a relatively low proportion of the operational costs of
most service sector companies (generally no greater than 6%). A further factor which
has frustrated thermal retrofitting is belief that improvements can be more effectively
achieved through replacement of existing lighting systems with low energy and efficient
control systems. Minimum energy efficiency standard aiming at carbon emission
reduction however is becoming a requirement by the Government.
There are approximately 350M m2 of office buildings existing in the UK (ONS, 2008).
Minimum achievable CO2 for novel insulation materials (when the building fabric is
upgraded from 0.35 to 0.15 W/m2.K U-Value) is approximately 0.23-1.68 kgCO2/m2
lower than that associated with investigated conventional insulation materials. This
equates to about 1-6.5% reduction in total non-residential buildings in-use phase CO2
emissions (BIS, 2010).
4.3 Technical Conclusions
The analyses demonstrate that there are limits for conventional insulation thicknesses
(varies depending on building type and size) beyond which the increase in embodied
carbon exceeds the decrease in operational carbon. These represent maximum insulation
thicknesses or ‘death points’ associated with each insulation material. If lower U-values

CHAPTER 5: Total Carbon Quantification of Insulation Materials for New and Retrofitted Buildings
104
are required, the development (birth point) of alternative (low embodied carbon)
insulation materials such as VIPs are essential.
Improving the fabric energy efficiency measures significantly reduces the space heating
load demand of buildings. The maximum achievable CO2 saving associated with fabric
thermal efficiency when including the regulated energy consumption (lighting and hot
water requirements) however, contributes to a maximum of 10% for non-domestic and
15-20% saving for residential buildings (refer to appendix B for detailed calculations).

105
5 CHAPTER 6: Insulation Specifications for Minimum Life-
Cycle Costs
The following chapter presents the Life Cycle Costing analysis associated with building
fabric energy efficiency for industrial, residential and office buildings. PUR and mineral
wool as mainstream conventional insulation materials and VIPs as exemplar novel
insulation material have been used for the analyses.
5.1 Introduction
Whilst all cladding systems must deliver acceptable levels of performance, ‘first cost’
criteria (procurement and construction costs) often have primacy in the selection of
building envelope systems. This is particularly the case for industrial buildings where
subsequent on-going costs are more associated with the lighting loads rather than
heating requirements. The target therefore for the industrial building owners is to
comply with the Building Regulation standards concerning the level of insulation.
The cost Analyses for residential and office buildings, however, are more complicated.
As the thickness of building cladding systems increase as a consequence of higher
levels of insulation (to reduce the conductive heat loss through building envelope), the
ratio of net to gross floor area calculated on a building perimeter basis is adversely
affected. Hence the rental value of buildings changes considerably. This will make the
thickness of building cladding a determinant factor in achieving the optimum level of
thermal performance for residential and office building envelopes.
The use of mainstream conventional insulation materials, such as mineral wool and
PUR, would demand thicker insulation panels in the wall construction (around 200-300
mm external wall to meet the performance requirements) which will consequently affect
the financial benefit of energy savings associated with the better thermal performance of
the building envelope. A substantial improvement in energy performance and cladding
slimness is however expected to be achieved by novel insulation materials such as VIPs

CHAPTER 6: Insulation Specifications for Minimum Life-Cycle Costs
106
where low embodied CO2 is coupled with high thermal resistance and subsequently a
thinner panel can be adopted.
Life Cycle Costing (LCC) analysis has been carried out therefore to investigate the cost
effectiveness of conventional and novel insulation materials for industrial, residential
and office buildings. The price/m2 floor area was extracted from the property market
report (Valuation Office Agency, 2011). Average insulation prices provided by different
suppliers have been used for conventional insulation materials. For VIPs an estimated
reduced price has been calculated based on the price of products involved in the similar
manufacturing process (see Section 2.3 for more detail) (Table 6.1).
Table 6. 1 Average cost of renewable technologies and insulation materials supplied by various manufacturers in the UK
Wall Roof
PUR
U value Thickness mm Price/m2 U value Thickness mm Price/m2 0.25 100 67 0.2 125 47 0.21 119 68.5 0.17 147 48 0.19 132 70 0.15 167 49 0.17 147 71.5 0.12 208 50 0.15 167 73 0.11 227 51 0.11 227 79 0.1 250 55 0.1 250 82 0.08 312.5 57
Mineral wool
U value Thickness mm Price/m2 U value Thickness mm Price/m2 0.25 160 43.7 0.2 200 35.7 0.21 190 45 0.17 235 36.4 0.19 211 48.6 0.15 267 37 0.17 235 50.4 0.12 333 38.4 0.15 267 52.2 0.11 364 39 0.11 364 63 0.1 400 43 0.1 400 66.6 0.08 500 44.7
VIP
U value Thickness mm Price/m2 U value Thickness mm Price/m2 0.25 16 75 0.2 20 52.5 0.21 19 80.4 0.17 24 56.28 0.19 21 85.75 0.15 27 60.025 0.17 24 98.5 0.12 33 68.95 0.15 27 106 0.11 36 74.2 0.11 36 123 0.1 40 86.1 0.1 40 127.5 0.08 50 89.25
PV - - 183 - - -

CHAPTER 6: Insulation Specifications for Minimum Life-Cycle Costs
107
5.2 Industrial buildings
5.2.1 Minimum Life Cycle Cost analyses
The following section presents the NPV results for standard single span portal frame
warehouses of 1000 and 3000m2 and similar 3000m2 retail shed using built up cladding
systems with mineral wool and composite PUR cladding systems. The analyses assume
the general system parameters described in Tables 4.1 and 4.3 (refer to Chapter 4). The
internal gains including generated heat from lighting, occupants and solar gain have
been taken into account when determining heating demands. The 2010 Building
Regulations backstop U-values for building fabric have been assumed as the basecase
for LCC calculations.
5.2.1.1 NPV analyses for conventional insulation materials: mineral wool and PUR
The following graphs illustrate the cost analysis associated with the incremental
increases in insulation levels and consequent decreases in U-values. Bars refer to the
initial cost of thermal performance improvements (left axis) and lines refer to NPV
results for 25, 40 and 60 years building service life (Right axis).
According to the results from Figures 6.1 to 6.6, improving the building fabric thermal
performance beyond the required standards (in this case the backstop U-value for
building envelope) results in small financial profit as for thicknesses where the NPV
reaches its highest level, the future energy cost savings over buildings design life will
only recover the capital cost of highly insulated envelope (except for 60 years design
life).
The Building Regulations suggest lower U-Values for Roofs compared to walls. This is
due to the higher conductive heat loss through roofs. There is a ratio of 0.7 between
current roof and wall backstop U-values in the Regulations which has been assumed to
be the case in this research.
In case of mineral wool over 25, 40 and 60 years design life:

CHAPTER 6: Insulation Specifications for Minimum Life-Cycle Costs
108
• For wall U-value; Maximum NPV occurs in range of 0.18 - 0.27 W/m2K in
investigated buildings whilst the required backstop U-value is 0.35 W/m2K.
• For the relative roof U-value (calculated by multiplying wall U-value by 0.7);
Maximum NPV occurs in range of 0.13 - 0.20 W/m2K in the buildings
investigated whilst the required backstop U-value is 0.25 W/m2K.
• 12 to15% more investment on initial cost of insulating the building beyond the
required standards, results in up to £ 30k cost benefit (NPV) during 60 years of
buildings design life.
• For retail sheds however, as the energy consumption is mainly associated with
lighting, improving the building fabric (aiming at reducing the heating demand)
is not financially justifiable.
Figure 6.1NPV results of 3000m2 warehouse insulated by mineral wool for 25, 40 and
60 years design life
-700
-600
-500
-400
-300
-200
-100
0
100
0
50
100
150
200
250
300
350
400
1.40
70.
799
0.55
80.
428
0.35
00.
293
0.25
20.
222
0.19
80.
179
0.16
30.
150
0.13
80.
129
0.12
00.
113
0.10
60.
101
0.09
50.
091
0.08
70.
083
0.08
00.
076
0.07
3
20 40 60 80 100120140160180200220240260280300320340360380400420440460480500U-Value (W/m2.K), Insulation thickness (mm)
Initialinsulationcost25 yearsdesign lifeNPV40 yearsdesign lifeNPV60 yearsdesign lifeNPV
Initi
al In
sula
tion
cost
( tho
usan
d £)
NPV
( th
ousa
nd £
)
Basecase
Maximum NPV
(25 years service
life)
Maximum NPV
(40 years service
life)
Maximum NPV
(60 years service
life)

CHAPTER 6: Insulation Specifications for Minimum Life-Cycle Costs
109
Figure 6.2NPV results of 3000m2 retail shed insulated by mineral wool for 25, 40 and
60 years design life
Figure 6.3 NPV results of 1000m2 warehouse insulated by mineral wool for 25, 40 and 60 years design life
In the case of PUR over 25, 40 and 60 years design life:
• For wall U-value; Maximum NPV occurs in range of 0.14 - 0.24 W/m2K in
investigated buildings (the backstop U-value is 0.35 W/m2K).
• For roof U-value; Maximum NPV occurs in range of 0.1 - 0.17 W/m2K in the
buildings investigated (the backstop U-value is 0.25 W/m2K).
-700
-600
-500
-400
-300
-200
-100
0
100
0
50
100
150
200
250
300
350
400
450
1.40
70.
799
0.55
80.
428
0.35
00.
293
0.25
20.
222
0.19
80.
179
0.16
30.
150
0.13
80.
129
0.12
00.
113
0.10
60.
101
0.09
50.
091
0.08
70.
083
0.08
00.
076
0.07
3
20 40 60 80 100120140160180200220240260280300320340360380400420440460480500U-Value (W/m2.K), Insulation thickness (mm)
Initialinsulationcost25 yearsdesign lifeNPV40 yearsdesign lifeNPV60 yearsdesign lifeNPV
Initi
al In
sula
tion
cost
( tho
usan
d £)
NPV
( th
ousa
nd £
)
Maximum NPV
(25 years service
life)
Maximum NPV
(40 years service
life)
Maximum NPV
(60 years service
life)
Basecase
-250
-200
-150
-100
-50
0
50
0
50
100
150
200
250
300
350
400
450
1.40
70.
799
0.55
80.
428
0.35
00.
293
0.25
20.
222
0.19
80.
179
0.16
30.
150
0.13
80.
129
0.12
00.
113
0.10
60.
101
0.09
50.
091
0.08
70.
083
0.08
00.
076
0.07
3
20 40 60 80 100120140160180200220240260280300320340360380400420440460480500U-Value (W/m2.K), Insulation thickness (mm)
Initialinsulationcost
25 yearsdesign lifeNPV
40 yearsdesign lifeNPV
60 yearsdesign lifeNPV
Initi
al In
sula
tion
cost
( tho
usan
d £)
NPV
( th
ousa
nd £
)
Maximum NPV
(40 years service
life)
Maximum NPV
(60 years service
Basecase

CHAPTER 6: Insulation Specifications for Minimum Life-Cycle Costs
110
• 8 to15% more investment on initial cost of insulating the building beyond the
required standards, results in £25k to £50k cost benefit for 60 years building
design life.
Achieving the thicknesses in which the NPV reaches its highest level for PUR roof
panels seems however to be difficult as the maximum available thickness currently
produced in the market is restricted to 0.13 W/m2K U-value due to manufacturing
constraints.
Figure 6.4 NPV results of 3000m2 warehouse insulated by PUR for 25, 40 and 60 years
design life
Figure 6.5 NPV results of 3000m2 retail shed insulated by PUR for 25, 40 and 60 years
design life
-500-450-400-350-300-250-200-150-100-50050100
0
50
100
150
200
250
300
350
400
1.06
38
0.57
47
0.39
37
0.29
94
0.24
15
0.20
24
0.17
42
0.15
29
0.13
62
0.12
28
0.11
19
0.10
27
0.09
49
0.08
82
0.08
24
0.07
73
0.07
28
0.06
88
0.06
52
0.06
220 40 60 80 100 120 140 160 180 200 220 240 260 280 300 320 340 360 380 400
U-Value (W/m2.K), Insulation thickness (mm)
Initialinsulationcost
25 yearsdesign lifeNPV
40 yearsdesign lifeNPV
60 yearsdesign lifeNPV
Initi
al In
sula
tion
cost
( tho
usan
d £)
NPV
( th
ousa
nd
£)
Maximum NPV
(60 years service
life)
Maximum NPV
(40 years service
life)
Maximum NPV
(25 years service
life)
Basecase
-400
-350
-300
-250
-200
-150
-100
-50
0
50
0
50
100
150
200
250
300
350
400
450
500
1.06
4
0.57
5
0.39
4
0.29
9
0.24
2
0.20
2
0.17
4
0.15
3
0.13
6
0.12
3
0.11
2
0.10
3
0.09
5
0.08
8
0.08
2
0.07
7
0.07
3
0.06
9
0.06
5
0.06
2
20 40 60 80 100 120 140 160 180 200 220 240 260 280 300 320 340 360 380 400
U-Value (W/m2.K), Insulation thickness (mm)
Initialinsulationcost
25 yearsdesign lifeNPV
40 yearsdesign lifeNPV
60 yearsdesign lifeNPV
Initi
al In
sula
tion
cost
( tho
usan
d £)
NPV
( th
ousa
nd £
)
Maximum NPV
(25 years service
life)
Maximum NPV
(40 years service
life)
Maximum NPV
(60 years service
life)
Basecase

CHAPTER 6: Insulation Specifications for Minimum Life-Cycle Costs
111
Figure 6.6 NPV results of 1000m2 warehouse insulated by PUR for 25, 40 and 60 years design life
Interpretation of NPV analyses of novel insulation materials: VIPs
Parallel with the cost analysis of incremental increases in insulation thickness for
conventional insulation materials, the cost analyses of VIPs are presented in the
following graphs. Bars refer to the initial cost of thermal performance improvements
(left axis) and lines refer to NPV results for 25, 40 and 60 years design life of insulation
panels (Right axis).
At present, whilst there is good technical potential supporting the development of
vacuum insulation, there is limited market demand and therefore limited opportunities
for large scale economic commercialisation. Costs are therefore relatively high since
high volume production and supply chains have not thus far been established (Tenpierik
2009, Erb 2010, Tenpierik 2006). Therefore in order to make the financial comparison
of VIP with conventional mainstream insulations materials feasible, an estimated
reduced price for VIPs has been calculated based on the price of products involved in
the similar manufacturing process such as argon filled double glazed units, vacuum
double glazed units and a similar insulation material such as PUR. The lower price limit
has been assumed not to be lower than manufacturing and raw materials price taking
into account a similar commercial profit as the products mentioned. The upper price
limit is not to be higher than the price for which VIPs are competitive with PUR in
-200
-175
-150
-125
-100
-75
-50
-25
0
25
50
0
50
100
150
200
250
300
1.06
4
0.57
5
0.39
4
0.29
9
0.24
2
0.20
2
0.17
4
0.15
3
0.13
6
0.12
3
0.11
2
0.10
3
0.09
5
0.08
8
0.08
2
0.07
7
0.07
3
0.06
9
0.06
5
0.06
2
20 40 60 80 100 120 140 160 180 200 220 240 260 280 300 320 340 360 380 400
U-Value (W/m2.K), Insulation thickness (mm)
Initialinsulationcost
25 yearsdesign lifeNPV
40 yearsdesign lifeNPV
60 yearsdesign lifeNPV
Initi
al In
sula
tion
cost
( tho
usan
d £)
NPV
( th
ousa
nd £
)
Maximum NPV
(25 years service
life)
Maximum NPV
(40 years service
life)
Maximum NPV
(60 years service
life)
Basecase

-1000
-800
-600
-400
-200
0
200
0200400600800
100012001400160018002000
0.7 0.37 0.25 0.193 0.1565 0.1309 0.098 0.065 0.049 0.039
5 10 15 20 25 30 40 60 80 100U-Value (W/m2.K), Insulation thickness (mm)
Initialinsulation cost25 yearsdesignlife NPV40 yearsdesignlife NPV60 yearsdesignlife NPV
0
0
0Basecase
-1000
-800
-600
-400
-200
0
200
0
200
400
600
800
1000
1200
1400
1600
1800
0.7 0.37 0.25 0.193 0.1565 0.1309 0.098 0.065 0.049 0.039
5 10 15 20 25 30 40 60 80 100U-Value (W/m2.K), Insulation thickness (mm)
Initialinsulationcost25 yearsdesign lifeNPV40 yearsdesign lifeNPV60 yearsdesign lifeNPVIn
itial
Insu
latio
n co
st( t
hous
and
£)
NPV
( th
ousa
nd £
)
Basecase

CHAPTER 6: Insulation Specifications for Minimum Life-Cycle Costs
113
Figure 6.9 NPV results of 1000m2 warehouse insulated with VIP for 25, 40 and 60
years design life
5.3 Office buildings
As has been discussed in section 1 of this Chapter, increases in the thickness of
commercial building cladding systems, will adversely affect the ratio of net to gross
floor area calculated on a building perimeter basis. The impacts of adjustments in net to
gross floor areas that may be achieved by reducing the width of external walls are
significant in maximising the rental value of buildings.
Thermal performance of three insulation materials (two mainstream conventional
insulation materials and a novel solution) for a typical four-story office building in
‘central London’ has been modelled using dynamic thermal modelling software (IES-
VE). Simulation settings were assumed to be based on CIBSE 2008 guidance for office
buildings. Modelling assumptions are as presented in Chapter 4, Section 4.2.
It is believed that the rental income is becoming the key performance driver in the
central London office market (www.building.co.uk, 2012). Current rental values for
centrally located office accommodation in key areas of London (as an example location)
are given in Table 6.1 according to the property market report 2011.
-400
-350
-300
-250
-200
-150
-100
-50
0
50
0
100
200
300
400
500
600
700
800
900
0.7 0.37 0.25 0.193 0.1565 0.1309 0.098 0.065 0.049 0.039
5 10 15 20 25 30 40 60 80 100
U-Value (W/m2.K), Insulation thickness (mm)
Initialinsulationcost
25 yearsdesign lifeNPV
40 yearsdesign lifeNPV
60 yearsdesign lifeNPVIn
itial
Insu
latio
n co
st( t
hous
and
£)
NPV
( th
ousa
nd £
)
Basecase

CHAPTER 6: Insulation Specifications for Minimum Life-Cycle Costs
114
Table 6.2Typical rental values for office accommodation (property market report 2011)
Value of land for offices (£/m².yr)
London City 565
West end 860
Table 6.3 Office building specifications
Building specifications
Total floor area: 4 × 48 × 13.5 = 2592 m2
Total Perimeter length: 4 × (48 + 13.5) × 2 = 492 m
The NPV analysis for office buildings in this study takes into account the capital cost of
fabric energy efficiency improvements, the associated operational energy savings and
the additional rental income associated with the thinner external walls for 30 and 60
years design life scenarios. The NPV of the additional rental income from the
application of VIPs is compared with PUR and Mineral wool using the below
expression (Gorgolewski, 1995).
PV(C) = C. [1-(1+d)-n]/d
Where C is the rental gained as a result of the reduced external wall width.
The analysis also identifies the most cost effective insulation level assuming the
required levels of insulation in the Regulations as the basecase.
5.3.1 NPV results
Table 6.3 presents the additional rental income associated with using thin VIP panels in
comparison to investigated conventional insulation materials. Considerable economic
benefit for using VIPs is demonstrable. The lost rental value is such that even the high
price of VIPs will be fully recovered as a part of a greater saving.

CHAPTER 6: Insulation Specifications for Minimum Life-Cycle Costs
115
Table 6.4 The NPV of the additional rental income of VIP in comparison to conventional insulations
City/area U-Value
W/m2.K
30 Years Design life 60 Years Design life
Mineral
Wool PUR
Mineral
Wool PUR
London-
City
0.25 503 K 425 K 1.08 M 831 K
0.2 754 K 456 K 1.50 M 913 K
0.15 1 M 630 K 2.20 M 1.30 M
0.1 Not
achievable
Not
achievable 3.98 M 2.49 M
London-
West end
0.25 865 K 677 K 1.76 M 1.30 M
0.2 1.26 M 740 K 2.52 M 1.44 M
0.15 1.8 M 1.04 M 3.59 M 2.08 M
0.1 Not
achievable
Not
achievable 3.98 M 2.49 M
The greyed out cells are not achievable using conventional insulation materials as the
embodied CO2 associated with thicker panels exceeds the overall CO2 savings and a net
carbon disbenefit occurs (as presented in Chapter 5).
Improving the building fabric beyond the backstop U-values using conventional and
novel insulation materials however is not showing any financial benefit as the
operational energy savings cannot recover the increased rental loss (Figures 6.10 to
6.15).
Figure 6.10 NPV results of the office building insulated with PUR for 30 and 60 years
design life in London City
-1800-1600-1400-1200-1000
-800-600-400-200
0200400
15 25 40 55 70 85 100 115 125 140 155 170 185 200 215 225 240 255 270 285
0.71 0.55 0.41 0.35 0.27 0.2 0.18 0.17 0.15 0.14 0.13 0.12 0.11 0.11 0.1 0.1 0.09 0.09 0.08 0.08
Fina
ncia
l ben
efit
(£ K
)
Insulation thickness (mm) and U-values (W/m2.K)
30 yearsdesignlife
60 yearsdesignlife
Basecase

CHAPTER 6: Insulation Specifications for Minimum Life-Cycle Costs
116
Figure 6.11 NPV results of the office building insulated with PUR for 30 and 60 years
design life in London West-End
Figure 6.12 NPV results of the office building insulated with mineral wool for 30 and 60 years design life in London City
Figure 6.13 NPV results of the office building insulated with mineral wool for 30 and
60 years design life in London West End
-2700-2400-2100-1800-1500-1200
-900-600-300
0300600
15 25 40 55 70 85 100 115 125 140 155 170 185 200 215 225 240 255 270 285
0.71 0.55 0.41 0.35 0.27 0.2 0.18 0.17 0.15 0.14 0.13 0.12 0.11 0.11 0.1 0.1 0.09 0.09 0.08 0.08
Fina
ncia
l ben
efit
(£ K
)
Insulation thickness (mm) and U-values (W/m2.K)
30yearsdesignlife60yearsdesignlife
Basecase
-2400-2100-1800-1500-1200
-900-600-300
0300
15 25 40 55 70 85 100115125140155170185200215225240255270285300320330340350
0.820.670.530.350.320.280.250.240.210.20.180.170.160.150.140.130.130.120.110.110.1 0.1 0.1 0.10.09
Fina
ncia
l ben
efit
(£ K
)
Insulation thickness (mm) and U-values (W/m2.K)
30yearsdesignlife
60yearsdesignlife
Basecase
-3600-3200-2800-2400-2000-1600-1200
-800-400
0400800
15 25 40 55 70 85 100 115 125 140 155 170 185 200 215 225 240 255 270 285 300 320 330 340 350
0.820.670.530.350.320.280.250.240.21 0.2 0.180.170.160.150.140.130.130.120.110.11 0.1 0.1 0.1 0.1 0.09
Fina
ncia
l ben
efit
(£ K
)
Insulation thickness (mm) and U-values (W/m2.K)
30yearsdesignlife
60yearsdesignlife
Basecase

CHAPTER 6: Insulation Specifications for Minimum Life-Cycle Costs
117
Figure 6.14 NPV results of the office building insulated with VIP for 30 and 60 years design life in London City
Figure 6.15 NPV results of the office building insulated with VIP for 30 and 60 years design life in London West End
5.4 Residential buildings
Space heating accounts for 65% of the energy consumption in residential buildings in
the UK. Reducing heating load demands will inevitably require higher levels of fabric
energy efficiency.
According to the definition of zero carbon buildings until 2008, house owners were
required to reduce all CO2 emissions to zero through on-site solutions. Both ‘regulated’
emissions (from heating, cooling, ventilation and lighting) and ‘unregulated’ emissions
(other appliances) had to be taken into account. Various research have been undertaken
and it was recognised that building to this level of efficiency was not the most cost
-800
-700
-600
-500
-400
-300
-200
-100
0
100
3.5 7 9 11 15 18 21 26 30 37 45 52 60 67 75
0.6 0.4 0.35 0.28 0.21 0.18 0.16 0.14 0.12 0.1 0.08 0.07 0.06 0.05 0.05Fi
nanc
ial b
enef
it (£
K)
Insulation thickness (mm) and U-values (W/m2.K)
30 yearsdesignlife
60 yearsdesignlife
Basecase
-1100-1000
-900-800-700-600-500-400-300-200-100
0100
3.5 7 9 11 15 18 21 26 30 37 45 52 60 67 75
0.6 0.4 0.35 0.28 0.21 0.18 0.16 0.14 0.12 0.1 0.08 0.07 0.06 0.05 0.05
Fina
ncia
l ben
efit
(£ K
)
Insulation thickness (mm) and U-values (W/m2.K)
30yearsdesignlife60yearsdesignlife
Basecase

CHAPTER 6: Insulation Specifications for Minimum Life-Cycle Costs
118
effective approach for mainstream housing production in 2011. After a series of changes
in the definition of zero carbon homes, unregulated emissions were removed from the
definition. Recently however, in the latest definition of zero carbon new homes, the
fabric energy efficiency is required to be at a level that keeps the total energy
consumption associated with heating and cooling of buildings to maximum 46
kWh/m2/year (Zero carbon hub, 2013).
The following analysis aims to identify whether the most cost effective approach is to
simply comply with fabric thermal standards, or if increasing the thickness of insulation
beyond the backstop values would demonstrate financial benefit. The study is carried
out with and without considering the rental value losses/gains.
The rental values used in the analyses is as stated in Table 6.5.
Table 6. 5 Rental value (residential buildings)
Value of land for residential Buildings (£/m²/yr)
London Ealing 1320
Croydon 930
5.4.1 Interpretation of the NPV analyses
A similar rental value analysis as for commercial building cladding was carried out for
residential buildings and the results are presented in table 6.4. The lost rental value
associated with the thick external wall over the design life of a building is considerable
and is not easily recovered by the amount of energy savings associated with improved
thermal performance of the cladding.

CHAPTER 6: Insulation Specifications for Minimum Life-Cycle Costs
119
Table 6.6The NPV of the additional rental income of VIP in comparison to conventional insulations
City/area U-Value
W/m2.K
30 Years Design life 60 Years Design life
Mineral
Wool PUR
Mineral
Wool PUR
London-
Croydon
0.25 34,000 35,500 52,000 52,600
0.2 78,000 56,000 121,000 86,500
0.15 145,000 Not
achievable 226,000 167,000
0.1 273,000 Not
achievable 419,500 279,000
London-
Ealing
0.25 48,000 47,000 74,000 74,500
0.2 114,000 83,000 173,000 123,000
0.15 211,000 Not
achievable 325,000 241,000
0.1 394,000 Not
achievable 600,000 400,000
Note that the greyed out cells in Table 6.4 show that the stated U-values are not
achievable using PUR as the embodied CO2 associated with the insulation material
outweighs the operational CO2 savings associated with improved thermal performance
of the material (thicker panel) (refer to Chapter 5).
The following analysis assumes that the rental value loss associated with the
incremental increase of insulation thickness is negligible. This raises the question as to
what level of thermal insulation, the overall energy saving over buildings’ design life
can recover and pay back the initial cost of fabric thermal improvements (Figures 6.16
to 6.18).

CHAPTER 6: Insulation Specifications for Minimum Life-Cycle Costs
120
Figure 6.16 NPV results of the residential building insulated with mineral wool for 30
and 60 years design life in London- Croydon
Figure 6.17 NPV results of the residential building insulated with PUR for 30 and 60
years design life in London- Croydon
Figure 6.18 NPV results of the residential building insulated with VIP for 30 and 60
years design life in London- Croydon
-14000
-12000
-10000
-8000
-6000
-4000
-2000
0
2000
4000
15 25 40 55 70 85 100 115 125 140 155 170 185 200 215 225 240 255 270 285 300 325 350
0.96 0.75 0.57 0.45 0.38 0.35 0.28 0.250.2390.210.1980.180.1690.1580.1480.1420.1330.1260.12 0.110.1080.1010.094
Fina
ncia
l Ben
efit
(£)
Insulation thickness (mm) and U-values (W/m2.K)
30 yearsdesign life
60 yearsdesign life
Maximum NPV
(30 years service life)
Maximum NPV
(60 years service
life)
Basecase
-10000
-8000
-6000
-4000
-2000
0
2000
15 25 40 55 70 85 100 115 125 140 155 170 185 200 215 225 240 255 270 285
0.82 0.62 0.45 0.35 0.29 0.25 0.21 0.190.1780.160.1460.1340.1240.110.1080.1040.0970.0920.0870.083
Fina
ncia
l Ben
efit
(£)
Insulation thickness (mm) and U-values (W/m2.K)
30 yearsdesign life
60 yearsdesign lifeMaximum
NPV (60 years
service life)
Basecase
-20000
-18000
-16000
-14000
-12000
-10000
-8000
-6000
-4000
-2000
0
2000
4000
3.5 7 9 11 15 18 23 30 37 45 52 60 67 75
0.67 0.42 0.35 0.29 0.229 0.19 0.15 0.12 0.1 0.084 0.073 0.064 0.057 0.051
Fina
ncia
l Ben
efit
(£)
Insulation thickness (mm) and U-values (W/m2.K)
30 yearsdesign life
60 yearsdesign life
Maximum NPV
(30 years service
life)
Maximum NPV
(60 years service
life)
Basecase

CHAPTER 6: Insulation Specifications for Minimum Life-Cycle Costs
121
The financial benefit associated with improving the fabric energy efficiency beyond the
requirements of Building Regulations is reflected in Table 6.5 where the payback period
for investigated insulation materials for different design life scenarios is presented.
Table 6.7 Payback periods associated with initial cost of thermal performance improvements and energy savings
Fabric U-Value
W/m2.K
Payback period (years)
Mineral wool PUR VIP
London
0.25 15 33
Not within
reasonable
range of
payback
period
0.2 20 Not within
reasonable
range of
payback
period
0.15 26
0.1
Not within
reasonable
range of
payback period
Not taking into account the rental value loss, mineral wool insulation is still the best
material for insulating the residential building fabric as the lower cost of material can be
recovered in a shorter period of time by operational carbon savings.
5.5 Conclusions
The LCC analyses are supporting the case for being restricted to the thermal
performance requirements by building codes and regulations for all three types of
buildings investigated. The analyses are demonstrating that the high initial cost of
improvements cannot be recovered by associated operational energy savings. Buildings
with lower carbon emissions associated with better thermal performance (thicker panels
of conventional insulation materials) potentially do not result in a price premium to
cover the cost of improvements made to the ‘building fabric’ only.
In buildings with high rental values, the slimness of the cladding is a determinant factor
in applying construction solutions. On this basis energy savings associated with the
increased levels of insulation cannot recover initial cost of improvement and/or lost
rental value if thicker cladding had been used. Therefore, slim cladding systems using
products such as VIPs can be justified financially and environmentally and be a

CHAPTER 6: Insulation Specifications for Minimum Life-Cycle Costs
122
replacement for conventional insulation materials such as PUR and mineral wool. This
requires large scale economic commercialisation and subsequent price reduction for
VIPs or other novel insulation materials.
The analyses are also providing compelling evidence supporting the view that although
the ‘fabric first’ approach is essential towards achieving zero carbon performance, it is
not necessarily the most cost effective approach. On-site low and zero carbon solutions
(such as heat and electricity generating technologies) should be adopted to contribute to
carbon savings in a more cost effective way.
It should also be stated that adding to the thickness of insulation and consequently
decreased operational energy can affect the required capacity of the heating system i.e.,
lower heat demand requires smaller heating system. This can improve the NPV of the
highly insulated cases but as it could cause further uncertainties in the analysis such as
gathering cost data from different sources for the new heating system and different
associated complexities, it has not been taken into account in this study.

123
6 CHAPTER 7: On-site low and zero carbon technologies
This chapter determines the maximum level of carbon (combined operational and
embodied) reductions achievable through a combination of fabric energy efficiency and
on-site low and zero carbon solutions. This will include the application of the developed
methodology to on-site electricity and heat generating technologies (specifically
Photovoltaics and Transpired Solar Collectors). The analyses will include industrial and
office buildings as exemplar building types for application of the methodology. PUR
and mineral wool as mainstream conventional insulation materials have been used for
the analysis. A 25 and 30 year service life have been assumed for industrial and office
buildings respectively.
6.1 Introduction
According to the analyses carried out in Chapter 5, the maximum CO2 saving associated
with improving the building fabric (only) is limited to a maximum of 10% for non-
domestic buildings (Table 7.1).
Table 7.1 Maximum CO2 savings associated with improving the building fabric U-value
Building type Max CO2 savings %
U-Value W/m2K Thickness (mm)
PUR Retail shed 6.3 0.21 115 Warehouse 7.7 0.1 240 Office 0.5 0.21 115
Mineral wool
Retail shed 9.4 0.2 180 Warehouse 9.97 0.1 360 Office 1 0.2 180
VIP Retail shed 9.75 0.15 25 Warehouse 10.05 0.1 40 Office 1.15 0.15 25
Achieving low and zero carbon performance therefore requires on-site low and zero
carbon technologies to contribute to CO2 savings. To achieve an optimum level of

CHAPTER 7: On-site low and zero carbon technologies
124
carbon reduction cost effectively through a combination of fabric energy efficiency and
onsite low and zero carbon energy, PVs and TSCs as on-site electricity and heat
generating technologies have been selected to be analysed.
6.2 Photovoltaic cells
The government’s support policies encourage development of renewable technologies at
all scales – domestic, commercial and industrial. A Roadmap was set out with defined
principles, which form the basis of the future strategy for solar PV. According to these
principles, support for solar PV should ensure that it has a role alongside other energy
generation technologies in delivering carbon reductions, energy security and
affordability for consumers.
Between May 2006 and May 2010, £45 billion has been allocated to PVs in the UK
which was about 51% of the total money allocated to all renewable technologies
(EvoEnergy Ltd, 2012). Consequently, an exceptional growth in solar electricity has
been achieved over recent years with installed capacity increasing from 94 MW at the
end of 2010 to 2,413 MW at the end of June 2013 (DECC, 2013). Solar PV is now
known as a mainstream renewable energy technology and is playing a vital role in the
UK Government’s policies to achieve the 2020 renewable energy targets.
Between 2011 and 2013 costs of solar PV have fallen by almost 50%. This price cut and
the Feed in Tariffs10 (see generation/export tariffs below) scheme are key factors
initiating solar capacity to increase dramatically to 2.4GW capacity installed (DECC,
2013).
Monocrystalline PV modules are selected for this research. The embodied CO2 of PV
panels are available from ICE database and are assumed to be 242 kgCO2/m2.
10 Feed-In Tariffs Scheme was introduced first in 2010 as UK government’s main financial incentive to encourage uptake of renewable electricity-generating technologies such as PVs (http://www.energysavingtrust.org.uk).

CHAPTER 7: On-site low and zero carbon technologies
125
6.2.1 Technology options (packages)
In order to determine the cost effectiveness of using PVs for delivering maximum CO2
savings, a group of technology options (packages) are defined and discussed in the
following Section.
Packages associated with PVs are based on ‘current’ and ‘likely future’ Feed in Tariff
(FiT) scenarios.
The first scenario is the ‘current FiT’ scheme which consists two main principles:
• Generation tariff: the energy supplier pays a fixed rate for each kWh of
electricity individual buildings generate (14 p/KWh at the time of the research).
• Export tariff: Buildings are also entitled to get a further payment with a fixed
rate per kWh from the energy supplier for each unit of electricity they export
back to the grid, so that the grid can benefit from the generated but not used
electricity from the households (4.5 p/KWh at the time of the research). The
exported electricity at the moment is assumed to be 50% of the total generated
electricity.
The second scenario is the ‘likely future scenario’ which assumes that there will be no
payment on the total generated electricity (generation tariff) and the payments on
exported electricity will be limited to the actual exported amount. It is believed that at
some stage, smart meters will be installed to measure what is actually exported to the
grid. Two different payment rates have been selected as the most likely future FiT
scenarios and are presented as options 1 and 2; 10 and 4.5 p/KWh export rate
respectively.
The area of PV installed is assumed to provide the equivalent amount of electricity to 25
(I), 50 (II), 75(III) and 100(IV) % of the buildings electricity demand in all packages.
In the case of supplying 100% of building’s total annual electricity demand by PVs, it
should be noted that a significant amount of electricity is generated in the time of the

CHAPTER 7: On-site low and zero carbon technologies
126
year which is not required (normally in spring/summer). Conversely the amount of
generated electricity in autumn/winter can be significantly below the required levels.
Thus a net electricity generation of the annual required electricity load is taken as 100%
supply case.
The selected technology packages (Table 7.2) are as follows:
• Package A is defined as: PV (current FiT) plus the notional building fabric
specification and taking full account of energy efficient services and
lighting.
• Package B is defined as: PV (current FiT) plus the improved building fabric
down to 0.1 W/m2K U-value and taking full account of energy efficient
services and lighting.
• Package C is defined as: PV (likely future FiT (option 1)) plus the notional
building fabric specification and taking full account of energy efficient
services and lighting.
• Package D is defined as: PV (likely future FiT (option 1)) plus the improved
building fabric down to 0.1 W/m2K U-value and taking full account of
energy efficient services and lighting.
• Package E is defined as: PV (likely future FiT (option 2)) plus the notional
building fabric specification and taking full account of energy efficient
services and lighting.
• Package F is defined as: PV (likely future FiT (option 2)) plus the improved
building fabric down to 0.1 W/m2K U-value and taking full account of
energy efficient services and lighting.

CHAPTER 7: On-site low and zero carbon technologies
127
Table 7.2 Investigated packages in summary
Package Current FiT Future FiT option 1 Future FiT option 2
Notional Building Fabric A C E Improved fabric down to 0.1 W/m2.K B D F
The above packages have been applied to three building types: distribution warehouses,
retail sheds and offices. According to Table 7.3 the most cost effective and carbon
efficient packages have been calculated through application of the methodology. 100%
electricity demand supply demonstrates the maximum cost benefit amongst investigated
packages. These packages are the basis of more sophisticated analyses in this chapter
(Refer to Appendix B for detailed tables/calculations).
Table 7.3 NPV and CO2 savings associated with selected technology packages
PV+ Insulation assessed packages (25 years service life)
Warehouse Retail shed Office
Packages NPV (£ K) CO2 savings (%) NPV (£ K) CO2 savings
(%) NPV (£ K) CO2 savings (%)
A(I) 63.50 8.70 146.10 17.61 132.60 19.75
A(II) 116.50 18.26 267.10 35.08 252.00 39.71
A(III) 163.10 27.43 372.10 52.30 352.40 59.57
A(IV) 207.10 36.61 471.70 69.85 443.00 79.38
B(I) 61.00 15.78 132.2 20.28 133.00 21.22
B(II) 114.00 25.33 253.30 37.74 253.00 41.18
B(III) 160.00 34.50 358.30 54.96 353.00 61.03
B(IV) 212.77 43.69 472.00 72.52 444.00 80.85
C(I) 21.20 8.70 50.30 17.61 47.20 19.75
C(II) 32.50 18.26 75.20 35.08 80.30 39.71
C(III) 36.80 27.43 84.50 52.30 94.80 59.57
C(IV) 38.50 36.61 88.40 69.85 100.40 79.38 E 70.40 36.61 161.00 69.85 150.2 79.38
D(I) 18.70 15.78 36.50 20.28 48.00 21.22
D(II) 30.00 25.33 61.40 37.74 81.30 41.18
D(III) 34.30 34.50 70.60 54.96 95.80 61.03
D(IV) 44.00 43.69 88.62 72.52 71.80 80.85 F 76.10 43.69 161.30 72.52 150.00 80.85
Opt U-Value 0.15-0.21 0.15-0.21 0.18-0.26

CHAPTER 7: On-site low and zero carbon technologies
128
6.2.1.1 Distribution warehouses
Previously in chapter 5, it was demonstrated that in a distribution warehouse, mineral
wool insulation was limited to 330 mm thick panels as the amount of embodied CO2
associated with the insulation material could exceed the operational CO2 savings. The
operational CO2 demand from the grid was reduced by the electricity generated by PV
panels. This consequently shifts the carbon disbenefit limits and continuous carbon
benefit is demonstrated down to 0.1 W/m2.K U-value.
Three financial scenarios have been investigated for a 3000m2 distribution warehouse.
According to Figure 7.1, increasing the thickness of insulation in order to decrease the
amount of heat loss through the building fabric, leads to high capital cost which will not
be recovered from savings in operational energy within 25 years of building service life.
The most cost effective fabric specification U-value in this case for roof is 0.15 W/m2.K
and for wall is 0.21 W/m2.K.
Within 5% of financial benefit, another 6% CO2 can be saved by improving the building
fabric from 0.15-0.21 W/m2.K to 0.1-0.14 W/m2.K. The analysis investigates whether
improvements in building fabric thermal performance is the most cost effective
approach towards achieving the further CO2 saving.
Furthermore, mineral wool can be produced to any thickness (if necessary in multiple
layers) but over-sizing in mineral wool panels causes significant engineering difficulties
(including extreme eccentricities in spacer systems specifically on walls and inclined
roofs). This will increase the capital cost of the construction even further.
Also, the payback period associated with improving the thermal performance of
building fabric can be increased significantly due to very high capital cost of the
improvement. In this case, the payback period increases from 12 to 17 years.

CHAPTER 7: On-site low and zero carbon technologies
129
Figure7.1 NPV and CO2 savings associated with ‘PV+ mineral wool Insulation’
package for distribution warehouse (NB: Notional Building) According to the simulated distribution warehouse in chapter 5, PUR insulation is
limited to 185 mm thick panels (due to embodied CO2 issues). The reduction in the
operational CO2 demand from grid could not recover the high embodied CO2 associated
with PUR insulation and PV panels after 0.11 W/m2.K roof U-Value and 0.15 W/m2.K
wall U-value. Consequently, there will be a reduction in the amount of CO2 saving
beyond this point.
In terms of financial scenarios that have been investigated for the 3000m2 distribution
warehouse, according to Figure 7.2, adding to the thickness of insulation leads to high
capital cost of improvement. This increase will be recovered from savings in operational
energy up to 0.15 W/m2.K roof U-Value and 0.21 W/m2.K wall U-value within 25 years
of building service life. Beyond this point, there will be a reduction in financial benefits.
The most cost effective fabric specification U-value in this case for roof is 0.15 W/m2.K
and for wall is 0.21 W/m2.K.
Within 3% of financial benefit, another 2% CO2 can be saved by improving the building
fabric from 0.15-0.21 W/m2.K to 0.11-0.154 W/m2.K. Similar to the previous case,
improvements in building fabric thermal performance is not proved to be the most cost
effective approach towards achieving the further CO2 savings.
0
5
10
15
20
25
30
35
40
45
50
-50
0
50
100
150
200
250
PV+Current FiT NPV PV+future FiT option (1) NPV PV+future FiT option (2) NPV CO2 savings
Distribution Warehouse - CO2 savings /NPV (PV+ Insulation) Packages (Mineral wool)
CO2
Savi
ngs
(%)
NPV
(Tho
usan
d £)
roof-wall U-Value (W/m2.K)
Maximum financial benefit
Maximum CO2 saving

CHAPTER 7: On-site low and zero carbon technologies
130
Beyond approximately 170mm, the chemical reaction of foam expansion in PUR foam
is slow and accordingly more difficult to control. At present, the maximum thickness of
PUR that is possible to obtain appears to be around 200mm with U-value of 0.125
W/m2.K (170mm being more common).
Furthermore, the payback period in this case increases from 13 years to 18 years.
Figure 7.2 NPV and CO2 savings associated with ‘PV+ PUR Insulation’ package for distribution warehouse (NB: Notional Building)
6.2.1.2 Retail sheds
According to the simulated Retail shed in Chapter 5, mineral wool insulation is limited
to 200mm thick panels on grounds of total carbon efficiency. The reduction in the
operational energy demand from the grid can recover the embodied CO2 associated with
mineral wool insulation and PV panels down to 0.1 W/m2.K wall U-value. High
embodied CO2 of the building fabric outweighs CO2 savings associated with lower
operational energy demand down to the stated U-Value. Therefore, there is no point in
going beyond the Notional Building fabric U-values as there will be a maximum of 1%
carbon saving in fabric improvements.
33
34
35
36
37
38
39
40
41
42
0
50
100
150
200
250
CO2 s
avin
gs (%
)
NPV
(Tho
usan
d £)
roof-wall U-Value (W/m2.K)
Distribution Warehouse - CO2 savings /NPV (PV+ Insulation) Packages (PUR) PV+Current FiT PV+Future FiT (option 1)
PV+Future FiT (option 2) CO2 savings
Maximum financial benefit
Maximum CO2 saving

CHAPTER 7: On-site low and zero carbon technologies
131
In terms of financial scenarios that have been investigated for the 3000m2 retail shed,
according to Figure 7.3, adding to the thickness of insulation leads to a flat line in the
graph meaning that no financial benefit in improving the building fabric is expected as
the capital cost will not be recovered from savings in operational energy within 25 years
of building service life.
Negligible financial benefit coupled with only 1% further CO2 saving suggest that
highly insulated building fabric for investigated type and size of building is neither cost
effective nor carbon efficient.
Moreover, the payback period associated with improving the thermal performance of
building fabric in this case increases from 15 years to 21 years.
Figure 7.3 NPV and CO2 savings associated with ‘PV+ mineral wool Insulation’ package for retail shed (NB: Notional Building)
Results from the simulated retail shed in Chapter 5 shows that PUR insulation is limited
to 115 mm thick panel in terms of carbon efficiency. Even with the reduction in the
operational CO2 demand from grid, the high embodied CO2 associated with PUR
insulation and PV panels cannot be recovered for U-values lower than 0.19 W/m2.K
wall and 0.13 W/m2.K roof U-values.
20
30
40
50
60
70
80
0
50
100
150
200
250
300
350
400
450
500
CO2 s
avin
gs (%
)
NPV
(tho
usan
d £)
roof-wall U-Value (W/m2.K)
Retail shed- CO2 savings/NPV (PV+ Insulation) Mineral wool PV+Current FiT NPV PV+future FiT option (1) NPVPV+future FiT option (2) NPV CO2 savings
Maximum financial benefit Maximum CO2 saving

CHAPTER 7: On-site low and zero carbon technologies
132
Regarding the cost effectiveness analyses that have been carried out for the 3000m2
retail shed (Figure 7.4), adding to the thickness of insulation leads to a downward line in
the graph meaning that the capital cost of improvements cannot be recovered by the
operational carbon savings through the lifetime of the building. No financial benefit
coupled with only 1.5% further CO2 saving suggests no benefit for insulating the
building beyond the Notional Building fabric specifications for the studied type and size
of building.
In addition, the payback period associated with improving the thermal performance of
building fabric in this case increases from 16 years to 22 years.
Figure 7.4 NPV and CO2 savings associated with ‘PV+ PUR Insulation’ package for retail shed (NB: Notional Building)
6.2.1.3 Office buildings
According to the simulated Office building in Chapter 5, beyond 200 mm thick panels
the amount of embodied CO2 associated with the insulation material outweighs the
operational CO2 savings for mineral wool insulation. Savings associated with
operational CO2 reduction from the grid however, almost offsets the high embodied
66.00
66.50
67.00
67.50
68.00
68.50
69.00
69.50
70.00
70.50
0
50
100
150
200
250
300
350
400
450
500
CO2 s
avin
gs (%
)
NPV
(tho
usan
d £)
roof-wall U-Value (W/m2.K)
Retail shed - CO2 savings/NPV (PV+ Insulation) PUR PV+Current FiT PV+Future FiT (option 1)PV+Future FiT (option 2) CO2 savings

CHAPTER 7: On-site low and zero carbon technologies
133
CO2 of the building fabric down to 0.11 W/m2.K roof U-Value and 0.15 W/m2.K wall
U-value.
The embodied CO2 associated with mineral wool insulation and PV panels cause carbon
disbenefit below 0.15 W/m2.K wall U-value. The maximum CO2 saving associated with
improving the building fabric is only 1%.
In terms of financial scenarios that have been investigated, according to figure 7.5,
adding to the thickness of insulation leads to a flat line in the graph. This suggests that,
beyond the Notional Building fabric, the high capital cost of improvement recovered
through savings associated with operational carbon within 25 years of building service
life. Negligible financial benefit coupled with only 1% further CO2 saving suggests that
a highly insulated building fabric for the investigated type and size of building is not
recommended.
Figure 7.5 NPV and CO2 savings associated with ‘PV+ mineral wool Insulation’ package for offices (NB: Notional Building)
The simulation results from Chapter 5 shows that beyond 140 mm thick panels, the
amount of embodied CO2 of the insulation material causes a carbon disbenefit for PUR
insulation. The reduction in the operational energy demand from grid cannot recover the
high embodied CO2 associated with insulation materials and PV panels beyond Notional
78.5
79.0
79.5
80.0
80.5
81.0
81.5
0
50
100
150
200
250
300
350
400
450
500
CO2 s
avin
gs (%
)
NPV
(tho
usan
d £)
roof-wall U-Value (W/m2.K)
Office - CO2 savings/NPV (PV+Insulation) Mineral wool PV+Current FiT PV+future FiT option (1)PV+future FiT option (2) CO2 savings

CHAPTER 7: On-site low and zero carbon technologies
134
Building U-value specifications. The maximum CO2 saving associated with improving
the building fabric is circa 0.8%.
Also according to Figure 7.6, adding to the thickness of insulation leads to a downward
cost line in the graph. This suggests that no financial benefit is anticipated for
improving the building fabric beyond Notional Building fabric specifications.
Financial disbenefit coupled with only 0.8% further CO2 saving suggests no
justification for insulating the building fabric beyond the Notional Building fabric for
studied type and size of building.
Figure 7.6 NPV and CO2 savings associated with ‘PV+ PUR Insulation’ package for offices (NB: Notional Building)
Cost analysis of office buildings taking into account the rental value loss
As it has been previously discussed in Chapter 5, increasing the thickness of
commercial building cladding systems adversely affects the ratio of net to gross floor
area calculated on a building perimeter basis. The impacts of reductions in net to gross
floor areas (caused by increased width of external walls) are significant on the rental
value of buildings.
76
76.5
77
77.5
78
78.5
79
79.5
80
0
50
100
150
200
250
300
350
400
450
500
CO2 s
avin
gs (
%)
NPV
(tho
usan
d £)
roof-wall U-Value (W/m2.K)
Office - CO2 savings/NPV (PV+Insulation) PUR PV+current FiT PV+future FiT option (1)PV+future FiT option (2) CO2 savings

CHAPTER 7: On-site low and zero carbon technologies
135
According to Figure 7.7, increased thickness of the external wall does not lead to
considerable CO2 savings, nor results in any financial benefits over 25 years design life
of the building.
Figure 7.7 NPV and CO2 savings associated with ‘PV+ mineral wool Insulation’
package for offices including rental value loss
According to Figure 7.8, improving the building fabric thermal performance
consequently leads to thick cladding panels using conventional insulation materials.
This results in a significant loss in the NPV over 25 years design life of the building.
Figure 7.8 NPV and CO2 savings associated with ‘PV+ PUR Insulation’ package for
offices including rental value loss
60
65
70
75
80
85
-1000
-800
-600
-400
-200
0
200
400
600
CO2 s
avin
gs (%
)
NPV
(tho
usan
d £)
roof-wall U-Value (W/m2.K)
Offices CO2 savings/NPV (PV+Insulation) Mineral wool PV+Current FiT NPV PV+future FiT option (1) NPVPV+future FiT option (2) NPV CO2 savings
60
65
70
75
80
85
-800
-600
-400
-200
0
200
400
600CO
2 sav
ings
(%)
NPV
(tho
usan
d £)
roof-wall U-Value (W/m2.K)
Offices CO2 savings/NPV (PV+Insulation) PUR PV+Current FiT PV+future FiT option (1)
PV+future FiT option (2) CO2 savings

CHAPTER 7: On-site low and zero carbon technologies
136
6.3 Summarising ‘PV + building fabric’ packages
The previous analyses present the maximum CO2 savings associated with improving the
building fabric packages plus application of PV panels in the most cost effective way.
All of the measures investigated fall short of zero carbon performance.
None of the cases investigated show significant financial benefit for improving the
building fabric specifications beyond the Notional Building fabric specification. In
terms of CO2 savings, the total savings relative to application of PV panels is different
for each building. The carbon savings for warehouses, retail sheds and offices are 35,
60.5 and 79 % respectively excluding the effect of improved fabric on CO2 savings. The
aggregate CO2 saving is presented in Table 7.4.
Table 7.4 CO2 savings associated with different packages and building types Building
type Maximum CO2 savings – ‘Insulation’ packages %
Maximum CO2 savings – ‘PV + Insulation’ packages %
Warehouse 9.97 45 Retail shed 9.43 70 Office 1 80
Hence, in order to achieve the zero carbon performance, additional on-site zero carbon
technologies are required to be coupled with the investigated packages. Transpired Solar
Collectors (TSC) as a heat generating technology has been added to the ‘technology
packages’.
6.4 Transpired Solar Collectors
The TSC was originally developed in Canada for agricultural applications (specifically
crop and process drying) and has been used successfully in the USA and Canada over
the past 20 years (Heinrich, 2007). Agricultural operators consume significant quantities
of energy which forms a substantial proportion of their total operational and capital
costs. Rising energy prices and the considerable pressure on agricultural incomes
emphasized the case for developing technologies to maximise the benefit from solar
energy for the agricultural sector.

CHAPTER 7: On-site low and zero carbon technologies
137
Convincing performance of TSCs in agricultural applications encouraged building
manufacturers to apply the technology to other building types such as industrial
warehouses and retail sheds. Monitored data from the US Department of Energy shows
that a reduction of $10–$30 per m2 of collector wall in annual heating costs can be
achieved in the US, by preheating the incoming ventilation air using solar energy by as
much as 30°C (DOE, 2000).
In the UK the first TSC installation goes back to year 2006 where it was installed on a
single-storey industrial building and provided around 20% of the building’s heating
demand in the first year. Figures released from the Department of Energy and Climate
Change (DECC) suggest that space heating accounts for approximately 40% of the
UK’s non-transport energy consumption. This raises a compelling case for development
of renewable technologies generating heat from solar radiation. It is expected that the
success of TSCs in the USA and Canada can potentially be replicated in the UK (Hall et
al., 2011).
TSCs are specially perforated steel collector panels installed about 75mm from a south
facing wall, creating an air cavity. The metal cladding (steel sheet) is heated by solar
radiation. A ventilation fan creates negative pressure in the air cavity, drawing the solar
heated air through the panel perforations. The heated air is then ducted into the building
via a connection to the HVAC intake (Figure 7.9).
Figure 7.9 TSC performance diagram (source: Solarwall)

CHAPTER 7: On-site low and zero carbon technologies
138
TSCs are mainly known as preheating air systems. By preheating the ventilating air
with solar energy, a substantial load from buildings conventional heating system can be
removed, saving energy and money. Research carried out at Oxford Brookes University
for 95 days during the winter of 2010/2011 show that under typical operating
conditions, TSCs heated the intake air by 10–15˚C on clear-skied days (Hall et al.,
2014). TSCs may not be able to preheat the ventilation air up to the required indoor air
temperature on cloudy days but it still can provide useful energy to reduce utility bills
(DOE, 1998).
TSCs also save energy in other ways such as recapturing the heat loss through the
building fabric and venting it back to the interior space. Also by introducing the air
through ceiling mounted ducts, the system eliminates the wasteful air stratification.
Stratified temperature can cause a high infiltration loss in addition to conduction loss
through the roof construction. In a high ceiling building, additional fans are often
required to de-stratify the air but using TSCs, the auxiliary energy associated with the
fan power can be eliminated from total energy consumption of the building.
Figure 7.10 compares floor to ceiling temperature difference for a typical distribution
warehouse with and without de-stratification fans. There is a 6 degree difference which
can negatively contribute to the overall heat loss through infiltration and conduction
loss through the roof construction.
Figure 7.10 Buildings with (left) and without (right) de-stratification fans (or TSCs)

CHAPTER 7: On-site low and zero carbon technologies
139
6.4.1 Technology options (packages) including TSCs
The area of TSC installed is assumed to provide the equivalent amount of heat to 25 (I),
50 (II) and 75(III) % of the buildings heat demand in all packages. Providing 100% of
the heat demand by TSCs is practically unachievable as the majority of the heat
generated by TSC is in the summer when heating demand is at its lowest. The generated
heat in this period can be significantly above the required level, which is not taken into
account as delivered heat.
Two mainstream conventional insulation materials, mineral wool and PUR, have been
used for the analyses.
The selected technology packages (Table 7.5) are as follows:
• Package G is defined as: TSC plus the notional building fabric
specification and taking full account of energy efficient services and
lighting.
• Package H is defined as: TSC plus the improved building fabric down to
0.1 W/m2K U-value and taking full account of energy efficient services
and lighting.
Table 7.5 Investigated packages
Investigated packages
Fabric percentage of the heat supplied by TSC
% 25 50 75
Notional Building fabric G(I) G(II) G(III) Improved insulation H(I) H(II) H(III)
6.4.2 Application of TSCs to the investigated buildings
Package G: TSC + Notional Building fabric + energy efficient services and lighting

CHAPTER 7: On-site low and zero carbon technologies
140
The results associated with applying TSC to industrial and office buildings are
demonstrated in Figures 7.11 and 7.12. All the investigated packages are insulated to
Notional Building fabric specifications. 25, 50 and 75% of the annual heat demand of
the building is supplied with application of TSCs (respectively G(I), G(II) and G(III)).
Figure 7.11 NPV and CO2 savings associated with package G, mineral wool
Figure 7.12 NPV and CO2 savings associated with package G, PUR
The maximum CO2 saving relative to application of TSCs is 36.5% which occurs in
warehouse buildings. The relative figure for office buildings reduces to 10.92% saving
due to the smaller annual heat demand (high internal gain from lighting, appliances and
occupants in offices leads to lower annual heat demand) (Tables 7.6 and 7.7).
-90
-70
-50
-30
-10
10
30
-90
-70
-50
-30
-10
10
30
G(I) G(II) G(III)
NPV
(tho
usan
d £)
CO2 s
avin
gs (%
)
Packages
Package G, CO2 savings/NPV (Mineral wool) warehouse Opt. CO2 savings Retail shed Opt. CO2 savings Offices Opt. CO2 savings
warehouse NPV Retail shed NPV Offices NPV
-90
-70
-50
-30
-10
10
30
-90
-70
-50
-30
-10
10
30
G(I) G(II) G(III)Packages
Package G, CO2 savings/NPV (PUR) warehouse Opt. CO2 savings Retail shed Opt. CO2 savings Offices Opt. CO2 savings
warehouse NPV Retail shed NPV Offices NPV
NPV
(Tho
usan
d £)
CO2 s
avin
gs (%
)

CHAPTER 7: On-site low and zero carbon technologies
141
Table 7.6 NPV and CO2 savings associated with package G and different building types, mineral wool
warehouse Retail shed Offices
NPV (£ K) Opt. CO2 savings (%) NPV (£ K)
Opt. CO2 savings
(%) NPV (£ K)
Opt. CO2 savings
(%) G(I) -3.7 12.51 2 6.6 -2.6 3.78 G(II) -37 24.62 -8 11.97 -12 7.46 G(III) -82 36.59 -24 17.82 -37 10.92
Table 7.7 NPV and CO2 savings associated with package G and different building types, PUR
warehouse Retail shed Offices
NPV (£ K) Opt. CO2 savings (%) NPV (£ K)
Opt. CO2 savings
(%) NPV (£ K)
Opt. CO2 savings
(%) G(I) -3.7 12.27 2.06 4.45 -2.59 3.74 G(II) -37.4 24.15 -8.62 10.36 -12.68 7.38 G(III) -82.35 35.88 -24.5 16.21 -37.77 10.80
Package H: TSC + improved fabric + energy efficient services and lighting
The optimum CO2 saving and cost effectiveness results associated with applying TSC
plus improving the building fabric U-values are demonstrated in Figures 7.13 and 7.14.
All the investigated packages are insulated down to 0.1 W/m2.K U-values. 25, 50 and
75% of the annual heat demand of the building is supplied with application of TSCs
(respectively H(I), H(II) and H(III))
Figure 7.13 NPV and CO2 savings associated with package H, mineral wool
-90
-70
-50
-30
-10
10
30
-90
-70
-50
-30
-10
10
30
H(I) H(II) H(III)
NPV
(tho
usan
d £)
CO2 s
avin
gs (%
)
Packages
Package H, CO2 savings/NPV (Mineral wool) warehouse Opt. CO2 savings (%) Retail shed Opt. CO2 savings (%)Offices Opt. CO2 savings (%) warehouse NPV (Thousand £)Retail shed NPV (Thousand £) Offices NPV (Thousand £)

CHAPTER 7: On-site low and zero carbon technologies
142
Figure 7.14 NPV and CO2 savings associated with package H, PUR
The maximum CO2 saving as a result of application of TSCs is 38% in warehouse
buildings. This figure drops to 11% saving in offices, due to the lower annual heat
demand (Tables 7.8 and 7.9).
Table 7.8 NPV and CO2 savings associated with package H and different building types, mineral wool
warehouse Retail shed Offices
NPV (£ K) Opt. CO2 savings (%) NPV (£ K)
Opt. CO2 savings
(%) NPV (£ K)
Opt. CO2 savings
(%) H(I) -3 16.5 -5 7.25 -7.5 4.5 H(II) -35 26.5 -5.6 12.43 -7 7.94 H(III) -73 38 -22 17.86 -36 11
Table 7.9 NPV and CO2 savings associated with package H and different building types, PUR
warehouse Retail shed Offices
NPV (£ K) Opt. CO2 savings (%) NPV (£ K)
Opt. CO2 savings
(%) NPV (£ K)
Opt. CO2 savings
(%) H(I) -0.18 14.98 2.06 4.98 -2.59 4.21 H(II) -32.4 24.92 -7.6 10.43 -12.05 7.55 H(III) -74.8 37.2 -23.4 16.21 -37.4 10.8
-90
-70
-50
-30
-10
10
30
-90
-70
-50
-30
-10
10
30
H(I) H(II) H(III)
CO2 s
avin
gs (%
)
Packages
Package H, CO2 savings/NPV (PUR)
warehouse Opt. CO2 savings Retail shed Opt. CO2 savings Offices Opt. CO2 savings
warehouse NPV Retail shed NPV Offices NPV
NPV
(Tho
usan
d £)

CHAPTER 7: On-site low and zero carbon technologies
143
Financially, TSCs with current capital cost are not showing a reasonable payback period
and in most cases the capital cost of installing TSCs cannot be recovered through 25
years of buildings service life.
There are debates on the method of calculating the cost of TSCs. The first view claims
that as TSCs are preheating air systems and cannot provide the required heat demand in
peak times of the year, a main heating system should be installed in addition to TSCs so
the costs associated with the ducting etc should be taken into account in the price of
TSCs. The second view argues that TSCs are additional renewable systems that add a
certain amount towards the total cost of the heating system of buildings. Therefore only
the cost of collectors should be taken into account as the price of TSCs.
In order to take both views into account, a range of prices have been defined and a
payback period analysis has been carried out for TSCs. Results are associated with
mineral wool insulation material. Mineral wool insulation applied to Package H(II) is
used as an example in payback period study (Figure 7.15).
Figure 7.15 Payback period associated with TSC and mineral wool insulation for
distribution warehouses
05
10152025303540455055
0.18-0.26 0.17-0.24 0.15-0.21 0.13-0.19 0.12-0.17 0.11-0.15 0.08-0.11 0.07-0.10
Payb
ack
perio
d (y
ears
)
roof-wall U-Value (W/m2.K)
TSC and Mineral wool - Distribution Warehouse - 50 % heat supplied by TSC
50 £/m2 75 £/m2 100 £/m2 125 £/m2 150 £/m2

CHAPTER 7: On-site low and zero carbon technologies
144
Figure 7.16 Payback period associated with TSC and mineral wool insulation for retail
sheds
Figure 7.17 Payback period associated with TSC and mineral wool insulation for
offices
In all studied cases, adding to the thickness of insulation irrespective to the price of TSC
caused a slight upward line in the payback period graph beyond 0.15 W/m2.K roof U-
Value and 0.21 W/m2.K wall U-Value. The steeply sloping line starting from 0.11
W/m2.K roof U-Value and 0.15 W/m2.K wall U-Value also demonstrates no financial
benefit beyond this point.
05
101520253035404550556065
0.18-0.26 0.17-0.24 0.15-0.21 0.13-0.19 0.12-0.17 0.11-0.15 0.08-0.11 0.07-0.10
Payb
ack
perio
d (y
ears
)
roof-wall U-Value (W/m2.K)
TSC and Mineral wool - Retail shed- 50 % heat supplied by TSC 50 £/m2 75 £/m2 100 £/m2 125 £/m2 150 £/m2
0
20
40
60
80
100
0.18-0.26 0.17-0.24 0.15-0.21 0.13-0.19 0.12-0.17 0.11-0.15 0.08-0.11 0.07-0.10
Payb
ack
perio
d (y
ears
)
roof-wall U-Value (W/m2.K)
TSC and Mineral wool - Office- 50 % heat supplied by TSC 50 £/m2 75 £/m2 100 £/m2 125 £/m2 150 £/m2

CHAPTER 7: On-site low and zero carbon technologies
145
6.5 ‘PV + TSC + Insulation’ packages
6.5.1 Technology options (packages)
All of the measures discussed in the previous sections fall short of zero carbon
performance as demonstrated in Table 7.10.
Table 7.10 Maximum CO2 savings achievable with the investigated packages for analysed building types
Building type
Max CO2 savings by 'PV+Insulation'
Packages %
Max CO2 savings by 'TSC+Insulation'
Packages %
Max CO2 savings by 'Insulation' Packages
% Warehouse 45 38 9.97 Retail shed 70 17.8 9.43 Office 80 11 1
In order to achieve the zero carbon performance, ‘PV + TSC + Insulation’ Packages
have been combined (Table 7.11). The selected technology packages are as follows:
• Package K is defined as; TSC + PV (current FiT) + the improved building
fabric and taking full account of energy efficient services and lightings.
• Package M is defined as; TSC + PV (future FiT) + the improved building
fabric and taking full account of energy efficient services and lightings.
Table 7.11 Investigated packages including current and future FiT scenarios
Investigated packages (current FiT)
Fabric percentage of heat and electricity supplied by renewables % 25 50 75 100 % PV - 75% TSC
Insulation K(I) K(II) K(III) K(IV) Investigated packages (future FiT)
Fabric percentage of heat and electricity supplied by renewables % 25 50 75 100 % PV - 75% TSC (Options 1&2)
Insulation M(I) M(II) M(III) M(IV)
6.5.1.1 Application of the introduced packages to the investigated building types
The above packages have been applied to distribution warehouses, retail sheds and
office buildings. The results of analyses are presented in the following section:

CHAPTER 7: On-site low and zero carbon technologies
146
• Packages K&M: TSC + PV (current/future FiT) + the improved
building fabric specification and energy efficient lighting and services
NPV results associated with applying ‘PV+TSC’ packages are demonstrated in Figures 7.18 to 7.21. Warehouse
All the investigated packages are insulated down to 0.1 W/m2.K U-values. Comparing
the results from Figure 7.18 with PV only packages demonstrates that application of
TSCs is negatively affecting the NPV benefits of using renewable technologies. This is
simply due to the high capital cost of applying TSCs which is not fully recovered by
heating load savings during the service life of the building.
In terms of CO2 savings in a medium sized distribution warehouse, the combination of
studied renewables contributes to a further 38% to the overall CO2 savings comparing
with PV only packages (Table 7.12).
Table 7.12 NPV and CO2 savings associated with different packages, medium sized warehouse
Investigated packages on a medium sized distribution warehouse Maximum
saving
Optimum U-value (roof-wall U-
values) PV (Current FiT)+TSC+
+Insulation NPV (£ K) 130 0.15-0.21
CO2 savings (%) 73 0.07-0.1 PV (Future FiT (4.5p/KWh))
+TSC+Insulation NPV (£ K) -37 0.15-0.21
CO2 savings (%) 73 0.07-0.1 PV (Future FiT
(10p/KWh))+TSC+ Insulation NPV (£ K) -6 0.15-0.21
CO2 savings (%) 73 0.07-0.1
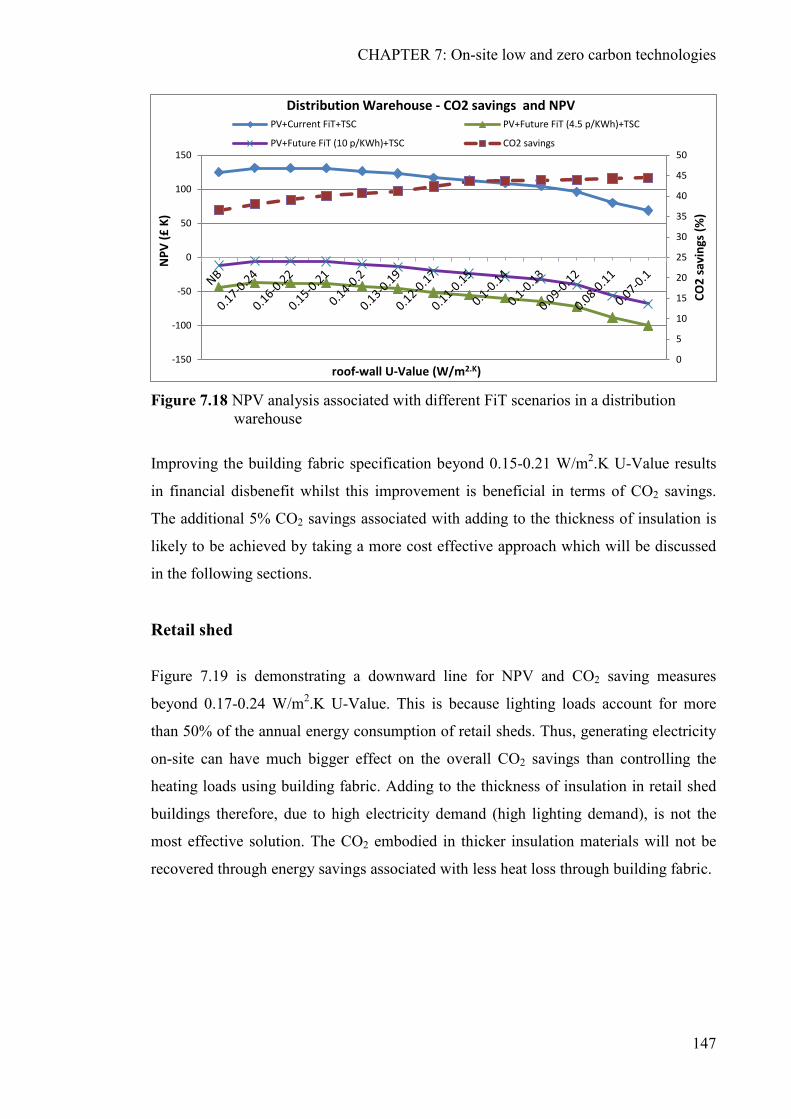
CHAPTER 7: On-site low and zero carbon technologies
147
Figure 7.18 NPV analysis associated with different FiT scenarios in a distribution warehouse
Improving the building fabric specification beyond 0.15-0.21 W/m2.K U-Value results
in financial disbenefit whilst this improvement is beneficial in terms of CO2 savings.
The additional 5% CO2 savings associated with adding to the thickness of insulation is
likely to be achieved by taking a more cost effective approach which will be discussed
in the following sections.
Retail shed
Figure 7.19 is demonstrating a downward line for NPV and CO2 saving measures
beyond 0.17-0.24 W/m2.K U-Value. This is because lighting loads account for more
than 50% of the annual energy consumption of retail sheds. Thus, generating electricity
on-site can have much bigger effect on the overall CO2 savings than controlling the
heating loads using building fabric. Adding to the thickness of insulation in retail shed
buildings therefore, due to high electricity demand (high lighting demand), is not the
most effective solution. The CO2 embodied in thicker insulation materials will not be
recovered through energy savings associated with less heat loss through building fabric.
0
5
10
15
20
25
30
35
40
45
50
-150
-100
-50
0
50
100
150
CO2
savi
ngs
(%)
NPV
(£ K
)
roof-wall U-Value (W/m2.K)
Distribution Warehouse - CO2 savings and NPV PV+Current FiT+TSC PV+Future FiT (4.5 p/KWh)+TSC
PV+Future FiT (10 p/KWh)+TSC CO2 savings

CHAPTER 7: On-site low and zero carbon technologies
148
Figure 7.19 NPV and CO2 saving analysis associated with different FiT scenarios in a retail shed
As presented in Table 7.13, the combination of studied renewables contributes a further
17% to the overall CO2 savings beyond PV only packages (Table 7.4).
Table 7.13 NPV and CO2 savings associated with different packages, retail shed
Investigated packages on a medium sized retail shed Maximum saving
Optimum U-value
PV+TSC+Current FiT+Insulation
NPV (£ K) 452 0.17-0.24 CO2 savings (%) 87.6 0.15-0.21
PV+TSC+Future FiT (4.5 p/KWh)+Insulation
NPV (£ K) 71.4 0.17-0.24 CO2 savings (%) 87.6 0.15-0.21
PV+TSC+Future FiT (10 p/KWh)+Insulation
NPV (£ K) 144.1 0.17-0.24 CO2 savings (%) 87.6 0.15-0.21
Offices In case of office buildings, due to the high internal gain generated by people, computers,
lighting and other appliances, the heating load is only about 30% of the overall energy
consumption. Lighting load on the other hand is responsible for over 60% of the annual
energy consumption in an office (excluding cooling loads).
Supplying the electricity demand on-site seems to be the most cost effective way of
saving CO2. Application of TSCs has only contributed a further 13.5% CO2 emission
reduction towards achieving the zero carbon performance (Table 7.14).
82.5083.0083.5084.0084.5085.0085.5086.0086.5087.0087.5088.00
050
100150200250300350400450500
CO2 s
avin
gs (
%)
NPV
(Tho
usan
d £)
roof-wall U-Value (W/m2.K)
Retail shed - CO2 savings and NPV PV+TSC+Current FiT+Insulation PV+TSC+Future FiT (4.5 p/KWh)+InsulationPV+TSC+Future FiT (10 p/KWh)+Insulation CO2 savings
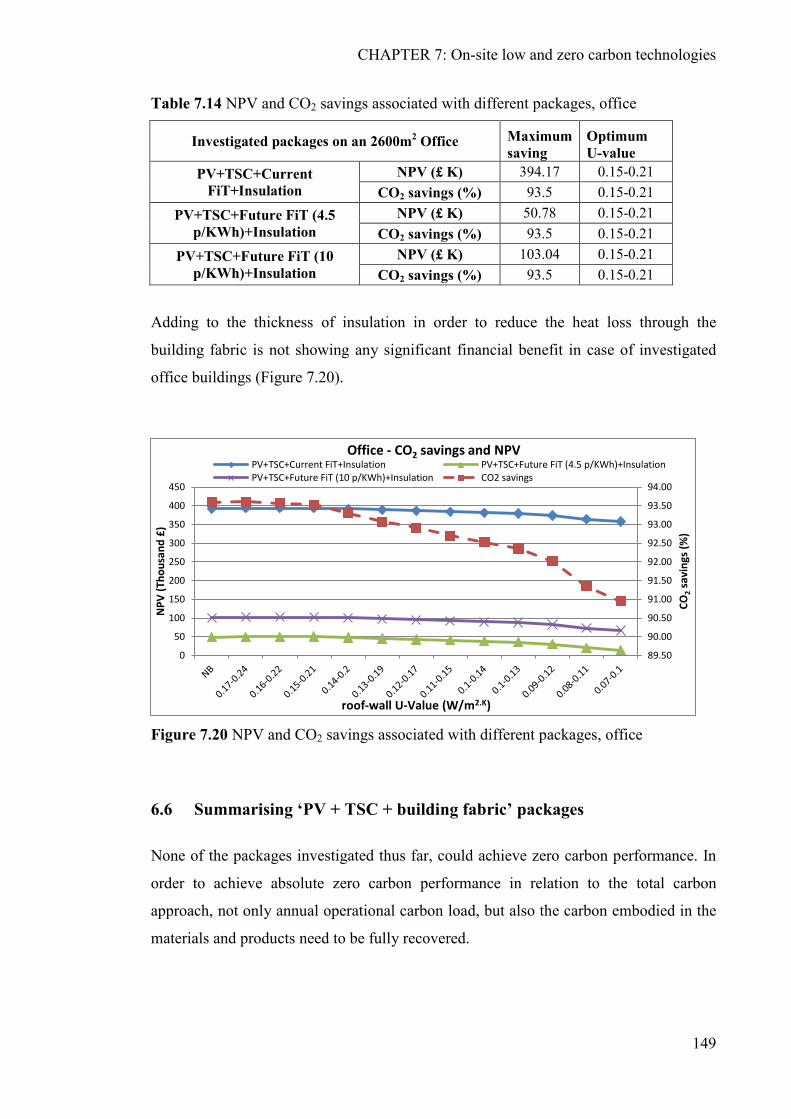
CHAPTER 7: On-site low and zero carbon technologies
149
Table 7.14 NPV and CO2 savings associated with different packages, office
Investigated packages on an 2600m2 Office Maximum saving
Optimum U-value
PV+TSC+Current FiT+Insulation
NPV (£ K) 394.17 0.15-0.21 CO2 savings (%) 93.5 0.15-0.21
PV+TSC+Future FiT (4.5 p/KWh)+Insulation
NPV (£ K) 50.78 0.15-0.21 CO2 savings (%) 93.5 0.15-0.21
PV+TSC+Future FiT (10 p/KWh)+Insulation
NPV (£ K) 103.04 0.15-0.21 CO2 savings (%) 93.5 0.15-0.21
Adding to the thickness of insulation in order to reduce the heat loss through the
building fabric is not showing any significant financial benefit in case of investigated
office buildings (Figure 7.20).
Figure 7.20 NPV and CO2 savings associated with different packages, office
6.6 Summarising ‘PV + TSC + building fabric’ packages
None of the packages investigated thus far, could achieve zero carbon performance. In
order to achieve absolute zero carbon performance in relation to the total carbon
approach, not only annual operational carbon load, but also the carbon embodied in the
materials and products need to be fully recovered.
89.50
90.00
90.50
91.00
91.50
92.00
92.50
93.00
93.50
94.00
0
50
100
150
200
250
300
350
400
450
CO2 s
avin
gs (%
)
NPV
(Tho
usan
d £)
roof-wall U-Value (W/m2.K)
Office - CO2 savings and NPV PV+TSC+Current FiT+Insulation PV+TSC+Future FiT (4.5 p/KWh)+Insulation
PV+TSC+Future FiT (10 p/KWh)+Insulation CO2 savings

CHAPTER 7: On-site low and zero carbon technologies
150
Table 7.15 demonstrates the maximum CO2 savings associated with the investigated
packages. All packages fall short of the zero carbon performance. Therefore, the carbon
emissions which cannot be cost-effectively offset on-site, after maximum carbon
reduction has been achieved, will be tackled through remote measures (such as
exporting electricity to the grid).
Table 7.15 Maximum achievable CO2 saving associated with each package
Building type
Max CO2 savings by
'Insulation' Packages %
Max CO2 savings by
'TSC+Insulation' Packages %
Max CO2 savings by
'PV+Insulation' Packages %
Max CO2 savings by
'PV+TSC+Insulation' Packages %
Warehouse 9.97 38 45 73 Retail shed 9.43 17.8 70 87.6 Office 1 11 80 93.5
Figure 7.21 demonstrates the additional CO2 saving that is required to be made in a
retail shed (as an example) in order to achieve the zero carbon performance. This
additional CO2 saving is different for each investigated package.
Figure 7.21 Maximum achievable CO2 saving associated with each package
-20
0
20
40
60
80
100
120
CO2 s
avin
gs (%
)
roof-wall U-Value (W/m2.K)
Retail shed - Maximum CO2 saving by each package PV + Insulation PV + TSC + Insulation Insulation TSC + Insulaton
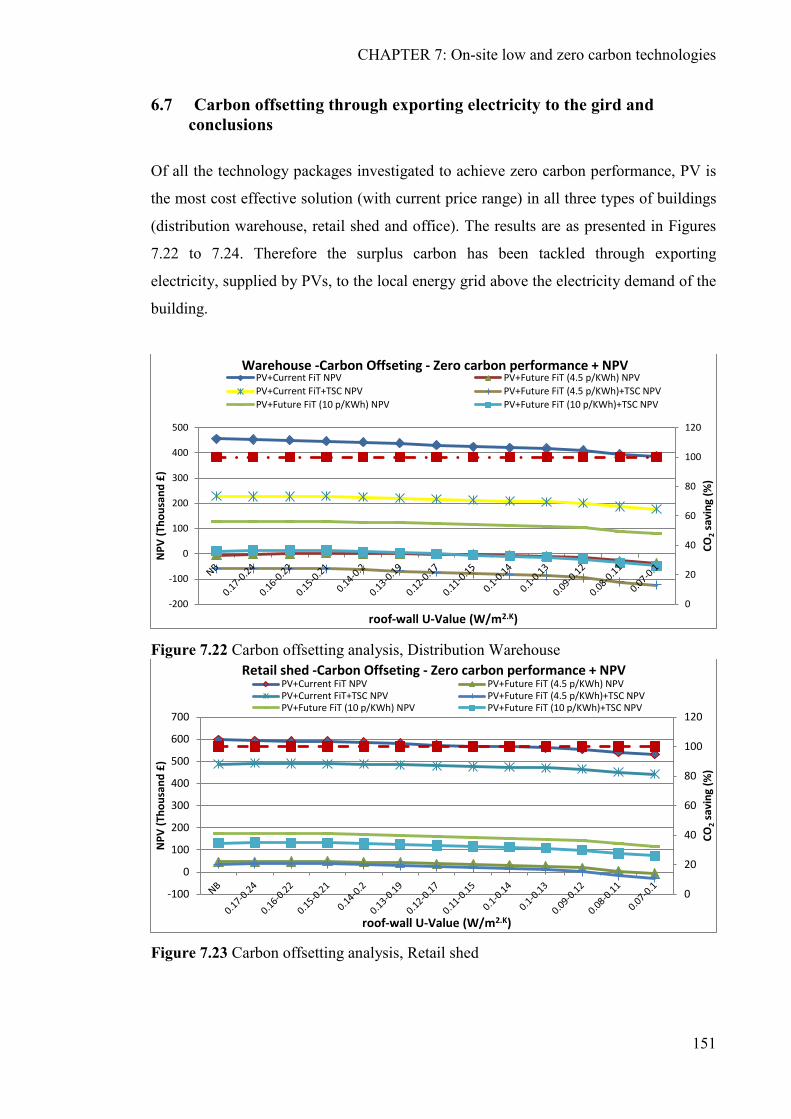
CHAPTER 7: On-site low and zero carbon technologies
151
6.7 Carbon offsetting through exporting electricity to the gird and conclusions
Of all the technology packages investigated to achieve zero carbon performance, PV is
the most cost effective solution (with current price range) in all three types of buildings
(distribution warehouse, retail shed and office). The results are as presented in Figures
7.22 to 7.24. Therefore the surplus carbon has been tackled through exporting
electricity, supplied by PVs, to the local energy grid above the electricity demand of the
building.
Figure 7.22 Carbon offsetting analysis, Distribution Warehouse
Figure 7.23 Carbon offsetting analysis, Retail shed
0
20
40
60
80
100
120
-200
-100
0
100
200
300
400
500
roof-wall U-Value (W/m2.K)
CO2 s
avin
g (%
)
NPV
(Tho
usan
d £)
Warehouse -Carbon Offseting - Zero carbon performance + NPV PV+Current FiT NPV PV+Future FiT (4.5 p/KWh) NPVPV+Current FiT+TSC NPV PV+Future FiT (4.5 p/KWh)+TSC NPVPV+Future FiT (10 p/KWh) NPV PV+Future FiT (10 p/KWh)+TSC NPV
0
20
40
60
80
100
120
-100
0
100
200
300
400
500
600
700CO
2 sav
ing
(%)
NPV
(Tho
usan
d £)
roof-wall U-Value (W/m2.K)
Retail shed -Carbon Offseting - Zero carbon performance + NPV PV+Current FiT NPV PV+Future FiT (4.5 p/KWh) NPV
PV+Current FiT+TSC NPV PV+Future FiT (4.5 p/KWh)+TSC NPVPV+Future FiT (10 p/KWh) NPV PV+Future FiT (10 p/KWh)+TSC NPV

CHAPTER 7: On-site low and zero carbon technologies
152
Figure 7.24 Carbon offsetting analysis, Office
The analysis is also demonstrating that adding to the thickness of insulation beyond
0.15-0.21 W/m2.K roof and wall U-Values is not cost effective. This can be due to two
main reasons:
• The capital cost of incremental increases in the level of insulation is not
recovered by the associated operational energy savings
• Application of the low and zero carbon technologies can achieve the required
carbon reduction targets in a more cost effective way.
The ‘Total Energy Assessment Methodology’ Tool in the next Chapter will be used to
determine the embodied to operational carbon proportion when achieving zero carbon
performance in non domestic buildings (Section 8.7).
0
20
40
60
80
100
120
-100
0
100
200
300
400
500
600
CO2
savi
ng (%
)
NPV
(Tho
usan
d £)
roof-wall U-Value (W/m2.K)
Office -Carbon Offseting - Zero carbon performance + NPV PV+Current FiT PV+Future FiT (4.5 p/KWh)
PV+Current FiT+TSC PV+Future FiT (4.5 p/KWh)+TSCPV+Future FiT (10 p/KWh) PV+Future FiT (10 p/KWh)+TSC

153
7 CHAPTER 8: Total Energy Assessment Methodology
(TEAM) Tool To consolidate the results, an Excel-based assessment tool has been developed which
enables designers and manufacturers to determine the most cost effective ways of
achieving zero carbon non-domestic buildings using different design scenarios and
service lives at the early design stages. A total carbon analysis has also been carried out
to quantify the ratio of embodied to operational CO2 for different scenarios and when
achieving a zero carbon performance.
7.1 General description
The ‘Total Energy Assessment Methodology’ tool is an Excel-based calculator to
determine the most cost effective way of achieving zero carbon buildings (using the
total carbon approach). At present, it is designed for industrial warehouses and retail
sheds but can be developed further to include other types of buildings.
The methodological framework for the tool consists 5 main modules including:
a) Operational carbon evaluation module (database for dynamic thermal simulation
of building energy consumption)
b) Environmental evaluation module (embodied CO2 database for materials and
technologies)
c) Economic evaluation module (materials and technologies price database)
d) User Interface module (data input)
e) Results module (numerical and graphical output)

CHAPTER 8: Total Energy Assessment Methodology (TEAM) Tool
154
7.2 Operational carbon evaluation module
IES dynamic thermal simulation software has been used to create a heating and lighting
demand database for the buildings investigated (Figure 8.1). These are used to compare
different building specifications, service systems and control regimes. The lighting
analysis associated with improving the liner reflectivity has been validated with Relux
Pro software and real monitored data. The occupancy profiles, based on the National
Calculation Methodology (NCM), the UK tool for assessment of carbon compliance in
the Building Regulations, have been used for all simulations.
Figure 8.1 Screenshot of the lighting demand database for different operational scenarios
7.3 Environmental evaluation module
The environmental evaluation module consists of an embodied carbon database on the
basis of measured quantities of materials and products EPDs (Figure 8.2). These
measures are linked to different operational and envelope energy efficiency scenarios
and will be automatically updated by selecting different options.

CHAPTER 8: Total Energy Assessment Methodology (TEAM) Tool
155
Figure 8.2 Screenshot of the embodied carbon database
7.4 Economic evaluation module
The price database includes the cost of the employed renewable technologies and fabric
elements (depending on the required thicknesses associated with fabric U-value and
insulation materials used) per square metre (Refer to Chapter 6 and Appendix B). The
area of each building element is linked to the Geometry tab in the tool which takes into
account the building size and rooflight area to calculate the area of building fabric.
7.5 User Interface (UI) module
The User Interface (UI) consists of menus through which users can select from various
dropdown menus displayed on the screen (Figure 8.3). The variables introduced in the
UI page of the tool include Building type, size, fabric U-value, rooflight percentage,
liner type, air permeability level and insulation type. All scenarios can be assessed for
UK south and north locations.

CHAPTER 8: Total Energy Assessment Methodology (TEAM) Tool
156
Figure 8.3 Screenshot of the User Interface (UI) module
7.5.1 Building type
Distribution warehouses and retail sheds have been selected to be investigated as
example buildings in the tool. Industrial buildings are of interest to the sponsoring
company and it was agreed that the analysis at this level be applied to these types of
buildings in more detail.
7.5.2 Size
Three sizes of buildings, small, medium and large (1000m2, 4000m2 and 10000m2
respectively) have been included in the tool.

CHAPTER 8: Total Energy Assessment Methodology (TEAM) Tool
157
7.5.3 Rooflight percentage
According to the Building Regulations Part L 2013, the recommended area for
rooflights is 12% of the roof area. However, analysis carried out at Oxford Brookes
University (Wang et al, 2013) is also demonstrating some benefits in lighting energy
consumption savings beyond recommended figures up to 15% rooflight. According to
the analysis, the percentage of rooflight affects both the amount of useful solar gains
(winter solar gains) and the amount of heat loss through the window panes due to higher
U-values of the rooflight panes compared to the solid roof panels. Whilst the heating
demand is not increased significantly when enlarging the rooflight percentage (an
increase of around 6% from the basecase), larger percentage of rooflights have proved
to be more beneficial for saving artificial lighting energy (although the overheating risk
is likely to rise for 15% rooflight area). The overall savings though, taking into account
both lighting and heating load changes is quite close, therefore both options (12 and
15% rooflight areas) along with 10% rooflight are included in the tool.
7.5.4 Fabric U-value
Six fabric U-value scenarios have been introduced to the module including the Building
Regulation 2013 Part L notional building specification as the base-case scenario.
Backstop U-value specifications along with 4 incrementally improving U-value
specifications down to 0.1 W/m2.K U-value are also available under the ‘Fabric’
heading (Table 8.1).

CHAPTER 8: Total Energy Assessment Methodology (TEAM) Tool
158
Table 8.1 Fabric U-value scenarios
Fabric U-values Building element U-value W/m2K
Back-stop
Roof 0.25 Wall 0.35 Floor 0.25
Rooflight 2.2
Notional Building
Roof 0.18 Wall 0.26 Floor 0.22
Rooflight 1.6
Spec. a
Roof 0.2 Wall 0.2 Floor 0.2
Rooflight 1.6
Spec. b
Roof 0.16 Wall 0.16 Floor 0.16
Rooflight 1.2
Spec. c
Roof 0.13 Wall 0.13 Floor 0.13
Rooflight 1
Spec. d
Roof 0.1 Wall 0.1 Floor 0.1
Rooflight 1
7.5.5 Liner type
It has been shown that using high reflective liners can reduce the amount of energy
required for lighting industrial sheds. The reflectivity these liners in comparison to
standard ones is about 18% higher (assuming 70% for standard and 85% for reflective
liners) and are expected to save between 6 to 12% of lighting energy (depending on the
operational scenarios). Consequently, high reflective liners contribute a further 3%
reduction in the overall CO2 emissions (based on SBEM calculation under NCM
conditions for Part L compliance)(TATA Steel, 2012).

CHAPTER 8: Total Energy Assessment Methodology (TEAM) Tool
159
7.5.6 Air permeability level
The air permeability figures are selected to comply with Building Regulations Part L
2013 standards relative to the selected building size (Table 8.2).
Table 8.2 Air permeability standards for industrial buildings
Air permeability m3/m2/h Side lit or unlit (where HVAC specification is
heating only)
Side lit or unlit (where HVAC specification
include cooling) Top lit
Gross internal area less than or equal to 250m2 5 5 7
Gross internal area greater than 250m2 and less than 3500m2
3 3 7
Gross internal area greater than 3500m2 and less than 10000m2
3 3 5
Gross internal area greater than or equal to 10000m2 3 3 3
7.5.7 Insulation type
PUR and mineral wool, as two of the most commonly used insulation materials in
composite and built-up systems, have been incorporated into the tool.
7.5.8 Renewable technologies
Transpired Solar Collectors (TSCs) and PV cells as dominant renewable technologies
applicable to industrial buildings have been included in the tool. Users can change the
colour of the steel sheets on TSCs which will affect the absorptivity of the material and
consequently can either decrease or increase the amount of the heat generated by TSCs.
The area of TSC on the wall is also adjustable but is limited to the area of the south wall
and an error message box will pop up if the entered area is greater than the available
area on the south wall.
Users can include both TSCs and PVs or include one or neither of them in the analysis.
Under the PV section, the user can select the type of PV cells (monocrystalline,

CHAPTER 8: Total Energy Assessment Methodology (TEAM) Tool
160
polycrystalline, thin films and amorphous silicon) and also the PV area on the roof. The
efficiency of the PV panels will change with selecting different types of cells.
The majority of the energy generated by renewables is in the summer period when
demand is at its lowest. Therefore an actual electricity demand analysis on a daily basis
has been carried out to calculate the required generated electricity by PVs and
consequently determine the accurate amount of electricity purchased from or exported
to the grid (Figure 8.4).
Figure 8.4 Screenshot of the PV daily calculations
7.6 Results module
The Results module will give an indication of financial (NPV of energy savings) and
environmental benefits of the products and technologies over their service life. This will
determine the scenarios and energy saving packages in which a net carbon or cost
benefit/disbenefit is achieved. The methodological approach takes into account the use
of selected carbon reduction technologies that will satisfy a range of criteria such as
environmental, cost, manufacturing limitations and resource constraints (Figure 8.5).
The base case building is introduced as the 2013 Building Regulations part L Notional
Building (Table 8.3).

CHAPTER 8: Total Energy Assessment Methodology (TEAM) Tool
161
Table 8.3 Notional Building fabric U-value specifications
U-Value (W/m2.K)
Element Side lit or unlit (where HVAC specification is heating only)
Side lit or unlit (where HVAC specification includes cooling) Toplit
Roof 0.18 0.18 0.18 Wall 0.26 0.26 0.26 Floor 0.22 0.22 0.22 Windows 1.6 1.6 1.6
Figure 8.5 Screenshot of the Results module
7.7 Total carbon analyses in relation to zero carbon performance
Total carbon analyses in relation to different levels of ‘fabric energy efficiency only’
(Tabel 8.3), and a ‘zero carbon building performance including renewable technologies’

CHAPTER 8: Total Energy Assessment Methodology (TEAM) Tool
162
(Table 8.4) have been carried out using the developed calculation tool. The shift in the
ratio of embodied to operational CO2 associated with each scenario is investigated.
Table 8.4 Embodied and operational carbon proportions in relation to different building fabric only scenarios
% %
heating only operational
CO2
embodied CO2
Total operational
CO2
embodied CO2
Bui
ldin
g fa
bric
onl
y Backstop 91 9 96 4 Notional Building 84 16 93 7
Spec. a 82 18 92 8 Spec. b 73 27 90 10 Spec. c 61 39 87 13 Spec. d 48 52 83 17
According to Table 8.4, improving the building fabric from backstop to ‘Specification
d’ U-values demonstrates an incremental shift in embodied to operational CO2
proportion. Beyond ‘Specification C’ embodied CO2 exceeds the operational CO2 and a
net carbon disbenefit occurs (more insulation increases embodied CO2 with a decreasing
effect on U-value).
Table 8.5 Embodied and operational carbon proportions in relation to different scenarios in order to achieve zero carbon performance
%
Total operational CO2 Embodied CO2
Bui
ldin
g fa
bric
+
rene
wab
les
Backstop 74 26 Notional Building 68 32 Spec. a 67 33 Spec. b 62 38 Spec. c 55 45 Spec. d 50 50
Table 8.5, demonstrates that in order to achieve a zero carbon performance, using
building fabric energy efficiency and on-site renewable technologies, embodied CO2
investments can account for 25 to 50% of the total carbon emissions. 100m2 TSC and a
range of PV area between 135 to 170m2 depending on building fabric specifications
have been used for the analyses.

CHAPTER 8: Total Energy Assessment Methodology (TEAM) Tool
163
It also agrees with the result of analyses presented in the previous Chapters supporting
the case for including embodied CO2 in all carbon reduction strategies and potentially in
the Building Regulations.

164
8 CHAPTER 9: Conclusions and Recommendations for further
research
This Chapter presents the conclusions, contribution to knowledge and recommendations
for further research with reference to the aim and objectives presented in Chapter 1.
8.1 Conclusions
As it has been discussed in Chapter 1, the aim of the research was to:
‘Establish an assessment methodology for appraising the commercial and carbon
advantages of new low and zero carbon building technologies’.
An assessment methodology therefore has been developed, the detail of which is
presented in Chapter 4. It has addressed the use of combined operational and embodied
carbon analyses as means of providing more representative assessments of life cycle
carbon burdens and cost appraisals for low and zero carbon technologies. The analyses
have demonstrated the importance of combining operational and embodied carbon in
evaluating the effectiveness of carbon reduction strategies and requirements to shift
away from ‘operational carbon only’ methods (refer to Chapter 2).
Whilst energy reduction strategies have so far focused only on operational energy
(which historically has accounted for a far greater proportion of total building related
CO2 emissions than embodied carbon), the analyses demonstrated that such approaches
may not be properly representative. As operational energy reduces, the ratio of it to
embodied carbon becomes relatively evenly balanced so both must be considered (refer
to Chapters 5 and 7). Discounting embodied carbon means that results may only
partially reflect reality and optimisation processes are therefore at risk of being
unrepresentative.

CHAPTER 9: Conclusions and Recommendations for further research
165
Already many building related organizations require embodied carbon data as part of
tendering processes (often in the form of Environmental product declarations (EPDs)),
and in the future it is anticipated that such requirements will become increasingly
commonplace, and may potentially feature in legislation.
The objectives in support of the aim were to:
1. Identify and review new product development demands relating to low and zero
carbon building technologies and the economic cases on which they are based.
The development and availability of effective new low carbon building technologies is
strategically important toward achieving carbon reduction targets, but commercially is
hindered by issues of predicting future market demands. Delivering new products to
market however requires significant investment and it is essential that the management
and timing of research and development, and subsequent commercialisation is correct.
The findings of the research support the case for development of novel insulation
materials as conventional solutions such as PUR and mineral wool cannot be justified in
relation to low U-values and/or relatively short service lives. This is due to the physical
thicknesses that would be required and the associated engineering difficulties. Also,
crucial to this research, increase in thickness results in high embodied CO2. High
performance insulation materials such as vacuum insulation, that provide low U-values
relative to their embodied carbon, perform significantly better in reducing overall CO2
emissions than conventional materials over a typical service life. At present however,
whilst there is a good ‘technology push’, there is limited ‘market pull’-
commercialisation may only occur at large scale if regulatory requirements are in place
that demand improved performance.
A prime example of novel insulation of the type that might reduce embodied carbon is
Vacuum Insulation Panels (VIPs). VIPs can achieve low, or extremely low, U-values (to
0.03 W/m2.K) coupled with low embodied CO2. Emerging retrofit applications include
thermal upgrading of facades and floors where the physical thinness of the panels is
highly advantageous, limiting the amount by which the cross-sectional size of building
elements is increased.

CHAPTER 9: Conclusions and Recommendations for further research
166
It is possible that other novel insulation materials may deliver similar levels of high
performance, however few such materials have reached the same level of technical
development as vacuum insulation. The results associated with hemp are based on
cradle-to-gate life cycle analysis (refer to Chapter 5), but would be significantly
different if appraised using results with cradle-to-grave approach.
2. Identify optimal approaches to:
a. Assessing the relative financial competitiveness of comparator new and existing
products based on ‘first’ and ‘life cycle’ cost (using appropriate future value
discounting procedures).
The financial competitiveness of conventional and novel low and zero carbon building
technologies has been assessed and analysed using appropriate future value discounting
procedures as presented in Chapter 4.
According to the analyses presented in Chapters 6 and 7, there are key points beyond
which, and depending on factors such as products, building types and operational
scenarios, additional cost of adding to the thickness of insulation materials or
application of on-site energy generating technologies cannot be recovered by the
associated operational energy savings. A net cost disbenefit occurs consequently.
Also if energy generating technologies such as TSCs are to be justified as a cost
effective solution for low or zero carbon buildings, it appears essential that there should
be a considerable price reduction from 150 to 50 £/m2. A shift towards the next
generation of TSCs is required to enable them to compete with rival technologies,
particularly PV (refer to Chapter 6).
Of the technologies investigated PVs are the most cost effective way of achieving zero
carbon buildings (refer to Chapter 7). The analyses demonstrate considerable financial
benefit from ‘Feed in Tariffs’ recovering the capital cost of installing PVs easily.

CHAPTER 9: Conclusions and Recommendations for further research
167
b. Quantifying relative carbon efficiencies of new products for low and zero carbon
buildings based on computer modelling and best practice modelling assumptions.
This identifies ‘death points’ beyond which existing products become obsolete as
new products present definitive advantages on the basis of carbon
Whilst there is a considerable body of work in the literature supporting the significance
of adopting a combined embodied and operational carbon approach, none of the
investigated studies identified how the inclusion of embodied CO2 in carbon reduction
equations can suggest ‘death points’ for conventional building technologies and relative
‘birth points’ for novel products.
The analyses presented however, demonstrate how such points can be determined (for
various operational scenarios and building types) by quantified methodological
approaches that aggregate operational and embodied carbon. This approach is useful for
such things as determining the maximum levels of insulation that can be incorporated
into buildings or required by standards, or for example, setting limits to the amount by
which current approaches to energy thrift can be escalated using specific products.
c. Determining the physical limitations of comparator products such that financial
and carbon comparisons are considered only where there is genuine product
competition, and the limits of technologies are fully recognised.
As has been discussed in Chapter 5, PUR foam is limited to 170-200mm thickness as it
relies on a reaction between its constituent chemicals to cause the formation of cells and
expansion (foaming) of the material. Beyond around 200mm this reaction is slow and
becomes difficult to control. It appears that 170-200mm with U-value of 0.147 to 0.125
W/m2.K are the most common thicknesses in use.
Mineral wool can be produced to any thickness (if necessary in multiple layers) but
where low U-values are required the necessary dimensions can become difficult to
accommodate within construction systems (the support systems in built-up cladding
becomes too large and problematic). The transportation and handling of deep insulation
systems can also be problematic. On these grounds very thick mineral wool assemblies

CHAPTER 9: Conclusions and Recommendations for further research
168
are usually discounted although the maximum thickness that is acceptable is more
difficult to identify precisely.
3. Apply the methodology to a series of selected case studies of novel low and zero
carbon building technologies and identify the threshold where these technologies will
present financial advantage (in relation to energy costs), or carbon advantage (in
relation to meeting tightening regulations for energy thrift).
The findings arising from application of the methodology includes ‘methodological’
and ‘specific to case study’ findings.
The key ‘methodological’ findings arising from the analyses (as presented in Chapters 5
to 7) include:
• There is compelling evidence that a combined embodied and operational CO2
approach should logically be the basis of all strategic decision making as the
relative balance of these two components is sufficiently close that neither can be
ignored. Designs made only on the basis of operational carbon have been
quantified as unrepresentative on a life cycle basis. Given the compelling
evidence, it is recommended that both operational and embodied carbon must be
considered in the future assessment methods and potentially in regulations.
• Analyses demonstrate that there are key points beyond which, and depending on
factors such as material and building types, additional embodied carbon
investments in low and zero carbon technologies exceed operational carbon
savings. This creates net carbon disbenefits.
Findings arising from the application of the methodology to ‘specific case studies’
include:
• Highly insulated envelopes, significantly exceeding current Building Regulation
requirements, appear difficult to justify due to the carbon and cost disbenefits.

CHAPTER 9: Conclusions and Recommendations for further research
169
These disbenefits due to the additional insulation materials are difficult to be
recovered from operational carbon savings (refer to Chapter 7).
• The optimum insulation level on grounds of carbon efficiency is contingent on
the building type and size, operational patterns and insulation type. Financially
however, focus on reducing all regulated energies rather than simple
conservation of heat is required in order to identify the most cost effective
approaches to carbon reduction (refer to Chapter 7).
• If novel insulation materials can be developed with lower embodied energies
(for given thermal resistances) than those materials currently in common usage,
the optimal insulation values will increase.
• Thin high performance insulation materials also offer advantages in terms of
optimising rental values on the basis that the adjusted ‘net to gross’ floor areas
are significantly altered such that a greater floor area is made available (refer to
Chapter 6).
• For non-domestic buildings, a maximum of 10% CO2 reduction can be achieved
using ‘fabric thermal efficiency’ (only) when including the regulated energy
consumption (lighting and hot water requirements) (refer to Chapter 5).
• As discussed in Chapter 7, the majority of the heat generated by TSCs occurs
during warm periods (summer) when heating demand is low. The operational
CO2 savings associated with the ‘actual’ delivered heat therefore cannot recover
the high capital costs of TSCs.
4. Develop an Excel-based assessment tool based on the proposed methodology.
The ‘Total Energy Assessment Methodology’ as an Excel-based tool has been
developed to consolidate the results associated with the application of the methodology.

CHAPTER 9: Conclusions and Recommendations for further research
170
It was designed to determine the most cost effective way of achieving zero carbon
buildings (on grounds of total carbon approach) using fabric energy efficiency and on-
site low and zero carbon technologies.
Such a tool can be used to investigate other existing and/or novel low and zero carbon
technologies on grounds of their carbon efficiency and cost effectiveness. As the
background heating and lighting databases are based on dynamic thermal simulations,
the tool offers a high level of accuracy and therefore can be used for real case
assessments.
It allows cost and carbon analyses to be performed (similar to those of Chapters 5 to 7),
for retrofitting and new build projects.
8.2 Contribution to knowledge
The main contribution to knowledge in this study is the developed assessment
methodology based on a total carbon analysis taking account of all relevant carbon
emissions from extraction of raw materials to the manufacturing energy consumption
and in use phase carbon. The methodology provides a ‘total carbon analyses graph’
suggesting deathpoints, for conventional low and zero carbon building technologies,
beyond which the associated embodied carbon burden outweighs the potential
operational carbon savings. This for the first time introduces the concept of sensible
maximum thickness for insulation materials suggesting the likely need for development
of more carbon efficient novel products to replace conventional products available in
the market.
The developed methodology enables manufacturers and suppliers to quantify the true
carbon saving potentials of their products.

CHAPTER 9: Conclusions and Recommendations for further research
171
8.3 Limitations and recommendations for further research
8.3.1 Scale of the study
The analyses carried out in Chapter 7 were associated with non-domestic buildings due
to the high number of simulations and the three year time limit of the study. Similar
analyses can be applied to domestic buildings and also in relation to more operational
scenarios.
8.3.2 System boundaries
Cradle to gate approaches have been adopted for this research due to the uncertainty of
data associated with distances to the site and end of life scenarios. For further research,
the results from this study can be incorporated into a cradle to grave analysis (assuming
all variables are known) which would further improve accuracy of the assessments.
The inclusion of end of life stages, which may include the burdens of disposal and
benefits of recycling or reuse, requires important methodological choices. It is vital that
the pros and cons of each method for recycling are well understood so that an informed
choice can be made.
8.3.3 Total Energy Assessment Methodology
The ‘Total Energy Assessment Methodology’ tool was developed in relation to
industrial buildings and certain building specifications and operational scenarios. More
options (such as different occupancy profiles, fabric specifications, temperature set-
points etc) could appropriately be incorporated.
8.3.4 TSCs
These performance issues suggest a major agenda for future research as the systems in
their current form whilst showing carbon benefits fail to demonstrate cost benefit using

CHAPTER 9: Conclusions and Recommendations for further research
172
this form of analysis. Systems appear to need either long term heat storage capacity or
performance enhancement such that they provide for a greater proportion of the annual
heating demands.
Long term heat storage capacity would make it possible to reuse the generated heat in
cooler seasons when the output of TSCs is limited. Currently however, there are no cost
effective heat storage systems available. Coupling TSCs with technologies such as air
source heat pumps is technically possible to provide hot water in the summer but capital
costs are considerable.
Phase Change Materials (PCM) have been investigated in relation to TSC heat storage
(because of their high thermal storage capacity coupled with moderate temperature
variations) but reliable systems have not thus far been developed.
Ideas to enhance the performance of TSCs can also be investigated to provide limited
amounts of high temperature air as opposed to the current systems that provide large
volumes of low temperature air.
8.3.5 Consistent embodied CO2 database
Finding accurate and reliable data for embodied carbon analyses, especially concerning
unusual materials (such as fumed silica) or products such as PVs (due to the various
manufacturers and cell types) and TSCs is difficult. Lack of consistent information
through the supply chain is the main limitation.
Where accurate and reliable data is not available for calculating the embodied carbon of
products, it has to be estimated based on ‘process energy calculation techniques’
through a step-by-step product manufacturing energy breakdown in addition to the
embodied CO2 of materials on a weight basis (again extracted from the ICE database).
Further analyses and research would increase the range of products and materials that
could be assessed.

CHAPTER 9: Conclusions and Recommendations for further research
173
8.3.6 Cost databases
The costs of building technologies and services are usually estimated by suppliers for
each project taking into account the size and type of the building. The same or similar
products will be available for different prices. The uncertainty of available cost data
complicates analyses so assumed average figures have been used in this research, but
analyses based on actual supply costs are also feasible.
8.4 Future significance
The application of the methodology identified how the inclusion of embodied CO2 in
carbon reduction equations and taking a total carbon approach can lead to points beyond
which carbon disbenefit occurs for conventional building technologies. This can have
the following implications for future research concerning policy making, and its global
principles and practice:
• Discounting embodied carbon from carbon reduction equations in future is
misleading and does not provide a true assessment of reductions. A shift away
from ‘operational carbon only’ methods is therefore required.
• The inclusion of embodied carbon can set limits to the potential carbon saving
through building fabric energy efficiency introduced in future Building
Regulations
• If embodied carbon is included in the Building Regulation in future, building
material manufacturers and suppliers should be able to supply materials that
comply with true carbon burden requirements.
The study demonstrated the absolute significance of combining operational and
embodied carbon analyses in demonstrating the effectiveness of carbon reduction
strategies. The approach must be an integral part of any holistic appraisal of low and
zero carbon performance. Recognition of this represents an important and necessary
paradigm shift.
CHAPTER 9: Conclusions and Recommendations for further research
174
REFERENCES
Aimc4.com (2014) AIMC4 : About AIMC4. [Online] Available at:
http://www.aimc4.com/page.jsp?id=1 (accessed 16/ 12/ 14).
Al-Homoud D (2005) Performance characteristics and practical applications of common
building thermal insulation materials. Building and Environment. 40 (3), 353-366.
Anastaselos D, Giama E and Papadopoulos A (2009) An assessment tool for the energy,
economic and environmental evaluation of thermal insulation solutions. Energy
and Buildings. 41 (11), 1165-1171.
Apps1.eere.energy.gov, (2011). Building Energy Software Tools Directory: IES Virtual
Environment. [online] Available at:
http://apps1.eere.energy.gov/buildings/tools_directory/software.cfm/ID=615/pagen
ame=alpha_list_sub [Accessed 27 Nov. 2014].
Apps1.eere.energy.gov, (2014). Building Energy Software Tools Directory: TRNSYS.
[online] Available at:
http://apps1.eere.energy.gov/buildings/tools_directory/software.cfm/ID=58/pagena
me=alpha_list [Accessed 27 Nov. 2014].
Apps1.eere.energy.gov, (2014). Building Technologies Office: EnergyPlus Energy
Simulation Software. [online] Available at:
http://apps1.eere.energy.gov/buildings/energyplus/ [Accessed 27 Nov. 2014].
Attia, S., Hensen, J., Beltrán, L. and De Herde, A. (2012). Selection criteria for building
performance simulation tools: contrasting architects' and engineers' needs. Journal
of Building Performance Simulation, 5(3), pp.155-169.
Banfill P and Peacock A (2007) Energy-efficient new housing – the UK reaches for
sustainability.Building Research & Information. 35 (4), 426-436.
Bath.ac.uk, (2014). Sustainable Energy Research Team | University of Bath. [online]
Available at: http://www.bath.ac.uk/mech-eng/research/sert/ [Accessed 27 Nov.
2014].

175
Battle, Guy. Embodied Carbon Industry Task Force Recommendations. 2014. Web. 27 Sept. 2015.
Blengini, G. and Di Carlo, T. (2010). The changing role of life cycle phases, subsystems
and materials in the LCA of low energy buildings. Energy and Buildings, 42(6),
pp.869-880.
Brander, M. (2013). Improvements to Greenhouse Gas Accounting – the Impact of
Ecometrica Publications So Far. [online] Ecometrica. Available at:
http://ecometrica.com/blog/improvements-to-greenhouse-gas-accounting-the-
impact-of-ecometrica-publications-so-far/ [Accessed 27 Nov. 2014].
Bre.co.uk, (2013). BRE Group: SBEM: Simplified Building Energy Model. [online]
Available at: http://www.bre.co.uk/page.jsp?id=706 [Accessed 27 Nov. 2014].
BRE, (2009). The Government’s Standard Assessment Procedure for Energy Rating of
Dwellings. 1st ed. Crown copyright.
BRE (2007) Design life of buildings A scoping study (1st edition). Crown copyright
BS 7543:1992 (1992) Guide to Durability of buildings and building elements, products
and components. BSi
BS 7543:1992 (2014) Guide to Durability of buildings and building elements, products
and components ICS 91.040.01. BSi
BS 7543:2003 (2003) Guide to Durability of buildings and building elements, products
and components ICS 91.040.01. BSi
Building (2011) Cost model: City of London offices. [Online] Available at:
http://www.building.co.uk/data/cost-model-city-of-london-offices/5017530.article
(accessed 16/ 12/ 14).
Bundi R, Wakili K and Frank T (2003). Vacuum insulated panels in building
applications. In: Proceedings of the CISBAT 2003 Conference, EPFL, Lausanne,
Switzerland
Caps R, Heinemann U, Ehrmanntraut M and Fricke J (2001) Evacuated insulation
panels filled with pyrogenic silica powders: properties and applications. High
Temperatures-High Pressures. 33 (2), 151-156.

176
Carbon trust (2009a) Building the future, today (1st edition). The Carbon trust Available
at:http://www.carbontrust.com/media/77252/ctc765_building_the_future__today.p
df (accessed 16/ 12/ 14).
Carbonbrief.org (2015) A detailed look at why the future of UK energy is so hard to predict. [Online] Available at: http://www.carbonbrief.org/blog/2014/07/a-detailed-look-at-why-the-future-of-uk-energy-is-so-hard-to-predict/ (accessed 20/ 04/ 15).
CCC (2008) Building a low-carbon economy – the UK’s contribution to tackling
climate change. Crown Copyright
Cho, S. and Haberl, J. (2014). A Survey of High Performance Office Buildings in the
United States. Symposium of Improving Building Systems in Hot and Humid
Climates. H&H.
Cleveland, C.J. & Morris, C.G. (2009). Dictionary of Energy: Expanded Edition
Expanded. Elsevier Science
CLG and ONS (2008). Statistic Release: Floorspace and Rateable Value of Commercial
and Industrial Properties – 1 April 2007, England and Wales.
http://www.communities.gov.uk/documents/corporate/pdf/705678.pdf, accessed
on 06/03/2012. Constructionproducts.org.uk, (2014). Construction Products Association. [online]
Available at: http://www.constructionproducts.org.uk [Accessed 26 Nov. 2014].
Cooper, J. and Fava, J. (2006). Life-Cycle Assessment Practitioner Survey: Summary of
Results. Journal of Industrial Ecology, 10(4), pp.12-14.
Crawford R, Czerniakowski I and Fuller R (2011) A comprehensive model for
streamlining low-energy building design. Energy and Buildings. 43 (7), 1748-1756.
Crawley, D., Hand, J., Kummert, M. and Griffith, B. (2008). Contrasting the capabilities
of building energy performance simulation programs. Building and Environment,
43(4), pp.661-673.
Crown Copyright (2008). Building a low-carbon economy – the UK’s contribution to
tackling climate change, Committee on Climate Change, published by The
Stationery Office, UK.
177
Dakwale V, Ralegaonkar R and Mandavgane S (2011) Improving environmental
performance of building through increased energy efficiency: A
review. Sustainable Cities and Society. 1 (4), 211-218.
Davey, E. (2013). 'The Importance of Engineering In Meeting The Challenge'. Speech.
Davison, B. and Tingley, D. (2011). Design for deconstruction and material
reuse. Proceedings of the ICE - Energy, 164(4), pp.195-204.
DCLG, (2014). Improving the energy efficiency of our buildings. Crown copyright.
DCLG (2013a). Dwelling Stock Estimates: 2012, England. Crown copyright
DCLG, (2013b). Changes to Part L of the Building Regulations 2013. Crown copyright.
DCLG, (2012a). Proposed changes to Part L 2013. Crown copyright.
DCLG (2012b) House Building: June Quarter 2012, England. Crown copytight
DCLG (2011a) Zero carbon non-domestic buildings Phase 3 final report. Crown
copytight
DCLG (2008a) Definition of zero carbon homes and non-domestic buildings. Crown
copyright
DCLG (2008b) Existing housing and climate change. The Stationery Office
DECC (2014a) 2012 UK Greenhouse Gas Emissions, Final Figures. Crown copyright
DECC (2014b) Smart Metering Implementation Programme, Third annual report on the
roll-out of Smart Meters. Crown copyright
DECC (2013) Digest of United Kingdom Energy Statistics 2013. London: Crown
copyright
DECC (2012) GHG Inventory summary Factsheet. Crown copyright
DECC (2011a) Great Britain’s housing energy fact file
DECC (2011b) The carbon plan: Delivering our low carbon future. London:
Department of Energy and Climate Change

178
DECC, 2010, ‘Estimates of Heat Use in the United Kingdom’
http://www.decc.gov.uk/assets/decc/statistics/publications/trends/articles_issue/56
2-trendssep10-heat-use-article.pdf. accessed on 06/03/2012.
Department for Business Innovation and Skills (2010) Estimating The Amount Of Co2
Emissions That The Construction Industry Can Influence. Crown copyright
Designbuilder.co.uk, (2014). DesignBuilder - building simulation made easy -
DesignBuilder - Simulation Made Easy. [online] Available at:
http://www.designbuilder.co.uk/ [Accessed 27 Nov. 2014].
Dixit, M., Fernández-Solís, J., Lavy, S. and Culp, C. (2010). Identification of
parameters for embodied energy measurement: A literature review. Energy and
Buildings, 42(8), pp.1238-1247.
DOE (2000) Transpired Solar Collectors, this simple, low-cost solar technology
preheats ventilation air for commercial buildings (1st edition). US Department of
Energy Available at: http://www.nrel.gov/docs/fy00osti/23667.pdf (accessed 16/
12/ 14).
DOE (1998) Transpired Collectors (Solar Pre-heaters for Outdoor Ventilation Air) (1st
edition). US Department of Energy Available at:
https://www1.eere.energy.gov/femp/pdfs/FTA_trans_coll.pdf (accessed 16/ 12/
14).
Doe2.com, (2014a). DOE2.com Home Page. [online] Available at:
http://www.doe2.com/ [Accessed 27 Nov. 2014].
Doe2.com, (2014b). eQUEST. [online] Available at: http://www.doe2.com/equest/
[Accessed 27 Nov. 2014].
Doyle, M. (2008). Investigation of dynamic and steady state calculation methodologies
for determination of building energy performance in the context of the EPBD.
Masters. Dublin Institute of Technology.
DTI (2007) New Cladding Solutions to Produce a Step Change in Construction. UK:
Department of Trade and Industry, Project number: TP/2/MS/6/1/10377.

179
Duijve M (2012) Comparative assessment of insulating materials on technical,
environmental and health aspects for application in building renovation to the
Passive house level. Masters. Utrecht University.
EC.europa.eu, (2014). The 2020 climate and energy package - European Commission.
[online] Available at: http://ec.europa.eu/clima/policies/package/.
Ecoinvent.org, (2014). Database. [online] Available at:
http://www.ecoinvent.org/database/ [Accessed 27 Nov. 2014].
Edsl.net, (2014). EDSL: Home. [online] Available at: http://www.edsl.net/main/
[Accessed 27 Nov. 2014].
Energy Saving Trust (2009) Home Energy Efficiency Programmes | Energy Saving
Trust. [Online] Available at:
http://www.energysavingtrust.org.uk/scotland/domestic/improving-my-
home/home-energy-efficiency-programmes (accessed 16/ 12/ 14).
Envest2.bre.co.uk, (2014). Envest II. [online] Available at: http://envest2.bre.co.uk/
[Accessed 27 Nov. 2014].
Environdec.com (2014) What is an EPD®? - Environmental Product Declarations.
[Online] Available at: http://www.environdec.com/en/What-is-an-
EPD/#.VQAoBvmsXDI (accessed 11/ 03/ 15).
EPA.gov, (2014). US Environmental Protection Agency. [online] Available at:
http://www.epa.gov.
Erb M and Symons W (ed.) (2010). Vacuum insulation panel properties and building
applications. ECBCS Annex 39 Project Summary Report. Published by AECOM
Ltd, St Albans, UK.
European Commission (2007) Integrated Pollution Prevention and Control Reference
Document on Best Available Techniques for the Manufacture of Large Volume
Inorganic Chemicals – Solids and Others Industry. European Commission
Available at: http://eippcb.jrc.es/reference/BREF/lvic-s_bref_0907.pdf (accessed
09/ 04/ 12).
EvoEnergy (2012) History of UK Solar Photovoltaics | Solar PV | Evo Energy. [Online]
Available at: http://www.evoenergy.co.uk/i/uk-solar-pv/ (accessed 16/ 12/ 14).

180
Fine H (1989) Advanced Evacuated Thermal Insulations: The State of the Art. Journal
of Building Physics. 12 (3), 183-208.
Fricke J, Schwab H and Heinemann U (2006) Vacuum Insulation Panels – Exciting
Thermal Properties and Most Challenging Applications. International Journal of
Thermophysics. 27 (4), 1123-1139.
Fsec.ucf.edu (2014) History of Photovoltaics. [Online] Available at:
http://www.fsec.ucf.edu/en/consumer/solar_electricity/basics/history_of_pv.htm
(accessed 16/ 12/ 14).
Gabi-software.com, (2014). Life Cycle Assessment LCA Software: GaBi Software.
[online] Available at: http://www.gabi-software.com/uk-ireland/index/ [Accessed
27 Nov. 2014].
GISS.NASA.gov, (2014). NASA GISS: NASA Goddard Institute for Space Studies.
[online] Available at: http://www.giss.nasa.gov.
Gluch, P. and Baumann, H. (2004). The life cycle costing (LCC) approach: a conceptual
discussion of its usefulness for environmental decision-making. Building and
Environment, 39(5), pp.571-580.
Gorgolewski, M. (1995). Cost-effective renovation strategies for energy efficiency in
housing. PhD thesis. Oxford Brookes University.
Graham, G. (2014). Small housing developers exempt from 'zero carbon' home
regulations - Telegraph. [online] Telegraph.co.uk. Available at:
http://www.telegraph.co.uk/news/politics/liberaldemocrats/10868579/Small-
housing-developers-exempt-from-zero-carbon-home-regulations.html [Accessed 26
Nov. 2014].
Gustavsson, L. and Joelsson, A. (2010). Life cycle primary energy analysis of
residential buildings.Energy and Buildings, 42(2), pp.210-220.
Hacker J, De Saulles T, Minson A and Holmes M (2008) Embodied and operational
carbon dioxide emissions from housing: A case study on the effects of thermal
mass and climate change. Energy and Buildings. 40 (3), 375-384.

181
Hall R, Lawson M and Kendrick C (2014) Development of a cassette-panel transpired
solar collector.Proceedings of the ICE - Energy. 167 (1), 32-41.
Hall R, Ogden R, Elghali L and Wang X (2011) Transpired solar collectors for
ventilation air heating.Proceedings of the ICE - Energy. 164 (3), 101-110.
Hammond G and Jones C (2008). Inventory of Carbon & Energy (ICE), Sustainable
Energy Research Team (SERT), University of Bath, UK, 2008.
http://perigordvacance.typepad.com/files/inventoryofcarbonandenergy.pdf,
accessed on 06/03/2012. Health S (2014) Housing demand and need (England), House of Commons
Heinrich M (2007) Transpired Solar Collectors – Results of a Field Trial. Branz
Available at:
http://www.branz.co.nz/cms_show_download.php?id=16420014393cdb1186d99ff3
90e93ee9bec512c7 (accessed 16/ 12/ 14).
Hemp technology [Online] Available at:
http://www.hemptechnology.co.uk/environment (accessed 16/ 12/ 14).
Hensen, J. (2004). Towards more effective use of building performance simulation in
design. In: 7th International Conference on Design & Decision Support Systems in
Architecture and Urban Planning. Eindhoven.
Hernandez P and Kenny P (2010) From net energy to zero energy buildings: Defining
life cycle zero energy buildings (LC-ZEB). Energy and Buildings. 42 (6), 815-821.
HiPTI IEA/ECBCS Annex 39 (2005) Vacuum Insulation Panels - Study on VIP-
components and Panels for Service Life Prediction of VIP in Building Applications
(Subtask A) (1st edition) Available at:
http://www.ecbcs.org/docs/Annex_39_Report_Subtask-A.pdf (accessed 16/ 12/
14).
Hock, 2009. Thermo Hemp, insulate and feel well. [online] Available at:
<http://www.thermohanf.de/cms/upload/pdf/Englisch/TH_prospekt_engl.pdf>
[Accessed: 5 October 2011].
182
IEA.org, (2014). Publication:- Global Tracking Framework. [online] Available at:
http://www.iea.org/publications/freepublications/publication/global-tracking-
framework.html.
Iesve.com, (2014). Integrated Environmental Solutions. [online] Available at:
http://www.iesve.com/ [Accessed 27 Nov. 2014].
IPCC, 2007: Climate Change 2007: Synthesis Report. Contribution of Working Groups
I, II and III to the Fourth Assessment Report of the Intergovernmental Panel on
Climate Change [Core Writing Team, Pachauri, R.K and Reisinger, A.(eds.)].
IPCC, Geneva, Switzerland, 104 pp.
Jelle B (2011) Traditional, state-of-the-art and future thermal building insulation
materials and solutions – Properties, requirements and possibilities. Energy and
Buildings. 43 (10), 2549-2563.
Jiménez-González, C., Kim, S. and Overcash, M. (2000). Methodology for developing
gate-to-gate Life cycle inventory information. The International Journal of Life
Cycle Assessment, 5(3), pp.153-159.
Jones C and Hammond G (2008) Inventory of Carbon & Energy (ICE) (1st edition).
Bath: Sustainable Energy Research Team (SERT), University of Bath Available at:
http://perigordvacance.typepad.com/files/inventoryofcarbonandenergy.pdf,
accessed (accessed 15/ 04/ 12).
Kennedy S, Whiteman G and Van Den Ende J (2013) Enhancing Radical Innovation
Using Sustainability as a Strategic Choice. London: Erasmus University. Available
at: http://www.hbs.edu/faculty/conferences/2013-sustainability-and-
corporation/Documents/Enhancing_radical_innovation_using_sustainability_as_a_
strategic_choice.pdf (accessed 11/ 10/ 15).
Klein H and Zwerger M (2005) Integration of VIP's into external wall insulation
system. In: 7th International Vacuum Insulation Symposium (IVIS’05). Dübendorf.
Maile T, Fischer M and Bazjanac V (2007) Building Energy Performance Simulation
Tools - a Life-Cycle and interoperable perspective. Stanford University, CIFE
Working Paper #WP107

183
Malmqvist, T., Glaumann, M., Scarpellini, S., Zabalza, I., Aranda, A., Llera, E. and
Díaz, S. (2011). Life cycle assessment in buildings: The ENSLIC simplified
method and guidelines. Energy, 36(4), pp.1900-1907.
Manuilova, A., Hallberg, K., Sanne, K., Widheden, J. and Bogeskär, M. (2005).
DANTES: a demonstration project for sustainable development. Management of
Env Quality, 16(2), pp.143-152.
Materna R (2001) VIP's for advanced retrofit solutions for buildings. In: the
International Conference and Workshop on High Performance Thermal Insulation
Systems - Vacuum Insulated Products (VIP). Duebendorf: International Energy
Agency. 55-62.
McAdam, B. (2007). Policy for Reducing Carbon Emissions from Buildings in England.
1st ed. Royal Institute of Chartered Surveyors.
McHendry, Stuart. 'The Embodied Energy And Carbon Of Passive House'. Masters. University of Strathclyde, 2013. Print.
Mitigation2014.org, (2014). IPCC: Greenhouse gas emissions accelerate despite
reduction efforts — IPCC WGIII Fifth Assessment Report - Mitigation of Climate
Change 2014. [online] Available at:
http://mitigation2014.org/communication/press-release.
Modernmasonry.co.uk (2014) Modern Masonry Alliance - Home. [Online] Available at:
http://www.modernmasonry.co.uk/ (accessed 16/ 12/ 14).
Monahan, J. and Powell, J. (2011). An embodied carbon and energy analysis of modern
methods of construction in housing: A case study using a lifecycle assessment
framework. Energy and Buildings, 43(1), pp.179-188.
NIBC, (2013). Life-Cycle Cost Analysis (LCCA) | Whole Building Design Guide.
[online] Wbdg.org. Available at: http://wbdg.org/resources/lcca.php?r=secondary
[Accessed 27 Nov. 2014].
Nussbaumer T, Wakili K and Tanner C (2006) Experimental and numerical
investigation of the thermal performance of a protected vacuum-insulation system
applied to a concrete wall. Applied Energy. 83 (8), 841-855.

184
Ogden R (2007) Thin Wall Technology Building Cladding Using Vacuum Insulation.
In: 8th International Vacuum Insulation Symposium (IVIS’07). Würzburg: IVIS.
Ogden R and Kendrick C (2015) VIP cladding panels for buildings: applications and
conceptual solutions. In: 7th International Vacuum Insulation Symposium
(IVIS’05). Dübendorf.
Ogden R, Kendrick C and Wang X (2009). Economic case for vacuum insulation in
mainstream new build construction applications. In: Proceedings of 9th
International Vacuum Insulation Symposium (IVIS’09), 17-18 September, 2009.
London, UK.
Ogden R, Wang X and Kendrick C (2011) High performance steel cladding systems
using vacuum technology. In: 10th International Vacuum Insulation Symposium.
Ottawa.
ONS (2010) New orders in the construction industry, Statistical Bulletin from Office for
National Statistics Available at: http://www.ons.gov.uk/ons/rel/construction/new-
orders-in-the-construction-industry/q1--2010/new-orders-in-the-construction-
industry.pdf (accessed 15/ 04/ 13).
Papadopoulos A (2005) State of the art in thermal insulation materials and aims for
future developments. Energy and Buildings. 37 (1), 77-86.
Planningportal.gov.uk, (2014). Planning Portal - The UK Government's online planning
and building regulations resource. [online] Available at:
http://www.planningportal.gov.uk [Accessed 26 Nov. 2014].
Ramesh T, Prakash R and Shukla K (2010) Life cycle energy analysis of buildings: An
overview.Energy and Buildings. 42 (10), 1592-1600.
Ravetz J (2008) State of the stock—What do we know about existing buildings and
their future prospects?. Energy Policy. 36 (12), 4462-4470.
Retscreen.net, (2014). RETScreen International Home. [online] Available at:
http://www.retscreen.net/ang/home.php [Accessed 27 Nov. 2014].
RIBA (2011) The case for space (1st edition). Royal Institute of British Architects
Available at:
185
http://www.architecture.com/Files/RIBAHoldings/PolicyAndInternationalRelations
/HomeWise/CaseforSpace.pdf (accessed 16/ 12/ 14).
RICS (2012). Methodology To Calculate Embodied Carbon Of Materials. Royal Institution of Chartered Surveyors, 2012. Print. RICS Information Paper.
Rossi, B., Marique, A., Glaumann, M. and Reiter, S. (2012). Life-cycle assessment of
residential buildings in three different European locations, basic tool. Building and
Environment, 51, pp.395-401.
Rum M and Akasah Z (2012) Implementing Life Cycle Costing in Malaysian
Construction Industry: A Review. Civil Engineering and Architecture. 6 (9), 1202-
1209.
Sartori I and Hestnes A (2007) Energy use in the life cycle of conventional and low-
energy buildings: A review article. Energy and Buildings. 39 (3), 249-257.
Schade J (2007) Life cycle cost calculation models for buildings. In: Proceedings of 4th
Nordic Conference on Construction Economics and Organisation: Development
Processes in Construction Mangement. Luleå: Luleå tekniska universitet. 321-329.
Available at: http://pure.ltu.se/portal/en/publications/life-cycle-cost-calculation-
models-for-buildings (68045cb0-6a70-11dc-9e58-000ea68e967b).html.
Science1.nasa.gov (2014) How do Photovoltaics Work? - NASA Science. [Online]
Available at: http://science1.nasa.gov/science-news/science-at-nasa/2002/solarcells
(accessed 16/ 12/ 14).
SCS Global Services, (2013). Environmental Claims. [online] Scsglobalservices.com.
Available at: http://www.scsglobalservices.com/environmental-claims [Accessed
27 Nov. 2014].
Sel.me.wisc.edu, (2014). TRNSYS - Official Website. [online] Available at:
http://sel.me.wisc.edu/trnsys/features/ [Accessed 27 Nov. 2014].
Simapro.co.uk, (2014). Home. [online] Available at: http://www.simapro.co.uk/
[Accessed 27 Nov. 2014].
Simmler H and Brunner S (2005) Vacuum insulation panels for building
application. Energy and Buildings. 37 (11), 1122-1131.

186
Simon, C. (2013). Climate Change: Action, Trends And Implications For Business. 1st
ed. [ebook] IPCC. Available at: http://www.europeanclimate.org.
Singh, S. and Bakshi, R. (2009). Eco-LCA: A Tool for Quantifying the Role of
Ecological Resources in LCA. International Symposium on Sustainable Systems
and Technology, (ISBN 978-1-4244-4324-6), pp.1-6.
Steelconstruction.info (2015) Cost of structural steelwork. [Online] Available at:
http://www.steelconstruction.info/Cost_of_structural_steelwork#Market_share_tre
nd_in_UK_multi-storey_construction (accessed 24/ 04/ 15).
Strand, R. and Pedersen, C. (2001). Modularization and Simulation Techniques for Heat
Balance Based Energy and Load Calculation Programs: The Experience of the
ASHRAE Loads Toolkit And EnergyPlus. In: Proceedings of Building Simulation.
Rio de Janiero: IBPSA, pp.43-50.
Strickland, D. (2005). Environmental Change Institute (ECI) - Oxford University.
[online] Eci.ox.ac.uk. Available at:
http://www.eci.ox.ac.uk/research/energy/40house.php [Accessed 26 Nov. 2014].
Sustainabilityworkshop.autodesk.com, (2014). Ecotect: Heat Gains/Losses |
Sustainability Workshop. [online] Available at:
http://sustainabilityworkshop.autodesk.com/buildings/ecotect-heat-gainslosses
[Accessed 27 Nov. 2014].
Symons W and Erb M (2010) Vacuum insulation panel properties and building
applications. St Albans: AECOM Ltd
Tao W H, Chang C C and Lin J Y (2000). An energy-efficiency, performance study of
vacuum insulation panels. Journal of Cellular Plastics 36(6) 441-450.
TAO W, CHANG C and LIN J (2000) An Energy-Efficiency Performance Study of
Vacuum Insulation Panels. Journal of Cellular Plastics. 36 (6), 441-450.
Target Zero (2011) Guidance on the design and construction of sustainable, low carbon
warehouse buildings. TATA Steel/BCSA Available at:
http://www.steelconstruction.info/Target_Zero
TATA (2014) The whole story from Cradle to Grave. [Online] Available at:
http://www.tatasteelconstruction.com/static_files/Construction%20UK/sustainabilit

187
y/The%20Whole%20Story/FINAL%20full%20supplement%20dps%20%287MB%
29.pdf
TATA Steel (2012) Colorcoat High Reflect (1st edition). TATA Steel Available at:
http://www.colorcoatonline.com/file_source/Colorcoat%20Online/New%20Colorc
oat/Colorcoat%20High%20Refelect%20data%20sheet.pdf (accessed 26/ 01/ 15).
Tenpierik M (2009) Vacuum insulation panels applied in building constructions. PhD.
Technical University of Delft.
Tenpierik M, Cauberg J and Thorsell T (2007) Integrating vacuum insulation panels in
building constructions: an integral perspective. Construction Innovation:
Information, Process, Management. 7 (1), 38-53.
Tenpierik M and Cauberg H (2006) Vacuum insulation panel: friend or foe?. In: 23rd
Conference on Passive and Low Energy Architecture. Geneva.
The EU Emissions Trading System (EU ETS). (2013). Fact sheet. European
Commission.
The Guardian, (2011). What is the Kyoto protocol and has it made any difference?.
[online] Available at:
http://www.theguardian.com/environment/2011/mar/11/kyoto-protocol.
Theccc.org.uk, (2014). The Climate Change Act and UK regulations | Committee on
Climate Change. [online] Available at: http://www.theccc.org.uk/tackling-climate-
change/the-legal-landscape/global-action-on-climate-change.
Thegreenstandard.org, (2014). [online] Available at: http://www.thegreenstandard.org
[Accessed 27 Nov. 2014].
Thormark, C. (2002). A low energy building in a life cycle—its embodied energy,
energy need for operation and recycling potential. Building and Environment,
37(4), pp.429-435.
Tingley D and Davison B (2011) Design for deconstruction and material
reuse. Proceedings of the ICE - Energy. 164 (4), 195-204.
188
Trends In Global CO2 Emissions. (2012). 1st ed. [ebook] PBL Netherlands
Environmental Assessment Agency. Available at:
http://edgar.jrc.ec.europa.eu/CO2REPORT2012.pdf.
UK Green Building Council,. Tackling Embodied Carbon In Buildings. The Crown Estate, 2014. Print.
Ukpower.co.uk (2015) Energy Prices Forecast: The Future of Gas and Electricity. [Online] Available at: http://www.ukpower.co.uk/home_energy/future-gas-electricity-price-forecast (accessed 20/ 04/ 15).
UNEP, (2005). Life Cycle Approaches the road from analysis to practice. 1st ed. United
Nations.
UNEP (2003) Sustainable building and construction: facts and figures (1st edition)
Available at: http://www.uneptie.org/media/review/vol26no2-3/005-098.pdf
Unfccc.int (2015) Untitled. [Online] Available at:
http://unfccc.int/cop3/fccc/climate/fact03.htm (accessed 20/ 02/ 15).
United Nations. (2014). Kyoto Protocol. [online] Unfccc.int. Available at:
http://unfccc.int/kyoto_protocol/items/2830.php.
Usa.autodesk.com, (2014). Ecotect Analysis - Sustainable Building Design Software -
Autodesk. [online] Available at: http://usa.autodesk.com/ecotect-analysis/
[Accessed 27 Nov. 2014].
Valuation Office Agency (2011) Property Market Report. London: Crown copyrights
Wakili K, Bundi R and Binder B (2004) Effective thermal conductivity of vacuum
insulation panels.Building Research & Information. 32 (4), 293-299.
Wang X, Kendrick C, Ogden R, Walliman N and Baiche B (2013) A case study on
energy consumption and overheating for a UK industrial building with
rooflights. Applied Energy. 104, 337-344.
Wang X, Walliman N, Ogden R and Kendrick C (2007) VIPs and their applications in
buildings: a review. ICE - Construction Materials. 160 (4), 145-153.
Willis, Rebecca (2014) Paris 2015 Getting A Global Agreement On Climate Change. London: Green Alliance,.

189
Worldwatch.org (2015) Energy Agency Predicts High Prices in Future | Worldwatch Institute. [Online] Available at: http://www.worldwatch.org/node/5936 (accessed 20/ 04/ 15).
Wright, G, and K Klingenberg. (2015) Climate-Specific Passive Building Standards. Westford: US Department of Energy. Print. Building America Report.
Yan Q and Zheng C (2011) Life Cycle Energy Statistical Analysis Of Buildings By
Literature Review.Energy Procedia. 11, 2489-2496.
Yohanis Y and Norton B (2002) Life-cycle operational and embodied energy for a
generic single-storey office building in the UK. Energy. 27 (1), 77-92.
Yrieix, Bernard, Benoît Morel, and Emmanuelle Pons (2014) 'VIP Service Life Assessment: Interactions Between Barrier Laminates And Core Material, And Significance Of Silica Core Ageing'. Energy and Buildings 85: 617-630. Web.
Zero Carbon Hub, (2014). Zero Carbon Policy. [online] Available at: :
http://www.zerocarbonhub.org/what-we-do [Accessed 26 Nov. 2014].
Zwerger M and Klein H (2005). Integration of VIP's into external wall insulation
system. In: Proceedings of 7th International Vacuum Insulation Symposium
(IVIS’05), 28-29September 2005. Dübendorf, Switzerland.

190
Appendix A
Process energy calculation technique applied to VIPs

191
Process energy calculation technique applied to VIPs
• Pump energy associated with evacuation (Pump EE)
Assume vacuum pump energy is: w=p×V×k/(k-1) [(p2/p1)^((k-1)/k)-1]
= 1.0135 × 0.144 × (1.4 ÷ (1.4 ˗ 1)) × ((1.0130.05 ((1.4 ˗ 1) ÷ 1.4) ˗ 1) = 317740 J
Where:
W = Energy,
p = pressure,
V = Volume of vacuum vessel,
k = Adiabatic constant of air,
p2/p1 = Pressure ratio (atmospheric to vacuum)
Assuming normal levels of mechanical inefficiency (67% volumetric inefficiency of
pump chamber and 59% electric motor efficiency) the above figure changes to 803795J
Commonly two VIP panels are evacuated at the same time and the total typical weight
is 4.32kg (based on 2 × 1000 × 600 × 20mm panels). Evacuation energy is therefore:
(803795 ÷ 4.32) / 106 = 0.186 MJ/kg
• Drying energy
Energy required to dry panels at 150 °C = mass × specific heat capacity × temperature
difference for both air and panels = 0.108 MJ/kg + losses
Assume 20% losses total figure becomes 0.130 MJ/kg
• Total evacuation plus drying energy
Pump energy associated with evacuation plus drying energy = 0.316 MJ/kg
This equates to 0.0475 kgCO2/kg (based on 0.542 kgCO2/KWh conversion factor).
Embodied energy of fumed silica core = 0.9438 kgCO2/kg
• Embodied energy of barrier material (Barrier EE)
Again assume 1000x600x20mm panels
Fumed silica volume = 1 × 0.6 × 0.02 = 0.012 m3

192
Barrier's area = 2 × 1 × 0.6 + 0.02 × 3.2 = 1.264 m2
Assume barrier thickness of 60 micros, the volume of the barrier is (1.264 × 60) ÷ 106 =
0.00007584 m3
Ratio of percentage of barrier volume to panel volume: 0.00007584 ÷ 0.012 = 0.63%
Notional embodied CO2 of barrier material: 1.57 kgCO2/kg
• Total CO2 for panel excluding barrier
Evacuation plus drying energy + EE of core = 0.0475 + 0.9438 = 0.9913 kgCO2/kg
• Total embodied energy of panel including barrier
Assume 1 kg of fumed silica requires 0.0063 kg barrier
Total embodied energy = 0.9913 + (0.0063 × 1.57) = 1.001 kgCO2/kg

193
Appendix B Appendix B includes full background calculation tables associated with each
‘technology package’ (A to M) investigated in Chapter 7. The 2010 Notional Building
fabric has been assumed to be the basecase scenario.
The analyses have been carried out for office buildings with and without taking into
account the rental loss/gain associated with the thickness of the cladding system. Two
regions in London (City and West-End) have been used for rental value analyses
comparisons.
Mineral wool and PUR as two mainstream conventional insulation materials have been
used for the analyses in all cases.

194
Table B. 1 Distribution warehouse – PV (current FiT) + improving the building fabric U-value down to 0.07-0.1 W/m2.K (mineral wool)
provided Elec. by PV
PV area m2
Heating (KWh/m2)
Lighting (KWh/m2)
Hot water (KWh/m2)
generated Elec by PV
(KWh)
purchased from grid
elec (KWh)
Exported Elec
(KWh)
Elec Cost £
Energy cost Inc
FIT
Wall Insulation price £/m2
Roof Insulation price £/m2
Total Insulation
price £
PV cost £
Fabric cost £
Operational CO2
(kgCO2/m2.yr)
PV ECO2
(kgCO2/m2.yr)
Insulation ECO2
(kgCO2/m2.yr)
Total CO2
(kgCO2/m2.yr)CO2 saving
%
Energy saving (A)
£
PV(A) £
NPV £
Payback period (years)
0 0 57.29 13.97 4.96 0 0 0 5867.4 13337.4 43.70 35.00 195010.00 0.00 195010.00 19.53 0.00 0.80 20.33 0.00 0.00 0.00 0.00 025% 94 57.29 10.4775 4.96 12404.8134 30259.929 203.1794 2428.549 9898.549 43.70 35.00 195010.00 17257.06 212267.06 17.46 0.30 0.80 18.56 8.70 3438.85 80775.10 63518.04 550% 187 57.29 6.985 4.96 24677.6607 23563.4558 6327.852 -564.13 6905.8697 43.70 35.00 195010.00 34514.12 229524.12 15.21 0.60 0.80 16.62 18.26 6431.53 151070.08 116555.97 5.575% 281 57.29 3.4925 4.96 37082.4741 19750.3654 14919.21 -3283.27 4186.7281 43.70 35.00 195010.00 51771.18 246781.18 13.05 0.91 0.80 14.75 27.43 9150.67 214939.95 163168.77 5.75
100% 375 57.29 0 4.96 49487.2875 17131.2544 24705.64 -5889.03 1580.9652 43.70 35.00 195010.00 69028.24 264038.24 10.88 1.21 0.80 12.89 36.61 11756.43 276146.66 207118.42 6Carbon Offset 1025 57.29 0 4.96 135265.253 8452.17178 101804.5 -23011.4 -15541.36 43.70 35.00 195010.00 222789.83 417799.83 -4.12 3.31 0.80 -0.02 100.08 28878.76 678332.63 455542.80 8
provided Elec. by PV
PV area m2
Heating (KWh/m2)
Lighting (KWh/m2)
Hot water (KWh/m2)
generated Elec by PV
(KWh)
purchased from grid
elec (KWh)
Exported Elec
(KWh)
Elec Cost £
Energy cost Inc
FIT
Wall Insulation price £/m2
Roof Insulation price £/m2
Total Insulation
price £
PV cost £
Fabric cost £
Operational CO2
(kgCO2/m2.yr)
PV ECO2
(kgCO2/m2.yr)
Insulation ECO2
(kgCO2/m2.yr)
Total CO2
(kgCO2/m2.yr)CO2 saving
%
Energy saving (A)
£
PV(A) £
NPV £
Payback period (years)
0 0 57.29 13.97 4.96 0 0 0 5867.4 13337.4 43.70 35.00 195010.00 0.00 195010.00 19.53 0.00 0.80 20.33 0.00 0.00 0.00 0.00 025 94 55.4 10.4775 4.96 12404.8134 30259.929 203.1794 2428.549 9671.749 44.30 35.70 198280.00 17257.06 215537.06 17.09 0.30 0.88 18.27 10.13 3665.65 86102.40 65575.34 5.7550 187 55.4 6.985 4.96 24677.6607 23563.4558 6327.852 -564.13 6679.0697 44.30 35.70 198280.00 34514.12 232794.12 14.84 0.60 0.88 16.33 19.68 6658.33 156397.39 118613.27 5.7575 281 55.4 3.4925 4.96 37082.4741 19750.3654 14919.21 -3283.27 3959.9281 44.30 35.70 198280.00 51771.18 250051.18 12.68 0.91 0.88 14.46 28.86 9377.47 220267.25 165226.07 6100 375 55.4 0 4.96 49487.2875 17131.2544 24705.64 -5889.03 1354.1652 44.30 35.70 198280.00 69028.24 267308.24 10.51 1.21 0.88 12.60 38.04 11983.23 281473.96 209175.72 6.15
Carbon Offset 1012 55.4 0 4.96 133549.693 8562.09068 100198.9 -22675 -15431.76 44.30 35.70 198280.00 219964.20 418244.20 -4.19 3.27 0.88 -0.05 100.24 28769.16 675758.27 452524.07 7.9
provided Elec. by PV
PV area m2
Heating (KWh/m2)
Lighting (KWh/m2)
Hot water (KWh/m2)
generated Elec by PV
(KWh)
purchased from grid
elec (KWh)
Exported Elec
(KWh)
Elec Cost £
Energy cost Inc
FIT
Wall Insulation price £/m2
Roof Insulation price £/m2
Total Insulation
price £
PV cost £
Fabric cost £
Operational CO2
(kgCO2/m2.yr)
PV ECO2
(kgCO2/m2.yr)
Insulation ECO2
(kgCO2/m2.yr)
Total CO2
(kgCO2/m2.yr)CO2 saving
%
Energy saving (A)
£
PV(A) £
NPV £
Payback period (years)
0 0 57.29 13.97 4.96 0 0 0 5867.4 13337.4 43.70 35.00 195010.00 0.00 195010.00 19.53 0.00 0.80 20.33 0.00 0.00 0.00 0.00 025 94 52.88 10.4775 4.96 12404.8134 30259.929 203.1794 2428.549 9369.349 45.00 36.40 201780.00 17257.06 219037.06 16.59 0.30 0.95 17.85 12.22 3968.05 93205.47 69178.41 6.1550 187 52.88 6.985 4.96 24677.6607 23563.4558 6327.852 -564.13 6376.6697 45.00 36.40 201780.00 34514.12 236294.12 14.35 0.60 0.95 15.90 21.77 6960.73 163500.45 122216.33 675 281 52.88 3.4925 4.96 37082.4741 19750.3654 14919.21 -3283.27 3657.5281 45.00 36.40 201780.00 51771.18 253551.18 12.18 0.91 0.95 14.04 30.95 9679.87 227370.31 168829.14 6.15100 375 52.88 0 4.96 49487.2875 17131.2544 24705.64 -5889.03 1051.7652 45.00 36.40 201780.00 69028.24 270808.24 10.01 1.21 0.95 12.17 40.13 12285.63 288577.03 212778.79 6.3
Carbon Offset 988 52.88 0 4.96 130382.507 8767.56876 97237.17 -22053.7 -15112.88 45.00 36.40 201780.00 214747.66 416527.66 -4.13 3.19 0.95 0.00 99.98 28450.28 668267.97 446750.31 7.95
provided Elec. by PV
PV area m2
Heating (KWh/m2)
Lighting (KWh/m2)
Hot water (KWh/m2)
generated Elec by PV
(KWh)
purchased from grid
elec (KWh)
Exported Elec
(KWh)
Elec Cost £
Energy cost Inc
FIT
Wall Insulation price £/m2
Roof Insulation price £/m2
Total Insulation
price £
PV cost £
Fabric cost £
Operational CO2
(kgCO2/m2.yr)
PV ECO2
(kgCO2/m2.yr)
Insulation ECO2
(kgCO2/m2.yr)
Total CO2
(kgCO2/m2.yr)CO2 saving
%
Energy saving (A)
£
PV(A) £
NPV £
Payback period (years)
0 0 57.29 13.97 4.96 0 0 0 5867.4 13337.4 43.70 35.00 195010.00 0.00 195010.00 19.53 0.00 0.80 20.33 0.00 0.00 0.00 0.00 025 94 50.84 10.4775 4.96 12404.8134 30259.929 203.1794 2428.549 9124.549 48.60 37.00 211680.00 17257.06 228937.06 16.19 0.30 1.12 17.62 13.35 4212.85 98955.57 65028.51 8.2550 187 50.84 6.985 4.96 24677.6607 23563.4558 6327.852 -564.13 6131.8697 48.60 37.00 211680.00 34514.12 246194.12 13.95 0.60 1.12 15.67 22.90 7205.53 169250.55 118066.44 7.275 281 50.84 3.4925 4.96 37082.4741 19750.3654 14919.21 -3283.27 3412.7281 48.60 37.00 211680.00 51771.18 263451.18 11.78 0.91 1.12 13.81 32.08 9924.67 233120.42 164679.24 7.05100 375 50.84 0 4.96 49487.2875 17131.2544 24705.64 -5889.03 806.96519 48.60 37.00 211680.00 69028.24 280708.24 9.61 1.21 1.12 11.94 41.26 12530.43 294327.13 208628.89 7
Carbon Offset 975 50.84 0 4.96 128666.948 8880.38437 95700.43 -21720 -15023.97 48.60 37.00 211680.00 211922.03 423602.03 -4.25 3.15 1.12 0.02 99.90 28361.37 666179.71 437587.68 8.25
provided Elec. by PV
PV area m2
Heating (KWh/m2)
Lighting (KWh/m2)
Hot water (KWh/m2)
generated Elec by PV
(KWh)
purchased from grid
elec (KWh)
Exported Elec
(KWh)
Elec Cost £
Energy cost Inc
FIT
Wall Insulation price £/m2
Roof Insulation price £/m2
Total Insulation
price £
PV cost £
Fabric cost £
Operational CO2
(kgCO2/m2.yr)
PV ECO2
(kgCO2/m2.yr)
Insulation ECO2
(kgCO2/m2.yr)
Total CO2
(kgCO2/m2.yr)CO2 saving
%
Energy saving (A)
£
PV(A) £
NPV £
Payback period (years)
0 0 57.29 13.97 4.96 0 0 0 5867.4 13337.4 43.70 35.00 195010.00 0.00 195010.00 19.53 0.00 0.80 20.33 0.00 0.00 0.00 0.00 025 94 48.8 10.4775 4.96 12404.8134 30259.929 203.1794 2428.549 8879.749 50.40 38.40 219600.00 17257.06 236857.06 15.79 0.30 1.2 17.30 14.92 4457.65 104705.67 62858.61 9.6550 187 48.8 6.985 4.96 24677.6607 23563.4558 6327.852 -564.13 5887.0697 50.40 38.40 219600.00 34514.12 254114.12 13.55 0.60 1.2 15.35 24.47 7450.33 175000.66 115896.54 8.1575 281 48.8 3.4925 4.96 37082.4741 19750.3654 14919.21 -3283.27 3167.9281 50.40 38.40 219600.00 51771.18 271371.18 11.38 0.91 1.2 13.49 33.65 10169.47 238870.52 162509.34 7.7100 375 48.8 0 4.96 49487.2875 17131.2544 24705.64 -5889.03 562.16519 50.40 38.40 219600.00 69028.24 288628.24 9.21 1.21 1.2 11.62 42.83 12775.23 300077.23 206458.99 7.5
Carbon Offset 963 48.8 0 4.96 127083.354 8985.40957 94155.86 -21406.1 -14954.94 50.40 38.40 219600.00 209313.76 428913.76 -4.36 3.11 1.2 -0.05 100.24 28292.34 664558.26 430654.50 8.45
provided Elec. by PV
PV area m2
Heating (KWh/m2)
Lighting (KWh/m2)
Hot water (KWh/m2)
generated Elec by PV
(KWh)
purchased from grid
elec (KWh)
Exported Elec
(KWh)
Elec Cost £
Energy cost Inc
FIT
Wall Insulation price £/m2
Roof Insulation price £/m2
Total Insulation
price £
PV cost £
Fabric cost £
Operational CO2
(kgCO2/m2.yr)
PV ECO2
(kgCO2/m2.yr)
Insulation ECO2
(kgCO2/m2.yr)
Total CO2
(kgCO2/m2.yr)CO2 saving
%
Energy saving (A)
£
PV(A) £
NPV £
Payback period (years)
0 0 57.29 13.97 4.96 0 0 0 5867.4 13337.4 43.70 35.00 195010.00 0.00 195010.00 19.53 0.00 0.80 20.33 0.00 0.00 0.00 0.00 025 94 47.4 10.4775 4.96 12404.8134 30259.929 203.1794 2428.549 8711.749 52.20 39.00 225360.00 17257.06 242617.06 15.52 0.30 1.3 17.12 15.78 4625.65 108651.82 61044.76 10.5550 187 47.4 6.985 4.96 24677.6607 23563.4558 6327.852 -564.13 5719.0697 52.20 39.00 225360.00 34514.12 259874.12 13.28 0.60 1.3 15.18 25.33 7618.33 178946.81 114082.69 8.7575 281 47.4 3.4925 4.96 37082.4741 19750.3654 14919.21 -3283.27 2999.9281 52.20 39.00 225360.00 51771.18 277131.18 11.11 0.91 1.3 13.31 34.51 10337.47 242816.67 160695.49 8.15100 375 47.4 0 4.96 49487.2875 17131.2544 24705.64 -5889.03 394.16519 52.20 39.00 225360.00 69028.24 294388.24 8.94 1.21 1.3 11.45 43.69 12943.23 304023.38 204645.14 7.85
Carbon Offset 950 47.4 0 4.96 125367.795 9100.43548 92555.33 -21069.3 -14786.06 52.20 39.00 225360.00 206488.13 431848.13 -4.33 3.07 1.3 0.03 99.83 28123.46 660591.36 423753.22 8.6
provided Elec. by PV
PV area m2
Heating (KWh/m2)
Lighting (KWh/m2)
Hot water (KWh/m2)
generated Elec by PV
(KWh)
purchased from grid
elec (KWh)
Exported Elec
(KWh)
Elec Cost £
Energy cost Inc
FIT
Wall Insulation price £/m2
Roof Insulation price £/m2
Total Insulation
price £
PV cost £
Fabric cost £
Operational CO2
(kgCO2/m2.yr)
PV ECO2
(kgCO2/m2.yr)
Insulation ECO2
(kgCO2/m2.yr)
Total CO2
(kgCO2/m2.yr)CO2 saving
%
Energy saving (A)
£
PV(A) £
NPV £
Payback period (years)
0 0 57.29 13.97 4.96 0 0 0 5867.4 13337.4 43.70 35.00 195010.00 0.00 195010.00 19.53 0.00 0.80 20.33 0.00 0.00 0.00 0.00 025 94 44 10.4775 4.96 12404.8134 30259.929 203.1794 2428.549 8303.749 63.00 43.00 261000.00 17257.06 278257.06 14.85 0.30 1.84 17.00 16.40 5033.65 118235.32 34988.27 17.350 187 44 6.985 4.96 24677.6607 23563.4558 6327.852 -564.13 5311.0697 63.00 43.00 261000.00 34514.12 295514.12 12.61 0.60 1.84 15.05 25.95 8026.33 188530.31 88026.19 1375 281 44 3.4925 4.96 37082.4741 19750.3654 14919.21 -3283.27 2591.9281 63.00 43.00 261000.00 51771.18 312771.18 10.44 0.91 1.84 13.19 35.13 10745.47 252400.17 134639.00 11.25100 375 44 0 4.96 49487.2875 17131.2544 24705.64 -5889.03 -13.83481 63.00 43.00 261000.00 69028.24 330028.24 8.27 1.21 1.84 11.32 44.31 13351.23 313606.88 178588.65 10.4
Carbon Offset 944 44 0 4.96 124575.998 9153.99913 91817.09 -20913.7 -15038.53 63.00 43.00 261000.00 205184.00 466184.00 -4.86 3.05 1.84 0.03 99.87 28375.93 666521.62 395347.62 9.8
provided Elec. by PV
PV area m2
Heating (KWh/m2)
Lighting (KWh/m2)
Hot water (KWh/m2)
generated Elec by PV
(KWh)
purchased from grid
elec (KWh)
Exported Elec
(KWh)
Elec Cost £
Energy cost Inc
FIT
Wall Insulation price £/m2
Roof Insulation price £/m2
Total Insulation
price £
PV cost £
Fabric cost £
Operational CO2
(kgCO2/m2.yr)
PV ECO2
(kgCO2/m2.yr)
Insulation ECO2
(kgCO2/m2.yr)
Total CO2
(kgCO2/m2.yr)CO2 saving
%
Energy saving (A)
£
PV(A) £
NPV £
Payback period (years)
0 0 57.29 13.97 4.96 0 0 0 5867.4 13337.4 43.70 35.00 195010.00 0.00 195010.00 19.53 0.00 0.80 20.33 0.00 0.00 0.00 0.00 025 94 43 10.4775 4.96 12404.8134 30259.929 203.1794 2428.549 8183.749 66.60 44.70 273870.00 17257.06 291127.06 14.66 0.30 2 16.96 16.58 5153.65 121054.00 24936.94 19.550 187 43 6.985 4.96 24677.6607 23563.4558 6327.852 -564.13 5191.0697 66.60 44.70 273870.00 34514.12 308384.12 12.41 0.60 2 15.02 26.13 8146.33 191348.99 77974.87 14.575 281 43 3.4925 4.96 37082.4741 19750.3654 14919.21 -3283.27 2471.9281 66.60 44.70 273870.00 51771.18 325641.18 10.24 0.91 2 13.15 35.31 10865.47 255218.85 124587.67 12.45100 375 43 0 4.96 49487.2875 17131.2544 24705.64 -5889.03 -133.8348 66.60 44.70 273870.00 69028.24 342898.24 8.08 1.21 2 11.29 44.49 13471.23 316425.56 168537.32 11.3
Carbon Offset 943 43 0 4.96 124575.998 9153.99913 91817.09 -20913.7 -15158.53 66.60 44.70 273870.00 205184.00 479054.00 -5.05 3.04 2 -0.01 100.06 28495.93 669340.30 385296.30 10.25
PV + 0.08 - 0.11
PV + 0.07 - 0.10
PV + 2010 notional building fabric
Storage and Distribution Warehouse-London
PV + 0.17 - 0.24
PV + 0.15 - 0.21
PV + 0.13 - 0.19
PV + 0.12 - 0.17
PV + 0.11 - 0.15
PV (current FiT)+Insulation

195
Table B. 2 Distribution warehouse – PV (future FiT) + improving the building fabric U-value down to 0.07-0.1 W/m2.K (mineral wool)
provided Elec. by PV
PV area m2
Heating (KWh/m2)
Lighting (KWh/m2)
Hot water (KWh/m2)
generated Elec by PV
(KWh)
purchased from grid
elec (KWh)
Exported Elec (KWh)
Elec Cost £Energy cost Inc
FIT
Wall Insulation price £/m2
Roof Insulation price £/m2
Total Insulation
price £
PV cost £
Fabric cost £
Operational CO2
(kgCO2/m2.yr)
PV ECO2
(kgCO2/m2.yr)
Insulation ECO2
(kgCO2/m2.yr)
Total CO2
(kgCO2/m2.yr)CO2
saving %
Energy saving (A) £
PV(A) £
NPV £
Payback period (years)
0 0.00 57.29 13.97 4.96 0.00 0.00 0.00 5867.40 13337.40 43.70 35.00 195010.00 0.00 195010.00 19.53 0.00 0.80 20.33 0.00 0.00 0.00 0.00 0.0025% 94.00 57.29 10.48 4.96 12404.81 30259.93 203.18 4227.25 11697.25 43.70 35.00 195010.00 17257.06 212267.06 17.46 0.30 0.80 18.56 8.70 1640.15 38525.52 21268.46 11.0050% 187.00 57.29 6.99 4.96 24677.66 23563.46 6327.85 3014.13 10484.13 43.70 35.00 195010.00 34514.12 229524.12 15.21 0.60 0.80 16.62 18.26 2853.27 67020.39 32506.27 12.5075% 281.00 57.29 3.49 4.96 37082.47 19750.37 14919.21 2093.69 9563.69 43.70 35.00 195010.00 51771.18 246781.18 13.05 0.91 0.80 14.75 27.43 3773.71 88640.67 36869.50 14.25
100% (1) 375.00 57.29 0.00 4.96 49487.29 17131.25 24705.64 1286.62 8756.62 43.70 35.00 195010.00 69028.24 264038.24 10.88 1.21 0.80 12.89 36.61 4580.78 107597.80 38569.57 15.70100% (2) 375.00 57.29 0.00 4.96 49487.29 17131.25 24705.64 -72.19 7397.81 43.70 35.00 195010.00 69028.24 264038.24 10.88 1.21 0.80 12.89 36.61 5939.59 139514.87 70486.63 12.00
Carbon Offset 1025.00 57.29 0.00 4.96 135265.25 8452.17 101804.52 -3397.90 4072.10 43.70 35.00 195010.00 222789.83 417799.83 -4.12 3.31 0.80 -0.02 100.08 9265.30 217632.43 -5157.40 25.65Carbon Offset 1025.00 57.29 0.00 4.96 135265.25 8452.17 101804.52 -8997.15 -1527.15 43.70 35.00 195010.00 222789.83 417799.83 -4.12 3.31 0.80 -0.02 100.08 14864.55 349153.07 126363.24 15.60
provided Elec. by PV
PV area m2
Heating (KWh/m2)
Lighting (KWh/m2)
Hot water (KWh/m2)
generated Elec by PV
(KWh)
purchased from grid
elec (KWh)
Exported Elec (KWh)
Elec Cost £Energy cost Inc
FIT
Wall Insulation price £/m2
Roof Insulation price £/m2
Total Insulation
price £
PV cost £
Fabric cost £
Operational CO2
(kgCO2/m2.yr)
PV ECO2
(kgCO2/m2.yr)
Insulation ECO2
(kgCO2/m2.yr)
Total CO2
(kgCO2/m2.yr)CO2
saving %
Energy saving (A) £
PV(A) £
NPV £
Payback period (years)
0 0 57.29 13.97 4.96 0 0 0 5867.4 13337.4 43.70 35.00 195010.00 0.00 195010.00 19.53 0.00 0.80 20.33 0.00 0.00 0.00 0.00 025 94 55.4 10.4775 4.96 12404.8134 30259.929 203.179386 4227.247 11470.45 44.30 35.70 198280.00 17257.06 215537.06 17.09 0.30 0.88 18.27 10.13 1866.95 43852.82 23325.76 11.2550 187 55.4 6.985 4.96 24677.6607 23563.4558 6327.8518 3014.1305 10257.33 44.30 35.70 198280.00 34514.12 232794.12 14.84 0.60 0.88 16.33 19.68 3080.07 72347.69 34563.57 12.7575 281 55.4 3.4925 4.96 37082.4741 19750.3654 14919.208 2093.6868 9336.887 44.30 35.70 198280.00 51771.18 250051.18 12.68 0.91 0.88 14.46 28.86 4000.51 93967.97 38926.80 14.25
100 (1) 375 55.4 0 4.96 49487.2875 17131.2544 24705.6387 1286.6219 8529.822 44.30 35.70 198280.00 69028.24 267308.24 10.51 1.21 0.88 12.60 38.04 4807.58 112925.10 40626.87 15.7100 (2) 375 55.4 0 4.96 49487.2875 17131.2544 24705.6387 -72.18825 7171.012 44.30 35.70 198280.00 69028.24 267308.24 10.51 1.21 0.88 12.60 38.04 6166.39 144842.17 72543.93 12.1
Carbon Offset 1012 55.4 0 4.96 133549.6932 8562.09068 100198.881 -3310.257 3932.943 44.30 35.70 198280.00 219964.20 418244.20 -4.19 3.27 0.88 -0.05 100.24 9404.46 220901.10 -2333.10 25.3Carbon Offset 1012 55.4 0 4.96 133549.6932 8562.09068 100198.881 -8821.195 -1578 44.30 35.70 198280.00 219964.20 418244.20 -4.19 3.27 0.88 -0.05 100.24 14915.40 350347.42 127113.22 15.6
provided Elec. by PV
PV area m2
Heating (KWh/m2)
Lighting (KWh/m2)
Hot water (KWh/m2)
generated Elec by PV
(KWh)
purchased from grid
elec (KWh)
Exported Elec (KWh)
Elec Cost £Energy cost Inc
FIT
Wall Insulation price £/m2
Roof Insulation price £/m2
Total Insulation
price £
PV cost £
Fabric cost £
Operational CO2
(kgCO2/m2.yr)
PV ECO2
(kgCO2/m2.yr)
Insulation ECO2
(kgCO2/m2.yr)
Total CO2
(kgCO2/m2.yr)CO2
saving %
Energy saving (A) £
PV(A) £
NPV £
Payback period (years)
0 0 57.29 13.97 4.96 0 0 0 5867.4 13337.4 43.70 35.00 195010.00 0.00 195010.00 19.53 0.00 0.80 20.33 0.00 0.00 0.00 0.00 025 94 52.88 10.4775 4.96 12404.8134 30259.929 203.179386 4227.247 11168.05 45.00 36.40 201780.00 17257.06 219037.06 16.59 0.30 0.96 17.86 12.17 2169.35 50955.89 26928.83 11.550 187 52.88 6.985 4.96 24677.6607 23563.4558 6327.8518 3014.1305 9954.93 45.00 36.40 201780.00 34514.12 236294.12 14.35 0.60 0.96 15.91 21.72 3382.47 79450.76 38166.64 12.6575 281 52.88 3.4925 4.96 37082.4741 19750.3654 14919.208 2093.6868 9034.487 45.00 36.40 201780.00 51771.18 253551.18 12.18 0.91 0.96 14.05 30.90 4302.91 101071.04 42529.86 14
100 (1) 375 52.88 0 4.96 49487.2875 17131.2544 24705.6387 1286.6219 8227.422 45.00 36.40 201780.00 69028.24 270808.24 10.01 1.21 0.96 12.18 40.08 5109.98 120028.17 44229.94 15.5100 (2) 375 52.88 0 4.96 49487.2875 17131.2544 24705.6387 -72.18825 6868.612 45.00 36.40 201780.00 69028.24 270808.24 10.01 1.21 0.96 12.18 40.08 6468.79 151945.24 76147.00 12.1
Carbon Offset 988 52.88 0 4.96 130382.5068 8767.56876 97237.1723 -3148.213 3792.587 45.00 36.40 201780.00 214747.66 416527.66 -4.13 3.19 0.95 0.00 99.98 9544.81 224197.92 2680.26 24.7Carbon Offset 988 52.88 0 4.96 130382.5068 8767.56876 97237.1723 -8496.258 -1555.46 45.00 36.40 201780.00 214747.66 416527.66 -4.13 3.19 0.95 0.00 99.98 14892.86 349818.03 128300.37 15.5
provided Elec. by PV
PV area m2
Heating (KWh/m2)
Lighting (KWh/m2)
Hot water (KWh/m2)
generated Elec by PV
(KWh)
purchased from grid
elec (KWh)
Exported Elec (KWh)
Elec Cost £Energy cost Inc
FIT
Wall Insulation price £/m2
Roof Insulation price £/m2
Total Insulation
price £
PV cost £
Fabric cost £
Operational CO2
(kgCO2/m2.yr)
PV ECO2
(kgCO2/m2.yr)
Insulation ECO2
(kgCO2/m2.yr)
Total CO2
(kgCO2/m2.yr)CO2
saving %
Energy saving (A) £
PV(A) £
NPV £
Payback period (years)
0 0 57.29 13.97 4.96 0 0 0 5867.4 13337.4 43.70 35.00 195010.00 0.00 195010.00 19.53 0.00 0.80 20.33 0.00 0.00 0.00 0.00 025 94 50.84 10.4775 4.96 12404.8134 30259.929 203.179386 4227.247 10923.25 48.60 37.00 211680.00 17257.06 228937.06 16.19 0.30 1.12 17.62 13.35 2414.15 56705.99 22778.93 14.550 187 50.84 6.985 4.96 24677.6607 23563.4558 6327.8518 3014.1305 9710.13 48.60 37.00 211680.00 34514.12 246194.12 13.95 0.60 1.12 15.67 22.90 3627.27 85200.86 34016.74 14.7575 281 50.84 3.4925 4.96 37082.4741 19750.3654 14919.208 2093.6868 8789.687 48.60 37.00 211680.00 51771.18 263451.18 11.78 0.91 1.12 13.81 32.08 4547.71 106821.14 38379.97 15.6
100 (1) 375 50.84 0 4.96 49487.2875 17131.2544 24705.6387 1286.6219 7982.622 48.60 37.00 211680.00 69028.24 280708.24 9.61 1.21 1.12 11.94 41.26 5354.78 125778.27 40080.04 16.75100 (2) 375 50.84 0 4.96 49487.2875 17131.2544 24705.6387 -72.18825 6623.812 48.60 37.00 211680.00 69028.24 280708.24 9.61 1.21 1.12 11.94 41.26 6713.59 157695.34 71997.10 13.2
Carbon Offset 975 50.84 0 4.96 128666.9475 8880.38437 95700.4286 -3063.265 3632.735 48.60 37.00 211680.00 211922.03 423602.03 -4.25 3.15 1.12 0.02 99.90 9704.67 227952.69 -639.34 25Carbon Offset 975 50.84 0 4.96 128666.9475 8880.38437 95700.4286 -8326.789 -1630.79 48.60 37.00 211680.00 211922.03 423602.03 -4.25 3.15 1.12 0.02 99.90 14968.19 351587.49 122995.46 15.9
provided Elec. by PV
PV area m2
Heating (KWh/m2)
Lighting (KWh/m2)
Hot water (KWh/m2)
generated Elec by PV
(KWh)
purchased from grid
elec (KWh)
Exported Elec (KWh)
Elec Cost £Energy cost Inc
FIT
Wall Insulation price £/m2
Roof Insulation price £/m2
Total Insulation
price £
PV cost £
Fabric cost £
Operational CO2
(kgCO2/m2.yr)
PV ECO2
(kgCO2/m2.yr)
Insulation ECO2
(kgCO2/m2.yr)
Total CO2
(kgCO2/m2.yr)CO2
saving %
Energy saving (A) £
PV(A) £
NPV £
Payback period (years)
0 0 57.29 13.97 4.96 0 0 0 5867.4 13337.4 43.70 35.00 195010.00 0.00 195010.00 19.53 0.00 0.80 20.33 0.00 0.00 0.00 0.00 025 94 48.8 10.4775 4.96 12404.8134 30259.929 203.179386 4227.247 10678.45 50.40 38.40 219600.00 17257.06 236857.06 15.79 0.30 1.2 17.30 14.92 2658.95 62456.09 20609.03 16.2550 187 48.8 6.985 4.96 24677.6607 23563.4558 6327.8518 3014.1305 9465.33 50.40 38.40 219600.00 34514.12 254114.12 13.55 0.60 1.2 15.35 24.47 3872.07 90950.96 31846.84 1675 281 48.8 3.4925 4.96 37082.4741 19750.3654 14919.208 2093.6868 8544.887 50.40 38.40 219600.00 51771.18 271371.18 11.38 0.91 1.2 13.49 33.65 4792.51 112571.24 36210.07 16.7
100 (1) 375 48.8 0 4.96 49487.2875 17131.2544 24705.6387 1286.6219 7737.822 50.40 38.40 219600.00 69028.24 288628.24 9.21 1.21 1.2 11.62 42.83 5599.58 131528.38 37910.14 17.5100 (2) 375 48.8 0 4.96 49487.2875 17131.2544 24705.6387 -72.18825 6379.012 50.40 38.40 219600.00 69028.24 288628.24 9.21 1.21 1.2 11.62 42.83 6958.39 163445.44 69827.20 13.95
Carbon Offset 963 48.8 0 4.96 127083.3543 8985.40957 94155.8606 -2979.056 3472.144 50.40 38.40 219600.00 209313.76 428913.76 -4.36 3.11 1.2 -0.05 100.24 9865.26 231724.81 -2178.95 25.25Carbon Offset 963 48.8 0 4.96 127083.3543 8985.40957 94155.8606 -8157.629 -1706.43 50.40 38.40 219600.00 209313.76 428913.76 -4.36 3.11 1.2 -0.05 100.24 15043.83 353364.19 119460.43 16.2
provided Elec. by PV
PV area m2
Heating (KWh/m2)
Lighting (KWh/m2)
Hot water (KWh/m2)
generated Elec by PV
(KWh)
purchased from grid
elec (KWh)
Exported Elec (KWh)
Elec Cost £Energy cost Inc
FIT
Wall Insulation price £/m2
Roof Insulation price £/m2
Total Insulation
price £
PV cost £
Fabric cost £
Operational CO2
(kgCO2/m2.yr)
PV ECO2
(kgCO2/m2.yr)
Insulation ECO2
(kgCO2/m2.yr)
Total CO2
(kgCO2/m2.yr)CO2
saving %
Energy saving (A) £
PV(A) £
NPV £
Payback period (years)
0 0 57.29 13.97 4.96 0 0 0 5867.4 13337.4 43.70 35.00 195010.00 0.00 195010.00 19.53 0.00 0.80 20.33 0.00 0.00 0.00 0.00 025 94 47.4 10.4775 4.96 12404.8134 30259.929 203.179386 4227.247 10510.45 52.20 39.00 225360.00 17257.06 242617.06 15.52 0.30 1.3 17.12 15.78 2826.95 66402.24 18795.18 17.750 187 47.4 6.985 4.96 24677.6607 23563.4558 6327.8518 3014.1305 9297.33 52.20 39.00 225360.00 34514.12 259874.12 13.28 0.60 1.3 15.18 25.33 4040.07 94897.11 30032.99 16.7575 281 47.4 3.4925 4.96 37082.4741 19750.3654 14919.208 2093.6868 8376.887 52.20 39.00 225360.00 51771.18 277131.18 11.11 0.91 1.3 13.31 34.51 4960.51 116517.39 34396.22 17.25
100 (1) 375 47.4 0 4.96 49487.2875 17131.2544 24705.6387 1286.6219 7569.822 52.20 39.00 225360.00 69028.24 294388.24 8.94 1.21 1.3 11.45 43.69 5767.58 135474.52 36096.29 18100 (2) 375 47.4 0 4.96 49487.2875 17131.2544 24705.6387 -72.18825 6211.012 52.20 39.00 225360.00 69028.24 294388.24 8.94 1.21 1.3 11.45 43.69 7126.39 167391.59 68013.35 14.5
Carbon Offset 950 47.4 0 4.96 125367.795 9100.43548 92555.3273 -2890.929 3392.271 52.20 39.00 225360.00 206488.13 431848.13 -4.33 3.07 1.3 0.03 99.83 9945.13 233600.93 -3237.21 25.4Carbon Offset 950 47.4 0 4.96 125367.795 9100.43548 92555.3273 -7981.472 -1698.27 52.20 39.00 225360.00 206488.13 431848.13 -4.33 3.07 1.3 0.03 99.83 15035.67 353172.59 116334.45 16.45
provided Elec. by PV
PV area m2
Heating (KWh/m2)
Lighting (KWh/m2)
Hot water (KWh/m2)
generated Elec by PV
(KWh)
purchased from grid
elec (KWh)
Exported Elec (KWh)
Elec Cost £Energy cost Inc
FIT
Wall Insulation price £/m2
Roof Insulation price £/m2
Total Insulation
price £
PV cost £
Fabric cost £
Operational CO2
(kgCO2/m2.yr)
PV ECO2
(kgCO2/m2.yr)
Insulation ECO2
(kgCO2/m2.yr)
Total CO2
(kgCO2/m2.yr)CO2
saving %
Energy saving (A) £
PV(A) £
NPV £
Payback period (years)
0 0 57.29 13.97 4.96 0 0 0 5867.4 13337.4 43.70 35.00 195010.00 0.00 195010.00 19.53 0.00 0.80 20.33 0.00 0.00 0.00 0.00 025 94 44 10.4775 4.96 12404.8134 30259.929 203.179386 4227.247 10102.45 63.00 43.00 261000.00 17257.06 278257.06 14.85 0.30 1.84 17.00 16.40 3234.95 75985.75 -7261.31 27.550 187 44 6.985 4.96 24677.6607 23563.4558 6327.8518 3014.1305 8889.33 63.00 43.00 261000.00 34514.12 295514.12 12.61 0.60 1.84 15.05 25.95 4448.07 104480.61 3976.50 2475 281 44 3.4925 4.96 37082.4741 19750.3654 14919.208 2093.6868 7968.887 63.00 43.00 261000.00 51771.18 312771.18 10.44 0.91 1.84 13.19 35.13 5368.51 126100.90 8339.72 23.25
100 (1) 375 44 0 4.96 49487.2875 17131.2544 24705.6387 1286.6219 7161.822 63.00 43.00 261000.00 69028.24 330028.24 8.27 1.21 1.84 11.32 44.31 6175.58 145058.03 10039.79 23.2100 (2) 375 44 0 4.96 49487.2875 17131.2544 24705.6387 -72.18825 5803.012 63.00 43.00 261000.00 69028.24 330028.24 8.27 1.21 1.84 11.32 44.31 7534.39 176975.09 41956.86 18.75
Carbon Offset 944 44 0 4.96 124575.9984 9153.99913 91817.0943 -2850.209 3024.991 63.00 43.00 261000.00 205184.00 466184.00 -4.86 3.05 1.84 0.03 99.87 10312.41 242227.97 -28946.02 28.2Carbon Offset 944 44 0 4.96 124575.9984 9153.99913 91817.0943 -7900.15 -2024.95 63.00 43.00 261000.00 205184.00 466184.00 -4.86 3.05 1.84 0.03 99.87 15362.35 360845.92 89671.92 18.5
provided Elec. by PV
PV area m2
Heating (KWh/m2)
Lighting (KWh/m2)
Hot water (KWh/m2)
generated Elec by PV
(KWh)
purchased from grid
elec (KWh)
Exported Elec (KWh)
Elec Cost £Energy cost Inc
FIT
Wall Insulation price £/m2
Roof Insulation price £/m2
Total Insulation
price £
PV cost £
Fabric cost £
Operational CO2
(kgCO2/m2.yr)
PV ECO2
(kgCO2/m2.yr)
Insulation ECO2
(kgCO2/m2.yr)
Total CO2
(kgCO2/m2.yr)CO2
saving %
Energy saving (A) £
PV(A) £
NPV £
Payback period (years)
0 0 57.29 13.97 4.96 0 0 0 5867.4 13337.4 43.70 35.00 195010.00 0.00 195010.00 19.53 0.00 0.80 20.33 0.00 0.00 0.00 0.00 025 94 43 10.4775 4.96 12404.8134 30259.929 203.179386 4227.247 9982.447 66.60 44.70 273870.00 17257.06 291127.06 14.66 0.30 2 16.96 16.58 3354.95 78804.42 -17312.64 3150 187 43 6.985 4.96 24677.6607 23563.4558 6327.8518 3014.1305 8769.33 66.60 44.70 273870.00 34514.12 308384.12 12.41 0.60 2 15.02 26.13 4568.07 107299.29 -6074.83 26.575 281 43 3.4925 4.96 37082.4741 19750.3654 14919.208 2093.6868 7848.887 66.60 44.70 273870.00 51771.18 325641.18 10.24 0.91 2 13.15 35.31 5488.51 128919.57 -1711.60 25.4
100 (1) 375 43 0 4.96 49487.2875 17131.2544 24705.6387 1286.6219 7041.822 66.60 44.70 273870.00 69028.24 342898.24 8.08 1.21 2 11.29 44.49 6295.58 147876.71 -11.53 25100 (2) 375 43 0 4.96 49487.2875 17131.2544 24705.6387 -72.18825 5683.012 66.60 44.70 273870.00 69028.24 342898.24 8.08 1.21 2 11.29 44.49 7654.39 179793.77 31905.53 20.35
Carbon Offset 943 43 0 4.96 124575.9984 9153.99913 91817.0943 -2850.209 2904.991 66.60 44.70 273870.00 205184.00 479054.00 -5.05 3.04 2 -0.01 100.06 10432.41 245046.65 -38997.35 29.25Carbon Offset 943 43 0 4.96 124575.9984 9153.99913 91817.0943 -7900.15 -2144.95 66.60 44.70 273870.00 205184.00 479054.00 -5.05 3.04 2 -0.01 100.06 15482.35 363664.59 79620.60 19.25
PV + 0.08 - 0.11
PV + 0.07 - 0.10
PV + 2010 notional building fabric
Storage and Distribution Warehouse-London
PV + 0.17 - 0.24
PV + 0.15 - 0.21
PV + 0.13 - 0.19
PV + 0.12 - 0.17
PV + 0.11 - 0.15
PV (Future FiT)+Insulation

196
Table B. 3 Distribution warehouse – PV (current FiT) + improving the building fabric U-value down to 0.07-0.1 W/m2.K (mineral wool) + TSC
provided Elec. & heating
TSC area m2
PV area m2
Heating (KWh/m2)
Lighting (KWh/m2)
Hot water (KWh/m2)
TSC fan power
(KWh/m2)
generated Elec by PV
(KWh)
purchased from grid
elec (KWh)
Exported Elec
(KWh)
Elec cost £
Energy cost Inc FIT £
Wall Insulation price £/m2
Roof Insulation price £/m2
Total Insulation
price £TSC cost £ PV Cost £ Fabric cost £
Operational CO2
(kgCO2/m2.yr)
PV ECO2
(kgCO2/m2.yr)
TSC ECO2
(kgCO2/m2.yr)
Insulation ECO2
(kgCO2/m2.yr)
Total CO2
(kgCO2/m2.yr)CO2
saving %
Energy saving (A)
£
PV(A) £
NPV £
Payback period (years)
0 0 0 57.29 13.97 4.96 0 0 0 0 5867.4 13337.4 43.70 35.00 195010.00 0.00 0.00 195010.00 19.53 0.00 0.00 0.80 20.33 0.00 0.00 0.00 0.00 025% 275 94 42.97 10.4775 4.96 0.2864 12404.8134 30259.929 203.1794 2428.549 8300.437046 43.70 35.00 195010.00 41250.00 17257.06 253517.06 14.80 0.30 0.11 0.80 16.02 21.22 5036.96 118313.12 59806.06 1250% 750 187 28.65 6.985 4.96 0.5728 24677.6607 23563.4558 6327.852 -564.13 3709.645681 43.70 35.00 195010.00 112500.00 34514.12 342024.12 9.90 0.60 0.31 0.80 11.61 42.88 9627.75 226146.12 79132.01 15.975% 1300 281 14.32 3.4925 4.96 0.8594 37082.4741 19750.3654 14919.21 -3283.27 -608.7239498 43.70 35.00 195010.00 195000.00 51771.18 441781.18 5.07 0.91 0.53 0.80 7.31 64.02 13946.12 327580.22 80809.04 18.55
75-100 1300 375 14.32 0 4.96 0.8594 49487.2875 17131.2544 24705.64 -5889.03 -3214.486809 43.70 35.00 195010.00 195000.00 69028.24 459038.24 2.91 1.21 0.53 0.80 5.45 73.20 16551.89 388786.93 124758.70 16.65Carbon Offsetting 1300 643 14.32 0 4.96 0 84722.2362 12542.2086 53801.54 -12949.9 -10636.28442 43.70 35.00 195010.00 195000.00 139542.51 529552.51 -3.44 2.07 0.53 0.80 -0.03 100.14 23973.68 563117.38 228574.88 14.5
provided Elec. & heating
TSC area m2
PV area m2
Heating (KWh/m2)
Lighting (KWh/m2)
Hot water (KWh/m2)
TSC fan power
(KWh/m2)
generated Elec by PV
(KWh)
purchased from grid
elec (KWh)
Exported Elec
(KWh)
Elec cost £
Energy cost Inc FIT £
Wall Insulation price £/m2
Roof Insulation price £/m2
Total Insulation
price £TSC cost £ PV Cost £ Fabric cost £
Operational CO2
(kgCO2/m2.yr)
PV ECO2
(kgCO2/m2.yr)
TSC ECO2
(kgCO2/m2.yr)
Insulation ECO2
(kgCO2/m2.yr)
Total CO2
(kgCO2/m2.yr)CO2
saving %
Energy saving (A)
£
PV(A) £
NPV £
Payback period (years)
0 0 0 57.29 13.97 4.96 0 0 0 0 5867.4 13337.4 43.70 35.00 195010.00 0.00 0.00 195010.00 19.53 0.00 0.00 0.80 20.33 0.00 0.00 0.00 0.00 025 250 94 41.5 10.4775 4.96 0.3158 12404.8134 30259.929 203.1794 2428.549 8136.385046 44.30 35.70 198280.00 37500.00 17257.06 253037.06 14.53 0.30 0.10 0.88 15.81 22.21 5201.01 122166.53 64139.48 11.550 700 187 27.7 6.985 4.96 0.5918 24677.6607 23563.4558 6327.852 -564.13 3603.625681 44.30 35.70 198280.00 105000.00 34514.12 337794.12 9.73 0.60 0.29 0.88 11.50 43.45 9733.77 228636.43 85852.31 15.2575 1250 281 13.42 3.4925 4.96 0.8774 37082.4741 19750.3654 14919.21 -3283.27 -709.1639498 44.30 35.70 198280.00 187500.00 51771.18 437551.18 4.91 0.91 0.51 0.88 7.21 64.55 14046.56 329939.45 87398.28 18.1
75-100 1250 375 13.42 0 4.96 0.8774 49487.2875 17131.2544 24705.64 -5889.03 -3314.926809 44.30 35.70 198280.00 187500.00 69028.24 454808.24 2.74 1.21 0.51 0.88 5.34 73.73 16652.33 391146.16 131347.93 16.25Carbon Offsetting 1250 635 13.42 0 4.96 0.8774 83798.4735 12665.7142 55651.28 -12881.9 -10307.77847 44.30 35.70 198280.00 187500.00 138021.02 523801.02 -3.45 2.05 0.51 0.88 -0.01 100.06 23645.18 555401.11 226610.10 14.45
provided Elec. & heating
TSC area m2
PV area m2
Heating (KWh/m2)
Lighting (KWh/m2)
Hot water (KWh/m2)
TSC fan power
(KWh/m2)
generated Elec by PV
(KWh)
purchased from grid
elec (KWh)
Exported Elec
(KWh)
Elec cost £
Energy cost Inc FIT £
Wall Insulation price £/m2
Roof Insulation price £/m2
Total Insulation
price £TSC cost £ PV Cost £ Fabric cost £
Operational CO2
(kgCO2/m2.yr)
PV ECO2
(kgCO2/m2.yr)
TSC ECO2
(kgCO2/m2.yr)
Insulation ECO2
(kgCO2/m2.yr)
Total CO2
(kgCO2/m2.yr)CO2
saving %
Energy saving (A)
£
PV(A) £
NPV £
Payback period (years)
0 0 0 57.29 13.97 4.96 0 0 0 0 5867.4 13337.4 43.70 35.00 195010.00 0.00 0.00 195010.00 19.53 0.00 0.00 0.80 20.33 0.00 0.00 0.00 0.00 025 235 94 39.66 10.4775 4.96 0.3526 12404.8134 30259.929 203.1794 2428.549 7931.041046 45.00 36.40 201780.00 35250.00 17257.06 254287.06 14.19 0.30 0.10 0.96 15.55 23.53 5406.36 126989.86 67712.80 11.2550 685 187 26.44 6.985 4.96 0.617 24677.6607 23563.4558 6327.852 -564.13 3463.009681 45.00 36.40 201780.00 102750.00 34514.12 339044.12 9.49 0.60 0.28 0.96 11.34 44.24 9874.39 231939.35 87905.24 15.1575 1235 281 13.22 3.4925 4.96 0.8814 37082.4741 19750.3654 14919.21 -3283.27 -731.4839498 45.00 36.40 201780.00 185250.00 51771.18 438801.18 4.87 0.91 0.51 0.96 7.24 64.37 14068.88 330463.73 86672.55 18.15
75-100 1235 375 13.22 0 4.96 0.8814 49487.2875 17131.2544 24705.64 -5889.03 -3337.246809 45.00 36.40 201780.00 185250.00 69028.24 456058.24 2.70 1.21 0.51 0.96 5.38 73.55 16674.65 391670.44 130622.20 16.3Carbon Offsetting 1235 639 13.22 0 4.96 0.8814 84326.3379 12609.5221 55822.96 -12974 -10422.23095 45.00 36.40 201780.00 185250.00 138890.44 525920.44 -3.53 2.06 0.51 0.96 0.00 100.01 23759.63 558089.49 227179.05 14.45
provided Elec. & heating
TSC area m2
PV area m2
Heating (KWh/m2)
Lighting (KWh/m2)
Hot water (KWh/m2)
TSC fan power
(KWh/m2)
generated Elec by PV
(KWh)
purchased from grid
elec (KWh)
Exported Elec
(KWh)
Elec cost £
Energy cost Inc FIT £
Wall Insulation price £/m2
Roof Insulation price £/m2
Total Insulation
price £TSC cost £ PV Cost £ Fabric cost £
Operational CO2
(kgCO2/m2.yr)
PV ECO2
(kgCO2/m2.yr)
TSC ECO2
(kgCO2/m2.yr)
Insulation ECO2
(kgCO2/m2.yr)
Total CO2
(kgCO2/m2.yr)CO2
saving %
Energy saving (A)
£
PV(A) £
NPV £
Payback period (years)
0 0 0 57.29 13.97 4.96 0 0 0 0 5867.4 13337.4 43.70 35.00 195010.00 0.00 0.00 195010.00 19.53 0.00 0.00 0.80 20.33 0.00 0.00 0.00 0.00 025 225 94 38.15 10.4775 4.96 0.3828 12404.8134 30259.929 203.1794 2428.549 7762.525046 48.60 37.00 211680.00 33750.00 17257.06 262687.06 13.91 0.30 0.09 1.12 15.42 24.14 5574.87 130948.12 63271.07 12.550 675 187 25.42 6.985 4.96 0.6374 24677.6607 23563.4558 6327.852 -564.13 3349.177681 48.60 37.00 211680.00 101250.00 34514.12 347444.12 9.30 0.60 0.28 1.12 11.30 44.40 9988.22 234613.15 82179.03 15.975 1230 281 12.7 3.4925 4.96 0.8918 37082.4741 19750.3654 14919.21 -3283.27 -789.5159498 48.60 37.00 211680.00 184500.00 51771.18 447951.18 4.77 0.91 0.50 1.12 7.31 64.07 14126.92 331826.84 78885.66 18.75
75-100 1230 375 12.7 0 4.96 0.8918 49487.2875 17131.2544 24705.64 -5889.03 -3395.278809 48.60 37.00 211680.00 184500.00 69028.24 465208.24 2.60 1.21 0.50 1.12 5.44 73.25 16732.68 393033.55 122835.32 16.9Carbon Offsetting 1230 644 12.7 0 4.96 0.8918 84722.2362 12542.2086 55801.54 -13039.9 -10546.12842 48.60 37.00 211680.00 184500.00 139542.51 535722.51 -3.64 2.08 0.50 1.12 0.07 99.67 23883.53 560999.71 220287.21 14.8
provided Elec. & heating
TSC area m2
PV area m2
Heating (KWh/m2)
Lighting (KWh/m2)
Hot water (KWh/m2)
TSC fan power
(KWh/m2)
generated Elec by PV
(KWh)
purchased from grid
elec (KWh)
Exported Elec
(KWh)
Elec cost £
Energy cost Inc FIT £
Wall Insulation price £/m2
Roof Insulation price £/m2
Total Insulation
price £TSC cost £ PV Cost £ Fabric cost £
Operational CO2
(kgCO2/m2.yr)
PV ECO2
(kgCO2/m2.yr)
TSC ECO2
(kgCO2/m2.yr)
Insulation ECO2
(kgCO2/m2.yr)
Total CO2
(kgCO2/m2.yr)CO2
saving %
Energy saving (A)
£
PV(A) £
NPV £
Payback period (years)
0 0 0 57.29 13.97 4.96 0 0 0 0 5867.4 13337.4 43.70 35.00 195010.00 0.00 0.00 195010.00 19.53 0.00 0.00 0.80 20.33 0.00 0.00 0.00 0.00 025 220 94 36.6 10.4775 4.96 0.4138 12404.8134 30259.929 203.1794 2428.549 7589.545046 50.40 38.40 219600.00 33000.00 17257.06 269857.06 13.62 0.30 0.09 1.2 15.21 25.17 5747.85 135011.25 60164.19 13.550 685 187 24.4 6.985 4.96 0.6578 24677.6607 23563.4558 6327.852 -564.13 3235.345681 50.40 38.40 219600.00 102750.00 34514.12 356864.12 9.11 0.60 0.28 1.2 11.20 44.92 10102.05 237286.95 75432.83 16.7575 1225 281 12.21 3.4925 4.96 0.9016 37082.4741 19750.3654 14919.21 -3283.27 -844.1999498 50.40 38.40 219600.00 183750.00 51771.18 455121.18 4.68 0.91 0.50 1.2 7.29 64.13 14181.60 333111.31 73000.14 19.25
75-100 1225 375 12.21 0 4.96 0.9016 49487.2875 17131.2544 24705.64 -5889.03 -3449.962809 50.40 38.40 219600.00 183750.00 69028.24 472378.24 2.51 1.21 0.50 1.2 5.43 73.31 16787.36 394318.02 116949.79 17.25Carbon Offsetting 1225 645 12.21 0 4.96 0.9016 84722.2362 12542.2086 56500.54 -13071.3 -10632.26742 50.40 38.40 219600.00 183750.00 139542.51 542892.51 -3.85 2.08 0.50 1.2 -0.07 100.32 23969.67 563023.03 215140.52 15.1
provided Elec. & heating
TSC area m2
PV area m2
Heating (KWh/m2)
Lighting (KWh/m2)
Hot water (KWh/m2)
TSC fan power
(KWh/m2)
generated Elec by PV
(KWh)
purchased from grid
elec (KWh)
Exported Elec
(KWh)
Elec cost £
Energy cost Inc FIT £
Wall Insulation price £/m2
Roof Insulation price £/m2
Total Insulation
price £TSC cost £ PV Cost £ Fabric cost £
Operational CO2
(kgCO2/m2.yr)
PV ECO2
(kgCO2/m2.yr)
TSC ECO2
(kgCO2/m2.yr)
Insulation ECO2
(kgCO2/m2.yr)
Total CO2
(kgCO2/m2.yr)CO2
saving %
Energy saving (A)
£
PV(A) £
NPV £
Payback period (years)
0 0 0 57.29 13.97 4.96 0 0 0 0 5867.4 13337.4 43.70 35.00 195010.00 0.00 0.00 195010.00 19.53 0.00 0.00 0.80 20.33 0.00 0.00 0.00 0.00 025 215 94 35.55 10.4775 4.96 0.4348 12404.8134 30259.929 203.1794 2428.549 7472.365046 52.20 39.00 225360.00 32250.00 17257.06 274867.06 13.42 0.30 0.09 1.3 15.12 25.65 5865.03 137763.69 57906.63 1450 665 187 23.7 6.985 4.96 0.6718 24677.6607 23563.4558 6327.852 -564.13 3157.225681 52.20 39.00 225360.00 99750.00 34514.12 359624.12 8.98 0.60 0.27 1.3 11.16 45.11 10180.17 239121.91 74507.79 16.975 1220 281 11.85 3.4925 4.96 0.9088 37082.4741 19750.3654 14919.21 -3283.27 -884.3759498 52.20 39.00 225360.00 183000.00 51771.18 460131.18 4.62 0.91 0.50 1.3 7.32 63.98 14221.78 334055.01 68933.83 19.6
75-100 1220 375 11.85 0 4.96 0.9088 49487.2875 17131.2544 24705.64 -5889.03 -3490.138809 52.20 39.00 225360.00 183000.00 69028.24 477388.24 2.45 1.21 0.50 1.3 5.46 73.16 16827.54 395261.72 112883.48 17.55Carbon Offsetting 1220 646 11.85 0 4.96 0.9088 85250.1006 12510.9109 56300.11 -13143.2 -10744.34593 52.20 39.00 225360.00 183000.00 140411.93 548771.93 -3.89 2.08 0.50 1.3 0.00 100.01 24081.75 565655.64 211893.71 15.3
provided Elec. & heating
TSC area m2
PV area m2
Heating (KWh/m2)
Lighting (KWh/m2)
Hot water (KWh/m2)
TSC fan power
(KWh/m2)
generated Elec by PV
(KWh)
purchased from grid
elec (KWh)
Exported Elec
(KWh)
Elec cost £
Energy cost Inc FIT £
Wall Insulation price £/m2
Roof Insulation price £/m2
Total Insulation
price £TSC cost £ PV Cost £ Fabric cost £
Operational CO2
(kgCO2/m2.yr)
PV ECO2
(kgCO2/m2.yr)
TSC ECO2
(kgCO2/m2.yr)
Insulation ECO2
(kgCO2/m2.yr)
Total CO2
(kgCO2/m2.yr)CO2
saving %
Energy saving (A)
£
PV(A) £
NPV £
Payback period (years)
0 0 0 57.29 13.97 4.96 0 0 0 0 5867.4 13337.4 43.70 35.00 195010.00 0.00 0.00 195010.00 19.53 0.00 0.00 0.80 20.33 0.00 0.00 0.00 0.00 025 200 94 33 10.4775 4.96 0.4858 12404.8134 30259.929 203.1794 2428.549 7187.785046 63.00 43.00 261000.00 30000.00 17257.06 308257.06 12.95 0.30 0.08 1.84 15.18 25.35 6149.61 144448.18 31201.12 19.3550 660 187 22 6.985 4.96 0.7058 24677.6607 23563.4558 6327.852 -564.13 2967.505681 63.00 43.00 261000.00 99000.00 34514.12 394514.12 8.67 0.60 0.27 1.84 11.38 44.01 10369.89 243578.24 44074.12 20.2575 1215 281 11 3.4925 4.96 0.9258 37082.4741 19750.3654 14919.21 -3283.27 -979.2359498 63.00 43.00 261000.00 182250.00 51771.18 495021.18 4.46 0.91 0.50 1.84 7.70 62.11 14316.64 336283.17 36271.99 22.15
75-100 1215 375 11 0 4.96 0.9258 49487.2875 17131.2544 24705.64 -5889.03 -3584.998809 63.00 43.00 261000.00 182250.00 69028.24 512278.24 2.29 1.21 0.50 1.84 5.84 71.29 16922.40 397489.88 80221.65 19.75Carbon Offsetting 1215 665 11 0 4.96 0.9258 87757.4565 12252.2495 58596.8 -13646.4 -11342.33638 63.00 43.00 261000.00 182250.00 144541.69 587791.69 -4.49 2.15 0.50 1.84 -0.01 100.03 24679.74 579701.82 186920.13 16.6
provided Elec. & heating
TSC area m2
PV area m2
Heating (KWh/m2)
Lighting (KWh/m2)
Hot water (KWh/m2)
TSC fan power
(KWh/m2)
generated Elec by PV
(KWh)
purchased from grid
elec (KWh)
Exported Elec
(KWh)
Elec cost £
Energy cost Inc FIT £
Wall Insulation price £/m2
Roof Insulation price £/m2
Total Insulation
price £TSC cost £ PV Cost £ Fabric cost £
Operational CO2
(kgCO2/m2.yr)
PV ECO2
(kgCO2/m2.yr)
TSC ECO2
(kgCO2/m2.yr)
Insulation ECO2
(kgCO2/m2.yr)
Total CO2
(kgCO2/m2.yr)CO2
saving %
Energy saving (A)
£
PV(A) £
NPV £
Payback period (years)
0 0 0 57.29 13.97 4.96 0 0 0 0 5867.4 13337.4 43.70 35.00 195010.00 0.00 0.00 195010.00 19.53 0.00 0.00 0.80 20.33 0.00 0.00 0.00 0.00 025 195 94 32.25 10.4775 4.96 0.5008 12404.8134 30259.929 203.1794 2428.549 7104.085046 66.60 44.70 273870.00 29250.00 17257.06 320377.06 12.81 0.30 0.08 2 15.20 25.26 6233.31 146414.21 21047.15 21.2550 650 187 21.5 6.985 4.96 0.7158 24677.6607 23563.4558 6327.852 -564.13 2911.705681 66.60 44.70 273870.00 97500.00 34514.12 405884.12 8.58 0.60 0.27 2 11.45 43.70 10425.69 244888.92 34014.80 21.3575 1210 281 10.75 3.4925 4.96 0.9308 37082.4741 19750.3654 14919.21 -3283.27 -1007.13595 66.60 44.70 273870.00 181500.00 51771.18 507141.18 4.41 0.91 0.50 2 7.82 61.56 14344.54 336938.51 24807.34 23.05
75-100 1210 375 10.75 0 4.96 0.9308 49487.2875 17131.2544 24705.64 -5889.03 -3612.898809 66.60 44.70 273870.00 181500.00 69028.24 524398.24 2.24 1.21 0.50 2 5.95 70.74 16950.30 398145.22 68756.99 20.5Carbon Offsetting 1210 670 10.75 0 4.96 0.9308 88417.287 12184.9046 58689.29 -13755.6 -11479.50194 66.60 44.70 273870.00 181500.00 145628.47 600998.47 -4.56 2.16 0.50 2 0.09 99.54 24816.90 582923.70 176935.23 17.1
TSC + PV + FIT + 0.08 - 0.11
TSC + PV + FIT + 0.07 - 0.10
Storage and Distribution Warehouse-London
TSC + PV + FIT + 2010 notional building fabric
TSC + PV + FIT + 0.17 - 0.24
TSC + PV + FIT + 0.15 - 0.21
TSC + PV + FIT + 0.13 - 0.19
TSC + PV + FIT + 0.11 - 0.15
TSC + PV + FIT + 0.12 - 0.17
PV (current FiT)+Insulation+TSC

197
Table B. 4 Distribution warehouse – PV (future FiT) + improving the building fabric U-value down to 0.07-0.1 W/m2.K (mineral wool) + TSC
provided Elec. & heating
TSC area m2
PV area m2
Heating (KWh/m2)
Lighting (KWh/m2)
Hot water (KWh/m2)
TSC fan power
(KWh/m2)
generated Elec by PV
(KWh)
purchased from grid
elec (KWh)
Exported Elec
(KWh)
Elec cost £
Energy cost Inc
FIT £
Wall Insulation price £/m2
Roof Insulation price £/m2
Total Insulation
price £TSC cost £ PV Cost £
Fabric cost £
Operational CO2
(kgCO2/m2.yr)
PV ECO2
(kgCO2/m2.yr)
TSC ECO2
(kgCO2/m2.yr)
Insulation ECO2
(kgCO2/m2.yr)
Total CO2
(kgCO2/m2.yr)
CO2 saving %
Energy saving (A)
£
PV(A) £
NPV £
Payback period (years)
0 0 0 57.29 13.97 4.96 0 0 0 0 5867.4 13337.4 43.70 35.00 195010.00 0.00 0.00 195010.00 19.53 0.00 0.00 0.80 20.33 0.00 0.00 0.00 0.00 025% 275 94 42.97 10.4775 4.96 0.2864 12404.813 30259.929 203.1794 4227.247 10099.13 43.70 35.00 195010.00 41250.00 17257.06 253517.06 14.80 0.30 0.11 0.80 16.02 21.22 3238.27 76063.54 17556.48 1950% 750 187 28.65 6.985 4.96 0.5728 24677.661 23563.4558 6327.852 3014.13 7287.906 43.70 35.00 195010.00 112500.00 34514.12 342024.12 9.90 0.60 0.31 0.80 11.61 42.88 6049.49 142096.43 -4917.69 2675% 1300 281 14.32 3.4925 4.96 0.8594 37082.474 19750.3654 14919.21 2093.687 4768.235 43.70 35.00 195010.00 195000.00 51771.18 441781.18 5.07 0.91 0.53 0.80 7.31 64.02 8569.17 201280.95 -45490.23 31
75-100 1300 375 14.32 0 4.96 0.8594 49487.288 17131.2544 24705.64 1286.622 3961.17 43.70 35.00 195010.00 195000.00 69028.24 459038.24 2.91 1.21 0.53 0.80 5.45 73.20 9376.23 220238.08 -43790.16 30.3575-100 (2) 1300 375 14.32 0 4.96 0.8594 49487.288 17131.2544 24705.64 -72.1883 2602.36 43.70 35.00 195010.00 195000.00 69028.24 459038.24 2.91 1.21 0.53 0.80 5.45 73.20 10735.04 252155.14 -11873.09 30.35
Carbon Offsetting 1300 643 14.32 0 4.96 0.8594 84722.236 12542.2086 53801.54 -665.16 2009.388 43.70 35.00 195010.00 195000.00 139542.51 529552.51 -2.99 2.07 0.53 0.80 0.42 97.92 11328.01 266083.45 -68459.06 30.9Carbon Offsetting 1300 643 14.32 0 4.96 0.8594 84722.236 12542.2086 53801.54 -3624.24 -949.697 43.70 35.00 195010.00 195000.00 139542.51 529552.51 -2.99 2.07 0.53 0.80 0.42 97.92 14287.10 335589.33 1046.82 24.25
provided Elec. & heating
TSC area m2
PV area m2
Heating (KWh/m2)
Lighting (KWh/m2)
Hot water (KWh/m2)
TSC fan power
(KWh/m2)
generated Elec by PV
(KWh)
purchased from grid
elec (KWh)
Exported Elec
(KWh)
Elec cost £
Energy cost Inc
FIT £
Wall Insulation price £/m2
Roof Insulation price £/m2
Total Insulation
price £TSC cost £ PV Cost £
Fabric cost £
Operational CO2
(kgCO2/m2.yr)
PV ECO2
(kgCO2/m2.yr)
TSC ECO2
(kgCO2/m2.yr)
Insulation ECO2
(kgCO2/m2.yr)
Total CO2
(kgCO2/m2.yr)
CO2 saving %
Energy saving (A)
£
PV(A) £
NPV £
Payback period (years)
0 0 0 57.29 13.97 4.96 0 0 0 0 5867.4 13337.4 43.70 35.00 195010.00 0.00 0.00 195010.00 19.53 0.00 0.00 0.80 20.33 0.00 0.00 0.00 0.00 025 250 94 41.5 10.4775 4.96 0.3158 12404.813 30259.929 203.1794 4227.247 9935.083 44.30 35.70 198280.00 37500.00 17257.06 253037.06 14.53 0.30 0.10 0.88 15.81 22.21 3402.32 79916.95 21889.90 1850 700 187 27.7 6.985 4.96 0.5918 24677.661 23563.4558 6327.852 3014.13 7181.886 44.30 35.70 198280.00 105000.00 34514.12 337794.12 9.73 0.60 0.29 0.88 11.50 43.45 6155.51 144586.73 1802.61 24.775 1250 281 13.42 3.4925 4.96 0.8774 37082.474 19750.3654 14919.21 2093.687 4667.795 44.30 35.70 198280.00 187500.00 51771.18 437551.18 4.91 0.91 0.51 0.88 7.21 64.55 8669.61 203640.18 -38901.00 30.25
75-100 1250 375 13.42 0 4.96 0.8774 49487.288 17131.2544 24705.64 1286.622 3860.73 44.30 35.70 198280.00 187500.00 69028.24 454808.24 2.74 1.21 0.51 0.88 5.34 73.73 9476.67 222597.31 -37200.92 29.575-100 (2) 1250 375 13.42 0 4.96 0.8774 49487.288 17131.2544 24705.64 -72.1883 2501.92 44.30 35.70 198280.00 187500.00 69028.24 454808.24 2.74 1.21 0.51 0.88 5.34 73.73 10835.48 254514.37 -5283.86 29.5
Carbon Offsetting 1250 635 13.42 0 4.96 0.8774 83798.473 12665.7142 55651.28 -731.108 1843 44.30 35.70 198280.00 187500.00 138021.02 523801.02 -3.45 2.05 0.51 0.88 -0.01 100.06 11494.40 269991.72 -58799.29 30.9Carbon Offsetting 1250 635 13.42 0 4.96 0.8774 83798.473 12665.7142 55651.28 -3791.93 -1217.82 44.30 35.70 198280.00 187500.00 138021.02 523801.02 -3.45 2.05 0.51 0.88 -0.01 100.06 14555.22 341887.28 13096.26 24
provided Elec. & heating
TSC area m2
PV area m2
Heating (KWh/m2)
Lighting (KWh/m2)
Hot water (KWh/m2)
TSC fan power
(KWh/m2)
generated Elec by PV
(KWh)
purchased from grid
elec (KWh)
Exported Elec
(KWh)
Elec cost £
Energy cost Inc
FIT £
Wall Insulation price £/m2
Roof Insulation price £/m2
Total Insulation
price £TSC cost £ PV Cost £
Fabric cost £
Operational CO2
(kgCO2/m2.yr)
PV ECO2
(kgCO2/m2.yr)
TSC ECO2
(kgCO2/m2.yr)
Insulation ECO2
(kgCO2/m2.yr)
Total CO2
(kgCO2/m2.yr)
CO2 saving %
Energy saving (A)
£
PV(A) £
NPV £
Payback period (years)
0 0 0 57.29 13.97 4.96 0 0 0 0 5867.4 13337.4 43.70 35.00 195010.00 0.00 0.00 195010.00 19.53 0.00 0.00 0.80 20.33 0.00 0.00 0.00 0.00 025 235 94 39.66 10.4775 4.96 0.3526 12404.813 30259.929 203.1794 4227.247 9729.739 45.00 36.40 201780.00 35250.00 17257.06 254287.06 14.19 0.30 0.10 0.96 15.55 23.53 3607.66 84740.28 25463.22 17.2550 685 187 26.44 6.985 4.96 0.617 24677.661 23563.4558 6327.852 3014.13 7041.27 45.00 36.40 201780.00 102750.00 34514.12 339044.12 9.49 0.60 0.28 0.96 11.34 44.24 6296.13 147889.66 3855.54 24.2575 1235 281 13.22 3.4925 4.96 0.8814 37082.474 19750.3654 14919.21 2093.687 4645.475 45.00 36.40 201780.00 185250.00 51771.18 438801.18 4.87 0.91 0.51 0.96 7.24 64.37 8691.93 204164.45 -39626.72 30.2
75-100 1235 375 13.22 0 4.96 0.8814 49487.288 17131.2544 24705.64 1286.622 3838.41 45.00 36.40 201780.00 185250.00 69028.24 456058.24 2.70 1.21 0.51 0.96 5.38 73.55 9498.99 223121.59 -37926.65 29.675-100 (2) 1235 375 13.22 0 4.96 0.8814 49487.288 17131.2544 24705.64 -72.1883 2479.6 45.00 36.40 201780.00 185250.00 69028.24 456058.24 2.70 1.21 0.51 0.96 5.38 73.55 10857.80 255038.65 -6009.59 29.6
Carbon Offsetting 1235 639 13.22 0 4.96 0.8814 84326.338 12609.5221 55822.96 -746.7 1805.088 45.00 36.40 201780.00 185250.00 138890.44 525920.44 -3.53 2.06 0.51 0.96 0.00 100.01 11532.31 270882.24 -60028.20 31Carbon Offsetting 1235 639 13.22 0 4.96 0.8814 84326.338 12609.5221 55822.96 -3816.96 -1265.17 45.00 36.40 201780.00 185250.00 138890.44 525920.44 -3.53 2.06 0.51 0.96 0.00 100.01 14602.57 342999.58 12089.14 24
provided Elec. & heating
TSC area m2
PV area m2
Heating (KWh/m2)
Lighting (KWh/m2)
Hot water (KWh/m2)
TSC fan power
(KWh/m2)
generated Elec by PV
(KWh)
purchased from grid
elec (KWh)
Exported Elec
(KWh)
Elec cost £
Energy cost Inc
FIT £
Wall Insulation price £/m2
Roof Insulation price £/m2
Total Insulation
price £TSC cost £ PV Cost £
Fabric cost £
Operational CO2
(kgCO2/m2.yr)
PV ECO2
(kgCO2/m2.yr)
TSC ECO2
(kgCO2/m2.yr)
Insulation ECO2
(kgCO2/m2.yr)
Total CO2
(kgCO2/m2.yr)
CO2 saving %
Energy saving (A)
£
PV(A) £
NPV £
Payback period (years)
0 0 0 57.29 13.97 4.96 0 0 0 0 5867.4 13337.4 43.70 35.00 195010.00 0.00 0.00 195010.00 19.53 0.00 0.00 0.80 20.33 0.00 0.00 0.00 0.00 025 225 94 38.15 10.4775 4.96 0.3828 12404.813 30259.929 203.1794 4227.247 9561.223 48.60 37.00 211680.00 33750.00 17257.06 262687.06 13.91 0.30 0.09 1.12 15.42 24.14 3776.18 88698.54 21021.49 18.7550 675 187 25.42 6.985 4.96 0.6374 24677.661 23563.4558 6327.852 3014.13 6927.438 48.60 37.00 211680.00 101250.00 34514.12 347444.12 9.30 0.60 0.28 1.12 11.30 44.40 6409.96 150563.46 -1870.66 25.2575 1230 281 12.7 3.4925 4.96 0.8918 37082.474 19750.3654 14919.21 2093.687 4587.443 48.60 37.00 211680.00 184500.00 51771.18 447951.18 4.77 0.91 0.50 1.12 7.31 64.07 8749.96 205527.57 -47413.61 31.25
75-100 1230 375 12.7 0 4.96 0.8918 49487.288 17131.2544 24705.64 1286.622 3780.378 48.60 37.00 211680.00 184500.00 69028.24 465208.24 2.60 1.21 0.50 1.12 5.44 73.25 9557.02 224484.70 -45713.54 30.575-100 (2) 1230 375 12.7 0 4.96 0.8918 49487.288 17131.2544 24705.64 -72.1883 2421.568 48.60 37.00 211680.00 184500.00 69028.24 465208.24 2.60 1.21 0.50 1.12 5.44 73.25 10915.83 256401.76 -13796.47 30.5
Carbon Offsetting 1230 644 12.7 0 4.96 0.8918 84722.236 12542.2086 55801.54 -755.16 1738.596 48.60 37.00 211680.00 184500.00 139542.51 535722.51 -3.64 2.08 0.50 1.12 0.07 99.67 11598.80 272444.07 -68268.43 31.75Carbon Offsetting 1230 644 12.7 0 4.96 0.8918 84722.236 12542.2086 55801.54 -3824.24 -1330.49 48.60 37.00 211680.00 184500.00 139542.51 535722.51 -3.64 2.08 0.50 1.12 0.07 99.67 14667.89 344533.74 3821.24 24.7
provided Elec. & heating
TSC area m2
PV area m2
Heating (KWh/m2)
Lighting (KWh/m2)
Hot water (KWh/m2)
TSC fan power
(KWh/m2)
generated Elec by PV
(KWh)
purchased from grid
elec (KWh)
Exported Elec
(KWh)
Elec cost £
Energy cost Inc
FIT £
Wall Insulation price £/m2
Roof Insulation price £/m2
Total Insulation
price £TSC cost £ PV Cost £
Fabric cost £
Operational CO2
(kgCO2/m2.yr)
PV ECO2
(kgCO2/m2.yr)
TSC ECO2
(kgCO2/m2.yr)
Insulation ECO2
(kgCO2/m2.yr)
Total CO2
(kgCO2/m2.yr)
CO2 saving %
Energy saving (A)
£
PV(A) £
NPV £
Payback period (years)
0 0 0 57.29 13.97 4.96 0 0 0 0 5867.4 13337.4 43.70 35.00 195010.00 0.00 0.00 195010.00 19.53 0.00 0.00 0.80 20.33 0.00 0.00 0.00 0.00 025 220 94 36.6 10.4775 4.96 0.4138 12404.813 30259.929 203.1794 4227.247 9388.243 50.40 38.40 219600.00 33000.00 17257.06 269857.06 13.62 0.30 0.09 1.2 15.21 25.17 3949.16 92761.67 17914.61 19.8550 685 187 24.4 6.985 4.96 0.6578 24677.661 23563.4558 6327.852 3014.13 6813.606 50.40 38.40 219600.00 102750.00 34514.12 356864.12 9.11 0.60 0.28 1.2 11.20 44.92 6523.79 153237.25 -8616.86 26.575 1225 281 12.21 3.4925 4.96 0.9016 37082.474 19750.3654 14919.21 2093.687 4532.759 50.40 38.40 219600.00 183750.00 51771.18 455121.18 4.68 0.91 0.50 1.2 7.29 64.13 8804.64 206812.04 -53299.14 32
75-100 1225 375 12.21 0 4.96 0.9016 49487.288 17131.2544 24705.64 1286.622 3725.694 50.40 38.40 219600.00 183750.00 69028.24 472378.24 2.51 1.21 0.50 1.2 5.43 73.31 9611.71 225769.17 -51599.07 31.275-100 (2) 1225 375 12.21 0 4.96 0.9016 49487.288 17131.2544 24705.64 -72.1883 2366.884 50.40 38.40 219600.00 183750.00 69028.24 472378.24 2.51 1.21 0.50 1.2 5.43 73.31 10970.52 257686.23 -19682.00 31.2
Carbon Offsetting 1225 645 12.21 0 4.96 0.9016 84722.236 12542.2086 56500.54 -786.615 1652.457 50.40 38.40 219600.00 183750.00 139542.51 542892.51 -3.85 2.08 0.50 1.2 -0.07 100.32 11684.94 274467.39 -73415.11 32.25Carbon Offsetting 1225 645 12.21 0 4.96 0.9016 84722.236 12542.2086 56500.54 -3894.14 -1455.07 50.40 38.40 219600.00 183750.00 139542.51 542892.51 -3.85 2.08 0.50 1.2 -0.07 100.32 14792.47 347460.10 -422.41 25
provided Elec. & heating
TSC area m2
PV area m2
Heating (KWh/m2)
Lighting (KWh/m2)
Hot water (KWh/m2)
TSC fan power
(KWh/m2)
generated Elec by PV
(KWh)
purchased from grid
elec (KWh)
Exported Elec
(KWh)
Elec cost £
Energy cost Inc
FIT £
Wall Insulation price £/m2
Roof Insulation price £/m2
Total Insulation
price £TSC cost £ PV Cost £
Fabric cost £
Operational CO2
(kgCO2/m2.yr)
PV ECO2
(kgCO2/m2.yr)
TSC ECO2
(kgCO2/m2.yr)
Insulation ECO2
(kgCO2/m2.yr)
Total CO2
(kgCO2/m2.yr)
CO2 saving %
Energy saving (A)
£
PV(A) £
NPV £
Payback period (years)
0 0 0 57.29 13.97 4.96 0 0 0 0 5867.4 13337.4 43.70 35.00 195010.00 0.00 0.00 195010.00 19.53 0.00 0.00 0.80 20.33 0.00 0.00 0.00 0.00 025 215 94 35.55 10.4775 4.96 0.4348 12404.813 30259.929 203.1794 4227.247 9271.063 52.20 39.00 225360.00 32250.00 17257.06 274867.06 13.42 0.30 0.09 1.3 15.12 25.65 4066.34 95514.11 15657.05 20.7550 665 187 23.7 6.985 4.96 0.6718 24677.661 23563.4558 6327.852 3014.13 6735.486 52.20 39.00 225360.00 99750.00 34514.12 359624.12 8.98 0.60 0.27 1.3 11.16 45.11 6601.91 155072.21 -9541.91 26.775 1220 281 11.85 3.4925 4.96 0.9088 37082.474 19750.3654 14919.21 2093.687 4492.583 52.20 39.00 225360.00 183000.00 51771.18 460131.18 4.62 0.91 0.50 1.3 7.32 63.98 8844.82 207755.73 -57365.45 32.5
75-100 1220 375 11.85 0 4.96 0.9088 49487.288 17131.2544 24705.64 1286.622 3685.518 52.20 39.00 225360.00 183000.00 69028.24 477388.24 2.45 1.21 0.50 1.3 5.46 73.16 9651.88 226712.86 -55665.37 31.6575-100 (2) 1220 375 11.85 0 4.96 0.9088 49487.288 17131.2544 24705.64 -72.1883 2326.708 52.20 39.00 225360.00 183000.00 69028.24 477388.24 2.45 1.21 0.50 1.3 5.46 73.16 11010.69 258629.93 -23748.31 31.65
Carbon Offsetting 1220 646 11.85 0 4.96 0.9088 85250.101 12510.9109 56300.11 -781.977 1616.919 52.20 39.00 225360.00 183000.00 140411.93 548771.93 -3.89 2.08 0.50 1.3 0.00 100.01 11720.48 275302.15 -78459.78 32.75Carbon Offsetting 1220 646 11.85 0 4.96 0.9088 85250.101 12510.9109 56300.11 -3878.48 -1479.59 52.20 39.00 225360.00 183000.00 140411.93 548771.93 -3.89 2.08 0.50 1.3 0.00 100.01 14816.99 348035.91 -5726.02 25.5
provided Elec. & heating
TSC area m2
PV area m2
Heating (KWh/m2)
Lighting (KWh/m2)
Hot water (KWh/m2)
TSC fan power
(KWh/m2)
generated Elec by PV
(KWh)
purchased from grid
elec (KWh)
Exported Elec
(KWh)
Elec cost £
Energy cost Inc
FIT £
Wall Insulation price £/m2
Roof Insulation price £/m2
Total Insulation
price £TSC cost £ PV Cost £
Fabric cost £
Operational CO2
(kgCO2/m2.yr)
PV ECO2
(kgCO2/m2.yr)
TSC ECO2
(kgCO2/m2.yr)
Insulation ECO2
(kgCO2/m2.yr)
Total CO2
(kgCO2/m2.yr)
CO2 saving %
Energy saving (A)
£
PV(A) £
NPV £
Payback period (years)
0 0 0 57.29 13.97 4.96 0 0 0 0 5867.4 13337.4 43.70 35.00 195010.00 0.00 0.00 195010.00 19.53 0.00 0.00 0.80 20.33 0.00 0.00 0.00 0.00 025 200 94 33 10.4775 4.96 0.4858 12404.813 30259.929 203.1794 4227.247 8986.483 63.00 43.00 261000.00 30000.00 17257.06 308257.06 12.95 0.30 0.08 1.84 15.18 25.35 4350.92 102198.60 -11048.46 2850 660 187 22 6.985 4.96 0.7058 24677.661 23563.4558 6327.852 3014.13 6545.766 63.00 43.00 261000.00 99000.00 34514.12 394514.12 8.67 0.60 0.27 1.84 11.38 44.01 6791.63 159528.54 -39975.58 31.7575 1215 281 11 3.4925 4.96 0.9258 37082.474 19750.3654 14919.21 2093.687 4397.723 63.00 43.00 261000.00 182250.00 51771.18 495021.18 4.46 0.91 0.50 1.84 7.70 62.11 8939.68 209983.90 -90027.28 36.75
75-100 1215 375 11 0 4.96 0.9258 49487.288 17131.2544 24705.64 1286.622 3590.658 63.00 43.00 261000.00 182250.00 69028.24 512278.24 2.29 1.21 0.50 1.84 5.84 71.29 9746.74 228941.03 -88327.21 35.575-100 (2) 1215 375 11 0 4.96 0.9258 49487.288 17131.2544 24705.64 -72.1883 2231.848 63.00 43.00 261000.00 182250.00 69028.24 512278.24 2.29 1.21 0.50 1.84 5.84 71.29 11105.55 260858.09 -56410.14 35.5
Carbon Offsetting 1215 665 11 0 4.96 0.9258 87757.457 12252.2495 58596.8 -921.541 1382.495 63.00 43.00 261000.00 182250.00 144541.69 587791.69 -4.49 2.15 0.50 1.84 -0.01 100.03 11954.91 280808.52 -111973.17 35.9Carbon Offsetting 1215 665 11 0 4.96 0.9258 87757.457 12252.2495 58596.8 -4144.37 -1840.33 63.00 43.00 261000.00 182250.00 144541.69 587791.69 -4.49 2.15 0.50 1.84 -0.01 100.03 15177.73 356509.38 -36272.32 27.7
provided Elec. & heating
TSC area m2
PV area m2
Heating (KWh/m2)
Lighting (KWh/m2)
Hot water (KWh/m2)
TSC fan power
(KWh/m2)
generated Elec by PV
(KWh)
purchased from grid
elec (KWh)
Exported Elec
(KWh)
Elec cost £
Energy cost Inc
FIT £
Wall Insulation price £/m2
Roof Insulation price £/m2
Total Insulation
price £TSC cost £ PV Cost £
Fabric cost £
Operational CO2
(kgCO2/m2.yr)
PV ECO2
(kgCO2/m2.yr)
TSC ECO2
(kgCO2/m2.yr)
Insulation ECO2
(kgCO2/m2.yr)
Total CO2
(kgCO2/m2.yr)
CO2 saving %
Energy saving (A)
£
PV(A) £
NPV £
Payback period (years)
0 0 0 57.29 13.97 4.96 0 0 0 0 5867.4 13337.4 43.70 35.00 195010.00 0.00 0.00 195010.00 19.53 0.00 0.00 0.80 20.33 0.00 0.00 0.00 0.00 025 195 94 32.25 10.4775 4.96 0.5008 12404.813 30259.929 203.1794 4227.247 8902.783 66.60 44.70 273870.00 29250.00 17257.06 320377.06 12.81 0.30 0.08 2 15.20 25.26 4434.62 104164.63 -21202.43 30.550 650 187 21.5 6.985 4.96 0.7158 24677.661 23563.4558 6327.852 3014.13 6489.966 66.60 44.70 273870.00 97500.00 34514.12 405884.12 8.58 0.60 0.27 2 11.45 43.70 6847.43 160839.23 -50034.89 33.575 1210 281 10.75 3.4925 4.96 0.9308 37082.474 19750.3654 14919.21 2093.687 4369.823 66.60 44.70 273870.00 181500.00 51771.18 507141.18 4.41 0.91 0.50 2 7.82 61.56 8967.58 210639.24 -101491.94 38.2
75-100 1210 375 10.75 0 4.96 0.9308 49487.288 17131.2544 24705.64 1286.622 3562.758 66.60 44.70 273870.00 181500.00 69028.24 524398.24 2.24 1.21 0.50 2 5.95 70.74 9774.64 229596.37 -99791.87 36.975-100 (2) 1210 375 10.75 0 4.96 0.9308 49487.288 17131.2544 24705.64 -72.1883 2203.948 66.60 44.70 273870.00 181500.00 69028.24 524398.24 2.24 1.21 0.50 2 5.95 70.74 11133.45 261513.43 -67874.80 36.9
Carbon Offsetting 1210 670 10.75 0 4.96 0.9308 88417.287 12184.9046 58689.29 -935.131 1341.005 66.60 44.70 273870.00 181500.00 145628.47 600998.47 -4.56 2.16 0.50 2 0.09 99.54 11996.40 281783.09 -124205.39 37Carbon Offsetting 1210 670 10.75 0 4.96 0.9308 88417.287 12184.9046 58689.29 -4163.04 -1886.91 66.60 44.70 273870.00 181500.00 145628.47 600998.47 -4.56 2.16 0.50 2 0.09 99.54 15224.31 357603.42 -48385.05 28.65
TSC + PV + FIT + 0.08 - 0.11
TSC + PV + FIT + 0.07 - 0.10
Storage and Distribution Warehouse-London
TSC + PV + Future FIT + 2010 notional building fabric
TSC + PV + FIT + 0.17 - 0.24
TSC + PV + FIT + 0.15 - 0.21
TSC + PV + FIT + 0.13 - 0.19
TSC + PV + FIT + 0.12 - 0.17
TSC + PV + FIT + 0.11 - 0.15
PV (future FiT)+Insulation+TSC

198
Table B. 5 Retail shed – PV (current FiT) + improving the building fabric U-value down to 0.07-0.1 W/m2.K (mineral wool)
provided Elec. by PV
PV area m2
Heating (KWh/m2)
Lighting (KWh/m2)
Hot water (KWh/m2)
generated Elec by PV
(KWh)
purchased from grid
elec (KWh)
Exported Elec (KWh)
Elec Cost £
Energy cost Inc FIT
Wall Insulation price £/m2
Roof Insulation price £/m2
Total Insulation
price £
PV cost £
Fabric cost £
Operational CO2
(kgCO2/m2.yr)
PV ECO2
(kgCO2/m2.yr)
Insulation ECO2
(kgCO2/m2.yr)
Total CO2
(kgCO2/m2.yr)CO2
saving %
Energy saving (A)
£
PV(A) £
NPV £
Payback period (years)
0 0 32.9 31.8 1.98 0 0 0 13356 17541.6 43.70 35.00 195010.00 0.00 195010.00 23.52 0.00 0.80 24.32 0.00 0.00 0.00 0.00 025% 213 32.9 23.85 1.98 28108.7793 68675.2667 1695.68 5462.459 9648.058743 43.70 35.00 195010.00 39282.35 234292.35 18.55 0.69 0.80 20.04 17.61 7893.54 185411.23 146128.88 550% 427 32.9 15.9 1.98 56349.5247 53315.7105 14577.04162 -1362.45 2823.151511 43.70 35.00 195010.00 78564.71 273574.71 13.61 1.38 0.80 15.79 35.08 14718.45 345721.34 267156.63 5.4575% 640 32.9 7.95 1.98 84458.304 44755.5418 33894.51628 -7505.93 -3320.33146 43.70 35.00 195010.00 117847.06 312857.06 8.74 2.07 0.80 11.60 52.30 20861.93 490025.48 372178.42 5.75100% 853 32.9 0 1.98 112567.0833 38839.5238 56318.41358 -13419 -9233.42235 43.70 35.00 195010.00 157129.41 352139.41 3.78 2.75 0.80 7.33 69.85 26775.02 628917.95 471788.54 6
Carbon offsetting 1225 32.9 0 1.98 161658.4725 32022.1112 98592.39014 -23394 -19208.4405 43.70 35.00 195010.00 266261.01 461271.01 -4.80 3.95 0.80 -0.05 100.21 36750.04 863220.95 596959.94 7.4
provided Elec. by PV
PV area m2
Heating (KWh/m2)
Lighting (KWh/m2)
Hot water (KWh/m2)
generated Elec by PV
(KWh)
purchased from grid
elec (KWh)
Exported Elec (KWh)
Elec Cost £
Energy cost Inc FIT
Wall Insulation price £/m2
Roof Insulation price £/m2
Total Insulation
price £
PV cost £
Fabric cost £
Operational CO2
(kgCO2/m2.yr)
PV ECO2
(kgCO2/m2.yr)
Insulation ECO2
(kgCO2/m2.yr)
Total CO2
(kgCO2/m2.yr)CO2
saving %
Energy saving (A)
£
PV(A) £
NPV £
Payback period (years)
0 0 32.9 31.8 1.98 0 0 0 13356 17541.6 43.70 35.00 195010.00 0.00 195010.00 23.52 0.00 0.80 24.32 0.00 0.00 0.00 0.00 025% 213 31.9 23.85 1.98 28108.7793 68675.2667 1695.68 5462.459 9528.058743 44.30 35.70 198280.00 39282.35 237562.35 18.35 0.69 0.88 19.92 18.09 8013.54 188229.91 145677.55 5.450% 427 31.9 15.9 1.98 56349.5247 53315.7105 14577.04162 -1362.45 2703.151511 44.30 35.70 198280.00 78564.71 276844.71 13.41 1.38 0.88 15.67 35.55 14838.45 348540.01 266705.31 5.675% 640 31.9 7.95 1.98 84458.304 44755.5418 33894.51628 -7505.93 -3440.33146 44.30 35.70 198280.00 117847.06 316127.06 8.54 2.07 0.88 11.48 52.77 20981.93 492844.16 371727.10 5.85100% 853 31.9 0 1.98 112567.0833 38839.5238 56318.41358 -13419 -9353.42235 44.30 35.70 198280.00 157129.41 355409.41 3.58 2.75 0.88 7.22 70.33 26895.02 631736.63 471337.22 6
Carbon offsetting 1215 31.9 0 1.98 160338.8115 32185.1076 97635.72554 -23136.8 -19071.2203 44.30 35.70 198280.00 264087.45 462367.45 -4.80 3.92 0.88 0.00 100.02 36612.82 859997.79 592640.33 7.45
provided Elec. by PV
PV area m2
Heating (KWh/m2)
Lighting (KWh/m2)
Hot water (KWh/m2)
generated Elec by PV
(KWh)
purchased from grid
elec (KWh)
Exported Elec (KWh)
Elec Cost £
Energy cost Inc FIT
Wall Insulation price £/m2
Roof Insulation price £/m2
Total Insulation
price £
PV cost £
Fabric cost £
Operational CO2
(kgCO2/m2.yr)
PV ECO2
(kgCO2/m2.yr)
Insulation ECO2
(kgCO2/m2.yr)
Total CO2
(kgCO2/m2.yr)CO2
saving %
Energy saving (A)
£
PV(A) £
NPV £
Payback period (years)
0 0 32.9 31.8 1.98 0 0 0 13356 17541.6 43.70 35.00 195010.00 0.00 195010.00 23.52 0.00 0.80 24.32 0.00 0.00 0.00 0.00 025% 213 30.42 23.85 1.98 28108.7793 68675.2667 1695.68 5462.459 9350.458743 45.00 36.40 201780.00 39282.35 241062.35 18.06 0.69 0.96 19.71 18.95 8191.14 192401.55 146349.20 5.7550% 427 30.42 15.9 1.98 56349.5247 53315.7105 14577.04162 -1362.45 2525.551511 45.00 36.40 201780.00 78564.71 280344.71 13.12 1.38 0.96 15.46 36.42 15016.05 352711.66 267376.95 5.7575% 640 30.42 7.95 1.98 84458.304 44755.5418 33894.51628 -7505.93 -3617.93146 45.00 36.40 201780.00 117847.06 319627.06 8.25 2.07 0.96 11.27 53.64 21159.53 497015.80 372398.74 6100% 853 30.42 0 1.98 112567.0833 38839.5238 56318.41358 -13419 -9531.02235 45.00 36.40 201780.00 157129.41 358909.41 3.29 2.75 0.96 7.01 71.19 27072.62 635908.27 472008.86 6.15
Carbon offsetting 1205 30.42 0 1.98 159019.1505 32348.104 96379.06094 -22866.1 -18978.1 45.00 36.40 201780.00 261913.89 463693.89 -4.85 3.89 0.96 0.00 99.99 36519.70 857810.49 589126.59 7.5
provided Elec. by PV
PV area m2
Heating (KWh/m2)
Lighting (KWh/m2)
Hot water (KWh/m2)
generated Elec by PV
(KWh)
purchased from grid
elec (KWh)
Exported Elec (KWh)
Elec Cost £
Energy cost Inc FIT
Wall Insulation price £/m2
Roof Insulation price £/m2
Total Insulation
price £
PV cost £
Fabric cost £
Operational CO2
(kgCO2/m2.yr)
PV ECO2
(kgCO2/m2.yr)
Insulation ECO2
(kgCO2/m2.yr)
Total CO2
(kgCO2/m2.yr)CO2
saving %
Energy saving (A)
£
PV(A) £
NPV £
Payback period (years)
0 0 32.9 31.8 1.98 0 0 0 13356 17541.6 43.70 35.00 195010.00 0.00 195010.00 23.52 0.00 0.80 24.32 0.00 0.00 0.00 0.00 025% 213 28.84 23.85 1.98 28108.7793 68675.2667 1695.68 5462.459 9160.858743 48.60 37.00 211680.00 39282.35 250962.35 17.75 0.69 1.12 19.56 19.57 8380.74 196855.06 140902.71 6.7550% 427 28.84 15.9 1.98 56349.5247 53315.7105 14577.04162 -1362.45 2335.951511 48.60 37.00 211680.00 78564.71 290244.71 12.81 1.38 1.12 15.31 37.03 15205.65 357165.17 261930.46 6.3575% 640 28.84 7.95 1.98 84458.304 44755.5418 33894.51628 -7505.93 -3807.53146 48.60 37.00 211680.00 117847.06 329527.06 7.94 2.07 1.12 11.13 54.25 21349.13 501469.31 366952.25 6.4100% 853 28.84 0 1.98 112567.0833 38839.5238 56318.41358 -13419 -9720.62235 48.60 37.00 211680.00 157129.41 368809.41 2.98 2.75 1.12 6.86 71.81 27262.22 640361.78 466562.37 6.5
Carbon offsetting 1200 28.84 0 1.98 158359.32 32460.4765 95728.7049 -22725.4 -19027.0264 48.60 37.00 211680.00 260827.12 472507.12 -5.02 3.87 1.12 -0.03 100.13 36568.63 858959.72 581462.60 7.75
provided Elec. by PV
PV area m2
Heating (KWh/m2)
Lighting (KWh/m2)
Hot water (KWh/m2)
generated Elec by PV
(KWh)
purchased from grid
elec (KWh)
Exported Elec (KWh)
Elec Cost £
Energy cost Inc FIT
Wall Insulation price £/m2
Roof Insulation price £/m2
Total Insulation
price £
PV cost £
Fabric cost £
Operational CO2
(kgCO2/m2.yr)
PV ECO2
(kgCO2/m2.yr)
Insulation ECO2
(kgCO2/m2.yr)
Total CO2
(kgCO2/m2.yr)CO2
saving %
Energy saving (A)
£
PV(A) £
NPV £
Payback period (years)
0 0 32.9 31.8 1.98 0 0 0 13356 17541.6 43.70 35.00 195010.00 0.00 195010.00 23.52 0.00 0.80 24.32 0.00 0.00 0.00 0.00 025% 213 28 23.85 1.98 28108.7793 68675.2667 1695.68 5462.459 9060.058743 50.40 38.40 219600.00 39282.35 258882.35 17.59 0.69 1.2 19.48 19.91 8481.54 199222.75 135350.40 7.7550% 427 28 15.9 1.98 56349.5247 53315.7105 14577.04162 -1362.45 2235.151511 50.40 38.40 219600.00 78564.71 298164.71 12.65 1.38 1.2 15.23 37.38 15306.45 359532.86 256378.15 6.8575% 640 28 7.95 1.98 84458.304 44755.5418 33894.51628 -7505.93 -3908.33146 50.40 38.40 219600.00 117847.06 337447.06 7.78 2.07 1.2 11.04 54.60 21449.93 503837.00 361399.94 6.75100% 853 28 0 1.98 112567.0833 38839.5238 56318.41358 -13419 -9821.42235 50.40 38.40 219600.00 157129.41 376729.41 2.82 2.75 1.2 6.77 72.15 27363.02 642729.47 461010.06 6.75
Carbon offsetting 1194 28 0 1.98 157567.5234 32556.8816 95036.21142 -22566 -18968.357 50.40 38.40 219600.00 259522.98 479122.98 -5.05 3.85 1.2 0.00 99.99 36509.96 857581.64 573468.66 7.95
provided Elec. by PV
PV area m2
Heating (KWh/m2)
Lighting (KWh/m2)
Hot water (KWh/m2)
generated Elec by PV
(KWh)
purchased from grid
elec (KWh)
Exported Elec (KWh)
Elec Cost £
Energy cost Inc FIT
Wall Insulation price £/m2
Roof Insulation price £/m2
Total Insulation
price £
PV cost £
Fabric cost £
Operational CO2
(kgCO2/m2.yr)
PV ECO2
(kgCO2/m2.yr)
Insulation ECO2
(kgCO2/m2.yr)
Total CO2
(kgCO2/m2.yr)CO2
saving %
Energy saving (A)
£
PV(A) £
NPV £
Payback period (years)
0 0 32.9 31.8 1.98 0 0 0 13356 17541.6 43.70 35.00 195010.00 0.00 195010.00 23.52 0.00 0.80 24.32 0.00 0.00 0.00 0.00 025% 213 27.04 23.85 1.98 28108.7793 68675.2667 1695.68 5462.459 8944.858743 52.20 39.00 225360.00 39282.35 264642.35 17.40 0.69 1.3 19.39 20.28 8596.74 201928.68 132296.33 8.2550% 427 27.04 15.9 1.98 56349.5247 53315.7105 14577.04162 -1362.45 2119.951511 52.20 39.00 225360.00 78564.71 303924.71 12.46 1.38 1.3 15.14 37.74 15421.65 362238.79 253324.08 7.275% 640 27.04 7.95 1.98 84458.304 44755.5418 33894.51628 -7505.93 -4023.53146 52.20 39.00 225360.00 117847.06 343207.06 7.59 2.07 1.3 10.95 54.96 21565.13 506542.93 358345.87 7100% 853 27.04 0 1.98 112567.0833 38839.5238 56318.41358 -13419 -9936.62235 52.20 39.00 225360.00 157129.41 382489.41 2.63 2.75 1.3 6.68 72.52 27478.22 645435.40 457955.99 7
Carbon offsetting 1190 27.04 0 1.98 157039.659 32623.0836 94574.5491 -22459.4 -18976.9736 52.20 39.00 225360.00 258653.56 484013.56 -5.15 3.84 1.3 -0.01 100.02 36518.57 857784.03 568780.47 8.1
provided Elec. by PV
PV area m2
Heating (KWh/m2)
Lighting (KWh/m2)
Hot water (KWh/m2)
generated Elec by PV
(KWh)
purchased from grid
elec (KWh)
Exported Elec (KWh)
Elec Cost £
Energy cost Inc FIT
Wall Insulation price £/m2
Roof Insulation price £/m2
Total Insulation
price £
PV cost £
Fabric cost £
Operational CO2
(kgCO2/m2.yr)
PV ECO2
(kgCO2/m2.yr)
Insulation ECO2
(kgCO2/m2.yr)
Total CO2
(kgCO2/m2.yr)CO2
saving %
Energy saving (A)
£
PV(A) £
NPV £
Payback period (years)
0 0 32.9 31.8 1.98 0 0 0 13356 17541.6 43.70 35.00 195010.00 0.00 195010.00 23.52 0.00 0.80 24.32 0.00 0.00 0.00 0.00 025% 213 24.8 23.85 1.98 28108.7793 68675.2667 1695.68 5462.459 8676.058743 63.00 43.00 261000.00 39282.35 300282.35 16.96 0.69 1.84 19.49 19.86 8865.54 208242.52 102970.16 12.2550% 427 24.8 15.9 1.98 56349.5247 53315.7105 14577.04162 -1362.45 1851.151511 63.00 43.00 261000.00 78564.71 339564.71 12.02 1.38 1.84 15.24 37.33 15690.45 368552.62 223997.92 9.575% 640 24.8 7.95 1.98 84458.304 44755.5418 33894.51628 -7505.93 -4292.33146 63.00 43.00 261000.00 117847.06 378847.06 7.15 2.07 1.84 11.05 54.55 21833.93 512856.77 329019.71 8.6100% 853 24.8 0 1.98 112567.0833 38839.5238 56318.41358 -13419 -10205.4224 63.00 43.00 261000.00 157129.41 418129.41 2.19 2.75 1.84 6.78 72.10 27747.02 651749.24 428629.83 8.25
Carbon offsetting 1194 24.8 0 1.98 157567.5234 32556.8816 95136.21142 -22570.5 -19356.857 63.00 43.00 261000.00 259522.98 520522.98 -5.69 3.85 1.84 0.00 100.01 36898.46 866707.10 541194.12 9
provided Elec. by PV
PV area m2
Heating (KWh/m2)
Lighting (KWh/m2)
Hot water (KWh/m2)
generated Elec by PV
(KWh)
purchased from grid
elec (KWh)
Exported Elec (KWh)
Elec Cost £
Energy cost Inc FIT
Wall Insulation price £/m2
Roof Insulation price £/m2
Total Insulation
price £
PV cost £
Fabric cost £
Operational CO2
(kgCO2/m2.yr)
PV ECO2
(kgCO2/m2.yr)
Insulation ECO2
(kgCO2/m2.yr)
Total CO2
(kgCO2/m2.yr)CO2
saving %
Energy saving (A)
£
PV(A) £
NPV £
Payback period (years)
0 0 32.9 31.8 1.98 0 0 0 13356 17541.6 43.70 35.00 195010.00 0.00 195010.00 23.52 0.00 0.80 24.32 0.00 0.00 0.00 0.00 025% 213 24.22 23.85 1.98 28108.7793 68675.2667 1695.68 5462.459 8606.458743 66.60 44.70 273870.00 39282.35 313152.35 16.85 0.69 2 19.53 19.67 8935.14 209877.35 91735.00 13.7550% 427 24.22 15.9 1.98 56349.5247 53315.7105 14577.04162 -1362.45 1781.551511 66.60 44.70 273870.00 78564.71 352434.71 11.91 1.38 2 15.29 37.14 15760.05 370187.46 212762.75 10.2575% 640 24.22 7.95 1.98 84458.304 44755.5418 33894.51628 -7505.93 -4361.93146 66.60 44.70 273870.00 117847.06 391717.06 7.03 2.07 2 11.10 54.36 21903.53 514491.60 317784.54 9.2100% 853 24.22 0 1.98 112567.0833 38839.5238 56318.41358 -13419 -10275.0224 66.60 44.70 273870.00 157129.41 430999.41 2.08 2.75 2 6.83 71.91 27816.62 653384.08 417394.66 8.7
Carbon offsetting 1199 24.22 0 1.98 158227.3539 32476.8093 95613.28932 -22698.8 -19554.811 66.60 44.70 273870.00 260609.76 534479.76 -5.91 3.87 2 -0.04 100.15 37096.41 871356.84 531887.08 9.4
PV + 0.08 - 0.11
PV + 0.07 - 0.10
Retail shed - London
PV + 2010 notional building fabric
PV + 0.17 - 0.24
PV + 0.15 - 0.21
PV + 0.13 - 0.19
PV + 0.12 - 0.17
PV + 0.11 - 0.15
PV (current FiT) + Insulation

199
Table B. 6 Retail shed – PV (future FiT) + improving the building fabric U-value down to 0.07-0.1 W/m2.K (mineral wool)
provided Elec. by PV
PV area m2
Heating (KWh/m2)
Lighting (KWh/m2)
Hot water (KWh/m2)
generated Elec by PV
(KWh)
purchased from grid
elec (KWh)
Exported Elec
(KWh)Elec Cost £
Energy cost Inc
FIT
Wall Insulation price £/m2
Roof Insulation price £/m2
Total Insulation
price £
PV cost £
Fabric cost £
Operational CO2
(kgCO2/m2.yr)
PV ECO2
(kgCO2/m2.yr)
Insulation ECO2
(kgCO2/m2.yr)
Total CO2
(kgCO2/m2.yr)
CO2 saving %
Energy saving (A) £
PV(A) £
NPV £
Payback period (years)
0 0 32.9 31.8 1.98 0 0 0 13356 17541.6 43.70 35.00 195010.00 0.00 195010.00 23.52 0.00 0.80 24.32 0.00 0.00 0.00 0.00 025% 213 32.9 23.85 1.98 28108.779 68675.2667 1695.68 9538.23174 13723.83 43.70 35.00 195010.00 39282.35 234292.35 18.55 0.69 0.80 20.04 17.61 3817.77 89675.48 50393.13 10.550% 427 32.9 15.9 1.98 56349.525 53315.7105 14577.042 6808.23259 10993.83 43.70 35.00 195010.00 78564.71 273574.71 13.61 1.38 0.80 15.79 35.08 6547.77 153800.38 75235.67 12.2575% 640 32.9 7.95 1.98 84458.304 44755.5418 33894.516 4740.52262 8926.123 43.70 35.00 195010.00 117847.06 312857.06 8.74 2.07 0.80 11.60 52.30 8615.48 202368.77 84521.71 14.25
100% (1) 853 32.9 0 1.98 112567.08 38839.5238 56318.414 2903.20473 7088.805 43.70 35.00 195010.00 157129.41 352139.41 3.78 2.75 0.80 7.33 69.85 10452.80 245525.50 88396.08 15.65100% (2) 853 32.9 0 1.98 112567.08 38839.5238 56318.414 -194.30802 3991.292 43.70 35.00 195010.00 157129.41 352139.41 3.78 2.75 0.80 7.33 69.85 13550.31 318282.91 161153.50 15.65
Carbon offsetting 1225 32.9 0 1.98 161658.47 32022.1112 98592.39 46.4380101 4232.038 43.70 35.00 195010.00 266261.01 461271.01 -4.80 3.95 0.80 -0.05 100.21 13309.56 312628.03 46367.02 21.1Carbon offsetting 1225 32.9 0 1.98 161658.47 32022.1112 98592.39 -5376.1434 -1190.54 43.70 35.00 195010.00 266261.01 461271.01 -4.80 3.95 0.80 -0.05 100.21 18732.14 439998.94 173737.92 14.75
provided Elec. by PV
PV area m2
Heating (KWh/m2)
Lighting (KWh/m2)
Hot water (KWh/m2)
generated Elec by PV
(KWh)
purchased from grid
elec (KWh)
Exported Elec
(KWh)Elec Cost £
Energy cost Inc
FIT
Wall Insulation price £/m2
Roof Insulation price £/m2
Total Insulation
price £
PV cost £
Fabric cost £
Operational CO2
(kgCO2/m2.yr)
PV ECO2
(kgCO2/m2.yr)
Insulation ECO2
(kgCO2/m2.yr)
Total CO2
(kgCO2/m2.yr)
CO2 saving %
Energy saving (A) £
PV(A) £
NPV £
Payback period (years)
0 0 32.9 31.8 1.98 0 0 0 13356 17541.6 43.70 35.00 195010.00 0.00 195010.00 23.52 0.00 0.80 24.32 0.00 0.00 0.00 0.00 025% 213 31.9 23.85 1.98 28108.779 68675.2667 1695.68 9538.23174 13603.83 44.30 35.70 198280.00 39282.35 237562.35 18.35 0.69 0.88 19.92 18.09 3937.77 92494.16 49941.81 1150% 427 31.9 15.9 1.98 56349.525 53315.7105 14577.042 6808.23259 10873.83 44.30 35.70 198280.00 78564.71 276844.71 13.41 1.38 0.88 15.67 35.55 6667.77 156619.05 74784.35 12.775% 640 31.9 7.95 1.98 84458.304 44755.5418 33894.516 4740.52262 8806.123 44.30 35.70 198280.00 117847.06 316127.06 8.54 2.07 0.88 11.48 52.77 8735.48 205187.45 84070.39 14.4100% 853 31.9 0 1.98 112567.08 38839.5238 56318.414 2903.20473 6968.805 44.30 35.70 198280.00 157129.41 355409.41 3.58 2.75 0.88 7.22 70.33 10572.80 248344.17 87944.76 15.8
100% (2) 853 31.9 0 1.98 112567.08 38839.5238 56318.414 -194.30802 3871.292 44.30 35.70 198280.00 157129.41 355409.41 3.58 2.75 0.88 7.22 70.33 13670.31 321101.59 160702.17 15.8Carbon offsetting 1215 31.9 0 1.98 160338.81 32185.1076 97635.726 112.307413 4177.907 44.30 35.70 198280.00 264087.45 462367.45 -4.80 3.92 0.88 0.00 100.02 13363.69 313899.50 46542.05 21.1Carbon offsetting 1215 31.9 0 1.98 160338.81 32185.1076 97635.726 -5257.6575 -1192.06 44.30 35.70 198280.00 264087.45 462367.45 -4.80 3.92 0.88 0.00 100.02 18733.66 440034.50 172677.04 14.85
provided Elec. by PV
PV area m2
Heating (KWh/m2)
Lighting (KWh/m2)
Hot water (KWh/m2)
generated Elec by PV
(KWh)
purchased from grid
elec (KWh)
Exported Elec
(KWh)Elec Cost £
Energy cost Inc
FIT
Wall Insulation price £/m2
Roof Insulation price £/m2
Total Insulation
price £
PV cost £
Fabric cost £
Operational CO2
(kgCO2/m2.yr)
PV ECO2
(kgCO2/m2.yr)
Insulation ECO2
(kgCO2/m2.yr)
Total CO2
(kgCO2/m2.yr)
CO2 saving %
Energy saving (A) £
PV(A) £
NPV £
Payback period (years)
0 0 32.9 31.8 1.98 0 0 0 13356 17541.6 43.70 35.00 195010.00 0.00 195010.00 23.52 0.00 0.80 24.32 0.00 0.00 0.00 0.00 025% 213 30.42 23.85 1.98 28108.779 68675.2667 1695.68 9538.23174 13426.23 45.00 36.40 201780.00 39282.35 241062.35 18.06 0.69 0.96 19.71 18.95 4115.37 96665.80 50613.45 11.550% 427 30.42 15.9 1.98 56349.525 53315.7105 14577.042 6808.23259 10696.23 45.00 36.40 201780.00 78564.71 280344.71 13.12 1.38 0.96 15.46 36.42 6845.37 160790.70 75455.99 12.975% 640 30.42 7.95 1.98 84458.304 44755.5418 33894.516 4740.52262 8628.523 45.00 36.40 201780.00 117847.06 319627.06 8.25 2.07 0.96 11.27 53.64 8913.08 209359.09 84742.03 14.5100% 853 30.42 0 1.98 112567.08 38839.5238 56318.414 2903.20473 6791.205 45.00 36.40 201780.00 157129.41 358909.41 3.29 2.75 0.96 7.01 71.19 10750.40 252515.82 88616.40 15.9
100% (2) 853 30.42 0 1.98 112567.08 38839.5238 56318.414 -194.30802 3693.692 45.00 36.40 201780.00 157129.41 358909.41 3.29 2.75 0.96 7.01 71.19 13847.91 325273.23 161373.82 15.9Carbon offsetting 1205 30.42 0 1.98 159019.15 32348.104 96379.061 191.676816 4079.677 45.00 36.40 201780.00 261913.89 463693.89 -4.85 3.89 0.96 0.00 99.99 13461.92 316206.84 47522.94 21.05Carbon offsetting 1205 30.42 0 1.98 159019.15 32348.104 96379.061 -5109.1715 -1221.17 45.00 36.40 201780.00 261913.89 463693.89 -4.85 3.89 0.96 0.00 99.99 18762.77 440718.36 172034.46 14.9
provided Elec. by PV
PV area m2
Heating (KWh/m2)
Lighting (KWh/m2)
Hot water (KWh/m2)
generated Elec by PV
(KWh)
purchased from grid
elec (KWh)
Exported Elec
(KWh)Elec Cost £
Energy cost Inc
FIT
Wall Insulation price £/m2
Roof Insulation price £/m2
Total Insulation
price £
PV cost £
Fabric cost £
Operational CO2
(kgCO2/m2.yr)
PV ECO2
(kgCO2/m2.yr)
Insulation ECO2
(kgCO2/m2.yr)
Total CO2
(kgCO2/m2.yr)
CO2 saving %
Energy saving (A) £
PV(A) £
NPV £
Payback period (years)
0 0 32.9 31.8 1.98 0 0 0 13356 17541.6 43.70 35.00 195010.00 0.00 195010.00 23.52 0.00 0.80 24.32 0.00 0.00 0.00 0.00 025% 213 28.84 23.85 1.98 28108.779 68675.2667 1695.68 9538.23174 13236.63 48.60 37.00 211680.00 39282.35 250962.35 17.75 0.69 1.12 19.56 19.57 4304.97 101119.31 45166.96 13.550% 427 28.84 15.9 1.98 56349.525 53315.7105 14577.042 6808.23259 10506.63 48.60 37.00 211680.00 78564.71 290244.71 12.81 1.38 1.12 15.31 37.03 7034.97 165244.21 70009.50 1475% 640 28.84 7.95 1.98 84458.304 44755.5418 33894.516 4740.52262 8438.923 48.60 37.00 211680.00 117847.06 329527.06 7.94 2.07 1.12 11.13 54.25 9102.68 213812.60 79295.54 15.35100% 853 28.84 0 1.98 112567.08 38839.5238 56318.414 2903.20473 6601.605 48.60 37.00 211680.00 157129.41 368809.41 2.98 2.75 1.12 6.86 71.81 10940.00 256969.33 83169.91 16.6
100% (2) 853 28.84 0 1.98 112567.08 38839.5238 56318.414 -194.30802 3504.092 48.60 37.00 211680.00 157129.41 368809.41 2.98 2.75 1.12 6.86 71.81 14037.51 329726.74 155927.33 16.6Carbon offsetting 1200 28.84 0 1.98 158359.32 32460.4765 95728.705 236.674991 3935.075 48.60 37.00 211680.00 260827.12 472507.12 -5.02 3.87 1.12 -0.03 100.13 13606.53 319603.39 42106.27 21.5Carbon offsetting 1200 28.84 0 1.98 158359.32 32460.4765 95728.705 -5028.4038 -1330 48.60 37.00 211680.00 260827.12 472507.12 -5.02 3.87 1.12 -0.03 100.13 18871.60 443274.72 165777.60 15.3
provided Elec. by PV
PV area m2
Heating (KWh/m2)
Lighting (KWh/m2)
Hot water (KWh/m2)
generated Elec by PV
(KWh)
purchased from grid
elec (KWh)
Exported Elec
(KWh)Elec Cost £
Energy cost Inc
FIT
Wall Insulation price £/m2
Roof Insulation price £/m2
Total Insulation
price £
PV cost £
Fabric cost £
Operational CO2
(kgCO2/m2.yr)
PV ECO2
(kgCO2/m2.yr)
Insulation ECO2
(kgCO2/m2.yr)
Total CO2
(kgCO2/m2.yr)
CO2 saving %
Energy saving (A) £
PV(A) £
NPV £
Payback period (years)
0 0 32.9 31.8 1.98 0 0 0 13356 17541.6 43.70 35.00 195010.00 0.00 195010.00 23.52 0.00 0.80 24.32 0.00 0.00 0.00 0.00 025% 213 28 23.85 1.98 28108.779 68675.2667 1695.68 9538.23174 13135.83 50.40 38.40 219600.00 39282.35 258882.35 17.59 0.69 1.2 19.48 19.91 4405.77 103487.00 39614.65 1550% 427 28 15.9 1.98 56349.525 53315.7105 14577.042 6808.23259 10405.83 50.40 38.40 219600.00 78564.71 298164.71 12.65 1.38 1.2 15.23 37.38 7135.77 167611.90 64457.19 1575% 640 28 7.95 1.98 84458.304 44755.5418 33894.516 4740.52262 8338.123 50.40 38.40 219600.00 117847.06 337447.06 7.78 2.07 1.2 11.04 54.60 9203.48 216180.29 73743.23 16.15100% 853 28 0 1.98 112567.08 38839.5238 56318.414 2903.20473 6500.805 50.40 38.40 219600.00 157129.41 376729.41 2.82 2.75 1.2 6.77 72.15 11040.80 259337.02 77617.60 17.2
100% (2) 853 28 0 1.98 112567.08 38839.5238 56318.414 -194.30802 3403.292 50.40 38.40 219600.00 157129.41 376729.41 2.82 2.75 1.2 6.77 72.15 14138.31 332094.43 150375.02 17.2Carbon offsetting 1194 28 0 1.98 157567.52 32556.8816 95036.211 281.333906 3878.934 50.40 38.40 219600.00 259522.98 479122.98 -5.05 3.85 1.2 0.00 99.99 13662.67 320922.09 36809.11 22Carbon offsetting 1194 28 0 1.98 157567.52 32556.8816 95036.211 -4945.6577 -1348.06 50.40 38.40 219600.00 259522.98 479122.98 -5.05 3.85 1.2 0.00 99.99 18889.66 443698.79 159585.81 15.65
provided Elec. by PV
PV area m2
Heating (KWh/m2)
Lighting (KWh/m2)
Hot water (KWh/m2)
generated Elec by PV
(KWh)
purchased from grid
elec (KWh)
Exported Elec
(KWh)Elec Cost £
Energy cost Inc
FIT
Wall Insulation price £/m2
Roof Insulation price £/m2
Total Insulation
price £
PV cost £
Fabric cost £
Operational CO2
(kgCO2/m2.yr)
PV ECO2
(kgCO2/m2.yr)
Insulation ECO2
(kgCO2/m2.yr)
Total CO2
(kgCO2/m2.yr)
CO2 saving %
Energy saving (A) £
PV(A) £
NPV £
Payback period (years)
0 0 32.9 31.8 1.98 0 0 0 13356 17541.6 43.70 35.00 195010.00 0.00 195010.00 23.52 0.00 0.80 24.32 0.00 0.00 0.00 0.00 025% 213 27.04 23.85 1.98 28108.779 68675.2667 1695.68 9538.23174 13020.63 52.20 39.00 225360.00 39282.35 264642.35 17.40 0.69 1.3 19.39 20.28 4520.97 106192.93 36560.58 1650% 427 27.04 15.9 1.98 56349.525 53315.7105 14577.042 6808.23259 10290.63 52.20 39.00 225360.00 78564.71 303924.71 12.46 1.38 1.3 15.14 37.74 7250.97 170317.83 61403.12 15.675% 640 27.04 7.95 1.98 84458.304 44755.5418 33894.516 4740.52262 8222.923 52.20 39.00 225360.00 117847.06 343207.06 7.59 2.07 1.3 10.95 54.96 9318.68 218886.22 70689.16 16.6100% 853 27.04 0 1.98 112567.08 38839.5238 56318.414 2903.20473 6385.605 52.20 39.00 225360.00 157129.41 382489.41 2.63 2.75 1.3 6.68 72.52 11156.00 262042.95 74563.53 17.6
100% (2) 853 27.04 0 1.98 112567.08 38839.5238 56318.414 -194.30802 3288.092 52.20 39.00 225360.00 157129.41 382489.41 2.63 2.75 1.3 6.68 72.52 14253.51 334800.36 147320.95 17.6Carbon offsetting 1190 27.04 0 1.98 157039.66 32623.0836 94574.549 311.377001 3793.777 52.20 39.00 225360.00 258653.56 484013.56 -5.15 3.84 1.3 -0.01 100.02 13747.82 322922.33 33918.78 22.25Carbon offsetting 1190 27.04 0 1.98 157039.66 32623.0836 94574.549 -4890.2232 -1407.82 52.20 39.00 225360.00 258653.56 484013.56 -5.15 3.84 1.3 -0.01 100.02 18949.42 445102.62 156099.06 15.9
provided Elec. by PV
PV area m2
Heating (KWh/m2)
Lighting (KWh/m2)
Hot water (KWh/m2)
generated Elec by PV
(KWh)
purchased from grid
elec (KWh)
Exported Elec
(KWh)Elec Cost £
Energy cost Inc
FIT
Wall Insulation price £/m2
Roof Insulation price £/m2
Total Insulation
price £
PV cost £
Fabric cost £
Operational CO2
(kgCO2/m2.yr)
PV ECO2
(kgCO2/m2.yr)
Insulation ECO2
(kgCO2/m2.yr)
Total CO2
(kgCO2/m2.yr)
CO2 saving %
Energy saving (A) £
PV(A) £
NPV £
Payback period (years)
0 0 32.9 31.8 1.98 0 0 0 13356 17541.6 43.70 35.00 195010.00 0.00 195010.00 23.52 0.00 0.80 24.32 0.00 0.00 0.00 0.00 025% 213 24.8 23.85 1.98 28108.779 68675.2667 1695.68 9538.23174 12751.83 63.00 43.00 261000.00 39282.35 300282.35 16.96 0.69 1.84 19.49 19.86 4789.77 112506.77 7234.42 23.350% 427 24.8 15.9 1.98 56349.525 53315.7105 14577.042 6808.23259 10021.83 63.00 43.00 261000.00 78564.71 339564.71 12.02 1.38 1.84 15.24 37.33 7519.77 176631.66 32076.96 20.2575% 640 24.8 7.95 1.98 84458.304 44755.5418 33894.516 4740.52262 7954.123 63.00 43.00 261000.00 117847.06 378847.06 7.15 2.07 1.84 11.05 54.55 9587.48 225200.06 41363.00 20.2100% 853 24.8 0 1.98 112567.08 38839.5238 56318.414 2903.20473 6116.805 63.00 43.00 261000.00 157129.41 418129.41 2.19 2.75 1.84 6.78 72.10 11424.80 268356.78 45237.37 20.6
100% (2) 853 24.8 0 1.98 112567.08 38839.5238 56318.414 -194.30802 3019.292 63.00 43.00 261000.00 157129.41 418129.41 2.19 2.75 1.84 6.78 72.10 14522.31 341114.20 117994.79 20.6Carbon offsetting 1194 24.8 0 1.98 157567.52 32556.8816 95136.211 276.833906 3490.434 63.00 43.00 261000.00 259522.98 520522.98 -5.69 3.85 1.84 0.00 100.01 14051.17 330047.55 4534.57 24.65Carbon offsetting 1194 24.8 0 1.98 157567.52 32556.8816 95136.211 -4955.6577 -1742.06 63.00 43.00 261000.00 259522.98 520522.98 -5.69 3.85 1.84 0.00 100.01 19283.66 452953.44 127440.46 17.65
provided Elec. by PV
PV area m2
Heating (KWh/m2)
Lighting (KWh/m2)
Hot water (KWh/m2)
generated Elec by PV
(KWh)
purchased from grid
elec (KWh)
Exported Elec
(KWh)Elec Cost £
Energy cost Inc
FIT
Wall Insulation price £/m2
Roof Insulation price £/m2
Total Insulation
price £
PV cost £
Fabric cost £
Operational CO2
(kgCO2/m2.yr)
PV ECO2
(kgCO2/m2.yr)
Insulation ECO2
(kgCO2/m2.yr)
Total CO2
(kgCO2/m2.yr)
CO2 saving %
Energy saving (A) £
PV(A) £
NPV £
Payback period (years)
0 0 32.9 31.8 1.98 0 0 0 13356 17541.6 43.70 35.00 195010.00 0.00 195010.00 23.52 0.00 0.80 24.32 0.00 0.00 0.00 0.00 025% 213 24.22 23.85 1.98 28108.779 68675.2667 1695.68 9538.23174 12682.23 66.60 44.70 273870.00 39282.35 313152.35 16.85 0.69 2 19.53 19.67 4859.37 114141.60 -4000.75 2650% 427 24.22 15.9 1.98 56349.525 53315.7105 14577.042 6808.23259 9952.233 66.60 44.70 273870.00 78564.71 352434.71 11.91 1.38 2 15.29 37.14 7589.37 178266.50 20841.79 21.975% 640 24.22 7.95 1.98 84458.304 44755.5418 33894.516 4740.52262 7884.523 66.60 44.70 273870.00 117847.06 391717.06 7.03 2.07 2 11.10 54.36 9657.08 226834.89 30127.83 21.5100% 853 24.22 0 1.98 112567.08 38839.5238 56318.414 2903.20473 6047.205 66.60 44.70 273870.00 157129.41 430999.41 2.08 2.75 2 6.83 71.91 11494.40 269991.62 34002.20 21.65
100% (2) 853 24.22 0 1.98 112567.08 38839.5238 56318.414 -194.30802 2949.692 66.60 44.70 273870.00 157129.41 430999.41 2.08 2.75 2 6.83 71.91 14591.91 342749.03 106759.62 21.65Carbon offsetting 1199 24.22 0 1.98 158227.35 32476.8093 95613.289 244.155287 3388.155 66.60 44.70 273870.00 260609.76 534479.76 -5.91 3.87 2 -0.04 100.15 14153.44 332449.97 -7019.79 25.5Carbon offsetting 1199 24.22 0 1.98 158227.35 32476.8093 95613.289 -5014.5756 -1870.58 66.60 44.70 273870.00 260609.76 534479.76 -5.91 3.87 2 -0.04 100.15 19412.18 455972.20 116502.44 18.3
PV + 0.08 - 0.11
PV + 0.07 - 0.10
PV + 2010 notional building fabric
Retail shed - London
PV + 0.17 - 0.24
PV + 0.15 - 0.21
PV + 0.13 - 0.19
PV + 0.12 - 0.17
PV + 0.11 - 0.15
PV (future FiT) + Insulation

200
Table B. 7 Retail shed – PV (current FiT) + improving the building fabric U-value down to 0.07-0.1 W/m2.K (mineral wool) +TSC
provided Elec. & heating
TSC area m2
PV area m2
Heating (KWh/m2)
Lighting (KWh/m2)
Hot water (KWh/m2)
TSC fan power
(KWh/m2)
generated Elec by PV
(KWh)
purchased from grid
elec (KWh)
Exported Elec (KWh)
Elec cost £Energy
cost Inc FIT £
Wall Insulation price £/m2
Roof Insulation price £/m2
Total Insulation
price £TSC cost £ PV Cost £
Fabric cost £
Operational CO2
(kgCO2/m2.yr)
PV ECO2
(kgCO2/m2.yr)
TSC ECO2
(kgCO2/m2.yr)
Insulation ECO2
(kgCO2/m2.yr)
Total CO2
(kgCO2/m2.yr)CO2
saving %
Energy saving (A)
£
PV(A) £
NPV £
Payback period (years)
0 0 0 32.9 31.8 1.98 0 0 0 0 13356 17541.6 43.70 35.00 195010.00 0.00 0.00 195010.00 23.52 0.00 0.00 0.80 24.32 0.00 0.00 0.00 0.00 025% 130 213 24.675 24.675 1.98 0.1645 28108.7793 68675.2667 1695.68 5462.45874 8661.0587 43.70 35.00 195010.00 19500.00 35205.88 249715.88 17.02 0.69 0.05 0.80 18.56 23.66 8880.54 208594.85 153888.97 6.2550% 345 427 16.45 16.45 1.98 0.329 56349.5247 53315.7105 14577.0416 -1362.4485 849.15151 43.70 35.00 195010.00 51750.00 75847.06 322607.06 10.56 1.38 0.14 0.80 12.88 47.04 16692.45 392088.58 264491.52 7.875% 595 640 8.225 8.225 1.98 0.4935 84458.304 44755.5418 33894.5163 -7505.9315 -6281.331 43.70 35.00 195010.00 89250.00 116488.24 400748.24 4.16 2.07 0.24 0.80 7.27 70.12 23822.93 559576.35 353838.12 8.85
75-100 595 853 8.225 0 1.98 0.4935 112567.083 38839.5238 56318.4136 -13419.022 -12194.42 43.70 35.00 195010.00 89250.00 157129.41 441389.41 -0.80 2.75 0.24 0.80 3.00 87.67 29736.02 698468.82 452089.41 8.5Carbon
offsetting595 1003 8.225 0 1.98 0.4935 132361.998 35860.2706 73242.651 -17467.971 -16243.37 43.70 35.00 195010.00 89250.00 218008.00 502268.00 -4.28 3.24 0.24 0.80 0.00 99.99 33784.97 793574.50 486316.50 9.35
provided Elec. & heating
TSC area m2
PV area m2
Heating (KWh/m2)
Lighting (KWh/m2)
Hot water (KWh/m2)
TSC fan power
(KWh/m2)
generated Elec by PV
(KWh)
purchased from grid
elec (KWh)
Exported Elec (KWh)
Elec cost £Energy
cost Inc FIT £
Wall Insulation price £/m2
Roof Insulation price £/m2
Total Insulation
price £TSC cost £ PV Cost £
Fabric cost £
Operational CO2
(kgCO2/m2.yr)
PV ECO2
(kgCO2/m2.yr)
TSC ECO2
(kgCO2/m2.yr)
Insulation ECO2
(kgCO2/m2.yr)
Total CO2
(kgCO2/m2.yr)CO2
saving %
Energy saving (A)
£
PV(A) £
NPV £
Payback period (years)
0 0 0 32.9 31.8 1.98 0 0 0 0 13356 17541.6 43.70 35.00 195010.00 0.00 0.00 195010.00 23.52 0.00 0.00 0.80 24.32 0.00 0.00 0.00 0.00 025 115 213 23.92 24.675 1.98 0.1796 28108.7793 68675.2667 1695.68 5462.45874 8570.4587 44.30 35.70 198280.00 17250.00 35205.88 250735.88 16.88 0.69 0.05 0.88 18.50 23.94 8971.14 210722.95 154997.07 6.350 315 427 15.95 16.45 1.98 0.339 56349.5247 53315.7105 14577.0416 -1362.4485 789.15151 44.30 35.70 198280.00 47250.00 75847.06 321377.06 10.47 1.38 0.13 0.88 12.85 47.15 16752.45 393497.92 267130.86 7.775 560 640 7.97 8.225 1.98 0.4986 84458.304 44755.5418 33894.5163 -7505.9315 -6311.931 44.30 35.70 198280.00 84000.00 116488.24 398768.24 4.11 2.07 0.23 0.88 7.29 70.04 23853.53 560295.11 356536.88 8.75
75-100 560 853 7.97 0 1.98 0.4986 112567.083 38839.5238 56318.4136 -13419.022 -12225.02 44.30 35.70 198280.00 84000.00 157129.41 439409.41 -0.84 2.75 0.23 0.88 3.02 87.59 29766.62 699187.59 454788.17 8.4Carbon
offsetting560 1006 7.97 0 1.98 0.4986 132757.897 35804.8269 73482.2773 -17543.922 -16349.92 44.30 35.70 198280.00 84000.00 218660.06 500940.06 -4.38 3.25 0.23 0.88 -0.02 100.09 33891.52 796077.26 490147.20 9.25
provided Elec. & heating
TSC area m2
PV area m2
Heating (KWh/m2)
Lighting (KWh/m2)
Hot water (KWh/m2)
TSC fan power
(KWh/m2)
generated Elec by PV
(KWh)
purchased from grid
elec (KWh)
Exported Elec (KWh)
Elec cost £Energy
cost Inc FIT £
Wall Insulation price £/m2
Roof Insulation price £/m2
Total Insulation
price £TSC cost £ PV Cost £
Fabric cost £
Operational CO2
(kgCO2/m2.yr)
PV ECO2
(kgCO2/m2.yr)
TSC ECO2
(kgCO2/m2.yr)
Insulation ECO2
(kgCO2/m2.yr)
Total CO2
(kgCO2/m2.yr)CO2
saving %
Energy saving (A)
£
PV(A) £
NPV £
Payback period (years)
0 0 0 32.9 31.8 1.98 0 0 0 0 13356 17541.6 43.70 35.00 195010.00 0.00 0.00 195010.00 23.52 0.00 0.00 0.80 24.32 0.00 0.00 0.00 0.00 025 113 213 22.6 24.675 1.98 0.206 28108.7793 68675.2667 1695.68 5462.45874 8412.0587 45.00 36.40 201780.00 16950.00 35205.88 253935.88 16.64 0.69 0.05 0.96 18.33 24.62 9129.54 214443.61 155517.73 6.5550 305 427 15.21 16.45 1.98 0.3538 56349.5247 53315.7105 14577.0416 -1362.4485 700.35151 45.00 36.40 201780.00 45750.00 75847.06 323377.06 10.33 1.38 0.13 0.96 12.79 47.40 16841.25 395583.74 267216.68 7.875 551 640 7.55 8.225 1.98 0.507 84458.304 44755.5418 33894.5163 -7505.9315 -6362.331 45.00 36.40 201780.00 82650.00 116488.24 400918.24 4.03 2.07 0.23 0.96 7.28 70.05 23903.93 561478.96 355570.72 8.85
75-100 551 853 7.55 0 1.98 0.507 112567.083 38839.5238 56318.4136 -13419.022 -12275.42 45.00 36.40 201780.00 82650.00 157129.41 441559.41 -0.92 2.75 0.23 0.96 3.02 87.60 29817.02 700371.43 453822.02 8.45Carbon
offsetting551 1006 7.55 0 1.98 0.507 132757.897 35804.8269 73482.2773 -17543.922 -16400.32 45.00 36.40 201780.00 82650.00 218660.06 503090.06 -4.45 3.25 0.23 0.96 -0.02 100.09 33941.92 797261.11 489181.04 9.3
provided Elec. & heating
TSC area m2
PV area m2
Heating (KWh/m2)
Lighting (KWh/m2)
Hot water (KWh/m2)
TSC fan power
(KWh/m2)
generated Elec by PV
(KWh)
purchased from grid
elec (KWh)
Exported Elec (KWh)
Elec cost £Energy
cost Inc FIT £
Wall Insulation price £/m2
Roof Insulation price £/m2
Total Insulation
price £TSC cost £ PV Cost £
Fabric cost £
Operational CO2
(kgCO2/m2.yr)
PV ECO2
(kgCO2/m2.yr)
TSC ECO2
(kgCO2/m2.yr)
Insulation ECO2
(kgCO2/m2.yr)
Total CO2
(kgCO2/m2.yr)CO2
saving %
Energy saving (A)
£
PV(A) £
NPV £
Payback period (years)
0 0 0 32.9 31.8 1.98 0 0 0 0 13356 17541.6 43.70 35.00 195010.00 0.00 0.00 195010.00 23.52 0.00 0.00 0.80 24.32 0.00 0.00 0.00 0.00 025 112 213 21.72 24.675 1.98 0.2236 28108.7793 68675.2667 1695.68 5462.45874 8306.4587 48.60 37.00 211680.00 16800.00 35205.88 263685.88 16.47 0.69 0.05 1.12 18.33 24.63 9235.14 216924.04 148248.16 7.6550 295 427 14.18 16.45 1.98 0.3744 56349.5247 53315.7105 14577.0416 -1362.4485 576.75151 48.60 37.00 211680.00 44250.00 75847.06 331777.06 10.14 1.38 0.12 1.12 12.76 47.54 16964.85 398486.98 261719.92 8.2575 542 640 7.24 8.225 1.98 0.5132 84458.304 44755.5418 33894.5163 -7505.9315 -6399.531 48.60 37.00 211680.00 81300.00 116488.24 409468.24 3.98 2.07 0.22 1.12 7.38 69.64 23941.13 562352.75 347894.51 9.2
75-100 542 853 7.24 0 1.98 0.5132 112567.083 38839.5238 56318.4136 -13419.022 -12312.62 48.60 37.00 211680.00 81300.00 157129.41 450109.41 -0.98 2.75 0.22 1.12 3.11 87.19 29854.22 701245.22 446145.81 8.75Carbon
offsetting542 1012 7.24 0 1.98 0.5132 133549.693 35693.9393 74161.5299 -17704.823 -16598.42 48.60 37.00 211680.00 81300.00 219964.20 512944.20 -4.65 3.27 0.22 1.12 -0.04 100.18 34140.02 801914.30 483980.10 9.55
provided Elec. & heating
TSC area m2
PV area m2
Heating (KWh/m2)
Lighting (KWh/m2)
Hot water (KWh/m2)
TSC fan power
(KWh/m2)
generated Elec by PV
(KWh)
purchased from grid
elec (KWh)
Exported Elec (KWh)
Elec cost £Energy
cost Inc FIT £
Wall Insulation price £/m2
Roof Insulation price £/m2
Total Insulation
price £TSC cost £ PV Cost £
Fabric cost £
Operational CO2
(kgCO2/m2.yr)
PV ECO2
(kgCO2/m2.yr)
TSC ECO2
(kgCO2/m2.yr)
Insulation ECO2
(kgCO2/m2.yr)
Total CO2
(kgCO2/m2.yr)CO2
saving %
Energy saving (A)
£
PV(A) £
NPV £
Payback period (years)
0 0 0 32.9 31.8 1.98 0 0 0 0 13356 17541.6 43.70 35.00 195010.00 0.00 0.00 195010.00 23.52 0.00 0.00 0.80 24.32 0.00 0.00 0.00 0.00 025 109 213 21 24.675 1.98 0.238 28108.7793 68675.2667 1695.68 5462.45874 8220.0587 50.40 38.40 219600.00 16350.00 35205.88 271155.88 16.34 0.69 0.04 1.2 18.27 24.86 9321.54 218953.49 142807.61 8.3550 292 427 14 16.45 1.98 0.378 56349.5247 53315.7105 14577.0416 -1362.4485 555.15151 50.40 38.40 219600.00 43800.00 75847.06 339247.06 10.10 1.38 0.12 1.2 12.80 47.36 16986.45 398994.34 254757.28 8.775 535 640 7 8.225 1.98 0.518 84458.304 44755.5418 33894.5163 -7505.9315 -6428.331 50.40 38.40 219600.00 80250.00 116488.24 416338.24 3.93 2.07 0.22 1.2 7.42 69.51 23969.93 563029.23 341701.00 9.5
75-100 535 853 7 0 1.98 0.518 112567.083 38839.5238 56318.4136 -13419.022 -12341.42 50.40 38.40 219600.00 80250.00 157129.41 456979.41 -1.02 2.75 0.22 1.2 3.15 87.06 29883.02 701921.70 439952.29 9Carbon
offsetting535 1015 7 0 1.98 0.518 133945.592 35638.4955 74501.1561 -17785.273 -16707.67 50.40 38.40 219600.00 80250.00 220616.27 520466.27 -4.76 3.28 0.22 1.2 -0.07 100.29 34249.27 804480.49 479024.22 9.75
provided Elec. & heating
TSC area m2
PV area m2
Heating (KWh/m2)
Lighting (KWh/m2)
Hot water (KWh/m2)
TSC fan power
(KWh/m2)
generated Elec by PV
(KWh)
purchased from grid
elec (KWh)
Exported Elec (KWh)
Elec cost £Energy
cost Inc FIT £
Wall Insulation price £/m2
Roof Insulation price £/m2
Total Insulation
price £TSC cost £ PV Cost £
Fabric cost £
Operational CO2
(kgCO2/m2.yr)
PV ECO2
(kgCO2/m2.yr)
TSC ECO2
(kgCO2/m2.yr)
Insulation ECO2
(kgCO2/m2.yr)
Total CO2
(kgCO2/m2.yr)CO2
saving %
Energy saving (A)
£
PV(A) £
NPV £
Payback period (years)
0 0 0 32.9 31.8 1.98 0 0 0 0 13356 17541.6 43.70 35.00 195010.00 0.00 0.00 195010.00 23.52 0.00 0.00 0.80 24.32 0.00 0.00 0.00 0.00 025 107 213 20.2 24.675 1.98 0.254 28108.7793 68675.2667 1695.68 5462.45874 8124.0587 52.20 39.00 225360.00 16050.00 35205.88 276615.88 16.19 0.69 0.04 1.3 18.22 25.06 9417.54 221208.43 139602.55 8.8550 288 427 13.52 16.45 1.98 0.3876 56349.5247 53315.7105 14577.0416 -1362.4485 497.55151 52.20 39.00 225360.00 43200.00 75847.06 344407.06 10.02 1.38 0.12 1.3 12.81 47.32 17044.05 400347.31 250950.25 975 527 640 6.76 8.225 1.98 0.5228 84458.304 44755.5418 33894.5163 -7505.9315 -6457.131 52.20 39.00 225360.00 79050.00 116488.24 420898.24 3.89 2.07 0.22 1.3 7.47 69.29 23998.73 563705.71 337817.48 9.65
75-100 527 853 6.76 0 1.98 0.5228 112567.083 38839.5238 56318.4136 -13419.022 -12370.22 52.20 39.00 225360.00 79050.00 157129.41 461539.41 -1.07 2.75 0.22 1.3 3.20 86.84 29911.82 702598.19 436068.77 9.15Carbon
offsetting527 1017 6.76 0 1.98 0.5228 134341.49 35583.0517 74740.7824 -17861.224 -16812.42 52.20 39.00 225360.00 79050.00 221268.34 525678.34 -4.86 3.28 0.22 1.3 -0.06 100.26 34354.02 806940.97 476272.63 9.9
provided Elec. & heating
TSC area m2
PV area m2
Heating (KWh/m2)
Lighting (KWh/m2)
Hot water (KWh/m2)
TSC fan power
(KWh/m2)
generated Elec by PV
(KWh)
purchased from grid
elec (KWh)
Exported Elec (KWh)
Elec cost £Energy
cost Inc FIT £
Wall Insulation price £/m2
Roof Insulation price £/m2
Total Insulation
price £TSC cost £ PV Cost £
Fabric cost £
Operational CO2
(kgCO2/m2.yr)
PV ECO2
(kgCO2/m2.yr)
TSC ECO2
(kgCO2/m2.yr)
Insulation ECO2
(kgCO2/m2.yr)
Total CO2
(kgCO2/m2.yr)CO2
saving %
Energy saving (A)
£
PV(A) £
NPV £
Payback period (years)
0 0 0 32.9 31.8 1.98 0 0 0 0 13356 17541.6 43.70 35.00 195010.00 0.00 0.00 195010.00 23.52 0.00 0.00 0.80 24.32 0.00 0.00 0.00 0.00 025 106 213 18.6 24.675 1.98 0.286 28108.7793 68675.2667 1695.68 5462.45874 7932.0587 63.00 43.00 261000.00 15900.00 35205.88 312105.88 15.90 0.69 0.04 1.84 18.47 24.06 9609.54 225718.32 108622.44 12.650 286 427 12.4 16.45 1.98 0.41 56349.5247 53315.7105 14577.0416 -1362.4485 363.15151 63.00 43.00 261000.00 42900.00 75847.06 379747.06 9.81 1.38 0.12 1.84 13.14 45.96 17178.45 403504.23 218767.17 11.175 524 640 6.2 8.225 1.98 0.534 84458.304 44755.5418 33894.5163 -7505.9315 -6524.331 63.00 43.00 261000.00 78600.00 116488.24 456088.24 3.78 2.07 0.21 1.84 7.90 67.50 24065.93 565284.17 304205.94 11.15
75-100 524 853 6.2 0 1.98 0.534 112567.083 38839.5238 56318.4136 -13419.022 -12437.42 63.00 43.00 261000.00 78600.00 157129.41 496729.41 -1.17 2.75 0.21 1.84 3.63 85.06 29979.02 704176.64 402457.23 10.35Carbon
offsetting524 1037 6.2 0 1.98 0.534 136848.846 35231.9078 76991.7489 -18375.244 -17393.64 63.00 43.00 261000.00 78600.00 225398.10 564998.10 -5.42 3.35 0.21 1.84 -0.02 100.07 34935.24 820593.24 450605.14 10.9
provided Elec. & heating
TSC area m2
PV area m2
Heating (KWh/m2)
Lighting (KWh/m2)
Hot water (KWh/m2)
TSC fan power
(KWh/m2)
generated Elec by PV
(KWh)
purchased from grid
elec (KWh)
Exported Elec (KWh)
Elec cost £Energy
cost Inc FIT £
Wall Insulation price £/m2
Roof Insulation price £/m2
Total Insulation
price £TSC cost £ PV Cost £
Fabric cost £
Operational CO2
(kgCO2/m2.yr)
PV ECO2
(kgCO2/m2.yr)
TSC ECO2
(kgCO2/m2.yr)
Insulation ECO2
(kgCO2/m2.yr)
Total CO2
(kgCO2/m2.yr)CO2
saving %
Energy saving (A)
£
PV(A) £
NPV £
Payback period (years)
0 0 0 32.9 31.8 1.98 0 0 0 0 13356 17541.6 43.70 35.00 195010.00 0.00 0.00 195010.00 23.52 0.00 0.00 0.80 24.32 0.00 0.00 0.00 0.00 025 105 213 18.17 24.675 1.98 0.2946 28108.7793 68675.2667 1695.68 5462.45874 7880.4587 66.60 44.70 273870.00 15750.00 35205.88 324825.88 15.82 0.69 0.04 2 18.55 23.73 9661.14 226930.35 97114.47 13.950 284 427 12.11 16.45 1.98 0.4158 56349.5247 53315.7105 14577.0416 -1362.4485 328.35151 66.60 44.70 273870.00 42600.00 75847.06 392317.06 9.75 1.38 0.12 2 13.25 45.52 17213.25 404321.64 207014.58 11.875 521 640 6.05 8.225 1.98 0.537 84458.304 44755.5418 33894.5163 -7505.9315 -6542.331 66.60 44.70 273870.00 78150.00 116488.24 468508.24 3.75 2.07 0.21 2 8.03 66.97 24083.93 565706.97 292208.74 11.7
75-100 521 853 6.05 0 1.98 0.537 112567.083 38839.5238 56318.4136 -13419.022 -12455.42 66.60 44.70 273870.00 78150.00 157129.41 509149.41 -1.20 2.75 0.21 2 3.77 84.52 29997.02 704599.45 390460.03 10.75Carbon
offsetting521 1045 6.05 0 1.98 0.537 137904.575 35084.0577 77897.4189 -18589.779 -17626.18 66.60 44.70 273870.00 78150.00 227136.95 579156.95 -5.63 3.37 0.21 2 -0.05 100.19 35167.78 826055.25 441908.30 11.25
TSC + PV + 0.08 - 0.11
TSC + PV + 0.07 - 0.10
Retail shed- sales -London
TSC + PV + 2010 notional building fabric
TSC + PV + 0.17 - 0.24
TSC + PV + 0.15 - 0.21
TSC + PV + 0.13 - 0.19
TSC + PV + 0.12 - 0.17
TSC + PV + 0.11 - 0.15
PV (current FiT)+Insulation+TSC

201
Table B. 8 Retail shed – PV (future FiT) + improving the building fabric U-value down to 0.07-0.1 W/m2.K (mineral wool) +TSC
provided Elec. & heating
TSC area m2
PV area m2
Heating (KWh/m2)
Lighting (KWh/m2)
Hot water (KWh/m2)
TSC fan power
(KWh/m2)
generated Elec by PV
(KWh)
purchased from grid
elec (KWh)
Exported Elec
(KWh)Elec cost £
Energy cost Inc FIT
£
Wall Insulation price £/m2
Roof Insulation price £/m2
Total Insulation
price £TSC cost £ PV Cost £
Fabric cost £
Operational CO2
(kgCO2/m2.yr)
PV ECO2
(kgCO2/m2.yr)
TSC ECO2
(kgCO2/m2.yr)
Insulation ECO2
(kgCO2/m2.yr)
Total CO2
(kgCO2/m2.yr)CO2
saving %
Energy saving (A)
£
PV(A) £
NPV £
Payback period (years)
0 0 0 32.9 31.8 1.98 0 0 0 0 13356 17541.6 43.70 35.00 195010.00 0.00 0.00 195010.00 23.52 0.00 0.00 0.80 24.32 0.00 0.00 0.00 0.00 025% 130 213 24.675 24.675 1.98 0.1645 28108.779 68675.2667 1695.68 9538.2317 12736.832 43.70 35.00 195010.00 19500.00 35205.88 249715.88 17.02 0.69 0.05 0.80 18.56 23.66 4804.77 112859.10 58153.22 11.7550% 345 427 16.45 16.45 1.98 0.329 56349.525 53315.7105 14577.04 6808.2326 9019.8326 43.70 35.00 195010.00 51750.00 75847.06 322607.06 10.56 1.38 0.14 0.80 12.88 47.04 8521.77 200167.62 72570.56 15.675% 595 640 8.225 8.225 1.98 0.4935 84458.304 44755.5418 33894.52 4740.5226 5965.1226 43.70 35.00 195010.00 89250.00 116488.24 400748.24 4.16 2.07 0.24 0.80 7.27 70.12 11576.48 271919.64 66181.41 18.6
75-100 595 853 8.225 0 1.98 0.4935 112567.08 38839.5238 56318.41 2903.2047 4127.8047 43.70 35.00 195010.00 89250.00 157129.41 441389.41 -0.80 2.75 0.24 0.80 3.00 87.67 13413.80 315076.36 68696.95 19.2575-100 (2) 595 853 8.225 0 1.98 0.4935 112567.08 38839.5238 56318.41 -194.308 1030.292 43.70 35.00 195010.00 89250.00 157129.41 441389.41 -0.80 2.75 0.24 0.80 3.00 87.67 16511.31 387833.78 141454.37
Carbon offsetting
595 1003 8.225 0 1.98 0.4935 132362 35860.2706 73242.65 1724.5186 2949.1186 43.70 35.00 195010.00 89250.00 218008.00 502268.00 -4.28 3.24 0.24 0.80 0.00 99.99 14592.48 342762.50 35504.50 22.25
Carbon offsetting
595 1003 8.225 0 1.98 0.4935 132362 35860.2706 73242.65 -2303.827 -1079.227 43.70 35.00 195010.00 89250.00 218008.00 502268.00 -4.28 3.24 0.24 0.80 0.00 99.99 18620.83 437384.23 130126.23 17.25
provided Elec. & heating
TSC area m2
PV area m2
Heating (KWh/m2)
Lighting (KWh/m2)
Hot water (KWh/m2)
TSC fan power
(KWh/m2)
generated Elec by PV
(KWh)
purchased from grid
elec (KWh)
Exported Elec
(KWh)Elec cost £
Energy cost Inc FIT
£
Wall Insulation price £/m2
Roof Insulation price £/m2
Total Insulation
price £TSC cost £ PV Cost £
Fabric cost £
Operational CO2
(kgCO2/m2.yr)
PV ECO2
(kgCO2/m2.yr)
TSC ECO2
(kgCO2/m2.yr)
Insulation ECO2
(kgCO2/m2.yr)
Total CO2
(kgCO2/m2.yr)CO2
saving %
Energy saving (A)
£
PV(A) £
NPV £
Payback period (years)
0 0 0 32.9 31.8 1.98 0 0 0 0 13356 17541.6 43.70 35.00 195010.00 0.00 0.00 195010.00 23.52 0.00 0.00 0.80 24.32 0.00 0.00 0.00 0.00 025 115 213 23.92 24.675 1.98 0.1796 28108.779 68675.2667 1695.68 9538.2317 12646.232 44.30 35.70 198280.00 17250.00 35205.88 250735.88 16.88 0.69 0.05 0.88 18.50 23.94 4895.37 114987.21 59261.32 11.7550 315 427 15.95 16.45 1.98 0.339 56349.525 53315.7105 14577.04 6808.2326 8959.8326 44.30 35.70 198280.00 47250.00 75847.06 321377.06 10.47 1.38 0.13 0.88 12.85 47.15 8581.77 201576.96 75209.90 15.375 560 640 7.97 8.225 1.98 0.4986 84458.304 44755.5418 33894.52 4740.5226 5934.5226 44.30 35.70 198280.00 84000.00 116488.24 398768.24 4.11 2.07 0.23 0.88 7.29 70.04 11607.08 272638.40 68880.17 18.4
75-100 560 853 7.97 0 1.98 0.4986 112567.08 38839.5238 56318.41 2903.2047 4097.2047 44.30 35.70 198280.00 84000.00 157129.41 439409.41 -0.84 2.75 0.23 0.88 3.02 87.59 13444.40 315795.13 71395.71 19.175-100 (2) 560 853 7.97 0 1.98 0.4986 112567.08 38839.5238 56318.41 -194.308 999.69198 44.30 35.70 198280.00 84000.00 157129.41 439409.41 -0.84 2.75 0.23 0.88 3.02 87.59 16541.91 388552.54 144153.13
Carbon offsetting
560 1006 7.97 0 1.98 0.4986 132757.9 35804.8269 73482.28 1705.9733 2899.9733 44.30 35.70 198280.00 84000.00 218660.06 500940.06 -4.38 3.25 0.23 0.88 -0.02 100.09 14641.63 343916.87 37986.81 22.1
Carbon offsetting
560 1006 7.97 0 1.98 0.4986 132757.9 35804.8269 73482.28 -2335.552 -1141.552 44.30 35.70 198280.00 84000.00 218660.06 500940.06 -4.38 3.25 0.23 0.88 -0.02 100.09 18683.15 438848.18 132918.11 17.1
provided Elec. & heating
TSC area m2
PV area m2
Heating (KWh/m2)
Lighting (KWh/m2)
Hot water (KWh/m2)
TSC fan power
(KWh/m2)
generated Elec by PV
(KWh)
purchased from grid
elec (KWh)
Exported Elec
(KWh)Elec cost £
Energy cost Inc FIT
£
Wall Insulation price £/m2
Roof Insulation price £/m2
Total Insulation
price £TSC cost £ PV Cost £
Fabric cost £
Operational CO2
(kgCO2/m2.yr)
PV ECO2
(kgCO2/m2.yr)
TSC ECO2
(kgCO2/m2.yr)
Insulation ECO2
(kgCO2/m2.yr)
Total CO2
(kgCO2/m2.yr)CO2
saving %
Energy saving (A)
£
PV(A) £
NPV £
Payback period (years)
0 0 0 32.9 31.8 1.98 0 0 0 0 13356 17541.6 43.70 35.00 195010.00 0.00 0.00 195010.00 23.52 0.00 0.00 0.80 24.32 0.00 0.00 0.00 0.00 025 113 213 22.6 24.675 1.98 0.206 28108.779 68675.2667 1695.68 9538.2317 12487.832 45.00 36.40 201780.00 16950.00 35205.88 253935.88 16.64 0.69 0.05 0.96 18.33 24.62 5053.77 118707.86 59781.98 1250 305 427 15.21 16.45 1.98 0.3538 56349.525 53315.7105 14577.04 6808.2326 8871.0326 45.00 36.40 201780.00 45750.00 75847.06 323377.06 10.33 1.38 0.13 0.96 12.79 47.40 8670.57 203662.78 75295.72 15.475 551 640 7.55 8.225 1.98 0.507 84458.304 44755.5418 33894.52 4740.5226 5884.1226 45.00 36.40 201780.00 82650.00 116488.24 400918.24 4.03 2.07 0.23 0.96 7.28 70.05 11657.48 273822.25 67914.01 18.5
75-100 551 853 7.55 0 1.98 0.507 112567.08 38839.5238 56318.41 2903.2047 4046.8047 45.00 36.40 201780.00 82650.00 157129.41 441559.41 -0.92 2.75 0.23 0.96 3.02 87.60 13494.80 316978.97 70429.56 19.275-100 (2) 551 853 7.55 0 1.98 0.507 112567.08 38839.5238 56318.41 -194.308 949.29198 45.00 36.40 201780.00 82650.00 157129.41 441559.41 -0.92 2.75 0.23 0.96 3.02 87.60 16592.31 389736.38 143186.97
Carbon offsetting
551 1006 7.55 0 1.98 0.507 132757.9 35804.8269 73482.28 1705.9733 2849.5733 45.00 36.40 201780.00 82650.00 218660.06 503090.06 -4.45 3.25 0.23 0.96 -0.02 100.09 14692.03 345100.72 37020.65 22.15
Carbon offsetting
551 1006 7.55 0 1.98 0.507 132757.9 35804.8269 73482.28 -2335.552 -1191.952 45.00 36.40 201780.00 82650.00 218660.06 503090.06 -4.45 3.25 0.23 0.96 -0.02 100.09 18733.55 440032.02 131951.96 17.2
provided Elec. & heating
TSC area m2
PV area m2
Heating (KWh/m2)
Lighting (KWh/m2)
Hot water (KWh/m2)
TSC fan power
(KWh/m2)
generated Elec by PV
(KWh)
purchased from grid
elec (KWh)
Exported Elec
(KWh)Elec cost £
Energy cost Inc FIT
£
Wall Insulation price £/m2
Roof Insulation price £/m2
Total Insulation
price £TSC cost £ PV Cost £
Fabric cost £
Operational CO2
(kgCO2/m2.yr)
PV ECO2
(kgCO2/m2.yr)
TSC ECO2
(kgCO2/m2.yr)
Insulation ECO2
(kgCO2/m2.yr)
Total CO2
(kgCO2/m2.yr)CO2
saving %
Energy saving (A)
£
PV(A) £
NPV £
Payback period (years)
0 0 0 32.9 31.8 1.98 0 0 0 0 13356 17541.6 43.70 35.00 195010.00 0.00 0.00 195010.00 23.52 0.00 0.00 0.80 24.32 0.00 0.00 0.00 0.00 025 112 213 21.72 24.675 1.98 0.2236 28108.779 68675.2667 1695.68 9538.2317 12382.232 48.60 37.00 211680.00 16800.00 35205.88 263685.88 16.47 0.69 0.05 1.12 18.33 24.63 5159.37 121188.30 52512.41 13.7550 295 427 14.18 16.45 1.98 0.3744 56349.525 53315.7105 14577.04 6808.2326 8747.4326 48.60 37.00 211680.00 44250.00 75847.06 331777.06 10.14 1.38 0.12 1.12 12.76 47.54 8794.17 206566.02 69798.96 16.2575 542 640 7.24 8.225 1.98 0.5132 84458.304 44755.5418 33894.52 4740.5226 5846.9226 48.60 37.00 211680.00 81300.00 116488.24 409468.24 3.98 2.07 0.22 1.12 7.38 69.64 11694.68 274696.04 60237.80 19.25
75-100 542 853 7.24 0 1.98 0.5132 112567.08 38839.5238 56318.41 2903.2047 4009.6047 48.60 37.00 211680.00 81300.00 157129.41 450109.41 -0.98 2.75 0.22 1.12 3.11 87.19 13532.00 317852.76 62753.35 19.875-100 (2) 542 853 7.24 0 1.98 0.5132 112567.08 38839.5238 56318.41 -194.308 912.09198 48.60 37.00 211680.00 81300.00 157129.41 450109.41 -0.98 2.75 0.22 1.12 3.11 87.19 16629.51 390610.17 135510.76
Carbon offsetting
542 1012 7.24 0 1.98 0.5132 133549.69 35693.9393 74161.53 1659.8827 2766.2827 48.60 37.00 211680.00 81300.00 219964.20 512944.20 -4.65 3.27 0.22 1.12 -0.04 100.18 14775.32 347057.13 29122.93 22.75
Carbon offsetting
542 1012 7.24 0 1.98 0.5132 133549.69 35693.9393 74161.53 -2419.001 -1312.601 48.60 37.00 211680.00 81300.00 219964.20 512944.20 -4.65 3.27 0.22 1.12 -0.04 100.18 18854.20 442865.95 124931.75 17.65
provided Elec. & heating
TSC area m2
PV area m2
Heating (KWh/m2)
Lighting (KWh/m2)
Hot water (KWh/m2)
TSC fan power
(KWh/m2)
generated Elec by PV
(KWh)
purchased from grid
elec (KWh)
Exported Elec
(KWh)Elec cost £
Energy cost Inc FIT
£
Wall Insulation price £/m2
Roof Insulation price £/m2
Total Insulation
price £TSC cost £ PV Cost £
Fabric cost £
Operational CO2
(kgCO2/m2.yr)
PV ECO2
(kgCO2/m2.yr)
TSC ECO2
(kgCO2/m2.yr)
Insulation ECO2
(kgCO2/m2.yr)
Total CO2
(kgCO2/m2.yr)CO2
saving %
Energy saving (A)
£
PV(A) £
NPV £
Payback period (years)
0 0 0 32.9 31.8 1.98 0 0 0 0 13356 17541.6 43.70 35.00 195010.00 0.00 0.00 195010.00 23.52 0.00 0.00 0.80 24.32 0.00 0.00 0.00 0.00 025 109 213 21 24.675 1.98 0.238 28108.779 68675.2667 1695.68 9538.2317 12295.832 50.40 38.40 219600.00 16350.00 35205.88 271155.88 16.34 0.69 0.04 1.2 18.27 24.86 5245.77 123217.74 47071.86 15.150 292 427 14 16.45 1.98 0.378 56349.525 53315.7105 14577.04 6808.2326 8725.8326 50.40 38.40 219600.00 43800.00 75847.06 339247.06 10.10 1.38 0.12 1.2 12.80 47.36 8815.77 207073.38 62836.32 17.175 535 640 7 8.225 1.98 0.518 84458.304 44755.5418 33894.52 4740.5226 5818.1226 50.40 38.40 219600.00 80250.00 116488.24 416338.24 3.93 2.07 0.22 1.2 7.42 69.51 11723.48 275372.52 54044.29 19.85
75-100 535 853 7 0 1.98 0.518 112567.08 38839.5238 56318.41 2903.2047 3980.8047 50.40 38.40 219600.00 80250.00 157129.41 456979.41 -1.02 2.75 0.22 1.2 3.15 87.06 13560.80 318529.24 56559.83 20.3575-100 (2) 535 853 7 0 1.98 0.518 112567.08 38839.5238 56318.41 -194.308 883.29198 50.40 38.40 219600.00 80250.00 157129.41 456979.41 -1.02 2.75 0.22 1.2 3.15 87.06 16658.31 391286.66 129317.25
Carbon offsetting
535 1015 7 0 1.98 0.518 133945.59 35638.4955 74501.16 1636.8373 2714.4373 50.40 38.40 219600.00 80250.00 220616.27 520466.27 -4.76 3.28 0.22 1.2 -0.07 100.29 14827.16 348274.92 22818.65 23.25
Carbon offsetting
535 1015 7 0 1.98 0.518 133945.59 35638.4955 74501.16 -2460.726 -1383.126 50.40 38.40 219600.00 80250.00 220616.27 520466.27 -4.76 3.28 0.22 1.2 -0.07 100.29 18924.73 444522.51 119066.24 18
provided Elec. & heating
TSC area m2
PV area m2
Heating (KWh/m2)
Lighting (KWh/m2)
Hot water (KWh/m2)
TSC fan power
(KWh/m2)
generated Elec by PV
(KWh)
purchased from grid
elec (KWh)
Exported Elec
(KWh)Elec cost £
Energy cost Inc FIT
£
Wall Insulation price £/m2
Roof Insulation price £/m2
Total Insulation
price £TSC cost £ PV Cost £
Fabric cost £
Operational CO2
(kgCO2/m2.yr)
PV ECO2
(kgCO2/m2.yr)
TSC ECO2
(kgCO2/m2.yr)
Insulation ECO2
(kgCO2/m2.yr)
Total CO2
(kgCO2/m2.yr)CO2
saving %
Energy saving (A)
£
PV(A) £
NPV £
Payback period (years)
0 0 0 32.9 31.8 1.98 0 0 0 0 13356 17541.6 43.70 35.00 195010.00 0.00 0.00 195010.00 23.52 0.00 0.00 0.80 24.32 0.00 0.00 0.00 0.00 025 107 213 20.2 24.675 1.98 0.254 28108.779 68675.2667 1695.68 9538.2317 12199.832 52.20 39.00 225360.00 16050.00 35205.88 276615.88 16.19 0.69 0.04 1.3 18.22 25.06 5341.77 125472.69 43866.80 1650 288 427 13.52 16.45 1.98 0.3876 56349.525 53315.7105 14577.04 6808.2326 8668.2326 52.20 39.00 225360.00 43200.00 75847.06 344407.06 10.02 1.38 0.12 1.3 12.81 47.32 8873.37 208426.35 59029.29 17.6575 527 640 6.76 8.225 1.98 0.5228 84458.304 44755.5418 33894.52 4740.5226 5789.3226 52.20 39.00 225360.00 79050.00 116488.24 420898.24 3.89 2.07 0.22 1.3 7.47 69.29 11752.28 276049.00 50160.77 20.25
75-100 527 853 6.76 0 1.98 0.5228 112567.08 38839.5238 56318.41 2903.2047 3952.0047 52.20 39.00 225360.00 79050.00 157129.41 461539.41 -1.07 2.75 0.22 1.3 3.20 86.84 13589.60 319205.73 52676.31 20.775-100 (2) 527 853 6.76 0 1.98 0.5228 112567.08 38839.5238 56318.41 -194.308 854.49198 52.20 39.00 225360.00 79050.00 157129.41 461539.41 -1.07 2.75 0.22 1.3 3.20 86.84 16687.11 391963.14 125433.73
Carbon offsetting
527 1017 6.76 0 1.98 0.5228 134341.49 35583.0517 74740.78 1618.292 2667.092 52.20 39.00 225360.00 79050.00 221268.34 525678.34 -4.86 3.28 0.22 1.3 -0.06 100.26 14874.51 349387.01 18718.68 23.55
Carbon offsetting
527 1017 6.76 0 1.98 0.5228 134341.49 35583.0517 74740.78 -2492.451 -1443.651 52.20 39.00 225360.00 79050.00 221268.34 525678.34 -4.86 3.28 0.22 1.3 -0.06 100.26 18985.25 445944.17 115275.84 18.25
provided Elec. & heating
TSC area m2
PV area m2
Heating (KWh/m2)
Lighting (KWh/m2)
Hot water (KWh/m2)
TSC fan power
(KWh/m2)
generated Elec by PV
(KWh)
purchased from grid
elec (KWh)
Exported Elec
(KWh)Elec cost £
Energy cost Inc FIT
£
Wall Insulation price £/m2
Roof Insulation price £/m2
Total Insulation
price £TSC cost £ PV Cost £
Fabric cost £
Operational CO2
(kgCO2/m2.yr)
PV ECO2
(kgCO2/m2.yr)
TSC ECO2
(kgCO2/m2.yr)
Insulation ECO2
(kgCO2/m2.yr)
Total CO2
(kgCO2/m2.yr)CO2
saving %
Energy saving (A)
£
PV(A) £
NPV £
Payback period (years)
0 0 0 32.9 31.8 1.98 0 0 0 0 13356 17541.6 43.70 35.00 195010.00 0.00 0.00 195010.00 23.52 0.00 0.00 0.80 24.32 0.00 0.00 0.00 0.00 025 106 213 18.6 24.675 1.98 0.286 28108.779 68675.2667 1695.68 9538.2317 12007.832 63.00 43.00 261000.00 15900.00 35205.88 312105.88 15.90 0.69 0.04 1.84 18.47 24.06 5533.77 129982.57 12886.69 22.550 286 427 12.4 16.45 1.98 0.41 56349.525 53315.7105 14577.04 6808.2326 8533.8326 63.00 43.00 261000.00 42900.00 75847.06 379747.06 9.81 1.38 0.12 1.84 13.14 45.96 9007.77 211583.26 26846.21 21.6575 524 640 6.2 8.225 1.98 0.534 84458.304 44755.5418 33894.52 4740.5226 5722.1226 63.00 43.00 261000.00 78600.00 116488.24 456088.24 3.78 2.07 0.21 1.84 7.90 67.50 11819.48 277627.46 16549.23 23.45
75-100 524 853 6.2 0 1.98 0.534 112567.08 38839.5238 56318.41 2903.2047 3884.8047 63.00 43.00 261000.00 78600.00 157129.41 496729.41 -1.17 2.75 0.21 1.84 3.63 85.06 13656.80 320784.19 19064.77 23.4575-100 (2) 524 853 6.2 0 1.98 0.534 112567.08 38839.5238 56318.41 -194.308 787.29198 63.00 43.00 261000.00 78600.00 157129.41 496729.41 -1.17 2.75 0.21 1.84 3.63 85.06 16754.31 393541.60 91822.19
Carbon offsetting
524 1037 6.2 0 1.98 0.534 136848.85 35231.9078 76991.75 1467.8384 2449.4384 63.00 43.00 261000.00 78600.00 225398.10 564998.10 -5.42 3.35 0.21 1.84 -0.02 100.07 15092.16 354499.48 -15488.62 26.15
Carbon offsetting
524 1037 6.2 0 1.98 0.534 136848.85 35231.9078 76991.75 -2766.708 -1785.108 63.00 43.00 261000.00 78600.00 225398.10 564998.10 -5.42 3.35 0.21 1.84 -0.02 100.07 19326.71 453964.65 83976.55 20.15
provided Elec. & heating
TSC area m2
PV area m2
Heating (KWh/m2)
Lighting (KWh/m2)
Hot water (KWh/m2)
TSC fan power
(KWh/m2)
generated Elec by PV
(KWh)
purchased from grid
elec (KWh)
Exported Elec
(KWh)Elec cost £
Energy cost Inc FIT
£
Wall Insulation price £/m2
Roof Insulation price £/m2
Total Insulation
price £TSC cost £ PV Cost £
Fabric cost £
Operational CO2
(kgCO2/m2.yr)
PV ECO2
(kgCO2/m2.yr)
TSC ECO2
(kgCO2/m2.yr)
Insulation ECO2
(kgCO2/m2.yr)
Total CO2
(kgCO2/m2.yr)CO2
saving %
Energy saving (A)
£
PV(A) £
NPV £
Payback period (years)
0 0 0 32.9 31.8 1.98 0 0 0 0 13356 17541.6 43.70 35.00 195010.00 0.00 0.00 195010.00 23.52 0.00 0.00 0.80 24.32 0.00 0.00 0.00 0.00 025 105 213 18.17 24.675 1.98 0.2946 28108.779 68675.2667 1695.68 9538.2317 11956.232 66.60 44.70 273870.00 15750.00 35205.88 324825.88 15.82 0.69 0.04 2 18.55 23.73 5585.37 131194.60 1378.72 24.750 284 427 12.11 16.45 1.98 0.4158 56349.525 53315.7105 14577.04 6808.2326 8499.0326 66.60 44.70 273870.00 42600.00 75847.06 392317.06 9.75 1.38 0.12 2 13.25 45.52 9042.57 212400.68 15093.62 23.1575 521 640 6.05 8.225 1.98 0.537 84458.304 44755.5418 33894.52 4740.5226 5704.1226 66.60 44.70 273870.00 78150.00 116488.24 468508.24 3.75 2.07 0.21 2 8.03 66.97 11837.48 278050.26 4552.03 24.55
75-100 521 853 6.05 0 1.98 0.537 112567.08 38839.5238 56318.41 2903.2047 3866.8047 66.60 44.70 273870.00 78150.00 157129.41 509149.41 -1.20 2.75 0.21 2 3.77 84.52 13674.80 321206.99 7067.58 24.475-100 (2) 521 853 6.05 0 1.98 0.537 112567.08 38839.5238 56318.41 -194.308 769.29198 66.60 44.70 273870.00 78150.00 157129.41 509149.41 -1.20 2.75 0.21 2 3.77 84.52 16772.31 393964.40 79824.99
Carbon offsetting
521 1045 6.05 0 1.98 0.537 137904.57 35084.0577 77897.42 1406.3842 2369.9842 66.60 44.70 273870.00 78150.00 227136.95 579156.95 -5.63 3.37 0.21 2 -0.05 100.19 15171.62 356365.77 -27781.17 27.1
Carbon offsetting
521 1045 6.05 0 1.98 0.537 137904.57 35084.0577 77897.42 -2877.974 -1914.374 66.60 44.70 273870.00 78150.00 227136.95 579156.95 -5.63 3.37 0.21 2 -0.05 100.19 19455.97 457000.97 72854.03 20.8
TSC + PV + 0.08 - 0.11
TSC + PV + 0.07 - 0.10
Retail shed -London
TSC + PV + 2010 notional building fabric
TSC + PV + 0.17 - 0.24
TSC + PV + 0.15 - 0.21
TSC + PV + 0.13 - 0.19
TSC + PV + 0.12 - 0.17
TSC + PV + 0.11 - 0.15
PV (future FiT)+Insulation+TSC

202
Table B. 9 Office - PV (curren FiT) + improving the building fabric U-value down to 0.07-0.1 W/m2.K (mineral wool) – not taking into account the rental loss/gain
provided Elec. by PV
PV area m2
Heating (KWh/m2)
Lighting (KWh/m2)
Hot water (KWh/m2)
generated Elec by PV
(KWh)
purchased from grid
elec (KWh)
Exported Elec
(KWh)
Elec Cost £
Energy cost Inc FIT
Wall Insulation price £/m2
Roof Insulation price £/m2
Total Insulation
price £
PV cost £
Fabric cost £
Operational CO2
(kgCO2/m2.yr)
PV ECO2
(kgCO2/m2.yr)
Insulation ECO2
(kgCO2/m2.yr)
Total CO2
(kgCO2/m2.yr)CO2 saving
%
Energy saving (A)
£
PV(A) £
NPV £
Payback period (years)
0 0 18.73 32.85 3.51 0 0 0 11957.4 14270.36 43.70 35.00 97931.40 0.00 97931.40 21.59 0.00 0.44 22.03 0.00 0.00 0.00 0.00 025% 190 18.73 24.6375 3.51 25073.559 60344.37639 0 4812.547 7125.50664 43.70 35.00 97931.40 35168.82 133100.22 16.53 0.71 0.44 17.68 19.75 7144.85 167825.31 132656.49 550% 382 18.73 16.425 3.51 50411.0502 41744.91709 6740.097 -1768.62 544.341737 43.70 35.00 97931.40 70337.65 168269.05 11.42 1.42 0.44 13.28 39.71 13726.02 322410.16 252072.52 5.275% 573 18.73 8.2125 3.51 75616.5753 31431.65212 21630.29 -7537.34 -5224.3753 43.70 35.00 97931.40 105506.47 203437.87 6.34 2.13 0.44 8.91 59.57 19494.74 457911.44 352404.97 5.5100% 764 18.73 0 3.51 100822.1004 25097.89092 40453.35 -12925.9 -10612.941 43.70 35.00 97931.40 140675.29 238606.69 1.26 2.84 0.44 4.54 79.38 24883.30 584483.34 443808.05 5.75
Carbon offsetting 964 18.73 0 3.51 127215.3204 20513.36376 62294.1 -18377.6 -16064.625 43.70 35.00 97931.40 209531.12 307462.52 -4.07 3.59 0.44 -0.04 100.20 30334.99 712537.85 503006.73 7
provided Elec. by PV
PV area m2
Heating (KWh/m2)
Lighting (KWh/m2)
Hot water (KWh/m2)
generated Elec by PV
(KWh)
purchased from grid
elec (KWh)
Exported Elec
(KWh)
Elec Cost £
Energy cost Inc FIT
Wall Insulation price £/m2
Roof Insulation price £/m2
Total Insulation
price £
PV cost £
Fabric cost £
Operational CO2
(kgCO2/m2.yr)
PV ECO2
(kgCO2/m2.yr)
Insulation ECO2
(kgCO2/m2.yr)
Total CO2
(kgCO2/m2.yr)CO2 saving
%
Energy saving (A)
£
PV(A) £
NPV £
Payback period (years)
0 0 18.73 32.85 3.51 0 0 0 11957.4 14270.36 43.70 35.00 97931.40 0.00 97931.40 21.59 0.00 0.44 22.03 0.00 0.00 0.00 0.00 025% 190 18.05 24.6375 3.51 25073.559 60344.37639 0 4812.547 7054.78664 44.30 35.70 99418.20 35168.82 134587.02 16.40 0.71 0.48 17.59 20.17 7215.57 169486.46 132830.83 5.1550% 382 18.05 16.425 3.51 50411.0502 41744.91709 6740.097 -1768.62 473.621737 44.30 35.70 99418.20 70337.65 169755.85 11.29 1.42 0.48 13.19 40.13 13796.74 324071.30 252246.86 5.375% 573 18.05 8.2125 3.51 75616.5753 31431.65212 21630.29 -7537.34 -5295.0953 44.30 35.70 99418.20 105506.47 204924.67 6.20 2.13 0.48 8.82 59.98 19565.46 459572.58 352579.31 5.55100% 764 18.05 0 3.51 100822.1004 25097.89092 40453.35 -12925.9 -10683.661 44.30 35.70 99418.20 140675.29 240093.49 1.13 2.84 0.48 4.45 79.79 24954.02 586144.48 443982.39 5.8
Carbon offsetting 960 18.05 0 3.51 126687.456 20588.5376 61840.48 -18270.1 -16027.867 44.30 35.70 99418.20 208661.69 308079.89 -4.10 3.57 0.48 -0.04 100.20 30298.23 711674.45 501525.96 7.1
provided Elec. by PV
PV area m2
Heating (KWh/m2)
Lighting (KWh/m2)
Hot water (KWh/m2)
generated Elec by PV
(KWh)
purchased from grid
elec (KWh)
Exported Elec
(KWh)
Elec Cost £
Energy cost Inc FIT
Wall Insulation price £/m2
Roof Insulation price £/m2
Total Insulation
price £
PV cost £
Fabric cost £
Operational CO2
(kgCO2/m2.yr)
PV ECO2
(kgCO2/m2.yr)
Insulation ECO2
(kgCO2/m2.yr)
Total CO2
(kgCO2/m2.yr)CO2 saving
%
Energy saving (A)
£
PV(A) £
NPV £
Payback period (years)
0 0 18.73 32.85 3.51 0 0 0 11957.4 14270.36 43.70 35.00 97931.40 0.00 97931.40 21.59 0.00 0.44 22.03 0.00 0.00 0.00 0.00 025% 190 17.05 24.6375 3.51 25073.559 60344.37639 0 4812.547 6950.78664 45.00 36.40 101077.20 35168.82 136246.02 16.21 0.71 0.52 17.43 20.88 7319.57 171929.31 133614.69 5.350% 382 17.05 16.425 3.51 50411.0502 41744.91709 6740.097 -1768.62 369.621737 45.00 36.40 101077.20 70337.65 171414.85 11.09 1.42 0.52 13.03 40.84 13900.74 326514.16 253030.71 5.475% 573 17.05 8.2125 3.51 75616.5753 31431.65212 21630.29 -7537.34 -5399.0953 45.00 36.40 101077.20 105506.47 206583.67 6.01 2.13 0.52 8.66 60.69 19669.46 462015.43 353363.16 5.6100% 764 17.05 0 3.51 100822.1004 25097.89092 40453.35 -12925.9 -10787.661 45.00 36.40 101077.20 140675.29 241752.49 0.93 2.84 0.52 4.30 80.50 25058.02 588587.34 444766.24 5.85
Carbon offsetting 954 17.05 0 3.51 125895.6594 20701.29836 61160.05 -18108.9 -15970.651 45.00 36.40 101077.20 207357.56 308434.76 -4.13 3.55 0.52 -0.06 100.28 30241.01 710330.49 499827.14 7.1
provided Elec. by PV
PV area m2
Heating (KWh/m2)
Lighting (KWh/m2)
Hot water (KWh/m2)
generated Elec by PV
(KWh)
purchased from grid
elec (KWh)
Exported Elec
(KWh)
Elec Cost £
Energy cost Inc FIT
Wall Insulation price £/m2
Roof Insulation price £/m2
Total Insulation
price £
PV cost £
Fabric cost £
Operational CO2
(kgCO2/m2.yr)
PV ECO2
(kgCO2/m2.yr)
Insulation ECO2
(kgCO2/m2.yr)
Total CO2
(kgCO2/m2.yr)CO2 saving
%
Energy saving (A)
£
PV(A) £
NPV £
Payback period (years)
0 0 18.73 32.85 3.51 0 0 0 11957.4 14270.36 43.70 35.00 97931.40 0.00 97931.40 21.59 0.00 0.44 22.03 0.00 0.00 0.00 0.00 025% 190 16.49 24.6375 3.51 25073.559 60344.37639 0 4812.547 6892.54664 48.60 37.00 107665.20 35168.82 142834.02 16.10 0.71 0.61 17.41 20.97 7377.81 173297.31 128394.68 6.1550% 382 16.49 16.425 3.51 50411.0502 41744.91709 6740.097 -1768.62 311.381737 48.60 37.00 107665.20 70337.65 178002.85 10.98 1.42 0.61 13.02 40.93 13958.98 327882.16 247810.71 5.8575% 573 16.49 8.2125 3.51 75616.5753 31431.65212 21630.29 -7537.34 -5457.3353 48.60 37.00 107665.20 105506.47 213171.67 5.90 2.13 0.61 8.64 60.78 19727.70 463383.43 348143.16 5.95100% 764 16.49 0 3.51 100822.1004 25097.89092 40453.35 -12925.9 -10845.901 48.60 37.00 107665.20 140675.29 248340.49 0.82 2.84 0.61 4.28 80.59 25116.26 589955.33 439546.24 6.1
Carbon offsetting 952 16.49 0 3.51 125631.7272 20738.88528 60933.24 -18055.2 -15975.152 48.60 37.00 107665.20 206922.84 314588.04 -4.19 3.54 0.61 -0.04 100.16 30245.51 710436.22 493779.58 7.3
provided Elec. by PV
PV area m2
Heating (KWh/m2)
Lighting (KWh/m2)
Hot water (KWh/m2)
generated Elec by PV
(KWh)
purchased from grid
elec (KWh)
Exported Elec
(KWh)
Elec Cost £
Energy cost Inc FIT
Wall Insulation price £/m2
Roof Insulation price £/m2
Total Insulation
price £
PV cost £
Fabric cost £
Operational CO2
(kgCO2/m2.yr)
PV ECO2
(kgCO2/m2.yr)
Insulation ECO2
(kgCO2/m2.yr)
Total CO2
(kgCO2/m2.yr)CO2 saving
%
Energy saving (A)
£
PV(A) £
NPV £
Payback period (years)
0 0 18.73 32.85 3.51 0 0 0 11957.4 14270.36 43.70 35.00 97931.40 0.00 97931.40 21.59 0.00 0.44 22.03 0.00 0.00 0.00 0.00 025% 190 16 24.6375 3.51 25073.559 60344.37639 0 4812.547 6841.58664 50.40 38.40 111672.00 35168.82 146840.82 16.00 0.71 0.65 17.36 21.22 7428.77 174494.31 125584.88 6.7550% 382 16 16.425 3.51 50411.0502 41744.91709 6740.097 -1768.62 260.421737 50.40 38.40 111672.00 70337.65 182009.65 10.89 1.42 0.65 12.96 41.18 14009.94 329079.15 245000.91 6.175% 573 16 8.2125 3.51 75616.5753 31431.65212 21630.29 -7537.34 -5508.2953 50.40 38.40 111672.00 105506.47 217178.47 5.80 2.13 0.65 8.58 61.03 19778.66 464580.43 345333.36 6.15100% 764 16 0 3.51 100822.1004 25097.89092 40453.35 -12925.9 -10896.861 50.40 38.40 111672.00 140675.29 252347.29 0.73 2.84 0.65 4.22 80.85 25167.22 591152.33 436736.44 6.25
Carbon offsetting 949 16 0 3.51 125103.8628 20814.05912 60479.62 -17947.7 -15918.635 50.40 38.40 111672.00 206053.42 317725.42 -4.18 3.53 0.65 0.00 99.98 30188.99 709108.68 489314.66 7.45
provided Elec. by PV
PV area m2
Heating (KWh/m2)
Lighting (KWh/m2)
Hot water (KWh/m2)
generated Elec by PV
(KWh)
purchased from grid
elec (KWh)
Exported Elec
(KWh)
Elec Cost £
Energy cost Inc FIT
Wall Insulation price £/m2
Roof Insulation price £/m2
Total Insulation
price £
PV cost £
Fabric cost £
Operational CO2
(kgCO2/m2.yr)
PV ECO2
(kgCO2/m2.yr)
Insulation ECO2
(kgCO2/m2.yr)
Total CO2
(kgCO2/m2.yr)CO2 saving
%
Energy saving (A)
£
PV(A) £
NPV £
Payback period (years)
0 0 18.73 32.85 3.51 0 0 0 11957.4 14270.36 43.70 35.00 97931.40 0.00 97931.40 21.59 0.00 0.44 22.03 0.00 0.00 0.00 0.00 025% 190 15.52 24.6375 3.51 25073.559 60344.37639 0 4812.547 6791.66664 52.20 39.00 115160.40 35168.82 150329.22 15.91 0.71 0.7 17.31 21.42 7478.69 175666.88 123269.05 7.1550% 382 15.52 16.425 3.51 50411.0502 41744.91709 6740.097 -1768.62 210.501737 52.20 39.00 115160.40 70337.65 185498.05 10.79 1.42 0.7 12.91 41.38 14059.86 330251.72 242685.08 6.3575% 573 15.52 8.2125 3.51 75616.5753 31431.65212 21630.29 -7537.34 -5558.2153 52.20 39.00 115160.40 105506.47 220666.87 5.71 2.13 0.7 8.54 61.23 19828.58 465753.00 343017.53 6.3100% 764 15.52 0 3.51 100822.1004 25097.89092 40453.35 -12925.9 -10946.781 52.20 39.00 115160.40 140675.29 255835.69 0.63 2.84 0.7 4.18 81.05 25217.14 592324.90 434420.61 6.4
Carbon offsetting 946 15.52 0 3.51 124839.9306 20851.64604 60252.81 -17893.9 -15914.816 52.20 39.00 115160.40 205618.71 320779.11 -4.22 3.52 0.7 0.00 99.99 30185.18 709018.98 486171.27 7.55
provided Elec. by PV
PV area m2
Heating (KWh/m2)
Lighting (KWh/m2)
Hot water (KWh/m2)
generated Elec by PV
(KWh)
purchased from grid
elec (KWh)
Exported Elec
(KWh)
Elec Cost £
Energy cost Inc FIT
Wall Insulation price £/m2
Roof Insulation price £/m2
Total Insulation
price £
PV cost £
Fabric cost £
Operational CO2
(kgCO2/m2.yr)
PV ECO2
(kgCO2/m2.yr)
Insulation ECO2
(kgCO2/m2.yr)
Total CO2
(kgCO2/m2.yr)CO2 saving
%
Energy saving (A)
£
PV(A) £
NPV £
Payback period (years)
0 0 18.73 32.85 3.51 0 0 0 11957.4 14270.36 43.70 35.00 97931.40 0.00 97931.40 21.59 0.00 0.44 22.03 0.00 0.00 0.00 0.00 025% 190 15 24.6375 3.51 25073.559 60344.37639 0 4812.547 6737.58664 63.00 43.00 136350.00 35168.82 171518.82 15.80 0.71 1 17.51 20.52 7532.77 176937.16 103349.74 1050% 382 15 16.425 3.51 50411.0502 41744.91709 6740.097 -1768.62 156.421737 63.00 43.00 136350.00 70337.65 206687.65 10.69 1.42 1 13.11 40.48 14113.94 331522.01 222765.76 7.8575% 573 15 8.2125 3.51 75616.5753 31431.65212 21630.29 -7537.34 -5612.2953 63.00 43.00 136350.00 105506.47 241856.47 5.61 2.13 1 8.74 60.34 19882.66 467023.28 323098.21 7.4100% 764 15 0 3.51 100822.1004 25097.89092 40453.35 -12925.9 -11000.861 63.00 43.00 136350.00 140675.29 277025.29 0.53 2.84 1 4.37 80.15 25271.22 593595.19 414501.29 7.25
Carbon offsetting 959 15.52 0 3.51 126555.4899 20614.05106 61750.92 -18243.4 -16264.25 63.00 43.00 136350.00 208444.34 344794.34 -4.57 3.57 1 0.00 100.00 30534.61 717226.84 470363.90 8.25
provided Elec. by PV
PV area m2
Heating (KWh/m2)
Lighting (KWh/m2)
Hot water (KWh/m2)
generated Elec by PV
(KWh)
purchased from grid
elec (KWh)
Exported Elec
(KWh)
Elec Cost £
Energy cost Inc FIT
Wall Insulation price £/m2
Roof Insulation price £/m2
Total Insulation
price £
PV cost £
Fabric cost £
Operational CO2
(kgCO2/m2.yr)
PV ECO2
(kgCO2/m2.yr)
Insulation ECO2
(kgCO2/m2.yr)
Total CO2
(kgCO2/m2.yr)CO2 saving
%
Energy saving (A)
£
PV(A) £
NPV £
Payback period (years)
0 0 18.73 32.85 3.51 0 0 0 11957.4 14270.36 43.70 35.00 97931.40 0.00 97931.40 21.59 0.00 0.44 22.03 0.00 0.00 0.00 0.00 025% 190 14.2 24.6375 3.51 25073.559 60344.37639 0 4812.547 6654.38664 66.60 44.70 143650.80 35168.82 178819.62 15.65 0.71 1.09 17.44 20.82 7615.97 178891.44 98003.22 1150% 382 14.2 16.425 3.51 50411.0502 41744.91709 6740.097 -1768.62 73.2217372 66.60 44.70 143650.80 70337.65 213988.45 10.53 1.42 1.09 13.05 40.79 14197.14 333476.29 217419.24 8.3575% 573 14.2 8.2125 3.51 75616.5753 31431.65212 21630.29 -7537.34 -5695.4953 66.60 44.70 143650.80 105506.47 249157.27 5.45 2.13 1.09 8.67 60.64 19965.86 468977.57 317751.70 7.75100% 764 14.2 0 3.51 100822.1004 25097.89092 40453.35 -12925.9 -11084.061 66.60 44.70 143650.80 140675.29 284326.09 0.37 2.84 1.09 4.31 80.45 25354.42 595549.47 409154.78 7.5
Carbon offsetting 952 14.2 0 3.51 125631.7272 20738.88528 60933.24 -18055.2 -16213.312 66.60 44.70 143650.80 206922.84 350573.64 -4.64 3.54 1.09 0.00 100.02 30483.67 716030.36 463388.11 8.5
PV + 0.08 - 0.11
PV + 0.07 - 0.10
PV + 2010 notional building fabric
Office-London
PV + 0.17 - 0.24
PV + 0.15 - 0.21
PV + 0.13 - 0.19
PV + 0.12 - 0.17
PV + 0.11 - 0.15
PV (current FiT) + Insulation

203
Table B. 10 Office - PV (future FiT) + improving the building fabric U-value down to 0.07-0.1 W/m2.K (mineral wool) – not taking into account the rental loss/gain
provided Elec. by PV
PV area m2
Heating (KWh/m2)
Lighting (KWh/m2)
Hot water (KWh/m2)
generated Elec by PV
(KWh)
purchased from grid
elec (KWh)
Exported Elec
(KWh)Elec Cost £
Energy cost Inc
FIT
Wall Insulation price £/m2
Roof Insulation price £/m2
Total Insulation
price £
PV cost £
Fabric cost £
Operational CO2
(kgCO2/m2.yr)
PV ECO2
(kgCO2/m2.yr)
Insulation ECO2
(kgCO2/m2.yr)
Total CO2
(kgCO2/m2.yr)
CO2 saving %
Energy saving (A)
£
PV(A) £
NPV £
Payback period (years)
0 0 18.73 32.85 3.51 0 0 0 11957.4 14270.36 43.70 35.00 97931.40 0.00 97931.40 21.59 0.00 0.44 22.03 0.00 0.00 0.00 0.00 025% 190 18.73 24.6375 3.51 25073.559 60344.37639 0 8448.2127 10761.173 43.70 35.00 97931.40 35168.82 133100.22 16.53 0.71 0.44 17.68 19.75 3509.19 82427.23 47258.41 10.2550% 382 18.73 16.425 3.51 50411.0502 41744.91709 6740.0973 5540.984 7853.944 43.70 35.00 97931.40 70337.65 168269.05 11.42 1.42 0.44 13.28 39.71 6416.42 150715.06 80377.42 11.2575% 573 18.73 8.2125 3.51 75616.5753 31431.65212 21630.292 3427.0682 5740.0282 43.70 35.00 97931.40 105506.47 203437.87 6.34 2.13 0.44 8.91 59.57 8530.33 200368.79 94862.32 12.75100% 764 18.73 0 3.51 100822.1 25097.89092 40453.352 1693.3039 4006.2639 43.70 35.00 97931.40 140675.29 238606.69 1.26 2.84 0.44 4.54 79.38 10264.10 241093.14 100417.85 14.25100% 764 18.73 0 3.51 100822.1 25097.89092 40453.352 -531.6305 1781.3295 43.70 35.00 97931.40 140675.29 238606.69 1.26 2.84 1.44 5.54 74.84 12489.03 293354.58 152679.29 15.25
Carbon offsetting 964 18.73 0 3.51 127215.32 20513.36376 62294.101 68.636402 2381.5964 43.70 35.00 97931.40 209531.12 307462.52 -4.07 3.59 0.44 -0.04 100.20 11888.76 279254.93 69723.81 18.5Carbon offsetting 964 18.73 0 3.51 127215.32 20513.36376 62294.101 -3357.539 -1044.579 43.70 35.00 97931.40 209531.12 307462.52 -4.07 3.59 0.44 -0.04 100.20 15314.94 359732.29 150201.18 14.15
provided Elec. by PV
PV area m2
Heating (KWh/m2)
Lighting (KWh/m2)
Hot water (KWh/m2)
generated Elec by PV
(KWh)
purchased from grid
elec (KWh)
Exported Elec
(KWh)Elec Cost £
Energy cost Inc
FIT
Wall Insulation price £/m2
Roof Insulation price £/m2
Total Insulation
price £
PV cost £
Fabric cost £
Operational CO2
(kgCO2/m2.yr)
PV ECO2
(kgCO2/m2.yr)
Insulation ECO2
(kgCO2/m2.yr)
Total CO2
(kgCO2/m2.yr)
CO2 saving %
Energy saving (A)
£
PV(A) £
NPV £
Payback period (years)
0 0 18.73 32.85 3.51 0 0 0 11957.4 14270.36 43.70 35.00 97931.40 0.00 97931.40 21.59 0.00 0.44 22.03 0.00 0.00 0.00 0.00 025% 190 18.05 24.6375 3.51 25073.559 60344.37639 0 8448.2127 10690.453 44.30 35.70 99418.20 35168.82 134587.02 16.40 0.71 0.48 17.59 20.17 3579.91 84088.37 47432.75 10.550% 382 18.05 16.425 3.51 50411.0502 41744.91709 6740.0973 5540.984 7783.224 44.30 35.70 99418.20 70337.65 169755.85 11.29 1.42 0.48 13.19 40.13 6487.14 152376.20 80551.76 11.575% 573 18.05 8.2125 3.51 75616.5753 31431.65212 21630.292 3427.0682 5669.3082 44.30 35.70 99418.20 105506.47 204924.67 6.20 2.13 0.48 8.82 59.98 8601.05 202029.93 95036.66 12.85100% 764 18.05 0 3.51 100822.1 25097.89092 40453.352 1693.3039 3935.5439 44.30 35.70 99418.20 140675.29 240093.49 1.13 2.84 0.48 4.45 79.79 10334.82 242754.28 100592.19 14.3100% 764 18.05 0 3.51 100822.1 25097.89092 40453.352 -531.6305 1710.6095 44.30 35.70 99418.20 140675.29 240093.49 1.13 2.84 1.48 5.45 75.25 12559.75 295015.72 152853.63 15.3
Carbon offsetting 960 18.05 0 3.51 126687.456 20588.5376 61840.48 99.573646 2341.8136 44.30 35.70 99418.20 208661.69 308079.89 -4.10 3.57 0.48 -0.04 100.20 11928.55 280189.38 70040.89 18.5Carbon offsetting 960 18.05 0 3.51 126687.456 20588.5376 61840.48 -3301.653 -1059.413 44.30 35.70 99418.20 208661.69 308079.89 -4.10 3.57 0.48 -0.04 100.20 15329.77 360080.72 149932.23 14.25
provided Elec. by PV
PV area m2
Heating (KWh/m2)
Lighting (KWh/m2)
Hot water (KWh/m2)
generated Elec by PV
(KWh)
purchased from grid
elec (KWh)
Exported Elec
(KWh)Elec Cost £
Energy cost Inc
FIT
Wall Insulation price £/m2
Roof Insulation price £/m2
Total Insulation
price £
PV cost £
Fabric cost £
Operational CO2
(kgCO2/m2.yr)
PV ECO2
(kgCO2/m2.yr)
Insulation ECO2
(kgCO2/m2.yr)
Total CO2
(kgCO2/m2.yr)
CO2 saving %
Energy saving (A)
£
PV(A) £
NPV £
Payback period (years)
0 0 18.73 32.85 3.51 0 0 0 11957.4 14270.36 43.70 35.00 97931.40 0.00 97931.40 21.59 0.00 0.44 22.03 0.00 0.00 0.00 0.00 025% 190 17.05 24.6375 3.51 25073.559 60344.37639 0 8448.2127 10586.453 45.00 36.40 101077.20 35168.82 136246.02 16.21 0.71 0.52 17.43 20.88 3683.91 86531.22 48216.60 10.7550% 382 17.05 16.425 3.51 50411.0502 41744.91709 6740.0973 5540.984 7679.224 45.00 36.40 101077.20 70337.65 171414.85 11.09 1.42 0.52 13.03 40.84 6591.14 154819.06 81335.61 11.575% 573 17.05 8.2125 3.51 75616.5753 31431.65212 21630.292 3427.0682 5565.3082 45.00 36.40 101077.20 105506.47 206583.67 6.01 2.13 0.52 8.66 60.69 8705.05 204472.79 95820.51 12.9100% 764 17.05 0 3.51 100822.1 25097.89092 40453.352 1693.3039 3831.5439 45.00 36.40 101077.20 140675.29 241752.49 0.93 2.84 0.52 4.30 80.50 10438.82 245197.14 101376.04 14.3100% 764 17.05 0 3.51 100822.1 25097.89092 40453.352 -531.6305 1606.6095 45.00 36.40 101077.20 140675.29 241752.49 0.93 2.84 1.52 5.30 75.96 12663.75 297458.58 153637.48 15.3
Carbon offsetting 954 17.05 0 3.51 125895.659 20701.29836 61160.05 145.97951 2284.2195 45.00 36.40 101077.20 207357.56 308434.76 -4.13 3.55 0.52 -0.06 100.28 11986.14 281542.21 71038.85 18.4Carbon offsetting 954 17.05 0 3.51 125895.659 20701.29836 61160.05 -3217.823 -1079.583 45.00 36.40 101077.20 207357.56 308434.76 -4.13 3.55 0.52 -0.06 100.28 15349.94 360554.50 150051.15 14.25
provided Elec. by PV
PV area m2
Heating (KWh/m2)
Lighting (KWh/m2)
Hot water (KWh/m2)
generated Elec by PV
(KWh)
purchased from grid
elec (KWh)
Exported Elec
(KWh)Elec Cost £
Energy cost Inc
FIT
Wall Insulation price £/m2
Roof Insulation price £/m2
Total Insulation
price £
PV cost £
Fabric cost £
Operational CO2
(kgCO2/m2.yr)
PV ECO2
(kgCO2/m2.yr)
Insulation ECO2
(kgCO2/m2.yr)
Total CO2
(kgCO2/m2.yr)
CO2 saving %
Energy saving (A)
£
PV(A) £
NPV £
Payback period (years)
0 0 18.73 32.85 3.51 0 0 0 11957.4 14270.36 43.70 35.00 97931.40 0.00 97931.40 21.59 0.00 0.44 22.03 0.00 0.00 0.00 0.00 025% 190 16.49 24.6375 3.51 25073.559 60344.37639 0 8448.2127 10528.213 48.60 37.00 107665.20 35168.82 142834.02 16.10 0.71 0.61 17.41 20.97 3742.15 87899.22 42996.60 12.550% 382 16.49 16.425 3.51 50411.0502 41744.91709 6740.0973 5540.984 7620.984 48.60 37.00 107665.20 70337.65 178002.85 10.98 1.42 0.61 13.02 40.93 6649.38 156187.06 76115.61 12.575% 573 16.49 8.2125 3.51 75616.5753 31431.65212 21630.292 3427.0682 5507.0682 48.60 37.00 107665.20 105506.47 213171.67 5.90 2.13 0.61 8.64 60.78 8763.29 205840.78 90600.51 13.65100% 764 16.49 0 3.51 100822.1 25097.89092 40453.352 1693.3039 3773.3039 48.60 37.00 107665.20 140675.29 248340.49 0.82 2.84 0.61 4.28 80.59 10497.06 246565.14 96156.04 14.85100% 764 16.49 0 3.51 100822.1 25097.89092 40453.352 -531.6305 1548.3695 48.60 37.00 107665.20 140675.29 248340.49 0.82 2.84 1.61 5.28 76.05 12721.99 298826.57 148417.48 15.85
Carbon offsetting 952 16.49 0 3.51 125631.727 20738.88528 60933.24 161.44814 2241.4481 48.60 37.00 107665.20 206922.84 314588.04 -4.19 3.54 0.61 -0.04 100.16 12028.91 282546.87 65890.22 18.9Carbon offsetting 952 16.49 0 3.51 125631.727 20738.88528 60933.24 -3189.88 -1109.88 48.60 37.00 107665.20 206922.84 314588.04 -4.19 3.54 0.61 -0.04 100.16 15380.24 361266.15 144609.50 14.65
provided Elec. by PV
PV area m2
Heating (KWh/m2)
Lighting (KWh/m2)
Hot water (KWh/m2)
generated Elec by PV
(KWh)
purchased from grid
elec (KWh)
Exported Elec
(KWh)Elec Cost £
Energy cost Inc
FIT
Wall Insulation price £/m2
Roof Insulation price £/m2
Total Insulation
price £
PV cost £
Fabric cost £
Operational CO2
(kgCO2/m2.yr)
PV ECO2
(kgCO2/m2.yr)
Insulation ECO2
(kgCO2/m2.yr)
Total CO2
(kgCO2/m2.yr)
CO2 saving %
Energy saving (A)
£
PV(A) £
NPV £
Payback period (years)
0 0 18.73 32.85 3.51 0 0 0 11957.4 14270.36 43.70 35.00 97931.40 0.00 97931.40 21.59 0.00 0.44 22.03 0.00 0.00 0.00 0.00 025% 190 16 24.6375 3.51 25073.559 60344.37639 0 8448.2127 10477.253 50.40 38.40 111672.00 35168.82 146840.82 16.00 0.71 0.65 17.36 21.22 3793.11 89096.22 40186.80 13.2550% 382 16 16.425 3.51 50411.0502 41744.91709 6740.0973 5540.984 7570.024 50.40 38.40 111672.00 70337.65 182009.65 10.89 1.42 0.65 12.96 41.18 6700.34 157384.06 73305.81 1375% 573 16 8.2125 3.51 75616.5753 31431.65212 21630.292 3427.0682 5456.1082 50.40 38.40 111672.00 105506.47 217178.47 5.80 2.13 0.65 8.58 61.03 8814.25 207037.78 87790.71 14100% 764 16 0 3.51 100822.1 25097.89092 40453.352 1693.3039 3722.3439 50.40 38.40 111672.00 140675.29 252347.29 0.73 2.84 0.65 4.22 80.85 10548.02 247762.14 93346.24 15.2100% 764 16 0 3.51 100822.1 25097.89092 40453.352 -531.6305 1497.4095 50.40 38.40 111672.00 140675.29 252347.29 0.73 2.84 1.65 5.22 76.31 12772.95 300023.57 145607.68 16.2
Carbon offsetting 949 16 0 3.51 125103.863 20814.05912 60479.62 192.38538 2221.4254 50.40 38.40 111672.00 206053.42 317725.42 -4.18 3.53 0.65 0.00 99.98 12048.93 283017.18 63223.16 19.15Carbon offsetting 949 16 0 3.51 125103.863 20814.05912 60479.62 -3133.994 -1104.954 50.40 38.40 111672.00 206053.42 317725.42 -4.18 3.53 0.65 0.00 99.98 15375.31 361150.43 141356.41 14.85
provided Elec. by PV
PV area m2
Heating (KWh/m2)
Lighting (KWh/m2)
Hot water (KWh/m2)
generated Elec by PV
(KWh)
purchased from grid
elec (KWh)
Exported Elec
(KWh)Elec Cost £
Energy cost Inc
FIT
Wall Insulation price £/m2
Roof Insulation price £/m2
Total Insulation
price £
PV cost £
Fabric cost £
Operational CO2
(kgCO2/m2.yr)
PV ECO2
(kgCO2/m2.yr)
Insulation ECO2
(kgCO2/m2.yr)
Total CO2
(kgCO2/m2.yr)
CO2 saving %
Energy saving (A)
£
PV(A) £
NPV £
Payback period (years)
0 0 18.73 32.85 3.51 0 0 0 11957.4 14270.36 43.70 35.00 97931.40 0.00 97931.40 21.59 0.00 0.44 22.03 0.00 0.00 0.00 0.00 025% 190 15.52 24.6375 3.51 25073.559 60344.37639 0 8448.2127 10427.333 52.20 39.00 115160.40 35168.82 150329.22 15.91 0.71 0.7 17.31 21.42 3843.03 90268.79 37870.97 14.1550% 382 15.52 16.425 3.51 50411.0502 41744.91709 6740.0973 5540.984 7520.104 52.20 39.00 115160.40 70337.65 185498.05 10.79 1.42 0.7 12.91 41.38 6750.26 158556.63 70989.98 13.575% 573 15.52 8.2125 3.51 75616.5753 31431.65212 21630.292 3427.0682 5406.1882 52.20 39.00 115160.40 105506.47 220666.87 5.71 2.13 0.7 8.54 61.23 8864.17 208210.35 85474.88 14.35100% 764 15.52 0 3.51 100822.1 25097.89092 40453.352 1693.3039 3672.4239 52.20 39.00 115160.40 140675.29 255835.69 0.63 2.84 0.7 4.18 81.05 10597.94 248934.71 91030.41 15.5100% 764 15.52 0 3.51 100822.1 25097.89092 40453.352 -531.6305 1447.4895 52.20 39.00 115160.40 140675.29 255835.69 0.63 2.84 1.7 5.18 76.51 12822.87 301196.14 143291.85 16.5
Carbon offsetting 946 15.52 0 3.51 124839.931 20851.64604 60252.81 207.854 2186.974 52.20 39.00 115160.40 205618.71 320779.11 -4.22 3.52 0.7 0.00 99.99 12083.39 283826.41 60978.70 19.35Carbon offsetting 946 15.52 0 3.51 124839.931 20851.64604 60252.81 -3106.051 -1126.931 52.20 39.00 115160.40 205618.71 320779.11 -4.22 3.52 0.7 0.00 99.99 15397.29 361666.64 138818.93 15
provided Elec. by PV
PV area m2
Heating (KWh/m2)
Lighting (KWh/m2)
Hot water (KWh/m2)
generated Elec by PV
(KWh)
purchased from grid
elec (KWh)
Exported Elec
(KWh)Elec Cost £
Energy cost Inc
FIT
Wall Insulation price £/m2
Roof Insulation price £/m2
Total Insulation
price £
PV cost £
Fabric cost £
Operational CO2
(kgCO2/m2.yr)
PV ECO2
(kgCO2/m2.yr)
Insulation ECO2
(kgCO2/m2.yr)
Total CO2
(kgCO2/m2.yr)
CO2 saving %
Energy saving (A)
£
PV(A) £
NPV £
Payback period (years)
0 0 18.73 32.85 3.51 0 0 0 11957.4 14270.36 43.70 35.00 97931.40 0.00 97931.40 21.59 0.00 0.44 22.03 0.00 0.00 0.00 0.00 025% 190 15 24.6375 3.51 25073.559 60344.37639 0 8448.2127 10373.253 63.00 43.00 136350.00 35168.82 171518.82 15.80 0.71 1 17.51 20.52 3897.11 91539.07 17951.65 19.7550% 382 15 16.425 3.51 50411.0502 41744.91709 6740.0973 5540.984 7466.024 63.00 43.00 136350.00 70337.65 206687.65 10.69 1.42 1 13.11 40.48 6804.34 159826.91 51070.66 16.7575% 573 15 8.2125 3.51 75616.5753 31431.65212 21630.292 3427.0682 5352.1082 63.00 43.00 136350.00 105506.47 241856.47 5.61 2.13 1 8.74 60.34 8918.25 209480.64 65555.57 16.85100% 764 15 0 3.51 100822.1 25097.89092 40453.352 1693.3039 3618.3439 63.00 43.00 136350.00 140675.29 277025.29 0.53 2.84 1 4.37 80.15 10652.02 250204.99 71111.09 17.6100% 764 15 0 3.51 100822.1 25097.89092 40453.352 -531.6305 1393.4095 63.00 43.00 136350.00 140675.29 277025.29 0.53 2.84 2 5.37 75.61 12876.95 302466.43 123372.53 18.6
Carbon offsetting 959 15.52 0 3.51 126555.49 20614.05106 61750.921 107.17569 2086.2957 63.00 43.00 136350.00 208444.34 344794.34 -4.57 3.57 1 0.00 100.00 12184.06 286191.24 39328.30 21.4Carbon offsetting 959 15.52 0 3.51 126555.49 20614.05106 61750.921 -3289.125 -1310.005 63.00 43.00 136350.00 208444.34 344794.34 -4.57 3.57 1 0.00 100.00 15580.36 365966.88 119103.94 16.5
provided Elec. by PV
PV area m2
Heating (KWh/m2)
Lighting (KWh/m2)
Hot water (KWh/m2)
generated Elec by PV
(KWh)
purchased from grid
elec (KWh)
Exported Elec
(KWh)Elec Cost £
Energy cost Inc
FIT
Wall Insulation price £/m2
Roof Insulation price £/m2
Total Insulation
price £
PV cost £
Fabric cost £
Operational CO2
(kgCO2/m2.yr)
PV ECO2
(kgCO2/m2.yr)
Insulation ECO2
(kgCO2/m2.yr)
Total CO2
(kgCO2/m2.yr)
CO2 saving %
Energy saving (A)
£
PV(A) £
NPV £
Payback period (years)
0 0 18.73 32.85 3.51 0 0 0 11957.4 14270.36 43.70 35.00 97931.40 0.00 97931.40 21.59 0.00 0.44 22.03 0.00 0.00 0.00 0.00 025% 190 14.2 24.6375 3.51 25073.559 60344.37639 0 8448.2127 10290.053 66.60 44.70 143650.80 35168.82 178819.62 15.65 0.71 1.09 17.44 20.82 3980.31 93493.36 12605.13 21.550% 382 14.2 16.425 3.51 50411.0502 41744.91709 6740.0973 5540.984 7382.824 66.60 44.70 143650.80 70337.65 213988.45 10.53 1.42 1.09 13.05 40.79 6887.54 161781.19 45724.15 17.6575% 573 14.2 8.2125 3.51 75616.5753 31431.65212 21630.292 3427.0682 5268.9082 66.60 44.70 143650.80 105506.47 249157.27 5.45 2.13 1.09 8.67 60.64 9001.45 211434.92 60209.05 17.55100% 764 14.2 0 3.51 100822.1 25097.89092 40453.352 1693.3039 3535.1439 66.60 44.70 143650.80 140675.29 284326.09 0.37 2.84 1.09 4.31 80.45 10735.22 252159.27 65764.58 18.2100% 764 14.2 0 3.51 100822.1 25097.89092 40453.352 -531.6305 1310.2095 66.60 44.70 143650.80 140675.29 284326.09 0.37 2.84 2.09 5.31 75.91 12960.15 304420.71 118026.02 19.2
Carbon offsetting 952 14.2 0 3.51 125631.727 20738.88528 60933.24 161.44814 2003.2881 66.60 44.70 143650.80 206922.84 350573.64 -4.64 3.54 1.09 0.00 100.02 12267.07 288141.00 35498.76 21.75Carbon offsetting 952 14.2 0 3.51 125631.727 20738.88528 60933.24 -3189.88 -1348.04 66.60 44.70 143650.80 206922.84 350573.64 -4.64 3.54 1.09 0.00 100.02 15618.40 366860.28 114218.04 16.9
PV + 0.07 - 0.10
Office-London
PV + 2010 notional building fabric
PV + 0.17 - 0.24
PV + 0.15 - 0.21
PV + 0.13 - 0.19
PV + 0.12 - 0.17
PV + 0.11 - 0.15
PV + 0.08 - 0.11
PV (future FiT) + Insulation

204
Table B. 11 Office - PV (current FiT) + improving the building fabric U-value down to 0.07-0.1 W/m2.K (mineral wool) + TSC – not taking into account the rental loss/gain
provided Elec. & heating
TSC area m2
PV area m2
Heating (KWh/m2
)
Lighting (KWh/m2)
Hot water (KWh/m2)
TSC fan power
(KWh/m2)
generated Elec by PV
(KWh)
purchased from grid
elec (KWh)
Exported Elec (KWh)
Elec cost £
Energy cost Inc
FIT £
Wall Insulation price £/m2
Roof Insulation price £/m2
Total Insulation
price £
TSC cost £
PV Cost £Fabric cost
£
Operational CO2
(kgCO2/m2.yr)
PV ECO2
(kgCO2/m2.yr)
TSC ECO2
(kgCO2/m2.yr)
Insulation ECO2
(kgCO2/m2.yr)
Total CO2
(kgCO2/m2.yr)CO2 saving
%
Energy saving (A)
£
PV(A) £
NPV £
Payback period (years)
0 0 0 18.73 32.85 3.51 0 0 0 0 11957.4 14270.36 43.70 35.00 97931.40 0.00 0.00 97931.40 21.59 0.00 0.00 0.44 22.03 0.00 0.00 0.00 0.00 025% 75 190 14.04 24.6375 3.51 0.0938 25073.559 60344.3764 0 4812.547 6637.7466 43.70 35.00 97931.40 11250.00 35168.82 144350.22 15.66 0.71 0.04 0.44 16.85 23.53 7632.61 179282.30 132863.48 6.250% 200 382 9.365 16.425 3.51 0.1873 50411.0502 41744.9171 6740.09727 -1768.62 -429.6183 43.70 35.00 97931.40 30000.00 70337.65 198269.05 9.68 1.42 0.09 0.44 11.64 47.17 14699.98 345287.49 244949.84 6.9575% 425 573 4.68 8.2125 3.51 0.281 75616.5753 31431.6521 21630.292 -7537.34 -6685.575 43.70 35.00 97931.40 63750.00 105506.47 267187.87 3.73 2.13 0.20 0.44 6.50 70.48 20955.94 492233.54 322977.07 8.25100% 650 764 0 0 3.51 0.3746 100822.1 25097.8909 40453.3519 -12925.9 -12560.86 43.70 35.00 97931.40 97500.00 140675.29 336106.69 -2.21 2.84 0.31 0.44 1.38 93.76 26831.22 630238.00 392062.70 9.1
Carbon offsetting
650 823 0 0 3.51 0.3746 108608.1 23453.9279 46753.1629 -14568.5 -14203.48 43.70 35.00 97931.40 97500.00 178883.93 374315.33 -3.82 3.06 0.31 0.44 -0.01 100.03 28473.84 668821.38 392437.45 10
provided Elec. & heating
TSC area m2
PV area m2
Heating (KWh/m2
)
Lighting (KWh/m2)
Hot water (KWh/m2)
TSC fan power
(KWh/m2)
generated Elec by PV
(KWh)
purchased from grid
elec (KWh)
Exported Elec (KWh)
Elec cost £
Energy cost Inc
FIT £
Wall Insulation price £/m2
Roof Insulation price £/m2
Total Insulation
price £
TSC cost £
PV Cost £Fabric cost
£
Operational CO2
(kgCO2/m2.yr)
PV ECO2
(kgCO2/m2.yr)
TSC ECO2
(kgCO2/m2.yr)
Insulation ECO2
(kgCO2/m2.yr)
Total CO2
(kgCO2/m2.yr)CO2 saving
%
Energy saving (A)
£
PV(A) £
NPV £
Payback period (years)
0 0 0 18.73 32.85 3.51 0 0 0 0 11957.4 14270.36 43.70 35.00 97931.40 0.00 0.00 97931.40 21.59 0.00 0.00 0.44 22.03 0.00 0.00 0.00 0.00 025% 72 190 13.53 24.6375 3.51 0.104 25073.559 60344.3764 0 4812.547 6584.7066 44.30 35.70 99418.20 10800.00 35168.82 145387.02 15.57 0.71 0.03 0.48 16.79 23.79 7685.65 180528.16 133072.53 6.350% 185 382 9.025 16.425 3.51 0.1941 50411.0502 41744.9171 6740.09727 -1768.62 -464.9783 44.30 35.70 99418.20 27750.00 70337.65 197505.85 9.62 1.42 0.09 0.48 11.61 47.30 14735.34 346118.06 246543.61 6.975% 410 573 4.51 8.2125 3.51 0.2844 75616.5753 31431.6521 21630.292 -7537.34 -6703.255 44.30 35.70 99418.20 61500.00 105506.47 266424.67 3.70 2.13 0.19 0.48 6.51 70.47 20973.62 492648.82 324155.55 8.2100% 630 764 0 0 3.51 0.3746 100822.1 25097.8909 40453.3519 -12925.9 -12560.86 44.30 35.70 99418.20 94500.00 140675.29 334593.49 -2.21 2.84 0.30 0.48 1.41 93.61 26831.22 630238.00 393575.90 9.05
Carbon offsetting
630 825 0 0 3.51 0.3746 108872.033 23407.2466 46970.1049 -14623.1 -14258.04 44.30 35.70 99418.20 94500.00 179318.64 373236.84 -3.87 3.07 0.30 0.48 -0.02 100.09 28528.40 670103.12 394797.68 9.9
provided Elec. & heating
TSC area m2
PV area m2
Heating (KWh/m2
)
Lighting (KWh/m2)
Hot water (KWh/m2)
TSC fan power
(KWh/m2)
generated Elec by PV
(KWh)
purchased from grid
elec (KWh)
Exported Elec (KWh)
Elec cost £
Energy cost Inc
FIT £
Wall Insulation price £/m2
Roof Insulation price £/m2
Total Insulation
price £
TSC cost £
PV Cost £Fabric cost
£
Operational CO2
(kgCO2/m2.yr)
PV ECO2
(kgCO2/m2.yr)
TSC ECO2
(kgCO2/m2.yr)
Insulation ECO2
(kgCO2/m2.yr)
Total CO2
(kgCO2/m2.yr)CO2 saving
%
Energy saving (A)
£
PV(A) £
NPV £
Payback period (years)
0 0 0 18.73 32.85 3.51 0 0 0 0 11957.4 14270.36 43.70 35.00 97931.40 0.00 0.00 97931.40 21.59 0.00 0.00 0.44 22.03 0.00 0.00 0.00 0.00 025% 69 190 12.78 24.6375 3.51 0.119 25073.559 60344.3764 0 4812.547 6506.7066 45.00 36.40 101077.20 10350.00 35168.82 146596.02 15.43 0.71 0.03 0.52 16.69 24.24 7763.65 182360.30 133695.67 6.450% 172 382 8.52 16.425 3.51 0.2042 50411.0502 41744.9171 6740.09727 -1768.62 -517.4983 45.00 36.40 101077.20 25800.00 70337.65 197214.85 9.53 1.42 0.08 0.52 11.55 47.57 14787.86 347351.70 248068.25 6.8575% 400 573 4.26 8.2125 3.51 0.2894 75616.5753 31431.6521 21630.292 -7537.34 -6729.255 45.00 36.40 101077.20 60000.00 105506.47 266583.67 3.65 2.13 0.19 0.52 6.49 70.52 20999.62 493259.53 324607.26 8.2100% 615 764 0 0 3.51 0.3746 100822.1 25097.8909 40453.3519 -12925.9 -12560.86 45.00 36.40 101077.20 92250.00 140675.29 334002.49 -2.21 2.84 0.29 0.52 1.44 93.46 26831.22 630238.00 394166.90 9
Carbon offsetting
615 827 0 0 3.51 0.3746 109135.965 23360.5653 47187.047 -14677.7 -14312.61 45.00 36.40 101077.20 92250.00 179753.35 373080.55 -3.92 3.08 0.29 0.52 -0.03 100.15 28582.97 671384.87 396235.71 9.9
provided Elec. & heating
TSC area m2
PV area m2
Heating (KWh/m2
)
Lighting (KWh/m2)
Hot water (KWh/m2)
TSC fan power
(KWh/m2)
generated Elec by PV
(KWh)
purchased from grid
elec (KWh)
Exported Elec (KWh)
Elec cost £
Energy cost Inc
FIT £
Wall Insulation price £/m2
Roof Insulation price £/m2
Total Insulation
price £
TSC cost £
PV Cost £Fabric cost
£
Operational CO2
(kgCO2/m2.yr)
PV ECO2
(kgCO2/m2.yr)
TSC ECO2
(kgCO2/m2.yr)
Insulation ECO2
(kgCO2/m2.yr)
Total CO2
(kgCO2/m2.yr)CO2 saving
%
Energy saving (A)
£
PV(A) £
NPV £
Payback period (years)
0 0 0 18.73 32.85 3.51 0 0 0 0 11957.4 14270.36 43.70 35.00 97931.40 0.00 0.00 97931.40 21.59 0.00 0.00 0.44 22.03 0.00 0.00 0.00 0.00 025% 66 190 12.36 24.6375 3.51 0.1274 25073.559 60344.3764 0 4812.547 6463.0266 48.60 37.00 107665.20 9900.00 35168.82 152734.02 15.35 0.71 0.03 0.61 16.70 24.19 7807.33 183386.29 128583.67 7.1550% 165 382 8.24 16.425 3.51 0.2098 50411.0502 41744.9171 6740.09727 -1768.62 -546.6183 48.60 37.00 107665.20 24750.00 70337.65 202752.85 9.48 1.42 0.08 0.61 11.59 47.41 14816.98 348035.70 243214.25 7.275% 392 573 4.12 8.2125 3.51 0.2922 75616.5753 31431.6521 21630.292 -7537.34 -6743.815 48.60 37.00 107665.20 58800.00 105506.47 271971.67 3.63 2.13 0.19 0.61 6.56 70.25 21014.18 493601.53 319561.26 8.5100% 605 764 0 0 3.51 0.3746 100822.1 25097.8909 40453.3519 -12925.9 -12560.86 48.60 37.00 107665.20 90750.00 140675.29 339090.49 -2.21 2.84 0.29 0.61 1.53 93.07 26831.22 630238.00 389078.90 9.2
Carbon offsetting
605 830 0 0 3.51 0.3746 109663.829 23267.2027 47420.931 -14777.8 -14412.75 48.60 37.00 107665.20 90750.00 180622.78 379037.98 -3.99 3.09 0.29 0.61 0.00 100.01 28683.11 673736.96 392630.38 10.05
provided Elec. & heating
TSC area m2
PV area m2
Heating (KWh/m2
)
Lighting (KWh/m2)
Hot water (KWh/m2)
TSC fan power
(KWh/m2)
generated Elec by PV
(KWh)
purchased from grid
elec (KWh)
Exported Elec (KWh)
Elec cost £
Energy cost Inc
FIT £
Wall Insulation price £/m2
Roof Insulation price £/m2
Total Insulation
price £
TSC cost £
PV Cost £Fabric cost
£
Operational CO2
(kgCO2/m2.yr)
PV ECO2
(kgCO2/m2.yr)
TSC ECO2
(kgCO2/m2.yr)
Insulation ECO2
(kgCO2/m2.yr)
Total CO2
(kgCO2/m2.yr)CO2 saving
%
Energy saving (A)
£
PV(A) £
NPV £
Payback period (years)
0 0 0 18.73 32.85 3.51 0 0 0 0 11957.4 14270.36 43.70 35.00 97931.40 0.00 0.00 97931.40 21.59 0.00 0.00 0.44 22.03 0.00 0.00 0.00 0.00 025% 63 190 12 24.6375 3.51 0.1346 25073.559 60344.3764 0 4812.547 6425.5866 50.40 38.40 111672.00 9450.00 35168.82 156290.82 15.29 0.71 0.03 0.65 16.67 24.32 7844.77 184265.72 125906.30 7.650% 160 382 8 16.425 3.51 0.2146 50411.0502 41744.9171 6740.09727 -1768.62 -571.5783 50.40 38.40 111672.00 24000.00 70337.65 206009.65 9.43 1.42 0.08 0.65 11.58 47.44 14841.94 348621.99 240543.74 7.4575% 382 573 4 8.2125 3.51 0.2946 75616.5753 31431.6521 21630.292 -7537.34 -6756.295 50.40 38.40 111672.00 57300.00 105506.47 274478.47 3.60 2.13 0.18 0.65 6.57 70.19 21026.66 493894.68 317347.61 8.6100% 595 764 0 0 3.51 0.3746 100822.1 25097.8909 40453.3519 -12925.9 -12560.86 50.40 38.40 111672.00 89250.00 140675.29 341597.29 -2.21 2.84 0.28 0.65 1.56 92.91 26831.22 630238.00 386572.10 9.3
Carbon offsetting
595 832 0 0 3.51 0.3746 109795.795 23243.862 47629.4021 -14809.6 -14444.53 50.40 38.40 111672.00 89250.00 180840.13 381762.13 -4.04 3.10 0.28 0.65 -0.01 100.03 28714.89 674483.53 390652.80 10.15
provided Elec. & heating
TSC area m2
PV area m2
Heating (KWh/m2
)
Lighting (KWh/m2)
Hot water (KWh/m2)
TSC fan power
(KWh/m2)
generated Elec by PV
(KWh)
purchased from grid
elec (KWh)
Exported Elec (KWh)
Elec cost £
Energy cost Inc
FIT £
Wall Insulation price £/m2
Roof Insulation price £/m2
Total Insulation
price £
TSC cost £
PV Cost £Fabric cost
£
Operational CO2
(kgCO2/m2.yr)
PV ECO2
(kgCO2/m2.yr)
TSC ECO2
(kgCO2/m2.yr)
Insulation ECO2
(kgCO2/m2.yr)
Total CO2
(kgCO2/m2.yr)CO2 saving
%
Energy saving (A)
£
PV(A) £
NPV £
Payback period (years)
0 0 0 18.73 32.85 3.51 0 0 0 0 11957.4 14270.36 43.70 35.00 97931.40 0.00 0.00 97931.40 21.59 0.00 0.00 0.44 22.03 0.00 0.00 0.00 0.00 025% 60 190 11.64 24.6375 3.51 0.1418 25073.559 60344.3764 0 4812.547 6388.1466 52.20 39.00 115160.40 9000.00 35168.82 159329.22 15.22 0.71 0.03 0.7 16.66 24.41 7882.21 185145.15 123747.33 850% 156 382 7.76 16.425 3.51 0.2194 50411.0502 41744.9171 6740.09727 -1768.62 -596.5383 52.20 39.00 115160.40 23400.00 70337.65 208898.05 9.39 1.42 0.07 0.7 11.58 47.43 14866.90 349208.27 238241.62 7.6575% 377 573 3.88 8.2125 3.51 0.297 75616.5753 31431.6521 21630.292 -7537.34 -6768.775 52.20 39.00 115160.40 56550.00 105506.47 277216.87 3.58 2.13 0.18 0.7 6.59 70.07 21039.14 494187.82 314902.35 8.75100% 589 764 0 0 3.51 0.3746 100822.1 25097.8909 40453.3519 -12925.9 -12560.86 52.20 39.00 115160.40 88350.00 140675.29 344185.69 -2.21 2.84 0.28 0.7 1.61 92.70 26831.22 630238.00 383983.70 9.4
Carbon offsetting
589 834 0 0 3.51 0.3746 110059.727 23197.1807 47946.3441 -14868.6 -14503.6 52.20 39.00 115160.40 88350.00 181274.85 384785.25 -4.11 3.11 0.28 0.7 -0.03 100.12 28773.96 675870.98 389017.13 10.25
provided Elec. & heating
TSC area m2
PV area m2
Heating (KWh/m2
)
Lighting (KWh/m2)
Hot water (KWh/m2)
TSC fan power
(KWh/m2)
generated Elec by PV
(KWh)
purchased from grid
elec (KWh)
Exported Elec (KWh)
Elec cost £
Energy cost Inc
FIT £
Wall Insulation price £/m2
Roof Insulation price £/m2
Total Insulation
price £
TSC cost £
PV Cost £Fabric cost
£
Operational CO2
(kgCO2/m2.yr)
PV ECO2
(kgCO2/m2.yr)
TSC ECO2
(kgCO2/m2.yr)
Insulation ECO2
(kgCO2/m2.yr)
Total CO2
(kgCO2/m2.yr)CO2 saving
%
Energy saving (A)
£
PV(A) £
NPV £
Payback period (years)
0 0 0 18.73 32.85 3.51 0 0 0 0 11957.4 14270.36 43.70 35.00 97931.40 0.00 0.00 97931.40 21.59 0.00 0.00 0.44 22.03 0.00 0.00 0.00 0.00 025% 57 190 11.25 24.6375 3.51 0.1496 25073.559 60344.3764 0 4812.547 6347.5866 63.00 43.00 136350.00 8550.00 35168.82 180068.82 15.15 0.71 0.03 1 16.88 23.38 7922.77 186097.86 103960.44 10.6550% 153 382 7.5 16.425 3.51 0.2246 50411.0502 41744.9171 6740.09727 -1768.62 -623.5783 63.00 43.00 136350.00 22950.00 70337.65 229637.65 9.34 1.42 0.07 1 11.83 46.29 14893.94 349843.41 218137.17 9.0575% 371 573 3.75 8.2125 3.51 0.2996 75616.5753 31431.6521 21630.292 -7537.34 -6782.295 63.00 43.00 136350.00 55650.00 105506.47 297506.47 3.56 2.13 0.18 1 6.87 68.83 21052.66 494505.39 294930.32 9.75100% 582 764 0 0 3.51 0.3746 100822.1 25097.8909 40453.3519 -12925.9 -12560.86 63.00 43.00 136350.00 87300.00 140675.29 364325.29 -2.21 2.84 0.28 1 1.91 91.35 26831.22 630238.00 363844.10 10.2
Carbon offsetting
582 847 0 0 3.51 0.3746 111775.287 22893.7521 49356.4674 -15223.3 -14858.29 63.00 43.00 136350.00 87300.00 184100.47 407750.47 -4.45 3.15 0.28 1 -0.03 100.12 29128.65 684202.32 374383.25 10.95
provided Elec. & heating
TSC area m2
PV area m2
Heating (KWh/m2
)
Lighting (KWh/m2)
Hot water (KWh/m2)
TSC fan power
(KWh/m2)
generated Elec by PV
(KWh)
purchased from grid
elec (KWh)
Exported Elec (KWh)
Elec cost £
Energy cost Inc
FIT £
Wall Insulation price £/m2
Roof Insulation price £/m2
Total Insulation
price £
TSC cost £
PV Cost £Fabric cost
£
Operational CO2
(kgCO2/m2.yr)
PV ECO2
(kgCO2/m2.yr)
TSC ECO2
(kgCO2/m2.yr)
Insulation ECO2
(kgCO2/m2.yr)
Total CO2
(kgCO2/m2.yr)CO2 saving
%
Energy saving (A)
£
PV(A) £
NPV £
Payback period (years)
0 0 0 18.73 32.85 3.51 0 0 0 0 11957.4 14270.36 43.70 35.00 97931.40 0.00 0.00 97931.40 21.59 0.00 0.00 0.44 22.03 0.00 0.00 0.00 0.00 025% 55 190 10.65 24.6375 3.51 0.1616 25073.559 60344.3764 0 4812.547 6285.1866 66.60 44.70 143650.80 8250.00 35168.82 187069.62 15.04 0.71 0.03 1.09 16.86 23.48 7985.17 187563.57 98425.35 11.5550% 150 382 7.1 16.425 3.51 0.2326 50411.0502 41744.9171 6740.09727 -1768.62 -665.1783 66.60 44.70 143650.80 22500.00 70337.65 236488.45 9.26 1.42 0.07 1.09 11.85 46.23 14935.54 350820.55 212263.51 9.575% 365 573 3.55 8.2125 3.51 0.3036 75616.5753 31431.6521 21630.292 -7537.34 -6803.095 66.60 44.70 143650.80 54750.00 105506.47 303907.27 3.52 2.13 0.17 1.09 6.92 68.61 21073.46 494993.96 289018.09 10.05100% 575 764 0 0 3.51 0.3746 100822.1 25097.8909 40453.3519 -12925.9 -12560.86 66.60 44.70 143650.80 86250.00 140675.29 370576.09 -2.21 2.84 0.27 1.09 1.99 90.96 26831.22 630238.00 357593.30 10.45
Carbon offsetting
575 850 0 0 3.51 0.3746 112039.219 22847.0708 49673.4094 -15282.4 -14917.36 66.60 44.70 143650.80 86250.00 184535.18 414435.98 -4.53 3.16 0.27 1.09 0.00 100.01 29187.72 685589.77 369085.18 11.15
TSC + PV + 0.08 - 0.11
TSC + PV + 0.07 - 0.10
Office-London
TSC + PV + 2010 notional building fabric
TSC + PV + 0.17 - 0.24
TSC + PV + 0.15 - 0.21
TSC + PV + 0.13 - 0.19
TSC + PV + 0.12 - 0.17
TSC + PV + 0.11 - 0.15
PV (current FiT) + Insulation + TSC

205
Table B. 12 Office - PV (future FiT) + improving the building fabric U-value down to 0.07-0.1 W/m2.K (mineral wool) + TSC – not taking into account the rental loss/gain
provided Elec. & heating
TSC area m2
PV area m2
Heating (KWh/m2)
Lighting (KWh/m2)
Hot water (KWh/m2)
TSC fan power
(KWh/m2)
generated Elec by PV
(KWh)
purchased from grid
elec (KWh)
Exported Elec
(KWh)
Elec cost £
Energy cost Inc
FIT £
Wall Insulation price £/m2
Roof Insulation price £/m2
Total Insulation
price £
TSC cost £
PV Cost £Fabric cost
£
Operational CO2
(kgCO2/m2.yr)
PV ECO2
(kgCO2/m2.yr)
TSC ECO2
(kgCO2/m2.yr)
Insulation ECO2
(kgCO2/m2.yr)
Total CO2
(kgCO2/m2.yr)CO2 saving
%
Energy saving (A)
£
PV(A) £
NPV £
Payback period (years)
0 0 0 18.73 32.85 3.51 0 0 0 0 11957.4 14270.36 43.70 35.00 97931.40 0.00 0.00 97931.40 21.59 0.00 0.00 0.44 22.03 0.00 0.00 0.00 0.00 025% 75 190 14.04 24.6375 3.51 0.0938 25073.559 60344.3764 0 8448.213 10273.413 43.70 35.00 97931.40 11250.00 35168.82 144350.22 15.66 0.71 0.04 0.44 16.85 23.53 3996.95 93884.21 47465.39 1250% 200 382 9.365 16.425 3.51 0.1873 50411.0502 41744.9171 6740.0973 5540.984 6879.984 43.70 35.00 97931.40 30000.00 70337.65 198269.05 9.68 1.42 0.09 0.44 11.64 47.17 7390.38 173592.39 73254.74 14.175% 425 573 4.68 8.2125 3.51 0.281 75616.5753 31431.6521 21630.292 3427.068 4278.8282 43.70 35.00 97931.40 63750.00 105506.47 267187.87 3.73 2.13 0.20 0.44 6.50 70.48 9991.53 234690.89 65434.42 17.75100% 650 764 0 0 3.51 0.3746 100822.1 25097.8909 40453.352 1693.304 2058.3439 43.70 35.00 97931.40 97500.00 140675.29 336106.69 -2.21 2.84 0.31 0.44 1.38 93.76 12212.02 286847.80 48672.50 20.55200% 650 764 0 0 4.51 0.3746 100822.1 25097.8909 40453.352 -531.63 -166.5905 43.70 35.00 97931.40 97500.00 140675.29 336106.69 -2.21 2.84 0.31 1.44 2.38 89.22 14436.95 339109.23 100933.94
Carbon offsetting
650 823 0 0 3.51 0.3746 108608.1 23453.9279 46753.163 1179.658 1544.6976 43.70 35.00 97931.40 97500.00 178883.93 374315.33 -3.82 3.06 0.31 0.44 -0.01 100.03 12725.66 298912.83 22528.90 23
Carbon offsetting
650 823 0 0 3.51 0.3746 108608.1 23453.9279 46753.163 -1391.77 -1026.726 43.70 35.00 97931.40 97500.00 178883.93 374315.33 -3.82 3.06 0.31 0.44 -0.01 100.03 15297.09 359312.95 82929.02 18.95
provided Elec. & heating
TSC area m2
PV area m2
Heating (KWh/m2)
Lighting (KWh/m2)
Hot water (KWh/m2)
TSC fan power
(KWh/m2)
generated Elec by PV
(KWh)
purchased from grid
elec (KWh)
Exported Elec
(KWh)
Elec cost £
Energy cost Inc
FIT £
Wall Insulation price £/m2
Roof Insulation price £/m2
Total Insulation
price £
TSC cost £
PV Cost £Fabric cost
£
Operational CO2
(kgCO2/m2.yr)
PV ECO2
(kgCO2/m2.yr)
TSC ECO2
(kgCO2/m2.yr)
Insulation ECO2
(kgCO2/m2.yr)
Total CO2
(kgCO2/m2.yr)CO2 saving
%
Energy saving (A)
£
PV(A) £
NPV £
Payback period (years)
0 0 0 18.73 32.85 3.51 0 0 0 0 11957.4 14270.36 43.70 35.00 97931.40 0.00 0.00 97931.40 21.59 0.00 0.00 0.44 22.03 0.00 0.00 0.00 0.00 025% 72 190 13.53 24.6375 3.51 0.104 25073.559 60344.3764 0 8448.213 10220.373 44.30 35.70 99418.20 10800.00 35168.82 145387.02 15.57 0.71 0.03 0.48 16.79 23.79 4049.99 95130.07 47674.45 12.150% 185 382 9.025 16.425 3.51 0.1941 50411.0502 41744.9171 6740.0973 5540.984 6844.624 44.30 35.70 99418.20 27750.00 70337.65 197505.85 9.62 1.42 0.09 0.48 11.61 47.30 7425.74 174422.96 74848.51 13.975% 410 573 4.51 8.2125 3.51 0.2844 75616.5753 31431.6521 21630.292 3427.068 4261.1482 44.30 35.70 99418.20 61500.00 105506.47 266424.67 3.70 2.13 0.19 0.48 6.51 70.47 10009.21 235106.17 66612.90 17.6100% 630 764 0 0 3.51 0.3746 100822.1 25097.8909 40453.352 1693.304 2058.3439 44.30 35.70 99418.20 94500.00 140675.29 334593.49 -2.21 2.84 0.30 0.48 1.41 93.61 12212.02 286847.80 50185.70 20.4100% 630 764 0 0 3.51 0.3746 100822.1 25097.8909 40453.352 -531.63 -166.5905 44.30 35.70 99418.20 94500.00 140675.29 334593.49 -2.21 2.84 0.30 0.48 1.41 93.61 14436.95 339109.23 102447.14 20.4
Carbon offsetting
630 825 0 0 3.51 0.3746 108872.033 23407.2466 46970.105 1163.36 1528.3998 44.30 35.70 99418.20 94500.00 179318.64 373236.84 -3.87 3.07 0.30 0.48 -0.02 100.09 12741.96 299295.64 23990.20 22.9
Carbon offsetting
630 825 0 0 3.51 0.3746 108872.033 23407.2466 46970.105 -1420 -1054.956 44.30 35.70 99418.20 94500.00 179318.64 373236.84 -3.87 3.07 0.30 0.48 -0.02 100.09 15325.32 359976.03 84670.59 18.85
provided Elec. & heating
TSC area m2
PV area m2
Heating (KWh/m2)
Lighting (KWh/m2)
Hot water (KWh/m2)
TSC fan power
(KWh/m2)
generated Elec by PV
(KWh)
purchased from grid
elec (KWh)
Exported Elec
(KWh)
Elec cost £
Energy cost Inc
FIT £
Wall Insulation price £/m2
Roof Insulation price £/m2
Total Insulation
price £
TSC cost £
PV Cost £Fabric cost
£
Operational CO2
(kgCO2/m2.yr)
PV ECO2
(kgCO2/m2.yr)
TSC ECO2
(kgCO2/m2.yr)
Insulation ECO2
(kgCO2/m2.yr)
Total CO2
(kgCO2/m2.yr)CO2 saving
%
Energy saving (A)
£
PV(A) £
NPV £
Payback period (years)
0 0 0 18.73 32.85 3.51 0 0 0 0 11957.4 14270.36 43.70 35.00 97931.40 0.00 0.00 97931.40 21.59 0.00 0.00 0.44 22.03 0.00 0.00 0.00 0.00 025% 69 190 12.78 24.6375 3.51 0.119 25073.559 60344.3764 0 8448.213 10142.373 45.00 36.40 101077.20 10350.00 35168.82 146596.02 15.43 0.71 0.03 0.52 16.69 24.24 4127.99 96962.21 48297.59 12.1550% 172 382 8.52 16.425 3.51 0.2042 50411.0502 41744.9171 6740.0973 5540.984 6792.104 45.00 36.40 101077.20 25800.00 70337.65 197214.85 9.53 1.42 0.08 0.52 11.55 47.57 7478.26 175656.60 76373.16 13.7575% 400 573 4.26 8.2125 3.51 0.2894 75616.5753 31431.6521 21630.292 3427.068 4235.1482 45.00 36.40 101077.20 60000.00 105506.47 266583.67 3.65 2.13 0.19 0.52 6.49 70.52 10035.21 235716.89 67064.62 17.55100% 615 764 0 0 3.51 0.3746 100822.1 25097.8909 40453.352 1693.304 2058.3439 45.00 36.40 101077.20 92250.00 140675.29 334002.49 -2.21 2.84 0.29 0.52 1.44 93.46 12212.02 286847.80 50776.70 20.35100% 615 764 0 0 3.51 0.3746 100822.1 25097.8909 40453.352 -531.63 -166.5905 45.00 36.40 101077.20 92250.00 140675.29 334002.49 -2.21 2.84 0.29 0.52 1.44 93.46 14436.95 339109.23 103038.14 20.35
Carbon offsetting
615 827 0 0 3.51 0.3746 109135.965 23360.5653 47187.047 1147.062 1512.102 45.00 36.40 101077.20 92250.00 179753.35 373080.55 -3.92 3.08 0.29 0.52 -0.03 100.15 12758.26 299678.46 24529.31 22.85
Carbon offsetting
615 827 0 0 3.51 0.3746 109135.965 23360.5653 47187.047 -1448.23 -1083.186 45.00 36.40 101077.20 92250.00 179753.35 373080.55 -3.92 3.08 0.29 0.52 -0.03 100.15 15353.55 360639.12 85489.96 18.8
provided Elec. & heating
TSC area m2
PV area m2
Heating (KWh/m2)
Lighting (KWh/m2)
Hot water (KWh/m2)
TSC fan power
(KWh/m2)
generated Elec by PV
(KWh)
purchased from grid
elec (KWh)
Exported Elec
(KWh)
Elec cost £
Energy cost Inc
FIT £
Wall Insulation price £/m2
Roof Insulation price £/m2
Total Insulation
price £
TSC cost £
PV Cost £Fabric cost
£
Operational CO2
(kgCO2/m2.yr)
PV ECO2
(kgCO2/m2.yr)
TSC ECO2
(kgCO2/m2.yr)
Insulation ECO2
(kgCO2/m2.yr)
Total CO2
(kgCO2/m2.yr)CO2 saving
%
Energy saving (A)
£
PV(A) £
NPV £
Payback period (years)
0 0 0 18.73 32.85 3.51 0 0 0 0 11957.4 14270.36 43.70 35.00 97931.40 0.00 0.00 97931.40 21.59 0.00 0.00 0.44 22.03 0.00 0.00 0.00 0.00 025% 66 190 12.36 24.6375 3.51 0.1274 25073.559 60344.3764 0 8448.213 10098.693 48.60 37.00 107665.20 9900.00 35168.82 152734.02 15.35 0.71 0.03 0.61 16.70 24.19 4171.67 97988.21 43185.58 13.650% 165 382 8.24 16.425 3.51 0.2098 50411.0502 41744.9171 6740.0973 5540.984 6762.984 48.60 37.00 107665.20 24750.00 70337.65 202752.85 9.48 1.42 0.08 0.61 11.59 47.41 7507.38 176340.60 71519.15 14.575% 392 573 4.12 8.2125 3.51 0.2922 75616.5753 31431.6521 21630.292 3427.068 4220.5882 48.60 37.00 107665.20 58800.00 105506.47 271971.67 3.63 2.13 0.19 0.61 6.56 70.25 10049.77 236058.89 62018.62 18.15100% 605 764 0 0 3.51 0.3746 100822.1 25097.8909 40453.352 1693.304 2058.3439 48.60 37.00 107665.20 90750.00 140675.29 339090.49 -2.21 2.84 0.29 0.61 1.53 93.07 12212.02 286847.80 45688.70 20.8100% 605 764 0 0 3.51 0.3746 100822.1 25097.8909 40453.352 -531.63 -166.5905 48.60 37.00 107665.20 90750.00 140675.29 339090.49 -2.21 2.84 0.29 0.61 1.53 93.07 14436.95 339109.23 97950.14 20.8
Carbon offsetting
605 830 0 0 3.51 0.3746 109663.829 23267.2027 47420.931 1123.466 1488.5065 48.60 37.00 107665.20 90750.00 180622.78 379037.98 -3.99 3.09 0.29 0.61 0.00 100.01 12781.85 300232.70 19126.12 23.3
Carbon offsetting
605 830 0 0 3.51 0.3746 109663.829 23267.2027 47420.931 -1484.68 -1119.645 48.60 37.00 107665.20 90750.00 180622.78 379037.98 -3.99 3.09 0.29 0.61 0.00 100.01 15390.00 361495.51 80388.93 19.2
provided Elec. & heating
TSC area m2
PV area m2
Heating (KWh/m2)
Lighting (KWh/m2)
Hot water (KWh/m2)
TSC fan power
(KWh/m2)
generated Elec by PV
(KWh)
purchased from grid
elec (KWh)
Exported Elec
(KWh)
Elec cost £
Energy cost Inc
FIT £
Wall Insulation price £/m2
Roof Insulation price £/m2
Total Insulation
price £
TSC cost £
PV Cost £Fabric cost
£
Operational CO2
(kgCO2/m2.yr)
PV ECO2
(kgCO2/m2.yr)
TSC ECO2
(kgCO2/m2.yr)
Insulation ECO2
(kgCO2/m2.yr)
Total CO2
(kgCO2/m2.yr)CO2 saving
%
Energy saving (A)
£
PV(A) £
NPV £
Payback period (years)
0 0 0 18.73 32.85 3.51 0 0 0 0 11957.4 14270.36 43.70 35.00 97931.40 0.00 0.00 97931.40 21.59 0.00 0.00 0.44 22.03 0.00 0.00 0.00 0.00 025% 63 190 12 24.6375 3.51 0.1346 25073.559 60344.3764 0 8448.213 10061.253 50.40 38.40 111672.00 9450.00 35168.82 156290.82 15.29 0.71 0.03 0.65 16.67 24.32 4209.11 98867.64 40508.21 14.450% 160 382 8 16.425 3.51 0.2146 50411.0502 41744.9171 6740.0973 5540.984 6738.024 50.40 38.40 111672.00 24000.00 70337.65 206009.65 9.43 1.42 0.08 0.65 11.58 47.44 7532.34 176926.89 68848.64 14.975% 382 573 4 8.2125 3.51 0.2946 75616.5753 31431.6521 21630.292 3427.068 4208.1082 50.40 38.40 111672.00 57300.00 105506.47 274478.47 3.60 2.13 0.18 0.65 6.57 70.19 10062.25 236352.03 59804.96 18.4100% 595 764 0 0 3.51 0.3746 100822.1 25097.8909 40453.352 1693.304 2058.3439 50.40 38.40 111672.00 89250.00 140675.29 341597.29 -2.21 2.84 0.28 0.65 1.56 92.91 12212.02 286847.80 43181.90 21.05100% 595 764 0 0 3.51 0.3746 100822.1 25097.8909 40453.352 -531.63 -166.5905 50.40 38.40 111672.00 89250.00 140675.29 341597.29 -2.21 2.84 0.28 0.65 1.56 92.91 14436.95 339109.23 95443.34 21.05
Carbon offsetting
595 832 0 0 3.51 0.3746 109795.795 23243.862 47629.402 1110.818 1475.8576 50.40 38.40 111672.00 89250.00 180840.13 381762.13 -4.04 3.10 0.28 0.65 -0.01 100.03 12794.50 300529.81 16699.07 23.55
Carbon offsetting
595 832 0 0 3.51 0.3746 109795.795 23243.862 47629.402 -1508.8 -1143.76 50.40 38.40 111672.00 89250.00 180840.13 381762.13 -4.04 3.10 0.28 0.65 -0.01 100.03 15414.12 362061.94 78231.21 19.35
provided Elec. & heating
TSC area m2
PV area m2
Heating (KWh/m2)
Lighting (KWh/m2)
Hot water (KWh/m2)
TSC fan power
(KWh/m2)
generated Elec by PV
(KWh)
purchased from grid
elec (KWh)
Exported Elec
(KWh)
Elec cost £
Energy cost Inc
FIT £
Wall Insulation price £/m2
Roof Insulation price £/m2
Total Insulation
price £
TSC cost £
PV Cost £Fabric cost
£
Operational CO2
(kgCO2/m2.yr)
PV ECO2
(kgCO2/m2.yr)
TSC ECO2
(kgCO2/m2.yr)
Insulation ECO2
(kgCO2/m2.yr)
Total CO2
(kgCO2/m2.yr)CO2 saving
%
Energy saving (A)
£
PV(A) £
NPV £
Payback period (years)
0 0 0 18.73 32.85 3.51 0 0 0 0 11957.4 14270.36 43.70 35.00 97931.40 0.00 0.00 97931.40 21.59 0.00 0.00 0.44 22.03 0.00 0.00 0.00 0.00 025% 60 190 11.64 24.6375 3.51 0.1418 25073.559 60344.3764 0 8448.213 10023.813 52.20 39.00 115160.40 9000.00 35168.82 159329.22 15.22 0.71 0.03 0.7 16.66 24.41 4246.55 99747.06 38349.24 1550% 156 382 7.76 16.425 3.51 0.2194 50411.0502 41744.9171 6740.0973 5540.984 6713.064 52.20 39.00 115160.40 23400.00 70337.65 208898.05 9.39 1.42 0.07 0.7 11.58 47.43 7557.30 177513.17 66546.52 15.375% 377 573 3.88 8.2125 3.51 0.297 75616.5753 31431.6521 21630.292 3427.068 4195.6282 52.20 39.00 115160.40 56550.00 105506.47 277216.87 3.58 2.13 0.18 0.7 6.59 70.07 10074.73 236645.17 57359.70 18.65100% 589 764 0 0 3.51 0.3746 100822.1 25097.8909 40453.352 1693.304 2058.3439 52.20 39.00 115160.40 88350.00 140675.29 344185.69 -2.21 2.84 0.28 0.7 1.61 92.70 12212.02 286847.80 40593.50 21.25100% 589 764 0 0 3.51 0.3746 100822.1 25097.8909 40453.352 -531.63 -166.5905 52.20 39.00 115160.40 88350.00 140675.29 344185.69 -2.21 2.84 0.28 0.7 1.61 92.70 14436.95 339109.23 92854.94 21.25
Carbon offsetting
589 834 0 0 3.51 0.3746 110059.727 23197.1807 47946.344 1090.02 1455.0598 52.20 39.00 115160.40 88350.00 181274.85 384785.25 -4.11 3.11 0.28 0.7 -0.03 100.12 12815.30 301018.32 14164.48 23.75
Carbon offsetting
589 834 0 0 3.51 0.3746 110059.727 23197.1807 47946.344 -1547.03 -1181.989 52.20 39.00 115160.40 88350.00 181274.85 384785.25 -4.11 3.11 0.28 0.7 -0.03 100.12 15452.35 362959.91 76106.07 19.5
provided Elec. & heating
TSC area m2
PV area m2
Heating (KWh/m2)
Lighting (KWh/m2)
Hot water (KWh/m2)
TSC fan power
(KWh/m2)
generated Elec by PV
(KWh)
purchased from grid
elec (KWh)
Exported Elec
(KWh)
Elec cost £
Energy cost Inc
FIT £
Wall Insulation price £/m2
Roof Insulation price £/m2
Total Insulation
price £
TSC cost £
PV Cost £Fabric cost
£
Operational CO2
(kgCO2/m2.yr)
PV ECO2
(kgCO2/m2.yr)
TSC ECO2
(kgCO2/m2.yr)
Insulation ECO2
(kgCO2/m2.yr)
Total CO2
(kgCO2/m2.yr)CO2 saving
%
Energy saving (A)
£
PV(A) £
NPV £
Payback period (years)
0 0 0 18.73 32.85 3.51 0 0 0 0 11957.4 14270.36 43.70 35.00 97931.40 0.00 0.00 97931.40 21.59 0.00 0.00 0.44 22.03 0.00 0.00 0.00 0.00 025% 57 190 11.25 24.6375 3.51 0.1496 25073.559 60344.3764 0 8448.213 9983.2527 63.00 43.00 136350.00 8550.00 35168.82 180068.82 15.15 0.71 0.03 1 16.88 23.38 4287.11 100699.78 18562.35 20.1550% 153 382 7.5 16.425 3.51 0.2246 50411.0502 41744.9171 6740.0973 5540.984 6686.024 63.00 43.00 136350.00 22950.00 70337.65 229637.65 9.34 1.42 0.07 1 11.83 46.29 7584.34 178148.31 46442.07 18.275% 371 573 3.75 8.2125 3.51 0.2996 75616.5753 31431.6521 21630.292 3427.068 4182.1082 63.00 43.00 136350.00 55650.00 105506.47 297506.47 3.56 2.13 0.18 1 6.87 68.83 10088.25 236962.74 37387.67 20.85100% 582 764 0 0 3.51 0.3746 100822.1 25097.8909 40453.352 1693.304 2058.3439 63.00 43.00 136350.00 87300.00 140675.29 364325.29 -2.21 2.84 0.28 1 1.91 91.35 12212.02 286847.80 20453.90 23.15100% 582 764 0 0 3.51 0.3746 100822.1 25097.8909 40453.352 -531.63 -166.5905 63.00 43.00 136350.00 87300.00 140675.29 364325.29 -2.21 2.84 0.28 1 1.91 91.35 14436.95 339109.23 72715.34 23.15
Carbon offsetting
582 847 0 0 3.51 0.3746 111775.287 22893.7521 49356.467 984.0843 1349.1243 63.00 43.00 136350.00 87300.00 184100.47 407750.47 -4.45 3.15 0.28 1 -0.03 100.12 12921.24 303506.64 -6312.43 25.55
Carbon offsetting
582 847 0 0 3.51 0.3746 111775.287 22893.7521 49356.467 -1730.52 -1365.481 63.00 43.00 136350.00 87300.00 184100.47 407750.47 -4.45 3.15 0.28 1 -0.03 100.12 15635.84 367269.96 57450.89 20.9
provided Elec. & heating
TSC area m2
PV area m2
Heating (KWh/m2)
Lighting (KWh/m2)
Hot water (KWh/m2)
TSC fan power
(KWh/m2)
generated Elec by PV
(KWh)
purchased from grid
elec (KWh)
Exported Elec
(KWh)
Elec cost £
Energy cost Inc
FIT £
Wall Insulation price £/m2
Roof Insulation price £/m2
Total Insulation
price £
TSC cost £
PV Cost £Fabric cost
£
Operational CO2
(kgCO2/m2.yr)
PV ECO2
(kgCO2/m2.yr)
TSC ECO2
(kgCO2/m2.yr)
Insulation ECO2
(kgCO2/m2.yr)
Total CO2
(kgCO2/m2.yr)CO2 saving
%
Energy saving (A)
£
PV(A) £
NPV £
Payback period (years)
0 0 0 18.73 32.85 3.51 0 0 0 0 11957.4 14270.36 43.70 35.00 97931.40 0.00 0.00 97931.40 21.59 0.00 0.00 0.44 22.03 0.00 0.00 0.00 0.00 025% 55 190 10.65 24.6375 3.51 0.1616 25073.559 60344.3764 0 8448.213 9920.8527 66.60 44.70 143650.80 8250.00 35168.82 187069.62 15.04 0.71 0.03 1.09 16.86 23.48 4349.51 102165.49 13027.26 21.650% 150 382 7.1 16.425 3.51 0.2326 50411.0502 41744.9171 6740.0973 5540.984 6644.424 66.60 44.70 143650.80 22500.00 70337.65 236488.45 9.26 1.42 0.07 1.09 11.85 46.23 7625.94 179125.45 40568.41 19.175% 365 573 3.55 8.2125 3.51 0.3036 75616.5753 31431.6521 21630.292 3427.068 4161.3082 66.60 44.70 143650.80 54750.00 105506.47 303907.27 3.52 2.13 0.17 1.09 6.92 68.61 10109.05 237451.31 31475.44 21.5100% 575 764 0 0 3.51 0.3746 100822.1 25097.8909 40453.352 1693.304 2058.3439 66.60 44.70 143650.80 86250.00 140675.29 370576.09 -2.21 2.84 0.27 1.09 1.99 90.96 12212.02 286847.80 14203.10 23.7100% 575 764 0 0 3.51 0.3746 100822.1 25097.8909 40453.352 -531.63 -166.5905 66.60 44.70 143650.80 86250.00 140675.29 370576.09 -2.21 2.84 0.27 1.09 1.99 90.96 14436.95 339109.23 66464.54 23.7
Carbon offsetting
575 850 0 0 3.51 0.3746 112039.219 22847.0708 49673.409 963.2865 1328.3265 66.60 44.70 143650.80 86250.00 184535.18 414435.98 -4.53 3.16 0.27 1.09 0.00 100.01 12942.03 303995.16 -12509.42 26.1
Carbon offsetting
575 850 0 0 3.51 0.3746 112039.219 22847.0708 49673.409 -1768.75 -1403.711 66.60 44.70 143650.80 86250.00 184535.18 414435.98 -4.53 3.16 0.27 1.09 0.00 100.01 15674.07 368167.93 51663.35 21.3
TSC + PV + 0.08 - 0.11
TSC + PV + 0.07 - 0.10
Office-London
TSC + PV + 2010 notional building fabric
TSC + PV + 0.17 - 0.24
TSC + PV + 0.15 - 0.21
TSC + PV + 0.13 - 0.19
TSC + PV + 0.12 - 0.17
TSC + PV + 0.11 - 0.15
PV (future FiT) + Insulation + TSC

206
Table B. 13 Office - PV (current FiT) + improving the building fabric U-value down to 0.07-0.1 W/m2.K (mineral wool) – taking into account the rental loss/gain- City
provided Elec. by PV
PV area m2
Heating (KWh/m2)
Lighting (KWh/m2)
Hot water (KWh/m2)
generated Elec by PV
(KWh)
purchased from grid
elec (KWh)
Exported Elec
(KWh)
Elec Cost £
Energy cost Inc FIT
Wall Insulation price £/m2
Roof Insulation price £/m2
Total Insulation
price £
PV cost £
Fabric cost £
Operational CO2
(kgCO2/m2.yr)
PV ECO2
(kgCO2/m2.yr)
Insulation ECO2
(kgCO2/m2.yr)
Total CO2
(kgCO2/m2.yr)
CO2 saving %
Energy saving (A)
£
Value of external footprint
area £
PV(A) £
NPV £
Payback period (years)
0 0 18.73 32.85 3.51 0 0 0 11957.4 14270.36 43.70 35.00 97931.40 0.00 97931.40 21.59 0.00 0.44 22.03 0.00 0.00 88119.66 0.00 0.00 025% 190 18.73 24.6375 3.51 25073.559 60344.37639 0 4812.547 7125.50664 43.70 35.00 97931.40 35168.82 133100.22 16.53 0.71 0.44 17.68 19.75 7144.85 88119.66 167825.31 132656.49 550% 382 18.73 16.425 3.51 50411.0502 41744.91709 6740.097 -1768.62 544.341737 43.70 35.00 97931.40 70337.65 168269.05 11.42 1.42 0.44 13.28 39.71 13726.02 88119.66 322410.16 252072.52 5.275% 573 18.73 8.2125 3.51 75616.5753 31431.65212 21630.29 -7537.34 -5224.3753 43.70 35.00 97931.40 105506.47 203437.87 6.34 2.13 0.44 8.91 59.57 19494.74 88119.66 457911.44 352404.97 5.5100% 764 18.73 0 3.51 100822.1004 25097.89092 40453.35 -12925.9 -10612.941 43.70 35.00 97931.40 140675.29 238606.69 1.26 2.84 0.44 4.54 79.38 24883.30 88119.66 584483.34 443808.05 5.75
Carbon offsetting 964 18.73 0 3.51 127215.3204 20513.36376 62294.1 -18377.6 -16064.625 43.70 35.00 97931.40 209531.12 307462.52 -4.07 3.59 0.44 -0.04 100.20 30334.99 88119.66 712537.85 503006.73 7
provided Elec. by PV
PV area m2
Heating (KWh/m2)
Lighting (KWh/m2)
Hot water (KWh/m2)
generated Elec by PV
(KWh)
purchased from grid
elec (KWh)
Exported Elec
(KWh)
Elec Cost £
Energy cost Inc FIT
Wall Insulation price £/m2
Roof Insulation price £/m2
Total Insulation
price £
PV cost £
Fabric cost £
Operational CO2
(kgCO2/m2.yr)
PV ECO2
(kgCO2/m2.yr)
Insulation ECO2
(kgCO2/m2.yr)
Total CO2
(kgCO2/m2.yr)
CO2 saving %
Energy saving (A)
£
Value of external footprint
area £
PV(A) £
NPV £
Payback period (years)
0 0 18.73 32.85 3.51 0 0 0 11957.4 14270.36 43.70 35.00 97931.40 0.00 97931.40 21.59 0.00 0.44 22.03 0.00 0.00 0.00 0.00 025% 190 18.05 24.6375 3.51 25073.559 60344.37639 0 4812.547 7054.78664 44.30 35.70 99418.20 35168.82 134587.02 16.40 0.71 0.48 17.59 20.17 7215.57 90400.00 131903.00 95247.38 5.1550% 382 18.05 16.425 3.51 50411.0502 41744.91709 6740.097 -1768.62 473.621737 44.30 35.70 99418.20 70337.65 169755.85 11.29 1.42 0.48 13.19 40.13 13796.74 90400.00 286487.85 214663.40 5.375% 573 18.05 8.2125 3.51 75616.5753 31431.65212 21630.29 -7537.34 -5295.0953 44.30 35.70 99418.20 105506.47 204924.67 6.20 2.13 0.48 8.82 59.98 19565.46 90400.00 421989.12 314995.85 5.55100% 764 18.05 0 3.51 100822.1004 25097.89092 40453.35 -12925.9 -10683.661 44.30 35.70 99418.20 140675.29 240093.49 1.13 2.84 0.48 4.45 79.79 24954.02 90400.00 548561.03 406398.93 5.8
Carbon offsetting 960 18.05 0 3.51 126687.456 20588.5376 61840.48 -18270.1 -16027.867 44.30 35.70 99418.20 208661.69 308079.89 -4.10 3.57 0.48 -0.04 100.20 30298.23 90400.00 674090.99 463942.50 7.1
provided Elec. by PV
PV area m2
Heating (KWh/m2)
Lighting (KWh/m2)
Hot water (KWh/m2)
generated Elec by PV
(KWh)
purchased from grid
elec (KWh)
Exported Elec
(KWh)
Elec Cost £
Energy cost Inc FIT
Wall Insulation price £/m2
Roof Insulation price £/m2
Total Insulation
price £
PV cost £
Fabric cost £
Operational CO2
(kgCO2/m2.yr)
PV ECO2
(kgCO2/m2.yr)
Insulation ECO2
(kgCO2/m2.yr)
Total CO2
(kgCO2/m2.yr)
CO2 saving %
Energy saving (A)
£
Value of external footprint
area £
PV(A) £
NPV £
Payback period (years)
0 0 18.73 32.85 3.51 0 0 0 11957.4 14270.36 43.70 35.00 97931.40 0.00 97931.40 21.59 0.00 0.44 22.03 0.00 0.00 0.00 0.00 025% 190 17.05 24.6375 3.51 25073.559 60344.37639 0 4812.547 6950.78664 45.00 36.40 101077.20 35168.82 136246.02 16.21 0.71 0.52 17.43 20.88 7319.57 96050.00 41225.29 2910.67 5.350% 382 17.05 16.425 3.51 50411.0502 41744.91709 6740.097 -1768.62 369.621737 45.00 36.40 101077.20 70337.65 171414.85 11.09 1.42 0.52 13.03 40.84 13900.74 96050.00 195810.14 122326.70 5.475% 573 17.05 8.2125 3.51 75616.5753 31431.65212 21630.29 -7537.34 -5399.0953 45.00 36.40 101077.20 105506.47 206583.67 6.01 2.13 0.52 8.66 60.69 19669.46 96050.00 331311.42 222659.15 5.6100% 764 17.05 0 3.51 100822.1004 25097.89092 40453.35 -12925.9 -10787.661 45.00 36.40 101077.20 140675.29 241752.49 0.93 2.84 0.52 4.30 80.50 25058.02 96050.00 457883.32 314062.23 5.85
Carbon offsetting 954 17.05 0 3.51 125895.6594 20701.29836 61160.05 -18108.9 -15970.651 45.00 36.40 101077.20 207357.56 308434.76 -4.13 3.55 0.52 -0.06 100.28 30241.01 96050.00 579626.48 369123.12 7.1
provided Elec. by PV
PV area m2
Heating (KWh/m2)
Lighting (KWh/m2)
Hot water (KWh/m2)
generated Elec by PV
(KWh)
purchased from grid
elec (KWh)
Exported Elec
(KWh)
Elec Cost £
Energy cost Inc FIT
Wall Insulation price £/m2
Roof Insulation price £/m2
Total Insulation
price £
PV cost £
Fabric cost £
Operational CO2
(kgCO2/m2.yr)
PV ECO2
(kgCO2/m2.yr)
Insulation ECO2
(kgCO2/m2.yr)
Total CO2
(kgCO2/m2.yr)
CO2 saving %
Energy saving (A)
£
Value of external footprint
area £
PV(A) £
NPV £
Payback period (years)
0 0 18.73 32.85 3.51 0 0 0 11957.4 14270.36 43.70 35.00 97931.40 0.00 97931.40 21.59 0.00 0.44 22.03 0.00 0.00 0.00 0.00 025% 190 16.49 24.6375 3.51 25073.559 60344.37639 0 4812.547 6892.54664 48.60 37.00 107665.20 35168.82 142834.02 16.10 0.71 0.61 17.41 20.97 7377.81 101700.00 -50527.26 -95429.89 6.1550% 382 16.49 16.425 3.51 50411.0502 41744.91709 6740.097 -1768.62 311.381737 48.60 37.00 107665.20 70337.65 178002.85 10.98 1.42 0.61 13.02 40.93 13958.98 101700.00 104057.58 23986.14 5.8575% 573 16.49 8.2125 3.51 75616.5753 31431.65212 21630.29 -7537.34 -5457.3353 48.60 37.00 107665.20 105506.47 213171.67 5.90 2.13 0.61 8.64 60.78 19727.70 101700.00 239558.86 124318.59 5.95100% 764 16.49 0 3.51 100822.1004 25097.89092 40453.35 -12925.9 -10845.901 48.60 37.00 107665.20 140675.29 248340.49 0.82 2.84 0.61 4.28 80.59 25116.26 101700.00 366130.76 215721.67 6.1
Carbon offsetting 952 16.49 0 3.51 125631.7272 20738.88528 60933.24 -18055.2 -15975.152 48.60 37.00 107665.20 206922.84 314588.04 -4.19 3.54 0.61 -0.04 100.16 30245.51 101700.00 486611.65 269955.01 7.3
provided Elec. by PV
PV area m2
Heating (KWh/m2)
Lighting (KWh/m2)
Hot water (KWh/m2)
generated Elec by PV
(KWh)
purchased from grid
elec (KWh)
Exported Elec
(KWh)
Elec Cost £
Energy cost Inc FIT
Wall Insulation price £/m2
Roof Insulation price £/m2
Total Insulation
price £
PV cost £
Fabric cost £
Operational CO2
(kgCO2/m2.yr)
PV ECO2
(kgCO2/m2.yr)
Insulation ECO2
(kgCO2/m2.yr)
Total CO2
(kgCO2/m2.yr)
CO2 saving %
Energy saving (A)
£
Value of external footprint
area £
PV(A) £
NPV £
Payback period (years)
0 0 18.73 32.85 3.51 0 0 0 11957.4 14270.36 43.70 35.00 97931.40 0.00 97931.40 21.59 0.00 0.44 22.03 0.00 0.00 0.00 0.00 025% 190 16 24.6375 3.51 25073.559 60344.37639 0 4812.547 6841.58664 50.40 38.40 111672.00 35168.82 146840.82 16.00 0.71 0.65 17.36 21.22 7428.77 107350.00 -142450.82 -191360.25 6.7550% 382 16 16.425 3.51 50411.0502 41744.91709 6740.097 -1768.62 260.421737 50.40 38.40 111672.00 70337.65 182009.65 10.89 1.42 0.65 12.96 41.18 14009.94 107350.00 12134.02 -71944.22 6.175% 573 16 8.2125 3.51 75616.5753 31431.65212 21630.29 -7537.34 -5508.2953 50.40 38.40 111672.00 105506.47 217178.47 5.80 2.13 0.65 8.58 61.03 19778.66 107350.00 147635.30 28388.23 6.15100% 764 16 0 3.51 100822.1004 25097.89092 40453.35 -12925.9 -10896.861 50.40 38.40 111672.00 140675.29 252347.29 0.73 2.84 0.65 4.22 80.85 25167.22 107350.00 274207.20 119791.31 6.25
Carbon offsetting 949 16 0 3.51 125103.8628 20814.05912 60479.62 -17947.7 -15918.635 50.40 38.40 111672.00 206053.42 317725.42 -4.18 3.53 0.65 0.00 99.98 30188.99 107350.00 392163.55 172369.53 7.45
provided Elec. by PV
PV area m2
Heating (KWh/m2)
Lighting (KWh/m2)
Hot water (KWh/m2)
generated Elec by PV
(KWh)
purchased from grid
elec (KWh)
Exported Elec
(KWh)
Elec Cost £
Energy cost Inc FIT
Wall Insulation price £/m2
Roof Insulation price £/m2
Total Insulation
price £
PV cost £
Fabric cost £
Operational CO2
(kgCO2/m2.yr)
PV ECO2
(kgCO2/m2.yr)
Insulation ECO2
(kgCO2/m2.yr)
Total CO2
(kgCO2/m2.yr)
CO2 saving %
Energy saving (A)
£
Value of external footprint
area £
PV(A) £
NPV £
Payback period (years)
0 0 18.73 32.85 3.51 0 0 0 11957.4 14270.36 43.70 35.00 97931.40 0.00 97931.40 21.59 0.00 0.44 22.03 0.00 0.00 0.00 0.00 025% 190 15.52 24.6375 3.51 25073.559 60344.37639 0 4812.547 6791.66664 52.20 39.00 115160.40 35168.82 150329.22 15.91 0.71 0.7 17.31 21.42 7478.69 115825.00 -280959.09 -333356.91 7.1550% 382 15.52 16.425 3.51 50411.0502 41744.91709 6740.097 -1768.62 210.501737 52.20 39.00 115160.40 70337.65 185498.05 10.79 1.42 0.7 12.91 41.38 14059.86 115825.00 -126374.24 -213940.89 6.3575% 573 15.52 8.2125 3.51 75616.5753 31431.65212 21630.29 -7537.34 -5558.2153 52.20 39.00 115160.40 105506.47 220666.87 5.71 2.13 0.7 8.54 61.23 19828.58 115825.00 9127.03 -113608.44 6.3100% 764 15.52 0 3.51 100822.1004 25097.89092 40453.35 -12925.9 -10946.781 52.20 39.00 115160.40 140675.29 255835.69 0.63 2.84 0.7 4.18 81.05 25217.14 115825.00 135698.94 -22205.36 6.4
Carbon offsetting 946 15.52 0 3.51 124839.9306 20851.64604 60252.81 -17893.9 -15914.816 52.20 39.00 115160.40 205618.71 320779.11 -4.22 3.52 0.7 0.00 99.99 30185.18 115825.00 252393.02 29545.31 7.55
provided Elec. by PV
PV area m2
Heating (KWh/m2)
Lighting (KWh/m2)
Hot water (KWh/m2)
generated Elec by PV
(KWh)
purchased from grid
elec (KWh)
Exported Elec
(KWh)
Elec Cost £
Energy cost Inc FIT
Wall Insulation price £/m2
Roof Insulation price £/m2
Total Insulation
price £
PV cost £
Fabric cost £
Operational CO2
(kgCO2/m2.yr)
PV ECO2
(kgCO2/m2.yr)
Insulation ECO2
(kgCO2/m2.yr)
Total CO2
(kgCO2/m2.yr)
CO2 saving %
Energy saving (A)
£
Value of external footprint
area £
PV(A) £
NPV £
Payback period (years)
0 0 18.73 32.85 3.51 0 0 0 11957.4 14270.36 43.70 35.00 97931.40 0.00 97931.40 21.59 0.00 0.44 22.03 0.00 0.00 0.00 0.00 025% 190 15 24.6375 3.51 25073.559 60344.37639 0 4812.547 6737.58664 63.00 43.00 136350.00 35168.82 171518.82 15.80 0.71 1 17.51 20.52 7532.77 138142.50 -647515.01 -721102.43 1050% 382 15 16.425 3.51 50411.0502 41744.91709 6740.097 -1768.62 156.421737 63.00 43.00 136350.00 70337.65 206687.65 10.69 1.42 1 13.11 40.48 14113.94 138142.50 -492930.16 -601686.41 7.8575% 573 15 8.2125 3.51 75616.5753 31431.65212 21630.29 -7537.34 -5612.2953 63.00 43.00 136350.00 105506.47 241856.47 5.61 2.13 1 8.74 60.34 19882.66 138142.50 -357428.88 -501353.95 7.4100% 764 15 0 3.51 100822.1004 25097.89092 40453.35 -12925.9 -11000.861 63.00 43.00 136350.00 140675.29 277025.29 0.53 2.84 1 4.37 80.15 25271.22 138142.50 -230856.98 -409950.87 7.25
Carbon offsetting 959 15.52 0 3.51 126555.4899 20614.05106 61750.92 -18243.4 -16264.25 63.00 43.00 136350.00 208444.34 344794.34 -4.57 3.57 1 0.00 100.00 30534.61 138142.50 -107225.33 -354088.26 8.25
provided Elec. by PV
PV area m2
Heating (KWh/m2)
Lighting (KWh/m2)
Hot water (KWh/m2)
generated Elec by PV
(KWh)
purchased from grid
elec (KWh)
Exported Elec
(KWh)
Elec Cost £
Energy cost Inc FIT
Wall Insulation price £/m2
Roof Insulation price £/m2
Total Insulation
price £
PV cost £
Fabric cost £
Operational CO2
(kgCO2/m2.yr)
PV ECO2
(kgCO2/m2.yr)
Insulation ECO2
(kgCO2/m2.yr)
Total CO2
(kgCO2/m2.yr)
CO2 saving %
Energy saving (A)
£
Value of external footprint
area £
PV(A) £
NPV £
Payback period (years)
0 0 18.73 32.85 3.51 0 0 0 11957.4 14270.36 43.70 35.00 97931.40 0.00 97931.40 21.59 0.00 0.44 22.03 0.00 0.00 0.00 0.00 025% 190 14.2 24.6375 3.51 25073.559 60344.37639 0 4812.547 6654.38664 66.60 44.70 143650.80 35168.82 178819.62 15.65 0.71 1.09 17.44 20.82 7615.97 149273.00 -829008.22 -909896.45 1150% 382 14.2 16.425 3.51 50411.0502 41744.91709 6740.097 -1768.62 73.2217372 66.60 44.70 143650.80 70337.65 213988.45 10.53 1.42 1.09 13.05 40.79 14197.14 149273.00 -674423.37 -790480.42 8.3575% 573 14.2 8.2125 3.51 75616.5753 31431.65212 21630.29 -7537.34 -5695.4953 66.60 44.70 143650.80 105506.47 249157.27 5.45 2.13 1.09 8.67 60.64 19965.86 149273.00 -538922.10 -690147.97 7.75100% 764 14.2 0 3.51 100822.1004 25097.89092 40453.35 -12925.9 -11084.061 66.60 44.70 143650.80 140675.29 284326.09 0.37 2.84 1.09 4.31 80.45 25354.42 149273.00 -412350.20 -598744.89 7.5
Carbon offsetting 952 14.2 0 3.51 125631.7272 20738.88528 60933.24 -18055.2 -16213.312 66.60 44.70 143650.80 206922.84 350573.64 -4.64 3.54 1.09 0.00 100.02 30483.67 149273.00 -291869.31 -544511.55 8.5
PV + 0.08 - 0.11
PV + 0.07 - 0.10
PV + 2010 notional building fabric
Office-London (City)
PV + 0.17 - 0.24
PV + 0.15 - 0.21
PV + 0.13 - 0.19
PV + 0.12 - 0.17
PV + 0.11 - 0.15
PV (current FiT) + Insulation
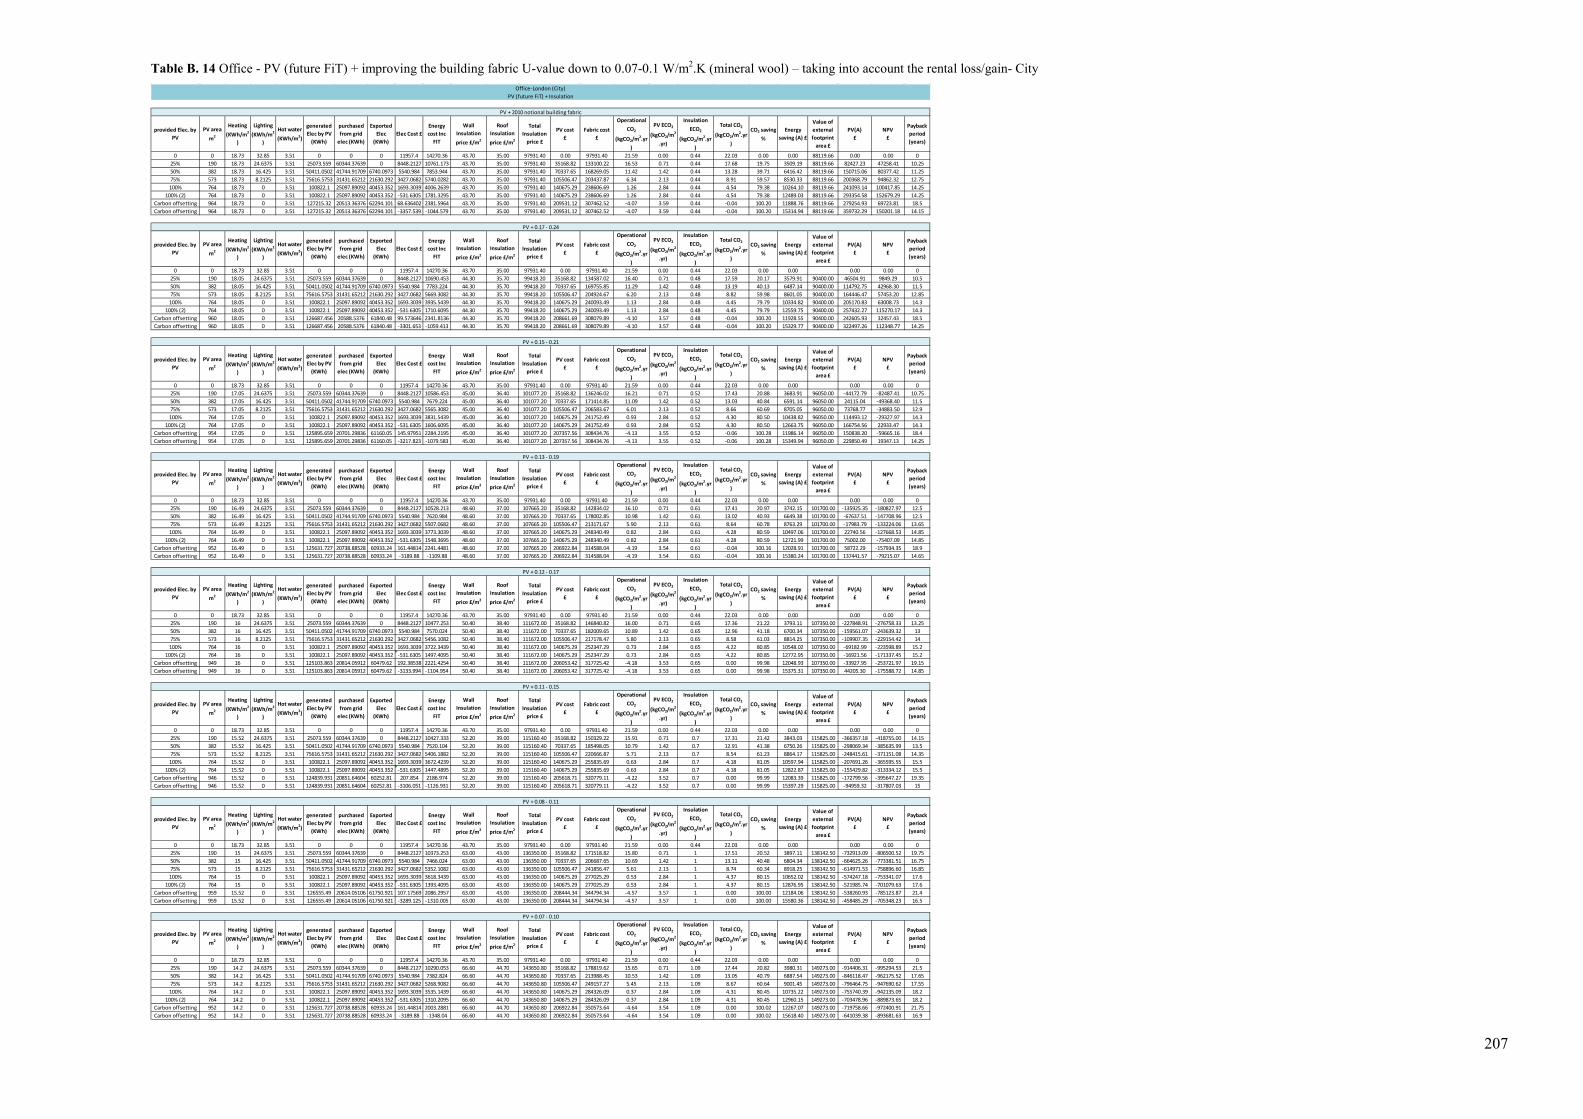
207
Table B. 14 Office - PV (future FiT) + improving the building fabric U-value down to 0.07-0.1 W/m2.K (mineral wool) – taking into account the rental loss/gain- City
provided Elec. by PV
PV area m2
Heating (KWh/m2
)
Lighting (KWh/m2
)
Hot water (KWh/m2)
generated Elec by PV
(KWh)
purchased from grid
elec (KWh)
Exported Elec
(KWh)Elec Cost £
Energy cost Inc
FIT
Wall Insulation price £/m2
Roof Insulation price £/m2
Total Insulation
price £
PV cost £
Fabric cost £
Operational CO2
(kgCO2/m2.yr)
PV ECO2
(kgCO2/m2
.yr)
Insulation ECO2
(kgCO2/m2.yr)
Total CO2
(kgCO2/m2.yr)
CO2 saving %
Energy saving (A) £
Value of external footprint
area £
PV(A) £
NPV £
Payback period (years)
0 0 18.73 32.85 3.51 0 0 0 11957.4 14270.36 43.70 35.00 97931.40 0.00 97931.40 21.59 0.00 0.44 22.03 0.00 0.00 88119.66 0.00 0.00 025% 190 18.73 24.6375 3.51 25073.559 60344.37639 0 8448.2127 10761.173 43.70 35.00 97931.40 35168.82 133100.22 16.53 0.71 0.44 17.68 19.75 3509.19 88119.66 82427.23 47258.41 10.2550% 382 18.73 16.425 3.51 50411.0502 41744.91709 6740.0973 5540.984 7853.944 43.70 35.00 97931.40 70337.65 168269.05 11.42 1.42 0.44 13.28 39.71 6416.42 88119.66 150715.06 80377.42 11.2575% 573 18.73 8.2125 3.51 75616.5753 31431.65212 21630.292 3427.0682 5740.0282 43.70 35.00 97931.40 105506.47 203437.87 6.34 2.13 0.44 8.91 59.57 8530.33 88119.66 200368.79 94862.32 12.75100% 764 18.73 0 3.51 100822.1 25097.89092 40453.352 1693.3039 4006.2639 43.70 35.00 97931.40 140675.29 238606.69 1.26 2.84 0.44 4.54 79.38 10264.10 88119.66 241093.14 100417.85 14.25
100% (2) 764 18.73 0 3.51 100822.1 25097.89092 40453.352 -531.6305 1781.3295 43.70 35.00 97931.40 140675.29 238606.69 1.26 2.84 0.44 4.54 79.38 12489.03 88119.66 293354.58 152679.29 14.25Carbon offsetting 964 18.73 0 3.51 127215.32 20513.36376 62294.101 68.636402 2381.5964 43.70 35.00 97931.40 209531.12 307462.52 -4.07 3.59 0.44 -0.04 100.20 11888.76 88119.66 279254.93 69723.81 18.5Carbon offsetting 964 18.73 0 3.51 127215.32 20513.36376 62294.101 -3357.539 -1044.579 43.70 35.00 97931.40 209531.12 307462.52 -4.07 3.59 0.44 -0.04 100.20 15314.94 88119.66 359732.29 150201.18 14.15
provided Elec. by PV
PV area m2
Heating (KWh/m2
)
Lighting (KWh/m2
)
Hot water (KWh/m2)
generated Elec by PV
(KWh)
purchased from grid
elec (KWh)
Exported Elec
(KWh)Elec Cost £
Energy cost Inc
FIT
Wall Insulation price £/m2
Roof Insulation price £/m2
Total Insulation
price £
PV cost £
Fabric cost £
Operational CO2
(kgCO2/m2.yr)
PV ECO2
(kgCO2/m2
.yr)
Insulation ECO2
(kgCO2/m2.yr)
Total CO2
(kgCO2/m2.yr)
CO2 saving %
Energy saving (A) £
Value of external footprint
area £
PV(A) £
NPV £
Payback period (years)
0 0 18.73 32.85 3.51 0 0 0 11957.4 14270.36 43.70 35.00 97931.40 0.00 97931.40 21.59 0.00 0.44 22.03 0.00 0.00 0.00 0.00 025% 190 18.05 24.6375 3.51 25073.559 60344.37639 0 8448.2127 10690.453 44.30 35.70 99418.20 35168.82 134587.02 16.40 0.71 0.48 17.59 20.17 3579.91 90400.00 46504.91 9849.29 10.550% 382 18.05 16.425 3.51 50411.0502 41744.91709 6740.0973 5540.984 7783.224 44.30 35.70 99418.20 70337.65 169755.85 11.29 1.42 0.48 13.19 40.13 6487.14 90400.00 114792.75 42968.30 11.575% 573 18.05 8.2125 3.51 75616.5753 31431.65212 21630.292 3427.0682 5669.3082 44.30 35.70 99418.20 105506.47 204924.67 6.20 2.13 0.48 8.82 59.98 8601.05 90400.00 164446.47 57453.20 12.85100% 764 18.05 0 3.51 100822.1 25097.89092 40453.352 1693.3039 3935.5439 44.30 35.70 99418.20 140675.29 240093.49 1.13 2.84 0.48 4.45 79.79 10334.82 90400.00 205170.83 63008.73 14.3
100% (2) 764 18.05 0 3.51 100822.1 25097.89092 40453.352 -531.6305 1710.6095 44.30 35.70 99418.20 140675.29 240093.49 1.13 2.84 0.48 4.45 79.79 12559.75 90400.00 257432.27 115270.17 14.3Carbon offsetting 960 18.05 0 3.51 126687.456 20588.5376 61840.48 99.573646 2341.8136 44.30 35.70 99418.20 208661.69 308079.89 -4.10 3.57 0.48 -0.04 100.20 11928.55 90400.00 242605.93 32457.43 18.5Carbon offsetting 960 18.05 0 3.51 126687.456 20588.5376 61840.48 -3301.653 -1059.413 44.30 35.70 99418.20 208661.69 308079.89 -4.10 3.57 0.48 -0.04 100.20 15329.77 90400.00 322497.26 112348.77 14.25
provided Elec. by PV
PV area m2
Heating (KWh/m2
)
Lighting (KWh/m2
)
Hot water (KWh/m2)
generated Elec by PV
(KWh)
purchased from grid
elec (KWh)
Exported Elec
(KWh)Elec Cost £
Energy cost Inc
FIT
Wall Insulation price £/m2
Roof Insulation price £/m2
Total Insulation
price £
PV cost £
Fabric cost £
Operational CO2
(kgCO2/m2.yr)
PV ECO2
(kgCO2/m2
.yr)
Insulation ECO2
(kgCO2/m2.yr)
Total CO2
(kgCO2/m2.yr)
CO2 saving %
Energy saving (A) £
Value of external footprint
area £
PV(A) £
NPV £
Payback period (years)
0 0 18.73 32.85 3.51 0 0 0 11957.4 14270.36 43.70 35.00 97931.40 0.00 97931.40 21.59 0.00 0.44 22.03 0.00 0.00 0.00 0.00 025% 190 17.05 24.6375 3.51 25073.559 60344.37639 0 8448.2127 10586.453 45.00 36.40 101077.20 35168.82 136246.02 16.21 0.71 0.52 17.43 20.88 3683.91 96050.00 -44172.79 -82487.41 10.7550% 382 17.05 16.425 3.51 50411.0502 41744.91709 6740.0973 5540.984 7679.224 45.00 36.40 101077.20 70337.65 171414.85 11.09 1.42 0.52 13.03 40.84 6591.14 96050.00 24115.04 -49368.40 11.575% 573 17.05 8.2125 3.51 75616.5753 31431.65212 21630.292 3427.0682 5565.3082 45.00 36.40 101077.20 105506.47 206583.67 6.01 2.13 0.52 8.66 60.69 8705.05 96050.00 73768.77 -34883.50 12.9100% 764 17.05 0 3.51 100822.1 25097.89092 40453.352 1693.3039 3831.5439 45.00 36.40 101077.20 140675.29 241752.49 0.93 2.84 0.52 4.30 80.50 10438.82 96050.00 114493.12 -29327.97 14.3
100% (2) 764 17.05 0 3.51 100822.1 25097.89092 40453.352 -531.6305 1606.6095 45.00 36.40 101077.20 140675.29 241752.49 0.93 2.84 0.52 4.30 80.50 12663.75 96050.00 166754.56 22933.47 14.3Carbon offsetting 954 17.05 0 3.51 125895.659 20701.29836 61160.05 145.97951 2284.2195 45.00 36.40 101077.20 207357.56 308434.76 -4.13 3.55 0.52 -0.06 100.28 11986.14 96050.00 150838.20 -59665.16 18.4Carbon offsetting 954 17.05 0 3.51 125895.659 20701.29836 61160.05 -3217.823 -1079.583 45.00 36.40 101077.20 207357.56 308434.76 -4.13 3.55 0.52 -0.06 100.28 15349.94 96050.00 229850.49 19347.13 14.25
provided Elec. by PV
PV area m2
Heating (KWh/m2
)
Lighting (KWh/m2
)
Hot water (KWh/m2)
generated Elec by PV
(KWh)
purchased from grid
elec (KWh)
Exported Elec
(KWh)Elec Cost £
Energy cost Inc
FIT
Wall Insulation price £/m2
Roof Insulation price £/m2
Total Insulation
price £
PV cost £
Fabric cost £
Operational CO2
(kgCO2/m2.yr)
PV ECO2
(kgCO2/m2
.yr)
Insulation ECO2
(kgCO2/m2.yr)
Total CO2
(kgCO2/m2.yr)
CO2 saving %
Energy saving (A) £
Value of external footprint
area £
PV(A) £
NPV £
Payback period (years)
0 0 18.73 32.85 3.51 0 0 0 11957.4 14270.36 43.70 35.00 97931.40 0.00 97931.40 21.59 0.00 0.44 22.03 0.00 0.00 0.00 0.00 025% 190 16.49 24.6375 3.51 25073.559 60344.37639 0 8448.2127 10528.213 48.60 37.00 107665.20 35168.82 142834.02 16.10 0.71 0.61 17.41 20.97 3742.15 101700.00 -135925.35 -180827.97 12.550% 382 16.49 16.425 3.51 50411.0502 41744.91709 6740.0973 5540.984 7620.984 48.60 37.00 107665.20 70337.65 178002.85 10.98 1.42 0.61 13.02 40.93 6649.38 101700.00 -67637.51 -147708.96 12.575% 573 16.49 8.2125 3.51 75616.5753 31431.65212 21630.292 3427.0682 5507.0682 48.60 37.00 107665.20 105506.47 213171.67 5.90 2.13 0.61 8.64 60.78 8763.29 101700.00 -17983.79 -133224.06 13.65100% 764 16.49 0 3.51 100822.1 25097.89092 40453.352 1693.3039 3773.3039 48.60 37.00 107665.20 140675.29 248340.49 0.82 2.84 0.61 4.28 80.59 10497.06 101700.00 22740.56 -127668.53 14.85
100% (2) 764 16.49 0 3.51 100822.1 25097.89092 40453.352 -531.6305 1548.3695 48.60 37.00 107665.20 140675.29 248340.49 0.82 2.84 0.61 4.28 80.59 12721.99 101700.00 75002.00 -75407.09 14.85Carbon offsetting 952 16.49 0 3.51 125631.727 20738.88528 60933.24 161.44814 2241.4481 48.60 37.00 107665.20 206922.84 314588.04 -4.19 3.54 0.61 -0.04 100.16 12028.91 101700.00 58722.29 -157934.35 18.9Carbon offsetting 952 16.49 0 3.51 125631.727 20738.88528 60933.24 -3189.88 -1109.88 48.60 37.00 107665.20 206922.84 314588.04 -4.19 3.54 0.61 -0.04 100.16 15380.24 101700.00 137441.57 -79215.07 14.65
provided Elec. by PV
PV area m2
Heating (KWh/m2
)
Lighting (KWh/m2
)
Hot water (KWh/m2)
generated Elec by PV
(KWh)
purchased from grid
elec (KWh)
Exported Elec
(KWh)Elec Cost £
Energy cost Inc
FIT
Wall Insulation price £/m2
Roof Insulation price £/m2
Total Insulation
price £
PV cost £
Fabric cost £
Operational CO2
(kgCO2/m2.yr)
PV ECO2
(kgCO2/m2
.yr)
Insulation ECO2
(kgCO2/m2.yr)
Total CO2
(kgCO2/m2.yr)
CO2 saving %
Energy saving (A) £
Value of external footprint
area £
PV(A) £
NPV £
Payback period (years)
0 0 18.73 32.85 3.51 0 0 0 11957.4 14270.36 43.70 35.00 97931.40 0.00 97931.40 21.59 0.00 0.44 22.03 0.00 0.00 0.00 0.00 025% 190 16 24.6375 3.51 25073.559 60344.37639 0 8448.2127 10477.253 50.40 38.40 111672.00 35168.82 146840.82 16.00 0.71 0.65 17.36 21.22 3793.11 107350.00 -227848.91 -276758.33 13.2550% 382 16 16.425 3.51 50411.0502 41744.91709 6740.0973 5540.984 7570.024 50.40 38.40 111672.00 70337.65 182009.65 10.89 1.42 0.65 12.96 41.18 6700.34 107350.00 -159561.07 -243639.32 1375% 573 16 8.2125 3.51 75616.5753 31431.65212 21630.292 3427.0682 5456.1082 50.40 38.40 111672.00 105506.47 217178.47 5.80 2.13 0.65 8.58 61.03 8814.25 107350.00 -109907.35 -229154.42 14100% 764 16 0 3.51 100822.1 25097.89092 40453.352 1693.3039 3722.3439 50.40 38.40 111672.00 140675.29 252347.29 0.73 2.84 0.65 4.22 80.85 10548.02 107350.00 -69182.99 -223598.89 15.2
100% (2) 764 16 0 3.51 100822.1 25097.89092 40453.352 -531.6305 1497.4095 50.40 38.40 111672.00 140675.29 252347.29 0.73 2.84 0.65 4.22 80.85 12772.95 107350.00 -16921.56 -171337.45 15.2Carbon offsetting 949 16 0 3.51 125103.863 20814.05912 60479.62 192.38538 2221.4254 50.40 38.40 111672.00 206053.42 317725.42 -4.18 3.53 0.65 0.00 99.98 12048.93 107350.00 -33927.95 -253721.97 19.15Carbon offsetting 949 16 0 3.51 125103.863 20814.05912 60479.62 -3133.994 -1104.954 50.40 38.40 111672.00 206053.42 317725.42 -4.18 3.53 0.65 0.00 99.98 15375.31 107350.00 44205.30 -175588.72 14.85
provided Elec. by PV
PV area m2
Heating (KWh/m2
)
Lighting (KWh/m2
)
Hot water (KWh/m2)
generated Elec by PV
(KWh)
purchased from grid
elec (KWh)
Exported Elec
(KWh)Elec Cost £
Energy cost Inc
FIT
Wall Insulation price £/m2
Roof Insulation price £/m2
Total Insulation
price £
PV cost £
Fabric cost £
Operational CO2
(kgCO2/m2.yr)
PV ECO2
(kgCO2/m2
.yr)
Insulation ECO2
(kgCO2/m2.yr)
Total CO2
(kgCO2/m2.yr)
CO2 saving %
Energy saving (A) £
Value of external footprint
area £
PV(A) £
NPV £
Payback period (years)
0 0 18.73 32.85 3.51 0 0 0 11957.4 14270.36 43.70 35.00 97931.40 0.00 97931.40 21.59 0.00 0.44 22.03 0.00 0.00 0.00 0.00 025% 190 15.52 24.6375 3.51 25073.559 60344.37639 0 8448.2127 10427.333 52.20 39.00 115160.40 35168.82 150329.22 15.91 0.71 0.7 17.31 21.42 3843.03 115825.00 -366357.18 -418755.00 14.1550% 382 15.52 16.425 3.51 50411.0502 41744.91709 6740.0973 5540.984 7520.104 52.20 39.00 115160.40 70337.65 185498.05 10.79 1.42 0.7 12.91 41.38 6750.26 115825.00 -298069.34 -385635.99 13.575% 573 15.52 8.2125 3.51 75616.5753 31431.65212 21630.292 3427.0682 5406.1882 52.20 39.00 115160.40 105506.47 220666.87 5.71 2.13 0.7 8.54 61.23 8864.17 115825.00 -248415.61 -371151.08 14.35100% 764 15.52 0 3.51 100822.1 25097.89092 40453.352 1693.3039 3672.4239 52.20 39.00 115160.40 140675.29 255835.69 0.63 2.84 0.7 4.18 81.05 10597.94 115825.00 -207691.26 -365595.55 15.5
100% (2) 764 15.52 0 3.51 100822.1 25097.89092 40453.352 -531.6305 1447.4895 52.20 39.00 115160.40 140675.29 255835.69 0.63 2.84 0.7 4.18 81.05 12822.87 115825.00 -155429.82 -313334.12 15.5Carbon offsetting 946 15.52 0 3.51 124839.931 20851.64604 60252.81 207.854 2186.974 52.20 39.00 115160.40 205618.71 320779.11 -4.22 3.52 0.7 0.00 99.99 12083.39 115825.00 -172799.56 -395647.27 19.35Carbon offsetting 946 15.52 0 3.51 124839.931 20851.64604 60252.81 -3106.051 -1126.931 52.20 39.00 115160.40 205618.71 320779.11 -4.22 3.52 0.7 0.00 99.99 15397.29 115825.00 -94959.32 -317807.03 15
provided Elec. by PV
PV area m2
Heating (KWh/m2
)
Lighting (KWh/m2
)
Hot water (KWh/m2)
generated Elec by PV
(KWh)
purchased from grid
elec (KWh)
Exported Elec
(KWh)Elec Cost £
Energy cost Inc
FIT
Wall Insulation price £/m2
Roof Insulation price £/m2
Total Insulation
price £
PV cost £
Fabric cost £
Operational CO2
(kgCO2/m2.yr)
PV ECO2
(kgCO2/m2
.yr)
Insulation ECO2
(kgCO2/m2.yr)
Total CO2
(kgCO2/m2.yr)
CO2 saving %
Energy saving (A) £
Value of external footprint
area £
PV(A) £
NPV £
Payback period (years)
0 0 18.73 32.85 3.51 0 0 0 11957.4 14270.36 43.70 35.00 97931.40 0.00 97931.40 21.59 0.00 0.44 22.03 0.00 0.00 0.00 0.00 025% 190 15 24.6375 3.51 25073.559 60344.37639 0 8448.2127 10373.253 63.00 43.00 136350.00 35168.82 171518.82 15.80 0.71 1 17.51 20.52 3897.11 138142.50 -732913.09 -806500.52 19.7550% 382 15 16.425 3.51 50411.0502 41744.91709 6740.0973 5540.984 7466.024 63.00 43.00 136350.00 70337.65 206687.65 10.69 1.42 1 13.11 40.48 6804.34 138142.50 -664625.26 -773381.51 16.7575% 573 15 8.2125 3.51 75616.5753 31431.65212 21630.292 3427.0682 5352.1082 63.00 43.00 136350.00 105506.47 241856.47 5.61 2.13 1 8.74 60.34 8918.25 138142.50 -614971.53 -758896.60 16.85100% 764 15 0 3.51 100822.1 25097.89092 40453.352 1693.3039 3618.3439 63.00 43.00 136350.00 140675.29 277025.29 0.53 2.84 1 4.37 80.15 10652.02 138142.50 -574247.18 -753341.07 17.6
100% (2) 764 15 0 3.51 100822.1 25097.89092 40453.352 -531.6305 1393.4095 63.00 43.00 136350.00 140675.29 277025.29 0.53 2.84 1 4.37 80.15 12876.95 138142.50 -521985.74 -701079.63 17.6Carbon offsetting 959 15.52 0 3.51 126555.49 20614.05106 61750.921 107.17569 2086.2957 63.00 43.00 136350.00 208444.34 344794.34 -4.57 3.57 1 0.00 100.00 12184.06 138142.50 -538260.93 -785123.87 21.4Carbon offsetting 959 15.52 0 3.51 126555.49 20614.05106 61750.921 -3289.125 -1310.005 63.00 43.00 136350.00 208444.34 344794.34 -4.57 3.57 1 0.00 100.00 15580.36 138142.50 -458485.29 -705348.23 16.5
provided Elec. by PV
PV area m2
Heating (KWh/m2
)
Lighting (KWh/m2
)
Hot water (KWh/m2)
generated Elec by PV
(KWh)
purchased from grid
elec (KWh)
Exported Elec
(KWh)Elec Cost £
Energy cost Inc
FIT
Wall Insulation price £/m2
Roof Insulation price £/m2
Total Insulation
price £
PV cost £
Fabric cost £
Operational CO2
(kgCO2/m2.yr)
PV ECO2
(kgCO2/m2
.yr)
Insulation ECO2
(kgCO2/m2.yr)
Total CO2
(kgCO2/m2.yr)
CO2 saving %
Energy saving (A) £
Value of external footprint
area £
PV(A) £
NPV £
Payback period (years)
0 0 18.73 32.85 3.51 0 0 0 11957.4 14270.36 43.70 35.00 97931.40 0.00 97931.40 21.59 0.00 0.44 22.03 0.00 0.00 0.00 0.00 025% 190 14.2 24.6375 3.51 25073.559 60344.37639 0 8448.2127 10290.053 66.60 44.70 143650.80 35168.82 178819.62 15.65 0.71 1.09 17.44 20.82 3980.31 149273.00 -914406.31 -995294.53 21.550% 382 14.2 16.425 3.51 50411.0502 41744.91709 6740.0973 5540.984 7382.824 66.60 44.70 143650.80 70337.65 213988.45 10.53 1.42 1.09 13.05 40.79 6887.54 149273.00 -846118.47 -962175.52 17.6575% 573 14.2 8.2125 3.51 75616.5753 31431.65212 21630.292 3427.0682 5268.9082 66.60 44.70 143650.80 105506.47 249157.27 5.45 2.13 1.09 8.67 60.64 9001.45 149273.00 -796464.75 -947690.62 17.55100% 764 14.2 0 3.51 100822.1 25097.89092 40453.352 1693.3039 3535.1439 66.60 44.70 143650.80 140675.29 284326.09 0.37 2.84 1.09 4.31 80.45 10735.22 149273.00 -755740.39 -942135.09 18.2
100% (2) 764 14.2 0 3.51 100822.1 25097.89092 40453.352 -531.6305 1310.2095 66.60 44.70 143650.80 140675.29 284326.09 0.37 2.84 1.09 4.31 80.45 12960.15 149273.00 -703478.96 -889873.65 18.2Carbon offsetting 952 14.2 0 3.51 125631.727 20738.88528 60933.24 161.44814 2003.2881 66.60 44.70 143650.80 206922.84 350573.64 -4.64 3.54 1.09 0.00 100.02 12267.07 149273.00 -719758.66 -972400.91 21.75Carbon offsetting 952 14.2 0 3.51 125631.727 20738.88528 60933.24 -3189.88 -1348.04 66.60 44.70 143650.80 206922.84 350573.64 -4.64 3.54 1.09 0.00 100.02 15618.40 149273.00 -641039.38 -893681.63 16.9
PV + 0.07 - 0.10
Office-London (City)
PV + 2010 notional building fabric
PV + 0.17 - 0.24
PV + 0.15 - 0.21
PV + 0.13 - 0.19
PV + 0.12 - 0.17
PV + 0.11 - 0.15
PV + 0.08 - 0.11
PV (future FiT) + Insulation

208
Table B. 15 Office - PV (current FiT) + improving the building fabric U-value down to 0.07-0.1 W/m2.K (mineral wool) + TSC – taking into account the rental loss/gain- City
provided Elec. & heating
TSC area m2
PV area m2
Heating (KWh/m2)
Lighting (KWh/m2)
Hot water (KWh/m2)
TSC fan power
(KWh/m2
)
generated Elec by PV
(KWh)
purchased from grid
elec (KWh)
Exported Elec (KWh)
Elec cost £
Energy cost Inc
FIT £
Wall Insulation price £/m2
Roof Insulation price £/m2
Total Insulation
price £
TSC cost £
PV Cost £Fabric cost
£
Operational CO2
(kgCO2/m2.yr)
PV ECO2
(kgCO2/m2.yr)
TSC ECO2
(kgCO2/m2.yr)
Insulation ECO2
(kgCO2/m2.yr)
Total CO2
(kgCO2/m2.yr)CO2 saving
%
Energy saving (A)
£
Value of external footprint
area £
PV(A) £
NPV £
Payback period (years)
0 0 0 18.73 32.85 3.51 0 0 0 0 11957.4 14270.36 43.70 35.00 97931.40 0.00 0.00 97931.40 21.59 0.00 0.00 0.44 22.03 0.00 0.00 88119.66 0.00 0.00 025% 75 190 14.04 24.6375 3.51 0.0938 25073.559 60344.3764 0 4812.547 6637.7466 43.70 35.00 97931.40 11250.00 35168.82 144350.22 15.66 0.71 0.04 0.44 16.85 23.53 7632.61 88119.66 179282.30 132863.48 6.250% 200 382 9.365 16.425 3.51 0.1873 50411.0502 41744.9171 6740.09727 -1768.62 -429.6183 43.70 35.00 97931.40 30000.00 70337.65 198269.05 9.68 1.42 0.09 0.44 11.64 47.17 14699.98 88119.66 345287.49 244949.84 6.9575% 425 573 4.68 8.2125 3.51 0.281 75616.5753 31431.6521 21630.292 -7537.34 -6685.575 43.70 35.00 97931.40 63750.00 105506.47 267187.87 3.73 2.13 0.20 0.44 6.50 70.48 20955.94 88119.66 492233.54 322977.07 8.25100% 650 764 0 0 3.51 0.3746 100822.1 25097.8909 40453.3519 -12925.9 -12560.86 43.70 35.00 97931.40 97500.00 140675.29 336106.69 -2.21 2.84 0.31 0.44 1.38 93.76 26831.22 88119.66 630238.00 392062.70 9.1
Carbon offsetting
650 823 0 0 3.51 0.3746 108608.1 23453.9279 46753.1629 -14568.5 -14203.48 43.70 35.00 97931.40 97500.00 178883.93 374315.33 -3.82 3.06 0.31 0.44 -0.01 100.03 28473.84 88119.66 668821.38 392437.45 10
provided Elec. & heating
TSC area m2
PV area m2
Heating (KWh/m2)
Lighting (KWh/m2)
Hot water (KWh/m2)
TSC fan power
(KWh/m2
)
generated Elec by PV
(KWh)
purchased from grid
elec (KWh)
Exported Elec (KWh)
Elec cost £
Energy cost Inc
FIT £
Wall Insulation price £/m2
Roof Insulation price £/m2
Total Insulation
price £
TSC cost £
PV Cost £Fabric cost
£
Operational CO2
(kgCO2/m2.yr)
PV ECO2
(kgCO2/m2.yr)
TSC ECO2
(kgCO2/m2.yr)
Insulation ECO2
(kgCO2/m2.yr)
Total CO2
(kgCO2/m2.yr)CO2 saving
%
Energy saving (A)
£
Value of external footprint
area £
PV(A) £
NPV £
Payback period (years)
0 0 0 18.73 32.85 3.51 0 0 0 0 11957.4 14270.36 43.70 35.00 97931.40 0.00 0.00 97931.40 21.59 0.00 0.00 0.44 22.03 0.00 0.00 0.00 0.00 025% 72 190 13.53 24.6375 3.51 0.104 25073.559 60344.3764 0 4812.547 6584.7066 44.30 35.70 99418.20 10800.00 35168.82 145387.02 15.57 0.71 0.03 0.48 16.79 23.79 7685.65 90400.00 142944.70 95489.07 6.350% 185 382 9.025 16.425 3.51 0.1941 50411.0502 41744.9171 6740.09727 -1768.62 -464.9783 44.30 35.70 99418.20 27750.00 70337.65 197505.85 9.62 1.42 0.09 0.48 11.61 47.30 14735.34 90400.00 308534.60 208960.16 6.975% 410 573 4.51 8.2125 3.51 0.2844 75616.5753 31431.6521 21630.292 -7537.34 -6703.255 44.30 35.70 99418.20 61500.00 105506.47 266424.67 3.70 2.13 0.19 0.48 6.51 70.47 20973.62 90400.00 455065.36 286572.09 8.2100% 630 764 0 0 3.51 0.3746 100822.1 25097.8909 40453.3519 -12925.9 -12560.86 44.30 35.70 99418.20 94500.00 140675.29 334593.49 -2.21 2.84 0.30 0.48 1.41 93.61 26831.22 90400.00 592654.54 355992.44 9.05
Carbon offsetting
630 825 0 0 3.51 0.3746 108872.033 23407.2466 46970.1049 -14623.1 -14258.04 44.30 35.70 99418.20 94500.00 179318.64 373236.84 -3.87 3.07 0.30 0.48 -0.02 100.09 28528.40 90400.00 632519.66 357214.22 9.9
provided Elec. & heating
TSC area m2
PV area m2
Heating (KWh/m2)
Lighting (KWh/m2)
Hot water (KWh/m2)
TSC fan power
(KWh/m2
)
generated Elec by PV
(KWh)
purchased from grid
elec (KWh)
Exported Elec (KWh)
Elec cost £
Energy cost Inc
FIT £
Wall Insulation price £/m2
Roof Insulation price £/m2
Total Insulation
price £
TSC cost £
PV Cost £Fabric cost
£
Operational CO2
(kgCO2/m2.yr)
PV ECO2
(kgCO2/m2.yr)
TSC ECO2
(kgCO2/m2.yr)
Insulation ECO2
(kgCO2/m2.yr)
Total CO2
(kgCO2/m2.yr)CO2 saving
%
Energy saving (A)
£
Value of external footprint
area £
PV(A) £
NPV £
Payback period (years)
0 0 0 18.73 32.85 3.51 0 0 0 0 11957.4 14270.36 43.70 35.00 97931.40 0.00 0.00 97931.40 21.59 0.00 0.00 0.44 22.03 0.00 0.00 0.00 0.00 025% 69 190 12.78 24.6375 3.51 0.119 25073.559 60344.3764 0 4812.547 6506.7066 45.00 36.40 101077.20 10350.00 35168.82 146596.02 15.43 0.71 0.03 0.52 16.69 24.24 7763.65 96050.00 51656.28 2991.66 6.450% 172 382 8.52 16.425 3.51 0.2042 50411.0502 41744.9171 6740.09727 -1768.62 -517.4983 45.00 36.40 101077.20 25800.00 70337.65 197214.85 9.53 1.42 0.08 0.52 11.55 47.57 14787.86 96050.00 216647.69 117364.24 6.8575% 400 573 4.26 8.2125 3.51 0.2894 75616.5753 31431.6521 21630.292 -7537.34 -6729.255 45.00 36.40 101077.20 60000.00 105506.47 266583.67 3.65 2.13 0.19 0.52 6.49 70.52 20999.62 96050.00 362555.52 193903.25 8.2100% 615 764 0 0 3.51 0.3746 100822.1 25097.8909 40453.3519 -12925.9 -12560.86 45.00 36.40 101077.20 92250.00 140675.29 334002.49 -2.21 2.84 0.29 0.52 1.44 93.46 26831.22 96050.00 499533.98 263462.89 9
Carbon offsetting
615 827 0 0 3.51 0.3746 109135.965 23360.5653 47187.047 -14677.7 -14312.61 45.00 36.40 101077.20 92250.00 179753.35 373080.55 -3.92 3.08 0.29 0.52 -0.03 100.15 28582.97 96050.00 540680.85 265531.70 9.9
provided Elec. & heating
TSC area m2
PV area m2
Heating (KWh/m2)
Lighting (KWh/m2)
Hot water (KWh/m2)
TSC fan power
(KWh/m2
)
generated Elec by PV
(KWh)
purchased from grid
elec (KWh)
Exported Elec (KWh)
Elec cost £
Energy cost Inc
FIT £
Wall Insulation price £/m2
Roof Insulation price £/m2
Total Insulation
price £
TSC cost £
PV Cost £Fabric cost
£
Operational CO2
(kgCO2/m2.yr)
PV ECO2
(kgCO2/m2.yr)
TSC ECO2
(kgCO2/m2.yr)
Insulation ECO2
(kgCO2/m2.yr)
Total CO2
(kgCO2/m2.yr)CO2 saving
%
Energy saving (A)
£
Value of external footprint
area £
PV(A) £
NPV £
Payback period (years)
0 0 0 18.73 32.85 3.51 0 0 0 0 11957.4 14270.36 43.70 35.00 97931.40 0.00 0.00 97931.40 21.59 0.00 0.00 0.44 22.03 0.00 0.00 0.00 0.00 025% 66 190 12.36 24.6375 3.51 0.1274 25073.559 60344.3764 0 4812.547 6463.0266 48.60 37.00 107665.20 9900.00 35168.82 152734.02 15.35 0.71 0.03 0.61 16.70 24.19 7807.33 101700.00 -40438.28 -95240.90 7.1550% 165 382 8.24 16.425 3.51 0.2098 50411.0502 41744.9171 6740.09727 -1768.62 -546.6183 48.60 37.00 107665.20 24750.00 70337.65 202752.85 9.48 1.42 0.08 0.61 11.59 47.41 14816.98 101700.00 124211.13 19389.68 7.275% 392 573 4.12 8.2125 3.51 0.2922 75616.5753 31431.6521 21630.292 -7537.34 -6743.815 48.60 37.00 107665.20 58800.00 105506.47 271971.67 3.63 2.13 0.19 0.61 6.56 70.25 21014.18 101700.00 269776.96 95736.69 8.5100% 605 764 0 0 3.51 0.3746 100822.1 25097.8909 40453.3519 -12925.9 -12560.86 48.60 37.00 107665.20 90750.00 140675.29 339090.49 -2.21 2.84 0.29 0.61 1.53 93.07 26831.22 101700.00 406413.42 165254.33 9.2
Carbon offsetting
605 830 0 0 3.51 0.3746 109663.829 23267.2027 47420.931 -14777.8 -14412.75 48.60 37.00 107665.20 90750.00 180622.78 379037.98 -3.99 3.09 0.29 0.61 0.00 100.01 28683.11 101700.00 449912.38 168805.81 10.05
provided Elec. & heating
TSC area m2
PV area m2
Heating (KWh/m2)
Lighting (KWh/m2)
Hot water (KWh/m2)
TSC fan power
(KWh/m2
)
generated Elec by PV
(KWh)
purchased from grid
elec (KWh)
Exported Elec (KWh)
Elec cost £
Energy cost Inc
FIT £
Wall Insulation price £/m2
Roof Insulation price £/m2
Total Insulation
price £
TSC cost £
PV Cost £Fabric cost
£
Operational CO2
(kgCO2/m2.yr)
PV ECO2
(kgCO2/m2.yr)
TSC ECO2
(kgCO2/m2.yr)
Insulation ECO2
(kgCO2/m2.yr)
Total CO2
(kgCO2/m2.yr)CO2 saving
%
Energy saving (A)
£
Value of external footprint
area £
PV(A) £
NPV £
Payback period (years)
0 0 0 18.73 32.85 3.51 0 0 0 0 11957.4 14270.36 43.70 35.00 97931.40 0.00 0.00 97931.40 21.59 0.00 0.00 0.44 22.03 0.00 0.00 0.00 0.00 025% 63 190 12 24.6375 3.51 0.1346 25073.559 60344.3764 0 4812.547 6425.5866 50.40 38.40 111672.00 9450.00 35168.82 156290.82 15.29 0.71 0.03 0.65 16.67 24.32 7844.77 107350.00 -132679.41 -191038.83 7.650% 160 382 8 16.425 3.51 0.2146 50411.0502 41744.9171 6740.09727 -1768.62 -571.5783 50.40 38.40 111672.00 24000.00 70337.65 206009.65 9.43 1.42 0.08 0.65 11.58 47.44 14841.94 107350.00 31676.86 -76401.39 7.4575% 382 573 4 8.2125 3.51 0.2946 75616.5753 31431.6521 21630.292 -7537.34 -6756.295 50.40 38.40 111672.00 57300.00 105506.47 274478.47 3.60 2.13 0.18 0.65 6.57 70.19 21026.66 107350.00 176949.55 402.48 8.6100% 595 764 0 0 3.51 0.3746 100822.1 25097.8909 40453.3519 -12925.9 -12560.86 50.40 38.40 111672.00 89250.00 140675.29 341597.29 -2.21 2.84 0.28 0.65 1.56 92.91 26831.22 107350.00 313292.87 69626.97 9.3
Carbon offsetting
595 832 0 0 3.51 0.3746 109795.795 23243.862 47629.4021 -14809.6 -14444.53 50.40 38.40 111672.00 89250.00 180840.13 381762.13 -4.04 3.10 0.28 0.65 -0.01 100.03 28714.89 107350.00 357538.40 73707.67 10.15
provided Elec. & heating
TSC area m2
PV area m2
Heating (KWh/m2)
Lighting (KWh/m2)
Hot water (KWh/m2)
TSC fan power
(KWh/m2
)
generated Elec by PV
(KWh)
purchased from grid
elec (KWh)
Exported Elec (KWh)
Elec cost £
Energy cost Inc
FIT £
Wall Insulation price £/m2
Roof Insulation price £/m2
Total Insulation
price £
TSC cost £
PV Cost £Fabric cost
£
Operational CO2
(kgCO2/m2.yr)
PV ECO2
(kgCO2/m2.yr)
TSC ECO2
(kgCO2/m2.yr)
Insulation ECO2
(kgCO2/m2.yr)
Total CO2
(kgCO2/m2.yr)CO2 saving
%
Energy saving (A)
£
Value of external footprint
area £
PV(A) £
NPV £
Payback period (years)
0 0 0 18.73 32.85 3.51 0 0 0 0 11957.4 14270.36 43.70 35.00 97931.40 0.00 0.00 97931.40 21.59 0.00 0.00 0.44 22.03 0.00 0.00 0.00 0.00 025% 60 190 11.64 24.6375 3.51 0.1418 25073.559 60344.3764 0 4812.547 6388.1466 52.20 39.00 115160.40 9000.00 35168.82 159329.22 15.22 0.71 0.03 0.7 16.66 24.41 7882.21 115825.00 -271480.82 -332878.64 850% 156 382 7.76 16.425 3.51 0.2194 50411.0502 41744.9171 6740.09727 -1768.62 -596.5383 52.20 39.00 115160.40 23400.00 70337.65 208898.05 9.39 1.42 0.07 0.7 11.58 47.43 14866.90 115825.00 -107417.70 -218384.34 7.6575% 377 573 3.88 8.2125 3.51 0.297 75616.5753 31431.6521 21630.292 -7537.34 -6768.775 52.20 39.00 115160.40 56550.00 105506.47 277216.87 3.58 2.13 0.18 0.7 6.59 70.07 21039.14 115825.00 37561.85 -141723.62 8.75100% 589 764 0 0 3.51 0.3746 100822.1 25097.8909 40453.3519 -12925.9 -12560.86 52.20 39.00 115160.40 88350.00 140675.29 344185.69 -2.21 2.84 0.28 0.7 1.61 92.70 26831.22 115825.00 173612.03 -72642.26 9.4
Carbon offsetting
589 834 0 0 3.51 0.3746 110059.727 23197.1807 47946.3441 -14868.6 -14503.6 52.20 39.00 115160.40 88350.00 181274.85 384785.25 -4.11 3.11 0.28 0.7 -0.03 100.12 28773.96 115825.00 219245.01 -67608.84 10.25
provided Elec. & heating
TSC area m2
PV area m2
Heating (KWh/m2)
Lighting (KWh/m2)
Hot water (KWh/m2)
TSC fan power
(KWh/m2
)
generated Elec by PV
(KWh)
purchased from grid
elec (KWh)
Exported Elec (KWh)
Elec cost £
Energy cost Inc
FIT £
Wall Insulation price £/m2
Roof Insulation price £/m2
Total Insulation
price £
TSC cost £
PV Cost £Fabric cost
£
Operational CO2
(kgCO2/m2.yr)
PV ECO2
(kgCO2/m2.yr)
TSC ECO2
(kgCO2/m2.yr)
Insulation ECO2
(kgCO2/m2.yr)
Total CO2
(kgCO2/m2.yr)CO2 saving
%
Energy saving (A)
£
Value of external footprint
area £
PV(A) £
NPV £
Payback period (years)
0 0 0 18.73 32.85 3.51 0 0 0 0 11957.4 14270.36 43.70 35.00 97931.40 0.00 0.00 97931.40 21.59 0.00 0.00 0.44 22.03 0.00 0.00 0.00 0.00 025% 57 190 11.25 24.6375 3.51 0.1496 25073.559 60344.3764 0 4812.547 6347.5866 63.00 43.00 136350.00 8550.00 35168.82 180068.82 15.15 0.71 0.03 1 16.88 23.38 7922.77 138142.50 -638354.31 -720491.73 10.6550% 153 382 7.5 16.425 3.51 0.2246 50411.0502 41744.9171 6740.09727 -1768.62 -623.5783 63.00 43.00 136350.00 22950.00 70337.65 229637.65 9.34 1.42 0.07 1 11.83 46.29 14893.94 138142.50 -474608.76 -606315.00 9.0575% 371 573 3.75 8.2125 3.51 0.2996 75616.5753 31431.6521 21630.292 -7537.34 -6782.295 63.00 43.00 136350.00 55650.00 105506.47 297506.47 3.56 2.13 0.18 1 6.87 68.83 21052.66 138142.50 -329946.78 -529521.85 9.75100% 582 764 0 0 3.51 0.3746 100822.1 25097.8909 40453.3519 -12925.9 -12560.86 63.00 43.00 136350.00 87300.00 140675.29 364325.29 -2.21 2.84 0.28 1 1.91 91.35 26831.22 138142.50 -194214.17 -460608.07 10.2
Carbon offsetting
582 847 0 0 3.51 0.3746 111775.287 22893.7521 49356.4674 -15223.3 -14858.29 63.00 43.00 136350.00 87300.00 184100.47 407750.47 -4.45 3.15 0.28 1 -0.03 100.12 29128.65 138142.50 -140249.85 -450068.92 10.95
provided Elec. & heating
TSC area m2
PV area m2
Heating (KWh/m2)
Lighting (KWh/m2)
Hot water (KWh/m2)
TSC fan power
(KWh/m2
)
generated Elec by PV
(KWh)
purchased from grid
elec (KWh)
Exported Elec (KWh)
Elec cost £
Energy cost Inc
FIT £
Wall Insulation price £/m2
Roof Insulation price £/m2
Total Insulation
price £
TSC cost £
PV Cost £Fabric cost
£
Operational CO2
(kgCO2/m2.yr)
PV ECO2
(kgCO2/m2.yr)
TSC ECO2
(kgCO2/m2.yr)
Insulation ECO2
(kgCO2/m2.yr)
Total CO2
(kgCO2/m2.yr)CO2 saving
%
Energy saving (A)
£
Value of external footprint
area £
PV(A) £
NPV £
Payback period (years)
0 0 0 18.73 32.85 3.51 0 0 0 0 11957.4 14270.36 43.70 35.00 97931.40 0.00 0.00 97931.40 21.59 0.00 0.00 0.44 22.03 0.00 0.00 0.00 0.00 025% 55 190 10.65 24.6375 3.51 0.1616 25073.559 60344.3764 0 4812.547 6285.1866 66.60 44.70 143650.80 8250.00 35168.82 187069.62 15.04 0.71 0.03 1.09 16.86 23.48 7985.17 149273.00 -820336.09 -909474.31 11.5550% 150 382 7.1 16.425 3.51 0.2326 50411.0502 41744.9171 6740.09727 -1768.62 -665.1783 66.60 44.70 143650.80 22500.00 70337.65 236488.45 9.26 1.42 0.07 1.09 11.85 46.23 14935.54 149273.00 -657079.11 -795636.16 9.575% 365 573 3.55 8.2125 3.51 0.3036 75616.5753 31431.6521 21630.292 -7537.34 -6803.095 66.60 44.70 143650.80 54750.00 105506.47 303907.27 3.52 2.13 0.17 1.09 6.92 68.61 21073.46 149273.00 -512905.70 -718881.58 10.05100% 575 764 0 0 3.51 0.3746 100822.1 25097.8909 40453.3519 -12925.9 -12560.86 66.60 44.70 143650.80 86250.00 140675.29 370576.09 -2.21 2.84 0.27 1.09 1.99 90.96 26831.22 149273.00 -377661.67 -650306.36 10.45
Carbon offsetting
575 850 0 0 3.51 0.3746 112039.219 22847.0708 49673.4094 -15282.4 -14917.36 66.60 44.70 143650.80 86250.00 184535.18 414435.98 -4.53 3.16 0.27 1.09 0.00 100.01 29187.72 149273.00 -322309.90 -638814.48 11.15
TSC + PV + 0.08 - 0.11
TSC + PV + 0.07 - 0.10
Office-London (City)
TSC + PV + 2010 notional building fabric
TSC + PV + 0.17 - 0.24
TSC + PV + 0.15 - 0.21
TSC + PV + 0.13 - 0.19
TSC + PV + 0.12 - 0.17
TSC + PV + 0.11 - 0.15
PV (current FiT) + Insulation + TSC

209
Table B. 16 Office - PV (future FiT) + improving the building fabric U-value down to 0.07-0.1 W/m2.K (mineral wool) + TSC – taking into account the rental loss/gain-City
(Y16*(1.03/0.005)*(1-(1.03/1.035)^25))+((Z6-Z16)*(1-(1+0.035)^-25))/0.035
provided Elec. & heating
TSC area m2
PV area m2
Heating (KWh/m2)
Lighting (KWh/m2)
Hot water (KWh/m2)
TSC fan power
(KWh/m2)
generated Elec by PV
(KWh)
purchased from grid
elec (KWh)
Exported Elec
(KWh)
Elec cost £
Energy cost Inc
FIT £
Wall Insulation price £/m2
Roof Insulation price £/m2
Total Insulation
price £
TSC cost £
PV Cost £Fabric cost
£
Operational CO2
(kgCO2/m2.yr)
PV ECO2
(kgCO2/m2.yr)
TSC ECO2
(kgCO2/m2.yr)
Insulation ECO2
(kgCO2/m2.yr)
Total CO2
(kgCO2/m2.yr)CO2 saving
%
Energy saving (A)
£
Value of external footprint
area £
PV(A) £
NPV £
Payback period (years)
0 0 0 18.73 32.85 3.51 0 0 0 0 11957.4 14270.36 43.70 35.00 97931.40 0.00 0.00 97931.40 21.59 0.00 0.00 0.44 22.03 0.00 0.00 88119.66 0.00 0.00 025% 75 190 14.04 24.6375 3.51 0.0938 25073.559 60344.3764 0 8448.213 10273.413 43.70 35.00 97931.40 11250.00 35168.82 144350.22 15.66 0.71 0.04 0.44 16.85 23.53 3996.95 88119.66 93884.21 47465.39 1250% 200 382 9.365 16.425 3.51 0.1873 50411.0502 41744.9171 6740.0973 5540.984 6879.984 43.70 35.00 97931.40 30000.00 70337.65 198269.05 9.68 1.42 0.09 0.44 11.64 47.17 7390.38 88119.66 173592.39 73254.74 14.1
75% 425 573 4.68 8.2125 3.51 0.281 75616.5753 31431.6521 21630.292 3427.068 4278.8282 43.70 35.00 97931.40 63750.00 105506.47 267187.87 3.73 2.13 0.20 0.44 6.50 70.48 9991.53 88119.66 234690.89 65434.42 17.75100% 650 764 0 0 3.51 0.3746 100822.1 25097.8909 40453.352 1693.304 2058.3439 43.70 35.00 97931.40 97500.00 140675.29 336106.69 -2.21 2.84 0.31 0.44 1.38 93.76 12212.02 88119.66 286847.80 48672.50 20.55
Carbon offsetting
650 823 0 0 3.51 0.3746 108608.1 23453.9279 46753.163 1179.658 1544.6976 43.70 35.00 97931.40 97500.00 178883.93 374315.33 -3.82 3.06 0.31 0.44 -0.01 100.03 12725.66 88119.66 298912.83 22528.90 23
Carbon offsetting
650 823 0 0 3.51 0.3746 108608.1 23453.9279 46753.163 -1391.77 -1026.726 43.70 35.00 97931.40 97500.00 178883.93 374315.33 -3.82 3.06 0.31 0.44 -0.01 100.03 15297.09 88119.66 359312.95 82929.02 18.95
provided Elec. & heating
TSC area m2
PV area m2
Heating (KWh/m2)
Lighting (KWh/m2)
Hot water (KWh/m2)
TSC fan power
(KWh/m2)
generated Elec by PV
(KWh)
purchased from grid
elec (KWh)
Exported Elec
(KWh)
Elec cost £
Energy cost Inc
FIT £
Wall Insulation price £/m2
Roof Insulation price £/m2
Total Insulation
price £
TSC cost £
PV Cost £Fabric cost
£
Operational CO2
(kgCO2/m2.yr)
PV ECO2
(kgCO2/m2.yr)
TSC ECO2
(kgCO2/m2.yr)
Insulation ECO2
(kgCO2/m2.yr)
Total CO2
(kgCO2/m2.yr)CO2 saving
%
Energy saving (A)
£
Value of external footprint
area £
PV(A) £
NPV £
Payback period (years)
0 0 0 18.73 32.85 3.51 0 0 0 0 11957.4 14270.36 43.70 35.00 97931.40 0.00 0.00 97931.40 21.59 0.00 0.00 0.44 22.03 0.00 0.00 0.00 0.00 025% 72 190 13.53 24.6375 3.51 0.104 25073.559 60344.3764 0 8448.213 10220.373 44.30 35.70 99418.20 10800.00 35168.82 145387.02 15.57 0.71 0.03 0.48 16.79 23.79 4049.99 90400.00 57546.61 10090.99 21.150% 185 382 9.025 16.425 3.51 0.1941 50411.0502 41744.9171 6740.0973 5540.984 6844.624 44.30 35.70 99418.20 27750.00 70337.65 197505.85 9.62 1.42 0.09 0.48 11.61 47.30 7425.74 90400.00 136839.50 37265.06 18.3575% 410 573 4.51 8.2125 3.51 0.2844 75616.5753 31431.6521 21630.292 3427.068 4261.1482 44.30 35.70 99418.20 61500.00 105506.47 266424.67 3.70 2.13 0.19 0.48 6.51 70.47 10009.21 90400.00 197522.72 29029.45 21.3100% 630 764 0 0 3.51 0.3746 100822.1 25097.8909 40453.352 1693.304 2058.3439 44.30 35.70 99418.20 94500.00 140675.29 334593.49 -2.21 2.84 0.30 0.48 1.41 93.61 12212.02 90400.00 249264.34 12602.25 23.75
Carbon offsetting
630 825 0 0 3.51 0.3746 108872.033 23407.2466 46970.105 1163.36 1528.3998 44.30 35.70 99418.20 94500.00 179318.64 373236.84 -3.87 3.07 0.30 0.48 -0.02 100.09 12741.96 90400.00 261712.19 -13593.26 26.25
Carbon offsetting
630 825 0 0 3.51 0.3746 108872.033 23407.2466 46970.105 -1420 -1054.956 44.30 35.70 99418.20 94500.00 179318.64 373236.84 -3.87 3.07 0.30 0.48 -0.02 100.09 15325.32 90400.00 275566.62 261.18 21.3
provided Elec. & heating
TSC area m2
PV area m2
Heating (KWh/m2)
Lighting (KWh/m2)
Hot water (KWh/m2)
TSC fan power
(KWh/m2)
generated Elec by PV
(KWh)
purchased from grid
elec (KWh)
Exported Elec
(KWh)
Elec cost £
Energy cost Inc
FIT £
Wall Insulation price £/m2
Roof Insulation price £/m2
Total Insulation
price £
TSC cost £
PV Cost £Fabric cost
£
Operational CO2
(kgCO2/m2.yr)
PV ECO2
(kgCO2/m2.yr)
TSC ECO2
(kgCO2/m2.yr)
Insulation ECO2
(kgCO2/m2.yr)
Total CO2
(kgCO2/m2.yr)CO2 saving
%
Energy saving (A)
£
Value of external footprint
area £
PV(A) £
NPV £
Payback period (years)
0 0 0 18.73 32.85 3.51 0 0 0 0 11957.4 14270.36 43.70 35.00 97931.40 0.00 0.00 97931.40 21.59 0.00 0.00 0.44 22.03 0.00 0.00 0.00 0.00 025% 69 190 12.78 24.6375 3.51 0.119 25073.559 60344.3764 0 8448.213 10142.373 45.00 36.40 101077.20 10350.00 35168.82 146596.02 15.43 0.71 0.03 0.52 16.69 24.24 4127.99 96050.00 -33741.80 -82406.4350% 172 382 8.52 16.425 3.51 0.2042 50411.0502 41744.9171 6740.0973 5540.984 6792.104 45.00 36.40 101077.20 25800.00 70337.65 197214.85 9.53 1.42 0.08 0.52 11.55 47.57 7478.26 96050.00 44952.59 -54330.8675% 400 573 4.26 8.2125 3.51 0.2894 75616.5753 31431.6521 21630.292 3427.068 4235.1482 45.00 36.40 101077.20 60000.00 105506.47 266583.67 3.65 2.13 0.19 0.52 6.49 70.52 10035.21 96050.00 105012.87 -63639.40100% 615 764 0 0 3.51 0.3746 100822.1 25097.8909 40453.352 1693.304 2058.3439 45.00 36.40 101077.20 92250.00 140675.29 334002.49 -2.21 2.84 0.29 0.52 1.44 93.46 12212.02 96050.00 156143.78 -79927.31
Carbon offsetting
615 827 0 0 3.51 0.3746 109135.965 23360.5653 47187.047 1147.062 1512.102 45.00 36.40 101077.20 92250.00 179753.35 373080.55 -3.92 3.08 0.29 0.52 -0.03 100.15 12758.26 96050.00 168974.45 -106174.71
Carbon offsetting
615 827 0 0 3.51 0.3746 109135.965 23360.5653 47187.047 -1448.23 -1083.186 45.00 36.40 101077.20 92250.00 179753.35 373080.55 -3.92 3.08 0.29 0.52 -0.03 100.15 15353.55 96050.00 229935.10 -45214.05
provided Elec. & heating
TSC area m2
PV area m2
Heating (KWh/m2)
Lighting (KWh/m2)
Hot water (KWh/m2)
TSC fan power
(KWh/m2)
generated Elec by PV
(KWh)
purchased from grid
elec (KWh)
Exported Elec
(KWh)
Elec cost £
Energy cost Inc
FIT £
Wall Insulation price £/m2
Roof Insulation price £/m2
Total Insulation
price £
TSC cost £
PV Cost £Fabric cost
£
Operational CO2
(kgCO2/m2.yr)
PV ECO2
(kgCO2/m2.yr)
TSC ECO2
(kgCO2/m2.yr)
Insulation ECO2
(kgCO2/m2.yr)
Total CO2
(kgCO2/m2.yr)CO2 saving
%
Energy saving (A)
£
Value of external footprint
area £
PV(A) £
NPV £
Payback period (years)
0 0 0 18.73 32.85 3.51 0 0 0 0 11957.4 14270.36 43.70 35.00 97931.40 0.00 0.00 97931.40 21.59 0.00 0.00 0.44 22.03 0.00 0.00 0.00 0.00 025% 66 190 12.36 24.6375 3.51 0.1274 25073.559 60344.3764 0 8448.213 10098.693 48.60 37.00 107665.20 9900.00 35168.82 152734.02 15.35 0.71 0.03 0.61 16.70 24.19 4171.67 101700.00 -125836.36 -180638.9950% 165 382 8.24 16.425 3.51 0.2098 50411.0502 41744.9171 6740.0973 5540.984 6762.984 48.60 37.00 107665.20 24750.00 70337.65 202752.85 9.48 1.42 0.08 0.61 11.59 47.41 7507.38 101700.00 -47483.97 -152305.4275% 392 573 4.12 8.2125 3.51 0.2922 75616.5753 31431.6521 21630.292 3427.068 4220.5882 48.60 37.00 107665.20 58800.00 105506.47 271971.67 3.63 2.13 0.19 0.61 6.56 70.25 10049.77 101700.00 12234.31 -161805.96100% 605 764 0 0 3.51 0.3746 100822.1 25097.8909 40453.352 1693.304 2058.3439 48.60 37.00 107665.20 90750.00 140675.29 339090.49 -2.21 2.84 0.29 0.61 1.53 93.07 12212.02 101700.00 63023.23 -178135.87
Carbon offsetting
605 830 0 0 3.51 0.3746 109663.829 23267.2027 47420.931 1123.466 1488.5065 48.60 37.00 107665.20 90750.00 180622.78 379037.98 -3.99 3.09 0.29 0.61 0.00 100.01 12781.85 101700.00 76408.12 -204698.45
Carbon offsetting
605 830 0 0 3.51 0.3746 109663.829 23267.2027 47420.931 -1484.68 -1119.645 48.60 37.00 107665.20 90750.00 180622.78 379037.98 -3.99 3.09 0.29 0.61 0.00 100.01 15390.00 101700.00 137670.94 -143435.64
provided Elec. & heating
TSC area m2
PV area m2
Heating (KWh/m2)
Lighting (KWh/m2)
Hot water (KWh/m2)
TSC fan power
(KWh/m2)
generated Elec by PV
(KWh)
purchased from grid
elec (KWh)
Exported Elec
(KWh)
Elec cost £
Energy cost Inc
FIT £
Wall Insulation price £/m2
Roof Insulation price £/m2
Total Insulation
price £
TSC cost £
PV Cost £Fabric cost
£
Operational CO2
(kgCO2/m2.yr)
PV ECO2
(kgCO2/m2.yr)
TSC ECO2
(kgCO2/m2.yr)
Insulation ECO2
(kgCO2/m2.yr)
Total CO2
(kgCO2/m2.yr)CO2 saving
%
Energy saving (A)
£
Value of external footprint
area £
PV(A) £
NPV £
Payback period (years)
0 0 0 18.73 32.85 3.51 0 0 0 0 11957.4 14270.36 43.70 35.00 97931.40 0.00 0.00 97931.40 21.59 0.00 0.00 0.44 22.03 0.00 0.00 0.00 0.00 025% 63 190 12 24.6375 3.51 0.1346 25073.559 60344.3764 0 8448.213 10061.253 50.40 38.40 111672.00 9450.00 35168.82 156290.82 15.29 0.71 0.03 0.65 16.67 24.32 4209.11 107350.00 -218077.49 -276436.9250% 160 382 8 16.425 3.51 0.2146 50411.0502 41744.9171 6740.0973 5540.984 6738.024 50.40 38.40 111672.00 24000.00 70337.65 206009.65 9.43 1.42 0.08 0.65 11.58 47.44 7532.34 107350.00 -140018.24 -248096.4975% 382 573 4 8.2125 3.51 0.2946 75616.5753 31431.6521 21630.292 3427.068 4208.1082 50.40 38.40 111672.00 57300.00 105506.47 274478.47 3.60 2.13 0.18 0.65 6.57 70.19 10062.25 107350.00 -80593.10 -257140.17100% 595 764 0 0 3.51 0.3746 100822.1 25097.8909 40453.352 1693.304 2058.3439 50.40 38.40 111672.00 89250.00 140675.29 341597.29 -2.21 2.84 0.28 0.65 1.56 92.91 12212.02 107350.00 -30097.33 -273763.23
Carbon offsetting
595 832 0 0 3.51 0.3746 109795.795 23243.862 47629.402 1110.818 1475.8576 50.40 38.40 111672.00 89250.00 180840.13 381762.13 -4.04 3.10 0.28 0.65 -0.01 100.03 12794.50 107350.00 -16415.32 -300246.06
Carbon offsetting
595 832 0 0 3.51 0.3746 109795.795 23243.862 47629.402 -1508.8 -1143.76 50.40 38.40 111672.00 89250.00 180840.13 381762.13 -4.04 3.10 0.28 0.65 -0.01 100.03 15414.12 107350.00 45116.81 -238713.92
provided Elec. & heating
TSC area m2
PV area m2
Heating (KWh/m2)
Lighting (KWh/m2)
Hot water (KWh/m2)
TSC fan power
(KWh/m2)
generated Elec by PV
(KWh)
purchased from grid
elec (KWh)
Exported Elec
(KWh)
Elec cost £
Energy cost Inc
FIT £
Wall Insulation price £/m2
Roof Insulation price £/m2
Total Insulation
price £
TSC cost £
PV Cost £Fabric cost
£
Operational CO2
(kgCO2/m2.yr)
PV ECO2
(kgCO2/m2.yr)
TSC ECO2
(kgCO2/m2.yr)
Insulation ECO2
(kgCO2/m2.yr)
Total CO2
(kgCO2/m2.yr)CO2 saving
%
Energy saving (A)
£
Value of external footprint
area £
PV(A) £
NPV £
Payback period (years)
0 0 0 18.73 32.85 3.51 0 0 0 0 11957.4 14270.36 43.70 35.00 97931.40 0.00 0.00 97931.40 21.59 0.00 0.00 0.44 22.03 0.00 0.00 0.00 0.00 025% 60 190 11.64 24.6375 3.51 0.1418 25073.559 60344.3764 0 8448.213 10023.813 52.20 39.00 115160.40 9000.00 35168.82 159329.22 15.22 0.71 0.03 0.7 16.66 24.41 4246.55 115825.00 -356878.90 -418276.7350% 156 382 7.76 16.425 3.51 0.2194 50411.0502 41744.9171 6740.0973 5540.984 6713.064 52.20 39.00 115160.40 23400.00 70337.65 208898.05 9.39 1.42 0.07 0.7 11.58 47.43 7557.30 115825.00 -279112.79 -390079.4475% 377 573 3.88 8.2125 3.51 0.297 75616.5753 31431.6521 21630.292 3427.068 4195.6282 52.20 39.00 115160.40 56550.00 105506.47 277216.87 3.58 2.13 0.18 0.7 6.59 70.07 10074.73 115825.00 -219980.79 -399266.27100% 589 764 0 0 3.51 0.3746 100822.1 25097.8909 40453.352 1693.304 2058.3439 52.20 39.00 115160.40 88350.00 140675.29 344185.69 -2.21 2.84 0.28 0.7 1.61 92.70 12212.02 115825.00 -169778.17 -416032.46
Carbon offsetting
589 834 0 0 3.51 0.3746 110059.727 23197.1807 47946.344 1090.02 1455.0598 52.20 39.00 115160.40 88350.00 181274.85 384785.25 -4.11 3.11 0.28 0.7 -0.03 100.12 12815.30 115825.00 -155607.64 -442461.49
Carbon offsetting
589 834 0 0 3.51 0.3746 110059.727 23197.1807 47946.344 -1547.03 -1181.989 52.20 39.00 115160.40 88350.00 181274.85 384785.25 -4.11 3.11 0.28 0.7 -0.03 100.12 15452.35 115825.00 -93666.05 -380519.90
provided Elec. & heating
TSC area m2
PV area m2
Heating (KWh/m2)
Lighting (KWh/m2)
Hot water (KWh/m2)
TSC fan power
(KWh/m2)
generated Elec by PV
(KWh)
purchased from grid
elec (KWh)
Exported Elec
(KWh)
Elec cost £
Energy cost Inc
FIT £
Wall Insulation price £/m2
Roof Insulation price £/m2
Total Insulation
price £
TSC cost £
PV Cost £Fabric cost
£
Operational CO2
(kgCO2/m2.yr)
PV ECO2
(kgCO2/m2.yr)
TSC ECO2
(kgCO2/m2.yr)
Insulation ECO2
(kgCO2/m2.yr)
Total CO2
(kgCO2/m2.yr)CO2 saving
%
Energy saving (A)
£
Value of external footprint
area £
PV(A) £
NPV £
Payback period (years)
0 0 0 18.73 32.85 3.51 0 0 0 0 11957.4 14270.36 43.70 35.00 97931.40 0.00 0.00 97931.40 21.59 0.00 0.00 0.44 22.03 0.00 0.00 0.00 0.00 025% 57 190 11.25 24.6375 3.51 0.1496 25073.559 60344.3764 0 8448.213 9983.2527 63.00 43.00 136350.00 8550.00 35168.82 180068.82 15.15 0.71 0.03 1 16.88 23.38 4287.11 138142.50 -723752.39 -805889.8150% 153 382 7.5 16.425 3.51 0.2246 50411.0502 41744.9171 6740.0973 5540.984 6686.024 63.00 43.00 136350.00 22950.00 70337.65 229637.65 9.34 1.42 0.07 1 11.83 46.29 7584.34 138142.50 -646303.85 -778010.1075% 371 573 3.75 8.2125 3.51 0.2996 75616.5753 31431.6521 21630.292 3427.068 4182.1082 63.00 43.00 136350.00 55650.00 105506.47 297506.47 3.56 2.13 0.18 1 6.87 68.83 10088.25 138142.50 -587489.43 -787064.50100% 582 764 0 0 3.51 0.3746 100822.1 25097.8909 40453.352 1693.304 2058.3439 63.00 43.00 136350.00 87300.00 140675.29 364325.29 -2.21 2.84 0.28 1 1.91 91.35 12212.02 138142.50 -537604.37 -803998.26
Carbon offsetting
582 847 0 0 3.51 0.3746 111775.287 22893.7521 49356.467 984.0843 1349.1243 63.00 43.00 136350.00 87300.00 184100.47 407750.47 -4.45 3.15 0.28 1 -0.03 100.12 12921.24 138142.50 -520945.52 -830764.60
Carbon offsetting
582 847 0 0 3.51 0.3746 111775.287 22893.7521 49356.467 -1730.52 -1365.481 63.00 43.00 136350.00 87300.00 184100.47 407750.47 -4.45 3.15 0.28 1 -0.03 100.12 15635.84 138142.50 -457182.21 -767001.28
provided Elec. & heating
TSC area m2
PV area m2
Heating (KWh/m2)
Lighting (KWh/m2)
Hot water (KWh/m2)
TSC fan power
(KWh/m2)
generated Elec by PV
(KWh)
purchased from grid
elec (KWh)
Exported Elec
(KWh)
Elec cost £
Energy cost Inc
FIT £
Wall Insulation price £/m2
Roof Insulation price £/m2
Total Insulation
price £
TSC cost £
PV Cost £Fabric cost
£
Operational CO2
(kgCO2/m2.yr)
PV ECO2
(kgCO2/m2.yr)
TSC ECO2
(kgCO2/m2.yr)
Insulation ECO2
(kgCO2/m2.yr)
Total CO2
(kgCO2/m2.yr)CO2 saving
%
Energy saving (A)
£
Value of external footprint
area £
PV(A) £
NPV £
Payback period (years)
0 0 0 18.73 32.85 3.51 0 0 0 0 11957.4 14270.36 43.70 35.00 97931.40 0.00 0.00 97931.40 21.59 0.00 0.00 0.44 22.03 0.00 0.00 0.00 0.00 025% 55 190 10.65 24.6375 3.51 0.1616 25073.559 60344.3764 0 8448.213 9920.8527 66.60 44.70 143650.80 8250.00 35168.82 187069.62 15.04 0.71 0.03 1.09 16.86 23.48 4349.51 149273.00 -905734.18 -994872.4050% 150 382 7.1 16.425 3.51 0.2326 50411.0502 41744.9171 6740.0973 5540.984 6644.424 66.60 44.70 143650.80 22500.00 70337.65 236488.45 9.26 1.42 0.07 1.09 11.85 46.23 7625.94 149273.00 -828774.21 -967331.2675% 365 573 3.55 8.2125 3.51 0.3036 75616.5753 31431.6521 21630.292 3427.068 4161.3082 66.60 44.70 143650.80 54750.00 105506.47 303907.27 3.52 2.13 0.17 1.09 6.92 68.61 10109.05 149273.00 -770448.35 -976424.22100% 575 764 0 0 3.51 0.3746 100822.1 25097.8909 40453.352 1693.304 2058.3439 66.60 44.70 143650.80 86250.00 140675.29 370576.09 -2.21 2.84 0.27 1.09 1.99 90.96 12212.02 149273.00 -721051.87 -993696.56
Carbon offsetting
575 850 0 0 3.51 0.3746 112039.219 22847.0708 49673.409 963.2865 1328.3265 66.60 44.70 143650.80 86250.00 184535.18 414435.98 -4.53 3.16 0.27 1.09 0.00 100.01 12942.03 149273.00 -703904.50 -1020409.09
Carbon offsetting
575 850 0 0 3.51 0.3746 112039.219 22847.0708 49673.409 -1768.75 -1403.711 66.60 44.70 143650.80 86250.00 184535.18 414435.98 -4.53 3.16 0.27 1.09 0.00 100.01 15674.07 149273.00 -639731.73 -956236.31
TSC + PV + 0.08 - 0.11
TSC + PV + 0.07 - 0.10
Office-London (city)
TSC + PV + 2010 notional building fabric
TSC + PV + 0.17 - 0.24
TSC + PV + 0.15 - 0.21
TSC + PV + 0.13 - 0.19
TSC + PV + 0.12 - 0.17
TSC + PV + 0.11 - 0.15
PV (future FiT) + Insulation + TSC

210
Table B. 17 Office - PV (current FiT) + improving the building fabric U-value down to 0.07-0.1 W/m2.K (mineral wool) – taking into account the rental loss/gain- West-End
provided Elec. by PV
PV area m2
Heating (KWh/m2)
Lighting (KWh/m2)
Hot water (KWh/m2)
generated Elec by PV
(KWh)
purchased from grid
elec (KWh)
Exported Elec
(KWh)
Elec Cost £
Energy cost Inc FIT
Wall Insulation price £/m2
Roof Insulation price £/m2
Total Insulation
price £
PV cost £
Fabric cost £
Operational CO2
(kgCO2/m2.yr)
PV ECO2
(kgCO2/m2.yr)
Insulation ECO2
(kgCO2/m2.yr)
Total CO2
(kgCO2/m2.yr)CO2 saving
%
Energy saving (A)
£
Value of external footprint
area £
PV(A) £
NPV £
Payback period (years)
0 0 18.73 32.85 3.51 0 0 0 11957.4 14270.36 43.70 35.00 97931.40 0.00 97931.40 21.59 0.00 0.44 22.03 0.00 0.00 134129.04 0.00 0.00 025% 190 18.73 24.6375 3.51 25073.559 60344.37639 0 4812.547 7125.50664 43.70 35.00 97931.40 35168.82 133100.22 16.53 0.71 0.44 17.68 19.75 7144.85 134129.04 167825.31 132656.49 550% 382 18.73 16.425 3.51 50411.0502 41744.91709 6740.097 -1768.62 544.341737 43.70 35.00 97931.40 70337.65 168269.05 11.42 1.42 0.44 13.28 39.71 13726.02 134129.04 322410.16 252072.52 5.275% 573 18.73 8.2125 3.51 75616.5753 31431.65212 21630.29 -7537.34 -5224.3753 43.70 35.00 97931.40 105506.47 203437.87 6.34 2.13 0.44 8.91 59.57 19494.74 134129.04 457911.44 352404.97 5.5100% 764 18.73 0 3.51 100822.1004 25097.89092 40453.35 -12925.9 -10612.941 43.70 35.00 97931.40 140675.29 238606.69 1.26 2.84 0.44 4.54 79.38 24883.30 134129.04 584483.34 443808.05 5.75
Carbon offsetting 964 18.73 0 3.51 127215.3204 20513.36376 62294.1 -18377.6 -16064.625 43.70 35.00 97931.40 209531.12 307462.52 -4.07 3.59 0.44 -0.04 100.20 30334.99 134129.04 712537.85 503006.73 7
provided Elec. by PV
PV area m2
Heating (KWh/m2)
Lighting (KWh/m2)
Hot water (KWh/m2)
generated Elec by PV
(KWh)
purchased from grid
elec (KWh)
Exported Elec
(KWh)
Elec Cost £
Energy cost Inc FIT
Wall Insulation price £/m2
Roof Insulation price £/m2
Total Insulation
price £
PV cost £
Fabric cost £
Operational CO2
(kgCO2/m2.yr)
PV ECO2
(kgCO2/m2.yr)
Insulation ECO2
(kgCO2/m2.yr)
Total CO2
(kgCO2/m2.yr)CO2 saving
%
Energy saving (A)
£
Value of external footprint
area £
PV(A) £
NPV £
Payback period (years)
0 0 18.73 32.85 3.51 0 0 0 11957.4 14270.36 43.70 35.00 97931.40 0.00 97931.40 21.59 0.00 0.44 22.03 0.00 0.00 0.00 0.00 025% 190 18.05 24.6375 3.51 25073.559 60344.37639 0 4812.547 7054.78664 44.30 35.70 99418.20 35168.82 134587.02 16.40 0.71 0.48 17.59 20.17 7215.57 137600.00 112279.78 75624.15 5.1550% 382 18.05 16.425 3.51 50411.0502 41744.91709 6740.097 -1768.62 473.621737 44.30 35.70 99418.20 70337.65 169755.85 11.29 1.42 0.48 13.19 40.13 13796.74 137600.00 266864.63 195040.18 5.375% 573 18.05 8.2125 3.51 75616.5753 31431.65212 21630.29 -7537.34 -5295.0953 44.30 35.70 99418.20 105506.47 204924.67 6.20 2.13 0.48 8.82 59.98 19565.46 137600.00 402365.90 295372.63 5.55100% 764 18.05 0 3.51 100822.1004 25097.89092 40453.35 -12925.9 -10683.661 44.30 35.70 99418.20 140675.29 240093.49 1.13 2.84 0.48 4.45 79.79 24954.02 137600.00 528937.80 386775.71 5.8
Carbon offsetting 960 18.05 0 3.51 126687.456 20588.5376 61840.48 -18270.1 -16027.867 44.30 35.70 99418.20 208661.69 308079.89 -4.10 3.57 0.48 -0.04 100.20 30298.23 137600.00 654467.77 444319.28 7.1
provided Elec. by PV
PV area m2
Heating (KWh/m2)
Lighting (KWh/m2)
Hot water (KWh/m2)
generated Elec by PV
(KWh)
purchased from grid
elec (KWh)
Exported Elec
(KWh)
Elec Cost £
Energy cost Inc FIT
Wall Insulation price £/m2
Roof Insulation price £/m2
Total Insulation
price £
PV cost £
Fabric cost £
Operational CO2
(kgCO2/m2.yr)
PV ECO2
(kgCO2/m2.yr)
Insulation ECO2
(kgCO2/m2.yr)
Total CO2
(kgCO2/m2.yr)CO2 saving
%
Energy saving (A)
£
Value of external footprint
area £
PV(A) £
NPV £
Payback period (years)
0 0 18.73 32.85 3.51 0 0 0 11957.4 14270.36 43.70 35.00 97931.40 0.00 97931.40 21.59 0.00 0.44 22.03 0.00 0.00 0.00 0.00 025% 190 17.05 24.6375 3.51 25073.559 60344.37639 0 4812.547 6950.78664 45.00 36.40 101077.20 35168.82 136246.02 16.21 0.71 0.52 17.43 20.88 7319.57 146200.00 -27018.39 -65333.02 5.350% 382 17.05 16.425 3.51 50411.0502 41744.91709 6740.097 -1768.62 369.621737 45.00 36.40 101077.20 70337.65 171414.85 11.09 1.42 0.52 13.03 40.84 13900.74 146200.00 127566.45 54083.01 5.475% 573 17.05 8.2125 3.51 75616.5753 31431.65212 21630.29 -7537.34 -5399.0953 45.00 36.40 101077.20 105506.47 206583.67 6.01 2.13 0.52 8.66 60.69 19669.46 146200.00 263067.73 154415.46 5.6100% 764 17.05 0 3.51 100822.1004 25097.89092 40453.35 -12925.9 -10787.661 45.00 36.40 101077.20 140675.29 241752.49 0.93 2.84 0.52 4.30 80.50 25058.02 146200.00 389639.63 245818.54 5.85
Carbon offsetting 954 17.05 0 3.51 125895.6594 20701.29836 61160.05 -18108.9 -15970.651 45.00 36.40 101077.20 207357.56 308434.76 -4.13 3.55 0.52 -0.06 100.28 30241.01 146200.00 511382.79 300879.43 7.1
provided Elec. by PV
PV area m2
Heating (KWh/m2)
Lighting (KWh/m2)
Hot water (KWh/m2)
generated Elec by PV
(KWh)
purchased from grid
elec (KWh)
Exported Elec
(KWh)
Elec Cost £
Energy cost Inc FIT
Wall Insulation price £/m2
Roof Insulation price £/m2
Total Insulation
price £
PV cost £
Fabric cost £
Operational CO2
(kgCO2/m2.yr)
PV ECO2
(kgCO2/m2.yr)
Insulation ECO2
(kgCO2/m2.yr)
Total CO2
(kgCO2/m2.yr)CO2 saving
%
Energy saving (A)
£
Value of external footprint
area £
PV(A) £
NPV £
Payback period (years)
0 0 18.73 32.85 3.51 0 0 0 11957.4 14270.36 43.70 35.00 97931.40 0.00 97931.40 21.59 0.00 0.44 22.03 0.00 0.00 0.00 0.00 025% 190 16.49 24.6375 3.51 25073.559 60344.37639 0 4812.547 6892.54664 48.60 37.00 107665.20 35168.82 142834.02 16.10 0.71 0.61 17.41 20.97 7377.81 154800.00 -167391.42 -212294.04 6.1550% 382 16.49 16.425 3.51 50411.0502 41744.91709 6740.097 -1768.62 311.381737 48.60 37.00 107665.20 70337.65 178002.85 10.98 1.42 0.61 13.02 40.93 13958.98 154800.00 -12806.57 -92878.02 5.8575% 573 16.49 8.2125 3.51 75616.5753 31431.65212 21630.29 -7537.34 -5457.3353 48.60 37.00 107665.20 105506.47 213171.67 5.90 2.13 0.61 8.64 60.78 19727.70 154800.00 122694.70 7454.43 5.95100% 764 16.49 0 3.51 100822.1004 25097.89092 40453.35 -12925.9 -10845.901 48.60 37.00 107665.20 140675.29 248340.49 0.82 2.84 0.61 4.28 80.59 25116.26 154800.00 249266.61 98857.51 6.1
Carbon offsetting 952 16.49 0 3.51 125631.7272 20738.88528 60933.24 -18055.2 -15975.152 48.60 37.00 107665.20 206922.84 314588.04 -4.19 3.54 0.61 -0.04 100.16 30245.51 154800.00 369747.49 153090.85 7.3
provided Elec. by PV
PV area m2
Heating (KWh/m2)
Lighting (KWh/m2)
Hot water (KWh/m2)
generated Elec by PV
(KWh)
purchased from grid
elec (KWh)
Exported Elec
(KWh)
Elec Cost £
Energy cost Inc FIT
Wall Insulation price £/m2
Roof Insulation price £/m2
Total Insulation
price £
PV cost £
Fabric cost £
Operational CO2
(kgCO2/m2.yr)
PV ECO2
(kgCO2/m2.yr)
Insulation ECO2
(kgCO2/m2.yr)
Total CO2
(kgCO2/m2.yr)CO2 saving
%
Energy saving (A)
£
Value of external footprint
area £
PV(A) £
NPV £
Payback period (years)
0 0 18.73 32.85 3.51 0 0 0 11957.4 14270.36 43.70 35.00 97931.40 0.00 97931.40 21.59 0.00 0.44 22.03 0.00 0.00 0.00 0.00 025% 190 16 24.6375 3.51 25073.559 60344.37639 0 4812.547 6841.58664 50.40 38.40 111672.00 35168.82 146840.82 16.00 0.71 0.65 17.36 21.22 7428.77 163400.00 -307935.45 -356844.87 6.7550% 382 16 16.425 3.51 50411.0502 41744.91709 6740.097 -1768.62 260.421737 50.40 38.40 111672.00 70337.65 182009.65 10.89 1.42 0.65 12.96 41.18 14009.94 163400.00 -153350.60 -237428.85 6.175% 573 16 8.2125 3.51 75616.5753 31431.65212 21630.29 -7537.34 -5508.2953 50.40 38.40 111672.00 105506.47 217178.47 5.80 2.13 0.65 8.58 61.03 19778.66 163400.00 -17849.32 -137096.39 6.15100% 764 16 0 3.51 100822.1004 25097.89092 40453.35 -12925.9 -10896.861 50.40 38.40 111672.00 140675.29 252347.29 0.73 2.84 0.65 4.22 80.85 25167.22 163400.00 108722.58 -45693.32 6.25
Carbon offsetting 949 16 0 3.51 125103.8628 20814.05912 60479.62 -17947.7 -15918.635 50.40 38.40 111672.00 206053.42 317725.42 -4.18 3.53 0.65 0.00 99.98 30188.99 163400.00 226678.93 6884.91 7.45
provided Elec. by PV
PV area m2
Heating (KWh/m2)
Lighting (KWh/m2)
Hot water (KWh/m2)
generated Elec by PV
(KWh)
purchased from grid
elec (KWh)
Exported Elec
(KWh)
Elec Cost £
Energy cost Inc FIT
Wall Insulation price £/m2
Roof Insulation price £/m2
Total Insulation
price £
PV cost £
Fabric cost £
Operational CO2
(kgCO2/m2.yr)
PV ECO2
(kgCO2/m2.yr)
Insulation ECO2
(kgCO2/m2.yr)
Total CO2
(kgCO2/m2.yr)CO2 saving
%
Energy saving (A)
£
Value of external footprint
area £
PV(A) £
NPV £
Payback period (years)
0 0 18.73 32.85 3.51 0 0 0 11957.4 14270.36 43.70 35.00 97931.40 0.00 97931.40 21.59 0.00 0.44 22.03 0.00 0.00 0.00 0.00 025% 190 15.52 24.6375 3.51 25073.559 60344.37639 0 4812.547 6791.66664 52.20 39.00 115160.40 35168.82 150329.22 15.91 0.71 0.7 17.31 21.42 7478.69 176300.00 -519374.42 -571772.24 7.1550% 382 15.52 16.425 3.51 50411.0502 41744.91709 6740.097 -1768.62 210.501737 52.20 39.00 115160.40 70337.65 185498.05 10.79 1.42 0.7 12.91 41.38 14059.86 176300.00 -364789.57 -452356.22 6.3575% 573 15.52 8.2125 3.51 75616.5753 31431.65212 21630.29 -7537.34 -5558.2153 52.20 39.00 115160.40 105506.47 220666.87 5.71 2.13 0.7 8.54 61.23 19828.58 176300.00 -229288.29 -352023.76 6.3100% 764 15.52 0 3.51 100822.1004 25097.89092 40453.35 -12925.9 -10946.781 52.20 39.00 115160.40 140675.29 255835.69 0.63 2.84 0.7 4.18 81.05 25217.14 176300.00 -102716.39 -260620.68 6.4
Carbon offsetting 946 15.52 0 3.51 124839.9306 20851.64604 60252.81 -17893.9 -15914.816 52.20 39.00 115160.40 205618.71 320779.11 -4.22 3.52 0.7 0.00 99.99 30185.18 176300.00 13977.69 -208870.02 7.55
provided Elec. by PV
PV area m2
Heating (KWh/m2)
Lighting (KWh/m2)
Hot water (KWh/m2)
generated Elec by PV
(KWh)
purchased from grid
elec (KWh)
Exported Elec
(KWh)
Elec Cost £
Energy cost Inc FIT
Wall Insulation price £/m2
Roof Insulation price £/m2
Total Insulation
price £
PV cost £
Fabric cost £
Operational CO2
(kgCO2/m2.yr)
PV ECO2
(kgCO2/m2.yr)
Insulation ECO2
(kgCO2/m2.yr)
Total CO2
(kgCO2/m2.yr)CO2 saving
%
Energy saving (A)
£
Value of external footprint
area £
PV(A) £
NPV £
Payback period (years)
0 0 18.73 32.85 3.51 0 0 0 11957.4 14270.36 43.70 35.00 97931.40 0.00 97931.40 21.59 0.00 0.44 22.03 0.00 0.00 0.00 0.00 025% 190 15 24.6375 3.51 25073.559 60344.37639 0 4812.547 6737.58664 63.00 43.00 136350.00 35168.82 171518.82 15.80 0.71 1 17.51 20.52 7532.77 210270.00 -1077981.18 -1151568.61 1050% 382 15 16.425 3.51 50411.0502 41744.91709 6740.097 -1768.62 156.421737 63.00 43.00 136350.00 70337.65 206687.65 10.69 1.42 1 13.11 40.48 14113.94 210270.00 -923396.34 -1032152.58 7.8575% 573 15 8.2125 3.51 75616.5753 31431.65212 21630.29 -7537.34 -5612.2953 63.00 43.00 136350.00 105506.47 241856.47 5.61 2.13 1 8.74 60.34 19882.66 210270.00 -787895.06 -931820.13 7.4100% 764 15 0 3.51 100822.1004 25097.89092 40453.35 -12925.9 -11000.861 63.00 43.00 136350.00 140675.29 277025.29 0.53 2.84 1 4.37 80.15 25271.22 210270.00 -661323.16 -840417.05 7.25
Carbon offsetting 959 15.52 0 3.51 126555.4899 20614.05106 61750.92 -18243.4 -16264.25 63.00 43.00 136350.00 208444.34 344794.34 -4.57 3.57 1 0.00 100.00 30534.61 210270.00 -537691.50 -784554.44 8.25
provided Elec. by PV
PV area m2
Heating (KWh/m2)
Lighting (KWh/m2)
Hot water (KWh/m2)
generated Elec by PV
(KWh)
purchased from grid
elec (KWh)
Exported Elec
(KWh)
Elec Cost £
Energy cost Inc FIT
Wall Insulation price £/m2
Roof Insulation price £/m2
Total Insulation
price £
PV cost £
Fabric cost £
Operational CO2
(kgCO2/m2.yr)
PV ECO2
(kgCO2/m2.yr)
Insulation ECO2
(kgCO2/m2.yr)
Total CO2
(kgCO2/m2.yr)CO2 saving
%
Energy saving (A)
£
Value of external footprint
area £
PV(A) £
NPV £
Payback period (years)
0 0 18.73 32.85 3.51 0 0 0 11957.4 14270.36 43.70 35.00 97931.40 0.00 97931.40 21.59 0.00 0.44 22.03 0.00 0.00 0.00 0.00 025% 190 14.2 24.6375 3.51 25073.559 60344.37639 0 4812.547 6654.38664 66.60 44.70 143650.80 35168.82 178819.62 15.65 0.71 1.09 17.44 20.82 7615.97 227212.00 -1355256.72 -1436144.94 1150% 382 14.2 16.425 3.51 50411.0502 41744.91709 6740.097 -1768.62 73.2217372 66.60 44.70 143650.80 70337.65 213988.45 10.53 1.42 1.09 13.05 40.79 14197.14 227212.00 -1200671.87 -1316728.92 8.3575% 573 14.2 8.2125 3.51 75616.5753 31431.65212 21630.29 -7537.34 -5695.4953 66.60 44.70 143650.80 105506.47 249157.27 5.45 2.13 1.09 8.67 60.64 19965.86 227212.00 -1065170.60 -1216396.47 7.75100% 764 14.2 0 3.51 100822.1004 25097.89092 40453.35 -12925.9 -11084.061 66.60 44.70 143650.80 140675.29 284326.09 0.37 2.84 1.09 4.31 80.45 25354.42 227212.00 -938598.69 -1124993.39 7.5
Carbon offsetting 952 14.2 0 3.51 125631.7272 20738.88528 60933.24 -18055.2 -16213.312 66.60 44.70 143650.80 206922.84 350573.64 -4.64 3.54 1.09 0.00 100.02 30483.67 227212.00 -818117.81 -1070760.05 8.5
PV + 0.08 - 0.11
PV + 0.07 - 0.10
PV + 2010 notional building fabric
Office-London (West End)
PV + 0.17 - 0.24
PV + 0.15 - 0.21
PV + 0.13 - 0.19
PV + 0.12 - 0.17
PV + 0.11 - 0.15
PV (current FiT) + Insulation

211
Table B. 18 Office - PV (future FiT) + improving the building fabric U-value down to 0.07-0.1 W/m2.K (mineral wool) – taking into account the rental loss/gain- West-End
provided Elec. by PV
PV area m2
Heating (KWh/m2)
Lighting (KWh/m2)
Hot water (KWh/m2)
generated Elec by PV
(KWh)
purchased from grid
elec (KWh)
Exported Elec
(KWh)Elec Cost £
Energy cost Inc
FIT
Wall Insulation price £/m2
Roof Insulation price £/m2
Total Insulation
price £
PV cost £
Fabric cost £
Operational CO2
(kgCO2/m2.yr)
PV ECO2
(kgCO2/m2.yr)
Insulation ECO2
(kgCO2/m2.yr)
Total CO2
(kgCO2/m2.yr)
CO2 saving %
Energy saving (A)
£
Value of external footprint
area £
PV(A) £
NPV £
Payback period (years)
0 0 18.73 32.85 3.51 0 0 0 11957.4 14270.36 43.70 35.00 97931.40 0.00 97931.40 21.59 0.00 0.44 22.03 0.00 0.00 134129.04 0.00 0.00 025% 190 18.73 24.6375 3.51 25073.559 60344.37639 0 8448.2127 10761.173 43.70 35.00 97931.40 35168.82 133100.22 16.53 0.71 0.44 17.68 19.75 3509.19 134129.04 82427.23 47258.41 10.2550% 382 18.73 16.425 3.51 50411.0502 41744.91709 6740.0973 5540.984 7853.944 43.70 35.00 97931.40 70337.65 168269.05 11.42 1.42 0.44 13.28 39.71 6416.42 134129.04 150715.06 80377.42 11.2575% 573 18.73 8.2125 3.51 75616.5753 31431.65212 21630.292 3427.0682 5740.0282 43.70 35.00 97931.40 105506.47 203437.87 6.34 2.13 0.44 8.91 59.57 8530.33 134129.04 200368.79 94862.32 12.75100% 764 18.73 0 3.51 100822.1 25097.89092 40453.352 1693.3039 4006.2639 43.70 35.00 97931.40 140675.29 238606.69 1.26 2.84 0.44 4.54 79.38 10264.10 134129.04 241093.14 100417.85 14.25
Carbon offsetting 964 18.73 0 3.51 127215.32 20513.36376 62294.101 68.636402 2381.5964 43.70 35.00 97931.40 209531.12 307462.52 -4.07 3.59 0.44 -0.04 100.20 11888.76 134129.04 279254.93 69723.81 18.5Carbon offsetting 964 18.73 0 3.51 127215.32 20513.36376 62294.101 -3357.539 -1044.579 43.70 35.00 97931.40 209531.12 307462.52 -4.07 3.59 0.44 -0.04 100.20 15314.94 134129.04 359732.29 150201.18 14.15
provided Elec. by PV
PV area m2
Heating (KWh/m2)
Lighting (KWh/m2)
Hot water (KWh/m2)
generated Elec by PV
(KWh)
purchased from grid
elec (KWh)
Exported Elec
(KWh)Elec Cost £
Energy cost Inc
FIT
Wall Insulation price £/m2
Roof Insulation price £/m2
Total Insulation
price £
PV cost £
Fabric cost £
Operational CO2
(kgCO2/m2.yr)
PV ECO2
(kgCO2/m2.yr)
Insulation ECO2
(kgCO2/m2.yr)
Total CO2
(kgCO2/m2.yr)
CO2 saving %
Energy saving (A)
£
Value of external footprint
area £
PV(A) £
NPV £
Payback period (years)
0 0 18.73 32.85 3.51 0 0 0 11957.4 14270.36 43.70 35.00 97931.40 0.00 97931.40 21.59 0.00 0.44 22.03 0.00 0.00 0.00 0.00 025% 190 18.05 24.6375 3.51 25073.559 60344.37639 0 8448.2127 10690.453 44.30 35.70 99418.20 35168.82 134587.02 16.40 0.71 0.48 17.59 20.17 3579.91 137600.00 26881.69 -9773.93 10.550% 382 18.05 16.425 3.51 50411.0502 41744.91709 6740.0973 5540.984 7783.224 44.30 35.70 99418.20 70337.65 169755.85 11.29 1.42 0.48 13.19 40.13 6487.14 137600.00 95169.53 23345.08 11.575% 573 18.05 8.2125 3.51 75616.5753 31431.65212 21630.292 3427.0682 5669.3082 44.30 35.70 99418.20 105506.47 204924.67 6.20 2.13 0.48 8.82 59.98 8601.05 137600.00 144823.25 37829.98 12.85100% 764 18.05 0 3.51 100822.1 25097.89092 40453.352 1693.3039 3935.5439 44.30 35.70 99418.20 140675.29 240093.49 1.13 2.84 0.48 4.45 79.79 10334.82 137600.00 185547.61 43385.51 14.3
Carbon offsetting 960 18.05 0 3.51 126687.456 20588.5376 61840.48 99.573646 2341.8136 44.30 35.70 99418.20 208661.69 308079.89 -4.10 3.57 0.48 -0.04 100.20 11928.55 137600.00 222982.70 12834.21 18.5Carbon offsetting 960 18.05 0 3.51 126687.456 20588.5376 61840.48 -3301.653 -1059.413 44.30 35.70 99418.20 208661.69 308079.89 -4.10 3.57 0.48 -0.04 100.20 15329.77 137600.00 302874.04 92725.55 14.25
provided Elec. by PV
PV area m2
Heating (KWh/m2)
Lighting (KWh/m2)
Hot water (KWh/m2)
generated Elec by PV
(KWh)
purchased from grid
elec (KWh)
Exported Elec
(KWh)Elec Cost £
Energy cost Inc
FIT
Wall Insulation price £/m2
Roof Insulation price £/m2
Total Insulation
price £
PV cost £
Fabric cost £
Operational CO2
(kgCO2/m2.yr)
PV ECO2
(kgCO2/m2.yr)
Insulation ECO2
(kgCO2/m2.yr)
Total CO2
(kgCO2/m2.yr)
CO2 saving %
Energy saving (A)
£
Value of external footprint
area £
PV(A) £
NPV £
Payback period (years)
0 0 18.73 32.85 3.51 0 0 0 11957.4 14270.36 43.70 35.00 97931.40 0.00 97931.40 21.59 0.00 0.44 22.03 0.00 0.00 0.00 0.00 025% 190 17.05 24.6375 3.51 25073.559 60344.37639 0 8448.2127 10586.453 45.00 36.40 101077.20 35168.82 136246.02 16.21 0.71 0.52 17.43 20.88 3683.91 146200.00 -112416.48 -150731.10 10.7550% 382 17.05 16.425 3.51 50411.0502 41744.91709 6740.0973 5540.984 7679.224 45.00 36.40 101077.20 70337.65 171414.85 11.09 1.42 0.52 13.03 40.84 6591.14 146200.00 -44128.64 -117612.09 11.575% 573 17.05 8.2125 3.51 75616.5753 31431.65212 21630.292 3427.0682 5565.3082 45.00 36.40 101077.20 105506.47 206583.67 6.01 2.13 0.52 8.66 60.69 8705.05 146200.00 5525.08 -103127.19 12.9100% 764 17.05 0 3.51 100822.1 25097.89092 40453.352 1693.3039 3831.5439 45.00 36.40 101077.20 140675.29 241752.49 0.93 2.84 0.52 4.30 80.50 10438.82 146200.00 46249.44 -97571.66 14.3
Carbon offsetting 954 17.05 0 3.51 125895.659 20701.29836 61160.05 145.97951 2284.2195 45.00 36.40 101077.20 207357.56 308434.76 -4.13 3.55 0.52 -0.06 100.28 11986.14 146200.00 82594.51 -127908.85 18.4Carbon offsetting 954 17.05 0 3.51 125895.659 20701.29836 61160.05 -3217.823 -1079.583 45.00 36.40 101077.20 207357.56 308434.76 -4.13 3.55 0.52 -0.06 100.28 15349.94 146200.00 161606.80 -48896.56 14.25
provided Elec. by PV
PV area m2
Heating (KWh/m2)
Lighting (KWh/m2)
Hot water (KWh/m2)
generated Elec by PV
(KWh)
purchased from grid
elec (KWh)
Exported Elec
(KWh)Elec Cost £
Energy cost Inc
FIT
Wall Insulation price £/m2
Roof Insulation price £/m2
Total Insulation
price £
PV cost £
Fabric cost £
Operational CO2
(kgCO2/m2.yr)
PV ECO2
(kgCO2/m2.yr)
Insulation ECO2
(kgCO2/m2.yr)
Total CO2
(kgCO2/m2.yr)
CO2 saving %
Energy saving (A)
£
Value of external footprint
area £
PV(A) £
NPV £
Payback period (years)
0 0 18.73 32.85 3.51 0 0 0 11957.4 14270.36 43.70 35.00 97931.40 0.00 97931.40 21.59 0.00 0.44 22.03 0.00 0.00 0.00 0.00 025% 190 16.49 24.6375 3.51 25073.559 60344.37639 0 8448.2127 10528.213 48.60 37.00 107665.20 35168.82 142834.02 16.10 0.71 0.61 17.41 20.97 3742.15 154800.00 -252789.51 -297692.13 12.550% 382 16.49 16.425 3.51 50411.0502 41744.91709 6740.0973 5540.984 7620.984 48.60 37.00 107665.20 70337.65 178002.85 10.98 1.42 0.61 13.02 40.93 6649.38 154800.00 -184501.67 -264573.12 12.575% 573 16.49 8.2125 3.51 75616.5753 31431.65212 21630.292 3427.0682 5507.0682 48.60 37.00 107665.20 105506.47 213171.67 5.90 2.13 0.61 8.64 60.78 8763.29 154800.00 -134847.95 -250088.22 13.65100% 764 16.49 0 3.51 100822.1 25097.89092 40453.352 1693.3039 3773.3039 48.60 37.00 107665.20 140675.29 248340.49 0.82 2.84 0.61 4.28 80.59 10497.06 154800.00 -94123.59 -244532.69 14.85
Carbon offsetting 952 16.49 0 3.51 125631.727 20738.88528 60933.24 161.44814 2241.4481 48.60 37.00 107665.20 206922.84 314588.04 -4.19 3.54 0.61 -0.04 100.16 12028.91 154800.00 -58141.86 -274798.51 18.9Carbon offsetting 952 16.49 0 3.51 125631.727 20738.88528 60933.24 -3189.88 -1109.88 48.60 37.00 107665.20 206922.84 314588.04 -4.19 3.54 0.61 -0.04 100.16 15380.24 154800.00 20577.42 -196079.23 14.65
provided Elec. by PV
PV area m2
Heating (KWh/m2)
Lighting (KWh/m2)
Hot water (KWh/m2)
generated Elec by PV
(KWh)
purchased from grid
elec (KWh)
Exported Elec
(KWh)Elec Cost £
Energy cost Inc
FIT
Wall Insulation price £/m2
Roof Insulation price £/m2
Total Insulation
price £
PV cost £
Fabric cost £
Operational CO2
(kgCO2/m2.yr)
PV ECO2
(kgCO2/m2.yr)
Insulation ECO2
(kgCO2/m2.yr)
Total CO2
(kgCO2/m2.yr)
CO2 saving %
Energy saving (A)
£
Value of external footprint
area £
PV(A) £
NPV £
Payback period (years)
0 0 18.73 32.85 3.51 0 0 0 11957.4 14270.36 43.70 35.00 97931.40 0.00 97931.40 21.59 0.00 0.44 22.03 0.00 0.00 0.00 0.00 025% 190 16 24.6375 3.51 25073.559 60344.37639 0 8448.2127 10477.253 50.40 38.40 111672.00 35168.82 146840.82 16.00 0.71 0.65 17.36 21.22 3793.11 163400.00 -393333.53 -442242.96 13.2550% 382 16 16.425 3.51 50411.0502 41744.91709 6740.0973 5540.984 7570.024 50.40 38.40 111672.00 70337.65 182009.65 10.89 1.42 0.65 12.96 41.18 6700.34 163400.00 -325045.70 -409123.95 1375% 573 16 8.2125 3.51 75616.5753 31431.65212 21630.292 3427.0682 5456.1082 50.40 38.40 111672.00 105506.47 217178.47 5.80 2.13 0.65 8.58 61.03 8814.25 163400.00 -275391.97 -394639.04 14100% 764 16 0 3.51 100822.1 25097.89092 40453.352 1693.3039 3722.3439 50.40 38.40 111672.00 140675.29 252347.29 0.73 2.84 0.65 4.22 80.85 10548.02 163400.00 -234667.62 -389083.51 15.2
Carbon offsetting 949 16 0 3.51 125103.863 20814.05912 60479.62 192.38538 2221.4254 50.40 38.40 111672.00 206053.42 317725.42 -4.18 3.53 0.65 0.00 99.98 12048.93 163400.00 -199412.57 -419206.60 19.15Carbon offsetting 949 16 0 3.51 125103.863 20814.05912 60479.62 -3133.994 -1104.954 50.40 38.40 111672.00 206053.42 317725.42 -4.18 3.53 0.65 0.00 99.98 15375.31 163400.00 -121279.32 -341073.35 14.85
provided Elec. by PV
PV area m2
Heating (KWh/m2)
Lighting (KWh/m2)
Hot water (KWh/m2)
generated Elec by PV
(KWh)
purchased from grid
elec (KWh)
Exported Elec
(KWh)Elec Cost £
Energy cost Inc
FIT
Wall Insulation price £/m2
Roof Insulation price £/m2
Total Insulation
price £
PV cost £
Fabric cost £
Operational CO2
(kgCO2/m2.yr)
PV ECO2
(kgCO2/m2.yr)
Insulation ECO2
(kgCO2/m2.yr)
Total CO2
(kgCO2/m2.yr)
CO2 saving %
Energy saving (A)
£
Value of external footprint
area £
PV(A) £
NPV £
Payback period (years)
0 0 18.73 32.85 3.51 0 0 0 11957.4 14270.36 43.70 35.00 97931.40 0.00 97931.40 21.59 0.00 0.44 22.03 0.00 0.00 0.00 0.00 025% 190 15.52 24.6375 3.51 25073.559 60344.37639 0 8448.2127 10427.333 52.20 39.00 115160.40 35168.82 150329.22 15.91 0.71 0.7 17.31 21.42 3843.03 176300.00 -604772.50 -657170.33 14.1550% 382 15.52 16.425 3.51 50411.0502 41744.91709 6740.0973 5540.984 7520.104 52.20 39.00 115160.40 70337.65 185498.05 10.79 1.42 0.7 12.91 41.38 6750.26 176300.00 -536484.67 -624051.31 13.575% 573 15.52 8.2125 3.51 75616.5753 31431.65212 21630.292 3427.0682 5406.1882 52.20 39.00 115160.40 105506.47 220666.87 5.71 2.13 0.7 8.54 61.23 8864.17 176300.00 -486830.94 -609566.41 14.35100% 764 15.52 0 3.51 100822.1 25097.89092 40453.352 1693.3039 3672.4239 52.20 39.00 115160.40 140675.29 255835.69 0.63 2.84 0.7 4.18 81.05 10597.94 176300.00 -446106.59 -604010.88 15.5
Carbon offsetting 946 15.52 0 3.51 124839.931 20851.64604 60252.81 207.854 2186.974 52.20 39.00 115160.40 205618.71 320779.11 -4.22 3.52 0.7 0.00 99.99 12083.39 176300.00 -411214.89 -634062.59 19.35Carbon offsetting 946 15.52 0 3.51 124839.931 20851.64604 60252.81 -3106.051 -1126.931 52.20 39.00 115160.40 205618.71 320779.11 -4.22 3.52 0.7 0.00 99.99 15397.29 176300.00 -333374.65 -556222.36 15
provided Elec. by PV
PV area m2
Heating (KWh/m2)
Lighting (KWh/m2)
Hot water (KWh/m2)
generated Elec by PV
(KWh)
purchased from grid
elec (KWh)
Exported Elec
(KWh)Elec Cost £
Energy cost Inc
FIT
Wall Insulation price £/m2
Roof Insulation price £/m2
Total Insulation
price £
PV cost £
Fabric cost £
Operational CO2
(kgCO2/m2.yr)
PV ECO2
(kgCO2/m2.yr)
Insulation ECO2
(kgCO2/m2.yr)
Total CO2
(kgCO2/m2.yr)
CO2 saving %
Energy saving (A)
£
Value of external footprint
area £
PV(A) £
NPV £
Payback period (years)
0 0 18.73 32.85 3.51 0 0 0 11957.4 14270.36 43.70 35.00 97931.40 0.00 97931.40 21.59 0.00 0.44 22.03 0.00 0.00 0.00 0.00 025% 190 15 24.6375 3.51 25073.559 60344.37639 0 8448.2127 10373.253 63.00 43.00 136350.00 35168.82 171518.82 15.80 0.71 1 17.51 20.52 3897.11 210270.00 -1163379.27 -1236966.69 19.7550% 382 15 16.425 3.51 50411.0502 41744.91709 6740.0973 5540.984 7466.024 63.00 43.00 136350.00 70337.65 206687.65 10.69 1.42 1 13.11 40.48 6804.34 210270.00 -1095091.43 -1203847.68 16.7575% 573 15 8.2125 3.51 75616.5753 31431.65212 21630.292 3427.0682 5352.1082 63.00 43.00 136350.00 105506.47 241856.47 5.61 2.13 1 8.74 60.34 8918.25 210270.00 -1045437.71 -1189362.78 16.85100% 764 15 0 3.51 100822.1 25097.89092 40453.352 1693.3039 3618.3439 63.00 43.00 136350.00 140675.29 277025.29 0.53 2.84 1 4.37 80.15 10652.02 210270.00 -1004713.35 -1183807.25 17.6
Carbon offsetting 959 15.52 0 3.51 126555.49 20614.05106 61750.921 107.17569 2086.2957 63.00 43.00 136350.00 208444.34 344794.34 -4.57 3.57 1 0.00 100.00 12184.06 210270.00 -968727.11 -1215590.04 21.4Carbon offsetting 959 15.52 0 3.51 126555.49 20614.05106 61750.921 -3289.125 -1310.005 63.00 43.00 136350.00 208444.34 344794.34 -4.57 3.57 1 0.00 100.00 15580.36 210270.00 -888951.47 -1135814.40 16.5
provided Elec. by PV
PV area m2
Heating (KWh/m2)
Lighting (KWh/m2)
Hot water (KWh/m2)
generated Elec by PV
(KWh)
purchased from grid
elec (KWh)
Exported Elec
(KWh)Elec Cost £
Energy cost Inc
FIT
Wall Insulation price £/m2
Roof Insulation price £/m2
Total Insulation
price £
PV cost £
Fabric cost £
Operational CO2
(kgCO2/m2.yr)
PV ECO2
(kgCO2/m2.yr)
Insulation ECO2
(kgCO2/m2.yr)
Total CO2
(kgCO2/m2.yr)
CO2 saving %
Energy saving (A)
£
Value of external footprint
area £
PV(A) £
NPV £
Payback period (years)
0 0 18.73 32.85 3.51 0 0 0 11957.4 14270.36 43.70 35.00 97931.40 0.00 97931.40 21.59 0.00 0.44 22.03 0.00 0.00 0.00 0.00 025% 190 14.2 24.6375 3.51 25073.559 60344.37639 0 8448.2127 10290.053 66.60 44.70 143650.80 35168.82 178819.62 15.65 0.71 1.09 17.44 20.82 3980.31 227212.00 -1440654.81 -1521543.03 21.550% 382 14.2 16.425 3.51 50411.0502 41744.91709 6740.0973 5540.984 7382.824 66.60 44.70 143650.80 70337.65 213988.45 10.53 1.42 1.09 13.05 40.79 6887.54 227212.00 -1372366.97 -1488424.02 17.6575% 573 14.2 8.2125 3.51 75616.5753 31431.65212 21630.292 3427.0682 5268.9082 66.60 44.70 143650.80 105506.47 249157.27 5.45 2.13 1.09 8.67 60.64 9001.45 227212.00 -1322713.24 -1473939.12 17.55100% 764 14.2 0 3.51 100822.1 25097.89092 40453.352 1693.3039 3535.1439 66.60 44.70 143650.80 140675.29 284326.09 0.37 2.84 1.09 4.31 80.45 10735.22 227212.00 -1281988.89 -1468383.59 18.2
Carbon offsetting 952 14.2 0 3.51 125631.727 20738.88528 60933.24 161.44814 2003.2881 66.60 44.70 143650.80 206922.84 350573.64 -4.64 3.54 1.09 0.00 100.02 12267.07 227212.00 -1246007.16 -1498649.41 21.75Carbon offsetting 952 14.2 0 3.51 125631.727 20738.88528 60933.24 -3189.88 -1348.04 66.60 44.70 143650.80 206922.84 350573.64 -4.64 3.54 1.09 0.00 100.02 15618.40 227212.00 -1167287.88 -1419930.13 16.9
PV + 0.07 - 0.10
Office-London (West End)
PV + 2010 notional building fabric
PV + 0.17 - 0.24
PV + 0.15 - 0.21
PV + 0.13 - 0.19
PV + 0.12 - 0.17
PV + 0.11 - 0.15
PV + 0.08 - 0.11
PV (future FiT) + Insulation

212
Table B. 19 Office - PV (current FiT) + improving the building fabric U-value down to 0.07-0.1 W/m2.K (mineral wool) + TSC – taking into account the rental loss/gain- West-End
provided Elec. & heating
TSC area m2
PV area m2
Heating (KWh/m2)
Lighting (KWh/m2)
Hot water (KWh/m2)
TSC fan power
(KWh/m2)
generated Elec by PV
(KWh)
purchased from grid
elec (KWh)
Exported Elec (KWh)
Elec cost £
Energy cost Inc
FIT £
Wall Insulation price £/m2
Roof Insulation price £/m2
Total Insulation
price £
TSC cost £
PV Cost £Fabric cost
£
Operational CO2
(kgCO2/m2.yr)
PV ECO2
(kgCO2/m2.yr)
TSC ECO2
(kgCO2/m2.yr)
Insulation ECO2
(kgCO2/m2.yr)
Total CO2
(kgCO2/m2.yr)CO2 saving
%
Energy saving (A)
£
Value of external footprint
area £
PV(A) £
NPV £
Payback period (years)
0 0 0 18.73 32.85 3.51 0 0 0 0 11957.4 14270.36 43.70 35.00 97931.40 0.00 0.00 97931.40 21.59 0.00 0.00 0.44 22.03 0.00 0.00 134129.04 0.00 0.00 025% 75 190 14.04 24.6375 3.51 0.0938 25073.559 60344.3764 0 4812.547 6637.7466 43.70 35.00 97931.40 11250.00 35168.82 144350.22 15.66 0.71 0.04 0.44 16.85 23.53 7632.61 134129.04 179282.30 132863.48 6.250% 200 382 9.365 16.425 3.51 0.1873 50411.0502 41744.9171 6740.09727 -1768.62 -429.6183 43.70 35.00 97931.40 30000.00 70337.65 198269.05 9.68 1.42 0.09 0.44 11.64 47.17 14699.98 134129.04 345287.49 244949.84 6.9575% 425 573 4.68 8.2125 3.51 0.281 75616.5753 31431.6521 21630.292 -7537.34 -6685.575 43.70 35.00 97931.40 63750.00 105506.47 267187.87 3.73 2.13 0.20 0.44 6.50 70.48 20955.94 134129.04 492233.54 322977.07 8.25100% 650 764 0 0 3.51 0.3746 100822.1 25097.8909 40453.3519 -12925.9 -12560.86 43.70 35.00 97931.40 97500.00 140675.29 336106.69 -2.21 2.84 0.31 0.44 1.38 93.76 26831.22 134129.04 630238.00 392062.70 9.1
Carbon offsetting
650 823 0 0 3.51 0.3746 108608.1 23453.9279 46753.1629 -14568.5 -14203.48 43.70 35.00 97931.40 97500.00 178883.93 374315.33 -3.82 3.06 0.31 0.44 -0.01 100.03 28473.84 134129.04 668821.38 392437.45 10
provided Elec. & heating
TSC area m2
PV area m2
Heating (KWh/m2)
Lighting (KWh/m2)
Hot water (KWh/m2)
TSC fan power
(KWh/m2)
generated Elec by PV
(KWh)
purchased from grid
elec (KWh)
Exported Elec (KWh)
Elec cost £
Energy cost Inc
FIT £
Wall Insulation price £/m2
Roof Insulation price £/m2
Total Insulation
price £
TSC cost £
PV Cost £Fabric cost
£
Operational CO2
(kgCO2/m2.yr)
PV ECO2
(kgCO2/m2.yr)
TSC ECO2
(kgCO2/m2.yr)
Insulation ECO2
(kgCO2/m2.yr)
Total CO2
(kgCO2/m2.yr)CO2 saving
%
Energy saving (A)
£
Value of external footprint
area £
PV(A) £
NPV £
Payback period (years)
0 0 0 18.73 32.85 3.51 0 0 0 0 11957.4 14270.36 43.70 35.00 97931.40 0.00 0.00 97931.40 21.59 0.00 0.00 0.44 22.03 0.00 0.00 0.00 0.00 025% 72 190 13.53 24.6375 3.51 0.104 25073.559 60344.3764 0 4812.547 6584.7066 44.30 35.70 99418.20 10800.00 35168.82 145387.02 15.57 0.71 0.03 0.48 16.79 23.79 7685.65 137600.00 123321.48 75865.85 6.350% 185 382 9.025 16.425 3.51 0.1941 50411.0502 41744.9171 6740.09727 -1768.62 -464.9783 44.30 35.70 99418.20 27750.00 70337.65 197505.85 9.62 1.42 0.09 0.48 11.61 47.30 14735.34 137600.00 288911.38 189336.94 6.975% 410 573 4.51 8.2125 3.51 0.2844 75616.5753 31431.6521 21630.292 -7537.34 -6703.255 44.30 35.70 99418.20 61500.00 105506.47 266424.67 3.70 2.13 0.19 0.48 6.51 70.47 20973.62 137600.00 435442.14 266948.87 8.2100% 630 764 0 0 3.51 0.3746 100822.1 25097.8909 40453.3519 -12925.9 -12560.86 44.30 35.70 99418.20 94500.00 140675.29 334593.49 -2.21 2.84 0.30 0.48 1.41 93.61 26831.22 137600.00 573031.32 336369.22 9.05
Carbon offsetting
630 825 0 0 3.51 0.3746 108872.033 23407.2466 46970.1049 -14623.1 -14258.04 44.30 35.70 99418.20 94500.00 179318.64 373236.84 -3.87 3.07 0.30 0.48 -0.02 100.09 28528.40 137600.00 612896.44 337591.00 9.9
provided Elec. & heating
TSC area m2
PV area m2
Heating (KWh/m2)
Lighting (KWh/m2)
Hot water (KWh/m2)
TSC fan power
(KWh/m2)
generated Elec by PV
(KWh)
purchased from grid
elec (KWh)
Exported Elec (KWh)
Elec cost £
Energy cost Inc
FIT £
Wall Insulation price £/m2
Roof Insulation price £/m2
Total Insulation
price £
TSC cost £
PV Cost £Fabric cost
£
Operational CO2
(kgCO2/m2.yr)
PV ECO2
(kgCO2/m2.yr)
TSC ECO2
(kgCO2/m2.yr)
Insulation ECO2
(kgCO2/m2.yr)
Total CO2
(kgCO2/m2.yr)CO2 saving
%
Energy saving (A)
£
Value of external footprint
area £
PV(A) £
NPV £
Payback period (years)
0 0 0 18.73 32.85 3.51 0 0 0 0 11957.4 14270.36 43.70 35.00 97931.40 0.00 0.00 97931.40 21.59 0.00 0.00 0.44 22.03 0.00 0.00 0.00 0.00 025% 69 190 12.78 24.6375 3.51 0.119 25073.559 60344.3764 0 4812.547 6506.7066 45.00 36.40 101077.20 10350.00 35168.82 146596.02 15.43 0.71 0.03 0.52 16.69 24.24 7763.65 146200.00 -16587.41 -65252.03 6.450% 172 382 8.52 16.425 3.51 0.2042 50411.0502 41744.9171 6740.09727 -1768.62 -517.4983 45.00 36.40 101077.20 25800.00 70337.65 197214.85 9.53 1.42 0.08 0.52 11.55 47.57 14787.86 146200.00 148404.00 49120.55 6.8575% 400 573 4.26 8.2125 3.51 0.2894 75616.5753 31431.6521 21630.292 -7537.34 -6729.255 45.00 36.40 101077.20 60000.00 105506.47 266583.67 3.65 2.13 0.19 0.52 6.49 70.52 20999.62 146200.00 294311.83 125659.56 8.2100% 615 764 0 0 3.51 0.3746 100822.1 25097.8909 40453.3519 -12925.9 -12560.86 45.00 36.40 101077.20 92250.00 140675.29 334002.49 -2.21 2.84 0.29 0.52 1.44 93.46 26831.22 146200.00 431290.29 195219.20 9
Carbon offsetting
615 827 0 0 3.51 0.3746 109135.965 23360.5653 47187.047 -14677.7 -14312.61 45.00 36.40 101077.20 92250.00 179753.35 373080.55 -3.92 3.08 0.29 0.52 -0.03 100.15 28582.97 146200.00 472437.16 197288.01 9.9
provided Elec. & heating
TSC area m2
PV area m2
Heating (KWh/m2)
Lighting (KWh/m2)
Hot water (KWh/m2)
TSC fan power
(KWh/m2)
generated Elec by PV
(KWh)
purchased from grid
elec (KWh)
Exported Elec (KWh)
Elec cost £
Energy cost Inc
FIT £
Wall Insulation price £/m2
Roof Insulation price £/m2
Total Insulation
price £
TSC cost £
PV Cost £Fabric cost
£
Operational CO2
(kgCO2/m2.yr)
PV ECO2
(kgCO2/m2.yr)
TSC ECO2
(kgCO2/m2.yr)
Insulation ECO2
(kgCO2/m2.yr)
Total CO2
(kgCO2/m2.yr)CO2 saving
%
Energy saving (A)
£
Value of external footprint
area £
PV(A) £
NPV £
Payback period (years)
0 0 0 18.73 32.85 3.51 0 0 0 0 11957.4 14270.36 43.70 35.00 97931.40 0.00 0.00 97931.40 21.59 0.00 0.00 0.44 22.03 0.00 0.00 0.00 0.00 025% 66 190 12.36 24.6375 3.51 0.1274 25073.559 60344.3764 0 4812.547 6463.0266 48.60 37.00 107665.20 9900.00 35168.82 152734.02 15.35 0.71 0.03 0.61 16.70 24.19 7807.33 154800.00 -157302.43 -212105.06 7.1550% 165 382 8.24 16.425 3.51 0.2098 50411.0502 41744.9171 6740.09727 -1768.62 -546.6183 48.60 37.00 107665.20 24750.00 70337.65 202752.85 9.48 1.42 0.08 0.61 11.59 47.41 14816.98 154800.00 7346.97 -97474.48 7.275% 392 573 4.12 8.2125 3.51 0.2922 75616.5753 31431.6521 21630.292 -7537.34 -6743.815 48.60 37.00 107665.20 58800.00 105506.47 271971.67 3.63 2.13 0.19 0.61 6.56 70.25 21014.18 154800.00 152912.81 -21127.47 8.5100% 605 764 0 0 3.51 0.3746 100822.1 25097.8909 40453.3519 -12925.9 -12560.86 48.60 37.00 107665.20 90750.00 140675.29 339090.49 -2.21 2.84 0.29 0.61 1.53 93.07 26831.22 154800.00 289549.27 48390.17 9.2
Carbon offsetting
605 830 0 0 3.51 0.3746 109663.829 23267.2027 47420.931 -14777.8 -14412.75 48.60 37.00 107665.20 90750.00 180622.78 379037.98 -3.99 3.09 0.29 0.61 0.00 100.01 28683.11 154800.00 333048.23 51941.65 10.05
provided Elec. & heating
TSC area m2
PV area m2
Heating (KWh/m2)
Lighting (KWh/m2)
Hot water (KWh/m2)
TSC fan power
(KWh/m2)
generated Elec by PV
(KWh)
purchased from grid
elec (KWh)
Exported Elec (KWh)
Elec cost £
Energy cost Inc
FIT £
Wall Insulation price £/m2
Roof Insulation price £/m2
Total Insulation
price £
TSC cost £
PV Cost £Fabric cost
£
Operational CO2
(kgCO2/m2.yr)
PV ECO2
(kgCO2/m2.yr)
TSC ECO2
(kgCO2/m2.yr)
Insulation ECO2
(kgCO2/m2.yr)
Total CO2
(kgCO2/m2.yr)CO2 saving
%
Energy saving (A)
£
Value of external footprint
area £
PV(A) £
NPV £
Payback period (years)
0 0 0 18.73 32.85 3.51 0 0 0 0 11957.4 14270.36 43.70 35.00 97931.40 0.00 0.00 97931.40 21.59 0.00 0.00 0.44 22.03 0.00 0.00 0.00 0.00 025% 63 190 12 24.6375 3.51 0.1346 25073.559 60344.3764 0 4812.547 6425.5866 50.40 38.40 111672.00 9450.00 35168.82 156290.82 15.29 0.71 0.03 0.65 16.67 24.32 7844.77 163400.00 -298164.03 -356523.46 7.650% 160 382 8 16.425 3.51 0.2146 50411.0502 41744.9171 6740.09727 -1768.62 -571.5783 50.40 38.40 111672.00 24000.00 70337.65 206009.65 9.43 1.42 0.08 0.65 11.58 47.44 14841.94 163400.00 -133807.77 -241886.02 7.4575% 382 573 4 8.2125 3.51 0.2946 75616.5753 31431.6521 21630.292 -7537.34 -6756.295 50.40 38.40 111672.00 57300.00 105506.47 274478.47 3.60 2.13 0.18 0.65 6.57 70.19 21026.66 163400.00 11464.92 -165082.15 8.6100% 595 764 0 0 3.51 0.3746 100822.1 25097.8909 40453.3519 -12925.9 -12560.86 50.40 38.40 111672.00 89250.00 140675.29 341597.29 -2.21 2.84 0.28 0.65 1.56 92.91 26831.22 163400.00 147808.24 -95857.65 9.3
Carbon offsetting
595 832 0 0 3.51 0.3746 109795.795 23243.862 47629.4021 -14809.6 -14444.53 50.40 38.40 111672.00 89250.00 180840.13 381762.13 -4.04 3.10 0.28 0.65 -0.01 100.03 28714.89 163400.00 192053.78 -91776.96 10.15
provided Elec. & heating
TSC area m2
PV area m2
Heating (KWh/m2)
Lighting (KWh/m2)
Hot water (KWh/m2)
TSC fan power
(KWh/m2)
generated Elec by PV
(KWh)
purchased from grid
elec (KWh)
Exported Elec (KWh)
Elec cost £
Energy cost Inc
FIT £
Wall Insulation price £/m2
Roof Insulation price £/m2
Total Insulation
price £
TSC cost £
PV Cost £Fabric cost
£
Operational CO2
(kgCO2/m2.yr)
PV ECO2
(kgCO2/m2.yr)
TSC ECO2
(kgCO2/m2.yr)
Insulation ECO2
(kgCO2/m2.yr)
Total CO2
(kgCO2/m2.yr)CO2 saving
%
Energy saving (A)
£
Value of external footprint
area £
PV(A) £
NPV £
Payback period (years)
0 0 0 18.73 32.85 3.51 0 0 0 0 11957.4 14270.36 43.70 35.00 97931.40 0.00 0.00 97931.40 21.59 0.00 0.00 0.44 22.03 0.00 0.00 0.00 0.00 025% 60 190 11.64 24.6375 3.51 0.1418 25073.559 60344.3764 0 4812.547 6388.1466 52.20 39.00 115160.40 9000.00 35168.82 159329.22 15.22 0.71 0.03 0.7 16.66 24.41 7882.21 176300.00 -509896.14 -571293.97 850% 156 382 7.76 16.425 3.51 0.2194 50411.0502 41744.9171 6740.09727 -1768.62 -596.5383 52.20 39.00 115160.40 23400.00 70337.65 208898.05 9.39 1.42 0.07 0.7 11.58 47.43 14866.90 176300.00 -345833.02 -456799.67 7.6575% 377 573 3.88 8.2125 3.51 0.297 75616.5753 31431.6521 21630.292 -7537.34 -6768.775 52.20 39.00 115160.40 56550.00 105506.47 277216.87 3.58 2.13 0.18 0.7 6.59 70.07 21039.14 176300.00 -200853.47 -380138.94 8.75100% 589 764 0 0 3.51 0.3746 100822.1 25097.8909 40453.3519 -12925.9 -12560.86 52.20 39.00 115160.40 88350.00 140675.29 344185.69 -2.21 2.84 0.28 0.7 1.61 92.70 26831.22 176300.00 -64803.30 -311057.59 9.4
Carbon offsetting
589 834 0 0 3.51 0.3746 110059.727 23197.1807 47946.3441 -14868.6 -14503.6 52.20 39.00 115160.40 88350.00 181274.85 384785.25 -4.11 3.11 0.28 0.7 -0.03 100.12 28773.96 176300.00 -19170.32 -306024.16 10.25
provided Elec. & heating
TSC area m2
PV area m2
Heating (KWh/m2)
Lighting (KWh/m2)
Hot water (KWh/m2)
TSC fan power
(KWh/m2)
generated Elec by PV
(KWh)
purchased from grid
elec (KWh)
Exported Elec (KWh)
Elec cost £
Energy cost Inc
FIT £
Wall Insulation price £/m2
Roof Insulation price £/m2
Total Insulation
price £
TSC cost £
PV Cost £Fabric cost
£
Operational CO2
(kgCO2/m2.yr)
PV ECO2
(kgCO2/m2.yr)
TSC ECO2
(kgCO2/m2.yr)
Insulation ECO2
(kgCO2/m2.yr)
Total CO2
(kgCO2/m2.yr)CO2 saving
%
Energy saving (A)
£
Value of external footprint
area £
PV(A) £
NPV £
Payback period (years)
0 0 0 18.73 32.85 3.51 0 0 0 0 11957.4 14270.36 43.70 35.00 97931.40 0.00 0.00 97931.40 21.59 0.00 0.00 0.44 22.03 0.00 0.00 0.00 0.00 025% 57 190 11.25 24.6375 3.51 0.1496 25073.559 60344.3764 0 4812.547 6347.5866 63.00 43.00 136350.00 8550.00 35168.82 180068.82 15.15 0.71 0.03 1 16.88 23.38 7922.77 210270.00 -1068820.48 -1150957.90 10.6550% 153 382 7.5 16.425 3.51 0.2246 50411.0502 41744.9171 6740.09727 -1768.62 -623.5783 63.00 43.00 136350.00 22950.00 70337.65 229637.65 9.34 1.42 0.07 1 11.83 46.29 14893.94 210270.00 -905074.93 -1036781.18 9.0575% 371 573 3.75 8.2125 3.51 0.2996 75616.5753 31431.6521 21630.292 -7537.34 -6782.295 63.00 43.00 136350.00 55650.00 105506.47 297506.47 3.56 2.13 0.18 1 6.87 68.83 21052.66 210270.00 -760412.95 -959988.02 9.75100% 582 764 0 0 3.51 0.3746 100822.1 25097.8909 40453.3519 -12925.9 -12560.86 63.00 43.00 136350.00 87300.00 140675.29 364325.29 -2.21 2.84 0.28 1 1.91 91.35 26831.22 210270.00 -624680.35 -891074.24 10.2
Carbon offsetting
582 847 0 0 3.51 0.3746 111775.287 22893.7521 49356.4674 -15223.3 -14858.29 63.00 43.00 136350.00 87300.00 184100.47 407750.47 -4.45 3.15 0.28 1 -0.03 100.12 29128.65 210270.00 -570716.02 -880535.10 10.95
provided Elec. & heating
TSC area m2
PV area m2
Heating (KWh/m2)
Lighting (KWh/m2)
Hot water (KWh/m2)
TSC fan power
(KWh/m2)
generated Elec by PV
(KWh)
purchased from grid
elec (KWh)
Exported Elec (KWh)
Elec cost £
Energy cost Inc
FIT £
Wall Insulation price £/m2
Roof Insulation price £/m2
Total Insulation
price £
TSC cost £
PV Cost £Fabric cost
£
Operational CO2
(kgCO2/m2.yr)
PV ECO2
(kgCO2/m2.yr)
TSC ECO2
(kgCO2/m2.yr)
Insulation ECO2
(kgCO2/m2.yr)
Total CO2
(kgCO2/m2.yr)CO2 saving
%
Energy saving (A)
£
Value of external footprint
area £
PV(A) £
NPV £
Payback period (years)
0 0 0 18.73 32.85 3.51 0 0 0 0 11957.4 14270.36 43.70 35.00 97931.40 0.00 0.00 97931.40 21.59 0.00 0.00 0.44 22.03 0.00 0.00 0.00 0.00 025% 55 190 10.65 24.6375 3.51 0.1616 25073.559 60344.3764 0 4812.547 6285.1866 66.60 44.70 143650.80 8250.00 35168.82 187069.62 15.04 0.71 0.03 1.09 16.86 23.48 7985.17 227212.00 -1346584.59 -1435722.81 11.5550% 150 382 7.1 16.425 3.51 0.2326 50411.0502 41744.9171 6740.09727 -1768.62 -665.1783 66.60 44.70 143650.80 22500.00 70337.65 236488.45 9.26 1.42 0.07 1.09 11.85 46.23 14935.54 227212.00 -1183327.61 -1321884.66 9.575% 365 573 3.55 8.2125 3.51 0.3036 75616.5753 31431.6521 21630.292 -7537.34 -6803.095 66.60 44.70 143650.80 54750.00 105506.47 303907.27 3.52 2.13 0.17 1.09 6.92 68.61 21073.46 227212.00 -1039154.20 -1245130.07 10.05100% 575 764 0 0 3.51 0.3746 100822.1 25097.8909 40453.3519 -12925.9 -12560.86 66.60 44.70 143650.80 86250.00 140675.29 370576.09 -2.21 2.84 0.27 1.09 1.99 90.96 26831.22 227212.00 -903910.17 -1176554.86 10.45
Carbon offsetting
575 850 0 0 3.51 0.3746 112039.219 22847.0708 49673.4094 -15282.4 -14917.36 66.60 44.70 143650.80 86250.00 184535.18 414435.98 -4.53 3.16 0.27 1.09 0.00 100.01 29187.72 227212.00 -848558.40 -1165062.98 11.15
TSC + PV + 0.08 - 0.11
TSC + PV + 0.07 - 0.10
Office-London (West End)
TSC + PV + 2010 notional building fabric
TSC + PV + 0.17 - 0.24
TSC + PV + 0.15 - 0.21
TSC + PV + 0.13 - 0.19
TSC + PV + 0.12 - 0.17
TSC + PV + 0.11 - 0.15
PV (current FiT) + Insulation + TSC

213
Table B. 20 Office - PV (future FiT) + improving the building fabric U-value down to 0.07-0.1 W/m2.K (mineral wool) + TSC – taking into account the rental loss/gain- West-End
provided Elec. & heating
TSC area m2
PV area m2
Heating (KWh/m2)
Lighting (KWh/m2)
Hot water (KWh/m2)
TSC fan power
(KWh/m2
)
generated Elec by PV
(KWh)
purchased from grid
elec (KWh)
Exported Elec
(KWh)
Elec cost £
Energy cost Inc
FIT £
Wall Insulation price £/m2
Roof Insulation price £/m2
Total Insulation
price £
TSC cost £
PV Cost £Fabric cost
£
Operational CO2
(kgCO2/m2.yr)
PV ECO2
(kgCO2/m2.yr)
TSC ECO2
(kgCO2/m2.yr)
Insulation ECO2
(kgCO2/m2.yr)
Total CO2
(kgCO2/m2.yr)
CO2 saving %
Energy saving (A) £
Value of external footprint
area £
PV(A) £
NPV £
Payback period (years)
0 0 0 18.73 32.85 3.51 0 0 0 0 11957.4 14270.36 43.70 35.00 97931.40 0.00 0.00 97931.40 21.59 0.00 0.00 0.44 22.03 0.00 0.00 134129.04 0.00 0.00 025% 75 190 14.04 24.6375 3.51 0.0938 25073.559 60344.3764 0 8448.213 10273.413 43.70 35.00 97931.40 11250.00 35168.82 144350.22 15.66 0.71 0.04 0.44 16.85 23.53 3996.95 134129.04 93884.21 47465.39 1250% 200 382 9.365 16.425 3.51 0.1873 50411.0502 41744.9171 6740.0973 5540.984 6879.984 43.70 35.00 97931.40 30000.00 70337.65 198269.05 9.68 1.42 0.09 0.44 11.64 47.17 7390.38 134129.04 173592.39 73254.74 14.175% 425 573 4.68 8.2125 3.51 0.281 75616.5753 31431.6521 21630.292 3427.068 4278.8282 43.70 35.00 97931.40 63750.00 105506.47 267187.87 3.73 2.13 0.20 0.44 6.50 70.48 9991.53 134129.04 234690.89 65434.42 17.75100% 650 764 0 0 3.51 0.3746 100822.1 25097.8909 40453.352 1693.304 2058.3439 43.70 35.00 97931.40 97500.00 140675.29 336106.69 -2.21 2.84 0.31 0.44 1.38 93.76 12212.02 134129.04 286847.80 48672.50 20.55
Carbon offsetting
650 823 0 0 3.51 0.3746 108608.1 23453.9279 46753.163 1179.658 1544.6976 43.70 35.00 97931.40 97500.00 178883.93 374315.33 -3.82 3.06 0.31 0.44 -0.01 100.03 12725.66 134129.04 298912.83 22528.90 23
Carbon offsetting
650 823 0 0 3.51 0.3746 108608.1 23453.9279 46753.163 -1391.77 -1026.726 43.70 35.00 97931.40 97500.00 178883.93 374315.33 -3.82 3.06 0.31 0.44 -0.01 100.03 15297.09 134129.04 359312.95 82929.02 18.95
provided Elec. & heating
TSC area m2
PV area m2
Heating (KWh/m2)
Lighting (KWh/m2)
Hot water (KWh/m2)
TSC fan power
(KWh/m2
)
generated Elec by PV
(KWh)
purchased from grid
elec (KWh)
Exported Elec
(KWh)
Elec cost £
Energy cost Inc
FIT £
Wall Insulation price £/m2
Roof Insulation price £/m2
Total Insulation
price £
TSC cost £
PV Cost £Fabric cost
£
Operational CO2
(kgCO2/m2.yr)
PV ECO2
(kgCO2/m2.yr)
TSC ECO2
(kgCO2/m2.yr)
Insulation ECO2
(kgCO2/m2.yr)
Total CO2
(kgCO2/m2.yr)
CO2 saving %
Energy saving (A) £
Value of external footprint
area £
PV(A) £
NPV £
Payback period (years)
0 0 0 18.73 32.85 3.51 0 0 0 0 11957.4 14270.36 43.70 35.00 97931.40 0.00 0.00 97931.40 21.59 0.00 0.00 0.44 22.03 0.00 0.00 0.00 0.00 025% 72 190 13.53 24.6375 3.51 0.104 25073.559 60344.3764 0 8448.213 10220.373 44.30 35.70 99418.20 10800.00 35168.82 145387.02 15.57 0.71 0.03 0.48 16.79 23.79 4049.99 137600.00 37923.39 -9532.23 12.150% 185 382 9.025 16.425 3.51 0.1941 50411.0502 41744.9171 6740.0973 5540.984 6844.624 44.30 35.70 99418.20 27750.00 70337.65 197505.85 9.62 1.42 0.09 0.48 11.61 47.30 7425.74 137600.00 117216.28 17641.84 13.975% 410 573 4.51 8.2125 3.51 0.2844 75616.5753 31431.6521 21630.292 3427.068 4261.1482 44.30 35.70 99418.20 61500.00 105506.47 266424.67 3.70 2.13 0.19 0.48 6.51 70.47 10009.21 137600.00 177899.50 9406.22 17.6100% 630 764 0 0 3.51 0.3746 100822.1 25097.8909 40453.352 1693.304 2058.3439 44.30 35.70 99418.20 94500.00 140675.29 334593.49 -2.21 2.84 0.30 0.48 1.41 93.61 12212.02 137600.00 229641.12 -7020.97 20.4
Carbon offsetting
630 825 0 0 3.51 0.3746 108872.033 23407.2466 46970.105 1163.36 1528.3998 44.30 35.70 99418.20 94500.00 179318.64 373236.84 -3.87 3.07 0.30 0.48 -0.02 100.09 12741.96 137600.00 242088.97 -33216.48 22.9
Carbon offsetting
630 825 0 0 3.51 0.3746 108872.033 23407.2466 46970.105 -1420 -1054.956 44.30 35.70 99418.20 94500.00 179318.64 373236.84 -3.87 3.07 0.30 0.48 -0.02 100.09 15325.32 137600.00 302769.36 27463.91 18.85
provided Elec. & heating
TSC area m2
PV area m2
Heating (KWh/m2)
Lighting (KWh/m2)
Hot water (KWh/m2)
TSC fan power
(KWh/m2
)
generated Elec by PV
(KWh)
purchased from grid
elec (KWh)
Exported Elec
(KWh)
Elec cost £
Energy cost Inc
FIT £
Wall Insulation price £/m2
Roof Insulation price £/m2
Total Insulation
price £
TSC cost £
PV Cost £Fabric cost
£
Operational CO2
(kgCO2/m2.yr)
PV ECO2
(kgCO2/m2.yr)
TSC ECO2
(kgCO2/m2.yr)
Insulation ECO2
(kgCO2/m2.yr)
Total CO2
(kgCO2/m2.yr)
CO2 saving %
Energy saving (A) £
Value of external footprint
area £
PV(A) £
NPV £
Payback period (years)
0 0 0 18.73 32.85 3.51 0 0 0 0 11957.4 14270.36 43.70 35.00 97931.40 0.00 0.00 97931.40 21.59 0.00 0.00 0.44 22.03 0.00 0.00 0.00 0.00 025% 69 190 12.78 24.6375 3.51 0.119 25073.559 60344.3764 0 8448.213 10142.373 45.00 36.40 101077.20 10350.00 35168.82 146596.02 15.43 0.71 0.03 0.52 16.69 24.24 4127.99 146200.00 -101985.49 -150650.12 12.1550% 172 382 8.52 16.425 3.51 0.2042 50411.0502 41744.9171 6740.0973 5540.984 6792.104 45.00 36.40 101077.20 25800.00 70337.65 197214.85 9.53 1.42 0.08 0.52 11.55 47.57 7478.26 146200.00 -23291.10 -122574.55 13.7575% 400 573 4.26 8.2125 3.51 0.2894 75616.5753 31431.6521 21630.292 3427.068 4235.1482 45.00 36.40 101077.20 60000.00 105506.47 266583.67 3.65 2.13 0.19 0.52 6.49 70.52 10035.21 146200.00 36769.18 -131883.09 17.55100% 615 764 0 0 3.51 0.3746 100822.1 25097.8909 40453.352 1693.304 2058.3439 45.00 36.40 101077.20 92250.00 140675.29 334002.49 -2.21 2.84 0.29 0.52 1.44 93.46 12212.02 146200.00 87900.09 -148171.00 20.35
Carbon offsetting
615 827 0 0 3.51 0.3746 109135.965 23360.5653 47187.047 1147.062 1512.102 45.00 36.40 101077.20 92250.00 179753.35 373080.55 -3.92 3.08 0.29 0.52 -0.03 100.15 12758.26 146200.00 100730.76 -174418.40 22.85
Carbon offsetting
615 827 0 0 3.51 0.3746 109135.965 23360.5653 47187.047 -1448.23 -1083.186 45.00 36.40 101077.20 92250.00 179753.35 373080.55 -3.92 3.08 0.29 0.52 -0.03 100.15 15353.55 146200.00 161691.42 -113457.74 18.8
provided Elec. & heating
TSC area m2
PV area m2
Heating (KWh/m2)
Lighting (KWh/m2)
Hot water (KWh/m2)
TSC fan power
(KWh/m2
)
generated Elec by PV
(KWh)
purchased from grid
elec (KWh)
Exported Elec
(KWh)
Elec cost £
Energy cost Inc
FIT £
Wall Insulation price £/m2
Roof Insulation price £/m2
Total Insulation
price £
TSC cost £
PV Cost £Fabric cost
£
Operational CO2
(kgCO2/m2.yr)
PV ECO2
(kgCO2/m2.yr)
TSC ECO2
(kgCO2/m2.yr)
Insulation ECO2
(kgCO2/m2.yr)
Total CO2
(kgCO2/m2.yr)
CO2 saving %
Energy saving (A) £
Value of external footprint
area £
PV(A) £
NPV £
Payback period (years)
0 0 0 18.73 32.85 3.51 0 0 0 0 11957.4 14270.36 43.70 35.00 97931.40 0.00 0.00 97931.40 21.59 0.00 0.00 0.44 22.03 0.00 0.00 0.00 0.00 025% 66 190 12.36 24.6375 3.51 0.1274 25073.559 60344.3764 0 8448.213 10098.693 48.60 37.00 107665.20 9900.00 35168.82 152734.02 15.35 0.71 0.03 0.61 16.70 24.19 4171.67 154800.00 -242700.52 -297503.14 13.650% 165 382 8.24 16.425 3.51 0.2098 50411.0502 41744.9171 6740.0973 5540.984 6762.984 48.60 37.00 107665.20 24750.00 70337.65 202752.85 9.48 1.42 0.08 0.61 11.59 47.41 7507.38 154800.00 -164348.13 -269169.57 14.575% 392 573 4.12 8.2125 3.51 0.2922 75616.5753 31431.6521 21630.292 3427.068 4220.5882 48.60 37.00 107665.20 58800.00 105506.47 271971.67 3.63 2.13 0.19 0.61 6.56 70.25 10049.77 154800.00 -104629.84 -278670.11 18.15100% 605 764 0 0 3.51 0.3746 100822.1 25097.8909 40453.352 1693.304 2058.3439 48.60 37.00 107665.20 90750.00 140675.29 339090.49 -2.21 2.84 0.29 0.61 1.53 93.07 12212.02 154800.00 -53840.93 -295000.03 20.8
Carbon offsetting
605 830 0 0 3.51 0.3746 109663.829 23267.2027 47420.931 1123.466 1488.5065 48.60 37.00 107665.20 90750.00 180622.78 379037.98 -3.99 3.09 0.29 0.61 0.00 100.01 12781.85 154800.00 -40456.03 -321562.61 23.3
Carbon offsetting
605 830 0 0 3.51 0.3746 109663.829 23267.2027 47420.931 -1484.68 -1119.645 48.60 37.00 107665.20 90750.00 180622.78 379037.98 -3.99 3.09 0.29 0.61 0.00 100.01 15390.00 154800.00 20806.78 -260299.80 19.2
provided Elec. & heating
TSC area m2
PV area m2
Heating (KWh/m2)
Lighting (KWh/m2)
Hot water (KWh/m2)
TSC fan power
(KWh/m2
)
generated Elec by PV
(KWh)
purchased from grid
elec (KWh)
Exported Elec
(KWh)
Elec cost £
Energy cost Inc
FIT £
Wall Insulation price £/m2
Roof Insulation price £/m2
Total Insulation
price £
TSC cost £
PV Cost £Fabric cost
£
Operational CO2
(kgCO2/m2.yr)
PV ECO2
(kgCO2/m2.yr)
TSC ECO2
(kgCO2/m2.yr)
Insulation ECO2
(kgCO2/m2.yr)
Total CO2
(kgCO2/m2.yr)
CO2 saving %
Energy saving (A) £
Value of external footprint
area £
PV(A) £
NPV £
Payback period (years)
0 0 0 18.73 32.85 3.51 0 0 0 0 11957.4 14270.36 43.70 35.00 97931.40 0.00 0.00 97931.40 21.59 0.00 0.00 0.44 22.03 0.00 0.00 0.00 0.00 025% 63 190 12 24.6375 3.51 0.1346 25073.559 60344.3764 0 8448.213 10061.253 50.40 38.40 111672.00 9450.00 35168.82 156290.82 15.29 0.71 0.03 0.65 16.67 24.32 4209.11 163400.00 -383562.12 -441921.54 14.450% 160 382 8 16.425 3.51 0.2146 50411.0502 41744.9171 6740.0973 5540.984 6738.024 50.40 38.40 111672.00 24000.00 70337.65 206009.65 9.43 1.42 0.08 0.65 11.58 47.44 7532.34 163400.00 -305502.87 -413581.12 14.975% 382 573 4 8.2125 3.51 0.2946 75616.5753 31431.6521 21630.292 3427.068 4208.1082 50.40 38.40 111672.00 57300.00 105506.47 274478.47 3.60 2.13 0.18 0.65 6.57 70.19 10062.25 163400.00 -246077.73 -422624.80 18.4100% 595 764 0 0 3.51 0.3746 100822.1 25097.8909 40453.352 1693.304 2058.3439 50.40 38.40 111672.00 89250.00 140675.29 341597.29 -2.21 2.84 0.28 0.65 1.56 92.91 12212.02 163400.00 -195581.96 -439247.85 21.05
Carbon offsetting
595 832 0 0 3.51 0.3746 109795.795 23243.862 47629.402 1110.818 1475.8576 50.40 38.40 111672.00 89250.00 180840.13 381762.13 -4.04 3.10 0.28 0.65 -0.01 100.03 12794.50 163400.00 -181899.95 -465730.68 23.55
Carbon offsetting
595 832 0 0 3.51 0.3746 109795.795 23243.862 47629.402 -1508.8 -1143.76 50.40 38.40 111672.00 89250.00 180840.13 381762.13 -4.04 3.10 0.28 0.65 -0.01 100.03 15414.12 163400.00 -120367.82 -404198.55 19.35
provided Elec. & heating
TSC area m2
PV area m2
Heating (KWh/m2)
Lighting (KWh/m2)
Hot water (KWh/m2)
TSC fan power
(KWh/m2
)
generated Elec by PV
(KWh)
purchased from grid
elec (KWh)
Exported Elec
(KWh)
Elec cost £
Energy cost Inc
FIT £
Wall Insulation price £/m2
Roof Insulation price £/m2
Total Insulation
price £
TSC cost £
PV Cost £Fabric cost
£
Operational CO2
(kgCO2/m2.yr)
PV ECO2
(kgCO2/m2.yr)
TSC ECO2
(kgCO2/m2.yr)
Insulation ECO2
(kgCO2/m2.yr)
Total CO2
(kgCO2/m2.yr)
CO2 saving %
Energy saving (A) £
Value of external footprint
area £
PV(A) £
NPV £
Payback period (years)
0 0 0 18.73 32.85 3.51 0 0 0 0 11957.4 14270.36 43.70 35.00 97931.40 0.00 0.00 97931.40 21.59 0.00 0.00 0.44 22.03 0.00 0.00 0.00 0.00 025% 60 190 11.64 24.6375 3.51 0.1418 25073.559 60344.3764 0 8448.213 10023.813 52.20 39.00 115160.40 9000.00 35168.82 159329.22 15.22 0.71 0.03 0.7 16.66 24.41 4246.55 176300.00 -595294.23 -656692.05 1550% 156 382 7.76 16.425 3.51 0.2194 50411.0502 41744.9171 6740.0973 5540.984 6713.064 52.20 39.00 115160.40 23400.00 70337.65 208898.05 9.39 1.42 0.07 0.7 11.58 47.43 7557.30 176300.00 -517528.12 -628494.77 15.375% 377 573 3.88 8.2125 3.51 0.297 75616.5753 31431.6521 21630.292 3427.068 4195.6282 52.20 39.00 115160.40 56550.00 105506.47 277216.87 3.58 2.13 0.18 0.7 6.59 70.07 10074.73 176300.00 -458396.12 -637681.59 18.65100% 589 764 0 0 3.51 0.3746 100822.1 25097.8909 40453.352 1693.304 2058.3439 52.20 39.00 115160.40 88350.00 140675.29 344185.69 -2.21 2.84 0.28 0.7 1.61 92.70 12212.02 176300.00 -408193.50 -654447.79 21.25
Carbon offsetting
589 834 0 0 3.51 0.3746 110059.727 23197.1807 47946.344 1090.02 1455.0598 52.20 39.00 115160.40 88350.00 181274.85 384785.25 -4.11 3.11 0.28 0.7 -0.03 100.12 12815.30 176300.00 -394022.97 -680876.81 23.75
Carbon offsetting
589 834 0 0 3.51 0.3746 110059.727 23197.1807 47946.344 -1547.03 -1181.989 52.20 39.00 115160.40 88350.00 181274.85 384785.25 -4.11 3.11 0.28 0.7 -0.03 100.12 15452.35 176300.00 -332081.38 -618935.22 19.5
provided Elec. & heating
TSC area m2
PV area m2
Heating (KWh/m2)
Lighting (KWh/m2)
Hot water (KWh/m2)
TSC fan power
(KWh/m2
)
generated Elec by PV
(KWh)
purchased from grid
elec (KWh)
Exported Elec
(KWh)
Elec cost £
Energy cost Inc
FIT £
Wall Insulation price £/m2
Roof Insulation price £/m2
Total Insulation
price £
TSC cost £
PV Cost £Fabric cost
£
Operational CO2
(kgCO2/m2.yr)
PV ECO2
(kgCO2/m2.yr)
TSC ECO2
(kgCO2/m2.yr)
Insulation ECO2
(kgCO2/m2.yr)
Total CO2
(kgCO2/m2.yr)
CO2 saving %
Energy saving (A) £
Value of external footprint
area £
PV(A) £
NPV £
Payback period (years)
0 0 0 18.73 32.85 3.51 0 0 0 0 11957.4 14270.36 43.70 35.00 97931.40 0.00 0.00 97931.40 21.59 0.00 0.00 0.44 22.03 0.00 0.00 0.00 0.00 025% 57 190 11.25 24.6375 3.51 0.1496 25073.559 60344.3764 0 8448.213 9983.2527 63.00 43.00 136350.00 8550.00 35168.82 180068.82 15.15 0.71 0.03 1 16.88 23.38 4287.11 210270.00 -1154218.57 -1236355.99 20.1550% 153 382 7.5 16.425 3.51 0.2246 50411.0502 41744.9171 6740.0973 5540.984 6686.024 63.00 43.00 136350.00 22950.00 70337.65 229637.65 9.34 1.42 0.07 1 11.83 46.29 7584.34 210270.00 -1076770.03 -1208476.28 18.275% 371 573 3.75 8.2125 3.51 0.2996 75616.5753 31431.6521 21630.292 3427.068 4182.1082 63.00 43.00 136350.00 55650.00 105506.47 297506.47 3.56 2.13 0.18 1 6.87 68.83 10088.25 210270.00 -1017955.60 -1217530.67 20.85100% 582 764 0 0 3.51 0.3746 100822.1 25097.8909 40453.352 1693.304 2058.3439 63.00 43.00 136350.00 87300.00 140675.29 364325.29 -2.21 2.84 0.28 1 1.91 91.35 12212.02 210270.00 -968070.55 -1234464.44 23.15
Carbon offsetting
582 847 0 0 3.51 0.3746 111775.287 22893.7521 49356.467 984.0843 1349.1243 63.00 43.00 136350.00 87300.00 184100.47 407750.47 -4.45 3.15 0.28 1 -0.03 100.12 12921.24 210270.00 -951411.70 -1261230.77 25.55
Carbon offsetting
582 847 0 0 3.51 0.3746 111775.287 22893.7521 49356.467 -1730.52 -1365.481 63.00 43.00 136350.00 87300.00 184100.47 407750.47 -4.45 3.15 0.28 1 -0.03 100.12 15635.84 210270.00 -887648.38 -1197467.45 20.9
provided Elec. & heating
TSC area m2
PV area m2
Heating (KWh/m2)
Lighting (KWh/m2)
Hot water (KWh/m2)
TSC fan power
(KWh/m2
)
generated Elec by PV
(KWh)
purchased from grid
elec (KWh)
Exported Elec
(KWh)
Elec cost £
Energy cost Inc
FIT £
Wall Insulation price £/m2
Roof Insulation price £/m2
Total Insulation
price £
TSC cost £
PV Cost £Fabric cost
£
Operational CO2
(kgCO2/m2.yr)
PV ECO2
(kgCO2/m2.yr)
TSC ECO2
(kgCO2/m2.yr)
Insulation ECO2
(kgCO2/m2.yr)
Total CO2
(kgCO2/m2.yr)
CO2 saving %
Energy saving (A) £
Value of external footprint
area £
PV(A) £
NPV £
Payback period (years)
0 0 0 18.73 32.85 3.51 0 0 0 0 11957.4 14270.36 43.70 35.00 97931.40 0.00 0.00 97931.40 21.59 0.00 0.00 0.44 22.03 0.00 0.00 0.00 0.00 025% 55 190 10.65 24.6375 3.51 0.1616 25073.559 60344.3764 0 8448.213 9920.8527 66.60 44.70 143650.80 8250.00 35168.82 187069.62 15.04 0.71 0.03 1.09 16.86 23.48 4349.51 227212.00 -1431982.68 -1521120.90 21.650% 150 382 7.1 16.425 3.51 0.2326 50411.0502 41744.9171 6740.0973 5540.984 6644.424 66.60 44.70 143650.80 22500.00 70337.65 236488.45 9.26 1.42 0.07 1.09 11.85 46.23 7625.94 227212.00 -1355022.71 -1493579.76 19.175% 365 573 3.55 8.2125 3.51 0.3036 75616.5753 31431.6521 21630.292 3427.068 4161.3082 66.60 44.70 143650.80 54750.00 105506.47 303907.27 3.52 2.13 0.17 1.09 6.92 68.61 10109.05 227212.00 -1296696.85 -1502672.72 21.5100% 575 764 0 0 3.51 0.3746 100822.1 25097.8909 40453.352 1693.304 2058.3439 66.60 44.70 143650.80 86250.00 140675.29 370576.09 -2.21 2.84 0.27 1.09 1.99 90.96 12212.02 227212.00 -1247300.37 -1519945.06 23.7
Carbon offsetting
575 850 0 0 3.51 0.3746 112039.219 22847.0708 49673.409 963.2865 1328.3265 66.60 44.70 143650.80 86250.00 184535.18 414435.98 -4.53 3.16 0.27 1.09 0.00 100.01 12942.03 227212.00 -1230153.00 -1546657.59 26.1
Carbon offsetting
575 850 0 0 3.51 0.3746 112039.219 22847.0708 49673.409 -1768.75 -1403.711 66.60 44.70 143650.80 86250.00 184535.18 414435.98 -4.53 3.16 0.27 1.09 0.00 100.01 15674.07 227212.00 -1165980.23 -1482484.81 21.3
TSC + PV + 0.08 - 0.11
TSC + PV + 0.07 - 0.10
Office-London (West End)
TSC + PV + 2010 notional building fabric
TSC + PV + 0.17 - 0.24
TSC + PV + 0.15 - 0.21
TSC + PV + 0.13 - 0.19
TSC + PV + 0.12 - 0.17
TSC + PV + 0.11 - 0.15
PV (future FiT) + Insulation + TSC

214
Table B. 21 Distribution warehouse - PV (current FiT) + improving the building fabric U-value down to 0.07-0.1 W/m2.K (PUR)
provided Elec. by PV
PV area m2
Heating (KWh/m2)
Lighting (KWh/m2)
Hot water (KWh/m2)
generated Elec by PV
(KWh)
purchased from grid
elec (KWh)
Exported Elec
(KWh)
Elec Cost £
Energy cost Inc
FIT
Wall Insulation price £/m2
Roof Insulation price £/m2
Total Insulation
price £
PV cost £
Fabric cost £
Operational CO2
(kgCO2/m2.yr)
PV ECO2
(kgCO2/m2.yr)
Insulation ECO2
(kgCO2/m2.yr)
Total CO2
(kgCO2/m2.yr)CO2 saving
%
Energy saving (A)
£
PV(A) £
NPV £
Payback period (years)
0 0 57.29 13.97 4.96 0 0 0 5867.4 13337.4 66.00 46.00 276000.00 0.00 276000.00 19.53 0.00 1.20 20.73 0.00 0.00 0.00 0.00 025% 94 57.29 10.4775 4.96 12404.8134 30259.929 203.1794 2428.549 9898.549 66.00 46.00 276000.00 17257.06 293257.06 17.46 0.30 1.20 18.96 8.54 3438.85 80775.10 63518.04 5.1550% 187 57.29 6.985 4.96 24677.6607 23563.4558 6327.852 -564.13 6905.8697 66.00 46.00 276000.00 34514.12 310514.12 15.21 0.60 1.20 17.02 17.90 6431.53 151070.08 116555.97 5.4575% 281 57.29 3.4925 4.96 37082.4741 19750.3654 14919.21 -3283.27 4186.7281 66.00 46.00 276000.00 51771.18 327771.18 13.05 0.91 1.20 15.15 26.90 9150.67 214939.95 163168.77 5.75
100% 375 57.29 0 4.96 49487.2875 17131.2544 24705.64 -5889.03 1580.9652 66.00 46.00 276000.00 69028.24 345028.24 10.88 1.21 1.20 13.29 35.91 11756.43 276146.66 207118.42 6Carbon Offset 1045 57.29 0 4.96 137904.575 8287.42383 104279.1 -23528.5 -16058.48 66.00 46.00 276000.00 227136.95 503136.95 -4.58 3.37 1.20 -0.01 100.06 29395.88 690479.30 463342.36 7.9
provided Elec. by PV
PV area m2
Heating (KWh/m2)
Lighting (KWh/m2)
Hot water (KWh/m2)
generated Elec by PV
(KWh)
purchased from grid
elec (KWh)
Exported Elec
(KWh)
Elec Cost £
Energy cost Inc
FIT
Wall Insulation price £/m2
Roof Insulation price £/m2
Total Insulation
price £
PV cost £
Fabric cost £
Operational CO2
(kgCO2/m2.yr)
PV ECO2
(kgCO2/m2.yr)
Insulation ECO2
(kgCO2/m2.yr)
Total CO2
(kgCO2/m2.yr)CO2 saving
%
Energy saving (A)
£
PV(A) £
NPV £
Payback period (years)
0 0 57.29 13.97 4.96 0 0 0 5867.4 13337.4 66.00 46.00 276000.00 0.00 276000.00 19.53 0.00 1.20 20.73 0.00 0.00 0.00 0.00 025 94 55.4 10.4775 4.96 12404.8134 30259.929 203.1794 2428.549 9671.749 67.00 47.00 281000.00 17257.06 298257.06 17.09 0.30 1.3 18.69 9.84 3665.65 86102.40 63845.34 6.250 187 55.4 6.985 4.96 24677.6607 23563.4558 6327.852 -564.13 6679.0697 67.00 47.00 281000.00 34514.12 315514.12 14.84 0.60 1.3 16.75 19.21 6658.33 156397.39 116883.27 675 281 55.4 3.4925 4.96 37082.4741 19750.3654 14919.21 -3283.27 3959.9281 67.00 47.00 281000.00 51771.18 332771.18 12.68 0.91 1.3 14.88 28.21 9377.47 220267.25 163496.07 6.15100 375 55.4 0 4.96 49487.2875 17131.2544 24705.64 -5889.03 1354.1652 67.00 47.00 281000.00 69028.24 350028.24 10.51 1.21 1.3 13.02 37.21 11983.23 281473.96 207445.72 6.3
Carbon Offset 1032 55.4 0 4.96 136189.015 8392.98468 102669.1 -23192.5 -15949.3 67.00 47.00 281000.00 224311.32 505311.32 -4.66 3.33 1.3 -0.03 100.12 29286.70 687914.67 458603.35 8
provided Elec. by PV
PV area m2
Heating (KWh/m2)
Lighting (KWh/m2)
Hot water (KWh/m2)
generated Elec by PV
(KWh)
purchased from grid
elec (KWh)
Exported Elec
(KWh)
Elec Cost £
Energy cost Inc
FIT
Wall Insulation price £/m2
Roof Insulation price £/m2
Total Insulation
price £
PV cost £
Fabric cost £
Operational CO2
(kgCO2/m2.yr)
PV ECO2
(kgCO2/m2.yr)
Insulation ECO2
(kgCO2/m2.yr)
Total CO2
(kgCO2/m2.yr)CO2 saving
%
Energy saving (A)
£
PV(A) £
NPV £
Payback period (years)
0 0 57.29 13.97 4.96 0 0 0 5867.4 13337.4 66.00 46.00 276000.00 0.00 276000.00 19.53 0.00 1.20 20.73 0.00 0.00 0.00 0.00 025 94 52.88 10.4775 4.96 12404.8134 30259.929 203.1794 2428.549 9369.349 68.50 48.00 287150.00 17257.06 304407.06 16.59 0.30 1.49 18.39 11.31 3968.05 93205.47 64798.41 7.2550 187 52.88 6.985 4.96 24677.6607 23563.4558 6327.852 -564.13 6376.6697 68.50 48.00 287150.00 34514.12 321664.12 14.35 0.60 1.49 16.44 20.67 6960.73 163500.45 117836.33 6.775 281 52.88 3.4925 4.96 37082.4741 19750.3654 14919.21 -3283.27 3657.5281 68.50 48.00 287150.00 51771.18 338921.18 12.18 0.91 1.49 14.58 29.67 9679.87 227370.31 164449.14 6.65100 375 52.88 0 4.96 49487.2875 17131.2544 24705.64 -5889.03 1051.7652 68.50 48.00 287150.00 69028.24 356178.24 10.01 1.21 1.49 12.71 38.68 12285.63 288577.03 208398.79 6.65
Carbon Offset 1015 52.88 0 4.96 133945.592 8533.03983 100665.7 -22757.4 -15816.64 68.50 48.00 287150.00 220616.27 507766.27 -4.77 3.28 1.49 -0.01 100.04 29154.04 684798.72 453032.45 8.1
provided Elec. by PV
PV area m2
Heating (KWh/m2)
Lighting (KWh/m2)
Hot water (KWh/m2)
generated Elec by PV
(KWh)
purchased from grid
elec (KWh)
Exported Elec
(KWh)
Elec Cost £
Energy cost Inc
FIT
Wall Insulation price £/m2
Roof Insulation price £/m2
Total Insulation
price £
PV cost £
Fabric cost £
Operational CO2
(kgCO2/m2.yr)
PV ECO2
(kgCO2/m2.yr)
Insulation ECO2
(kgCO2/m2.yr)
Total CO2
(kgCO2/m2.yr)CO2 saving
%
Energy saving (A)
£
PV(A) £
NPV £
Payback period (years)
0 0 57.29 13.97 4.96 0 0 0 5867.4 13337.4 66.00 46.00 276000.00 0.00 276000.00 19.53 0.00 1.20 20.73 0.00 0.00 0.00 0.00 025 94 50.84 10.4775 4.96 12404.8134 30259.929 203.1794 2428.549 9124.549 70.00 49.00 293300.00 17257.06 310557.06 16.19 0.30 1.67 18.17 12.37 4212.85 98955.57 64398.51 8.4550 187 50.84 6.985 4.96 24677.6607 23563.4558 6327.852 -564.13 6131.8697 70.00 49.00 293300.00 34514.12 327814.12 13.95 0.60 1.67 16.22 21.73 7205.53 169250.55 117436.44 7.3575 281 50.84 3.4925 4.96 37082.4741 19750.3654 14919.21 -3283.27 3412.7281 70.00 49.00 293300.00 51771.18 345071.18 11.78 0.91 1.67 14.36 30.74 9924.67 233120.42 164049.24 7.1100 375 50.84 0 4.96 49487.2875 17131.2544 24705.64 -5889.03 806.96519 70.00 49.00 293300.00 69028.24 362328.24 9.61 1.21 1.67 12.49 39.74 12530.43 294327.13 207998.89 7
Carbon Offset 1005 50.84 0 4.96 132625.931 8614.91183 99327.94 -22494.4 -15798.43 70.00 49.00 293300.00 218442.71 511742.71 -4.93 3.24 1.67 -0.01 100.06 29135.83 684370.91 448628.20 8.275
provided Elec. by PV
PV area m2
Heating (KWh/m2)
Lighting (KWh/m2)
Hot water (KWh/m2)
generated Elec by PV
(KWh)
purchased from grid
elec (KWh)
Exported Elec
(KWh)
Elec Cost £
Energy cost Inc
FIT
Wall Insulation price £/m2
Roof Insulation price £/m2
Total Insulation
price £
PV cost £
Fabric cost £
Operational CO2
(kgCO2/m2.yr)
PV ECO2
(kgCO2/m2.yr)
Insulation ECO2
(kgCO2/m2.yr)
Total CO2
(kgCO2/m2.yr)CO2 saving
%
Energy saving (A)
£
PV(A) £
NPV £
Payback period (years)
0 0 57.29 13.97 4.96 0 0 0 5867.4 13337.4 66.00 46.00 276000.00 0.00 276000.00 19.53 0.00 1.20 20.73 0.00 0.00 0.00 0.00 025 94 48.8 10.4775 4.96 12404.8134 30259.929 203.1794 2428.549 8879.749 71.50 50.00 299450.00 17257.06 316707.06 15.79 0.30 1.86 17.96 13.38 4457.65 104705.67 63998.61 9.3550 187 48.8 6.985 4.96 24677.6607 23563.4558 6327.852 -564.13 5887.0697 71.50 50.00 299450.00 34514.12 333964.12 13.55 0.60 1.86 16.01 22.75 7450.33 175000.66 117036.54 875 281 48.8 3.4925 4.96 37082.4741 19750.3654 14919.21 -3283.27 3167.9281 71.50 50.00 299450.00 51771.18 351221.18 11.38 0.91 1.86 14.15 31.75 10169.47 238870.52 163649.34 7.55100 375 48.8 0 4.96 49487.2875 17131.2544 24705.64 -5889.03 562.16519 71.50 50.00 299450.00 69028.24 368478.24 9.21 1.21 1.86 12.28 40.75 12775.23 300077.23 207598.99 7.4
Carbon Offset 995 48.8 0 4.96 131306.27 8707.33698 98100.7 -22234.9 -15783.71 71.50 50.00 299450.00 216269.15 515719.15 -5.09 3.21 1.86 -0.02 100.12 29121.11 684025.24 444306.09 8.425
provided Elec. by PV
PV area m2
Heating (KWh/m2)
Lighting (KWh/m2)
Hot water (KWh/m2)
generated Elec by PV
(KWh)
purchased from grid
elec (KWh)
Exported Elec
(KWh)
Elec Cost £
Energy cost Inc
FIT
Wall Insulation price £/m2
Roof Insulation price £/m2
Total Insulation
price £
PV cost £
Fabric cost £
Operational CO2
(kgCO2/m2.yr)
PV ECO2
(kgCO2/m2.yr)
Insulation ECO2
(kgCO2/m2.yr)
Total CO2
(kgCO2/m2.yr)CO2 saving
%
Energy saving (A)
£
PV(A) £
NPV £
Payback period (years)
0 0 57.29 13.97 4.96 0 0 0 5867.4 13337.4 66.00 46.00 276000.00 0.00 276000.00 19.53 0.00 1.20 20.73 0.00 0.00 0.00 0.00 025 94 47.4 10.4775 4.96 12404.8134 30259.929 203.1794 2428.549 8711.749 73.00 51.00 305600.00 17257.06 322857.06 15.52 0.30 2.04 17.86 13.83 4625.65 108651.82 61794.76 10.4550 187 47.4 6.985 4.96 24677.6607 23563.4558 6327.852 -564.13 5719.0697 73.00 51.00 305600.00 34514.12 340114.12 13.28 0.60 2.04 15.92 23.20 7618.33 178946.81 114832.69 8.6575 281 47.4 3.4925 4.96 37082.4741 19750.3654 14919.21 -3283.27 2999.9281 73.00 51.00 305600.00 51771.18 357371.18 11.11 0.91 2.04 14.05 32.20 10337.47 242816.67 161445.49 8100 375 47.4 0 4.96 49487.2875 17131.2544 24705.64 -5889.03 394.16519 73.00 51.00 305600.00 69028.24 374628.24 8.94 1.21 2.04 12.19 41.20 12943.23 304023.38 205395.14 7.8
Carbon Offset 990 47.4 0 4.96 130646.439 8750.35968 97483.9 -22105.5 -15822.26 73.00 51.00 305600.00 215182.37 520782.37 -5.25 3.19 2.04 -0.02 100.09 29159.66 684930.63 440148.26 8.6
provided Elec. by PV
PV area m2
Heating (KWh/m2)
Lighting (KWh/m2)
Hot water (KWh/m2)
generated Elec by PV
(KWh)
purchased from grid
elec (KWh)
Exported Elec
(KWh)
Elec Cost £
Energy cost Inc
FIT
Wall Insulation price £/m2
Roof Insulation price £/m2
Total Insulation
price £
PV cost £
Fabric cost £
Operational CO2
(kgCO2/m2.yr)
PV ECO2
(kgCO2/m2.yr)
Insulation ECO2
(kgCO2/m2.yr)
Total CO2
(kgCO2/m2.yr)CO2 saving
%
Energy saving (A)
£
PV(A) £
NPV £
Payback period (years)
0 0 57.29 13.97 4.96 0 0 0 5867.4 13337.4 66.00 46.00 276000.00 0.00 276000.00 19.53 0.00 1.20 20.73 0.00 0.00 0.00 0.00 025 94 44 10.4775 4.96 12404.8134 30259.929 203.1794 2428.549 8303.749 79.00 55.00 330200.00 17257.06 347457.06 14.85 0.30 2.79 17.95 13.43 5033.65 118235.32 46778.27 14.7550 187 44 6.985 4.96 24677.6607 23563.4558 6327.852 -564.13 5311.0697 79.00 55.00 330200.00 34514.12 364714.12 12.61 0.60 2.79 16.00 22.80 8026.33 188530.31 99816.19 11.475 281 44 3.4925 4.96 37082.4741 19750.3654 14919.21 -3283.27 2591.9281 79.00 55.00 330200.00 51771.18 381971.18 10.44 0.91 2.79 14.14 31.80 10745.47 252400.17 146429.00 10.15100 375 44 0 4.96 49487.2875 17131.2544 24705.64 -5889.03 -13.83481 79.00 55.00 330200.00 69028.24 399228.24 8.27 1.21 2.79 12.27 40.80 13351.23 313606.88 190378.65 9.5
Carbon Offset 993 44 0 4.96 131042.337 8724.54606 97853.98 -22183.1 -16307.93 79.00 55.00 330200.00 215834.44 546034.44 -5.99 3.20 2.79 0.00 99.98 29645.33 696338.59 426304.15 9.35
provided Elec. by PV
PV area m2
Heating (KWh/m2)
Lighting (KWh/m2)
Hot water (KWh/m2)
generated Elec by PV
(KWh)
purchased from grid
elec (KWh)
Exported Elec
(KWh)
Elec Cost £
Energy cost Inc
FIT
Wall Insulation price £/m2
Roof Insulation price £/m2
Total Insulation
price £
PV cost £
Fabric cost £
Operational CO2
(kgCO2/m2.yr)
PV ECO2
(kgCO2/m2.yr)
Insulation ECO2
(kgCO2/m2.yr)
Total CO2
(kgCO2/m2.yr)CO2 saving
%
Energy saving (A)
£
PV(A) £
NPV £
Payback period (years)
0 0 57.29 13.97 4.96 0 0 0 5867.4 13337.4 66.00 46.00 276000.00 0.00 276000.00 19.53 0.00 1.20 20.73 0.00 0.00 0.00 0.00 025 94 43 10.4775 4.96 12404.8134 30259.929 203.1794 2428.549 8183.749 82.00 57.00 342500.00 17257.06 359757.06 14.66 0.30 3.16 18.12 12.59 5153.65 121054.00 37296.94 1750 187 43 6.985 4.96 24677.6607 23563.4558 6327.852 -564.13 5191.0697 82.00 57.00 342500.00 34514.12 377014.12 12.41 0.60 3.16 16.18 21.96 8146.33 191348.99 90334.87 12.8575 281 43 3.4925 4.96 37082.4741 19750.3654 14919.21 -3283.27 2471.9281 82.00 57.00 342500.00 51771.18 394271.18 10.24 0.91 3.16 14.31 30.96 10865.47 255218.85 136947.67 11.2100 375 43 0 4.96 49487.2875 17131.2544 24705.64 -5889.03 -133.8348 82.00 57.00 342500.00 69028.24 411528.24 8.08 1.21 3.16 12.45 39.96 13471.23 316425.56 180897.32 10.37
Carbon Offset 1002 43 0 4.96 132230.032 8647.1052 98964.23 -22416.2 -16660.95 82.00 57.00 342500.00 217790.64 560290.64 -6.39 3.23 3.16 0.00 100.00 29998.35 704630.64 420340.00 9.75
PV + 0.08 - 0.11
PV + 0.07 - 0.10
PV + 2010 notional building fabric
Distribution Warehouse - London
PV + 0.17 - 0.24
PV + 0.15 - 0.21
PV + 0.13 - 0.19
PV + 0.12 - 0.17
PV + 0.11 - 0.15
PV (current FiT) + Insulation

215
Table B. 22 Distribution warehouse - PV (future FiT) + improving the building fabric U-value down to 0.07-0.1 W/m2.K (PUR)
provided Elec. by PV
PV area m2
Heating (KWh/m2)
Lighting (KWh/m2)
Hot water (KWh/m2)
generated Elec by PV
(KWh)
purchased from grid
elec (KWh)
Exported Elec (KWh)
Elec Cost £Energy cost Inc
FIT
Wall Insulation price £/m2
Roof Insulation price £/m2
Total Insulation
price £
PV cost £
Fabric cost £
Operational CO2
(kgCO2/m2.yr)
PV ECO2
(kgCO2/m2.yr)
Insulation ECO2
(kgCO2/m2.yr)
Total CO2
(kgCO2/m2.yr)CO2
saving %
Energy saving (A)
£
PV(A) £
NPV £
Payback period (years)
0 0 57.29 13.97 4.96 0 0 0 5867.4 13337.4 66.00 46.00 276000.00 0.00 276000.00 19.53 0.00 1.20 20.73 0.00 0.00 0.00 0.00 025% 94 57.29 10.4775 4.96 12404.813 30259.929 203.179386 4227.247 11697.25 66.00 46.00 276000.00 17257.06 293257.06 17.46 0.30 1.20 18.96 8.54 1640.15 38525.52 21268.46 10.850% 187 57.29 6.985 4.96 24677.661 23563.4558 6327.8518 3014.1305 10484.13 66.00 46.00 276000.00 34514.12 310514.12 15.21 0.60 1.20 17.02 17.90 2853.27 67020.39 32506.27 12.575% 281 57.29 3.4925 4.96 37082.474 19750.3654 14919.208 2093.6868 9563.687 66.00 46.00 276000.00 51771.18 327771.18 13.05 0.91 1.20 15.15 26.90 3773.71 88640.67 36869.50 14.25100% 375 57.29 0 4.96 49487.288 17131.2544 24705.6387 1286.6219 8756.622 66.00 46.00 276000.00 69028.24 345028.24 10.88 1.21 1.20 13.29 35.91 4580.78 107597.80 38569.57 15.75
Carbon Offset 1045 57.29 0 4.96 137904.57 8287.42383 104279.095 -3532.32 3937.68 66.00 46.00 276000.00 227136.95 503136.95 -4.58 3.37 1.20 -0.01 100.06 9399.72 220789.83 -6347.12 25.75Carbon Offset 1045 57.29 0 4.96 137904.57 8287.42383 104279.095 -9267.67 -1797.67 66.00 46.00 276000.00 227136.95 503136.95 -4.58 3.37 1.20 -0.01 100.06 15135.07 355507.35 128370.41 15.625
provided Elec. by PV
PV area m2
Heating (KWh/m2)
Lighting (KWh/m2)
Hot water (KWh/m2)
generated Elec by PV
(KWh)
purchased from grid
elec (KWh)
Exported Elec (KWh)
Elec Cost £Energy cost Inc
FIT
Wall Insulation price £/m2
Roof Insulation price £/m2
Total Insulation
price £
PV cost £
Fabric cost £
Operational CO2
(kgCO2/m2.yr)
PV ECO2
(kgCO2/m2.yr)
Insulation ECO2
(kgCO2/m2.yr)
Total CO2
(kgCO2/m2.yr)CO2
saving %
Energy saving (A)
£
PV(A) £
NPV £
Payback period (years)
0 0 57.29 13.97 4.96 0 0 0 5867.4 13337.4 66.00 46.00 276000.00 0.00 276000.00 19.53 0.00 1.20 20.73 0.00 0.00 0.00 0.00 025 94 55.4 10.4775 4.96 12404.813 30259.929 203.179386 4227.247 11470.45 67.00 47.00 281000.00 17257.06 298257.06 17.09 0.30 1.3 18.69 9.84 1866.95 43852.82 21595.76 12.350 187 55.4 6.985 4.96 24677.661 23563.4558 6327.8518 3014.1305 10257.33 67.00 47.00 281000.00 34514.12 315514.12 14.84 0.60 1.3 16.75 19.21 3080.07 72347.69 32833.57 13.2575 281 55.4 3.4925 4.96 37082.474 19750.3654 14919.208 2093.6868 9336.887 67.00 47.00 281000.00 51771.18 332771.18 12.68 0.91 1.3 14.88 28.21 4000.51 93967.97 37196.80 14.75
100 375 55.4 0 4.96 49487.288 17131.2544 24705.6387 1286.6219 8529.822 67.00 47.00 281000.00 69028.24 350028.24 10.51 1.21 1.3 13.02 37.21 4807.58 112925.10 38896.87 16Carbon Offset 1032 55.4 0 4.96 136189.02 8392.98468 102669.097 -3445.091 3798.109 67.00 47.00 281000.00 224311.32 505311.32 -4.66 3.33 1.3 -0.03 100.12 9539.29 224068.22 -5243.10 25.65Carbon Offset 1032 55.4 0 4.96 136189.02 8392.98468 102669.097 -9091.892 -1848.69 67.00 47.00 281000.00 224311.32 505311.32 -4.66 3.33 1.3 -0.03 100.12 15186.09 356705.80 127394.48 15.75
provided Elec. by PV
PV area m2
Heating (KWh/m2)
Lighting (KWh/m2)
Hot water (KWh/m2)
generated Elec by PV
(KWh)
purchased from grid
elec (KWh)
Exported Elec (KWh)
Elec Cost £Energy cost Inc
FIT
Wall Insulation price £/m2
Roof Insulation price £/m2
Total Insulation
price £
PV cost £
Fabric cost £
Operational CO2
(kgCO2/m2.yr)
PV ECO2
(kgCO2/m2.yr)
Insulation ECO2
(kgCO2/m2.yr)
Total CO2
(kgCO2/m2.yr)CO2
saving %
Energy saving (A)
£
PV(A) £
NPV £
Payback period (years)
0 0 57.29 13.97 4.96 0 0 0 5867.4 13337.4 66.00 46.00 276000.00 0.00 276000.00 19.53 0.00 1.20 20.73 0.00 0.00 0.00 0.00 025 94 52.88 10.4775 4.96 12404.813 30259.929 203.179386 4227.247 11168.05 68.50 48.00 287150.00 17257.06 304407.06 16.59 0.30 1.49 18.39 11.31 2169.35 50955.89 22548.83 13.550 187 52.88 6.985 4.96 24677.661 23563.4558 6327.8518 3014.1305 9954.93 68.50 48.00 287150.00 34514.12 321664.12 14.35 0.60 1.49 16.44 20.67 3382.47 79450.76 33786.64 1475 281 52.88 3.4925 4.96 37082.474 19750.3654 14919.208 2093.6868 9034.487 68.50 48.00 287150.00 51771.18 338921.18 12.18 0.91 1.49 14.58 29.67 4302.91 101071.04 38149.86 15.25
100 375 52.88 0 4.96 49487.288 17131.2544 24705.6387 1286.6219 8227.422 68.50 48.00 287150.00 69028.24 356178.24 10.01 1.21 1.49 12.71 38.68 5109.98 120028.17 39849.94 16.4Carbon Offset 1015 52.88 0 4.96 133945.59 8533.03983 100665.728 -3335.332 3605.468 68.50 48.00 287150.00 220616.27 507766.27 -4.77 3.28 1.49 -0.01 100.04 9731.93 228593.16 -3173.11 25.4Carbon Offset 1015 52.88 0 4.96 133945.59 8533.03983 100665.728 -8871.947 -1931.15 68.50 48.00 287150.00 220616.27 507766.27 -4.77 3.28 1.49 -0.01 100.04 15268.55 358642.59 126876.33 15.8
provided Elec. by PV
PV area m2
Heating (KWh/m2)
Lighting (KWh/m2)
Hot water (KWh/m2)
generated Elec by PV
(KWh)
purchased from grid
elec (KWh)
Exported Elec (KWh)
Elec Cost £Energy cost Inc
FIT
Wall Insulation price £/m2
Roof Insulation price £/m2
Total Insulation
price £
PV cost £
Fabric cost £
Operational CO2
(kgCO2/m2.yr)
PV ECO2
(kgCO2/m2.yr)
Insulation ECO2
(kgCO2/m2.yr)
Total CO2
(kgCO2/m2.yr)CO2
saving %
Energy saving (A)
£
PV(A) £
NPV £
Payback period (years)
0 0 57.29 13.97 4.96 0 0 0 5867.4 13337.4 66.00 46.00 276000.00 0.00 276000.00 19.53 0.00 1.20 20.73 0.00 0.00 0.00 0.00 025 94 50.84 10.4775 4.96 12404.813 30259.929 203.179386 4227.247 10923.25 70.00 49.00 293300.00 17257.06 310557.06 16.19 0.30 1.67 18.17 12.37 2414.15 56705.99 22148.93 14.8550 187 50.84 6.985 4.96 24677.661 23563.4558 6327.8518 3014.1305 9710.13 70.00 49.00 293300.00 34514.12 327814.12 13.95 0.60 1.67 16.22 21.73 3627.27 85200.86 33386.74 14.975 281 50.84 3.4925 4.96 37082.474 19750.3654 14919.208 2093.6868 8789.687 70.00 49.00 293300.00 51771.18 345071.18 11.78 0.91 1.67 14.36 30.74 4547.71 106821.14 37749.97 15.8
100 375 50.84 0 4.96 49487.288 17131.2544 24705.6387 1286.6219 7982.622 70.00 49.00 293300.00 69028.24 362328.24 9.61 1.21 1.67 12.49 39.74 5354.78 125778.27 39450.04 16.8Carbon Offset 1005 50.84 0 4.96 132625.93 8614.91183 99327.9391 -3263.67 3432.33 70.00 49.00 293300.00 218442.71 511742.71 -4.93 3.24 1.67 -0.01 100.06 9905.07 232659.98 -3082.73 25.35Carbon Offset 1005 50.84 0 4.96 132625.93 8614.91183 99327.9391 -8726.706 -2030.71 70.00 49.00 293300.00 218442.71 511742.71 -4.93 3.24 1.67 -0.01 100.06 15368.11 360981.13 125238.43 16
provided Elec. by PV
PV area m2
Heating (KWh/m2)
Lighting (KWh/m2)
Hot water (KWh/m2)
generated Elec by PV
(KWh)
purchased from grid
elec (KWh)
Exported Elec (KWh)
Elec Cost £Energy cost Inc
FIT
Wall Insulation price £/m2
Roof Insulation price £/m2
Total Insulation
price £
PV cost £
Fabric cost £
Operational CO2
(kgCO2/m2.yr)
PV ECO2
(kgCO2/m2.yr)
Insulation ECO2
(kgCO2/m2.yr)
Total CO2
(kgCO2/m2.yr)CO2
saving %
Energy saving (A)
£
PV(A) £
NPV £
Payback period (years)
0 0 57.29 13.97 4.96 0 0 0 5867.4 13337.4 66.00 46.00 276000.00 0.00 276000.00 19.53 0.00 1.20 20.73 0.00 0.00 0.00 0.00 025 94 48.8 10.4775 4.96 12404.813 30259.929 203.179386 4227.247 10678.45 71.50 50.00 299450.00 17257.06 316707.06 15.79 0.30 1.86 17.96 13.38 2658.95 62456.09 21749.03 1650 187 48.8 6.985 4.96 24677.661 23563.4558 6327.8518 3014.1305 9465.33 71.50 50.00 299450.00 34514.12 333964.12 13.55 0.60 1.86 16.01 22.75 3872.07 90950.96 32986.84 15.675 281 48.8 3.4925 4.96 37082.474 19750.3654 14919.208 2093.6868 8544.887 71.50 50.00 299450.00 51771.18 351221.18 11.38 0.91 1.86 14.15 31.75 4792.51 112571.24 37350.07 16.4
100 375 48.8 0 4.96 49487.288 17131.2544 24705.6387 1286.6219 7737.822 71.50 50.00 299450.00 69028.24 368478.24 9.21 1.21 1.86 12.28 40.75 5599.58 131528.38 39050.14 17.25Carbon Offset 995 48.8 0 4.96 131306.27 8707.33698 98100.7033 -3195.504 3255.696 71.50 50.00 299450.00 216269.15 515719.15 -5.09 3.21 1.86 -0.02 100.12 10081.70 236808.95 -2910.20 25.35Carbon Offset 995 48.8 0 4.96 131306.27 8707.33698 98100.7033 -8591.043 -2139.84 71.50 50.00 299450.00 216269.15 515719.15 -5.09 3.21 1.86 -0.02 100.12 15477.24 363544.65 123825.50 16.15
provided Elec. by PV
PV area m2
Heating (KWh/m2)
Lighting (KWh/m2)
Hot water (KWh/m2)
generated Elec by PV
(KWh)
purchased from grid
elec (KWh)
Exported Elec (KWh)
Elec Cost £Energy cost Inc
FIT
Wall Insulation price £/m2
Roof Insulation price £/m2
Total Insulation
price £
PV cost £
Fabric cost £
Operational CO2
(kgCO2/m2.yr)
PV ECO2
(kgCO2/m2.yr)
Insulation ECO2
(kgCO2/m2.yr)
Total CO2
(kgCO2/m2.yr)CO2
saving %
Energy saving (A)
£
PV(A) £
NPV £
Payback period (years)
0 0 57.29 13.97 4.96 0 0 0 5867.4 13337.4 66.00 46.00 276000.00 0.00 276000.00 19.53 0.00 1.20 20.73 0.00 0.00 0.00 0.00 025 94 47.4 10.4775 4.96 12404.813 30259.929 203.179386 4227.247 10510.45 73.00 51.00 305600.00 17257.06 322857.06 15.52 0.30 2.04 17.86 13.83 2826.95 66402.24 19545.18 17.2550 187 47.4 6.985 4.96 24677.661 23563.4558 6327.8518 3014.1305 9297.33 73.00 51.00 305600.00 34514.12 340114.12 13.28 0.60 2.04 15.92 23.20 4040.07 94897.11 30782.99 16.575 281 47.4 3.4925 4.96 37082.474 19750.3654 14919.208 2093.6868 8376.887 73.00 51.00 305600.00 51771.18 357371.18 11.11 0.91 2.04 14.05 32.20 4960.51 116517.39 35146.22 17.15
100 375 47.4 0 4.96 49487.288 17131.2544 24705.6387 1286.6219 7569.822 73.00 51.00 305600.00 69028.24 374628.24 8.94 1.21 2.04 12.19 41.20 5767.58 135474.52 36846.29 17.9Carbon Offset 990 47.4 0 4.96 130646.44 8750.35968 97483.8955 -3161.725 3121.475 73.00 51.00 305600.00 215182.37 520782.37 -5.25 3.19 2.04 -0.02 100.09 10215.92 239961.65 -4820.72 25.5Carbon Offset 990 47.4 0 4.96 130646.44 8750.35968 97483.8955 -8523.339 -2240.14 73.00 51.00 305600.00 215182.37 520782.37 -5.25 3.19 2.04 -0.02 100.09 15577.54 365900.50 121118.13 16.4
provided Elec. by PV
PV area m2
Heating (KWh/m2)
Lighting (KWh/m2)
Hot water (KWh/m2)
generated Elec by PV
(KWh)
purchased from grid
elec (KWh)
Exported Elec (KWh)
Elec Cost £Energy cost Inc
FIT
Wall Insulation price £/m2
Roof Insulation price £/m2
Total Insulation
price £
PV cost £
Fabric cost £
Operational CO2
(kgCO2/m2.yr)
PV ECO2
(kgCO2/m2.yr)
Insulation ECO2
(kgCO2/m2.yr)
Total CO2
(kgCO2/m2.yr)CO2
saving %
Energy saving (A)
£
PV(A) £
NPV £
Payback period (years)
0 0 57.29 13.97 4.96 0 0 0 5867.4 13337.4 66.00 46.00 276000.00 0.00 276000.00 19.53 0.00 1.20 20.73 0.00 0.00 0.00 0.00 025 94 44 10.4775 4.96 12404.813 30259.929 203.179386 4227.247 10102.45 79.00 55.00 330200.00 17257.06 347457.06 14.85 0.30 2.79 17.95 13.43 3234.95 75985.75 4528.69 23.550 187 44 6.985 4.96 24677.661 23563.4558 6327.8518 3014.1305 8889.33 79.00 55.00 330200.00 34514.12 364714.12 12.61 0.60 2.79 16.00 22.80 4448.07 104480.61 15766.50 2175 281 44 3.4925 4.96 37082.474 19750.3654 14919.208 2093.6868 7968.887 79.00 55.00 330200.00 51771.18 381971.18 10.44 0.91 2.79 14.14 31.80 5368.51 126100.90 20129.72 20.8
100 375 44 0 4.96 49487.288 17131.2544 24705.6387 1286.6219 7161.822 79.00 55.00 330200.00 69028.24 399228.24 8.27 1.21 2.79 12.27 40.80 6175.58 145058.03 21829.79 21Carbon Offset 993 44 0 4.96 131042.34 8724.54606 97853.9801 -3181.993 2693.207 79.00 55.00 330200.00 215834.44 546034.44 -5.99 3.20 2.79 0.00 99.98 10644.19 250021.22 -20013.21 27.15Carbon Offset 993 44 0 4.96 131042.34 8724.54606 97853.9801 -8563.962 -2688.76 79.00 55.00 330200.00 215834.44 546034.44 -5.99 3.20 2.79 0.00 99.98 16026.16 376438.18 106403.74 17.65
provided Elec. by PV
PV area m2
Heating (KWh/m2)
Lighting (KWh/m2)
Hot water (KWh/m2)
generated Elec by PV
(KWh)
purchased from grid
elec (KWh)
Exported Elec (KWh)
Elec Cost £Energy cost Inc
FIT
Wall Insulation price £/m2
Roof Insulation price £/m2
Total Insulation
price £
PV cost £
Fabric cost £
Operational CO2
(kgCO2/m2.yr)
PV ECO2
(kgCO2/m2.yr)
Insulation ECO2
(kgCO2/m2.yr)
Total CO2
(kgCO2/m2.yr)CO2
saving %
Energy saving (A)
£
PV(A) £
NPV £
Payback period (years)
0 0 57.29 13.97 4.96 0 0 0 5867.4 13337.4 66.00 46.00 276000.00 0.00 276000.00 19.53 0.00 1.20 20.73 0.00 0.00 0.00 0.00 025 94 43 10.4775 4.96 12404.813 30259.929 203.179386 4227.247 9982.447 82.00 57.00 342500.00 17257.06 359757.06 14.66 0.30 3.16 18.12 12.59 3354.95 78804.42 -4952.64 26.7550 187 43 6.985 4.96 24677.661 23563.4558 6327.8518 3014.1305 8769.33 82.00 57.00 342500.00 34514.12 377014.12 12.41 0.60 3.16 16.18 21.96 4568.07 107299.29 6285.17 23.575 281 43 3.4925 4.96 37082.474 19750.3654 14919.208 2093.6868 7848.887 82.00 57.00 342500.00 51771.18 394271.18 10.24 0.91 3.16 14.31 30.96 5488.51 128919.57 10648.40 22.85
100 375 43 0 4.96 49487.288 17131.2544 24705.6387 1286.6219 7041.822 82.00 57.00 342500.00 69028.24 411528.24 8.08 1.21 3.16 12.45 39.96 6295.58 147876.71 12348.47 22.75Carbon Offset 1002 43 0 4.96 132230.03 8647.1052 98964.2342 -3242.796 2512.404 82.00 57.00 342500.00 217790.64 560290.64 -6.39 3.23 3.16 0.00 100.00 10825.00 254268.11 -30022.54 28.15Carbon Offset 1002 43 0 4.96 132230.03 8647.1052 98964.2342 -8685.829 -2930.63 82.00 57.00 342500.00 217790.64 560290.64 -6.39 3.23 3.16 0.00 100.00 16268.03 382119.39 97828.75 18.3
PV + 0.08 - 0.11
PV + 0.07 - 0.10
PV + 2010 notional building fabric
Distribution Warehouse - London
PV + 0.17 - 0.24
PV + 0.15 - 0.21
PV + 0.13 - 0.19
PV + 0.12 - 0.17
PV + 0.11 - 0.15
PV (future FiT) + Insulation

216
Table B. 23 Distribution warehouse - PV (current FiT) + improving the building fabric U-value down to 0.07-0.1 W/m2.K (PUR) + TSC
provided Elec. & heating
TSC area m2
PV area m2
Heating (KWh/m2)
Lighting (KWh/m2)
Hot water (KWh/m2)
TSC fan power
(KWh/m2)
generated Elec by PV
(KWh)
purchased from grid
elec (KWh)
Exported Elec
(KWh)
Elec cost £
Energy cost Inc
FIT £
Wall Insulation price £/m2
Roof Insulation price £/m2
Total Insulation
price £TSC cost £ PV Cost £ Fabric cost £
Operational CO2
(kgCO2/m2.yr)
PV ECO2
(kgCO2/m2.yr)
TSC ECO2
(kgCO2/m2.yr)
Insulation ECO2
(kgCO2/m2.yr)
Total CO2
(kgCO2/m2.yr)CO2
saving %
Energy saving (A)
£
PV(A) £
NPV £
Payback period (years)
0 0 0 57.29 13.97 4.96 0 0 0 0 5867.4 13337.4 66.00 46.00 276000.00 0.00 0.00 276000.00 19.53 0.00 0.00 1.20 20.73 0.00 0.00 0.00 0.00 025% 275 94 42.97 10.4775 4.96 0.2864 12404.8134 30259.929 203.1794 2428.549 8300.437 66.00 46.00 276000.00 41250.00 17257.06 334507.06 14.80 0.30 0.11 1.20 16.42 20.81 5036.96 118313.12 59806.06 1250% 750 187 28.65 6.985 4.96 0.5728 24677.6607 23563.4558 6327.852 -564.13 3709.646 66.00 46.00 276000.00 112500.00 34514.12 423014.12 9.90 0.60 0.31 1.20 12.01 42.05 9627.75 226146.12 79132.01 15.975% 1300 281 14.32 3.4925 4.96 0.8594 37082.4741 19750.3654 14919.21 -3283.27 -608.724 66.00 46.00 276000.00 195000.00 51771.18 522771.18 5.07 0.91 0.53 1.20 7.71 62.79 13946.12 327580.22 80809.04 18.55
75-100 1300 375 14.32 0 4.96 0.8594 49487.2875 17131.2544 24705.64 -5889.03 -3214.49 66.00 46.00 276000.00 195000.00 69028.24 540028.24 2.91 1.21 0.53 1.20 5.85 71.79 16551.89 388786.93 124758.70 16.65Carbon Offsetting 1300 650 14.32 0 4.96 0 85777.965 12455.3763 56320.44 -13228.5 -10914.9 66.00 46.00 276000.00 195000.00 141281.35 612281.35 -3.89 2.10 0.53 1.20 -0.06 100.30 24252.27 569661.12 233379.77 14.4
provided Elec. & heating
TSC area m2
PV area m2
Heating (KWh/m2)
Lighting (KWh/m2)
Hot water (KWh/m2)
TSC fan power
(KWh/m2)
generated Elec by PV
(KWh)
purchased from grid
elec (KWh)
Exported Elec
(KWh)
Elec cost £
Energy cost Inc
FIT £
Wall Insulation price £/m2
Roof Insulation price £/m2
Total Insulation
price £TSC cost £ PV Cost £ Fabric cost £
Operational CO2
(kgCO2/m2.yr)
PV ECO2
(kgCO2/m2.yr)
TSC ECO2
(kgCO2/m2.yr)
Insulation ECO2
(kgCO2/m2.yr)
Total CO2
(kgCO2/m2.yr)CO2
saving %
Energy saving (A)
£
PV(A) £
NPV £
Payback period (years)
0 0 0 57.29 13.97 4.96 0 0 0 0 5867.4 13337.4 66.00 46.00 276000.00 0.00 0.00 276000.00 19.53 0.00 0.00 1.20 20.73 0.00 0.00 0.00 0.00 025 250 94 41.5 10.4775 4.96 0.3158 12404.8134 30259.929 203.1794 2428.549 8136.385 67.00 47.00 281000.00 37500.00 17257.06 335757.06 14.53 0.30 0.10 1.3 16.23 21.69 5201.01 122166.53 62409.48 11.8550 700 187 27.7 6.985 4.96 0.5918 24677.6607 23563.4558 6327.852 -564.13 3603.626 67.00 47.00 281000.00 105000.00 34514.12 420514.12 9.73 0.60 0.29 1.3 11.92 42.52 9733.77 228636.43 84122.31 15.4575 1250 281 13.42 3.4925 4.96 0.8774 37082.4741 19750.3654 14919.21 -3283.27 -709.164 67.00 47.00 281000.00 187500.00 51771.18 520271.18 4.91 0.91 0.51 1.3 7.63 63.21 14046.56 329939.45 85668.28 18.2
75-100 1250 375 13.42 0 4.96 0.8774 49487.2875 17131.2544 24705.64 -5889.03 -3314.93 67.00 47.00 281000.00 187500.00 69028.24 537528.24 2.74 1.21 0.51 1.3 5.76 72.21 16652.33 391146.16 129617.93 16.4Carbon Offsetting 1250 665 13.42 0 4.96 0.8774 87757.4565 12247.1214 58091.67 -13624.4 -11050.3 67.00 47.00 281000.00 187500.00 144541.69 613041.69 -3.95 2.15 0.51 1.3 0.00 99.98 24387.65 572841.05 235799.36 14.35
provided Elec. & heating
TSC area m2
PV area m2
Heating (KWh/m2)
Lighting (KWh/m2)
Hot water (KWh/m2)
TSC fan power
(KWh/m2)
generated Elec by PV
(KWh)
purchased from grid
elec (KWh)
Exported Elec
(KWh)
Elec cost £
Energy cost Inc
FIT £
Wall Insulation price £/m2
Roof Insulation price £/m2
Total Insulation
price £TSC cost £ PV Cost £ Fabric cost £
Operational CO2
(kgCO2/m2.yr)
PV ECO2
(kgCO2/m2.yr)
TSC ECO2
(kgCO2/m2.yr)
Insulation ECO2
(kgCO2/m2.yr)
Total CO2
(kgCO2/m2.yr)CO2
saving %
Energy saving (A)
£
PV(A) £
NPV £
Payback period (years)
0 0 0 57.29 13.97 4.96 0 0 0 0 5867.4 13337.4 66.00 46.00 276000.00 0.00 0.00 276000.00 19.53 0.00 0.00 1.20 20.73 0.00 0.00 0.00 0.00 025 235 94 39.66 10.4775 4.96 0.3526 12404.8134 30259.929 203.1794 2428.549 7931.041 68.50 48.00 287150.00 35250.00 17257.06 339657.06 14.19 0.30 0.10 1.49 16.08 22.45 5406.36 126989.86 63332.80 12.1550 685 187 26.44 6.985 4.96 0.617 24677.6607 23563.4558 6327.852 -564.13 3463.01 68.50 48.00 287150.00 102750.00 34514.12 424414.12 9.49 0.60 0.28 1.49 11.87 42.76 9874.39 231939.35 83525.24 15.6575 1235 281 13.22 3.4925 4.96 0.8814 37082.4741 19750.3654 14919.21 -3283.27 -731.484 68.50 48.00 287150.00 185250.00 51771.18 524171.18 4.87 0.91 0.51 1.49 7.77 62.50 14068.88 330463.73 82292.55 18.5
75-100 1235 375 13.22 0 4.96 0.8814 49487.2875 17131.2544 24705.64 -5889.03 -3337.25 68.50 48.00 287150.00 185250.00 69028.24 541428.24 2.70 1.21 0.51 1.49 5.91 71.50 16674.65 391670.44 126242.20 16.6Carbon Offsetting 1235 673 13.22 0 4.96 0.8814 88813.1853 12136.0521 59036.33 -13835.5 -11283.7 68.50 48.00 287150.00 185250.00 146280.54 618680.54 -4.18 2.17 0.51 1.49 -0.01 100.04 24621.11 578324.79 235644.25 14.45
provided Elec. & heating
TSC area m2
PV area m2
Heating (KWh/m2)
Lighting (KWh/m2)
Hot water (KWh/m2)
TSC fan power
(KWh/m2)
generated Elec by PV
(KWh)
purchased from grid
elec (KWh)
Exported Elec
(KWh)
Elec cost £
Energy cost Inc
FIT £
Wall Insulation price £/m2
Roof Insulation price £/m2
Total Insulation
price £TSC cost £ PV Cost £ Fabric cost £
Operational CO2
(kgCO2/m2.yr)
PV ECO2
(kgCO2/m2.yr)
TSC ECO2
(kgCO2/m2.yr)
Insulation ECO2
(kgCO2/m2.yr)
Total CO2
(kgCO2/m2.yr)CO2
saving %
Energy saving (A)
£
PV(A) £
NPV £
Payback period (years)
0 0 0 57.29 13.97 4.96 0 0 0 0 5867.4 13337.4 66.00 46.00 276000.00 0.00 0.00 276000.00 19.53 0.00 0.00 1.20 20.73 0.00 0.00 0.00 0.00 025 225 94 38.15 10.4775 4.96 0.3828 12404.8134 30259.929 203.1794 2428.549 7762.525 70.00 49.00 293300.00 33750.00 17257.06 344307.06 13.91 0.30 0.09 1.67 15.97 22.95 5574.87 130948.12 62641.07 12.6550 675 187 25.42 6.985 4.96 0.6374 24677.6607 23563.4558 6327.852 -564.13 3349.178 70.00 49.00 293300.00 101250.00 34514.12 429064.12 9.30 0.60 0.28 1.67 11.85 42.82 9988.22 234613.15 81549.03 15.9575 1230 281 12.7 3.4925 4.96 0.8918 37082.4741 19750.3654 14919.21 -3283.27 -789.516 70.00 49.00 293300.00 184500.00 51771.18 529571.18 4.77 0.91 0.50 1.67 7.86 62.11 14126.92 331826.84 78255.66 18.825
75-100 1230 375 12.7 0 4.96 0.8918 49487.2875 17131.2544 24705.64 -5889.03 -3395.28 70.00 49.00 293300.00 184500.00 69028.24 546828.24 2.60 1.21 0.50 1.67 5.99 71.11 16732.68 393033.55 122205.32 16.9Carbon Offsetting 1230 677 12.7 0 4.96 0.8918 89341.0497 12080.5175 59508.66 -13941.1 -11447.3 70.00 49.00 293300.00 184500.00 147149.96 624949.96 -4.36 2.18 0.50 1.67 -0.01 100.03 24784.71 582167.63 233217.67 14.62
provided Elec. & heating
TSC area m2
PV area m2
Heating (KWh/m2)
Lighting (KWh/m2)
Hot water (KWh/m2)
TSC fan power
(KWh/m2)
generated Elec by PV
(KWh)
purchased from grid
elec (KWh)
Exported Elec
(KWh)
Elec cost £
Energy cost Inc
FIT £
Wall Insulation price £/m2
Roof Insulation price £/m2
Total Insulation
price £TSC cost £ PV Cost £ Fabric cost £
Operational CO2
(kgCO2/m2.yr)
PV ECO2
(kgCO2/m2.yr)
TSC ECO2
(kgCO2/m2.yr)
Insulation ECO2
(kgCO2/m2.yr)
Total CO2
(kgCO2/m2.yr)CO2
saving %
Energy saving (A)
£
PV(A) £
NPV £
Payback period (years)
0 0 0 57.29 13.97 4.96 0 0 0 0 5867.4 13337.4 66.00 46.00 276000.00 0.00 0.00 276000.00 19.53 0.00 0.00 1.20 20.73 0.00 0.00 0.00 0.00 025 220 94 36.6 10.4775 4.96 0.4138 12404.8134 30259.929 203.1794 2428.549 7589.545 71.50 50.00 299450.00 33000.00 17257.06 349707.06 13.62 0.30 0.09 1.86 15.87 23.43 5747.85 135011.25 61304.19 13.2550 685 187 24.4 6.985 4.96 0.6578 24677.6607 23563.4558 6327.852 -564.13 3235.346 71.50 50.00 299450.00 102750.00 34514.12 436714.12 9.11 0.60 0.28 1.86 11.86 42.80 10102.05 237286.95 76572.83 16.675 1225 281 12.21 3.4925 4.96 0.9016 37082.4741 19750.3654 14919.21 -3283.27 -844.2 71.50 50.00 299450.00 183750.00 51771.18 534971.18 4.68 0.91 0.50 1.86 7.95 61.64 14181.60 333111.31 74140.14 19.15
75-100 1225 375 12.21 0 4.96 0.9016 49487.2875 17131.2544 24705.64 -5889.03 -3449.96 71.50 50.00 299450.00 183750.00 69028.24 552228.24 2.51 1.21 0.50 1.86 6.09 70.64 16787.36 394318.02 118089.79 17.2Carbon Offsetting 1225 682 12.21 0 4.96 0.9016 90132.8463 12003.1919 60222.36 -14098.8 -11659.7 71.50 50.00 299450.00 183750.00 148454.10 631654.10 -4.59 2.20 0.50 1.86 -0.03 100.15 24997.15 587157.55 231503.45 14.8
provided Elec. & heating
TSC area m2
PV area m2
Heating (KWh/m2)
Lighting (KWh/m2)
Hot water (KWh/m2)
TSC fan power
(KWh/m2)
generated Elec by PV
(KWh)
purchased from grid
elec (KWh)
Exported Elec
(KWh)
Elec cost £
Energy cost Inc
FIT £
Wall Insulation price £/m2
Roof Insulation price £/m2
Total Insulation
price £TSC cost £ PV Cost £ Fabric cost £
Operational CO2
(kgCO2/m2.yr)
PV ECO2
(kgCO2/m2.yr)
TSC ECO2
(kgCO2/m2.yr)
Insulation ECO2
(kgCO2/m2.yr)
Total CO2
(kgCO2/m2.yr)CO2
saving %
Energy saving (A)
£
PV(A) £
NPV £
Payback period (years)
0 0 0 57.29 13.97 4.96 0 0 0 0 5867.4 13337.4 66.00 46.00 276000.00 0.00 0.00 276000.00 19.53 0.00 0.00 1.20 20.73 0.00 0.00 0.00 0.00 025 215 94 35.55 10.4775 4.96 0.4348 12404.8134 30259.929 203.1794 2428.549 7472.365 73.00 51.00 305600.00 32250.00 17257.06 355107.06 13.42 0.30 0.09 2.04 15.86 23.51 5865.03 137763.69 58656.63 1450 665 187 23.7 6.985 4.96 0.6718 24677.6607 23563.4558 6327.852 -564.13 3157.226 73.00 51.00 305600.00 99750.00 34514.12 439864.12 8.98 0.60 0.27 2.04 11.90 42.60 10180.17 239121.91 75257.79 16.875 1220 281 11.85 3.4925 4.96 0.9088 37082.4741 19750.3654 14919.21 -3283.27 -884.376 73.00 51.00 305600.00 183000.00 51771.18 540371.18 4.62 0.91 0.50 2.04 8.06 61.10 14221.78 334055.01 69683.83 19.55
75-100 1220 375 11.85 0 4.96 0.9088 49487.2875 17131.2544 24705.64 -5889.03 -3490.14 73.00 51.00 305600.00 183000.00 69028.24 557628.24 2.45 1.21 0.50 2.04 6.20 70.10 16827.54 395261.72 113633.48 17.5Carbon Offsetting 1220 687 11.85 0 4.96 0.9088 90660.7107 11949.0147 60694.69 -14204.2 -11805.3 73.00 51.00 305600.00 183000.00 149323.52 637923.52 -4.75 2.22 0.50 2.04 0.00 99.98 25142.71 590576.51 228652.98 14.95
provided Elec. & heating
TSC area m2
PV area m2
Heating (KWh/m2)
Lighting (KWh/m2)
Hot water (KWh/m2)
TSC fan power
(KWh/m2)
generated Elec by PV
(KWh)
purchased from grid
elec (KWh)
Exported Elec
(KWh)
Elec cost £
Energy cost Inc
FIT £
Wall Insulation price £/m2
Roof Insulation price £/m2
Total Insulation
price £TSC cost £ PV Cost £ Fabric cost £
Operational CO2
(kgCO2/m2.yr)
PV ECO2
(kgCO2/m2.yr)
TSC ECO2
(kgCO2/m2.yr)
Insulation ECO2
(kgCO2/m2.yr)
Total CO2
(kgCO2/m2.yr)CO2
saving %
Energy saving (A)
£
PV(A) £
NPV £
Payback period (years)
0 0 0 57.29 13.97 4.96 0 0 0 0 5867.4 13337.4 66.00 46.00 276000.00 0.00 0.00 276000.00 19.53 0.00 0.00 1.20 20.73 0.00 0.00 0.00 0.00 025 200 94 33 10.4775 4.96 0.4858 12404.8134 30259.929 203.1794 2428.549 7187.785 79.00 55.00 330200.00 30000.00 17257.06 377457.06 12.95 0.30 0.08 2.79 16.13 22.21 6149.61 144448.18 42991.12 17.2550 660 187 22 6.985 4.96 0.7058 24677.6607 23563.4558 6327.852 -564.13 2967.506 79.00 55.00 330200.00 99000.00 34514.12 463714.12 8.67 0.60 0.27 2.79 12.33 40.51 10369.89 243578.24 55864.12 1975 1215 281 11 3.4925 4.96 0.9258 37082.4741 19750.3654 14919.21 -3283.27 -979.236 79.00 55.00 330200.00 182250.00 51771.18 564221.18 4.46 0.91 0.50 2.79 8.65 58.26 14316.64 336283.17 48061.99 21.25
75-100 1215 375 11 0 4.96 0.9258 49487.2875 17131.2544 24705.64 -5889.03 -3585 79.00 55.00 330200.00 182250.00 69028.24 581478.24 2.29 1.21 0.50 2.79 6.79 67.26 16922.40 397489.88 92011.65 18.95Carbon Offsetting 1215 717 11 0 4.96 0.9258 94619.6937 11567.1196 64253.54 -14991.9 -12687.8 79.00 55.00 330200.00 182250.00 155844.20 668294.20 -5.60 2.31 0.50 2.79 0.00 99.99 26025.23 611306.15 219011.95 15.7
provided Elec. & heating
TSC area m2
PV area m2
Heating (KWh/m2)
Lighting (KWh/m2)
Hot water (KWh/m2)
TSC fan power
(KWh/m2)
generated Elec by PV
(KWh)
purchased from grid
elec (KWh)
Exported Elec
(KWh)
Elec cost £
Energy cost Inc
FIT £
Wall Insulation price £/m2
Roof Insulation price £/m2
Total Insulation
price £TSC cost £ PV Cost £ Fabric cost £
Operational CO2
(kgCO2/m2.yr)
PV ECO2
(kgCO2/m2.yr)
TSC ECO2
(kgCO2/m2.yr)
Insulation ECO2
(kgCO2/m2.yr)
Total CO2
(kgCO2/m2.yr)CO2
saving %
Energy saving (A)
£
PV(A) £
NPV £
Payback period (years)
0 0 0 57.29 13.97 4.96 0 0 0 0 5867.4 13337.4 66.00 46.00 276000.00 0.00 0.00 276000.00 19.53 0.00 0.00 1.20 20.73 0.00 0.00 0.00 0.00 025 195 94 32.25 10.4775 4.96 0.5008 12404.8134 30259.929 203.1794 2428.549 7104.085 82.00 57.00 342500.00 29250.00 17257.06 389007.06 12.81 0.30 0.08 3.16 16.36 21.10 6233.31 146414.21 33407.15 1950 650 187 21.5 6.985 4.96 0.7158 24677.6607 23563.4558 6327.852 -564.13 2911.706 82.00 57.00 342500.00 97500.00 34514.12 474514.12 8.58 0.60 0.27 3.16 12.61 39.19 10425.69 244888.92 46374.80 2075 1210 281 10.75 3.4925 4.96 0.9308 37082.4741 19750.3654 14919.21 -3283.27 -1007.14 82.00 57.00 342500.00 181500.00 51771.18 575771.18 4.41 0.91 0.50 3.16 8.98 56.70 14344.54 336938.51 37167.34 22.1
75-100 1210 375 10.75 0 4.96 0.9308 49487.2875 17131.2544 24705.64 -5889.03 -3612.9 82.00 57.00 342500.00 181500.00 69028.24 593028.24 2.24 1.21 0.50 3.16 7.11 65.71 16950.30 398145.22 81116.99 19.65Carbon Offsetting 1210 735 10.75 0 4.96 0.9308 96995.0835 11331.2073 66379.03 -15465 -13188.8 82.00 57.00 342500.00 181500.00 159756.61 683756.61 -6.06 2.37 0.50 3.16 -0.03 100.15 26526.24 623074.27 215317.66 16
TSC + PV + FIT + 0.08 - 0.11
TSC + PV + FIT + 0.07 - 0.10
Distribution Warehouse-London
TSC + PV + FIT + 2010 notional building fabric
TSC + PV + FIT + 0.17 - 0.24
TSC + PV + FIT + 0.15 - 0.21
TSC + PV + FIT + 0.13 - 0.19
TSC + PV + FIT + 0.11 - 0.15
TSC + PV + FIT + 0.12 - 0.17
PV (current FiT) + Insulation + TSC
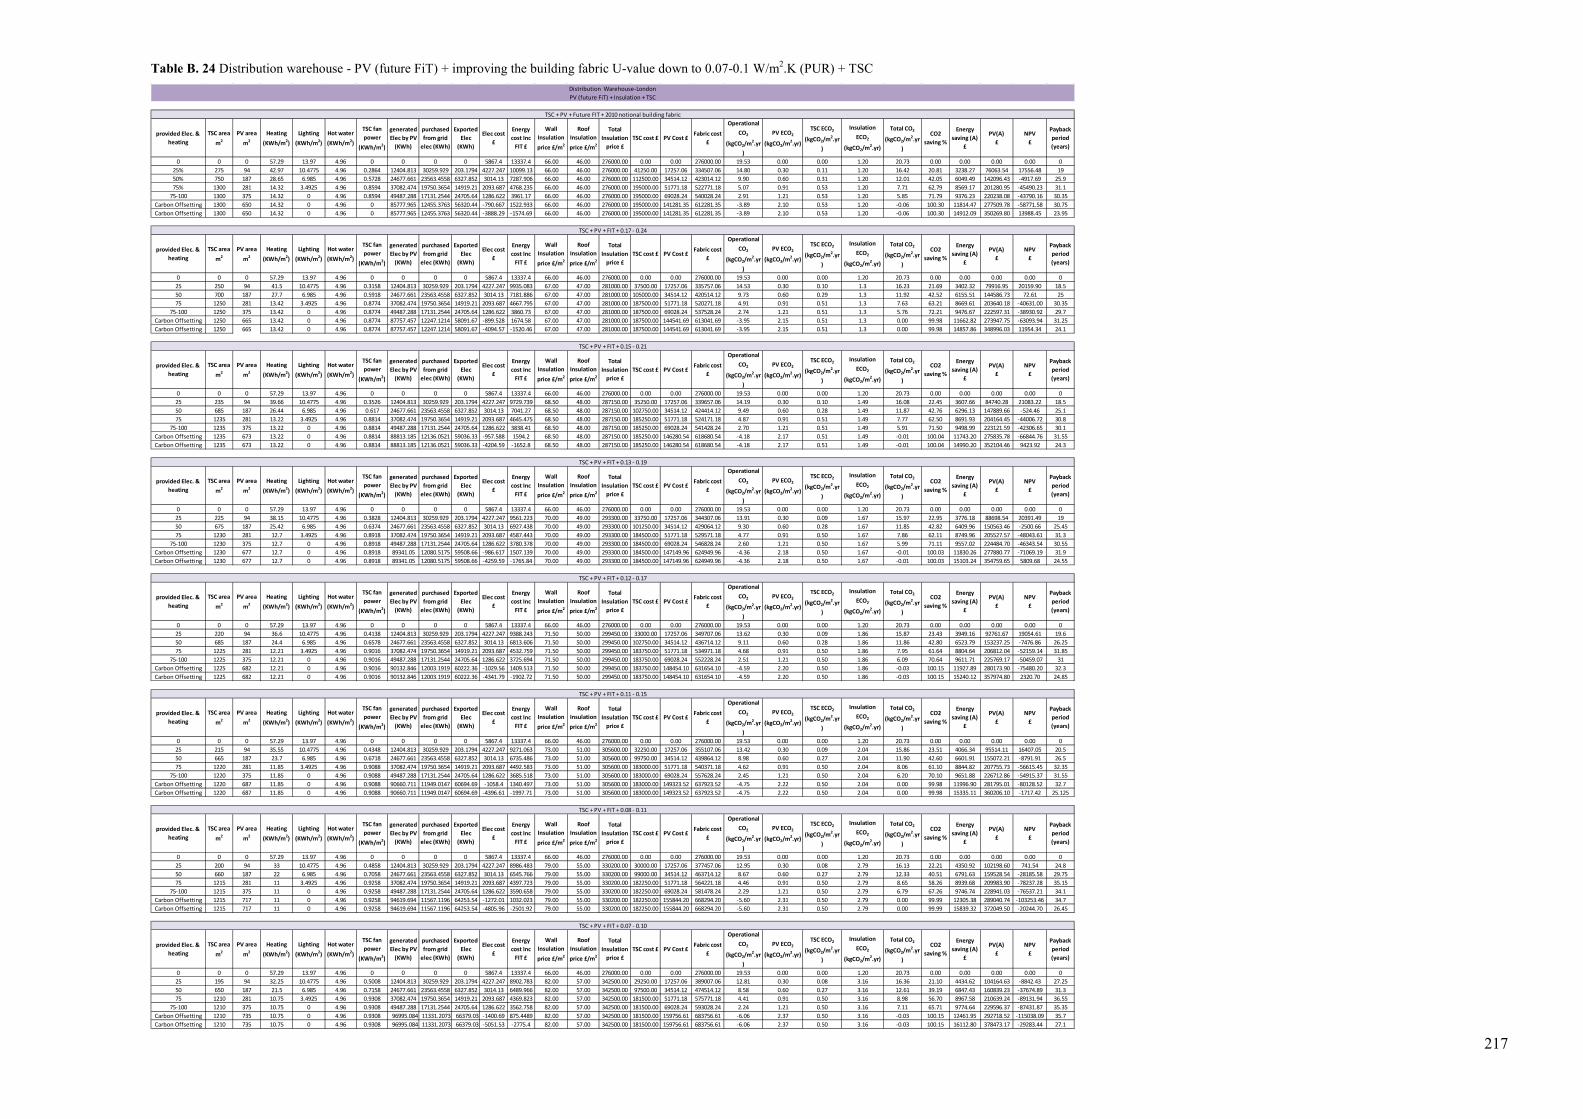
217
Table B. 24 Distribution warehouse - PV (future FiT) + improving the building fabric U-value down to 0.07-0.1 W/m2.K (PUR) + TSC
provided Elec. & heating
TSC area m2
PV area m2
Heating (KWh/m2)
Lighting (KWh/m2)
Hot water (KWh/m2)
TSC fan power
(KWh/m2)
generated Elec by PV
(KWh)
purchased from grid
elec (KWh)
Exported Elec
(KWh)
Elec cost £
Energy cost Inc
FIT £
Wall Insulation price £/m2
Roof Insulation price £/m2
Total Insulation
price £TSC cost £ PV Cost £
Fabric cost £
Operational CO2
(kgCO2/m2.yr)
PV ECO2
(kgCO2/m2.yr)
TSC ECO2
(kgCO2/m2.yr)
Insulation ECO2
(kgCO2/m2.yr)
Total CO2
(kgCO2/m2.yr)
CO2 saving %
Energy saving (A)
£
PV(A) £
NPV £
Payback period (years)
0 0 0 57.29 13.97 4.96 0 0 0 0 5867.4 13337.4 66.00 46.00 276000.00 0.00 0.00 276000.00 19.53 0.00 0.00 1.20 20.73 0.00 0.00 0.00 0.00 025% 275 94 42.97 10.4775 4.96 0.2864 12404.813 30259.929 203.1794 4227.247 10099.13 66.00 46.00 276000.00 41250.00 17257.06 334507.06 14.80 0.30 0.11 1.20 16.42 20.81 3238.27 76063.54 17556.48 1950% 750 187 28.65 6.985 4.96 0.5728 24677.661 23563.4558 6327.852 3014.13 7287.906 66.00 46.00 276000.00 112500.00 34514.12 423014.12 9.90 0.60 0.31 1.20 12.01 42.05 6049.49 142096.43 -4917.69 25.975% 1300 281 14.32 3.4925 4.96 0.8594 37082.474 19750.3654 14919.21 2093.687 4768.235 66.00 46.00 276000.00 195000.00 51771.18 522771.18 5.07 0.91 0.53 1.20 7.71 62.79 8569.17 201280.95 -45490.23 31.1
75-100 1300 375 14.32 0 4.96 0.8594 49487.288 17131.2544 24705.64 1286.622 3961.17 66.00 46.00 276000.00 195000.00 69028.24 540028.24 2.91 1.21 0.53 1.20 5.85 71.79 9376.23 220238.08 -43790.16 30.35Carbon Offsetting 1300 650 14.32 0 4.96 0 85777.965 12455.3763 56320.44 -790.667 1522.933 66.00 46.00 276000.00 195000.00 141281.35 612281.35 -3.89 2.10 0.53 1.20 -0.06 100.30 11814.47 277509.78 -58771.58 30.75Carbon Offsetting 1300 650 14.32 0 4.96 0 85777.965 12455.3763 56320.44 -3888.29 -1574.69 66.00 46.00 276000.00 195000.00 141281.35 612281.35 -3.89 2.10 0.53 1.20 -0.06 100.30 14912.09 350269.80 13988.45 23.95
provided Elec. & heating
TSC area m2
PV area m2
Heating (KWh/m2)
Lighting (KWh/m2)
Hot water (KWh/m2)
TSC fan power
(KWh/m2)
generated Elec by PV
(KWh)
purchased from grid
elec (KWh)
Exported Elec
(KWh)
Elec cost £
Energy cost Inc
FIT £
Wall Insulation price £/m2
Roof Insulation price £/m2
Total Insulation
price £TSC cost £ PV Cost £
Fabric cost £
Operational CO2
(kgCO2/m2.yr)
PV ECO2
(kgCO2/m2.yr)
TSC ECO2
(kgCO2/m2.yr)
Insulation ECO2
(kgCO2/m2.yr)
Total CO2
(kgCO2/m2.yr)
CO2 saving %
Energy saving (A)
£
PV(A) £
NPV £
Payback period (years)
0 0 0 57.29 13.97 4.96 0 0 0 0 5867.4 13337.4 66.00 46.00 276000.00 0.00 0.00 276000.00 19.53 0.00 0.00 1.20 20.73 0.00 0.00 0.00 0.00 025 250 94 41.5 10.4775 4.96 0.3158 12404.813 30259.929 203.1794 4227.247 9935.083 67.00 47.00 281000.00 37500.00 17257.06 335757.06 14.53 0.30 0.10 1.3 16.23 21.69 3402.32 79916.95 20159.90 18.550 700 187 27.7 6.985 4.96 0.5918 24677.661 23563.4558 6327.852 3014.13 7181.886 67.00 47.00 281000.00 105000.00 34514.12 420514.12 9.73 0.60 0.29 1.3 11.92 42.52 6155.51 144586.73 72.61 2575 1250 281 13.42 3.4925 4.96 0.8774 37082.474 19750.3654 14919.21 2093.687 4667.795 67.00 47.00 281000.00 187500.00 51771.18 520271.18 4.91 0.91 0.51 1.3 7.63 63.21 8669.61 203640.18 -40631.00 30.35
75-100 1250 375 13.42 0 4.96 0.8774 49487.288 17131.2544 24705.64 1286.622 3860.73 67.00 47.00 281000.00 187500.00 69028.24 537528.24 2.74 1.21 0.51 1.3 5.76 72.21 9476.67 222597.31 -38930.92 29.7Carbon Offsetting 1250 665 13.42 0 4.96 0.8774 87757.457 12247.1214 58091.67 -899.528 1674.58 67.00 47.00 281000.00 187500.00 144541.69 613041.69 -3.95 2.15 0.51 1.3 0.00 99.98 11662.82 273947.75 -63093.94 31.25Carbon Offsetting 1250 665 13.42 0 4.96 0.8774 87757.457 12247.1214 58091.67 -4094.57 -1520.46 67.00 47.00 281000.00 187500.00 144541.69 613041.69 -3.95 2.15 0.51 1.3 0.00 99.98 14857.86 348996.03 11954.34 24.1
provided Elec. & heating
TSC area m2
PV area m2
Heating (KWh/m2)
Lighting (KWh/m2)
Hot water (KWh/m2)
TSC fan power
(KWh/m2)
generated Elec by PV
(KWh)
purchased from grid
elec (KWh)
Exported Elec
(KWh)
Elec cost £
Energy cost Inc
FIT £
Wall Insulation price £/m2
Roof Insulation price £/m2
Total Insulation
price £TSC cost £ PV Cost £
Fabric cost £
Operational CO2
(kgCO2/m2.yr)
PV ECO2
(kgCO2/m2.yr)
TSC ECO2
(kgCO2/m2.yr)
Insulation ECO2
(kgCO2/m2.yr)
Total CO2
(kgCO2/m2.yr)
CO2 saving %
Energy saving (A)
£
PV(A) £
NPV £
Payback period (years)
0 0 0 57.29 13.97 4.96 0 0 0 0 5867.4 13337.4 66.00 46.00 276000.00 0.00 0.00 276000.00 19.53 0.00 0.00 1.20 20.73 0.00 0.00 0.00 0.00 025 235 94 39.66 10.4775 4.96 0.3526 12404.813 30259.929 203.1794 4227.247 9729.739 68.50 48.00 287150.00 35250.00 17257.06 339657.06 14.19 0.30 0.10 1.49 16.08 22.45 3607.66 84740.28 21083.22 18.550 685 187 26.44 6.985 4.96 0.617 24677.661 23563.4558 6327.852 3014.13 7041.27 68.50 48.00 287150.00 102750.00 34514.12 424414.12 9.49 0.60 0.28 1.49 11.87 42.76 6296.13 147889.66 -524.46 25.175 1235 281 13.22 3.4925 4.96 0.8814 37082.474 19750.3654 14919.21 2093.687 4645.475 68.50 48.00 287150.00 185250.00 51771.18 524171.18 4.87 0.91 0.51 1.49 7.77 62.50 8691.93 204164.45 -44006.72 30.8
75-100 1235 375 13.22 0 4.96 0.8814 49487.288 17131.2544 24705.64 1286.622 3838.41 68.50 48.00 287150.00 185250.00 69028.24 541428.24 2.70 1.21 0.51 1.49 5.91 71.50 9498.99 223121.59 -42306.65 30.1Carbon Offsetting 1235 673 13.22 0 4.96 0.8814 88813.185 12136.0521 59036.33 -957.588 1594.2 68.50 48.00 287150.00 185250.00 146280.54 618680.54 -4.18 2.17 0.51 1.49 -0.01 100.04 11743.20 275835.78 -66844.76 31.55Carbon Offsetting 1235 673 13.22 0 4.96 0.8814 88813.185 12136.0521 59036.33 -4204.59 -1652.8 68.50 48.00 287150.00 185250.00 146280.54 618680.54 -4.18 2.17 0.51 1.49 -0.01 100.04 14990.20 352104.46 9423.92 24.3
provided Elec. & heating
TSC area m2
PV area m2
Heating (KWh/m2)
Lighting (KWh/m2)
Hot water (KWh/m2)
TSC fan power
(KWh/m2)
generated Elec by PV
(KWh)
purchased from grid
elec (KWh)
Exported Elec
(KWh)
Elec cost £
Energy cost Inc
FIT £
Wall Insulation price £/m2
Roof Insulation price £/m2
Total Insulation
price £TSC cost £ PV Cost £
Fabric cost £
Operational CO2
(kgCO2/m2.yr)
PV ECO2
(kgCO2/m2.yr)
TSC ECO2
(kgCO2/m2.yr)
Insulation ECO2
(kgCO2/m2.yr)
Total CO2
(kgCO2/m2.yr)
CO2 saving %
Energy saving (A)
£
PV(A) £
NPV £
Payback period (years)
0 0 0 57.29 13.97 4.96 0 0 0 0 5867.4 13337.4 66.00 46.00 276000.00 0.00 0.00 276000.00 19.53 0.00 0.00 1.20 20.73 0.00 0.00 0.00 0.00 025 225 94 38.15 10.4775 4.96 0.3828 12404.813 30259.929 203.1794 4227.247 9561.223 70.00 49.00 293300.00 33750.00 17257.06 344307.06 13.91 0.30 0.09 1.67 15.97 22.95 3776.18 88698.54 20391.49 1950 675 187 25.42 6.985 4.96 0.6374 24677.661 23563.4558 6327.852 3014.13 6927.438 70.00 49.00 293300.00 101250.00 34514.12 429064.12 9.30 0.60 0.28 1.67 11.85 42.82 6409.96 150563.46 -2500.66 25.4575 1230 281 12.7 3.4925 4.96 0.8918 37082.474 19750.3654 14919.21 2093.687 4587.443 70.00 49.00 293300.00 184500.00 51771.18 529571.18 4.77 0.91 0.50 1.67 7.86 62.11 8749.96 205527.57 -48043.61 31.3
75-100 1230 375 12.7 0 4.96 0.8918 49487.288 17131.2544 24705.64 1286.622 3780.378 70.00 49.00 293300.00 184500.00 69028.24 546828.24 2.60 1.21 0.50 1.67 5.99 71.11 9557.02 224484.70 -46343.54 30.55Carbon Offsetting 1230 677 12.7 0 4.96 0.8918 89341.05 12080.5175 59508.66 -986.617 1507.139 70.00 49.00 293300.00 184500.00 147149.96 624949.96 -4.36 2.18 0.50 1.67 -0.01 100.03 11830.26 277880.77 -71069.19 31.9Carbon Offsetting 1230 677 12.7 0 4.96 0.8918 89341.05 12080.5175 59508.66 -4259.59 -1765.84 70.00 49.00 293300.00 184500.00 147149.96 624949.96 -4.36 2.18 0.50 1.67 -0.01 100.03 15103.24 354759.65 5809.68 24.55
provided Elec. & heating
TSC area m2
PV area m2
Heating (KWh/m2)
Lighting (KWh/m2)
Hot water (KWh/m2)
TSC fan power
(KWh/m2)
generated Elec by PV
(KWh)
purchased from grid
elec (KWh)
Exported Elec
(KWh)
Elec cost £
Energy cost Inc
FIT £
Wall Insulation price £/m2
Roof Insulation price £/m2
Total Insulation
price £TSC cost £ PV Cost £
Fabric cost £
Operational CO2
(kgCO2/m2.yr)
PV ECO2
(kgCO2/m2.yr)
TSC ECO2
(kgCO2/m2.yr)
Insulation ECO2
(kgCO2/m2.yr)
Total CO2
(kgCO2/m2.yr)
CO2 saving %
Energy saving (A)
£
PV(A) £
NPV £
Payback period (years)
0 0 0 57.29 13.97 4.96 0 0 0 0 5867.4 13337.4 66.00 46.00 276000.00 0.00 0.00 276000.00 19.53 0.00 0.00 1.20 20.73 0.00 0.00 0.00 0.00 025 220 94 36.6 10.4775 4.96 0.4138 12404.813 30259.929 203.1794 4227.247 9388.243 71.50 50.00 299450.00 33000.00 17257.06 349707.06 13.62 0.30 0.09 1.86 15.87 23.43 3949.16 92761.67 19054.61 19.650 685 187 24.4 6.985 4.96 0.6578 24677.661 23563.4558 6327.852 3014.13 6813.606 71.50 50.00 299450.00 102750.00 34514.12 436714.12 9.11 0.60 0.28 1.86 11.86 42.80 6523.79 153237.25 -7476.86 26.2575 1225 281 12.21 3.4925 4.96 0.9016 37082.474 19750.3654 14919.21 2093.687 4532.759 71.50 50.00 299450.00 183750.00 51771.18 534971.18 4.68 0.91 0.50 1.86 7.95 61.64 8804.64 206812.04 -52159.14 31.85
75-100 1225 375 12.21 0 4.96 0.9016 49487.288 17131.2544 24705.64 1286.622 3725.694 71.50 50.00 299450.00 183750.00 69028.24 552228.24 2.51 1.21 0.50 1.86 6.09 70.64 9611.71 225769.17 -50459.07 31Carbon Offsetting 1225 682 12.21 0 4.96 0.9016 90132.846 12003.1919 60222.36 -1029.56 1409.513 71.50 50.00 299450.00 183750.00 148454.10 631654.10 -4.59 2.20 0.50 1.86 -0.03 100.15 11927.89 280173.90 -75480.20 32.3Carbon Offsetting 1225 682 12.21 0 4.96 0.9016 90132.846 12003.1919 60222.36 -4341.79 -1902.72 71.50 50.00 299450.00 183750.00 148454.10 631654.10 -4.59 2.20 0.50 1.86 -0.03 100.15 15240.12 357974.80 2320.70 24.85
provided Elec. & heating
TSC area m2
PV area m2
Heating (KWh/m2)
Lighting (KWh/m2)
Hot water (KWh/m2)
TSC fan power
(KWh/m2)
generated Elec by PV
(KWh)
purchased from grid
elec (KWh)
Exported Elec
(KWh)
Elec cost £
Energy cost Inc
FIT £
Wall Insulation price £/m2
Roof Insulation price £/m2
Total Insulation
price £TSC cost £ PV Cost £
Fabric cost £
Operational CO2
(kgCO2/m2.yr)
PV ECO2
(kgCO2/m2.yr)
TSC ECO2
(kgCO2/m2.yr)
Insulation ECO2
(kgCO2/m2.yr)
Total CO2
(kgCO2/m2.yr)
CO2 saving %
Energy saving (A)
£
PV(A) £
NPV £
Payback period (years)
0 0 0 57.29 13.97 4.96 0 0 0 0 5867.4 13337.4 66.00 46.00 276000.00 0.00 0.00 276000.00 19.53 0.00 0.00 1.20 20.73 0.00 0.00 0.00 0.00 025 215 94 35.55 10.4775 4.96 0.4348 12404.813 30259.929 203.1794 4227.247 9271.063 73.00 51.00 305600.00 32250.00 17257.06 355107.06 13.42 0.30 0.09 2.04 15.86 23.51 4066.34 95514.11 16407.05 20.550 665 187 23.7 6.985 4.96 0.6718 24677.661 23563.4558 6327.852 3014.13 6735.486 73.00 51.00 305600.00 99750.00 34514.12 439864.12 8.98 0.60 0.27 2.04 11.90 42.60 6601.91 155072.21 -8791.91 26.575 1220 281 11.85 3.4925 4.96 0.9088 37082.474 19750.3654 14919.21 2093.687 4492.583 73.00 51.00 305600.00 183000.00 51771.18 540371.18 4.62 0.91 0.50 2.04 8.06 61.10 8844.82 207755.73 -56615.45 32.35
75-100 1220 375 11.85 0 4.96 0.9088 49487.288 17131.2544 24705.64 1286.622 3685.518 73.00 51.00 305600.00 183000.00 69028.24 557628.24 2.45 1.21 0.50 2.04 6.20 70.10 9651.88 226712.86 -54915.37 31.55Carbon Offsetting 1220 687 11.85 0 4.96 0.9088 90660.711 11949.0147 60694.69 -1058.4 1340.497 73.00 51.00 305600.00 183000.00 149323.52 637923.52 -4.75 2.22 0.50 2.04 0.00 99.98 11996.90 281795.01 -80128.52 32.7Carbon Offsetting 1220 687 11.85 0 4.96 0.9088 90660.711 11949.0147 60694.69 -4396.61 -1997.71 73.00 51.00 305600.00 183000.00 149323.52 637923.52 -4.75 2.22 0.50 2.04 0.00 99.98 15335.11 360206.10 -1717.42 25.125
provided Elec. & heating
TSC area m2
PV area m2
Heating (KWh/m2)
Lighting (KWh/m2)
Hot water (KWh/m2)
TSC fan power
(KWh/m2)
generated Elec by PV
(KWh)
purchased from grid
elec (KWh)
Exported Elec
(KWh)
Elec cost £
Energy cost Inc
FIT £
Wall Insulation price £/m2
Roof Insulation price £/m2
Total Insulation
price £TSC cost £ PV Cost £
Fabric cost £
Operational CO2
(kgCO2/m2.yr)
PV ECO2
(kgCO2/m2.yr)
TSC ECO2
(kgCO2/m2.yr)
Insulation ECO2
(kgCO2/m2.yr)
Total CO2
(kgCO2/m2.yr)
CO2 saving %
Energy saving (A)
£
PV(A) £
NPV £
Payback period (years)
0 0 0 57.29 13.97 4.96 0 0 0 0 5867.4 13337.4 66.00 46.00 276000.00 0.00 0.00 276000.00 19.53 0.00 0.00 1.20 20.73 0.00 0.00 0.00 0.00 025 200 94 33 10.4775 4.96 0.4858 12404.813 30259.929 203.1794 4227.247 8986.483 79.00 55.00 330200.00 30000.00 17257.06 377457.06 12.95 0.30 0.08 2.79 16.13 22.21 4350.92 102198.60 741.54 24.850 660 187 22 6.985 4.96 0.7058 24677.661 23563.4558 6327.852 3014.13 6545.766 79.00 55.00 330200.00 99000.00 34514.12 463714.12 8.67 0.60 0.27 2.79 12.33 40.51 6791.63 159528.54 -28185.58 29.7575 1215 281 11 3.4925 4.96 0.9258 37082.474 19750.3654 14919.21 2093.687 4397.723 79.00 55.00 330200.00 182250.00 51771.18 564221.18 4.46 0.91 0.50 2.79 8.65 58.26 8939.68 209983.90 -78237.28 35.15
75-100 1215 375 11 0 4.96 0.9258 49487.288 17131.2544 24705.64 1286.622 3590.658 79.00 55.00 330200.00 182250.00 69028.24 581478.24 2.29 1.21 0.50 2.79 6.79 67.26 9746.74 228941.03 -76537.21 34.1Carbon Offsetting 1215 717 11 0 4.96 0.9258 94619.694 11567.1196 64253.54 -1272.01 1032.023 79.00 55.00 330200.00 182250.00 155844.20 668294.20 -5.60 2.31 0.50 2.79 0.00 99.99 12305.38 289040.74 -103253.46 34.7Carbon Offsetting 1215 717 11 0 4.96 0.9258 94619.694 11567.1196 64253.54 -4805.96 -2501.92 79.00 55.00 330200.00 182250.00 155844.20 668294.20 -5.60 2.31 0.50 2.79 0.00 99.99 15839.32 372049.50 -20244.70 26.45
provided Elec. & heating
TSC area m2
PV area m2
Heating (KWh/m2)
Lighting (KWh/m2)
Hot water (KWh/m2)
TSC fan power
(KWh/m2)
generated Elec by PV
(KWh)
purchased from grid
elec (KWh)
Exported Elec
(KWh)
Elec cost £
Energy cost Inc
FIT £
Wall Insulation price £/m2
Roof Insulation price £/m2
Total Insulation
price £TSC cost £ PV Cost £
Fabric cost £
Operational CO2
(kgCO2/m2.yr)
PV ECO2
(kgCO2/m2.yr)
TSC ECO2
(kgCO2/m2.yr)
Insulation ECO2
(kgCO2/m2.yr)
Total CO2
(kgCO2/m2.yr)
CO2 saving %
Energy saving (A)
£
PV(A) £
NPV £
Payback period (years)
0 0 0 57.29 13.97 4.96 0 0 0 0 5867.4 13337.4 66.00 46.00 276000.00 0.00 0.00 276000.00 19.53 0.00 0.00 1.20 20.73 0.00 0.00 0.00 0.00 025 195 94 32.25 10.4775 4.96 0.5008 12404.813 30259.929 203.1794 4227.247 8902.783 82.00 57.00 342500.00 29250.00 17257.06 389007.06 12.81 0.30 0.08 3.16 16.36 21.10 4434.62 104164.63 -8842.43 27.2550 650 187 21.5 6.985 4.96 0.7158 24677.661 23563.4558 6327.852 3014.13 6489.966 82.00 57.00 342500.00 97500.00 34514.12 474514.12 8.58 0.60 0.27 3.16 12.61 39.19 6847.43 160839.23 -37674.89 31.375 1210 281 10.75 3.4925 4.96 0.9308 37082.474 19750.3654 14919.21 2093.687 4369.823 82.00 57.00 342500.00 181500.00 51771.18 575771.18 4.41 0.91 0.50 3.16 8.98 56.70 8967.58 210639.24 -89131.94 36.55
75-100 1210 375 10.75 0 4.96 0.9308 49487.288 17131.2544 24705.64 1286.622 3562.758 82.00 57.00 342500.00 181500.00 69028.24 593028.24 2.24 1.21 0.50 3.16 7.11 65.71 9774.64 229596.37 -87431.87 35.35Carbon Offsetting 1210 735 10.75 0 4.96 0.9308 96995.084 11331.2073 66379.03 -1400.69 875.4489 82.00 57.00 342500.00 181500.00 159756.61 683756.61 -6.06 2.37 0.50 3.16 -0.03 100.15 12461.95 292718.52 -115038.09 35.7Carbon Offsetting 1210 735 10.75 0 4.96 0.9308 96995.084 11331.2073 66379.03 -5051.53 -2775.4 82.00 57.00 342500.00 181500.00 159756.61 683756.61 -6.06 2.37 0.50 3.16 -0.03 100.15 16112.80 378473.17 -29283.44 27.1
TSC + PV + FIT + 0.08 - 0.11
TSC + PV + FIT + 0.07 - 0.10
Distribution Warehouse-London
TSC + PV + Future FIT + 2010 notional building fabric
TSC + PV + FIT + 0.17 - 0.24
TSC + PV + FIT + 0.15 - 0.21
TSC + PV + FIT + 0.13 - 0.19
TSC + PV + FIT + 0.12 - 0.17
TSC + PV + FIT + 0.11 - 0.15
PV (future FiT) + Insulation + TSC

218
Table B. 25 Retail shed - PV (current FiT) + improving the building fabric U-value down to 0.07-0.1 W/m2.K (PUR)
provided Elec. by PV
PV area m2
Heating (KWh/m2)
Lighting (KWh/m2)
Hot water (KWh/m2)
generated Elec by PV
(KWh)
purchased from grid
elec (KWh)
Exported Elec (KWh)
Elec Cost £
Energy cost Inc FIT
Wall Insulation price £/m2
Roof Insulation price £/m2
Total Insulation
price £
PV cost £
Fabric cost £
Operational CO2
(kgCO2/m2.yr)
PV ECO2
(kgCO2/m2.yr)
Insulation ECO2
(kgCO2/m2.yr)
Total CO2
(kgCO2/m2.yr)CO2
saving %
Energy saving (A)
£
PV(A) £
NPV £
Payback period (years)
0 0 32.9 31.8 1.98 0 0 0 13356 17541.6 66.00 46.00 276000.00 0.00 276000.00 23.52 0.00 1.20 24.72 0.00 0.00 0.00 0.00 025% 213 32.9 23.85 1.98 28108.7793 68675.2667 1695.68 5462.459 9648.058743 66.00 46.00 276000.00 39282.35 315282.35 18.55 0.69 1.20 20.44 17.32 7893.54 185411.23 146128.88 5.150% 427 32.9 15.9 1.98 56349.5247 53315.7105 14577.04162 -1362.45 2823.151511 66.00 46.00 276000.00 78564.71 354564.71 13.61 1.38 1.20 16.19 34.51 14718.45 345721.34 267156.63 5.475% 640 32.9 7.95 1.98 84458.304 44755.5418 33894.51628 -7505.93 -3320.33146 66.00 46.00 276000.00 117847.06 393847.06 8.74 2.07 1.20 12.00 51.45 20861.93 490025.48 372178.42 5.75100% 853 32.9 0 1.98 112567.0833 38839.5238 56318.41358 -13419 -9233.42235 66.00 46.00 276000.00 157129.41 433129.41 3.78 2.75 1.20 7.73 68.72 26775.02 628917.95 471788.54 6
Carbon offsetting 1243 32.9 0 1.98 164033.8623 31728.7177 100674.3864 -23873.2 -19687.6369 66.00 46.00 276000.00 270173.42 546173.42 -5.22 4.01 1.20 -0.01 100.04 37229.24 874476.79 604303.37 7.4
provided Elec. by PV
PV area m2
Heating (KWh/m2)
Lighting (KWh/m2)
Hot water (KWh/m2)
generated Elec by PV
(KWh)
purchased from grid
elec (KWh)
Exported Elec (KWh)
Elec Cost £
Energy cost Inc FIT
Wall Insulation price £/m2
Roof Insulation price £/m2
Total Insulation
price £
PV cost £
Fabric cost £
Operational CO2
(kgCO2/m2.yr)
PV ECO2
(kgCO2/m2.yr)
Insulation ECO2
(kgCO2/m2.yr)
Total CO2
(kgCO2/m2.yr)CO2
saving %
Energy saving (A)
£
PV(A) £
NPV £
Payback period (years)
0 0 32.9 31.8 1.98 0 0 0 13356 17541.6 66.00 46.00 276000.00 0.00 276000.00 23.52 0.00 1.20 24.72 0.00 0.00 0.00 0.00 025% 213 31.9 23.85 1.98 28108.7793 68675.2667 1695.68 5462.459 9528.058743 67.00 47.00 281000.00 39282.35 320282.35 18.35 0.69 1.3 20.34 17.71 8013.54 188229.91 143947.55 5.650% 427 31.9 15.9 1.98 56349.5247 53315.7105 14577.04162 -1362.45 2703.151511 67.00 47.00 281000.00 78564.71 359564.71 13.41 1.38 1.3 16.09 34.90 14838.45 348540.01 264975.31 5.7575% 640 31.9 7.95 1.98 84458.304 44755.5418 33894.51628 -7505.93 -3440.33146 67.00 47.00 281000.00 117847.06 398847.06 8.54 2.07 1.3 11.90 51.84 20981.93 492844.16 369997.10 5.95100% 853 31.9 0 1.98 112567.0833 38839.5238 56318.41358 -13419 -9353.42235 67.00 47.00 281000.00 157129.41 438129.41 3.58 2.75 1.3 7.64 69.11 26895.02 631736.63 469607.22 6.15
Carbon offsetting 1238 31.9 0 1.98 163505.9979 31793.9162 100211.7206 -23766.7 -19701.1488 67.00 47.00 281000.00 269304.00 550304.00 -5.32 3.99 1.3 -0.03 100.12 37242.75 874794.17 600490.17 7.5
provided Elec. by PV
PV area m2
Heating (KWh/m2)
Lighting (KWh/m2)
Hot water (KWh/m2)
generated Elec by PV
(KWh)
purchased from grid
elec (KWh)
Exported Elec (KWh)
Elec Cost £
Energy cost Inc FIT
Wall Insulation price £/m2
Roof Insulation price £/m2
Total Insulation
price £
PV cost £
Fabric cost £
Operational CO2
(kgCO2/m2.yr)
PV ECO2
(kgCO2/m2.yr)
Insulation ECO2
(kgCO2/m2.yr)
Total CO2
(kgCO2/m2.yr)CO2
saving %
Energy saving (A)
£
PV(A) £
NPV £
Payback period (years)
0 0 32.9 31.8 1.98 0 0 0 13356 17541.6 66.00 46.00 276000.00 0.00 276000.00 23.52 0.00 1.20 24.72 0.00 0.00 0.00 0.00 025% 213 30.42 23.85 1.98 28108.7793 68675.2667 1695.68 5462.459 9350.458743 68.50 48.00 287150.00 39282.35 326432.35 18.06 0.69 1.49 20.24 18.12 8191.14 192401.55 141969.20 6.2550% 427 30.42 15.9 1.98 56349.5247 53315.7105 14577.04162 -1362.45 2525.551511 68.50 48.00 287150.00 78564.71 365714.71 13.12 1.38 1.49 15.99 35.30 15016.05 352711.66 262996.95 6.175% 640 30.42 7.95 1.98 84458.304 44755.5418 33894.51628 -7505.93 -3617.93146 68.50 48.00 287150.00 117847.06 404997.06 8.25 2.07 1.49 11.80 52.24 21159.53 497015.80 368018.74 6.2100% 853 30.42 0 1.98 112567.0833 38839.5238 56318.41358 -13419 -9531.02235 68.50 48.00 287150.00 157129.41 444279.41 3.29 2.75 1.49 7.54 69.51 27072.62 635908.27 467628.86 6.35
Carbon offsetting 1233 30.42 0 1.98 162714.2013 31891.7141 99517.72182 -23607 -19719.0167 68.50 48.00 287150.00 267999.86 555149.86 -5.48 3.98 1.49 -0.01 100.03 37260.62 875213.87 596064.00 7.65
provided Elec. by PV
PV area m2
Heating (KWh/m2)
Lighting (KWh/m2)
Hot water (KWh/m2)
generated Elec by PV
(KWh)
purchased from grid
elec (KWh)
Exported Elec (KWh)
Elec Cost £
Energy cost Inc FIT
Wall Insulation price £/m2
Roof Insulation price £/m2
Total Insulation
price £
PV cost £
Fabric cost £
Operational CO2
(kgCO2/m2.yr)
PV ECO2
(kgCO2/m2.yr)
Insulation ECO2
(kgCO2/m2.yr)
Total CO2
(kgCO2/m2.yr)CO2
saving %
Energy saving (A)
£
PV(A) £
NPV £
Payback period (years)
0 0 32.9 31.8 1.98 0 0 0 13356 17541.6 66.00 46.00 276000.00 0.00 276000.00 23.52 0.00 1.20 24.72 0.00 0.00 0.00 0.00 025% 213 28.84 23.85 1.98 28108.7793 68675.2667 1695.68 5462.459 9160.858743 70.00 49.00 293300.00 39282.35 332582.35 17.75 0.69 1.67 20.11 18.64 8380.74 196855.06 140272.71 6.950% 427 28.84 15.9 1.98 56349.5247 53315.7105 14577.04162 -1362.45 2335.951511 70.00 49.00 293300.00 78564.71 371864.71 12.81 1.38 1.67 15.86 35.83 15205.65 357165.17 261300.46 6.4575% 640 28.84 7.95 1.98 84458.304 44755.5418 33894.51628 -7505.93 -3807.53146 70.00 49.00 293300.00 117847.06 411147.06 7.94 2.07 1.67 11.68 52.77 21349.13 501469.31 366322.25 6.45100% 853 28.84 0 1.98 112567.0833 38839.5238 56318.41358 -13419 -9720.62235 70.00 49.00 293300.00 157129.41 450429.41 2.98 2.75 1.67 7.41 70.04 27262.22 640361.78 465932.37 6.5
Carbon offsetting 1227 28.84 0 1.98 161922.4047 31989.5119 98823.72306 -23447.3 -19748.8846 70.00 49.00 293300.00 266695.73 559995.73 -5.65 3.96 1.67 -0.02 100.07 37290.48 875915.43 591919.71 7.8
provided Elec. by PV
PV area m2
Heating (KWh/m2)
Lighting (KWh/m2)
Hot water (KWh/m2)
generated Elec by PV
(KWh)
purchased from grid
elec (KWh)
Exported Elec (KWh)
Elec Cost £
Energy cost Inc FIT
Wall Insulation price £/m2
Roof Insulation price £/m2
Total Insulation
price £
PV cost £
Fabric cost £
Operational CO2
(kgCO2/m2.yr)
PV ECO2
(kgCO2/m2.yr)
Insulation ECO2
(kgCO2/m2.yr)
Total CO2
(kgCO2/m2.yr)CO2
saving %
Energy saving (A)
£
PV(A) £
NPV £
Payback period (years)
0 0 32.9 31.8 1.98 0 0 0 13356 17541.6 66.00 46.00 276000.00 0.00 276000.00 23.52 0.00 1.20 24.72 0.00 0.00 0.00 0.00 025% 213 28 23.85 1.98 28108.7793 68675.2667 1695.68 5462.459 9060.058743 71.50 50.00 299450.00 39282.35 338732.35 17.59 0.69 1.86 20.14 18.54 8481.54 199222.75 136490.40 7.5550% 427 28 15.9 1.98 56349.5247 53315.7105 14577.04162 -1362.45 2235.151511 71.50 50.00 299450.00 78564.71 378014.71 12.65 1.38 1.86 15.89 35.73 15306.45 359532.86 257518.15 6.875% 640 28 7.95 1.98 84458.304 44755.5418 33894.51628 -7505.93 -3908.33146 71.50 50.00 299450.00 117847.06 417297.06 7.78 2.07 1.86 11.70 52.67 21449.93 503837.00 362539.94 6.7100% 853 28 0 1.98 112567.0833 38839.5238 56318.41358 -13419 -9821.42235 71.50 50.00 299450.00 157129.41 456579.41 2.82 2.75 1.86 7.43 69.93 27363.02 642729.47 462150.06 6.72
Carbon offsetting 1228 28 0 1.98 162054.3708 31973.2123 98939.38952 -23473.9 -19876.3066 71.50 50.00 299450.00 266913.08 566363.08 -5.83 3.96 1.86 -0.01 100.05 37417.91 878908.44 588545.36 7.93
provided Elec. by PV
PV area m2
Heating (KWh/m2)
Lighting (KWh/m2)
Hot water (KWh/m2)
generated Elec by PV
(KWh)
purchased from grid
elec (KWh)
Exported Elec (KWh)
Elec Cost £
Energy cost Inc FIT
Wall Insulation price £/m2
Roof Insulation price £/m2
Total Insulation
price £
PV cost £
Fabric cost £
Operational CO2
(kgCO2/m2.yr)
PV ECO2
(kgCO2/m2.yr)
Insulation ECO2
(kgCO2/m2.yr)
Total CO2
(kgCO2/m2.yr)CO2
saving %
Energy saving (A)
£
PV(A) £
NPV £
Payback period (years)
0 0 32.9 31.8 1.98 0 0 0 13356 17541.6 66.00 46.00 276000.00 0.00 276000.00 23.52 0.00 1.20 24.72 0.00 0.00 0.00 0.00 025% 213 27.04 23.85 1.98 28108.7793 68675.2667 1695.68 5462.459 8944.858743 73.00 51.00 305600.00 39282.35 344882.35 17.40 0.69 2.04 20.13 18.57 8596.74 201928.68 133046.33 8.250% 427 27.04 15.9 1.98 56349.5247 53315.7105 14577.04162 -1362.45 2119.951511 73.00 51.00 305600.00 78564.71 384164.71 12.46 1.38 2.04 15.88 35.76 15421.65 362238.79 254074.08 7.1575% 640 27.04 7.95 1.98 84458.304 44755.5418 33894.51628 -7505.93 -4023.53146 73.00 51.00 305600.00 117847.06 423447.06 7.59 2.07 2.04 11.69 52.70 21565.13 506542.93 359095.87 7100% 853 27.04 0 1.98 112567.0833 38839.5238 56318.41358 -13419 -9936.62235 73.00 51.00 305600.00 157129.41 462729.41 2.63 2.75 2.04 7.42 69.97 27478.22 645435.40 458705.99 6.92
Carbon offsetting 1228 27.04 0 1.98 162054.3708 31973.2123 98939.38952 -23473.9 -19991.5066 73.00 51.00 305600.00 266913.08 572513.08 -6.02 3.96 2.04 -0.02 100.08 37533.11 881614.38 585101.29 8.1
provided Elec. by PV
PV area m2
Heating (KWh/m2)
Lighting (KWh/m2)
Hot water (KWh/m2)
generated Elec by PV
(KWh)
purchased from grid
elec (KWh)
Exported Elec (KWh)
Elec Cost £
Energy cost Inc FIT
Wall Insulation price £/m2
Roof Insulation price £/m2
Total Insulation
price £
PV cost £
Fabric cost £
Operational CO2
(kgCO2/m2.yr)
PV ECO2
(kgCO2/m2.yr)
Insulation ECO2
(kgCO2/m2.yr)
Total CO2
(kgCO2/m2.yr)CO2
saving %
Energy saving (A)
£
PV(A) £
NPV £
Payback period (years)
0 0 32.9 31.8 1.98 0 0 0 13356 17541.6 66.00 46.00 276000.00 0.00 276000.00 23.52 0.00 1.20 24.72 0.00 0.00 0.00 0.00 025% 213 24.8 23.85 1.98 28108.7793 68675.2667 1695.68 5462.459 8676.058743 79.00 55.00 330200.00 39282.35 369482.35 16.96 0.69 2.79 20.44 17.32 8865.54 208242.52 114760.16 10.8550% 427 24.8 15.9 1.98 56349.5247 53315.7105 14577.04162 -1362.45 1851.151511 79.00 55.00 330200.00 78564.71 408764.71 12.02 1.38 2.79 16.19 34.50 15690.45 368552.62 235787.92 8.6575% 640 24.8 7.95 1.98 84458.304 44755.5418 33894.51628 -7505.93 -4292.33146 79.00 55.00 330200.00 117847.06 448047.06 7.15 2.07 2.79 12.00 51.44 21833.93 512856.77 340809.71 8.05100% 853 24.8 0 1.98 112567.0833 38839.5238 56318.41358 -13419 -10205.4224 79.00 55.00 330200.00 157129.41 487329.41 2.19 2.75 2.79 7.73 68.71 27747.02 651749.24 440419.83 7.8
Carbon offsetting 1243 24.8 0 1.98 164033.8623 31728.7177 100674.3864 -23873.2 -20659.6369 79.00 55.00 330200.00 270173.42 600373.42 -6.81 4.01 2.79 -0.01 100.03 38201.24 897308.08 572934.66 8.7
provided Elec. by PV
PV area m2
Heating (KWh/m2)
Lighting (KWh/m2)
Hot water (KWh/m2)
generated Elec by PV
(KWh)
purchased from grid
elec (KWh)
Exported Elec (KWh)
Elec Cost £
Energy cost Inc FIT
Wall Insulation price £/m2
Roof Insulation price £/m2
Total Insulation
price £
PV cost £
Fabric cost £
Operational CO2
(kgCO2/m2.yr)
PV ECO2
(kgCO2/m2.yr)
Insulation ECO2
(kgCO2/m2.yr)
Total CO2
(kgCO2/m2.yr)CO2
saving %
Energy saving (A)
£
PV(A) £
NPV £
Payback period (years)
0 0 32.9 31.8 1.98 0 0 0 13356 17541.6 66.00 46.00 276000.00 0.00 276000.00 23.52 0.00 1.20 24.72 0.00 0.00 0.00 0.00 025% 213 24.22 23.85 1.98 28108.7793 68675.2667 1695.68 5462.459 8606.458743 82.00 57.00 342500.00 39282.35 381782.35 16.85 0.69 3.16 20.69 16.28 8935.14 209877.35 104095.00 12.250% 427 24.22 15.9 1.98 56349.5247 53315.7105 14577.04162 -1362.45 1781.551511 82.00 57.00 342500.00 78564.71 421064.71 11.91 1.38 3.16 16.45 33.46 15760.05 370187.46 225122.75 9.4575% 640 24.22 7.95 1.98 84458.304 44755.5418 33894.51628 -7505.93 -4361.93146 82.00 57.00 342500.00 117847.06 460347.06 7.03 2.07 3.16 12.26 50.40 21903.53 514491.60 330144.54 8.6100% 853 24.22 0 1.98 112567.0833 38839.5238 56318.41358 -13419 -10275.0224 82.00 57.00 342500.00 157129.41 499629.41 2.08 2.75 3.16 7.99 67.67 27816.62 653384.08 429754.66 8.25
Carbon offsetting 1257 24.22 0 1.98 165881.3877 31500.5227 102293.7169 -24245.9 -21101.9453 82.00 57.00 342500.00 273216.40 615716.40 -7.24 4.06 3.16 -0.03 100.11 38643.55 907697.45 567981.04 9
PV + 0.08 - 0.11
PV + 0.07 - 0.10
Retail shed - London
PV + 2010 notional building fabric
PV + 0.17 - 0.24
PV + 0.15 - 0.21
PV + 0.13 - 0.19
PV + 0.12 - 0.17
PV + 0.11 - 0.15
PV (curent FiT) + Insulation

219
Table B. 26 Retail shed - PV (future FiT) + improving the building fabric U-value down to 0.07-0.1 W/m2.K (PUR)
provided Elec. by PV
PV area m2
Heating (KWh/m2)
Lighting (KWh/m2)
Hot water (KWh/m2)
generated Elec by PV
(KWh)
purchased from grid
elec (KWh)
Exported Elec
(KWh)Elec Cost £
Energy cost Inc
FIT
Wall Insulation price £/m2
Roof Insulation price £/m2
Total Insulation
price £
PV cost £
Fabric cost £
Operational CO2
(kgCO2/m2.yr)
PV ECO2
(kgCO2/m2.yr)
Insulation ECO2
(kgCO2/m2.yr)
Total CO2
(kgCO2/m2.yr)CO2
saving %
Energy saving (A)
£
PV(A) £
NPV £
Payback period (years)
0 0 32.9 31.8 1.98 0 0 0 13356 17541.6 66.00 46.00 276000.00 0.00 276000.00 23.52 0.00 1.20 24.72 0.00 0.00 0.00 0.00 025% 213 32.9 23.85 1.98 28108.779 68675.2667 1695.68 9538.23174 13723.83 66.00 46.00 276000.00 39282.35 315282.35 18.55 0.69 1.20 20.44 17.32 3817.77 89675.48 50393.13 10.550% 427 32.9 15.9 1.98 56349.525 53315.7105 14577.042 6808.23259 10993.83 66.00 46.00 276000.00 78564.71 354564.71 13.61 1.38 1.20 16.19 34.51 6547.77 153800.38 75235.67 12.475% 640 32.9 7.95 1.98 84458.304 44755.5418 33894.516 4740.52262 8926.123 66.00 46.00 276000.00 117847.06 393847.06 8.74 2.07 1.20 12.00 51.45 8615.48 202368.77 84521.71 14.2100% 853 32.9 0 1.98 112567.08 38839.5238 56318.414 2903.20473 7088.805 66.00 46.00 276000.00 157129.41 433129.41 3.78 2.75 1.20 7.73 68.72 10452.80 245525.50 88396.08 15.65
Carbon offsetting 1243 32.9 0 1.98 164033.86 31728.7177 100674.39 -88.326915 4097.273 66.00 46.00 276000.00 270173.42 546173.42 -5.22 4.01 1.20 -0.01 100.04 13444.33 315793.52 45620.10 21.2Carbon offsetting 1243 32.9 0 1.98 164033.86 31728.7177 100674.39 -5625.4182 -1439.82 66.00 46.00 276000.00 270173.42 546173.42 -5.22 4.01 1.20 -0.01 100.04 18981.42 445854.14 175680.72 14.8
provided Elec. by PV
PV area m2
Heating (KWh/m2)
Lighting (KWh/m2)
Hot water (KWh/m2)
generated Elec by PV
(KWh)
purchased from grid
elec (KWh)
Exported Elec
(KWh)Elec Cost £
Energy cost Inc
FIT
Wall Insulation price £/m2
Roof Insulation price £/m2
Total Insulation
price £
PV cost £
Fabric cost £
Operational CO2
(kgCO2/m2.yr)
PV ECO2
(kgCO2/m2.yr)
Insulation ECO2
(kgCO2/m2.yr)
Total CO2
(kgCO2/m2.yr)CO2
saving %
Energy saving (A)
£
PV(A) £
NPV £
Payback period (years)
0 0 32.9 31.8 1.98 0 0 0 13356 17541.6 66.00 46.00 276000.00 0.00 276000.00 23.52 0.00 1.20 24.72 0.00 0.00 0.00 0.00 025% 213 31.9 23.85 1.98 28108.779 68675.2667 1695.68 9538.23174 13603.83 67.00 47.00 281000.00 39282.35 320282.35 18.35 0.69 1.3 20.34 17.71 3937.77 92494.16 48211.81 11.5550% 427 31.9 15.9 1.98 56349.525 53315.7105 14577.042 6808.23259 10873.83 67.00 47.00 281000.00 78564.71 359564.71 13.41 1.38 1.3 16.09 34.90 6667.77 156619.05 73054.35 12.9575% 640 31.9 7.95 1.98 84458.304 44755.5418 33894.516 4740.52262 8806.123 67.00 47.00 281000.00 117847.06 398847.06 8.54 2.07 1.3 11.90 51.84 8735.48 205187.45 82340.39 14.6100% 853 31.9 0 1.98 112567.08 38839.5238 56318.414 2903.20473 6968.805 67.00 47.00 281000.00 157129.41 438129.41 3.58 2.75 1.3 7.64 69.11 10572.80 248344.17 86214.76 16
Carbon offsetting 1238 31.9 0 1.98 163506 31793.9162 100211.72 -58.379154 4007.221 67.00 47.00 281000.00 269304.00 550304.00 -5.32 3.99 1.3 -0.03 100.12 13534.38 317908.76 43604.76 21.4Carbon offsetting 1238 31.9 0 1.98 163506 31793.9162 100211.72 -5570.0238 -1504.42 67.00 47.00 281000.00 269304.00 550304.00 -5.32 3.99 1.3 -0.03 100.12 19046.02 447371.66 173067.67 14.95
provided Elec. by PV
PV area m2
Heating (KWh/m2)
Lighting (KWh/m2)
Hot water (KWh/m2)
generated Elec by PV
(KWh)
purchased from grid
elec (KWh)
Exported Elec
(KWh)Elec Cost £
Energy cost Inc
FIT
Wall Insulation price £/m2
Roof Insulation price £/m2
Total Insulation
price £
PV cost £
Fabric cost £
Operational CO2
(kgCO2/m2.yr)
PV ECO2
(kgCO2/m2.yr)
Insulation ECO2
(kgCO2/m2.yr)
Total CO2
(kgCO2/m2.yr)CO2
saving %
Energy saving (A)
£
PV(A) £
NPV £
Payback period (years)
0 0 32.9 31.8 1.98 0 0 0 13356 17541.6 66.00 46.00 276000.00 0.00 276000.00 23.52 0.00 1.20 24.72 0.00 0.00 0.00 0.00 025% 213 30.42 23.85 1.98 28108.779 68675.2667 1695.68 9538.23174 13426.23 68.50 48.00 287150.00 39282.35 326432.35 18.06 0.69 1.49 20.24 18.12 4115.37 96665.80 46233.45 12.750% 427 30.42 15.9 1.98 56349.525 53315.7105 14577.042 6808.23259 10696.23 68.50 48.00 287150.00 78564.71 365714.71 13.12 1.38 1.49 15.99 35.30 6845.37 160790.70 71075.99 13.675% 640 30.42 7.95 1.98 84458.304 44755.5418 33894.516 4740.52262 8628.523 68.50 48.00 287150.00 117847.06 404997.06 8.25 2.07 1.49 11.80 52.24 8913.08 209359.09 80362.03 15.05100% 853 30.42 0 1.98 112567.08 38839.5238 56318.414 2903.20473 6791.205 68.50 48.00 287150.00 157129.41 444279.41 3.29 2.75 1.49 7.54 69.51 10750.40 252515.82 84236.40 16.35
Carbon offsetting 1233 30.42 0 1.98 162714.2 31891.7141 99517.722 -13.457512 3874.542 68.50 48.00 287150.00 267999.86 555149.86 -5.48 3.98 1.49 -0.01 100.03 13667.06 321025.24 41875.37 21.55Carbon offsetting 1233 30.42 0 1.98 162714.2 31891.7141 99517.722 -5486.9322 -1598.93 68.50 48.00 287150.00 267999.86 555149.86 -5.48 3.98 1.49 -0.01 100.03 19140.53 449591.57 170441.71 15.2
provided Elec. by PV
PV area m2
Heating (KWh/m2)
Lighting (KWh/m2)
Hot water (KWh/m2)
generated Elec by PV
(KWh)
purchased from grid
elec (KWh)
Exported Elec
(KWh)Elec Cost £
Energy cost Inc
FIT
Wall Insulation price £/m2
Roof Insulation price £/m2
Total Insulation
price £
PV cost £
Fabric cost £
Operational CO2
(kgCO2/m2.yr)
PV ECO2
(kgCO2/m2.yr)
Insulation ECO2
(kgCO2/m2.yr)
Total CO2
(kgCO2/m2.yr)CO2
saving %
Energy saving (A)
£
PV(A) £
NPV £
Payback period (years)
0 0 32.9 31.8 1.98 0 0 0 13356 17541.6 66.00 46.00 276000.00 0.00 276000.00 23.52 0.00 1.20 24.72 0.00 0.00 0.00 0.00 025% 213 28.84 23.85 1.98 28108.779 68675.2667 1695.68 9538.23174 13236.63 70.00 49.00 293300.00 39282.35 332582.35 17.75 0.69 1.67 20.11 18.64 4304.97 101119.31 44536.96 13.6550% 427 28.84 15.9 1.98 56349.525 53315.7105 14577.042 6808.23259 10506.63 70.00 49.00 293300.00 78564.71 371864.71 12.81 1.38 1.67 15.86 35.83 7034.97 165244.21 69379.50 14.175% 640 28.84 7.95 1.98 84458.304 44755.5418 33894.516 4740.52262 8438.923 70.00 49.00 293300.00 117847.06 411147.06 7.94 2.07 1.67 11.68 52.77 9102.68 213812.60 78665.54 15.45100% 853 28.84 0 1.98 112567.08 38839.5238 56318.414 2903.20473 6601.605 70.00 49.00 293300.00 157129.41 450429.41 2.98 2.75 1.67 7.41 70.04 10940.00 256969.33 82539.91 16.65
Carbon offsetting 1227 28.84 0 1.98 161922.4 31989.5119 98823.723 31.4641295 3729.864 70.00 49.00 293300.00 266695.73 559995.73 -5.65 3.96 1.67 -0.02 100.07 13811.74 324423.58 40427.86 21.7Carbon offsetting 1227 28.84 0 1.98 161922.4 31989.5119 98823.723 -5403.8406 -1705.44 70.00 49.00 293300.00 266695.73 559995.73 -5.65 3.96 1.67 -0.02 100.07 19247.04 452093.35 168097.62 15.35
provided Elec. by PV
PV area m2
Heating (KWh/m2)
Lighting (KWh/m2)
Hot water (KWh/m2)
generated Elec by PV
(KWh)
purchased from grid
elec (KWh)
Exported Elec
(KWh)Elec Cost £
Energy cost Inc
FIT
Wall Insulation price £/m2
Roof Insulation price £/m2
Total Insulation
price £
PV cost £
Fabric cost £
Operational CO2
(kgCO2/m2.yr)
PV ECO2
(kgCO2/m2.yr)
Insulation ECO2
(kgCO2/m2.yr)
Total CO2
(kgCO2/m2.yr)CO2
saving %
Energy saving (A)
£
PV(A) £
NPV £
Payback period (years)
0 0 32.9 31.8 1.98 0 0 0 13356 17541.6 66.00 46.00 276000.00 0.00 276000.00 23.52 0.00 1.20 24.72 0.00 0.00 0.00 0.00 025% 213 28 23.85 1.98 28108.779 68675.2667 1695.68 9538.23174 13135.83 71.50 50.00 299450.00 39282.35 338732.35 17.59 0.69 1.86 20.14 18.54 4405.77 103487.00 40754.65 14.7550% 427 28 15.9 1.98 56349.525 53315.7105 14577.042 6808.23259 10405.83 71.50 50.00 299450.00 78564.71 378014.71 12.65 1.38 1.86 15.89 35.73 7135.77 167611.90 65597.19 14.8575% 640 28 7.95 1.98 84458.304 44755.5418 33894.516 4740.52262 8338.123 71.50 50.00 299450.00 117847.06 417297.06 7.78 2.07 1.86 11.70 52.67 9203.48 216180.29 74883.23 16100% 853 28 0 1.98 112567.08 38839.5238 56318.414 2903.20473 6500.805 71.50 50.00 299450.00 157129.41 456579.41 2.82 2.75 1.86 7.43 69.93 11040.80 259337.02 78757.60 17.1
Carbon offsetting 1228 28 0 1.98 162054.37 31973.2123 98939.39 23.9771892 3621.577 71.50 50.00 299450.00 266913.08 566363.08 -5.83 3.96 1.86 -0.01 100.05 13920.02 326967.13 36604.05 22.05Carbon offsetting 1228 28 0 1.98 162054.37 31973.2123 98939.39 -5417.6892 -1820.09 71.50 50.00 299450.00 266913.08 566363.08 -5.83 3.96 1.86 -0.01 100.05 19361.69 454786.32 164423.24 15.6
provided Elec. by PV
PV area m2
Heating (KWh/m2)
Lighting (KWh/m2)
Hot water (KWh/m2)
generated Elec by PV
(KWh)
purchased from grid
elec (KWh)
Exported Elec
(KWh)Elec Cost £
Energy cost Inc
FIT
Wall Insulation price £/m2
Roof Insulation price £/m2
Total Insulation
price £
PV cost £
Fabric cost £
Operational CO2
(kgCO2/m2.yr)
PV ECO2
(kgCO2/m2.yr)
Insulation ECO2
(kgCO2/m2.yr)
Total CO2
(kgCO2/m2.yr)CO2
saving %
Energy saving (A)
£
PV(A) £
NPV £
Payback period (years)
0 0 32.9 31.8 1.98 0 0 0 13356 17541.6 66.00 46.00 276000.00 0.00 276000.00 23.52 0.00 1.20 24.72 0.00 0.00 0.00 0.00 025% 213 27.04 23.85 1.98 28108.779 68675.2667 1695.68 9538.23174 13020.63 73.00 51.00 305600.00 39282.35 344882.35 17.40 0.69 2.04 20.13 18.57 4520.97 106192.93 37310.58 15.8550% 427 27.04 15.9 1.98 56349.525 53315.7105 14577.042 6808.23259 10290.63 73.00 51.00 305600.00 78564.71 384164.71 12.46 1.38 2.04 15.88 35.76 7250.97 170317.83 62153.12 15.575% 640 27.04 7.95 1.98 84458.304 44755.5418 33894.516 4740.52262 8222.923 73.00 51.00 305600.00 117847.06 423447.06 7.59 2.07 2.04 11.69 52.70 9318.68 218886.22 71439.16 16.5100% 853 27.04 0 1.98 112567.08 38839.5238 56318.414 2903.20473 6385.605 73.00 51.00 305600.00 157129.41 462729.41 2.63 2.75 2.04 7.42 69.97 11156.00 262042.95 75313.53 17.5
Carbon offsetting 1228 27.04 0 1.98 162054.37 31973.2123 98939.39 23.9771892 3506.377 73.00 51.00 305600.00 266913.08 572513.08 -6.02 3.96 2.04 -0.02 100.08 14035.22 329673.06 33159.98 22.35Carbon offsetting 1228 27.04 0 1.98 162054.37 31973.2123 98939.39 -5417.6892 -1935.29 73.00 51.00 305600.00 266913.08 572513.08 -6.02 3.96 2.04 -0.02 100.08 19476.89 457492.25 160979.17 15.85
provided Elec. by PV
PV area m2
Heating (KWh/m2)
Lighting (KWh/m2)
Hot water (KWh/m2)
generated Elec by PV
(KWh)
purchased from grid
elec (KWh)
Exported Elec
(KWh)Elec Cost £
Energy cost Inc
FIT
Wall Insulation price £/m2
Roof Insulation price £/m2
Total Insulation
price £
PV cost £
Fabric cost £
Operational CO2
(kgCO2/m2.yr)
PV ECO2
(kgCO2/m2.yr)
Insulation ECO2
(kgCO2/m2.yr)
Total CO2
(kgCO2/m2.yr)CO2
saving %
Energy saving (A)
£
PV(A) £
NPV £
Payback period (years)
0 0 32.9 31.8 1.98 0 0 0 13356 17541.6 66.00 46.00 276000.00 0.00 276000.00 23.52 0.00 1.20 24.72 0.00 0.00 0.00 0.00 025% 213 24.8 23.85 1.98 28108.779 68675.2667 1695.68 9538.23174 12751.83 79.00 55.00 330200.00 39282.35 369482.35 16.96 0.69 2.79 20.44 17.32 4789.77 93247.60 -234.75 20.5550% 427 24.8 15.9 1.98 56349.525 53315.7105 14577.042 6808.23259 10021.83 79.00 55.00 330200.00 78564.71 408764.71 12.02 1.38 2.79 16.19 34.50 7519.77 132744.17 -20.53 18.575% 640 24.8 7.95 1.98 84458.304 44755.5418 33894.516 4740.52262 7954.123 79.00 55.00 330200.00 117847.06 448047.06 7.15 2.07 2.79 12.00 51.44 9587.48 172302.88 255.82 18.85100% 853 24.8 0 1.98 112567.08 38839.5238 56318.414 2903.20473 6116.805 79.00 55.00 330200.00 157129.41 487329.41 2.19 2.75 2.79 7.73 68.71 11424.80 211555.19 225.78 19.45
Carbon offsetting 1243 24.8 0 1.98 164033.86 31728.7177 100674.39 -88.326915 3125.273 79.00 55.00 330200.00 270173.42 600373.42 -6.81 4.01 2.79 -0.01 100.03 14416.33 324571.63 198.21 23.9Carbon offsetting 1243 24.8 0 1.98 164033.86 31728.7177 100674.39 -5625.4182 -2411.82 79.00 55.00 330200.00 270173.42 600373.42 -6.81 4.01 2.79 -0.01 100.03 19953.42 322999.47 -1373.95 17
provided Elec. by PV
PV area m2
Heating (KWh/m2)
Lighting (KWh/m2)
Hot water (KWh/m2)
generated Elec by PV
(KWh)
purchased from grid
elec (KWh)
Exported Elec
(KWh)Elec Cost £
Energy cost Inc
FIT
Wall Insulation price £/m2
Roof Insulation price £/m2
Total Insulation
price £
PV cost £
Fabric cost £
Operational CO2
(kgCO2/m2.yr)
PV ECO2
(kgCO2/m2.yr)
Insulation ECO2
(kgCO2/m2.yr)
Total CO2
(kgCO2/m2.yr)CO2
saving %
Energy saving (A)
£
PV(A) £
NPV £
Payback period (years)
0 0 32.9 31.8 1.98 0 0 0 13356 17541.6 66.00 46.00 276000.00 0.00 276000.00 23.52 0.00 1.20 24.72 0.00 0.00 0.00 0.00 025% 213 24.22 23.85 1.98 28108.779 68675.2667 1695.68 9538.23174 12682.23 82.00 57.00 342500.00 39282.35 381782.35 16.85 0.69 3.16 20.69 16.28 4859.37 114141.60 8359.25 2350% 427 24.22 15.9 1.98 56349.525 53315.7105 14577.042 6808.23259 9952.233 82.00 57.00 342500.00 78564.71 421064.71 11.91 1.38 3.16 16.45 33.46 7589.37 178266.50 33201.79 20.1275% 640 24.22 7.95 1.98 84458.304 44755.5418 33894.516 4740.52262 7884.523 82.00 57.00 342500.00 117847.06 460347.06 7.03 2.07 3.16 12.26 50.40 9657.08 226834.89 42487.83 20.1100% 853 24.22 0 1.98 112567.08 38839.5238 56318.414 2903.20473 6047.205 82.00 57.00 342500.00 157129.41 499629.41 2.08 2.75 3.16 7.99 67.67 11494.40 269991.62 46362.20 20.5
Carbon offsetting 1257 24.22 0 1.98 165881.39 31500.5227 102293.72 -193.14408 2950.856 82.00 57.00 342500.00 273216.40 615716.40 -7.24 4.06 3.16 -0.03 100.11 14590.74 342721.69 3005.29 24.75Carbon offsetting 1257 24.22 0 1.98 165881.39 31500.5227 102293.72 -5819.2985 -2675.3 82.00 57.00 342500.00 273216.40 615716.40 -7.24 4.06 3.16 -0.03 100.11 20216.90 474874.32 135157.91 17.55
PV + 0.08 - 0.11
PV + 0.07 - 0.10
PV + 2010 notional building fabric
Retail shed - London
PV + 0.17 - 0.24
PV + 0.15 - 0.21
PV + 0.13 - 0.19
PV + 0.12 - 0.17
PV + 0.11 - 0.15
PV (future FiT) + Insulation
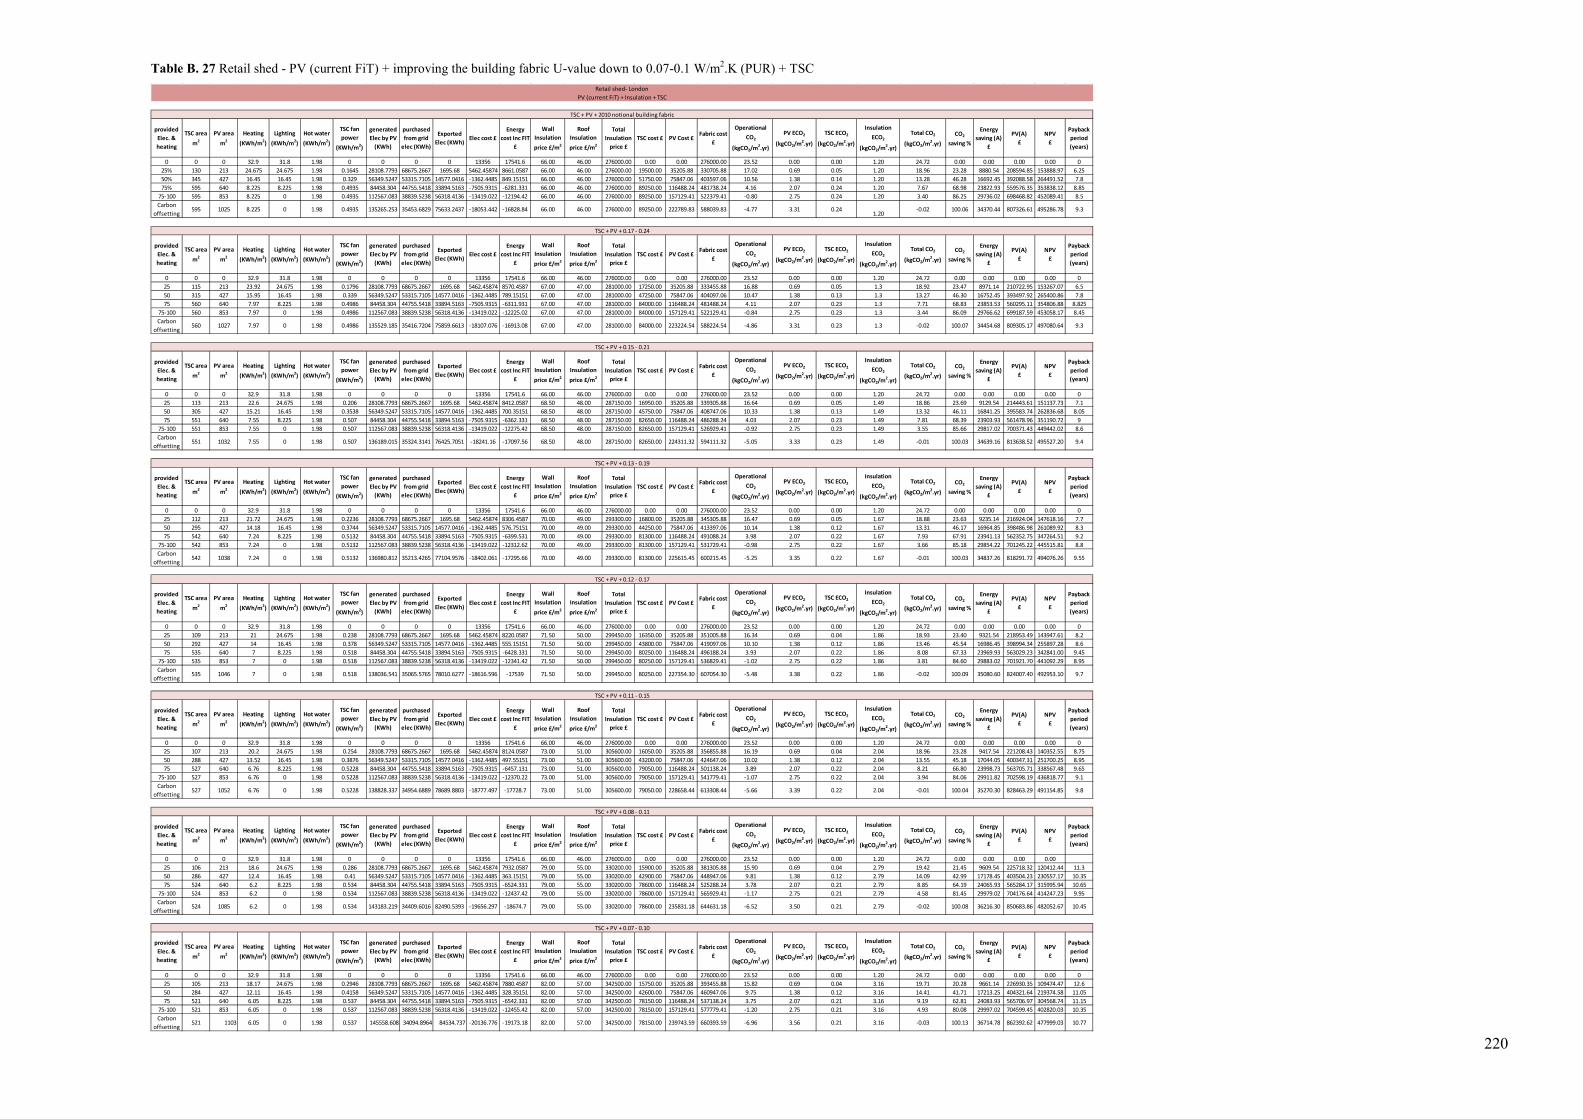
220
Table B. 27 Retail shed - PV (current FiT) + improving the building fabric U-value down to 0.07-0.1 W/m2.K (PUR) + TSC
provided Elec. & heating
TSC area m2
PV area m2
Heating (KWh/m2)
Lighting (KWh/m2)
Hot water (KWh/m2)
TSC fan power
(KWh/m2)
generated Elec by PV
(KWh)
purchased from grid
elec (KWh)
Exported Elec (KWh)
Elec cost £Energy
cost Inc FIT £
Wall Insulation price £/m2
Roof Insulation price £/m2
Total Insulation
price £TSC cost £ PV Cost £
Fabric cost £
Operational CO2
(kgCO2/m2.yr)
PV ECO2
(kgCO2/m2.yr)
TSC ECO2
(kgCO2/m2.yr)
Insulation ECO2
(kgCO2/m2.yr)
Total CO2
(kgCO2/m2.yr)CO2
saving %
Energy saving (A)
£
PV(A) £
NPV £
Payback period (years)
0 0 0 32.9 31.8 1.98 0 0 0 0 13356 17541.6 66.00 46.00 276000.00 0.00 0.00 276000.00 23.52 0.00 0.00 1.20 24.72 0.00 0.00 0.00 0.00 025% 130 213 24.675 24.675 1.98 0.1645 28108.7793 68675.2667 1695.68 5462.45874 8661.0587 66.00 46.00 276000.00 19500.00 35205.88 330705.88 17.02 0.69 0.05 1.20 18.96 23.28 8880.54 208594.85 153888.97 6.2550% 345 427 16.45 16.45 1.98 0.329 56349.5247 53315.7105 14577.0416 -1362.4485 849.15151 66.00 46.00 276000.00 51750.00 75847.06 403597.06 10.56 1.38 0.14 1.20 13.28 46.28 16692.45 392088.58 264491.52 7.875% 595 640 8.225 8.225 1.98 0.4935 84458.304 44755.5418 33894.5163 -7505.9315 -6281.331 66.00 46.00 276000.00 89250.00 116488.24 481738.24 4.16 2.07 0.24 1.20 7.67 68.98 23822.93 559576.35 353838.12 8.85
75-100 595 853 8.225 0 1.98 0.4935 112567.083 38839.5238 56318.4136 -13419.022 -12194.42 66.00 46.00 276000.00 89250.00 157129.41 522379.41 -0.80 2.75 0.24 1.20 3.40 86.25 29736.02 698468.82 452089.41 8.5Carbon
offsetting595 1025 8.225 0 1.98 0.4935 135265.253 35453.6829 75633.2437 -18053.442 -16828.84 66.00 46.00 276000.00 89250.00 222789.83 588039.83 -4.77 3.31 0.24
1.20-0.02 100.06 34370.44 807326.61 495286.78 9.3
provided Elec. & heating
TSC area m2
PV area m2
Heating (KWh/m2)
Lighting (KWh/m2)
Hot water (KWh/m2)
TSC fan power
(KWh/m2)
generated Elec by PV
(KWh)
purchased from grid
elec (KWh)
Exported Elec (KWh)
Elec cost £Energy
cost Inc FIT £
Wall Insulation price £/m2
Roof Insulation price £/m2
Total Insulation
price £TSC cost £ PV Cost £
Fabric cost £
Operational CO2
(kgCO2/m2.yr)
PV ECO2
(kgCO2/m2.yr)
TSC ECO2
(kgCO2/m2.yr)
Insulation ECO2
(kgCO2/m2.yr)
Total CO2
(kgCO2/m2.yr)CO2
saving %
Energy saving (A)
£
PV(A) £
NPV £
Payback period (years)
0 0 0 32.9 31.8 1.98 0 0 0 0 13356 17541.6 66.00 46.00 276000.00 0.00 0.00 276000.00 23.52 0.00 0.00 1.20 24.72 0.00 0.00 0.00 0.00 025 115 213 23.92 24.675 1.98 0.1796 28108.7793 68675.2667 1695.68 5462.45874 8570.4587 67.00 47.00 281000.00 17250.00 35205.88 333455.88 16.88 0.69 0.05 1.3 18.92 23.47 8971.14 210722.95 153267.07 6.550 315 427 15.95 16.45 1.98 0.339 56349.5247 53315.7105 14577.0416 -1362.4485 789.15151 67.00 47.00 281000.00 47250.00 75847.06 404097.06 10.47 1.38 0.13 1.3 13.27 46.30 16752.45 393497.92 265400.86 7.875 560 640 7.97 8.225 1.98 0.4986 84458.304 44755.5418 33894.5163 -7505.9315 -6311.931 67.00 47.00 281000.00 84000.00 116488.24 481488.24 4.11 2.07 0.23 1.3 7.71 68.83 23853.53 560295.11 354806.88 8.825
75-100 560 853 7.97 0 1.98 0.4986 112567.083 38839.5238 56318.4136 -13419.022 -12225.02 67.00 47.00 281000.00 84000.00 157129.41 522129.41 -0.84 2.75 0.23 1.3 3.44 86.09 29766.62 699187.59 453058.17 8.45Carbon
offsetting560 1027 7.97 0 1.98 0.4986 135529.185 35416.7204 75859.6613 -18107.076 -16913.08 67.00 47.00 281000.00 84000.00 223224.54 588224.54 -4.86 3.31 0.23 1.3 -0.02 100.07 34454.68 809305.17 497080.64 9.3
provided Elec. & heating
TSC area m2
PV area m2
Heating (KWh/m2)
Lighting (KWh/m2)
Hot water (KWh/m2)
TSC fan power
(KWh/m2)
generated Elec by PV
(KWh)
purchased from grid
elec (KWh)
Exported Elec (KWh)
Elec cost £Energy
cost Inc FIT £
Wall Insulation price £/m2
Roof Insulation price £/m2
Total Insulation
price £TSC cost £ PV Cost £
Fabric cost £
Operational CO2
(kgCO2/m2.yr)
PV ECO2
(kgCO2/m2.yr)
TSC ECO2
(kgCO2/m2.yr)
Insulation ECO2
(kgCO2/m2.yr)
Total CO2
(kgCO2/m2.yr)CO2
saving %
Energy saving (A)
£
PV(A) £
NPV £
Payback period (years)
0 0 0 32.9 31.8 1.98 0 0 0 0 13356 17541.6 66.00 46.00 276000.00 0.00 0.00 276000.00 23.52 0.00 0.00 1.20 24.72 0.00 0.00 0.00 0.00 025 113 213 22.6 24.675 1.98 0.206 28108.7793 68675.2667 1695.68 5462.45874 8412.0587 68.50 48.00 287150.00 16950.00 35205.88 339305.88 16.64 0.69 0.05 1.49 18.86 23.69 9129.54 214443.61 151137.73 7.150 305 427 15.21 16.45 1.98 0.3538 56349.5247 53315.7105 14577.0416 -1362.4485 700.35151 68.50 48.00 287150.00 45750.00 75847.06 408747.06 10.33 1.38 0.13 1.49 13.32 46.11 16841.25 395583.74 262836.68 8.0575 551 640 7.55 8.225 1.98 0.507 84458.304 44755.5418 33894.5163 -7505.9315 -6362.331 68.50 48.00 287150.00 82650.00 116488.24 486288.24 4.03 2.07 0.23 1.49 7.81 68.39 23903.93 561478.96 351190.72 9
75-100 551 853 7.55 0 1.98 0.507 112567.083 38839.5238 56318.4136 -13419.022 -12275.42 68.50 48.00 287150.00 82650.00 157129.41 526929.41 -0.92 2.75 0.23 1.49 3.55 85.66 29817.02 700371.43 449442.02 8.6Carbon
offsetting551 1032 7.55 0 1.98 0.507 136189.015 35324.3141 76425.7051 -18241.16 -17097.56 68.50 48.00 287150.00 82650.00 224311.32 594111.32 -5.05 3.33 0.23 1.49 -0.01 100.03 34639.16 813638.52 495527.20 9.4
provided Elec. & heating
TSC area m2
PV area m2
Heating (KWh/m2)
Lighting (KWh/m2)
Hot water (KWh/m2)
TSC fan power
(KWh/m2)
generated Elec by PV
(KWh)
purchased from grid
elec (KWh)
Exported Elec (KWh)
Elec cost £Energy
cost Inc FIT £
Wall Insulation price £/m2
Roof Insulation price £/m2
Total Insulation
price £TSC cost £ PV Cost £
Fabric cost £
Operational CO2
(kgCO2/m2.yr)
PV ECO2
(kgCO2/m2.yr)
TSC ECO2
(kgCO2/m2.yr)
Insulation ECO2
(kgCO2/m2.yr)
Total CO2
(kgCO2/m2.yr)CO2
saving %
Energy saving (A)
£
PV(A) £
NPV £
Payback period (years)
0 0 0 32.9 31.8 1.98 0 0 0 0 13356 17541.6 66.00 46.00 276000.00 0.00 0.00 276000.00 23.52 0.00 0.00 1.20 24.72 0.00 0.00 0.00 0.00 025 112 213 21.72 24.675 1.98 0.2236 28108.7793 68675.2667 1695.68 5462.45874 8306.4587 70.00 49.00 293300.00 16800.00 35205.88 345305.88 16.47 0.69 0.05 1.67 18.88 23.63 9235.14 216924.04 147618.16 7.750 295 427 14.18 16.45 1.98 0.3744 56349.5247 53315.7105 14577.0416 -1362.4485 576.75151 70.00 49.00 293300.00 44250.00 75847.06 413397.06 10.14 1.38 0.12 1.67 13.31 46.17 16964.85 398486.98 261089.92 8.375 542 640 7.24 8.225 1.98 0.5132 84458.304 44755.5418 33894.5163 -7505.9315 -6399.531 70.00 49.00 293300.00 81300.00 116488.24 491088.24 3.98 2.07 0.22 1.67 7.93 67.91 23941.13 562352.75 347264.51 9.2
75-100 542 853 7.24 0 1.98 0.5132 112567.083 38839.5238 56318.4136 -13419.022 -12312.62 70.00 49.00 293300.00 81300.00 157129.41 531729.41 -0.98 2.75 0.22 1.67 3.66 85.18 29854.22 701245.22 445515.81 8.8Carbon
offsetting542 1038 7.24 0 1.98 0.5132 136980.812 35213.4265 77104.9576 -18402.061 -17295.66 70.00 49.00 293300.00 81300.00 225615.45 600215.45 -5.25 3.35 0.22 1.67 -0.01 100.03 34837.26 818291.72 494076.26 9.55
provided Elec. & heating
TSC area m2
PV area m2
Heating (KWh/m2)
Lighting (KWh/m2)
Hot water (KWh/m2)
TSC fan power
(KWh/m2)
generated Elec by PV
(KWh)
purchased from grid
elec (KWh)
Exported Elec (KWh)
Elec cost £Energy
cost Inc FIT £
Wall Insulation price £/m2
Roof Insulation price £/m2
Total Insulation
price £TSC cost £ PV Cost £
Fabric cost £
Operational CO2
(kgCO2/m2.yr)
PV ECO2
(kgCO2/m2.yr)
TSC ECO2
(kgCO2/m2.yr)
Insulation ECO2
(kgCO2/m2.yr)
Total CO2
(kgCO2/m2.yr)CO2
saving %
Energy saving (A)
£
PV(A) £
NPV £
Payback period (years)
0 0 0 32.9 31.8 1.98 0 0 0 0 13356 17541.6 66.00 46.00 276000.00 0.00 0.00 276000.00 23.52 0.00 0.00 1.20 24.72 0.00 0.00 0.00 0.00 025 109 213 21 24.675 1.98 0.238 28108.7793 68675.2667 1695.68 5462.45874 8220.0587 71.50 50.00 299450.00 16350.00 35205.88 351005.88 16.34 0.69 0.04 1.86 18.93 23.40 9321.54 218953.49 143947.61 8.250 292 427 14 16.45 1.98 0.378 56349.5247 53315.7105 14577.0416 -1362.4485 555.15151 71.50 50.00 299450.00 43800.00 75847.06 419097.06 10.10 1.38 0.12 1.86 13.46 45.54 16986.45 398994.34 255897.28 8.675 535 640 7 8.225 1.98 0.518 84458.304 44755.5418 33894.5163 -7505.9315 -6428.331 71.50 50.00 299450.00 80250.00 116488.24 496188.24 3.93 2.07 0.22 1.86 8.08 67.33 23969.93 563029.23 342841.00 9.45
75-100 535 853 7 0 1.98 0.518 112567.083 38839.5238 56318.4136 -13419.022 -12341.42 71.50 50.00 299450.00 80250.00 157129.41 536829.41 -1.02 2.75 0.22 1.86 3.81 84.60 29883.02 701921.70 441092.29 8.95Carbon
offsetting535 1046 7 0 1.98 0.518 138036.541 35065.5765 78010.6277 -18616.596 -17539 71.50 50.00 299450.00 80250.00 227354.30 607054.30 -5.48 3.38 0.22 1.86 -0.02 100.09 35080.60 824007.40 492953.10 9.7
provided Elec. & heating
TSC area m2
PV area m2
Heating (KWh/m2)
Lighting (KWh/m2)
Hot water (KWh/m2)
TSC fan power
(KWh/m2)
generated Elec by PV
(KWh)
purchased from grid
elec (KWh)
Exported Elec (KWh)
Elec cost £Energy
cost Inc FIT £
Wall Insulation price £/m2
Roof Insulation price £/m2
Total Insulation
price £TSC cost £ PV Cost £
Fabric cost £
Operational CO2
(kgCO2/m2.yr)
PV ECO2
(kgCO2/m2.yr)
TSC ECO2
(kgCO2/m2.yr)
Insulation ECO2
(kgCO2/m2.yr)
Total CO2
(kgCO2/m2.yr)CO2
saving %
Energy saving (A)
£
PV(A) £
NPV £
Payback period (years)
0 0 0 32.9 31.8 1.98 0 0 0 0 13356 17541.6 66.00 46.00 276000.00 0.00 0.00 276000.00 23.52 0.00 0.00 1.20 24.72 0.00 0.00 0.00 0.00 025 107 213 20.2 24.675 1.98 0.254 28108.7793 68675.2667 1695.68 5462.45874 8124.0587 73.00 51.00 305600.00 16050.00 35205.88 356855.88 16.19 0.69 0.04 2.04 18.96 23.28 9417.54 221208.43 140352.55 8.7550 288 427 13.52 16.45 1.98 0.3876 56349.5247 53315.7105 14577.0416 -1362.4485 497.55151 73.00 51.00 305600.00 43200.00 75847.06 424647.06 10.02 1.38 0.12 2.04 13.55 45.18 17044.05 400347.31 251700.25 8.9575 527 640 6.76 8.225 1.98 0.5228 84458.304 44755.5418 33894.5163 -7505.9315 -6457.131 73.00 51.00 305600.00 79050.00 116488.24 501138.24 3.89 2.07 0.22 2.04 8.21 66.80 23998.73 563705.71 338567.48 9.65
75-100 527 853 6.76 0 1.98 0.5228 112567.083 38839.5238 56318.4136 -13419.022 -12370.22 73.00 51.00 305600.00 79050.00 157129.41 541779.41 -1.07 2.75 0.22 2.04 3.94 84.06 29911.82 702598.19 436818.77 9.1Carbon
offsetting527 1052 6.76 0 1.98 0.5228 138828.337 34954.6889 78689.8803 -18777.497 -17728.7 73.00 51.00 305600.00 79050.00 228658.44 613308.44 -5.66 3.39 0.22 2.04 -0.01 100.04 35270.30 828463.29 491154.85 9.8
provided Elec. & heating
TSC area m2
PV area m2
Heating (KWh/m2)
Lighting (KWh/m2)
Hot water (KWh/m2)
TSC fan power
(KWh/m2)
generated Elec by PV
(KWh)
purchased from grid
elec (KWh)
Exported Elec (KWh)
Elec cost £Energy
cost Inc FIT £
Wall Insulation price £/m2
Roof Insulation price £/m2
Total Insulation
price £TSC cost £ PV Cost £
Fabric cost £
Operational CO2
(kgCO2/m2.yr)
PV ECO2
(kgCO2/m2.yr)
TSC ECO2
(kgCO2/m2.yr)
Insulation ECO2
(kgCO2/m2.yr)
Total CO2
(kgCO2/m2.yr)CO2
saving %
Energy saving (A)
£
PV(A) £
NPV £
Payback period (years)
0 0 0 32.9 31.8 1.98 0 0 0 0 13356 17541.6 66.00 46.00 276000.00 0.00 0.00 276000.00 23.52 0.00 0.00 1.20 24.72 0.00 0.00 0.00 0.0025 106 213 18.6 24.675 1.98 0.286 28108.7793 68675.2667 1695.68 5462.45874 7932.0587 79.00 55.00 330200.00 15900.00 35205.88 381305.88 15.90 0.69 0.04 2.79 19.42 21.45 9609.54 225718.32 120412.44 11.350 286 427 12.4 16.45 1.98 0.41 56349.5247 53315.7105 14577.0416 -1362.4485 363.15151 79.00 55.00 330200.00 42900.00 75847.06 448947.06 9.81 1.38 0.12 2.79 14.09 42.99 17178.45 403504.23 230557.17 10.3575 524 640 6.2 8.225 1.98 0.534 84458.304 44755.5418 33894.5163 -7505.9315 -6524.331 79.00 55.00 330200.00 78600.00 116488.24 525288.24 3.78 2.07 0.21 2.79 8.85 64.19 24065.93 565284.17 315995.94 10.65
75-100 524 853 6.2 0 1.98 0.534 112567.083 38839.5238 56318.4136 -13419.022 -12437.42 79.00 55.00 330200.00 78600.00 157129.41 565929.41 -1.17 2.75 0.21 2.79 4.58 81.45 29979.02 704176.64 414247.23 9.95Carbon
offsetting524 1085 6.2 0 1.98 0.534 143183.219 34409.6016 82490.5393 -19656.297 -18674.7 79.00 55.00 330200.00 78600.00 235831.18 644631.18 -6.52 3.50 0.21 2.79 -0.02 100.08 36216.30 850683.86 482052.67 10.45
provided Elec. & heating
TSC area m2
PV area m2
Heating (KWh/m2)
Lighting (KWh/m2)
Hot water (KWh/m2)
TSC fan power
(KWh/m2)
generated Elec by PV
(KWh)
purchased from grid
elec (KWh)
Exported Elec (KWh)
Elec cost £Energy
cost Inc FIT £
Wall Insulation price £/m2
Roof Insulation price £/m2
Total Insulation
price £TSC cost £ PV Cost £
Fabric cost £
Operational CO2
(kgCO2/m2.yr)
PV ECO2
(kgCO2/m2.yr)
TSC ECO2
(kgCO2/m2.yr)
Insulation ECO2
(kgCO2/m2.yr)
Total CO2
(kgCO2/m2.yr)CO2
saving %
Energy saving (A)
£
PV(A) £
NPV £
Payback period (years)
0 0 0 32.9 31.8 1.98 0 0 0 0 13356 17541.6 66.00 46.00 276000.00 0.00 0.00 276000.00 23.52 0.00 0.00 1.20 24.72 0.00 0.00 0.00 0.00 025 105 213 18.17 24.675 1.98 0.2946 28108.7793 68675.2667 1695.68 5462.45874 7880.4587 82.00 57.00 342500.00 15750.00 35205.88 393455.88 15.82 0.69 0.04 3.16 19.71 20.28 9661.14 226930.35 109474.47 12.650 284 427 12.11 16.45 1.98 0.4158 56349.5247 53315.7105 14577.0416 -1362.4485 328.35151 82.00 57.00 342500.00 42600.00 75847.06 460947.06 9.75 1.38 0.12 3.16 14.41 41.71 17213.25 404321.64 219374.58 11.0575 521 640 6.05 8.225 1.98 0.537 84458.304 44755.5418 33894.5163 -7505.9315 -6542.331 82.00 57.00 342500.00 78150.00 116488.24 537138.24 3.75 2.07 0.21 3.16 9.19 62.81 24083.93 565706.97 304568.74 11.15
75-100 521 853 6.05 0 1.98 0.537 112567.083 38839.5238 56318.4136 -13419.022 -12455.42 82.00 57.00 342500.00 78150.00 157129.41 577779.41 -1.20 2.75 0.21 3.16 4.93 80.08 29997.02 704599.45 402820.03 10.35Carbon
offsetting521 1103 6.05 0 1.98 0.537 145558.608 34094.8964 84534.737 -20136.776 -19173.18 82.00 57.00 342500.00 78150.00 239743.59 660393.59 -6.96 3.56 0.21 3.16 -0.03 100.13 36714.78 862392.62 477999.03 10.77
TSC + PV + 0.08 - 0.11
TSC + PV + 0.07 - 0.10
Retail shed- London
TSC + PV + 2010 notional building fabric
TSC + PV + 0.17 - 0.24
TSC + PV + 0.15 - 0.21
TSC + PV + 0.13 - 0.19
TSC + PV + 0.12 - 0.17
TSC + PV + 0.11 - 0.15
PV (current FiT) + Insulation + TSC

221
Table B. 28 Retail shed - PV (future FiT) + improving the building fabric U-value down to 0.07-0.1 W/m2.K (PUR) + TSC
provided Elec. & heating
TSC area m2
PV area m2
Heating (KWh/m2)
Lighting (KWh/m2)
Hot water (KWh/m2)
TSC fan power
(KWh/m2)
generated Elec by PV
(KWh)
purchased from grid
elec (KWh)
Exported Elec
(KWh)Elec cost £
Energy cost Inc FIT
£
Wall Insulation price £/m2
Roof Insulation price £/m2
Total Insulation
price £TSC cost £ PV Cost £
Fabric cost £
Operational CO2
(kgCO2/m2.yr)
PV ECO2
(kgCO2/m2.yr)
TSC ECO2
(kgCO2/m2.yr)
Insulation ECO2
(kgCO2/m2.yr)
Total CO2
(kgCO2/m2.yr)CO2
saving %
Energy saving (A)
£
PV(A) £
NPV £
Payback period (years)
0 0 0 32.9 31.8 1.98 0 0 0 0 13356 17541.6 66.00 46.00 276000.00 0.00 0.00 276000.00 23.52 0.00 0.00 1.20 24.72 0.00 0.00 0.00 0.00 025% 130 213 24.675 24.675 1.98 0.1645 28108.779 68675.2667 1695.68 9538.2317 12736.832 66.00 46.00 276000.00 19500.00 35205.88 330705.88 17.02 0.69 0.05 1.20 18.96 23.28 4804.77 54747.09 41.21 11.7550% 345 427 16.45 16.45 1.98 0.329 56349.525 53315.7105 14577.04 6808.2326 9019.8326 66.00 46.00 276000.00 51750.00 75847.06 403597.06 10.56 1.38 0.14 1.20 13.28 46.28 8521.77 127732.43 135.37 15.675% 595 640 8.225 8.225 1.98 0.4935 84458.304 44755.5418 33894.52 4740.5226 5965.1226 66.00 46.00 276000.00 89250.00 116488.24 481738.24 4.16 2.07 0.24 1.20 7.67 68.98 11576.48 205939.30 201.06 18.65
75-100 595 853 8.225 0 1.98 0.4935 112567.08 38839.5238 56318.41 2903.2047 4127.8047 66.00 46.00 276000.00 89250.00 157129.41 522379.41 -0.80 2.75 0.24 1.20 3.40 86.25 13413.80 246558.45 179.04 19.3Carbon
offsetting595 1025 8.225 0 1.98 0.4935 135265.25 35453.6829 75633.24 1560.0196 2784.6196 66.00 46.00 276000.00 89250.00 222789.83 588039.83 -4.77 3.31 0.24
1.20-0.02 100.06 14756.98 311840.54 -199.29 22.35
Carbon offsetting
595 1025 8.225 0 1.98 0.4935 135265.25 35453.6829 75633.24 -2599.809 -1375.209 66.00 46.00 276000.00 89250.00 222789.83 588039.83 -4.77 3.31 0.241.20
-0.02 100.06 18916.81 312299.87 260.04 17.25
provided Elec. & heating
TSC area m2
PV area m2
Heating (KWh/m2)
Lighting (KWh/m2)
Hot water (KWh/m2)
TSC fan power
(KWh/m2)
generated Elec by PV
(KWh)
purchased from grid
elec (KWh)
Exported Elec
(KWh)Elec cost £
Energy cost Inc FIT
£
Wall Insulation price £/m2
Roof Insulation price £/m2
Total Insulation
price £TSC cost £ PV Cost £
Fabric cost £
Operational CO2
(kgCO2/m2.yr)
PV ECO2
(kgCO2/m2.yr)
TSC ECO2
(kgCO2/m2.yr)
Insulation ECO2
(kgCO2/m2.yr)
Total CO2
(kgCO2/m2.yr)CO2
saving %
Energy saving (A)
£
PV(A) £
NPV £
Payback period (years)
0 0 0 32.9 31.8 1.98 0 0 0 0 13356 17541.6 66.00 46.00 276000.00 0.00 0.00 276000.00 23.52 0.00 0.00 1.20 24.72 0.00 0.00 0.00 0.00 025 115 213 23.92 24.675 1.98 0.1796 28108.779 68675.2667 1695.68 9538.2317 12646.232 67.00 47.00 281000.00 17250.00 35205.88 333455.88 16.88 0.69 0.05 1.3 18.92 23.47 4895.37 57392.74 -63.14 12.150 315 427 15.95 16.45 1.98 0.339 56349.525 53315.7105 14577.04 6808.2326 8959.8326 67.00 47.00 281000.00 47250.00 75847.06 404097.06 10.47 1.38 0.13 1.3 13.27 46.30 8581.77 128234.82 137.76 15.5575 560 640 7.97 8.225 1.98 0.4986 84458.304 44755.5418 33894.52 4740.5226 5934.5226 67.00 47.00 281000.00 84000.00 116488.24 481488.24 4.11 2.07 0.23 1.3 7.71 68.83 11607.08 205425.49 -62.74 18.55
75-100 560 853 7.97 0 1.98 0.4986 112567.08 38839.5238 56318.41 2903.2047 4097.2047 67.00 47.00 281000.00 84000.00 157129.41 522129.41 -0.84 2.75 0.23 1.3 3.44 86.09 13444.40 246143.51 14.10 19.22Carbon
offsetting560 1027 7.97 0 1.98 0.4986 135529.18 35416.7204 75859.66 1544.6561 2738.6561 67.00 47.00 281000.00 84000.00 223224.54 588224.54 -4.86 3.31 0.23 1.3 -0.02 100.07 14802.94 312149.13 -75.41 22.3
Carbon offsetting
560 1027 7.97 0 1.98 0.4986 135529.18 35416.7204 75859.66 -2627.625 -1433.625 67.00 47.00 281000.00 84000.00 223224.54 588224.54 -4.86 3.31 0.23 1.3 -0.02 100.07 18975.23 312393.55 169.01 17.2
provided Elec. & heating
TSC area m2
PV area m2
Heating (KWh/m2)
Lighting (KWh/m2)
Hot water (KWh/m2)
TSC fan power
(KWh/m2)
generated Elec by PV
(KWh)
purchased from grid
elec (KWh)
Exported Elec
(KWh)Elec cost £
Energy cost Inc FIT
£
Wall Insulation price £/m2
Roof Insulation price £/m2
Total Insulation
price £TSC cost £ PV Cost £
Fabric cost £
Operational CO2
(kgCO2/m2.yr)
PV ECO2
(kgCO2/m2.yr)
TSC ECO2
(kgCO2/m2.yr)
Insulation ECO2
(kgCO2/m2.yr)
Total CO2
(kgCO2/m2.yr)CO2
saving %
Energy saving (A)
£
PV(A) £
NPV £
Payback period (years)
0 0 0 32.9 31.8 1.98 0 0 0 0 13356 17541.6 66.00 46.00 276000.00 0.00 0.00 276000.00 23.52 0.00 0.00 1.20 24.72 0.00 0.00 0.00 0.00 025 113 213 22.6 24.675 1.98 0.206 28108.779 68675.2667 1695.68 9538.2317 12487.832 68.50 48.00 287150.00 16950.00 35205.88 339305.88 16.64 0.69 0.05 1.49 18.86 23.69 5053.77 63282.92 -22.96 12.9550 305 427 15.21 16.45 1.98 0.3538 56349.525 53315.7105 14577.04 6808.2326 8871.0326 68.50 48.00 287150.00 45750.00 75847.06 408747.06 10.33 1.38 0.13 1.49 13.32 46.11 8670.57 132767.49 20.43 15.9575 551 640 7.55 8.225 1.98 0.507 84458.304 44755.5418 33894.52 4740.5226 5884.1226 68.50 48.00 287150.00 82650.00 116488.24 486288.24 4.03 2.07 0.23 1.49 7.81 68.39 11657.48 210034.89 -253.35 18.9
75-100 551 853 7.55 0 1.98 0.507 112567.08 38839.5238 56318.41 2903.2047 4046.8047 68.50 48.00 287150.00 82650.00 157129.41 526929.41 -0.92 2.75 0.23 1.49 3.55 85.66 13494.80 251110.69 181.28 19.55Carbon
offsetting551 1032 7.55 0 1.98 0.507 136189.02 35324.3141 76425.71 1506.2472 2649.8472 68.50 48.00 287150.00 82650.00 224311.32 594111.32 -5.05 3.33 0.23 1.49 -0.01 100.03 14891.75 318019.45 -91.87 22.6
Carbon offsetting
551 1032 7.55 0 1.98 0.507 136189.02 35324.3141 76425.71 -2697.167 -1553.567 68.50 48.00 287150.00 82650.00 224311.32 594111.32 -5.05 3.33 0.23 1.49 -0.01 100.03 19095.17 318221.97 110.65 17.42
provided Elec. & heating
TSC area m2
PV area m2
Heating (KWh/m2)
Lighting (KWh/m2)
Hot water (KWh/m2)
TSC fan power
(KWh/m2)
generated Elec by PV
(KWh)
purchased from grid
elec (KWh)
Exported Elec
(KWh)Elec cost £
Energy cost Inc FIT
£
Wall Insulation price £/m2
Roof Insulation price £/m2
Total Insulation
price £TSC cost £ PV Cost £
Fabric cost £
Operational CO2
(kgCO2/m2.yr)
PV ECO2
(kgCO2/m2.yr)
TSC ECO2
(kgCO2/m2.yr)
Insulation ECO2
(kgCO2/m2.yr)
Total CO2
(kgCO2/m2.yr)CO2
saving %
Energy saving (A)
£
PV(A) £
NPV £
Payback period (years)
0 0 0 32.9 31.8 1.98 0 0 0 0 13356 17541.6 66.00 46.00 276000.00 0.00 0.00 276000.00 23.52 0.00 0.00 1.20 24.72 0.00 0.00 0.00 0.00 025 112 213 21.72 24.675 1.98 0.2236 28108.779 68675.2667 1695.68 9538.2317 12382.232 70.00 49.00 293300.00 16800.00 35205.88 345305.88 16.47 0.69 0.05 1.67 18.88 23.63 5159.37 69668.08 362.20 1450 295 427 14.18 16.45 1.98 0.3744 56349.525 53315.7105 14577.04 6808.2326 8747.4326 70.00 49.00 293300.00 44250.00 75847.06 413397.06 10.14 1.38 0.12 1.67 13.31 46.17 8794.17 137499.97 102.92 16.375 542 640 7.24 8.225 1.98 0.5132 84458.304 44755.5418 33894.52 4740.5226 5846.9226 70.00 49.00 293300.00 81300.00 116488.24 491088.24 3.98 2.07 0.22 1.67 7.93 67.91 11694.68 214959.41 -128.82 19.3
75-100 542 853 7.24 0 1.98 0.5132 112567.08 38839.5238 56318.41 2903.2047 4009.6047 70.00 49.00 293300.00 81300.00 157129.41 531729.41 -0.98 2.75 0.22 1.67 3.66 85.18 13532.00 255484.20 -245.22 19.85Carbon
offsetting542 1038 7.24 0 1.98 0.5132 136980.81 35213.4265 77104.96 1460.1566 2566.5566 70.00 49.00 293300.00 81300.00 225615.45 600215.45 -5.25 3.35 0.22 1.67 -0.01 100.03 14975.04 324480.74 265.28 22.95
Carbon offsetting
542 1038 7.24 0 1.98 0.5132 136980.81 35213.4265 77104.96 -2780.616 -1674.216 70.00 49.00 293300.00 81300.00 225615.45 600215.45 -5.25 3.35 0.22 1.67 -0.01 100.03 19215.82 324282.61 67.16 17.65
provided Elec. & heating
TSC area m2
PV area m2
Heating (KWh/m2)
Lighting (KWh/m2)
Hot water (KWh/m2)
TSC fan power
(KWh/m2)
generated Elec by PV
(KWh)
purchased from grid
elec (KWh)
Exported Elec
(KWh)Elec cost £
Energy cost Inc FIT
£
Wall Insulation price £/m2
Roof Insulation price £/m2
Total Insulation
price £TSC cost £ PV Cost £
Fabric cost £
Operational CO2
(kgCO2/m2.yr)
PV ECO2
(kgCO2/m2.yr)
TSC ECO2
(kgCO2/m2.yr)
Insulation ECO2
(kgCO2/m2.yr)
Total CO2
(kgCO2/m2.yr)CO2
saving %
Energy saving (A)
£
PV(A) £
NPV £
Payback period (years)
0 0 0 32.9 31.8 1.98 0 0 0 0 13356 17541.6 66.00 46.00 276000.00 0.00 0.00 276000.00 23.52 0.00 0.00 1.20 24.72 0.00 0.00 0.00 0.00 025 109 213 21 24.675 1.98 0.238 28108.779 68675.2667 1695.68 9538.2317 12295.832 71.50 50.00 299450.00 16350.00 35205.88 351005.88 16.34 0.69 0.04 1.86 18.93 23.40 5245.77 74982.76 -23.12 14.8550 292 427 14 16.45 1.98 0.378 56349.525 53315.7105 14577.04 6808.2326 8725.8326 71.50 50.00 299450.00 43800.00 75847.06 419097.06 10.10 1.38 0.12 1.86 13.46 45.54 8815.77 143516.93 419.87 1775 535 640 7 8.225 1.98 0.518 84458.304 44755.5418 33894.52 4740.5226 5818.1226 71.50 50.00 299450.00 80250.00 116488.24 496188.24 3.93 2.07 0.22 1.86 8.08 67.33 11723.48 220276.78 88.54 19.75
75-100 535 853 7 0 1.98 0.518 112567.08 38839.5238 56318.41 2903.2047 3980.8047 71.50 50.00 299450.00 80250.00 157129.41 536829.41 -1.02 2.75 0.22 1.86 3.81 84.60 13560.80 260938.44 109.03 20.25Carbon
offsetting535 1046 7 0 1.98 0.518 138036.54 35065.5765 78010.63 1398.7025 2476.3025 71.50 50.00 299450.00 80250.00 227354.30 607054.30 -5.48 3.38 0.22 1.86 -0.02 100.09 15065.30 331139.20 84.90 23.3
Carbon offsetting
535 1046 7 0 1.98 0.518 138036.54 35065.5765 78010.63 -2891.882 -1814.282 71.50 50.00 299450.00 80250.00 227354.30 607054.30 -5.48 3.38 0.22 1.86 -0.02 100.09 19355.88 331075.47 21.17 17.9
provided Elec. & heating
TSC area m2
PV area m2
Heating (KWh/m2)
Lighting (KWh/m2)
Hot water (KWh/m2)
TSC fan power
(KWh/m2)
generated Elec by PV
(KWh)
purchased from grid
elec (KWh)
Exported Elec
(KWh)Elec cost £
Energy cost Inc FIT
£
Wall Insulation price £/m2
Roof Insulation price £/m2
Total Insulation
price £TSC cost £ PV Cost £
Fabric cost £
Operational CO2
(kgCO2/m2.yr)
PV ECO2
(kgCO2/m2.yr)
TSC ECO2
(kgCO2/m2.yr)
Insulation ECO2
(kgCO2/m2.yr)
Total CO2
(kgCO2/m2.yr)CO2
saving %
Energy saving (A)
£
PV(A) £
NPV £
Payback period (years)
0 0 0 32.9 31.8 1.98 0 0 0 0 13356 17541.6 66.00 46.00 276000.00 0.00 0.00 276000.00 23.52 0.00 0.00 1.20 24.72 0.00 0.00 0.00 0.00 025 107 213 20.2 24.675 1.98 0.254 28108.779 68675.2667 1695.68 9538.2317 12199.832 73.00 51.00 305600.00 16050.00 35205.88 356855.88 16.19 0.69 0.04 2.04 18.96 23.28 5341.77 81055.29 199.41 15.850 288 427 13.52 16.45 1.98 0.3876 56349.525 53315.7105 14577.04 6808.2326 8668.2326 73.00 51.00 305600.00 43200.00 75847.06 424647.06 10.02 1.38 0.12 2.04 13.55 45.18 8873.37 148525.88 -121.18 17.575 527 640 6.76 8.225 1.98 0.5228 84458.304 44755.5418 33894.52 4740.5226 5789.3226 73.00 51.00 305600.00 79050.00 116488.24 501138.24 3.89 2.07 0.22 2.04 8.21 66.80 11752.28 225075.59 -62.65 20.15
75-100 527 853 6.76 0 1.98 0.5228 112567.08 38839.5238 56318.41 2903.2047 3952.0047 73.00 51.00 305600.00 79050.00 157129.41 541779.41 -1.07 2.75 0.22 2.04 3.94 84.06 13589.60 265790.61 11.20 20.6Carbon
offsetting527 1052 6.76 0 1.98 0.5228 138828.34 34954.6889 78689.88 1352.6118 2401.4118 73.00 51.00 305600.00 79050.00 228658.44 613308.44 -5.66 3.39 0.22 2.04 -0.01 100.04 15140.19 337503.52 195.08 23.65
Carbon offsetting
527 1052 6.76 0 1.98 0.5228 138828.34 34954.6889 78689.88 -2975.332 -1926.532 73.00 51.00 305600.00 79050.00 228658.44 613308.44 -5.66 3.39 0.22 2.04 -0.01 100.04 19468.13 337444.88 136.44 18.15
provided Elec. & heating
TSC area m2
PV area m2
Heating (KWh/m2)
Lighting (KWh/m2)
Hot water (KWh/m2)
TSC fan power
(KWh/m2)
generated Elec by PV
(KWh)
purchased from grid
elec (KWh)
Exported Elec
(KWh)Elec cost £
Energy cost Inc FIT
£
Wall Insulation price £/m2
Roof Insulation price £/m2
Total Insulation
price £TSC cost £ PV Cost £
Fabric cost £
Operational CO2
(kgCO2/m2.yr)
PV ECO2
(kgCO2/m2.yr)
TSC ECO2
(kgCO2/m2.yr)
Insulation ECO2
(kgCO2/m2.yr)
Total CO2
(kgCO2/m2.yr)CO2
saving %
Energy saving (A)
£
PV(A) £
NPV £
Payback period (years)
0 0 0 32.9 31.8 1.98 0 0 0 0 13356 17541.6 66.00 46.00 276000.00 0.00 0.00 276000.00 23.52 0.00 0.00 1.20 24.72 0.00 0.00 0.00 0.00 025 106 213 18.6 24.675 1.98 0.286 28108.779 68675.2667 1695.68 9538.2317 12007.832 79.00 55.00 330200.00 15900.00 35205.88 381305.88 15.90 0.69 0.04 2.79 19.42 21.45 5533.77 105229.49 -76.39 2050 286 427 12.4 16.45 1.98 0.41 56349.525 53315.7105 14577.04 6808.2326 8533.8326 79.00 55.00 330200.00 42900.00 75847.06 448947.06 9.81 1.38 0.12 2.79 14.09 42.99 9007.77 172921.15 -25.90 20.275 524 640 6.2 8.225 1.98 0.534 84458.304 44755.5418 33894.52 4740.5226 5722.1226 79.00 55.00 330200.00 78600.00 116488.24 525288.24 3.78 2.07 0.21 2.79 8.85 64.19 11819.48 249236.88 -51.35 22.3
75-100 524 853 6.2 0 1.98 0.534 112567.08 38839.5238 56318.41 2903.2047 3884.8047 79.00 55.00 330200.00 78600.00 157129.41 565929.41 -1.17 2.75 0.21 2.79 4.58 81.45 13656.80 289814.05 -115.36 22.45Carbon
offsetting524 1085 6.2 0 1.98 0.534 143183.22 34409.6016 82490.54 1105.2699 2086.8699 79.00 55.00 330200.00 78600.00 235831.18 644631.18 -6.52 3.50 0.21 2.79 -0.02 100.08 15454.73 368474.31 -156.88 25.4
Carbon offsetting
524 1085 6.2 0 1.98 0.534 143183.22 34409.6016 82490.54 -3431.71 -2450.11 79.00 55.00 330200.00 78600.00 235831.18 644631.18 -6.52 3.50 0.21 2.79 -0.02 100.08 19991.71 368374.93 -256.26 19.35
provided Elec. & heating
TSC area m2
PV area m2
Heating (KWh/m2)
Lighting (KWh/m2)
Hot water (KWh/m2)
TSC fan power
(KWh/m2)
generated Elec by PV
(KWh)
purchased from grid
elec (KWh)
Exported Elec
(KWh)Elec cost £
Energy cost Inc FIT
£
Wall Insulation price £/m2
Roof Insulation price £/m2
Total Insulation
price £TSC cost £ PV Cost £
Fabric cost £
Operational CO2
(kgCO2/m2.yr)
PV ECO2
(kgCO2/m2.yr)
TSC ECO2
(kgCO2/m2.yr)
Insulation ECO2
(kgCO2/m2.yr)
Total CO2
(kgCO2/m2.yr)CO2
saving %
Energy saving (A)
£
PV(A) £
NPV £
Payback period (years)
0 0 0 32.9 31.8 1.98 0 0 0 0 13356 17541.6 66.00 46.00 276000.00 0.00 0.00 276000.00 23.52 0.00 0.00 1.20 24.72 0.00 0.00 0.00 0.00 025 105 213 18.17 24.675 1.98 0.2946 28108.779 68675.2667 1695.68 9538.2317 11956.232 82.00 57.00 342500.00 15750.00 35205.88 393455.88 15.82 0.69 0.04 3.16 19.71 20.28 5585.37 117528.35 72.47 22.2550 284 427 12.11 16.45 1.98 0.4158 56349.525 53315.7105 14577.04 6808.2326 8499.0326 82.00 57.00 342500.00 42600.00 75847.06 460947.06 9.75 1.38 0.12 3.16 14.41 41.71 9042.57 185002.56 55.50 21.675 521 640 6.05 8.225 1.98 0.537 84458.304 44755.5418 33894.52 4740.5226 5704.1226 82.00 57.00 342500.00 78150.00 116488.24 537138.24 3.75 2.07 0.21 3.16 9.19 62.81 11837.48 261245.49 107.26 23.4
75-100 521 853 6.05 0 1.98 0.537 112567.08 38839.5238 56318.41 2903.2047 3866.8047 82.00 57.00 342500.00 78150.00 157129.41 577779.41 -1.20 2.75 0.21 3.16 4.93 80.08 13674.80 301793.91 14.50 23.4Carbon
offsetting521 1103 6.05 0 1.98 0.537 145558.61 34094.8964 84534.74 969.22233 1932.8223 82.00 57.00 342500.00 78150.00 239743.59 660393.59 -6.96 3.56 0.21 3.16 -0.03 100.13 15608.78 384512.13 118.54 26.3
Carbon offsetting
521 1103 6.05 0 1.98 0.537 145558.61 34094.8964 84534.74 -3680.188 -2716.588 82.00 57.00 342500.00 78150.00 239743.59 660393.59 -6.96 3.56 0.21 3.16 -0.03 100.13 20258.19 384310.04 -83.55 19.95
TSC + PV + 0.08 - 0.11
TSC + PV + 0.07 - 0.10
Retail shed - London
TSC + PV + 2010 notional building fabric
TSC + PV + 0.17 - 0.24
TSC + PV + 0.15 - 0.21
TSC + PV + 0.13 - 0.19
TSC + PV + 0.12 - 0.17
TSC + PV + 0.11 - 0.15
PV (future FiT) + Insulation + TSC

222
Table B. 29 Office - PV (curren FiT) + improving the building fabric U-value down to 0.07-0.1 W/m2.K (PUR) – not taking into account the rental loss/gain
provided Elec. by PV
PV area m2
Heating (KWh/m2)
Lighting (KWh/m2)
Hot water (KWh/m2)
generated Elec by PV
(KWh)
purchased from grid
elec (KWh)
Exported Elec
(KWh)
Elec Cost £
Energy cost Inc FIT
Wall Insulation price £/m2
Roof Insulation price £/m2
Total Insulation
price £
PV cost £
Fabric cost £
Operational CO2
(kgCO2/m2.yr)
PV ECO2
(kgCO2/m2.yr)
Insulation ECO2
(kgCO2/m2.yr)
Total CO2
(kgCO2/m2.yr)CO2 saving
%
Energy saving (A)
£
PV(A) £
NPV £
0 0 18.73 32.85 3.51 0 0 0 11957.4 14270.36 66.00 46.00 143460.00 0.00 143460.00 21.59 0.000.66
22.25 0.00 0.00 0.00 0.00
25% 190 18.73 24.6375 3.51 25073.559 60344.37639 0 4812.547 7125.50664 66.00 46.00 143460.00 35168.82 178628.82 16.53 0.71 0.66 17.90 19.55 7144.85 167825.31 132656.4950% 382 18.73 16.425 3.51 50411.0502 41744.91709 6740.097 -1768.62 544.341737 66.00 46.00 143460.00 70337.65 213797.65 11.42 1.42 0.66 13.50 39.31 13726.02 322410.16 252072.5275% 573 18.73 8.2125 3.51 75616.5753 31431.65212 21630.29 -7537.34 -5224.3753 66.00 46.00 143460.00 105506.47 248966.47 6.34 2.13 0.66 9.13 58.97 19494.74 457911.44 352404.97100% 764 18.73 0 3.51 100822.1004 25097.89092 40453.35 -12925.9 -10612.941 66.00 46.00 143460.00 140675.29 284135.29 1.26 2.84 0.66 4.77 78.59 24883.30 584483.34 443808.05
Carbon offsetting 972 18.73 0 3.51 128271.0492 20369.73608 63219.18 -18592.4 -16279.442 66.00 46.00 143460.00 211269.96 354729.96 -4.29 3.62 0.66 -0.01 100.04 30549.80 717583.68 506313.72
provided Elec. by PV
PV area m2
Heating (KWh/m2)
Lighting (KWh/m2)
Hot water (KWh/m2)
generated Elec by PV
(KWh)
purchased from grid
elec (KWh)
Exported Elec
(KWh)
Elec Cost £
Energy cost Inc FIT
Wall Insulation price £/m2
Roof Insulation price £/m2
Total Insulation
price £
PV cost £
Fabric cost £
Operational CO2
(kgCO2/m2.yr)
PV ECO2
(kgCO2/m2.yr)
Insulation ECO2
(kgCO2/m2.yr)
Total CO2
(kgCO2/m2.yr)CO2 saving
%
Energy saving (A)
£
PV(A) £
NPV £
0 0 18.73 32.85 3.51 0 0 0 11957.4 14270.36 66.00 46.00 143460.00 0.00 143460.00 21.59 0.00 0.66 22.25 0.00 0.00 0.00 0.0025% 190 18.05 24.6375 3.51 25073.559 60344.37639 0 4812.547 7054.78664 67.00 47.00 145830.00 35168.82 180998.82 16.40 0.71 0.71 17.82 19.92 7215.57 169486.46 131947.6350% 382 18.05 16.425 3.51 50411.0502 41744.91709 6740.097 -1768.62 473.621737 67.00 47.00 145830.00 70337.65 216167.65 11.29 1.42 0.71 13.42 39.69 13796.74 324071.30 251363.6675% 573 18.05 8.2125 3.51 75616.5753 31431.65212 21630.29 -7537.34 -5295.0953 67.00 47.00 145830.00 105506.47 251336.47 6.20 2.13 0.71 9.05 59.34 19565.46 459572.58 351696.11100% 764 18.05 0 3.51 100822.1004 25097.89092 40453.35 -12925.9 -10683.661 67.00 47.00 145830.00 140675.29 286505.29 1.13 2.84 0.71 4.68 78.96 24954.02 586144.48 443099.19
Carbon offsetting 968 18.05 0 3.51 127743.1848 20444.90992 62767.41 -18485 -16242.768 67.00 47.00 145830.00 210400.54 356230.54 -4.31 3.60 0.71 0.00 100.00 30513.13 716722.24 503951.70
provided Elec. by PV
PV area m2
Heating (KWh/m2)
Lighting (KWh/m2)
Hot water (KWh/m2)
generated Elec by PV
(KWh)
purchased from grid
elec (KWh)
Exported Elec
(KWh)
Elec Cost £
Energy cost Inc FIT
Wall Insulation price £/m2
Roof Insulation price £/m2
Total Insulation
price £
PV cost £
Fabric cost £
Operational CO2
(kgCO2/m2.yr)
PV ECO2
(kgCO2/m2.yr)
Insulation ECO2
(kgCO2/m2.yr)
Total CO2
(kgCO2/m2.yr)CO2 saving
%
Energy saving (A)
£
PV(A) £
NPV £
0 0 18.73 32.85 3.51 0 0 0 11957.4 14270.36 66.00 46.00 143460.00 0.00 143460.00 21.59 0.00 0.66 22.25 0.00 0.00 0.00 0.0025% 190 17.05 24.6375 3.51 25073.559 60344.37639 0 4812.547 6950.78664 68.50 48.00 149061.00 35168.82 184229.82 16.21 0.71 0.81 17.72 20.35 7319.57 171929.31 131159.4950% 382 17.05 16.425 3.51 50411.0502 41744.91709 6740.097 -1768.62 369.621737 68.50 48.00 149061.00 70337.65 219398.65 11.09 1.42 0.81 13.32 40.12 13900.74 326514.16 250575.5175% 573 17.05 8.2125 3.51 75616.5753 31431.65212 21630.29 -7537.34 -5399.0953 68.50 48.00 149061.00 105506.47 254567.47 6.01 2.13 0.81 8.95 59.78 19669.46 462015.43 350907.96100% 764 17.05 0 3.51 100822.1004 25097.89092 40453.35 -12925.9 -10787.661 68.50 48.00 149061.00 140675.29 289736.29 0.93 2.84 0.81 4.59 79.39 25058.02 588587.34 442311.04
Carbon offsetting 964 17.05 0 3.51 127215.3204 20520.08376 62315.64 -18377.6 -16239.373 68.50 48.00 149061.00 209531.12 358592.12 -4.40 3.59 0.81 0.00 100.02 30509.73 716642.50 501510.39
provided Elec. by PV
PV area m2
Heating (KWh/m2)
Lighting (KWh/m2)
Hot water (KWh/m2)
generated Elec by PV
(KWh)
purchased from grid
elec (KWh)
Exported Elec
(KWh)
Elec Cost £
Energy cost Inc FIT
Wall Insulation price £/m2
Roof Insulation price £/m2
Total Insulation
price £
PV cost £
Fabric cost £
Operational CO2
(kgCO2/m2.yr)
PV ECO2
(kgCO2/m2.yr)
Insulation ECO2
(kgCO2/m2.yr)
Total CO2
(kgCO2/m2.yr)CO2 saving
%
Energy saving (A)
£
PV(A) £
NPV £
0 0 18.73 32.85 3.51 0 0 0 11957.4 14270.36 66.00 46.00 143460.00 0.00 143460.00 21.59 0.00 0.66 22.25 0.00 0.00 0.00 0.0025% 190 16.49 24.6375 3.51 25073.559 60344.37639 0 4812.547 6892.54664 70.00 49.00 152292.00 35168.82 187460.82 16.10 0.71 0.91 17.71 20.40 7377.81 173297.31 129296.4850% 382 16.49 16.425 3.51 50411.0502 41744.91709 6740.097 -1768.62 311.381737 70.00 49.00 152292.00 70337.65 222629.65 10.98 1.42 0.91 13.32 40.16 13958.98 327882.16 248712.5175% 573 16.49 8.2125 3.51 75616.5753 31431.65212 21630.29 -7537.34 -5457.3353 70.00 49.00 152292.00 105506.47 257798.47 5.90 2.13 0.91 8.94 59.82 19727.70 463383.43 349044.96100% 764 16.49 0 3.51 100822.1004 25097.89092 40453.35 -12925.9 -10845.901 70.00 49.00 152292.00 140675.29 292967.29 0.82 2.84 0.91 4.58 79.43 25116.26 589955.33 440448.04
Carbon offsetting 964 16.49 0 3.51 127215.3204 20520.08376 62315.64 -18377.6 -16297.613 70.00 49.00 152292.00 209531.12 361823.12 -4.51 3.59 0.91 -0.01 100.06 30567.97 718010.50 499647.39
provided Elec. by PV
PV area m2
Heating (KWh/m2)
Lighting (KWh/m2)
Hot water (KWh/m2)
generated Elec by PV
(KWh)
purchased from grid
elec (KWh)
Exported Elec
(KWh)
Elec Cost £
Energy cost Inc FIT
Wall Insulation price £/m2
Roof Insulation price £/m2
Total Insulation
price £
PV cost £
Fabric cost £
Operational CO2
(kgCO2/m2.yr)
PV ECO2
(kgCO2/m2.yr)
Insulation ECO2
(kgCO2/m2.yr)
Total CO2
(kgCO2/m2.yr)CO2 saving
%
Energy saving (A)
£
PV(A) £
NPV £
0 0 18.73 32.85 3.51 0 0 0 11957.4 14270.36 66.00 46.00 143460.00 0.00 143460.00 21.59 0.00 0.66 22.25 0.00 0.00 0.00 0.0025% 190 16 24.6375 3.51 25073.559 60344.37639 0 4812.547 6841.58664 71.50 50.00 155523.00 35168.82 190691.82 16.00 0.71 1.01 17.72 20.38 7428.77 174494.31 127262.4850% 382 16 16.425 3.51 50411.0502 41744.91709 6740.097 -1768.62 260.421737 71.50 50.00 155523.00 70337.65 225860.65 10.89 1.42 1.01 13.32 40.14 14009.94 329079.15 246678.5175% 573 16 8.2125 3.51 75616.5753 31431.65212 21630.29 -7537.34 -5508.2953 71.50 50.00 155523.00 105506.47 261029.47 5.80 2.13 1.01 8.94 59.80 19778.66 464580.43 347010.96100% 764 16 0 3.51 100822.1004 25097.89092 40453.35 -12925.9 -10896.861 71.50 50.00 155523.00 140675.29 296198.29 0.73 2.84 1.01 4.58 79.42 25167.22 591152.33 438414.04
Carbon offsetting 964 16 0 3.51 127215.3204 20520.08376 62315.64 -18377.6 -16348.573 71.50 50.00 155523.00 209531.12 365054.12 -4.61 3.59 1.01 -0.01 100.05 30618.93 719207.50 497613.38
provided Elec. by PV
PV area m2
Heating (KWh/m2)
Lighting (KWh/m2)
Hot water (KWh/m2)
generated Elec by PV
(KWh)
purchased from grid
elec (KWh)
Exported Elec
(KWh)
Elec Cost £
Energy cost Inc FIT
Wall Insulation price £/m2
Roof Insulation price £/m2
Total Insulation
price £
PV cost £
Fabric cost £
Operational CO2
(kgCO2/m2.yr)
PV ECO2
(kgCO2/m2.yr)
Insulation ECO2
(kgCO2/m2.yr)
Total CO2
(kgCO2/m2.yr)CO2 saving
%
Energy saving (A)
£
PV(A) £
NPV £
0 0 18.73 32.85 3.51 0 0 0 11957.4 14270.36 66.00 46.00 143460.00 0.00 143460.00 21.59 0.00 0.66 22.25 0.00 0.00 0.00 0.0025% 190 15.52 24.6375 3.51 25073.559 60344.37639 0 4812.547 6791.66664 73.00 51.00 158754.00 35168.82 193922.82 15.91 0.71 1.11 17.72 20.35 7478.69 175666.88 125204.0550% 382 15.52 16.425 3.51 50411.0502 41744.91709 6740.097 -1768.62 210.501737 73.00 51.00 158754.00 70337.65 229091.65 10.79 1.42 1.11 13.32 40.12 14059.86 330251.72 244620.0875% 573 15.52 8.2125 3.51 75616.5753 31431.65212 21630.29 -7537.34 -5558.2153 73.00 51.00 158754.00 105506.47 264260.47 5.71 2.13 1.11 8.95 59.78 19828.58 465753.00 344952.53100% 764 15.52 0 3.51 100822.1004 25097.89092 40453.35 -12925.9 -10946.781 73.00 51.00 158754.00 140675.29 299429.29 0.63 2.84 1.11 4.59 79.39 25217.14 592324.90 436355.61
Carbon offsetting 964 15.52 0 3.51 127215.3204 20520.08376 62315.64 -18377.6 -16398.493 73.00 51.00 158754.00 209531.12 368285.12 -4.70 3.59 1.11 0.00 100.02 30668.85 720380.07 495554.95
provided Elec. by PV
PV area m2
Heating (KWh/m2)
Lighting (KWh/m2)
Hot water (KWh/m2)
generated Elec by PV
(KWh)
purchased from grid
elec (KWh)
Exported Elec
(KWh)
Elec Cost £
Energy cost Inc FIT
Wall Insulation price £/m2
Roof Insulation price £/m2
Total Insulation
price £
PV cost £
Fabric cost £
Operational CO2
(kgCO2/m2.yr)
PV ECO2
(kgCO2/m2.yr)
Insulation ECO2
(kgCO2/m2.yr)
Total CO2
(kgCO2/m2.yr)CO2 saving
%
Energy saving (A)
£
PV(A) £
NPV £
0 0 18.73 32.85 3.51 0 0 0 11957.4 14270.36 66.00 46.00 143460.00 0.00 143460.00 21.59 0.00 0.66 22.25 0.00 0.00 0.00 0.0025% 190 15 24.6375 3.51 25073.559 60344.37639 0 4812.547 6737.58664 79.00 55.00 171678.00 35168.82 206846.82 15.80 0.71 1.62 18.13 18.52 7532.77 176937.16 113550.3450% 382 15 16.425 3.51 50411.0502 41744.91709 6740.097 -1768.62 156.421737 79.00 55.00 171678.00 70337.65 242015.65 10.69 1.42 1.62 13.73 38.28 14113.94 331522.01 232966.3675% 573 15 8.2125 3.51 75616.5753 31431.65212 21630.29 -7537.34 -5612.2953 79.00 55.00 171678.00 105506.47 277184.47 5.61 2.13 1.62 9.36 57.94 19882.66 467023.28 333298.81100% 764 15 0 3.51 100822.1004 25097.89092 40453.35 -12925.9 -11000.861 79.00 55.00 171678.00 140675.29 312353.29 0.53 2.84 1.62 4.99 77.56 25271.22 593595.19 424701.89
Carbon offsetting 987 15.52 0 3.51 130250.5407 20087.83418 64913.32 -18995.1 -17016.011 79.00 55.00 171678.00 214530.30 386208.30 -5.31 3.67 1.62 -0.02 100.09 31286.37 734884.93 492136.63
provided Elec. by PV
PV area m2
Heating (KWh/m2)
Lighting (KWh/m2)
Hot water (KWh/m2)
generated Elec by PV
(KWh)
purchased from grid
elec (KWh)
Exported Elec
(KWh)
Elec Cost £
Energy cost Inc FIT
Wall Insulation price £/m2
Roof Insulation price £/m2
Total Insulation
price £
PV cost £
Fabric cost £
Operational CO2
(kgCO2/m2.yr)
PV ECO2
(kgCO2/m2.yr)
Insulation ECO2
(kgCO2/m2.yr)
Total CO2
(kgCO2/m2.yr)CO2 saving
%
Energy saving (A)
£
PV(A) £
NPV £
0 0 18.73 32.85 3.51 0 0 0 11957.4 14270.36 66.00 46.00 143460.00 0.00 143460.00 21.59 0.00 0.66 22.25 0.00 0.00 0.00 0.0025% 190 14.2 24.6375 3.51 25073.559 60344.37639 0 4812.547 6654.38664 82.00 57.00 178140.00 35168.82 213308.82 15.65 0.71 1.72 18.07 18.78 7615.97 178891.44 109042.6250% 382 14.2 16.425 3.51 50411.0502 41744.91709 6740.097 -1768.62 73.2217372 82.00 57.00 178140.00 70337.65 248477.65 10.53 1.42 1.72 13.68 38.54 14197.14 333476.29 228458.6475% 573 14.2 8.2125 3.51 75616.5753 31431.65212 21630.29 -7537.34 -5695.4953 82.00 57.00 178140.00 105506.47 283646.47 5.45 2.13 1.72 9.30 58.20 19965.86 468977.57 328791.10100% 764 14.2 0 3.51 100822.1004 25097.89092 40453.35 -12925.9 -11084.061 82.00 57.00 178140.00 140675.29 318815.29 0.37 2.84 1.72 4.94 77.81 25354.42 595549.47 420194.18
Carbon offsetting 980 14.2 0 3.51 129326.778 20219.3884 64122.72 -18807.2 -16965.351 82.00 57.00 178140.00 213008.81 391148.81 -5.39 3.65 1.72 -0.02 100.08 31235.71 733694.98 486006.17
PV + 0.08 - 0.11
PV + 0.07 - 0.10
PV + 2010 notional building fabric
Office-London
PV + 0.17 - 0.24
PV + 0.15 - 0.21
PV + 0.13 - 0.19
PV + 0.12 - 0.17
PV + 0.11 - 0.15
PV (current FiT) + Insulation

223
Table B. 30 Office - PV (future FiT) + improving the building fabric U-value down to 0.07-0.1 W/m2.K (PUR) – not taking into account the rental loss/gain
provided Elec. by PV
PV area m2
Heating (KWh/m2)
Lighting (KWh/m2)
Hot water (KWh/m2)
generated Elec by PV
(KWh)
purchased from grid
elec (KWh)
Exported Elec
(KWh)Elec Cost £
Energy cost Inc
FIT
Wall Insulation price £/m2
Roof Insulation price £/m2
Total Insulation
price £
PV cost £
Fabric cost £
Operational CO2
(kgCO2/m2.yr)
PV ECO2
(kgCO2/m2.yr)
Insulation ECO2
(kgCO2/m2.yr)
Total CO2
(kgCO2/m2.yr)CO2 saving
%Energy
saving (A) £PV(A)
£NPV
£
0 0 18.73 32.85 3.51 0 0 0 11957.4 14270.36 66.00 46.00 143460.00 0.00 143460.00 21.59 0.00 0.66 22.25 0.00 0.00 0.00 0.0025% 190 18.73 24.6375 3.51 25073.559 60344.37639 0 8448.2127 10761.173 66.00 46.00 143460.00 35168.82 178628.82 16.53 0.71 0.66 17.90 19.55 3509.19 82427.23 47258.4150% 382 18.73 16.425 3.51 50411.0502 41744.91709 6740.0973 5540.984 7853.944 66.00 46.00 143460.00 70337.65 213797.65 11.42 1.42 0.66 13.50 39.31 6416.42 150715.06 80377.4275% 573 18.73 8.2125 3.51 75616.5753 31431.65212 21630.292 3427.0682 5740.0282 66.00 46.00 143460.00 105506.47 248966.47 6.34 2.13 0.66 9.13 58.97 8530.33 200368.79 94862.32100% 764 18.73 0 3.51 100822.1 25097.89092 40453.352 1693.3039 4006.2639 66.00 46.00 143460.00 140675.29 284135.29 1.26 2.84 0.66 4.77 78.59 10264.10 241093.14 100417.85100% 764 18.73 0 3.51 100822.1 25097.89092 40453.352 -531.6305 1781.3295 66.00 46.00 143460.00 140675.29 284135.29 1.26 2.84 1.66 5.77 74.09 12489.03 293354.58 152679.29
Carbon offsetting 972 18.73 0 3.51 128271.049 20369.73608 63219.179 6.8999979 2319.86 66.00 46.00 143460.00 211269.96 354729.96 -4.29 3.62 0.66 -0.01 100.04 11950.50 280705.05 69435.09Carbon offsetting 972 18.73 0 3.51 128271.049 20369.73608 63219.179 -3470.155 -1157.195 66.00 46.00 143460.00 211269.96 354729.96 -4.29 3.62 0.66 -0.01 100.04 15427.55 362377.52 151107.56
provided Elec. by PV
PV area m2
Heating (KWh/m2)
Lighting (KWh/m2)
Hot water (KWh/m2)
generated Elec by PV
(KWh)
purchased from grid
elec (KWh)
Exported Elec
(KWh)Elec Cost £
Energy cost Inc
FIT
Wall Insulation price £/m2
Roof Insulation price £/m2
Total Insulation
price £
PV cost £
Fabric cost £
Operational CO2
(kgCO2/m2.yr)
PV ECO2
(kgCO2/m2.yr)
Insulation ECO2
(kgCO2/m2.yr)
Total CO2
(kgCO2/m2.yr)CO2 saving
%Energy
saving (A) £PV(A)
£NPV
£
0 0 18.73 32.85 3.51 0 0 0 11957.4 14270.36 66.00 46.00 143460.00 0.00 143460.00 21.59 0.00 0.66 22.25 0.00 0.00 0.00 0.0025% 190 18.05 24.6375 3.51 25073.559 60344.37639 0 8448.2127 10690.453 67.00 47.00 145830.00 35168.82 180998.82 16.40 0.71 0.71 17.82 19.92 3579.91 84088.37 46549.5550% 382 18.05 16.425 3.51 50411.0502 41744.91709 6740.0973 5540.984 7783.224 67.00 47.00 145830.00 70337.65 216167.65 11.29 1.42 0.71 13.42 39.69 6487.14 152376.20 79668.5675% 573 18.05 8.2125 3.51 75616.5753 31431.65212 21630.292 3427.0682 5669.3082 67.00 47.00 145830.00 105506.47 251336.47 6.20 2.13 0.71 9.05 59.34 8601.05 202029.93 94153.46100% 764 18.05 0 3.51 100822.1 25097.89092 40453.352 1693.3039 3935.5439 67.00 47.00 145830.00 140675.29 286505.29 1.13 2.84 0.71 4.68 78.96 10334.82 242754.28 99708.99100% 764 18.05 0 3.51 100822.1 25097.89092 40453.352 -531.6305 1710.6095 67.00 47.00 145830.00 140675.29 286505.29 1.13 2.84 1.71 5.68 74.47 12559.75 295015.72 151970.43
Carbon offsetting 968 18.05 0 3.51 127743.185 20444.90992 62767.407 37.754058 2279.9941 67.00 47.00 145830.00 210400.54 356230.54 -4.31 3.60 0.71 0.00 100.00 11990.37 281641.46 68870.92Carbon offsetting 968 18.05 0 3.51 127743.185 20444.90992 62767.407 -3414.453 -1172.213 67.00 47.00 145830.00 210400.54 356230.54 -4.31 3.60 0.71 0.00 100.00 15442.57 362730.29 149959.75
provided Elec. by PV
PV area m2
Heating (KWh/m2)
Lighting (KWh/m2)
Hot water (KWh/m2)
generated Elec by PV
(KWh)
purchased from grid
elec (KWh)
Exported Elec
(KWh)Elec Cost £
Energy cost Inc
FIT
Wall Insulation price £/m2
Roof Insulation price £/m2
Total Insulation
price £
PV cost £
Fabric cost £
Operational CO2
(kgCO2/m2.yr)
PV ECO2
(kgCO2/m2.yr)
Insulation ECO2
(kgCO2/m2.yr)
Total CO2
(kgCO2/m2.yr)CO2 saving
%Energy
saving (A) £PV(A)
£NPV
£
0 0 18.73 32.85 3.51 0 0 0 11957.4 14270.36 66.00 46.00 143460.00 0.00 143460.00 21.59 0.00 0.66 22.25 0.00 0.00 0.00 0.0025% 190 17.05 24.6375 3.51 25073.559 60344.37639 0 8448.2127 10586.453 68.50 48.00 149061.00 35168.82 184229.82 16.21 0.71 0.81 17.72 20.35 3683.91 86531.22 45761.4050% 382 17.05 16.425 3.51 50411.0502 41744.91709 6740.0973 5540.984 7679.224 68.50 48.00 149061.00 70337.65 219398.65 11.09 1.42 0.81 13.32 40.12 6591.14 154819.06 78880.4175% 573 17.05 8.2125 3.51 75616.5753 31431.65212 21630.292 3427.0682 5565.3082 68.50 48.00 149061.00 105506.47 254567.47 6.01 2.13 0.81 8.95 59.78 8705.05 204472.79 93365.31100% 764 17.05 0 3.51 100822.1 25097.89092 40453.352 1693.3039 3831.5439 68.50 48.00 149061.00 140675.29 289736.29 0.93 2.84 0.81 4.59 79.39 10438.82 245197.14 98920.84100% 764 17.05 0 3.51 100822.1 25097.89092 40453.352 -531.6305 1606.6095 68.50 48.00 149061.00 140675.29 289736.29 0.93 2.84 1.81 5.59 74.90 12663.75 297458.58 151182.28
Carbon offsetting 964 17.05 0 3.51 127215.32 20520.08376 62315.636 68.608117 2206.8481 68.50 48.00 149061.00 209531.12 358592.12 -4.40 3.59 0.81 0.00 100.02 12063.51 283359.58 68227.47Carbon offsetting 964 17.05 0 3.51 127215.32 20520.08376 62315.636 -3358.752 -1220.512 68.50 48.00 149061.00 209531.12 358592.12 -4.40 3.59 0.81 0.00 100.02 15490.87 363864.77 148732.66
provided Elec. by PV
PV area m2
Heating (KWh/m2)
Lighting (KWh/m2)
Hot water (KWh/m2)
generated Elec by PV
(KWh)
purchased from grid
elec (KWh)
Exported Elec
(KWh)Elec Cost £
Energy cost Inc
FIT
Wall Insulation price £/m2
Roof Insulation price £/m2
Total Insulation
price £
PV cost £
Fabric cost £
Operational CO2
(kgCO2/m2.yr)
PV ECO2
(kgCO2/m2.yr)
Insulation ECO2
(kgCO2/m2.yr)
Total CO2
(kgCO2/m2.yr)CO2 saving
%Energy
saving (A) £PV(A)
£NPV
£
0 0 18.73 32.85 3.51 0 0 0 11957.4 14270.36 66.00 46.00 143460.00 0.00 143460.00 21.59 0.00 0.66 22.25 0.00 0.00 0.00 0.0025% 190 16.49 24.6375 3.51 25073.559 60344.37639 0 8448.2127 10528.213 70.00 49.00 152292.00 35168.82 187460.82 16.10 0.71 0.91 17.71 20.40 3742.15 87899.22 43898.4050% 382 16.49 16.425 3.51 50411.0502 41744.91709 6740.0973 5540.984 7620.984 70.00 49.00 152292.00 70337.65 222629.65 10.98 1.42 0.91 13.32 40.16 6649.38 156187.06 77017.4175% 573 16.49 8.2125 3.51 75616.5753 31431.65212 21630.292 3427.0682 5507.0682 70.00 49.00 152292.00 105506.47 257798.47 5.90 2.13 0.91 8.94 59.82 8763.29 205840.78 91502.31100% 764 16.49 0 3.51 100822.1 25097.89092 40453.352 1693.3039 3773.3039 70.00 49.00 152292.00 140675.29 292967.29 0.82 2.84 0.91 4.58 79.43 10497.06 246565.14 97057.84100% 764 16.49 0 3.51 100822.1 25097.89092 40453.352 -531.6305 1548.3695 70.00 49.00 152292.00 140675.29 292967.29 0.82 2.84 1.91 5.58 74.94 12721.99 298826.57 149319.28
Carbon offsetting 964 16.49 0 3.51 127215.32 20520.08376 62315.636 68.608117 2148.6081 70.00 49.00 152292.00 209531.12 361823.12 -4.51 3.59 0.91 -0.01 100.06 12121.75 284727.58 66364.47Carbon offsetting 964 16.49 0 3.51 127215.32 20520.08376 62315.636 -3358.752 -1278.752 70.00 49.00 152292.00 209531.12 361823.12 -4.51 3.59 0.91 -0.01 100.06 15549.11 365232.77 146869.66
provided Elec. by PV
PV area m2
Heating (KWh/m2)
Lighting (KWh/m2)
Hot water (KWh/m2)
generated Elec by PV
(KWh)
purchased from grid
elec (KWh)
Exported Elec
(KWh)Elec Cost £
Energy cost Inc
FIT
Wall Insulation price £/m2
Roof Insulation price £/m2
Total Insulation
price £
PV cost £
Fabric cost £
Operational CO2
(kgCO2/m2.yr)
PV ECO2
(kgCO2/m2.yr)
Insulation ECO2
(kgCO2/m2.yr)
Total CO2
(kgCO2/m2.yr)CO2 saving
%Energy
saving (A) £PV(A)
£NPV
£
0 0 18.73 32.85 3.51 0 0 0 11957.4 14270.36 66.00 46.00 143460.00 0.00 143460.00 21.59 0.00 0.66 22.25 0.00 0.00 0.00 0.0025% 190 16 24.6375 3.51 25073.559 60344.37639 0 8448.2127 10477.253 71.50 50.00 155523.00 35168.82 190691.82 16.00 0.71 1.01 17.72 20.38 3793.11 89096.22 41864.4050% 382 16 16.425 3.51 50411.0502 41744.91709 6740.0973 5540.984 7570.024 71.50 50.00 155523.00 70337.65 225860.65 10.89 1.42 1.01 13.32 40.14 6700.34 157384.06 74983.4175% 573 16 8.2125 3.51 75616.5753 31431.65212 21630.292 3427.0682 5456.1082 71.50 50.00 155523.00 105506.47 261029.47 5.80 2.13 1.01 8.94 59.80 8814.25 207037.78 89468.31100% 764 16 0 3.51 100822.1 25097.89092 40453.352 1693.3039 3722.3439 71.50 50.00 155523.00 140675.29 296198.29 0.73 2.84 1.01 4.58 79.42 10548.02 247762.14 95023.84100% 764 16 0 3.51 100822.1 25097.89092 40453.352 -531.6305 1497.4095 71.50 50.00 155523.00 140675.29 296198.29 0.73 2.84 2.01 5.58 74.92 12772.95 300023.57 147285.28
Carbon offsetting 964 16 0 3.51 127215.32 20520.08376 62315.636 68.608117 2097.6481 71.50 50.00 155523.00 209531.12 365054.12 -4.61 3.59 1.01 -0.01 100.05 12172.71 285924.58 64330.47Carbon offsetting 964 16 0 3.51 127215.32 20520.08376 62315.636 -3358.752 -1329.712 71.50 50.00 155523.00 209531.12 365054.12 -4.61 3.59 1.01 -0.01 100.05 15600.07 366429.77 144835.65
provided Elec. by PV
PV area m2
Heating (KWh/m2)
Lighting (KWh/m2)
Hot water (KWh/m2)
generated Elec by PV
(KWh)
purchased from grid
elec (KWh)
Exported Elec
(KWh)Elec Cost £
Energy cost Inc
FIT
Wall Insulation price £/m2
Roof Insulation price £/m2
Total Insulation
price £
PV cost £
Fabric cost £
Operational CO2
(kgCO2/m2.yr)
PV ECO2
(kgCO2/m2.yr)
Insulation ECO2
(kgCO2/m2.yr)
Total CO2
(kgCO2/m2.yr)CO2 saving
%Energy
saving (A) £PV(A)
£NPV
£
0 0 18.73 32.85 3.51 0 0 0 11957.4 14270.36 66.00 46.00 143460.00 0.00 143460.00 21.59 0.00 0.66 22.25 0.00 0.00 0.00 0.0025% 190 15.52 24.6375 3.51 25073.559 60344.37639 0 8448.2127 10427.333 73.00 51.00 158754.00 35168.82 193922.82 15.91 0.71 1.11 17.72 20.35 3843.03 90268.79 39805.9750% 382 15.52 16.425 3.51 50411.0502 41744.91709 6740.0973 5540.984 7520.104 73.00 51.00 158754.00 70337.65 229091.65 10.79 1.42 1.11 13.32 40.12 6750.26 158556.63 72924.9875% 573 15.52 8.2125 3.51 75616.5753 31431.65212 21630.292 3427.0682 5406.1882 73.00 51.00 158754.00 105506.47 264260.47 5.71 2.13 1.11 8.95 59.78 8864.17 208210.35 87409.88100% 764 15.52 0 3.51 100822.1 25097.89092 40453.352 1693.3039 3672.4239 73.00 51.00 158754.00 140675.29 299429.29 0.63 2.84 1.11 4.59 79.39 10597.94 248934.71 92965.41100% 764 15.52 0 3.51 100822.1 25097.89092 40453.352 -531.6305 1447.4895 73.00 51.00 158754.00 140675.29 299429.29 0.63 2.84 2.11 5.59 74.90 12822.87 301196.14 145226.85
Carbon offsetting 964 15.52 0 3.51 127215.32 20520.08376 62315.636 68.608117 2047.7281 73.00 51.00 158754.00 209531.12 368285.12 -4.70 3.59 1.11 0.00 100.02 12222.63 287097.15 62272.04Carbon offsetting 964 15.52 0 3.51 127215.32 20520.08376 62315.636 -3358.752 -1379.632 73.00 51.00 158754.00 209531.12 368285.12 -4.70 3.59 1.11 0.00 100.02 15649.99 367602.34 142777.22
provided Elec. by PV
PV area m2
Heating (KWh/m2)
Lighting (KWh/m2)
Hot water (KWh/m2)
generated Elec by PV
(KWh)
purchased from grid
elec (KWh)
Exported Elec
(KWh)Elec Cost £
Energy cost Inc
FIT
Wall Insulation price £/m2
Roof Insulation price £/m2
Total Insulation
price £
PV cost £
Fabric cost £
Operational CO2
(kgCO2/m2.yr)
PV ECO2
(kgCO2/m2.yr)
Insulation ECO2
(kgCO2/m2.yr)
Total CO2
(kgCO2/m2.yr)CO2 saving
%Energy
saving (A) £PV(A)
£NPV
£
0 0 18.73 32.85 3.51 0 0 0 11957.4 14270.36 66.00 46.00 143460.00 0.00 143460.00 21.59 0.00 0.66 22.25 0.00 0.00 0.00 0.0025% 190 15 24.6375 3.51 25073.559 60344.37639 0 8448.2127 10373.253 79.00 55.00 171678.00 35168.82 206846.82 15.80 0.71 1.62 18.13 18.52 3897.11 91539.07 28152.2550% 382 15 16.425 3.51 50411.0502 41744.91709 6740.0973 5540.984 7466.024 79.00 55.00 171678.00 70337.65 242015.65 10.69 1.42 1.62 13.73 38.28 6804.34 159826.91 61271.2675% 573 15 8.2125 3.51 75616.5753 31431.65212 21630.292 3427.0682 5352.1082 79.00 55.00 171678.00 105506.47 277184.47 5.61 2.13 1.62 9.36 57.94 8918.25 209480.64 75756.17100% 764 15 0 3.51 100822.1 25097.89092 40453.352 1693.3039 3618.3439 79.00 55.00 171678.00 140675.29 312353.29 0.53 2.84 1.62 4.99 77.56 10652.02 250204.99 81311.69100% 764 15 0 3.51 100822.1 25097.89092 40453.352 -531.6305 1393.4095 79.00 55.00 171678.00 140675.29 312353.29 0.53 2.84 2.62 5.99 73.06 12876.95 302466.43 133573.13
Carbon offsetting 987 15.52 0 3.51 130250.541 20087.83418 64913.322 -108.8027 1870.3173 79.00 55.00 171678.00 214530.30 386208.30 -5.31 3.67 1.62 -0.02 100.09 12400.04 291264.35 48516.05Carbon offsetting 987 15.52 0 3.51 130250.541 20087.83418 64913.322 -3679.035 -1699.915 79.00 55.00 171678.00 214530.30 386208.30 -5.31 3.67 1.62 -0.02 100.09 15970.28 375125.47 132377.17
provided Elec. by PV
PV area m2
Heating (KWh/m2)
Lighting (KWh/m2)
Hot water (KWh/m2)
generated Elec by PV
(KWh)
purchased from grid
elec (KWh)
Exported Elec
(KWh)Elec Cost £
Energy cost Inc
FIT
Wall Insulation price £/m2
Roof Insulation price £/m2
Total Insulation
price £
PV cost £
Fabric cost £
Operational CO2
(kgCO2/m2.yr)
PV ECO2
(kgCO2/m2.yr)
Insulation ECO2
(kgCO2/m2.yr)
Total CO2
(kgCO2/m2.yr)CO2 saving
%Energy
saving (A) £PV(A)
£NPV
£
0 0 18.73 32.85 3.51 0 0 0 11957.4 14270.36 66.00 46.00 143460.00 0.00 143460.00 21.59 0.00 0.66 22.25 0.00 0.00 0.00 0.0025% 190 14.2 24.6375 3.51 25073.559 60344.37639 0 8448.2127 10290.053 82.00 57.00 178140.00 35168.82 213308.82 15.65 0.71 1.72 18.07 18.78 3980.31 93493.36 23644.5350% 382 14.2 16.425 3.51 50411.0502 41744.91709 6740.0973 5540.984 7382.824 82.00 57.00 178140.00 70337.65 248477.65 10.53 1.42 1.72 13.68 38.54 6887.54 161781.19 56763.5575% 573 14.2 8.2125 3.51 75616.5753 31431.65212 21630.292 3427.0682 5268.9082 82.00 57.00 178140.00 105506.47 283646.47 5.45 2.13 1.72 9.30 58.20 9001.45 211434.92 71248.45100% 764 14.2 0 3.51 100822.1 25097.89092 40453.352 1693.3039 3535.1439 82.00 57.00 178140.00 140675.29 318815.29 0.37 2.84 1.72 4.94 77.81 10735.22 252159.27 76803.98100% 764 14.2 0 3.51 100822.1 25097.89092 40453.352 -531.6305 1310.2095 82.00 57.00 178140.00 140675.29 318815.29 0.37 2.84 2.72 5.94 73.32 12960.15 304420.71 129065.42
Carbon offsetting 980 14.2 0 3.51 129326.778 20219.3884 64122.722 -54.80812 1787.0319 82.00 57.00 178140.00 213008.81 391148.81 -5.39 3.65 1.72 -0.02 100.08 12483.33 293220.64 45531.83Carbon offsetting 980 14.2 0 3.51 129326.778 20219.3884 64122.722 -3581.558 -1739.718 82.00 57.00 178140.00 213008.81 391148.81 -5.39 3.65 1.72 -0.02 100.08 16010.08 376060.39 128371.58
PV + 0.07 - 0.10
Office-London
PV + 2010 notional building fabric
PV + 0.17 - 0.24
PV + 0.15 - 0.21
PV + 0.13 - 0.19
PV + 0.12 - 0.17
PV + 0.11 - 0.15
PV + 0.08 - 0.11
PV (future FiT) + Insulation

224
Table B. 31 Office - PV (current FiT) + improving the building fabric U-value down to 0.07-0.1 W/m2.K (PUR) + TSC– not taking into account the rental loss/gain
provided Elec. & heating
TSC area m2
PV area m2
Heating (KWh/m2
)
Lighting (KWh/m2)
Hot water (KWh/m2)
TSC fan power
(KWh/m2)
generated Elec by PV
(KWh)
purchased from grid
elec (KWh)
Exported Elec (KWh)
Elec cost £
Energy cost Inc
FIT £
Wall Insulation price £/m2
Roof Insulation price £/m2
Total Insulation
price £
TSC cost £
PV Cost £Fabric cost
£
Operational CO2
(kgCO2/m2.yr)
PV ECO2
(kgCO2/m2.yr)
TSC ECO2
(kgCO2/m2.yr)
Insulation ECO2
(kgCO2/m2.yr)
Total CO2
(kgCO2/m2.yr)CO2 saving
%
Energy saving (A)
£
PV(A) £
NPV £
0 0 0 18.73 32.85 3.51 0 0 0 0 11957.4 14270.36 66.00 46.00 143460.00 0.00 0.00 143460.00 21.59 0.00 0.00 0.66 22.25 0.00 0.00 0.00 0.0025% 75 190 14.04 24.6375 3.51 0.0938 25073.559 60344.3764 0 4812.547 6637.7466 66.00 46.00 143460.00 11250.00 35168.82 189878.82 15.66 0.71 0.04 0.66 17.07 23.30 7632.61 179282.30 132863.4850% 200 382 9.365 16.425 3.51 0.1873 50411.0502 41744.9171 6740.09727 -1768.62 -429.6183 66.00 46.00 143460.00 30000.00 70337.65 243797.65 9.68 1.42 0.09 0.66 11.86 46.70 14699.98 345287.49 244949.8475% 425 573 4.68 8.2125 3.51 0.281 75616.5753 31431.6521 21630.292 -7537.34 -6685.575 66.00 46.00 143460.00 63750.00 105506.47 312716.47 3.73 2.13 0.20 0.66 6.72 69.78 20955.94 492233.54 322977.07100% 650 764 0 0 3.51 0.3746 100822.1 25097.8909 40453.3519 -12925.9 -12560.86 66.00 46.00 143460.00 97500.00 140675.29 381635.29 -2.21 2.84 0.31 0.66 1.60 92.82 26831.22 630238.00 392062.70
Carbon offsetting
650 832 0 0 3.51 0.3746 109795.795 23243.862 47729.4021 -14814.1 -14449.03 66.00 46.00 143460.00 97500.00 180840.13 421800.13 -4.06 3.10 0.310.66
0.01 99.96 28719.39 674589.23 396249.10
provided Elec. & heating
TSC area m2
PV area m2
Heating (KWh/m2
)
Lighting (KWh/m2)
Hot water (KWh/m2)
TSC fan power
(KWh/m2)
generated Elec by PV
(KWh)
purchased from grid
elec (KWh)
Exported Elec (KWh)
Elec cost £
Energy cost Inc
FIT £
Wall Insulation price £/m2
Roof Insulation price £/m2
Total Insulation
price £
TSC cost £
PV Cost £Fabric cost
£
Operational CO2
(kgCO2/m2.yr)
PV ECO2
(kgCO2/m2.yr)
TSC ECO2
(kgCO2/m2.yr)
Insulation ECO2
(kgCO2/m2.yr)
Total CO2
(kgCO2/m2.yr)CO2 saving
%
Energy saving (A)
£
PV(A) £
NPV £
0 0 0 18.73 32.85 3.51 0 0 0 0 11957.4 14270.36 66.00 46.00 143460.00 0.00 0.00 143460.00 21.59 0.00 0.00 0.66 22.25 0.00 0.00 0.00 0.0025% 72 190 13.53 24.6375 3.51 0.104 25073.559 60344.3764 0 4812.547 6584.7066 67.00 47.00 145830.00 10800.00 35168.82 191798.82 15.57 0.71 0.03 0.71 17.02 23.51 7685.65 180528.16 132189.3350% 185 382 9.025 16.425 3.51 0.1941 50411.0502 41744.9171 6740.09727 -1768.62 -464.9783 67.00 47.00 145830.00 27750.00 70337.65 243917.65 9.62 1.42 0.09 0.71 11.84 46.79 14735.34 346118.06 245660.4175% 410 573 4.51 8.2125 3.51 0.2844 75616.5753 31431.6521 21630.292 -7537.34 -6703.255 67.00 47.00 145830.00 61500.00 105506.47 312836.47 3.70 2.13 0.19 0.71 6.74 69.73 20973.62 492648.82 323272.35100% 630 764 0 0 3.51 0.3746 100822.1 25097.8909 40453.3519 -12925.9 -12560.86 67.00 47.00 145830.00 94500.00 140675.29 381005.29 -2.21 2.84 0.30 0.71 1.64 92.64 26831.22 630238.00 392692.70
Carbon offsetting
630 835 0 0 3.51 0.3746 110191.694 23173.84 48054.8151 -14895.9 -14530.88 67.00 47.00 145830.00 94500.00 181492.20 421822.20 -4.14 3.11 0.30 0.71 -0.02 100.09 28801.24 676511.85 398149.65
provided Elec. & heating
TSC area m2
PV area m2
Heating (KWh/m2
)
Lighting (KWh/m2)
Hot water (KWh/m2)
TSC fan power
(KWh/m2)
generated Elec by PV
(KWh)
purchased from grid
elec (KWh)
Exported Elec (KWh)
Elec cost £
Energy cost Inc
FIT £
Wall Insulation price £/m2
Roof Insulation price £/m2
Total Insulation
price £
TSC cost £
PV Cost £Fabric cost
£
Operational CO2
(kgCO2/m2.yr)
PV ECO2
(kgCO2/m2.yr)
TSC ECO2
(kgCO2/m2.yr)
Insulation ECO2
(kgCO2/m2.yr)
Total CO2
(kgCO2/m2.yr)CO2 saving
%
Energy saving (A)
£
PV(A) £
NPV £
0 0 0 18.73 32.85 3.51 0 0 0 0 11957.4 14270.36 66.00 46.00 143460.00 0.00 0.00 143460.00 21.59 0.00 0.00 0.66 22.25 0.00 0.00 0.00 0.0025% 69 190 12.78 24.6375 3.51 0.119 25073.559 60344.3764 0 4812.547 6506.7066 68.50 48.00 149061.00 10350.00 35168.82 194579.82 15.43 0.71 0.03 0.81 16.98 23.69 7763.65 182360.30 131240.4750% 172 382 8.52 16.425 3.51 0.2042 50411.0502 41744.9171 6740.09727 -1768.62 -517.4983 68.50 48.00 149061.00 25800.00 70337.65 245198.65 9.53 1.42 0.08 0.81 11.84 46.78 14787.86 347351.70 245613.0575% 400 573 4.26 8.2125 3.51 0.2894 75616.5753 31431.6521 21630.292 -7537.34 -6729.255 68.50 48.00 149061.00 60000.00 105506.47 314567.47 3.65 2.13 0.19 0.81 6.78 69.51 20999.62 493259.53 322152.06100% 615 764 0 0 3.51 0.3746 100822.1 25097.8909 40453.3519 -12925.9 -12560.86 68.50 48.00 149061.00 92250.00 140675.29 381986.29 -2.21 2.84 0.29 0.81 1.73 92.22 26831.22 630238.00 391711.70
Carbon offsetting
615 838 0 0 3.51 0.3746 110587.592 23103.818 48380.2282 -14977.8 -14612.74 68.50 48.00 149061.00 92250.00 182144.27 423455.27 -4.22 3.12 0.29 0.81 0.01 99.98 28883.10 678434.47 398439.20
provided Elec. & heating
TSC area m2
PV area m2
Heating (KWh/m2
)
Lighting (KWh/m2)
Hot water (KWh/m2)
TSC fan power
(KWh/m2)
generated Elec by PV
(KWh)
purchased from grid
elec (KWh)
Exported Elec (KWh)
Elec cost £
Energy cost Inc
FIT £
Wall Insulation price £/m2
Roof Insulation price £/m2
Total Insulation
price £
TSC cost £
PV Cost £Fabric cost
£
Operational CO2
(kgCO2/m2.yr)
PV ECO2
(kgCO2/m2.yr)
TSC ECO2
(kgCO2/m2.yr)
Insulation ECO2
(kgCO2/m2.yr)
Total CO2
(kgCO2/m2.yr)CO2 saving
%
Energy saving (A)
£
PV(A) £
NPV £
0 0 0 18.73 32.85 3.51 0 0 0 0 11957.4 14270.36 66.00 46.00 143460.00 0.00 0.00 143460.00 21.59 0.00 0.00 0.66 22.25 0.00 0.00 0.00 0.0025% 66 190 12.36 24.6375 3.51 0.1274 25073.559 60344.3764 0 4812.547 6463.0266 70.00 49.00 152292.00 9900.00 35168.82 197360.82 15.35 0.71 0.03 0.91 17.00 23.60 7807.33 183386.29 129485.4750% 165 382 8.24 16.425 3.51 0.2098 50411.0502 41744.9171 6740.09727 -1768.62 -546.6183 70.00 49.00 152292.00 24750.00 70337.65 247379.65 9.48 1.42 0.08 0.91 11.89 46.58 14816.98 348035.70 244116.0575% 392 573 4.12 8.2125 3.51 0.2922 75616.5753 31431.6521 21630.292 -7537.34 -6743.815 70.00 49.00 152292.00 58800.00 105506.47 316598.47 3.63 2.13 0.19 0.91 6.86 69.19 21014.18 493601.53 320463.06100% 605 764 0 0 3.51 0.3746 100822.1 25097.8909 40453.3519 -12925.9 -12560.86 70.00 49.00 152292.00 90750.00 140675.29 383717.29 -2.21 2.84 0.29 0.91 1.83 91.79 26831.22 630238.00 389980.70
Carbon offsetting
605 843 0 0 3.51 0.3746 111247.422 22987.1147 48922.5833 -15114.2 -14749.16 70.00 49.00 152292.00 90750.00 183231.05 426273.05 -4.35 3.14 0.29 0.91 -0.01 100.06 29019.52 681638.83 398825.78
provided Elec. & heating
TSC area m2
PV area m2
Heating (KWh/m2
)
Lighting (KWh/m2)
Hot water (KWh/m2)
TSC fan power
(KWh/m2)
generated Elec by PV
(KWh)
purchased from grid
elec (KWh)
Exported Elec (KWh)
Elec cost £
Energy cost Inc
FIT £
Wall Insulation price £/m2
Roof Insulation price £/m2
Total Insulation
price £
TSC cost £
PV Cost £Fabric cost
£
Operational CO2
(kgCO2/m2.yr)
PV ECO2
(kgCO2/m2.yr)
TSC ECO2
(kgCO2/m2.yr)
Insulation ECO2
(kgCO2/m2.yr)
Total CO2
(kgCO2/m2.yr)CO2 saving
%
Energy saving (A)
£
PV(A) £
NPV £
0 0 0 18.73 32.85 3.51 0 0 0 0 11957.4 14270.36 66.00 46.00 143460.00 0.00 0.00 143460.00 21.59 0.00 0.00 0.66 22.25 0.00 0.00 0.00 0.0025% 63 190 12 24.6375 3.51 0.1346 25073.559 60344.3764 0 4812.547 6425.5866 71.50 50.00 155523.00 9450.00 35168.82 200141.82 15.29 0.71 0.03 1.01 17.03 23.45 7844.77 184265.72 127583.9050% 160 382 8 16.425 3.51 0.2146 50411.0502 41744.9171 6740.09727 -1768.62 -571.5783 71.50 50.00 155523.00 24000.00 70337.65 249860.65 9.43 1.42 0.08 1.01 11.94 46.35 14841.94 348621.99 242221.3475% 382 573 4 8.2125 3.51 0.2946 75616.5753 31431.6521 21630.292 -7537.34 -6756.295 71.50 50.00 155523.00 57300.00 105506.47 318329.47 3.60 2.13 0.18 1.01 6.93 68.87 21026.66 493894.68 319025.21100% 595 764 0 0 3.51 0.3746 100822.1 25097.8909 40453.3519 -12925.9 -12560.86 71.50 50.00 155523.00 89250.00 140675.29 385448.29 -2.21 2.84 0.28 1.01 1.92 91.36 26831.22 630238.00 388249.70
Carbon offsetting
595 846 0 0 3.51 0.3746 111775.287 22893.7521 49356.4674 -15223.3 -14858.29 71.50 50.00 155523.00 89250.00 184100.47 428873.47 -4.45 3.15 0.28 1.01 -0.01 100.06 29128.65 684202.32 398788.85
provided Elec. & heating
TSC area m2
PV area m2
Heating (KWh/m2
)
Lighting (KWh/m2)
Hot water (KWh/m2)
TSC fan power
(KWh/m2)
generated Elec by PV
(KWh)
purchased from grid
elec (KWh)
Exported Elec (KWh)
Elec cost £
Energy cost Inc
FIT £
Wall Insulation price £/m2
Roof Insulation price £/m2
Total Insulation
price £
TSC cost £
PV Cost £Fabric cost
£
Operational CO2
(kgCO2/m2.yr)
PV ECO2
(kgCO2/m2.yr)
TSC ECO2
(kgCO2/m2.yr)
Insulation ECO2
(kgCO2/m2.yr)
Total CO2
(kgCO2/m2.yr)CO2 saving
%
Energy saving (A)
£
PV(A) £
NPV £
0 0 0 18.73 32.85 3.51 0 0 0 0 11957.4 14270.36 66.00 46.00 143460.00 0.00 0.00 143460.00 21.59 0.00 0.00 0.66 22.25 0.00 0.00 0.00 0.0025% 60 190 11.64 24.6375 3.51 0.1418 25073.559 60344.3764 0 4812.547 6388.1466 73.00 51.00 158754.00 9000.00 35168.82 202922.82 15.22 0.71 0.03 1.11 17.07 23.31 7882.21 185145.15 125682.3350% 156 382 7.76 16.425 3.51 0.2194 50411.0502 41744.9171 6740.09727 -1768.62 -596.5383 73.00 51.00 158754.00 23400.00 70337.65 252491.65 9.39 1.42 0.07 1.11 11.99 46.10 14866.90 349208.27 240176.6275% 377 573 3.88 8.2125 3.51 0.297 75616.5753 31431.6521 21630.292 -7537.34 -6768.775 73.00 51.00 158754.00 56550.00 105506.47 320810.47 3.58 2.13 0.18 1.11 7.00 68.53 21039.14 494187.82 316837.35100% 589 764 0 0 3.51 0.3746 100822.1 25097.8909 40453.3519 -12925.9 -12560.86 73.00 51.00 158754.00 88350.00 140675.29 387779.29 -2.21 2.84 0.28 1.11 2.02 90.93 26831.22 630238.00 385918.70
Carbon offsetting
589 851 0 0 3.51 0.3746 112303.151 22800.3895 49790.3514 -15332.5 -14967.43 73.00 51.00 158754.00 88350.00 184969.90 432073.90 -4.56 3.17 0.28 1.11 0.00 100.02 29237.79 686765.81 398151.91
provided Elec. & heating
TSC area m2
PV area m2
Heating (KWh/m2
)
Lighting (KWh/m2)
Hot water (KWh/m2)
TSC fan power
(KWh/m2)
generated Elec by PV
(KWh)
purchased from grid
elec (KWh)
Exported Elec (KWh)
Elec cost £
Energy cost Inc
FIT £
Wall Insulation price £/m2
Roof Insulation price £/m2
Total Insulation
price £
TSC cost £
PV Cost £Fabric cost
£
Operational CO2
(kgCO2/m2.yr)
PV ECO2
(kgCO2/m2.yr)
TSC ECO2
(kgCO2/m2.yr)
Insulation ECO2
(kgCO2/m2.yr)
Total CO2
(kgCO2/m2.yr)CO2 saving
%
Energy saving (A)
£
PV(A) £
NPV £
0 0 0 18.73 32.85 3.51 0 0 0 0 11957.4 14270.36 66.00 46.00 143460.00 0.00 0.00 143460.00 21.59 0.00 0.00 0.66 22.25 0.00 0.00 0.00 0.0025% 57 190 11.25 24.6375 3.51 0.1496 25073.559 60344.3764 0 4812.547 6347.5866 79.00 55.00 171678.00 8550.00 35168.82 215396.82 15.15 0.71 0.03 1.62 17.50 21.35 7922.77 186097.86 114161.0450% 153 382 7.5 16.425 3.51 0.2246 50411.0502 41744.9171 6740.09727 -1768.62 -623.5783 79.00 55.00 171678.00 22950.00 70337.65 264965.65 9.34 1.42 0.07 1.62 12.45 44.04 14893.94 349843.41 228337.7775% 371 573 3.75 8.2125 3.51 0.2996 75616.5753 31431.6521 21630.292 -7537.34 -6782.295 79.00 55.00 171678.00 55650.00 105506.47 332834.47 3.56 2.13 0.18 1.62 7.49 66.36 21052.66 494505.39 305130.92100% 582 764 0 0 3.51 0.3746 100822.1 25097.8909 40453.3519 -12925.9 -12560.86 79.00 55.00 171678.00 87300.00 140675.29 399653.29 -2.21 2.84 0.28 1.62 2.53 88.65 26831.22 630238.00 374044.70
Carbon offsetting
582 873 0 0 3.51 0.3746 115206.405 22286.8949 52176.7139 -15932.7 -15567.68 79.00 55.00 171678.00 87300.00 189751.73 448729.73 -5.15 3.25 0.28 1.62 0.00 100.00 29838.04 700865.01 395595.28
provided Elec. & heating
TSC area m2
PV area m2
Heating (KWh/m2
)
Lighting (KWh/m2)
Hot water (KWh/m2)
TSC fan power
(KWh/m2)
generated Elec by PV
(KWh)
purchased from grid
elec (KWh)
Exported Elec (KWh)
Elec cost £
Energy cost Inc
FIT £
Wall Insulation price £/m2
Roof Insulation price £/m2
Total Insulation
price £
TSC cost £
PV Cost £Fabric cost
£
Operational CO2
(kgCO2/m2.yr)
PV ECO2
(kgCO2/m2.yr)
TSC ECO2
(kgCO2/m2.yr)
Insulation ECO2
(kgCO2/m2.yr)
Total CO2
(kgCO2/m2.yr)CO2 saving
%
Energy saving (A)
£
PV(A) £
NPV £
0 0 0 18.73 32.85 3.51 0 0 0 0 11957.4 14270.36 66.00 46.00 143460.00 0.00 0.00 143460.00 21.59 0.00 0.00 0.66 22.25 0.00 0.00 0.00 0.0025% 55 190 10.65 24.6375 3.51 0.1616 25073.559 60344.3764 0 4812.547 6285.1866 82.00 57.00 178140.00 8250.00 35168.82 221558.82 15.04 0.71 0.03 1.72 17.49 21.40 7985.17 187563.57 109464.7550% 150 382 7.1 16.425 3.51 0.2326 50411.0502 41744.9171 6740.09727 -1768.62 -665.1783 82.00 57.00 178140.00 22500.00 70337.65 270977.65 9.26 1.42 0.07 1.72 12.48 43.93 14935.54 350820.55 223302.9175% 365 573 3.55 8.2125 3.51 0.3036 75616.5753 31431.6521 21630.292 -7537.34 -6803.095 82.00 57.00 178140.00 54750.00 105506.47 338396.47 3.52 2.13 0.17 1.72 7.55 66.09 21073.46 494993.96 300057.49100% 575 764 0 0 3.51 0.3746 100822.1 25097.8909 40453.3519 -12925.9 -12560.86 82.00 57.00 178140.00 86250.00 140675.29 405065.29 -2.21 2.84 0.27 1.72 2.62 88.21 26831.22 630238.00 368632.70
Carbon offsetting
575 878 0 0 3.51 0.3746 115866.236 22170.1916 52719.069 -16069.1 -15704.1 82.00 57.00 178140.00 86250.00 190838.51 455228.51 -5.28 3.27 0.27 1.72 -0.02 100.08 29974.46 704069.37 392300.87
TSC + PV + 0.08 - 0.11
TSC + PV + 0.07 - 0.10
Office-London
TSC + PV + 2010 notional building fabric
TSC + PV + 0.17 - 0.24
TSC + PV + 0.15 - 0.21
TSC + PV + 0.13 - 0.19
TSC + PV + 0.12 - 0.17
TSC + PV + 0.11 - 0.15
PV (current FiT) + Insulation + TSC

225
Table B. 32 Office - PV (future FiT) + improving the building fabric U-value down to 0.07-0.1 W/m2.K (PUR) + TSC– not taking into account the rental loss/gain
provided Elec. & heating
TSC area m2
PV area m2
Heating (KWh/m2)
Lighting (KWh/m2)
Hot water (KWh/m2)
TSC fan power
(KWh/m2)
generated Elec by PV
(KWh)
purchased from grid
elec (KWh)
Exported Elec
(KWh)
Elec cost £
Energy cost Inc
FIT £
Wall Insulation price £/m2
Roof Insulation price £/m2
Total Insulation
price £
TSC cost £
PV Cost £Fabric cost
£
Operational CO2
(kgCO2/m2.yr)
PV ECO2
(kgCO2/m2.yr)
TSC ECO2
(kgCO2/m2.yr)
Insulation ECO2
(kgCO2/m2.yr)
Total CO2
(kgCO2/m2.yr)CO2 saving
%
Energy saving (A)
£
PV(A) £
NPV £
0 0 0 18.73 32.85 3.51 0 0 0 0 11957.4 14270.36 66.00 46.00 143460.00 0.00 0.00 143460.00 21.59 0.00 0.00 0.66 22.25 0.00 0.00 0.00 0.0025% 75 190 14.04 24.6375 3.51 0.0938 25073.559 60344.3764 0 8448.213 10273.413 66.00 46.00 143460.00 11250.00 35168.82 189878.82 15.66 0.71 0.04 0.66 17.07 23.30 3996.95 93884.21 47465.3950% 200 382 9.365 16.425 3.51 0.1873 50411.0502 41744.9171 6740.0973 5540.984 6879.984 66.00 46.00 143460.00 30000.00 70337.65 243797.65 9.68 1.42 0.09 0.66 11.86 46.70 7390.38 173592.39 73254.7475% 425 573 4.68 8.2125 3.51 0.281 75616.5753 31431.6521 21630.292 3427.068 4278.8282 66.00 46.00 143460.00 63750.00 105506.47 312716.47 3.73 2.13 0.20 0.66 6.72 69.78 9991.53 234690.89 65434.42100% 650 764 0 0 3.51 0.3746 100822.1 25097.8909 40453.352 1693.304 2058.3439 66.00 46.00 143460.00 97500.00 140675.29 381635.29 -2.21 2.84 0.31 0.66 1.60 92.82 12212.02 286847.80 48672.50
Carbon offsetting
650 832 0 0 3.51 0.3746 109795.795 23243.862 47729.402 1106.318 1471.3576 66.00 46.00 143460.00 97500.00 180840.13 421800.13 -4.06 3.10 0.31 0.66 0.01 99.96 12799.00 300635.51 22295.37
Carbon offsetting
650 832 0 0 3.51 0.3746 109795.795 23243.862 47729.402 -1518.8 -1153.76 66.00 46.00 143460.00 97500.00 180840.13 421800.13 -4.06 3.10 0.310.66
0.01 99.96 15424.12 362296.83 83956.70
provided Elec. & heating
TSC area m2
PV area m2
Heating (KWh/m2)
Lighting (KWh/m2)
Hot water (KWh/m2)
TSC fan power
(KWh/m2)
generated Elec by PV
(KWh)
purchased from grid
elec (KWh)
Exported Elec
(KWh)
Elec cost £
Energy cost Inc
FIT £
Wall Insulation price £/m2
Roof Insulation price £/m2
Total Insulation
price £
TSC cost £
PV Cost £Fabric cost
£
Operational CO2
(kgCO2/m2.yr)
PV ECO2
(kgCO2/m2.yr)
TSC ECO2
(kgCO2/m2.yr)
Insulation ECO2
(kgCO2/m2.yr)
Total CO2
(kgCO2/m2.yr)CO2 saving
%
Energy saving (A)
£
PV(A) £
NPV £
0 0 0 18.73 32.85 3.51 0 0 0 0 11957.4 14270.36 66.00 46.00 143460.00 0.00 0.00 143460.00 21.59 0.00 0.00 0.66 22.25 0.00 0.00 0.00 0.0025% 72 190 13.53 24.6375 3.51 0.104 25073.559 60344.3764 0 8448.213 10220.373 67.00 47.00 145830.00 10800.00 35168.82 191798.82 15.57 0.71 0.03 0.71 17.02 23.51 4049.99 95130.07 46791.2550% 185 382 9.025 16.425 3.51 0.1941 50411.0502 41744.9171 6740.0973 5540.984 6844.624 67.00 47.00 145830.00 27750.00 70337.65 243917.65 9.62 1.42 0.09 0.71 11.84 46.79 7425.74 174422.96 73965.3175% 410 573 4.51 8.2125 3.51 0.2844 75616.5753 31431.6521 21630.292 3427.068 4261.1482 67.00 47.00 145830.00 61500.00 105506.47 312836.47 3.70 2.13 0.19 0.71 6.74 69.73 10009.21 235106.17 65729.70100% 630 764 0 0 3.51 0.3746 100822.1 25097.8909 40453.352 1693.304 2058.3439 67.00 47.00 145830.00 94500.00 140675.29 381005.29 -2.21 2.84 0.30 0.71 1.64 92.64 12212.02 286847.80 49302.50
Carbon offsetting
630 835 0 0 3.51 0.3746 110191.694 23173.84 48054.815 1081.871 1446.9109 67.00 47.00 145830.00 94500.00 181492.20 421822.20 -4.14 3.11 0.30 0.71 -0.02 100.09 12823.45 301209.73 22847.53
Carbon offsetting
630 835 0 0 3.51 0.3746 110191.694 23173.84 48054.815 -1561.14 -1196.104 67.00 47.00 145830.00 94500.00 181492.20 421822.20 -4.14 3.11 0.30 0.71 -0.02 100.09 15466.46 363291.46 84929.25
provided Elec. & heating
TSC area m2
PV area m2
Heating (KWh/m2)
Lighting (KWh/m2)
Hot water (KWh/m2)
TSC fan power
(KWh/m2)
generated Elec by PV
(KWh)
purchased from grid
elec (KWh)
Exported Elec
(KWh)
Elec cost £
Energy cost Inc
FIT £
Wall Insulation price £/m2
Roof Insulation price £/m2
Total Insulation
price £
TSC cost £
PV Cost £Fabric cost
£
Operational CO2
(kgCO2/m2.yr)
PV ECO2
(kgCO2/m2.yr)
TSC ECO2
(kgCO2/m2.yr)
Insulation ECO2
(kgCO2/m2.yr)
Total CO2
(kgCO2/m2.yr)CO2 saving
%
Energy saving (A)
£
PV(A) £
NPV £
0 0 0 18.73 32.85 3.51 0 0 0 0 11957.4 14270.36 66.00 46.00 143460.00 0.00 0.00 143460.00 21.59 0.00 0.00 0.66 22.25 0.00 0.00 0.00 0.0025% 69 190 12.78 24.6375 3.51 0.119 25073.559 60344.3764 0 8448.213 10142.373 68.50 48.00 149061.00 10350.00 35168.82 194579.82 15.43 0.71 0.03 0.81 16.98 23.69 4127.99 96962.21 45842.3950% 172 382 8.52 16.425 3.51 0.2042 50411.0502 41744.9171 6740.0973 5540.984 6792.104 68.50 48.00 149061.00 25800.00 70337.65 245198.65 9.53 1.42 0.08 0.81 11.84 46.78 7478.26 175656.60 73917.9675% 400 573 4.26 8.2125 3.51 0.2894 75616.5753 31431.6521 21630.292 3427.068 4235.1482 68.50 48.00 149061.00 60000.00 105506.47 314567.47 3.65 2.13 0.19 0.81 6.78 69.51 10035.21 235716.89 64609.42100% 615 764 0 0 3.51 0.3746 100822.1 25097.8909 40453.352 1693.304 2058.3439 68.50 48.00 149061.00 92250.00 140675.29 381986.29 -2.21 2.84 0.29 0.81 1.73 92.22 12212.02 286847.80 48321.50
Carbon offsetting
615 838 0 0 3.51 0.3746 110587.592 23103.818 48380.228 1057.424 1422.4643 68.50 48.00 149061.00 92250.00 182144.27 423455.27 -4.22 3.12 0.29 0.81 0.01 99.98 12847.90 301783.96 21788.69
Carbon offsetting
615 838 0 0 3.51 0.3746 110587.592 23103.818 48380.228 -1603.49 -1238.448 68.50 48.00 149061.00 92250.00 182144.27 423455.27 -4.22 3.12 0.29 0.81 0.01 99.98 15508.81 364286.08 84290.81
provided Elec. & heating
TSC area m2
PV area m2
Heating (KWh/m2)
Lighting (KWh/m2)
Hot water (KWh/m2)
TSC fan power
(KWh/m2)
generated Elec by PV
(KWh)
purchased from grid
elec (KWh)
Exported Elec
(KWh)
Elec cost £
Energy cost Inc
FIT £
Wall Insulation price £/m2
Roof Insulation price £/m2
Total Insulation
price £
TSC cost £
PV Cost £Fabric cost
£
Operational CO2
(kgCO2/m2.yr)
PV ECO2
(kgCO2/m2.yr)
TSC ECO2
(kgCO2/m2.yr)
Insulation ECO2
(kgCO2/m2.yr)
Total CO2
(kgCO2/m2.yr)CO2 saving
%
Energy saving (A)
£
PV(A) £
NPV £
0 0 0 18.73 32.85 3.51 0 0 0 0 11957.4 14270.36 66.00 46.00 143460.00 0.00 0.00 143460.00 21.59 0.00 0.00 0.66 22.25 0.00 0.00 0.00 0.0025% 66 190 12.36 24.6375 3.51 0.1274 25073.559 60344.3764 0 8448.213 10098.693 70.00 49.00 152292.00 9900.00 35168.82 197360.82 15.35 0.71 0.03 0.91 17.00 23.60 4171.67 97988.21 44087.3850% 165 382 8.24 16.425 3.51 0.2098 50411.0502 41744.9171 6740.0973 5540.984 6762.984 70.00 49.00 152292.00 24750.00 70337.65 247379.65 9.48 1.42 0.08 0.91 11.89 46.58 7507.38 176340.60 72420.9575% 392 573 4.12 8.2125 3.51 0.2922 75616.5753 31431.6521 21630.292 3427.068 4220.5882 70.00 49.00 152292.00 58800.00 105506.47 316598.47 3.63 2.13 0.19 0.91 6.86 69.19 10049.77 236058.89 62920.42100% 605 764 0 0 3.51 0.3746 100822.1 25097.8909 40453.352 1693.304 2058.3439 70.00 49.00 152292.00 90750.00 140675.29 383717.29 -2.21 2.84 0.29 0.91 1.83 91.79 12212.02 286847.80 46590.50
Carbon offsetting
605 843 0 0 3.51 0.3746 111247.422 22987.1147 48922.583 1016.68 1381.7198 70.00 49.00 152292.00 90750.00 183231.05 426273.05 -4.35 3.14 0.29 0.91 -0.01 100.06 12888.64 302741.01 19927.96
Carbon offsetting
605 843 0 0 3.51 0.3746 111247.422 22987.1147 48922.583 -1674.06 -1309.022 70.00 49.00 152292.00 90750.00 183231.05 426273.05 -4.35 3.14 0.29 0.91 -0.01 100.06 15579.38 365943.79 83130.74
provided Elec. & heating
TSC area m2
PV area m2
Heating (KWh/m2)
Lighting (KWh/m2)
Hot water (KWh/m2)
TSC fan power
(KWh/m2)
generated Elec by PV
(KWh)
purchased from grid
elec (KWh)
Exported Elec
(KWh)
Elec cost £
Energy cost Inc
FIT £
Wall Insulation price £/m2
Roof Insulation price £/m2
Total Insulation
price £
TSC cost £
PV Cost £Fabric cost
£
Operational CO2
(kgCO2/m2.yr)
PV ECO2
(kgCO2/m2.yr)
TSC ECO2
(kgCO2/m2.yr)
Insulation ECO2
(kgCO2/m2.yr)
Total CO2
(kgCO2/m2.yr)CO2 saving
%
Energy saving (A)
£
PV(A) £
NPV £
0 0 0 18.73 32.85 3.51 0 0 0 0 11957.4 14270.36 66.00 46.00 143460.00 0.00 0.00 143460.00 21.59 0.00 0.00 0.66 22.25 0.00 0.00 0.00 0.0025% 63 190 12 24.6375 3.51 0.1346 25073.559 60344.3764 0 8448.213 10061.253 71.50 50.00 155523.00 9450.00 35168.82 200141.82 15.29 0.71 0.03 1.01 17.03 23.45 4209.11 98867.64 42185.8150% 160 382 8 16.425 3.51 0.2146 50411.0502 41744.9171 6740.0973 5540.984 6738.024 71.50 50.00 155523.00 24000.00 70337.65 249860.65 9.43 1.42 0.08 1.01 11.94 46.35 7532.34 176926.89 70526.2475% 382 573 4 8.2125 3.51 0.2946 75616.5753 31431.6521 21630.292 3427.068 4208.1082 71.50 50.00 155523.00 57300.00 105506.47 318329.47 3.60 2.13 0.18 1.01 6.93 68.87 10062.25 236352.03 61482.56100% 595 764 0 0 3.51 0.3746 100822.1 25097.8909 40453.352 1693.304 2058.3439 71.50 50.00 155523.00 89250.00 140675.29 385448.29 -2.21 2.84 0.28 1.01 1.92 91.36 12212.02 286847.80 44859.50
Carbon offsetting
595 846 0 0 3.51 0.3746 111775.287 22893.7521 49356.467 984.0843 1349.1243 71.50 50.00 155523.00 89250.00 184100.47 428873.47 -4.45 3.15 0.28 1.01 -0.01 100.06 12921.24 303506.64 18093.17
Carbon offsetting
595 846 0 0 3.51 0.3746 111775.287 22893.7521 49356.467 -1730.52 -1365.481 71.50 50.00 155523.00 89250.00 184100.47 428873.47 -4.45 3.15 0.28 1.01 -0.01 100.06 15635.84 367269.96 81856.49
provided Elec. & heating
TSC area m2
PV area m2
Heating (KWh/m2)
Lighting (KWh/m2)
Hot water (KWh/m2)
TSC fan power
(KWh/m2)
generated Elec by PV
(KWh)
purchased from grid
elec (KWh)
Exported Elec
(KWh)
Elec cost £
Energy cost Inc
FIT £
Wall Insulation price £/m2
Roof Insulation price £/m2
Total Insulation
price £
TSC cost £
PV Cost £Fabric cost
£
Operational CO2
(kgCO2/m2.yr)
PV ECO2
(kgCO2/m2.yr)
TSC ECO2
(kgCO2/m2.yr)
Insulation ECO2
(kgCO2/m2.yr)
Total CO2
(kgCO2/m2.yr)CO2 saving
%
Energy saving (A)
£
PV(A) £
NPV £
0 0 0 18.73 32.85 3.51 0 0 0 0 11957.4 14270.36 66.00 46.00 143460.00 0.00 0.00 143460.00 21.59 0.00 0.00 0.66 22.25 0.00 0.00 0.00 0.0025% 60 190 11.64 24.6375 3.51 0.1418 25073.559 60344.3764 0 8448.213 10023.813 73.00 51.00 158754.00 9000.00 35168.82 202922.82 15.22 0.71 0.03 1.11 17.07 23.31 4246.55 99747.06 40284.2450% 156 382 7.76 16.425 3.51 0.2194 50411.0502 41744.9171 6740.0973 5540.984 6713.064 73.00 51.00 158754.00 23400.00 70337.65 252491.65 9.39 1.42 0.07 1.11 11.99 46.10 7557.30 177513.17 68481.5275% 377 573 3.88 8.2125 3.51 0.297 75616.5753 31431.6521 21630.292 3427.068 4195.6282 73.00 51.00 158754.00 56550.00 105506.47 320810.47 3.58 2.13 0.18 1.11 7.00 68.53 10074.73 236645.17 59294.70100% 589 764 0 0 3.51 0.3746 100822.1 25097.8909 40453.352 1693.304 2058.3439 73.00 51.00 158754.00 88350.00 140675.29 387779.29 -2.21 2.84 0.28 1.11 2.02 90.93 12212.02 286847.80 42528.50
Carbon offsetting
589 851 0 0 3.51 0.3746 112303.151 22800.3895 49790.351 951.4887 1316.5287 73.00 51.00 158754.00 88350.00 184969.90 432073.90 -4.56 3.17 0.28 1.11 0.00 100.02 12953.83 304272.28 15658.38
Carbon offsetting
589 851 0 0 3.51 0.3746 112303.151 22800.3895 49790.351 -1786.98 -1421.941 73.00 51.00 158754.00 88350.00 184969.90 432073.90 -4.56 3.17 0.28 1.11 0.00 100.02 15692.30 368596.13 79982.23
provided Elec. & heating
TSC area m2
PV area m2
Heating (KWh/m2)
Lighting (KWh/m2)
Hot water (KWh/m2)
TSC fan power
(KWh/m2)
generated Elec by PV
(KWh)
purchased from grid
elec (KWh)
Exported Elec
(KWh)
Elec cost £
Energy cost Inc
FIT £
Wall Insulation price £/m2
Roof Insulation price £/m2
Total Insulation
price £
TSC cost £
PV Cost £Fabric cost
£
Operational CO2
(kgCO2/m2.yr)
PV ECO2
(kgCO2/m2.yr)
TSC ECO2
(kgCO2/m2.yr)
Insulation ECO2
(kgCO2/m2.yr)
Total CO2
(kgCO2/m2.yr)CO2 saving
%
Energy saving (A)
£
PV(A) £
NPV £
0 0 0 18.73 32.85 3.51 0 0 0 0 11957.4 14270.36 66.00 46.00 143460.00 0.00 0.00 143460.00 21.59 0.00 0.00 0.66 22.25 0.00 0.00 0.00 0.0025% 57 190 11.25 24.6375 3.51 0.1496 25073.559 60344.3764 0 8448.213 9983.2527 79.00 55.00 171678.00 8550.00 35168.82 215396.82 15.15 0.71 0.03 1.62 17.50 21.35 4287.11 100699.78 28762.9550% 153 382 7.5 16.425 3.51 0.2246 50411.0502 41744.9171 6740.0973 5540.984 6686.024 79.00 55.00 171678.00 22950.00 70337.65 264965.65 9.34 1.42 0.07 1.62 12.45 44.04 7584.34 178148.31 56642.6775% 371 573 3.75 8.2125 3.51 0.2996 75616.5753 31431.6521 21630.292 3427.068 4182.1082 79.00 55.00 171678.00 55650.00 105506.47 332834.47 3.56 2.13 0.18 1.62 7.49 66.36 10088.25 236962.74 47588.27100% 582 764 0 0 3.51 0.3746 100822.1 25097.8909 40453.352 1693.304 2058.3439 79.00 55.00 171678.00 87300.00 140675.29 399653.29 -2.21 2.84 0.28 1.62 2.53 88.65 12212.02 286847.80 30654.50
Carbon offsetting
582 873 0 0 3.51 0.3746 115206.405 22286.8949 52176.714 772.2132 1137.2532 79.00 55.00 171678.00 87300.00 189751.73 448729.73 -5.15 3.25 0.28 1.62 0.00 100.00 13133.11 308483.28 3213.55
Carbon offsetting
582 873 0 0 3.51 0.3746 115206.405 22286.8949 52176.714 -2097.51 -1732.466 79.00 55.00 171678.00 87300.00 189751.73 448729.73 -5.15 3.25 0.28 1.62 0.00 100.00 16002.83 375890.06 70620.33
provided Elec. & heating
TSC area m2
PV area m2
Heating (KWh/m2)
Lighting (KWh/m2)
Hot water (KWh/m2)
TSC fan power
(KWh/m2)
generated Elec by PV
(KWh)
purchased from grid
elec (KWh)
Exported Elec
(KWh)
Elec cost £
Energy cost Inc
FIT £
Wall Insulation price £/m2
Roof Insulation price £/m2
Total Insulation
price £
TSC cost £
PV Cost £Fabric cost
£
Operational CO2
(kgCO2/m2.yr)
PV ECO2
(kgCO2/m2.yr)
TSC ECO2
(kgCO2/m2.yr)
Insulation ECO2
(kgCO2/m2.yr)
Total CO2
(kgCO2/m2.yr)CO2 saving
%
Energy saving (A)
£
PV(A) £
NPV £
0 0 0 18.73 32.85 3.51 0 0 0 0 11957.4 14270.36 66.00 46.00 143460.00 0.00 0.00 143460.00 21.59 0.00 0.00 0.66 22.25 0.00 0.00 0.00 0.0025% 55 190 10.65 24.6375 3.51 0.1616 25073.559 60344.3764 0 8448.213 9920.8527 82.00 57.00 178140.00 8250.00 35168.82 221558.82 15.04 0.71 0.03 1.72 17.49 21.40 4349.51 102165.49 24066.6650% 150 382 7.1 16.425 3.51 0.2326 50411.0502 41744.9171 6740.0973 5540.984 6644.424 82.00 57.00 178140.00 22500.00 70337.65 270977.65 9.26 1.42 0.07 1.72 12.48 43.93 7625.94 179125.45 51607.8175% 365 573 3.55 8.2125 3.51 0.3036 75616.5753 31431.6521 21630.292 3427.068 4161.3082 82.00 57.00 178140.00 54750.00 105506.47 338396.47 3.52 2.13 0.17 1.72 7.55 66.09 10109.05 237451.31 42514.84100% 575 764 0 0 3.51 0.3746 100822.1 25097.8909 40453.352 1693.304 2058.3439 82.00 57.00 178140.00 86250.00 140675.29 405065.29 -2.21 2.84 0.27 1.72 2.62 88.21 12212.02 286847.80 25242.50
Carbon offsetting
575 878 0 0 3.51 0.3746 115866.236 22170.1916 52719.069 731.4687 1096.5087 82.00 57.00 178140.00 86250.00 190838.51 455228.51 -5.28 3.27 0.27 1.72 -0.02 100.08 13173.85 309440.32 -2328.18
Carbon offsetting
575 878 0 0 3.51 0.3746 115866.236 22170.1916 52719.069 -2168.08 -1803.04 82.00 57.00 178140.00 86250.00 190838.51 455228.51 -5.28 3.27 0.27 1.72 -0.02 100.08 16073.40 377547.77 65779.26
TSC + PV + 0.08 - 0.11
TSC + PV + 0.07 - 0.10
Office-London
TSC + PV + 2010 notional building fabric
TSC + PV + 0.17 - 0.24
TSC + PV + 0.15 - 0.21
TSC + PV + 0.13 - 0.19
TSC + PV + 0.12 - 0.17
TSC + PV + 0.11 - 0.15
PV (future FiT) + Insulation + TSC
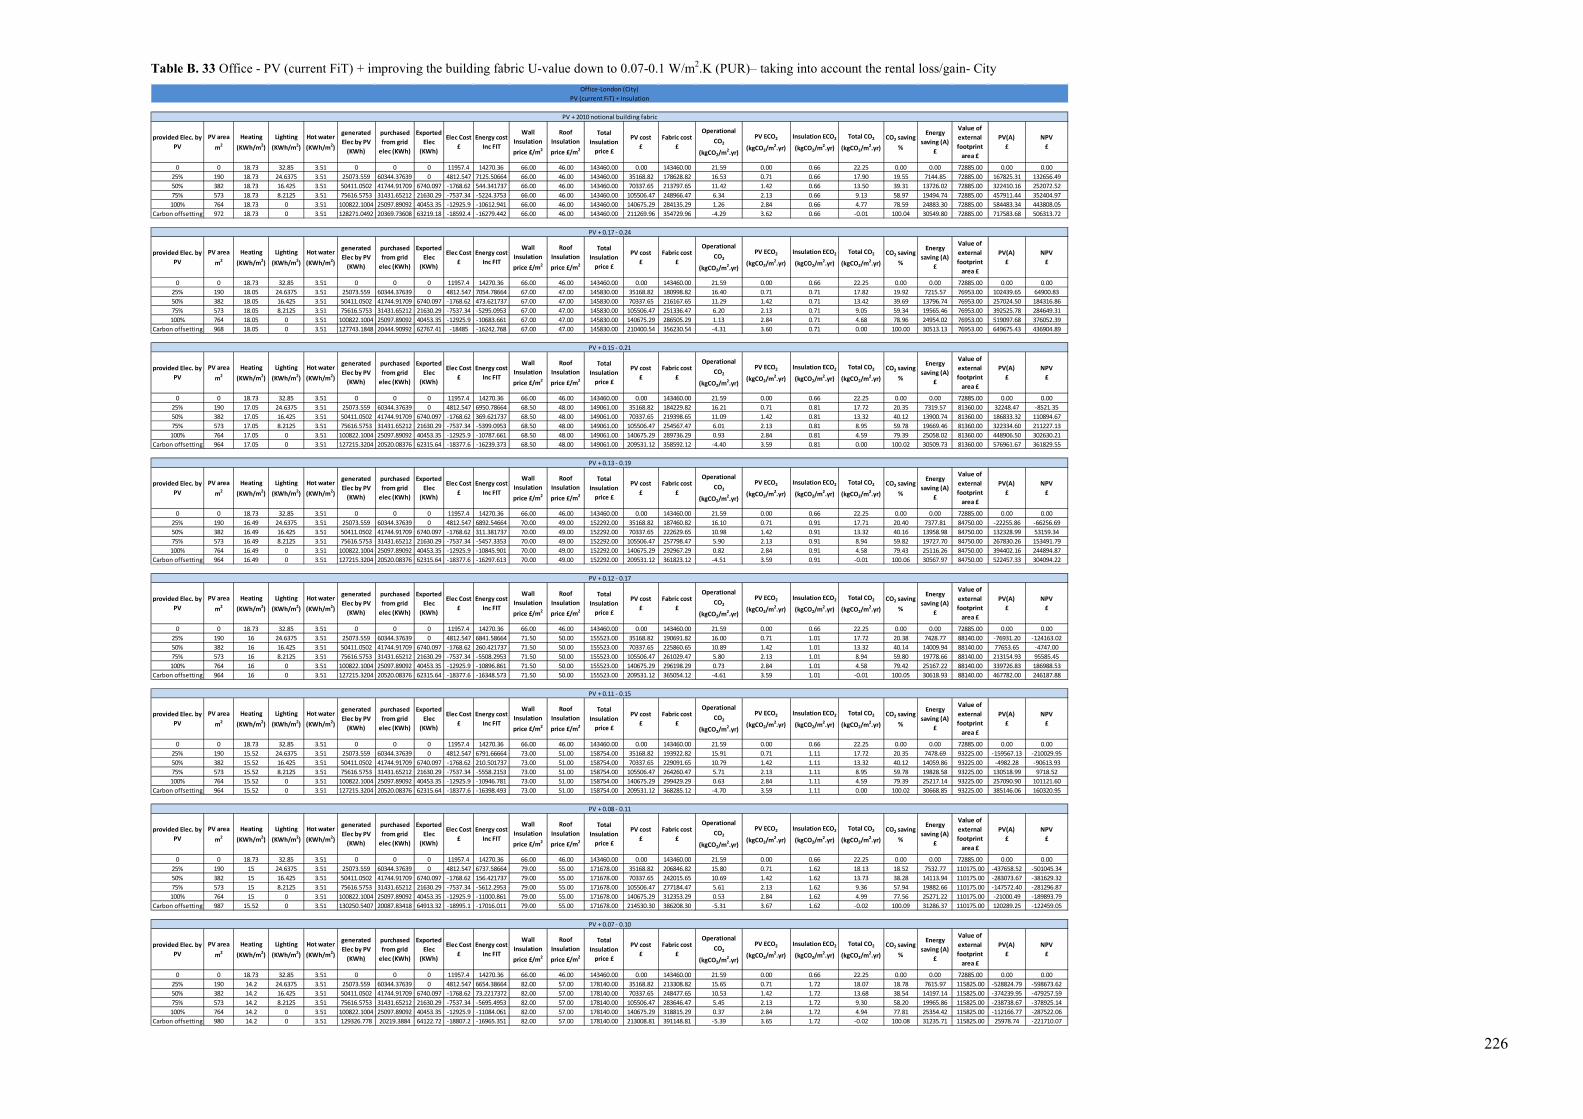
226
Table B. 33 Office - PV (current FiT) + improving the building fabric U-value down to 0.07-0.1 W/m2.K (PUR)– taking into account the rental loss/gain- City
provided Elec. by PV
PV area m2
Heating (KWh/m2)
Lighting (KWh/m2)
Hot water (KWh/m2)
generated Elec by PV
(KWh)
purchased from grid
elec (KWh)
Exported Elec
(KWh)
Elec Cost £
Energy cost Inc FIT
Wall Insulation price £/m2
Roof Insulation price £/m2
Total Insulation
price £
PV cost £
Fabric cost £
Operational CO2
(kgCO2/m2.yr)
PV ECO2
(kgCO2/m2.yr)
Insulation ECO2
(kgCO2/m2.yr)
Total CO2
(kgCO2/m2.yr)CO2 saving
%
Energy saving (A)
£
Value of external footprint
area £
PV(A) £
NPV £
0 0 18.73 32.85 3.51 0 0 0 11957.4 14270.36 66.00 46.00 143460.00 0.00 143460.00 21.59 0.00 0.66 22.25 0.00 0.00 72885.00 0.00 0.0025% 190 18.73 24.6375 3.51 25073.559 60344.37639 0 4812.547 7125.50664 66.00 46.00 143460.00 35168.82 178628.82 16.53 0.71 0.66 17.90 19.55 7144.85 72885.00 167825.31 132656.4950% 382 18.73 16.425 3.51 50411.0502 41744.91709 6740.097 -1768.62 544.341737 66.00 46.00 143460.00 70337.65 213797.65 11.42 1.42 0.66 13.50 39.31 13726.02 72885.00 322410.16 252072.5275% 573 18.73 8.2125 3.51 75616.5753 31431.65212 21630.29 -7537.34 -5224.3753 66.00 46.00 143460.00 105506.47 248966.47 6.34 2.13 0.66 9.13 58.97 19494.74 72885.00 457911.44 352404.97100% 764 18.73 0 3.51 100822.1004 25097.89092 40453.35 -12925.9 -10612.941 66.00 46.00 143460.00 140675.29 284135.29 1.26 2.84 0.66 4.77 78.59 24883.30 72885.00 584483.34 443808.05
Carbon offsetting 972 18.73 0 3.51 128271.0492 20369.73608 63219.18 -18592.4 -16279.442 66.00 46.00 143460.00 211269.96 354729.96 -4.29 3.62 0.66 -0.01 100.04 30549.80 72885.00 717583.68 506313.72
provided Elec. by PV
PV area m2
Heating (KWh/m2)
Lighting (KWh/m2)
Hot water (KWh/m2)
generated Elec by PV
(KWh)
purchased from grid
elec (KWh)
Exported Elec
(KWh)
Elec Cost £
Energy cost Inc FIT
Wall Insulation price £/m2
Roof Insulation price £/m2
Total Insulation
price £
PV cost £
Fabric cost £
Operational CO2
(kgCO2/m2.yr)
PV ECO2
(kgCO2/m2.yr)
Insulation ECO2
(kgCO2/m2.yr)
Total CO2
(kgCO2/m2.yr)CO2 saving
%
Energy saving (A)
£
Value of external footprint
area £
PV(A) £
NPV £
0 0 18.73 32.85 3.51 0 0 0 11957.4 14270.36 66.00 46.00 143460.00 0.00 143460.00 21.59 0.00 0.66 22.25 0.00 0.00 72885.00 0.00 0.0025% 190 18.05 24.6375 3.51 25073.559 60344.37639 0 4812.547 7054.78664 67.00 47.00 145830.00 35168.82 180998.82 16.40 0.71 0.71 17.82 19.92 7215.57 76953.00 102439.65 64900.8350% 382 18.05 16.425 3.51 50411.0502 41744.91709 6740.097 -1768.62 473.621737 67.00 47.00 145830.00 70337.65 216167.65 11.29 1.42 0.71 13.42 39.69 13796.74 76953.00 257024.50 184316.8675% 573 18.05 8.2125 3.51 75616.5753 31431.65212 21630.29 -7537.34 -5295.0953 67.00 47.00 145830.00 105506.47 251336.47 6.20 2.13 0.71 9.05 59.34 19565.46 76953.00 392525.78 284649.31100% 764 18.05 0 3.51 100822.1004 25097.89092 40453.35 -12925.9 -10683.661 67.00 47.00 145830.00 140675.29 286505.29 1.13 2.84 0.71 4.68 78.96 24954.02 76953.00 519097.68 376052.39
Carbon offsetting 968 18.05 0 3.51 127743.1848 20444.90992 62767.41 -18485 -16242.768 67.00 47.00 145830.00 210400.54 356230.54 -4.31 3.60 0.71 0.00 100.00 30513.13 76953.00 649675.43 436904.89
provided Elec. by PV
PV area m2
Heating (KWh/m2)
Lighting (KWh/m2)
Hot water (KWh/m2)
generated Elec by PV
(KWh)
purchased from grid
elec (KWh)
Exported Elec
(KWh)
Elec Cost £
Energy cost Inc FIT
Wall Insulation price £/m2
Roof Insulation price £/m2
Total Insulation
price £
PV cost £
Fabric cost £
Operational CO2
(kgCO2/m2.yr)
PV ECO2
(kgCO2/m2.yr)
Insulation ECO2
(kgCO2/m2.yr)
Total CO2
(kgCO2/m2.yr)CO2 saving
%
Energy saving (A)
£
Value of external footprint
area £
PV(A) £
NPV £
0 0 18.73 32.85 3.51 0 0 0 11957.4 14270.36 66.00 46.00 143460.00 0.00 143460.00 21.59 0.00 0.66 22.25 0.00 0.00 72885.00 0.00 0.0025% 190 17.05 24.6375 3.51 25073.559 60344.37639 0 4812.547 6950.78664 68.50 48.00 149061.00 35168.82 184229.82 16.21 0.71 0.81 17.72 20.35 7319.57 81360.00 32248.47 -8521.3550% 382 17.05 16.425 3.51 50411.0502 41744.91709 6740.097 -1768.62 369.621737 68.50 48.00 149061.00 70337.65 219398.65 11.09 1.42 0.81 13.32 40.12 13900.74 81360.00 186833.32 110894.6775% 573 17.05 8.2125 3.51 75616.5753 31431.65212 21630.29 -7537.34 -5399.0953 68.50 48.00 149061.00 105506.47 254567.47 6.01 2.13 0.81 8.95 59.78 19669.46 81360.00 322334.60 211227.13100% 764 17.05 0 3.51 100822.1004 25097.89092 40453.35 -12925.9 -10787.661 68.50 48.00 149061.00 140675.29 289736.29 0.93 2.84 0.81 4.59 79.39 25058.02 81360.00 448906.50 302630.21
Carbon offsetting 964 17.05 0 3.51 127215.3204 20520.08376 62315.64 -18377.6 -16239.373 68.50 48.00 149061.00 209531.12 358592.12 -4.40 3.59 0.81 0.00 100.02 30509.73 81360.00 576961.67 361829.55
provided Elec. by PV
PV area m2
Heating (KWh/m2)
Lighting (KWh/m2)
Hot water (KWh/m2)
generated Elec by PV
(KWh)
purchased from grid
elec (KWh)
Exported Elec
(KWh)
Elec Cost £
Energy cost Inc FIT
Wall Insulation price £/m2
Roof Insulation price £/m2
Total Insulation
price £
PV cost £
Fabric cost £
Operational CO2
(kgCO2/m2.yr)
PV ECO2
(kgCO2/m2.yr)
Insulation ECO2
(kgCO2/m2.yr)
Total CO2
(kgCO2/m2.yr)CO2 saving
%
Energy saving (A)
£
Value of external footprint
area £
PV(A) £
NPV £
0 0 18.73 32.85 3.51 0 0 0 11957.4 14270.36 66.00 46.00 143460.00 0.00 143460.00 21.59 0.00 0.66 22.25 0.00 0.00 72885.00 0.00 0.0025% 190 16.49 24.6375 3.51 25073.559 60344.37639 0 4812.547 6892.54664 70.00 49.00 152292.00 35168.82 187460.82 16.10 0.71 0.91 17.71 20.40 7377.81 84750.00 -22255.86 -66256.6950% 382 16.49 16.425 3.51 50411.0502 41744.91709 6740.097 -1768.62 311.381737 70.00 49.00 152292.00 70337.65 222629.65 10.98 1.42 0.91 13.32 40.16 13958.98 84750.00 132328.99 53159.3475% 573 16.49 8.2125 3.51 75616.5753 31431.65212 21630.29 -7537.34 -5457.3353 70.00 49.00 152292.00 105506.47 257798.47 5.90 2.13 0.91 8.94 59.82 19727.70 84750.00 267830.26 153491.79100% 764 16.49 0 3.51 100822.1004 25097.89092 40453.35 -12925.9 -10845.901 70.00 49.00 152292.00 140675.29 292967.29 0.82 2.84 0.91 4.58 79.43 25116.26 84750.00 394402.16 244894.87
Carbon offsetting 964 16.49 0 3.51 127215.3204 20520.08376 62315.64 -18377.6 -16297.613 70.00 49.00 152292.00 209531.12 361823.12 -4.51 3.59 0.91 -0.01 100.06 30567.97 84750.00 522457.33 304094.22
provided Elec. by PV
PV area m2
Heating (KWh/m2)
Lighting (KWh/m2)
Hot water (KWh/m2)
generated Elec by PV
(KWh)
purchased from grid
elec (KWh)
Exported Elec
(KWh)
Elec Cost £
Energy cost Inc FIT
Wall Insulation price £/m2
Roof Insulation price £/m2
Total Insulation
price £
PV cost £
Fabric cost £
Operational CO2
(kgCO2/m2.yr)
PV ECO2
(kgCO2/m2.yr)
Insulation ECO2
(kgCO2/m2.yr)
Total CO2
(kgCO2/m2.yr)CO2 saving
%
Energy saving (A)
£
Value of external footprint
area £
PV(A) £
NPV £
0 0 18.73 32.85 3.51 0 0 0 11957.4 14270.36 66.00 46.00 143460.00 0.00 143460.00 21.59 0.00 0.66 22.25 0.00 0.00 72885.00 0.00 0.0025% 190 16 24.6375 3.51 25073.559 60344.37639 0 4812.547 6841.58664 71.50 50.00 155523.00 35168.82 190691.82 16.00 0.71 1.01 17.72 20.38 7428.77 88140.00 -76931.20 -124163.0250% 382 16 16.425 3.51 50411.0502 41744.91709 6740.097 -1768.62 260.421737 71.50 50.00 155523.00 70337.65 225860.65 10.89 1.42 1.01 13.32 40.14 14009.94 88140.00 77653.65 -4747.0075% 573 16 8.2125 3.51 75616.5753 31431.65212 21630.29 -7537.34 -5508.2953 71.50 50.00 155523.00 105506.47 261029.47 5.80 2.13 1.01 8.94 59.80 19778.66 88140.00 213154.93 95585.45100% 764 16 0 3.51 100822.1004 25097.89092 40453.35 -12925.9 -10896.861 71.50 50.00 155523.00 140675.29 296198.29 0.73 2.84 1.01 4.58 79.42 25167.22 88140.00 339726.83 186988.53
Carbon offsetting 964 16 0 3.51 127215.3204 20520.08376 62315.64 -18377.6 -16348.573 71.50 50.00 155523.00 209531.12 365054.12 -4.61 3.59 1.01 -0.01 100.05 30618.93 88140.00 467782.00 246187.88
provided Elec. by PV
PV area m2
Heating (KWh/m2)
Lighting (KWh/m2)
Hot water (KWh/m2)
generated Elec by PV
(KWh)
purchased from grid
elec (KWh)
Exported Elec
(KWh)
Elec Cost £
Energy cost Inc FIT
Wall Insulation price £/m2
Roof Insulation price £/m2
Total Insulation
price £
PV cost £
Fabric cost £
Operational CO2
(kgCO2/m2.yr)
PV ECO2
(kgCO2/m2.yr)
Insulation ECO2
(kgCO2/m2.yr)
Total CO2
(kgCO2/m2.yr)CO2 saving
%
Energy saving (A)
£
Value of external footprint
area £
PV(A) £
NPV £
0 0 18.73 32.85 3.51 0 0 0 11957.4 14270.36 66.00 46.00 143460.00 0.00 143460.00 21.59 0.00 0.66 22.25 0.00 0.00 72885.00 0.00 0.0025% 190 15.52 24.6375 3.51 25073.559 60344.37639 0 4812.547 6791.66664 73.00 51.00 158754.00 35168.82 193922.82 15.91 0.71 1.11 17.72 20.35 7478.69 93225.00 -159567.13 -210029.9550% 382 15.52 16.425 3.51 50411.0502 41744.91709 6740.097 -1768.62 210.501737 73.00 51.00 158754.00 70337.65 229091.65 10.79 1.42 1.11 13.32 40.12 14059.86 93225.00 -4982.28 -90613.9375% 573 15.52 8.2125 3.51 75616.5753 31431.65212 21630.29 -7537.34 -5558.2153 73.00 51.00 158754.00 105506.47 264260.47 5.71 2.13 1.11 8.95 59.78 19828.58 93225.00 130518.99 9718.52100% 764 15.52 0 3.51 100822.1004 25097.89092 40453.35 -12925.9 -10946.781 73.00 51.00 158754.00 140675.29 299429.29 0.63 2.84 1.11 4.59 79.39 25217.14 93225.00 257090.90 101121.60
Carbon offsetting 964 15.52 0 3.51 127215.3204 20520.08376 62315.64 -18377.6 -16398.493 73.00 51.00 158754.00 209531.12 368285.12 -4.70 3.59 1.11 0.00 100.02 30668.85 93225.00 385146.06 160320.95
provided Elec. by PV
PV area m2
Heating (KWh/m2)
Lighting (KWh/m2)
Hot water (KWh/m2)
generated Elec by PV
(KWh)
purchased from grid
elec (KWh)
Exported Elec
(KWh)
Elec Cost £
Energy cost Inc FIT
Wall Insulation price £/m2
Roof Insulation price £/m2
Total Insulation
price £
PV cost £
Fabric cost £
Operational CO2
(kgCO2/m2.yr)
PV ECO2
(kgCO2/m2.yr)
Insulation ECO2
(kgCO2/m2.yr)
Total CO2
(kgCO2/m2.yr)CO2 saving
%
Energy saving (A)
£
Value of external footprint
area £
PV(A) £
NPV £
0 0 18.73 32.85 3.51 0 0 0 11957.4 14270.36 66.00 46.00 143460.00 0.00 143460.00 21.59 0.00 0.66 22.25 0.00 0.00 72885.00 0.00 0.0025% 190 15 24.6375 3.51 25073.559 60344.37639 0 4812.547 6737.58664 79.00 55.00 171678.00 35168.82 206846.82 15.80 0.71 1.62 18.13 18.52 7532.77 110175.00 -437658.52 -501045.3450% 382 15 16.425 3.51 50411.0502 41744.91709 6740.097 -1768.62 156.421737 79.00 55.00 171678.00 70337.65 242015.65 10.69 1.42 1.62 13.73 38.28 14113.94 110175.00 -283073.67 -381629.3275% 573 15 8.2125 3.51 75616.5753 31431.65212 21630.29 -7537.34 -5612.2953 79.00 55.00 171678.00 105506.47 277184.47 5.61 2.13 1.62 9.36 57.94 19882.66 110175.00 -147572.40 -281296.87100% 764 15 0 3.51 100822.1004 25097.89092 40453.35 -12925.9 -11000.861 79.00 55.00 171678.00 140675.29 312353.29 0.53 2.84 1.62 4.99 77.56 25271.22 110175.00 -21000.49 -189893.79
Carbon offsetting 987 15.52 0 3.51 130250.5407 20087.83418 64913.32 -18995.1 -17016.011 79.00 55.00 171678.00 214530.30 386208.30 -5.31 3.67 1.62 -0.02 100.09 31286.37 110175.00 120289.25 -122459.05
provided Elec. by PV
PV area m2
Heating (KWh/m2)
Lighting (KWh/m2)
Hot water (KWh/m2)
generated Elec by PV
(KWh)
purchased from grid
elec (KWh)
Exported Elec
(KWh)
Elec Cost £
Energy cost Inc FIT
Wall Insulation price £/m2
Roof Insulation price £/m2
Total Insulation
price £
PV cost £
Fabric cost £
Operational CO2
(kgCO2/m2.yr)
PV ECO2
(kgCO2/m2.yr)
Insulation ECO2
(kgCO2/m2.yr)
Total CO2
(kgCO2/m2.yr)CO2 saving
%
Energy saving (A)
£
Value of external footprint
area £
PV(A) £
NPV £
0 0 18.73 32.85 3.51 0 0 0 11957.4 14270.36 66.00 46.00 143460.00 0.00 143460.00 21.59 0.00 0.66 22.25 0.00 0.00 72885.00 0.00 0.0025% 190 14.2 24.6375 3.51 25073.559 60344.37639 0 4812.547 6654.38664 82.00 57.00 178140.00 35168.82 213308.82 15.65 0.71 1.72 18.07 18.78 7615.97 115825.00 -528824.79 -598673.6250% 382 14.2 16.425 3.51 50411.0502 41744.91709 6740.097 -1768.62 73.2217372 82.00 57.00 178140.00 70337.65 248477.65 10.53 1.42 1.72 13.68 38.54 14197.14 115825.00 -374239.95 -479257.5975% 573 14.2 8.2125 3.51 75616.5753 31431.65212 21630.29 -7537.34 -5695.4953 82.00 57.00 178140.00 105506.47 283646.47 5.45 2.13 1.72 9.30 58.20 19965.86 115825.00 -238738.67 -378925.14100% 764 14.2 0 3.51 100822.1004 25097.89092 40453.35 -12925.9 -11084.061 82.00 57.00 178140.00 140675.29 318815.29 0.37 2.84 1.72 4.94 77.81 25354.42 115825.00 -112166.77 -287522.06
Carbon offsetting 980 14.2 0 3.51 129326.778 20219.3884 64122.72 -18807.2 -16965.351 82.00 57.00 178140.00 213008.81 391148.81 -5.39 3.65 1.72 -0.02 100.08 31235.71 115825.00 25978.74 -221710.07
PV + 0.08 - 0.11
PV + 0.07 - 0.10
PV + 2010 notional building fabric
Office-London (City)
PV + 0.17 - 0.24
PV + 0.15 - 0.21
PV + 0.13 - 0.19
PV + 0.12 - 0.17
PV + 0.11 - 0.15
PV (current FiT) + Insulation

227
Table B. 34 Office - PV (future FiT) + improving the building fabric U-value down to 0.07-0.1 W/m2.K (PUR) – taking into account the rental loss/gain- City
provided Elec. by PV
PV area m2
Heating (KWh/m2)
Lighting (KWh/m2)
Hot water (KWh/m2)
generated Elec by PV
(KWh)
purchased from grid
elec (KWh)
Exported Elec
(KWh)Elec Cost £
Energy cost Inc
FIT
Wall Insulation price £/m2
Roof Insulation price £/m2
Total Insulation
price £
PV cost £
Fabric cost £
Operational CO2
(kgCO2/m2.yr)
PV ECO2
(kgCO2/m2.yr)
Insulation ECO2
(kgCO2/m2.yr)
Total CO2
(kgCO2/m2.yr)CO2 saving
%
Energy saving (A)
£
Value of external footprint
area £
PV(A) £
NPV £
0 0 18.73 32.85 3.51 0 0 0 11957.4 14270.36 66.00 46.00 143460.00 0.00 143460.00 21.59 0.00 0.66 22.25 0.00 0.00 0.00 0.0025% 190 18.73 24.6375 3.51 25073.559 60344.37639 0 8448.2127 10761.173 66.00 46.00 143460.00 35168.82 178628.82 16.53 0.71 0.66 17.90 19.55 3509.19 72885.00 82427.23 47258.4150% 382 18.73 16.425 3.51 50411.0502 41744.91709 6740.0973 5540.984 7853.944 66.00 46.00 143460.00 70337.65 213797.65 11.42 1.42 0.66 13.50 39.31 6416.42 72885.00 150715.06 80377.4275% 573 18.73 8.2125 3.51 75616.5753 31431.65212 21630.292 3427.0682 5740.0282 66.00 46.00 143460.00 105506.47 248966.47 6.34 2.13 0.66 9.13 58.97 8530.33 72885.00 200368.79 94862.32100% 764 18.73 0 3.51 100822.1 25097.89092 40453.352 1693.3039 4006.2639 66.00 46.00 143460.00 140675.29 284135.29 1.26 2.84 0.66 4.77 78.59 10264.10 72885.00 241093.14 100417.85100% 764 18.73 0 3.51 100822.1 25097.89092 40453.352 -531.6305 1781.3295 66.00 46.00 143460.00 140675.29 284135.29 1.26 2.84 1.66 5.77 74.09 12489.03 72885.00 293354.58 152679.29
Carbon offsetting 972 18.73 0 3.51 128271.049 20369.73608 63219.179 6.8999979 2319.86 66.00 46.00 143460.00 211269.96 354729.96 -4.29 3.62 0.66 -0.01 100.04 11950.50 72885.00 280705.05 69435.09Carbon offsetting 972 18.73 0 3.51 128271.049 20369.73608 63219.179 -3470.155 -1157.195 66.00 46.00 143460.00 211269.96 354729.96 -4.29 3.62 0.66 -0.01 100.04 15427.55 72885.00 362377.52 151107.56
provided Elec. by PV
PV area m2
Heating (KWh/m2)
Lighting (KWh/m2)
Hot water (KWh/m2)
generated Elec by PV
(KWh)
purchased from grid
elec (KWh)
Exported Elec
(KWh)Elec Cost £
Energy cost Inc
FIT
Wall Insulation price £/m2
Roof Insulation price £/m2
Total Insulation
price £
PV cost £
Fabric cost £
Operational CO2
(kgCO2/m2.yr)
PV ECO2
(kgCO2/m2.yr)
Insulation ECO2
(kgCO2/m2.yr)
Total CO2
(kgCO2/m2.yr)CO2 saving
%
Energy saving (A)
£
Value of external footprint
area £
PV(A) £
NPV £
0 0 18.73 32.85 3.51 0 0 0 11957.4 14270.36 66.00 46.00 143460.00 0.00 143460.00 21.59 0.00 0.66 22.25 0.00 0.00 0.00 0.0025% 190 18.05 24.6375 3.51 25073.559 60344.37639 0 8448.2127 10690.453 67.00 47.00 145830.00 35168.82 180998.82 16.40 0.71 0.71 17.82 19.92 3579.91 76953.00 17041.57 -20497.2650% 382 18.05 16.425 3.51 50411.0502 41744.91709 6740.0973 5540.984 7783.224 67.00 47.00 145830.00 70337.65 216167.65 11.29 1.42 0.71 13.42 39.69 6487.14 76953.00 85329.40 12621.7675% 573 18.05 8.2125 3.51 75616.5753 31431.65212 21630.292 3427.0682 5669.3082 67.00 47.00 145830.00 105506.47 251336.47 6.20 2.13 0.71 9.05 59.34 8601.05 76953.00 134983.13 27106.66100% 764 18.05 0 3.51 100822.1 25097.89092 40453.352 1693.3039 3935.5439 67.00 47.00 145830.00 140675.29 286505.29 1.13 2.84 0.71 4.68 78.96 10334.82 76953.00 175707.48 32662.19100% 764 18.05 0 3.51 100822.1 25097.89092 40453.352 -531.6305 1710.6095 67.00 47.00 145830.00 140675.29 286505.29 1.13 2.84 1.71 5.68 74.47 12559.75 76953.00 227968.92 84923.63
Carbon offsetting 968 18.05 0 3.51 127743.185 20444.90992 62767.407 37.754058 2279.9941 67.00 47.00 145830.00 210400.54 356230.54 -4.31 3.60 0.71 0.00 100.00 11990.37 76953.00 214594.66 1824.12Carbon offsetting 968 18.05 0 3.51 127743.185 20444.90992 62767.407 -3414.453 -1172.213 67.00 47.00 145830.00 210400.54 356230.54 -4.31 3.60 0.71 0.00 100.00 15442.57 76953.00 295683.49 82912.95
provided Elec. by PV
PV area m2
Heating (KWh/m2)
Lighting (KWh/m2)
Hot water (KWh/m2)
generated Elec by PV
(KWh)
purchased from grid
elec (KWh)
Exported Elec
(KWh)Elec Cost £
Energy cost Inc
FIT
Wall Insulation price £/m2
Roof Insulation price £/m2
Total Insulation
price £
PV cost £
Fabric cost £
Operational CO2
(kgCO2/m2.yr)
PV ECO2
(kgCO2/m2.yr)
Insulation ECO2
(kgCO2/m2.yr)
Total CO2
(kgCO2/m2.yr)CO2 saving
%
Energy saving (A)
£
Value of external footprint
area £
PV(A) £
NPV £
0 0 18.73 32.85 3.51 0 0 0 11957.4 14270.36 66.00 46.00 143460.00 0.00 143460.00 21.59 0.00 0.66 22.25 0.00 0.00 0.00 0.0025% 190 17.05 24.6375 3.51 25073.559 60344.37639 0 8448.2127 10586.453 68.50 48.00 149061.00 35168.82 184229.82 16.21 0.71 0.81 17.72 20.35 3683.91 81360.00 -53149.61 -93919.4450% 382 17.05 16.425 3.51 50411.0502 41744.91709 6740.0973 5540.984 7679.224 68.50 48.00 149061.00 70337.65 219398.65 11.09 1.42 0.81 13.32 40.12 6591.14 81360.00 15138.22 -60800.4275% 573 17.05 8.2125 3.51 75616.5753 31431.65212 21630.292 3427.0682 5565.3082 68.50 48.00 149061.00 105506.47 254567.47 6.01 2.13 0.81 8.95 59.78 8705.05 81360.00 64791.95 -46315.52100% 764 17.05 0 3.51 100822.1 25097.89092 40453.352 1693.3039 3831.5439 68.50 48.00 149061.00 140675.29 289736.29 0.93 2.84 0.81 4.59 79.39 10438.82 81360.00 105516.30 -40759.99100% 764 17.05 0 3.51 100822.1 25097.89092 40453.352 -531.6305 1606.6095 68.50 48.00 149061.00 140675.29 289736.29 0.93 2.84 1.81 5.59 74.90 12663.75 81360.00 157777.74 11501.45
Carbon offsetting 964 17.05 0 3.51 127215.32 20520.08376 62315.636 68.608117 2206.8481 68.50 48.00 149061.00 209531.12 358592.12 -4.40 3.59 0.81 0.00 100.02 12063.51 81360.00 143678.75 -71453.37Carbon offsetting 964 17.05 0 3.51 127215.32 20520.08376 62315.636 -3358.752 -1220.512 68.50 48.00 149061.00 209531.12 358592.12 -4.40 3.59 0.81 0.00 100.02 15490.87 81360.00 224183.94 9051.82
provided Elec. by PV
PV area m2
Heating (KWh/m2)
Lighting (KWh/m2)
Hot water (KWh/m2)
generated Elec by PV
(KWh)
purchased from grid
elec (KWh)
Exported Elec
(KWh)Elec Cost £
Energy cost Inc
FIT
Wall Insulation price £/m2
Roof Insulation price £/m2
Total Insulation
price £
PV cost £
Fabric cost £
Operational CO2
(kgCO2/m2.yr)
PV ECO2
(kgCO2/m2.yr)
Insulation ECO2
(kgCO2/m2.yr)
Total CO2
(kgCO2/m2.yr)CO2 saving
%
Energy saving (A)
£
Value of external footprint
area £
PV(A) £
NPV £
0 0 18.73 32.85 3.51 0 0 0 11957.4 14270.36 66.00 46.00 143460.00 0.00 143460.00 21.59 0.00 0.66 22.25 0.00 0.00 0.00 0.0025% 190 16.49 24.6375 3.51 25073.559 60344.37639 0 8448.2127 10528.213 70.00 49.00 152292.00 35168.82 187460.82 16.10 0.71 0.91 17.71 20.40 3742.15 84750.00 -107653.95 -151654.7750% 382 16.49 16.425 3.51 50411.0502 41744.91709 6740.0973 5540.984 7620.984 70.00 49.00 152292.00 70337.65 222629.65 10.98 1.42 0.91 13.32 40.16 6649.38 84750.00 -39366.11 -118535.7675% 573 16.49 8.2125 3.51 75616.5753 31431.65212 21630.292 3427.0682 5507.0682 70.00 49.00 152292.00 105506.47 257798.47 5.90 2.13 0.91 8.94 59.82 8763.29 84750.00 10287.61 -104050.86100% 764 16.49 0 3.51 100822.1 25097.89092 40453.352 1693.3039 3773.3039 70.00 49.00 152292.00 140675.29 292967.29 0.82 2.84 0.91 4.58 79.43 10497.06 84750.00 51011.97 -98495.33100% 764 16.49 0 3.51 100822.1 25097.89092 40453.352 -531.6305 1548.3695 70.00 49.00 152292.00 140675.29 292967.29 0.82 2.84 1.91 5.58 74.94 12721.99 84750.00 103273.40 -46233.89
Carbon offsetting 964 16.49 0 3.51 127215.32 20520.08376 62315.636 68.608117 2148.6081 70.00 49.00 152292.00 209531.12 361823.12 -4.51 3.59 0.91 -0.01 100.06 12121.75 84750.00 89174.41 -129188.70Carbon offsetting 964 16.49 0 3.51 127215.32 20520.08376 62315.636 -3358.752 -1278.752 70.00 49.00 152292.00 209531.12 361823.12 -4.51 3.59 0.91 -0.01 100.06 15549.11 84750.00 169679.60 -48683.52
provided Elec. by PV
PV area m2
Heating (KWh/m2)
Lighting (KWh/m2)
Hot water (KWh/m2)
generated Elec by PV
(KWh)
purchased from grid
elec (KWh)
Exported Elec
(KWh)Elec Cost £
Energy cost Inc
FIT
Wall Insulation price £/m2
Roof Insulation price £/m2
Total Insulation
price £
PV cost £
Fabric cost £
Operational CO2
(kgCO2/m2.yr)
PV ECO2
(kgCO2/m2.yr)
Insulation ECO2
(kgCO2/m2.yr)
Total CO2
(kgCO2/m2.yr)CO2 saving
%
Energy saving (A)
£
Value of external footprint
area £
PV(A) £
NPV £
0 0 18.73 32.85 3.51 0 0 0 11957.4 14270.36 66.00 46.00 143460.00 0.00 143460.00 21.59 0.00 0.66 22.25 0.00 0.00 0.00 0.0025% 190 16 24.6375 3.51 25073.559 60344.37639 0 8448.2127 10477.253 71.50 50.00 155523.00 35168.82 190691.82 16.00 0.71 1.01 17.72 20.38 3793.11 88140.00 -162329.28 -209561.1150% 382 16 16.425 3.51 50411.0502 41744.91709 6740.0973 5540.984 7570.024 71.50 50.00 155523.00 70337.65 225860.65 10.89 1.42 1.01 13.32 40.14 6700.34 88140.00 -94041.45 -176442.1075% 573 16 8.2125 3.51 75616.5753 31431.65212 21630.292 3427.0682 5456.1082 71.50 50.00 155523.00 105506.47 261029.47 5.80 2.13 1.01 8.94 59.80 8814.25 88140.00 -44387.72 -161957.19100% 764 16 0 3.51 100822.1 25097.89092 40453.352 1693.3039 3722.3439 71.50 50.00 155523.00 140675.29 296198.29 0.73 2.84 1.01 4.58 79.42 10548.02 88140.00 -3663.37 -156401.66100% 764 16 0 3.51 100822.1 25097.89092 40453.352 -531.6305 1497.4095 71.50 50.00 155523.00 140675.29 296198.29 0.73 2.84 2.01 5.58 74.92 12772.95 88140.00 48598.07 -104140.23
Carbon offsetting 964 16 0 3.51 127215.32 20520.08376 62315.636 68.608117 2097.6481 71.50 50.00 155523.00 209531.12 365054.12 -4.61 3.59 1.01 -0.01 100.05 12172.71 88140.00 34499.08 -187095.04Carbon offsetting 964 16 0 3.51 127215.32 20520.08376 62315.636 -3358.752 -1329.712 71.50 50.00 155523.00 209531.12 365054.12 -4.61 3.59 1.01 -0.01 100.05 15600.07 88140.00 115004.26 -106589.85
provided Elec. by PV
PV area m2
Heating (KWh/m2)
Lighting (KWh/m2)
Hot water (KWh/m2)
generated Elec by PV
(KWh)
purchased from grid
elec (KWh)
Exported Elec
(KWh)Elec Cost £
Energy cost Inc
FIT
Wall Insulation price £/m2
Roof Insulation price £/m2
Total Insulation
price £
PV cost £
Fabric cost £
Operational CO2
(kgCO2/m2.yr)
PV ECO2
(kgCO2/m2.yr)
Insulation ECO2
(kgCO2/m2.yr)
Total CO2
(kgCO2/m2.yr)CO2 saving
%
Energy saving (A)
£
Value of external footprint
area £
PV(A) £
NPV £
0 0 18.73 32.85 3.51 0 0 0 11957.4 14270.36 66.00 46.00 143460.00 0.00 143460.00 21.59 0.00 0.66 22.25 0.00 0.00 0.00 0.0025% 190 15.52 24.6375 3.51 25073.559 60344.37639 0 8448.2127 10427.333 73.00 51.00 158754.00 35168.82 193922.82 15.91 0.71 1.11 17.72 20.35 3843.03 93225.00 -244965.22 -295428.0450% 382 15.52 16.425 3.51 50411.0502 41744.91709 6740.0973 5540.984 7520.104 73.00 51.00 158754.00 70337.65 229091.65 10.79 1.42 1.11 13.32 40.12 6750.26 93225.00 -176677.38 -262309.0375% 573 15.52 8.2125 3.51 75616.5753 31431.65212 21630.292 3427.0682 5406.1882 73.00 51.00 158754.00 105506.47 264260.47 5.71 2.13 1.11 8.95 59.78 8864.17 93225.00 -127023.66 -247824.13100% 764 15.52 0 3.51 100822.1 25097.89092 40453.352 1693.3039 3672.4239 73.00 51.00 158754.00 140675.29 299429.29 0.63 2.84 1.11 4.59 79.39 10597.94 93225.00 -86299.30 -242268.60100% 764 15.52 0 3.51 100822.1 25097.89092 40453.352 -531.6305 1447.4895 73.00 51.00 158754.00 140675.29 299429.29 0.63 2.84 2.11 5.59 74.90 12822.87 93225.00 -34037.86 -190007.16
Carbon offsetting 964 15.52 0 3.51 127215.32 20520.08376 62315.636 68.608117 2047.7281 73.00 51.00 158754.00 209531.12 368285.12 -4.70 3.59 1.11 0.00 100.02 12222.63 93225.00 -48136.86 -272961.97Carbon offsetting 964 15.52 0 3.51 127215.32 20520.08376 62315.636 -3358.752 -1379.632 73.00 51.00 158754.00 209531.12 368285.12 -4.70 3.59 1.11 0.00 100.02 15649.99 93225.00 32368.33 -192456.78
provided Elec. by PV
PV area m2
Heating (KWh/m2)
Lighting (KWh/m2)
Hot water (KWh/m2)
generated Elec by PV
(KWh)
purchased from grid
elec (KWh)
Exported Elec
(KWh)Elec Cost £
Energy cost Inc
FIT
Wall Insulation price £/m2
Roof Insulation price £/m2
Total Insulation
price £
PV cost £
Fabric cost £
Operational CO2
(kgCO2/m2.yr)
PV ECO2
(kgCO2/m2.yr)
Insulation ECO2
(kgCO2/m2.yr)
Total CO2
(kgCO2/m2.yr)CO2 saving
%
Energy saving (A)
£
Value of external footprint
area £
PV(A) £
NPV £
0 0 18.73 32.85 3.51 0 0 0 11957.4 14270.36 66.00 46.00 143460.00 0.00 143460.00 21.59 0.00 0.66 22.25 0.00 0.00 0.00 0.0025% 190 15 24.6375 3.51 25073.559 60344.37639 0 8448.2127 10373.253 79.00 55.00 171678.00 35168.82 206846.82 15.80 0.71 1.62 18.13 18.52 3897.11 110175.00 -523056.61 -586443.4350% 382 15 16.425 3.51 50411.0502 41744.91709 6740.0973 5540.984 7466.024 79.00 55.00 171678.00 70337.65 242015.65 10.69 1.42 1.62 13.73 38.28 6804.34 110175.00 -454768.77 -553324.4275% 573 15 8.2125 3.51 75616.5753 31431.65212 21630.292 3427.0682 5352.1082 79.00 55.00 171678.00 105506.47 277184.47 5.61 2.13 1.62 9.36 57.94 8918.25 110175.00 -405115.04 -538839.51100% 764 15 0 3.51 100822.1 25097.89092 40453.352 1693.3039 3618.3439 79.00 55.00 171678.00 140675.29 312353.29 0.53 2.84 1.62 4.99 77.56 10652.02 110175.00 -364390.69 -533283.98100% 764 15 0 3.51 100822.1 25097.89092 40453.352 -531.6305 1393.4095 79.00 55.00 171678.00 140675.29 312353.29 0.53 2.84 2.62 5.99 73.06 12876.95 110175.00 -312129.25 -481022.55
Carbon offsetting 987 15.52 0 3.51 130250.541 20087.83418 64913.322 -108.8027 1870.3173 79.00 55.00 171678.00 214530.30 386208.30 -5.31 3.67 1.62 -0.02 100.09 12400.04 110175.00 -323331.33 -566079.63Carbon offsetting 987 15.52 0 3.51 130250.541 20087.83418 64913.322 -3679.035 -1699.915 79.00 55.00 171678.00 214530.30 386208.30 -5.31 3.67 1.62 -0.02 100.09 15970.28 110175.00 -239470.20 -482218.51
provided Elec. by PV
PV area m2
Heating (KWh/m2)
Lighting (KWh/m2)
Hot water (KWh/m2)
generated Elec by PV
(KWh)
purchased from grid
elec (KWh)
Exported Elec
(KWh)Elec Cost £
Energy cost Inc
FIT
Wall Insulation price £/m2
Roof Insulation price £/m2
Total Insulation
price £
PV cost £
Fabric cost £
Operational CO2
(kgCO2/m2.yr)
PV ECO2
(kgCO2/m2.yr)
Insulation ECO2
(kgCO2/m2.yr)
Total CO2
(kgCO2/m2.yr)CO2 saving
%
Energy saving (A)
£
Value of external footprint
area £
PV(A) £
NPV £
0 0 18.73 32.85 3.51 0 0 0 11957.4 14270.36 66.00 46.00 143460.00 0.00 143460.00 21.59 0.00 0.66 22.25 0.00 0.00 0.00 0.0025% 190 14.2 24.6375 3.51 25073.559 60344.37639 0 8448.2127 10290.053 82.00 57.00 178140.00 35168.82 213308.82 15.65 0.71 1.72 18.07 18.78 3980.31 115825.00 -614222.88 -684071.7050% 382 14.2 16.425 3.51 50411.0502 41744.91709 6740.0973 5540.984 7382.824 82.00 57.00 178140.00 70337.65 248477.65 10.53 1.42 1.72 13.68 38.54 6887.54 115825.00 -545935.04 -650952.6975% 573 14.2 8.2125 3.51 75616.5753 31431.65212 21630.292 3427.0682 5268.9082 82.00 57.00 178140.00 105506.47 283646.47 5.45 2.13 1.72 9.30 58.20 9001.45 115825.00 -496281.32 -636467.79100% 764 14.2 0 3.51 100822.1 25097.89092 40453.352 1693.3039 3535.1439 82.00 57.00 178140.00 140675.29 318815.29 0.37 2.84 1.72 4.94 77.81 10735.22 115825.00 -455556.96 -630912.26100% 764 14.2 0 3.51 100822.1 25097.89092 40453.352 -531.6305 1310.2095 82.00 57.00 178140.00 140675.29 318815.29 0.37 2.84 2.72 5.94 73.32 12960.15 115825.00 -403295.53 -578650.82
Carbon offsetting 980 14.2 0 3.51 129326.778 20219.3884 64122.722 -54.80812 1787.0319 82.00 57.00 178140.00 213008.81 391148.81 -5.39 3.65 1.72 -0.02 100.08 12483.33 115825.00 -414495.60 -662184.41Carbon offsetting 980 14.2 0 3.51 129326.778 20219.3884 64122.722 -3581.558 -1739.718 82.00 57.00 178140.00 213008.81 391148.81 -5.39 3.65 1.72 -0.02 100.08 16010.08 115825.00 -331655.84 -579344.66
PV + 0.07 - 0.10
Office-London (City)
PV + 2010 notional building fabric
PV + 0.17 - 0.24
PV + 0.15 - 0.21
PV + 0.13 - 0.19
PV + 0.12 - 0.17
PV + 0.11 - 0.15
PV + 0.08 - 0.11
PV (future FiT) + Insulation

228
Table B. 35 Office - PV (current FiT) + improving the building fabric U-value down to 0.07-0.1 W/m2.K (PUR) + TSC– taking into account the rental loss/gain- City
provided Elec. & heating
TSC area m2
PV area m2
Heating (KWh/m2)
Lighting (KWh/m2)
Hot water (KWh/m2)
TSC fan power
(KWh/m2)
generated Elec by PV
(KWh)
purchased from grid
elec (KWh)
Exported Elec (KWh)
Elec cost £
Energy cost Inc
FIT £
Wall Insulation price £/m2
Roof Insulation price £/m2
Total Insulation
price £
TSC cost £
PV Cost £Fabric cost
£
Operational CO2
(kgCO2/m2.yr)
PV ECO2
(kgCO2/m2.yr)
TSC ECO2
(kgCO2/m2.yr)
Insulation ECO2
(kgCO2/m2.yr)
Total CO2
(kgCO2/m2.yr)CO2 saving
%
Energy saving (A)
£
Value of external footprint
area £
PV(A) £
NPV £
0 0 0 18.73 32.85 3.51 0 0 0 0 11957.4 14270.36 66.00 46.00 143460.00 0.00 0.00 143460.00 21.59 0.00 0.00 0.66 22.25 0.00 0.00 72885.00 0.00 0.0025% 75 190 14.04 24.6375 3.51 0.0938 25073.559 60344.3764 0 4812.547 6637.7466 66.00 46.00 143460.00 11250.00 35168.82 189878.82 15.66 0.71 0.04 0.66 17.07 23.30 7632.61 72885.00 179282.30 132863.4850% 200 382 9.365 16.425 3.51 0.1873 50411.0502 41744.9171 6740.09727 -1768.62 -429.6183 66.00 46.00 143460.00 30000.00 70337.65 243797.65 9.68 1.42 0.09 0.66 11.86 46.70 14699.98 72885.00 345287.49 244949.8475% 425 573 4.68 8.2125 3.51 0.281 75616.5753 31431.6521 21630.292 -7537.34 -6685.575 66.00 46.00 143460.00 63750.00 105506.47 312716.47 3.73 2.13 0.20 0.66 6.72 69.78 20955.94 72885.00 492233.54 322977.07100% 650 764 0 0 3.51 0.3746 100822.1 25097.8909 40453.3519 -12925.9 -12560.86 66.00 46.00 143460.00 97500.00 140675.29 381635.29 -2.21 2.84 0.31 0.66 1.60 92.82 26831.22 72885.00 630238.00 392062.70
Carbon offsetting
650 832 0 0 3.51 0.3746 109795.795 23243.862 47729.4021 -14814.1 -14449.03 66.00 46.00 143460.00 97500.00 180840.13 421800.13 -4.06 3.10 0.310.66
0.01 99.96 28719.39 72885.00 674589.23 396249.10
provided Elec. & heating
TSC area m2
PV area m2
Heating (KWh/m2)
Lighting (KWh/m2)
Hot water (KWh/m2)
TSC fan power
(KWh/m2)
generated Elec by PV
(KWh)
purchased from grid
elec (KWh)
Exported Elec (KWh)
Elec cost £
Energy cost Inc
FIT £
Wall Insulation price £/m2
Roof Insulation price £/m2
Total Insulation
price £
TSC cost £
PV Cost £Fabric cost
£
Operational CO2
(kgCO2/m2.yr)
PV ECO2
(kgCO2/m2.yr)
TSC ECO2
(kgCO2/m2.yr)
Insulation ECO2
(kgCO2/m2.yr)
Total CO2
(kgCO2/m2.yr)CO2 saving
%
Energy saving (A)
£
Value of external footprint
area £
PV(A) £
NPV £
0 0 0 18.73 32.85 3.51 0 0 0 0 11957.4 14270.36 66.00 46.00 143460.00 0.00 0.00 143460.00 21.59 0.00 0.00 0.66 22.25 0.00 0.00 0.00 0.0025% 72 190 13.53 24.6375 3.51 0.104 25073.559 60344.3764 0 4812.547 6584.7066 67.00 47.00 145830.00 10800.00 35168.82 191798.82 15.57 0.71 0.03 0.71 17.02 23.51 7685.65 76953.00 113481.35 65142.5350% 185 382 9.025 16.425 3.51 0.1941 50411.0502 41744.9171 6740.09727 -1768.62 -464.9783 67.00 47.00 145830.00 27750.00 70337.65 243917.65 9.62 1.42 0.09 0.71 11.84 46.79 14735.34 76953.00 279071.26 178613.6175% 410 573 4.51 8.2125 3.51 0.2844 75616.5753 31431.6521 21630.292 -7537.34 -6703.255 67.00 47.00 145830.00 61500.00 105506.47 312836.47 3.70 2.13 0.19 0.71 6.74 69.73 20973.62 76953.00 425602.02 256225.55100% 630 764 0 0 3.51 0.3746 100822.1 25097.8909 40453.3519 -12925.9 -12560.86 67.00 47.00 145830.00 94500.00 140675.29 381005.29 -2.21 2.84 0.30 0.71 1.64 92.64 26831.22 76953.00 563191.19 325645.90
Carbon offsetting
630 835 0 0 3.51 0.3746 110191.694 23173.84 48054.8151 -14895.9 -14530.88 67.00 47.00 145830.00 94500.00 181492.20 421822.20 -4.14 3.11 0.30 0.71 -0.02 100.09 28801.24 76953.00 609465.05 331102.85
provided Elec. & heating
TSC area m2
PV area m2
Heating (KWh/m2)
Lighting (KWh/m2)
Hot water (KWh/m2)
TSC fan power
(KWh/m2)
generated Elec by PV
(KWh)
purchased from grid
elec (KWh)
Exported Elec (KWh)
Elec cost £
Energy cost Inc
FIT £
Wall Insulation price £/m2
Roof Insulation price £/m2
Total Insulation
price £
TSC cost £
PV Cost £Fabric cost
£
Operational CO2
(kgCO2/m2.yr)
PV ECO2
(kgCO2/m2.yr)
TSC ECO2
(kgCO2/m2.yr)
Insulation ECO2
(kgCO2/m2.yr)
Total CO2
(kgCO2/m2.yr)CO2 saving
%
Energy saving (A)
£
Value of external footprint
area £
PV(A) £
NPV £
0 0 0 18.73 32.85 3.51 0 0 0 0 11957.4 14270.36 66.00 46.00 143460.00 0.00 0.00 143460.00 21.59 0.00 0.00 0.66 22.25 0.00 0.00 0.00 0.0025% 69 190 12.78 24.6375 3.51 0.119 25073.559 60344.3764 0 4812.547 6506.7066 68.50 48.00 149061.00 10350.00 35168.82 194579.82 15.43 0.71 0.03 0.81 16.98 23.69 7763.65 81360.00 42679.46 -8440.3650% 172 382 8.52 16.425 3.51 0.2042 50411.0502 41744.9171 6740.09727 -1768.62 -517.4983 68.50 48.00 149061.00 25800.00 70337.65 245198.65 9.53 1.42 0.08 0.81 11.84 46.78 14787.86 81360.00 207670.87 105932.2275% 400 573 4.26 8.2125 3.51 0.2894 75616.5753 31431.6521 21630.292 -7537.34 -6729.255 68.50 48.00 149061.00 60000.00 105506.47 314567.47 3.65 2.13 0.19 0.81 6.78 69.51 20999.62 81360.00 353578.70 182471.23100% 615 764 0 0 3.51 0.3746 100822.1 25097.8909 40453.3519 -12925.9 -12560.86 68.50 48.00 149061.00 92250.00 140675.29 381986.29 -2.21 2.84 0.29 0.81 1.73 92.22 26831.22 81360.00 490557.16 252030.86
Carbon offsetting
615 838 0 0 3.51 0.3746 110587.592 23103.818 48380.2282 -14977.8 -14612.74 68.50 48.00 149061.00 92250.00 182144.27 423455.27 -4.22 3.12 0.29 0.81 0.01 99.98 28883.10 81360.00 538753.63 258758.36
provided Elec. & heating
TSC area m2
PV area m2
Heating (KWh/m2)
Lighting (KWh/m2)
Hot water (KWh/m2)
TSC fan power
(KWh/m2)
generated Elec by PV
(KWh)
purchased from grid
elec (KWh)
Exported Elec (KWh)
Elec cost £
Energy cost Inc
FIT £
Wall Insulation price £/m2
Roof Insulation price £/m2
Total Insulation
price £
TSC cost £
PV Cost £Fabric cost
£
Operational CO2
(kgCO2/m2.yr)
PV ECO2
(kgCO2/m2.yr)
TSC ECO2
(kgCO2/m2.yr)
Insulation ECO2
(kgCO2/m2.yr)
Total CO2
(kgCO2/m2.yr)CO2 saving
%
Energy saving (A)
£
Value of external footprint
area £
PV(A) £
NPV £
0 0 0 18.73 32.85 3.51 0 0 0 0 11957.4 14270.36 66.00 46.00 143460.00 0.00 0.00 143460.00 21.59 0.00 0.00 0.66 22.25 0.00 0.00 0.00 0.0025% 66 190 12.36 24.6375 3.51 0.1274 25073.559 60344.3764 0 4812.547 6463.0266 70.00 49.00 152292.00 9900.00 35168.82 197360.82 15.35 0.71 0.03 0.91 17.00 23.60 7807.33 84750.00 -12166.88 -66067.7050% 165 382 8.24 16.425 3.51 0.2098 50411.0502 41744.9171 6740.09727 -1768.62 -546.6183 70.00 49.00 152292.00 24750.00 70337.65 247379.65 9.48 1.42 0.08 0.91 11.89 46.58 14816.98 84750.00 152482.53 48562.8875% 392 573 4.12 8.2125 3.51 0.2922 75616.5753 31431.6521 21630.292 -7537.34 -6743.815 70.00 49.00 152292.00 58800.00 105506.47 316598.47 3.63 2.13 0.19 0.91 6.86 69.19 21014.18 84750.00 298048.36 124909.89100% 605 764 0 0 3.51 0.3746 100822.1 25097.8909 40453.3519 -12925.9 -12560.86 70.00 49.00 152292.00 90750.00 140675.29 383717.29 -2.21 2.84 0.29 0.91 1.83 91.79 26831.22 84750.00 434684.82 194427.53
Carbon offsetting
605 843 0 0 3.51 0.3746 111247.422 22987.1147 48922.5833 -15114.2 -14749.16 70.00 49.00 152292.00 90750.00 183231.05 426273.05 -4.35 3.14 0.29 0.91 -0.01 100.06 29019.52 84750.00 486085.66 203272.61
provided Elec. & heating
TSC area m2
PV area m2
Heating (KWh/m2)
Lighting (KWh/m2)
Hot water (KWh/m2)
TSC fan power
(KWh/m2)
generated Elec by PV
(KWh)
purchased from grid
elec (KWh)
Exported Elec (KWh)
Elec cost £
Energy cost Inc
FIT £
Wall Insulation price £/m2
Roof Insulation price £/m2
Total Insulation
price £
TSC cost £
PV Cost £Fabric cost
£
Operational CO2
(kgCO2/m2.yr)
PV ECO2
(kgCO2/m2.yr)
TSC ECO2
(kgCO2/m2.yr)
Insulation ECO2
(kgCO2/m2.yr)
Total CO2
(kgCO2/m2.yr)CO2 saving
%
Energy saving (A)
£
Value of external footprint
area £
PV(A) £
NPV £
0 0 0 18.73 32.85 3.51 0 0 0 0 11957.4 14270.36 66.00 46.00 143460.00 0.00 0.00 143460.00 21.59 0.00 0.00 0.66 22.25 0.00 0.00 0.00 0.0025% 63 190 12 24.6375 3.51 0.1346 25073.559 60344.3764 0 4812.547 6425.5866 71.50 50.00 155523.00 9450.00 35168.82 200141.82 15.29 0.71 0.03 1.01 17.03 23.45 7844.77 88140.00 -67159.78 -123841.6150% 160 382 8 16.425 3.51 0.2146 50411.0502 41744.9171 6740.09727 -1768.62 -571.5783 71.50 50.00 155523.00 24000.00 70337.65 249860.65 9.43 1.42 0.08 1.01 11.94 46.35 14841.94 88140.00 97196.48 -9204.1775% 382 573 4 8.2125 3.51 0.2946 75616.5753 31431.6521 21630.292 -7537.34 -6756.295 71.50 50.00 155523.00 57300.00 105506.47 318329.47 3.60 2.13 0.18 1.01 6.93 68.87 21026.66 88140.00 242469.17 67599.70100% 595 764 0 0 3.51 0.3746 100822.1 25097.8909 40453.3519 -12925.9 -12560.86 71.50 50.00 155523.00 89250.00 140675.29 385448.29 -2.21 2.84 0.28 1.01 1.92 91.36 26831.22 88140.00 378812.49 136824.20
Carbon offsetting
595 846 0 0 3.51 0.3746 111775.287 22893.7521 49356.4674 -15223.3 -14858.29 71.50 50.00 155523.00 89250.00 184100.47 428873.47 -4.45 3.15 0.28 1.01 -0.01 100.06 29128.65 88140.00 432776.82 147363.34
provided Elec. & heating
TSC area m2
PV area m2
Heating (KWh/m2)
Lighting (KWh/m2)
Hot water (KWh/m2)
TSC fan power
(KWh/m2)
generated Elec by PV
(KWh)
purchased from grid
elec (KWh)
Exported Elec (KWh)
Elec cost £
Energy cost Inc
FIT £
Wall Insulation price £/m2
Roof Insulation price £/m2
Total Insulation
price £
TSC cost £
PV Cost £Fabric cost
£
Operational CO2
(kgCO2/m2.yr)
PV ECO2
(kgCO2/m2.yr)
TSC ECO2
(kgCO2/m2.yr)
Insulation ECO2
(kgCO2/m2.yr)
Total CO2
(kgCO2/m2.yr)CO2 saving
%
Energy saving (A)
£
Value of external footprint
area £
PV(A) £
NPV £
0 0 0 18.73 32.85 3.51 0 0 0 0 11957.4 14270.36 66.00 46.00 143460.00 0.00 0.00 143460.00 21.59 0.00 0.00 0.66 22.25 0.00 0.00 0.00 0.0025% 60 190 11.64 24.6375 3.51 0.1418 25073.559 60344.3764 0 4812.547 6388.1466 73.00 51.00 158754.00 9000.00 35168.82 202922.82 15.22 0.71 0.03 1.11 17.07 23.31 7882.21 93225.00 -150088.86 -209551.6850% 156 382 7.76 16.425 3.51 0.2194 50411.0502 41744.9171 6740.09727 -1768.62 -596.5383 73.00 51.00 158754.00 23400.00 70337.65 252491.65 9.39 1.42 0.07 1.11 11.99 46.10 14866.90 93225.00 13974.26 -95057.3875% 377 573 3.88 8.2125 3.51 0.297 75616.5753 31431.6521 21630.292 -7537.34 -6768.775 73.00 51.00 158754.00 56550.00 105506.47 320810.47 3.58 2.13 0.18 1.11 7.00 68.53 21039.14 93225.00 158953.81 -18396.66100% 589 764 0 0 3.51 0.3746 100822.1 25097.8909 40453.3519 -12925.9 -12560.86 73.00 51.00 158754.00 88350.00 140675.29 387779.29 -2.21 2.84 0.28 1.11 2.02 90.93 26831.22 93225.00 295003.99 50684.69
Carbon offsetting
589 851 0 0 3.51 0.3746 112303.151 22800.3895 49790.3514 -15332.5 -14967.43 73.00 51.00 158754.00 88350.00 184969.90 432073.90 -4.56 3.17 0.28 1.11 0.00 100.02 29237.79 93225.00 351531.80 62917.91
provided Elec. & heating
TSC area m2
PV area m2
Heating (KWh/m2)
Lighting (KWh/m2)
Hot water (KWh/m2)
TSC fan power
(KWh/m2)
generated Elec by PV
(KWh)
purchased from grid
elec (KWh)
Exported Elec (KWh)
Elec cost £
Energy cost Inc
FIT £
Wall Insulation price £/m2
Roof Insulation price £/m2
Total Insulation
price £
TSC cost £
PV Cost £Fabric cost
£
Operational CO2
(kgCO2/m2.yr)
PV ECO2
(kgCO2/m2.yr)
TSC ECO2
(kgCO2/m2.yr)
Insulation ECO2
(kgCO2/m2.yr)
Total CO2
(kgCO2/m2.yr)CO2 saving
%
Energy saving (A)
£
Value of external footprint
area £
PV(A) £
NPV £
0 0 0 18.73 32.85 3.51 0 0 0 0 11957.4 14270.36 66.00 46.00 143460.00 0.00 0.00 143460.00 21.59 0.00 0.00 0.66 22.25 0.00 0.00 0.00 0.0025% 57 190 11.25 24.6375 3.51 0.1496 25073.559 60344.3764 0 4812.547 6347.5866 79.00 55.00 171678.00 8550.00 35168.82 215396.82 15.15 0.71 0.03 1.62 17.50 21.35 7922.77 110175.00 -428497.82 -500434.6450% 153 382 7.5 16.425 3.51 0.2246 50411.0502 41744.9171 6740.09727 -1768.62 -623.5783 79.00 55.00 171678.00 22950.00 70337.65 264965.65 9.34 1.42 0.07 1.62 12.45 44.04 14893.94 110175.00 -264752.27 -386257.9175% 371 573 3.75 8.2125 3.51 0.2996 75616.5753 31431.6521 21630.292 -7537.34 -6782.295 79.00 55.00 171678.00 55650.00 105506.47 332834.47 3.56 2.13 0.18 1.62 7.49 66.36 21052.66 110175.00 -120090.29 -309464.76100% 582 764 0 0 3.51 0.3746 100822.1 25097.8909 40453.3519 -12925.9 -12560.86 79.00 55.00 171678.00 87300.00 140675.29 399653.29 -2.21 2.84 0.28 1.62 2.53 88.65 26831.22 110175.00 15642.32 -240550.98
Carbon offsetting
582 873 0 0 3.51 0.3746 115206.405 22286.8949 52176.7139 -15932.7 -15567.68 79.00 55.00 171678.00 87300.00 189751.73 448729.73 -5.15 3.25 0.28 1.62 0.00 100.00 29838.04 110175.00 86269.33 -219000.40
provided Elec. & heating
TSC area m2
PV area m2
Heating (KWh/m2)
Lighting (KWh/m2)
Hot water (KWh/m2)
TSC fan power
(KWh/m2)
generated Elec by PV
(KWh)
purchased from grid
elec (KWh)
Exported Elec (KWh)
Elec cost £
Energy cost Inc
FIT £
Wall Insulation price £/m2
Roof Insulation price £/m2
Total Insulation
price £
TSC cost £
PV Cost £Fabric cost
£
Operational CO2
(kgCO2/m2.yr)
PV ECO2
(kgCO2/m2.yr)
TSC ECO2
(kgCO2/m2.yr)
Insulation ECO2
(kgCO2/m2.yr)
Total CO2
(kgCO2/m2.yr)CO2 saving
%
Energy saving (A)
£
Value of external footprint
area £
PV(A) £
NPV £
0 0 0 18.73 32.85 3.51 0 0 0 0 11957.4 14270.36 66.00 46.00 143460.00 0.00 0.00 143460.00 21.59 0.00 0.00 0.66 22.25 0.00 0.00 0.00 0.0025% 55 190 10.65 24.6375 3.51 0.1616 25073.559 60344.3764 0 4812.547 6285.1866 82.00 57.00 178140.00 8250.00 35168.82 221558.82 15.04 0.71 0.03 1.72 17.49 21.40 7985.17 115825.00 -520152.66 -598251.4950% 150 382 7.1 16.425 3.51 0.2326 50411.0502 41744.9171 6740.09727 -1768.62 -665.1783 82.00 57.00 178140.00 22500.00 70337.65 270977.65 9.26 1.42 0.07 1.72 12.48 43.93 14935.54 115825.00 -356895.68 -484413.3375% 365 573 3.55 8.2125 3.51 0.3036 75616.5753 31431.6521 21630.292 -7537.34 -6803.095 82.00 57.00 178140.00 54750.00 105506.47 338396.47 3.52 2.13 0.17 1.72 7.55 66.09 21073.46 115825.00 -212722.28 -407658.75100% 575 764 0 0 3.51 0.3746 100822.1 25097.8909 40453.3519 -12925.9 -12560.86 82.00 57.00 178140.00 86250.00 140675.29 405065.29 -2.21 2.84 0.27 1.72 2.62 88.21 26831.22 115825.00 -77478.24 -339083.54
Carbon offsetting
575 878 0 0 3.51 0.3746 115866.236 22170.1916 52719.069 -16069.1 -15704.1 82.00 57.00 178140.00 86250.00 190838.51 455228.51 -5.28 3.27 0.27 1.72 -0.02 100.08 29974.46 115825.00 -3646.86 -315415.37
TSC + PV + 0.08 - 0.11
TSC + PV + 0.07 - 0.10
Office-London (City)
TSC + PV + 2010 notional building fabric
TSC + PV + 0.17 - 0.24
TSC + PV + 0.15 - 0.21
TSC + PV + 0.13 - 0.19
TSC + PV + 0.12 - 0.17
TSC + PV + 0.11 - 0.15
PV (current FiT) + Insulation + TSC

229
Table B. 36 Office - PV (future FiT) + improving the building fabric U-value down to 0.07-0.1 W/m2.K (PUR) + TSC– taking into account the rental loss/gain- City
provided Elec. & heating
TSC area m2
PV area m2
Heating (KWh/m2)
Lighting (KWh/m2)
Hot water (KWh/m2)
TSC fan power
(KWh/m2)
generated Elec by PV
(KWh)
purchased from grid
elec (KWh)
Exported Elec
(KWh)
Elec cost £
Energy cost Inc
FIT £
Wall Insulation price £/m2
Roof Insulation price £/m2
Total Insulation
price £
TSC cost £
PV Cost £Fabric cost
£
Operational CO2
(kgCO2/m2.yr)
PV ECO2
(kgCO2/m2.yr)
TSC ECO2
(kgCO2/m2.yr)
Insulation ECO2
(kgCO2/m2.yr)
Total CO2
(kgCO2/m2.yr)CO2 saving
%
Energy saving (A)
£
Value of external footprint
area £
PV(A) £
NPV £
0 0 0 18.73 32.85 3.51 0 0 0 0 11957.4 14270.36 66.00 46.00 143460.00 0.00 0.00 143460.00 21.59 0.00 0.00 0.66 22.25 0.00 0.00 72885.00 0.00 0.0025% 75 190 14.04 24.6375 3.51 0.0938 25073.559 60344.3764 0 8448.213 10273.413 66.00 46.00 143460.00 11250.00 35168.82 189878.82 15.66 0.71 0.04 0.66 17.07 23.30 3996.95 72885.00 93884.21 47465.3950% 200 382 9.365 16.425 3.51 0.1873 50411.0502 41744.9171 6740.0973 5540.984 6879.984 66.00 46.00 143460.00 30000.00 70337.65 243797.65 9.68 1.42 0.09 0.66 11.86 46.70 7390.38 72885.00 173592.39 73254.7475% 425 573 4.68 8.2125 3.51 0.281 75616.5753 31431.6521 21630.292 3427.068 4278.8282 66.00 46.00 143460.00 63750.00 105506.47 312716.47 3.73 2.13 0.20 0.66 6.72 69.78 9991.53 72885.00 234690.89 65434.42100% 650 764 0 0 3.51 0.3746 100822.1 25097.8909 40453.352 1693.304 2058.3439 66.00 46.00 143460.00 97500.00 140675.29 381635.29 -2.21 2.84 0.31 0.66 1.60 92.82 12212.02 72885.00 286847.80 48672.50
Carbon offsetting
650 832 0 0 3.51 0.3746 109795.795 23243.862 47729.402 1106.318 1471.3576 66.00 46.00 143460.00 97500.00 180840.13 421800.13 -4.06 3.10 0.31 0.66 0.01 99.96 12799.00 72885.00 300635.51 22295.37
Carbon offsetting
650 832 0 0 3.51 0.3746 109795.795 23243.862 47729.402 -1518.8 -1153.76 66.00 46.00 143460.00 97500.00 180840.13 421800.13 -4.06 3.10 0.310.66
0.01 99.96 15424.12 72885.00 362296.83 83956.70
provided Elec. & heating
TSC area m2
PV area m2
Heating (KWh/m2)
Lighting (KWh/m2)
Hot water (KWh/m2)
TSC fan power
(KWh/m2)
generated Elec by PV
(KWh)
purchased from grid
elec (KWh)
Exported Elec
(KWh)
Elec cost £
Energy cost Inc
FIT £
Wall Insulation price £/m2
Roof Insulation price £/m2
Total Insulation
price £
TSC cost £
PV Cost £Fabric cost
£
Operational CO2
(kgCO2/m2.yr)
PV ECO2
(kgCO2/m2.yr)
TSC ECO2
(kgCO2/m2.yr)
Insulation ECO2
(kgCO2/m2.yr)
Total CO2
(kgCO2/m2.yr)CO2 saving
%
Energy saving (A)
£
Value of external footprint
area £
PV(A) £
NPV £
0 0 0 18.73 32.85 3.51 0 0 0 0 11957.4 14270.36 66.00 46.00 143460.00 0.00 0.00 143460.00 21.59 0.00 0.00 0.66 22.25 0.00 0.00 0.00 0.0025% 72 190 13.53 24.6375 3.51 0.104 25073.559 60344.3764 0 8448.213 10220.373 67.00 47.00 145830.00 10800.00 35168.82 191798.82 15.57 0.71 0.03 0.71 17.02 23.51 4049.99 76953.00 28083.27 -20255.5650% 185 382 9.025 16.425 3.51 0.1941 50411.0502 41744.9171 6740.0973 5540.984 6844.624 67.00 47.00 145830.00 27750.00 70337.65 243917.65 9.62 1.42 0.09 0.71 11.84 46.79 7425.74 76953.00 107376.16 6918.5175% 410 573 4.51 8.2125 3.51 0.2844 75616.5753 31431.6521 21630.292 3427.068 4261.1482 67.00 47.00 145830.00 61500.00 105506.47 312836.47 3.70 2.13 0.19 0.71 6.74 69.73 10009.21 76953.00 168059.37 -1317.10100% 630 764 0 0 3.51 0.3746 100822.1 25097.8909 40453.352 1693.304 2058.3439 67.00 47.00 145830.00 94500.00 140675.29 381005.29 -2.21 2.84 0.30 0.71 1.64 92.64 12212.02 76953.00 219801.00 -17744.30
Carbon offsetting
630 835 0 0 3.51 0.3746 110191.694 23173.84 48054.815 1081.871 1446.9109 67.00 47.00 145830.00 94500.00 181492.20 421822.20 -4.14 3.11 0.30 0.71 -0.02 100.09 12823.45 76953.00 234162.93 -44199.27
Carbon offsetting
630 835 0 0 3.51 0.3746 110191.694 23173.84 48054.815 -1561.14 -1196.104 67.00 47.00 145830.00 94500.00 181492.20 421822.20 -4.14 3.11 0.30 0.71 -0.02 100.09 15466.46 76953.00 296244.65 17882.45
provided Elec. & heating
TSC area m2
PV area m2
Heating (KWh/m2)
Lighting (KWh/m2)
Hot water (KWh/m2)
TSC fan power
(KWh/m2)
generated Elec by PV
(KWh)
purchased from grid
elec (KWh)
Exported Elec
(KWh)
Elec cost £
Energy cost Inc
FIT £
Wall Insulation price £/m2
Roof Insulation price £/m2
Total Insulation
price £
TSC cost £
PV Cost £Fabric cost
£
Operational CO2
(kgCO2/m2.yr)
PV ECO2
(kgCO2/m2.yr)
TSC ECO2
(kgCO2/m2.yr)
Insulation ECO2
(kgCO2/m2.yr)
Total CO2
(kgCO2/m2.yr)CO2 saving
%
Energy saving (A)
£
Value of external footprint
area £
PV(A) £
NPV £
0 0 0 18.73 32.85 3.51 0 0 0 0 11957.4 14270.36 66.00 46.00 143460.00 0.00 0.00 143460.00 21.59 0.00 0.00 0.66 22.25 0.00 0.00 0.00 0.0025% 69 190 12.78 24.6375 3.51 0.119 25073.559 60344.3764 0 8448.213 10142.373 68.50 48.00 149061.00 10350.00 35168.82 194579.82 15.43 0.71 0.03 0.81 16.98 23.69 4127.99 81360.00 -42718.63 -93838.4550% 172 382 8.52 16.425 3.51 0.2042 50411.0502 41744.9171 6740.0973 5540.984 6792.104 68.50 48.00 149061.00 25800.00 70337.65 245198.65 9.53 1.42 0.08 0.81 11.84 46.78 7478.26 81360.00 35975.77 -65762.8875% 400 573 4.26 8.2125 3.51 0.2894 75616.5753 31431.6521 21630.292 3427.068 4235.1482 68.50 48.00 149061.00 60000.00 105506.47 314567.47 3.65 2.13 0.19 0.81 6.78 69.51 10035.21 81360.00 96036.05 -75071.42100% 615 764 0 0 3.51 0.3746 100822.1 25097.8909 40453.352 1693.304 2058.3439 68.50 48.00 149061.00 92250.00 140675.29 381986.29 -2.21 2.84 0.29 0.81 1.73 92.22 12212.02 81360.00 147166.96 -91359.33
Carbon offsetting
615 838 0 0 3.51 0.3746 110587.592 23103.818 48380.228 1057.424 1422.4643 68.50 48.00 149061.00 92250.00 182144.27 423455.27 -4.22 3.12 0.29 0.81 0.01 99.98 12847.90 81360.00 162103.12 -117892.14
Carbon offsetting
615 838 0 0 3.51 0.3746 110587.592 23103.818 48380.228 -1603.49 -1238.448 68.50 48.00 149061.00 92250.00 182144.27 423455.27 -4.22 3.12 0.29 0.81 0.01 99.98 15508.81 81360.00 224605.25 -55390.02
provided Elec. & heating
TSC area m2
PV area m2
Heating (KWh/m2)
Lighting (KWh/m2)
Hot water (KWh/m2)
TSC fan power
(KWh/m2)
generated Elec by PV
(KWh)
purchased from grid
elec (KWh)
Exported Elec
(KWh)
Elec cost £
Energy cost Inc
FIT £
Wall Insulation price £/m2
Roof Insulation price £/m2
Total Insulation
price £
TSC cost £
PV Cost £Fabric cost
£
Operational CO2
(kgCO2/m2.yr)
PV ECO2
(kgCO2/m2.yr)
TSC ECO2
(kgCO2/m2.yr)
Insulation ECO2
(kgCO2/m2.yr)
Total CO2
(kgCO2/m2.yr)CO2 saving
%
Energy saving (A)
£
Value of external footprint
area £
PV(A) £
NPV £
0 0 0 18.73 32.85 3.51 0 0 0 0 11957.4 14270.36 66.00 46.00 143460.00 0.00 0.00 143460.00 21.59 0.00 0.00 0.66 22.25 0.00 0.00 0.00 0.0025% 66 190 12.36 24.6375 3.51 0.1274 25073.559 60344.3764 0 8448.213 10098.693 70.00 49.00 152292.00 9900.00 35168.82 197360.82 15.35 0.71 0.03 0.91 17.00 23.60 4171.67 84750.00 -97564.96 -151465.7950% 165 382 8.24 16.425 3.51 0.2098 50411.0502 41744.9171 6740.0973 5540.984 6762.984 70.00 49.00 152292.00 24750.00 70337.65 247379.65 9.48 1.42 0.08 0.91 11.89 46.58 7507.38 84750.00 -19212.57 -123132.2275% 392 573 4.12 8.2125 3.51 0.2922 75616.5753 31431.6521 21630.292 3427.068 4220.5882 70.00 49.00 152292.00 58800.00 105506.47 316598.47 3.63 2.13 0.19 0.91 6.86 69.19 10049.77 84750.00 40505.72 -132632.76100% 605 764 0 0 3.51 0.3746 100822.1 25097.8909 40453.352 1693.304 2058.3439 70.00 49.00 152292.00 90750.00 140675.29 383717.29 -2.21 2.84 0.29 0.91 1.83 91.79 12212.02 84750.00 91294.63 -148962.67
Carbon offsetting
605 843 0 0 3.51 0.3746 111247.422 22987.1147 48922.583 1016.68 1381.7198 70.00 49.00 152292.00 90750.00 183231.05 426273.05 -4.35 3.14 0.29 0.91 -0.01 100.06 12888.64 84750.00 107187.84 -175625.21
Carbon offsetting
605 843 0 0 3.51 0.3746 111247.422 22987.1147 48922.583 -1674.06 -1309.022 70.00 49.00 152292.00 90750.00 183231.05 426273.05 -4.35 3.14 0.29 0.91 -0.01 100.06 15579.38 84750.00 170390.62 -112422.43
provided Elec. & heating
TSC area m2
PV area m2
Heating (KWh/m2)
Lighting (KWh/m2)
Hot water (KWh/m2)
TSC fan power
(KWh/m2)
generated Elec by PV
(KWh)
purchased from grid
elec (KWh)
Exported Elec
(KWh)
Elec cost £
Energy cost Inc
FIT £
Wall Insulation price £/m2
Roof Insulation price £/m2
Total Insulation
price £
TSC cost £
PV Cost £Fabric cost
£
Operational CO2
(kgCO2/m2.yr)
PV ECO2
(kgCO2/m2.yr)
TSC ECO2
(kgCO2/m2.yr)
Insulation ECO2
(kgCO2/m2.yr)
Total CO2
(kgCO2/m2.yr)CO2 saving
%
Energy saving (A)
£
Value of external footprint
area £
PV(A) £
NPV £
0 0 0 18.73 32.85 3.51 0 0 0 0 11957.4 14270.36 66.00 46.00 143460.00 0.00 0.00 143460.00 21.59 0.00 0.00 0.66 22.25 0.00 0.00 0.00 0.0025% 63 190 12 24.6375 3.51 0.1346 25073.559 60344.3764 0 8448.213 10061.253 71.50 50.00 155523.00 9450.00 35168.82 200141.82 15.29 0.71 0.03 1.01 17.03 23.45 4209.11 88140.00 -152557.87 -209239.6950% 160 382 8 16.425 3.51 0.2146 50411.0502 41744.9171 6740.0973 5540.984 6738.024 71.50 50.00 155523.00 24000.00 70337.65 249860.65 9.43 1.42 0.08 1.01 11.94 46.35 7532.34 88140.00 -74498.62 -180899.2775% 382 573 4 8.2125 3.51 0.2946 75616.5753 31431.6521 21630.292 3427.068 4208.1082 71.50 50.00 155523.00 57300.00 105506.47 318329.47 3.60 2.13 0.18 1.01 6.93 68.87 10062.25 88140.00 -15073.48 -189942.95100% 595 764 0 0 3.51 0.3746 100822.1 25097.8909 40453.352 1693.304 2058.3439 71.50 50.00 155523.00 89250.00 140675.29 385448.29 -2.21 2.84 0.28 1.01 1.92 91.36 12212.02 88140.00 35422.29 -206566.00
Carbon offsetting
595 846 0 0 3.51 0.3746 111775.287 22893.7521 49356.467 984.0843 1349.1243 71.50 50.00 155523.00 89250.00 184100.47 428873.47 -4.45 3.15 0.28 1.01 -0.01 100.06 12921.24 88140.00 52081.14 -233332.33
Carbon offsetting
595 846 0 0 3.51 0.3746 111775.287 22893.7521 49356.467 -1730.52 -1365.481 71.50 50.00 155523.00 89250.00 184100.47 428873.47 -4.45 3.15 0.28 1.01 -0.01 100.06 15635.84 88140.00 115844.46 -169569.02
provided Elec. & heating
TSC area m2
PV area m2
Heating (KWh/m2)
Lighting (KWh/m2)
Hot water (KWh/m2)
TSC fan power
(KWh/m2)
generated Elec by PV
(KWh)
purchased from grid
elec (KWh)
Exported Elec
(KWh)
Elec cost £
Energy cost Inc
FIT £
Wall Insulation price £/m2
Roof Insulation price £/m2
Total Insulation
price £
TSC cost £
PV Cost £Fabric cost
£
Operational CO2
(kgCO2/m2.yr)
PV ECO2
(kgCO2/m2.yr)
TSC ECO2
(kgCO2/m2.yr)
Insulation ECO2
(kgCO2/m2.yr)
Total CO2
(kgCO2/m2.yr)CO2 saving
%
Energy saving (A)
£
Value of external footprint
area £
PV(A) £
NPV £
0 0 0 18.73 32.85 3.51 0 0 0 0 11957.4 14270.36 66.00 46.00 143460.00 0.00 0.00 143460.00 21.59 0.00 0.00 0.66 22.25 0.00 0.00 0.00 0.0025% 60 190 11.64 24.6375 3.51 0.1418 25073.559 60344.3764 0 8448.213 10023.813 73.00 51.00 158754.00 9000.00 35168.82 202922.82 15.22 0.71 0.03 1.11 17.07 23.31 4246.55 93225.00 -235486.94 -294949.7750% 156 382 7.76 16.425 3.51 0.2194 50411.0502 41744.9171 6740.0973 5540.984 6713.064 73.00 51.00 158754.00 23400.00 70337.65 252491.65 9.39 1.42 0.07 1.11 11.99 46.10 7557.30 93225.00 -157720.84 -266752.4875% 377 573 3.88 8.2125 3.51 0.297 75616.5753 31431.6521 21630.292 3427.068 4195.6282 73.00 51.00 158754.00 56550.00 105506.47 320810.47 3.58 2.13 0.18 1.11 7.00 68.53 10074.73 93225.00 -98588.84 -275939.31100% 589 764 0 0 3.51 0.3746 100822.1 25097.8909 40453.352 1693.304 2058.3439 73.00 51.00 158754.00 88350.00 140675.29 387779.29 -2.21 2.84 0.28 1.11 2.02 90.93 12212.02 93225.00 -48386.21 -292705.50
Carbon offsetting
589 851 0 0 3.51 0.3746 112303.151 22800.3895 49790.351 951.4887 1316.5287 73.00 51.00 158754.00 88350.00 184969.90 432073.90 -4.56 3.17 0.28 1.11 0.00 100.02 12953.83 93225.00 -30961.73 -319575.62
Carbon offsetting
589 851 0 0 3.51 0.3746 112303.151 22800.3895 49790.351 -1786.98 -1421.941 73.00 51.00 158754.00 88350.00 184969.90 432073.90 -4.56 3.17 0.28 1.11 0.00 100.02 15692.30 93225.00 33362.12 -255251.77
provided Elec. & heating
TSC area m2
PV area m2
Heating (KWh/m2)
Lighting (KWh/m2)
Hot water (KWh/m2)
TSC fan power
(KWh/m2)
generated Elec by PV
(KWh)
purchased from grid
elec (KWh)
Exported Elec
(KWh)
Elec cost £
Energy cost Inc
FIT £
Wall Insulation price £/m2
Roof Insulation price £/m2
Total Insulation
price £
TSC cost £
PV Cost £Fabric cost
£
Operational CO2
(kgCO2/m2.yr)
PV ECO2
(kgCO2/m2.yr)
TSC ECO2
(kgCO2/m2.yr)
Insulation ECO2
(kgCO2/m2.yr)
Total CO2
(kgCO2/m2.yr)CO2 saving
%
Energy saving (A)
£
Value of external footprint
area £
PV(A) £
NPV £
0 0 0 18.73 32.85 3.51 0 0 0 0 11957.4 14270.36 66.00 46.00 143460.00 0.00 0.00 143460.00 21.59 0.00 0.00 0.66 22.25 0.00 0.00 0.00 0.0025% 57 190 11.25 24.6375 3.51 0.1496 25073.559 60344.3764 0 8448.213 9983.2527 79.00 55.00 171678.00 8550.00 35168.82 215396.82 15.15 0.71 0.03 1.62 17.50 21.35 4287.11 110175.00 -513895.90 -585832.7350% 153 382 7.5 16.425 3.51 0.2246 50411.0502 41744.9171 6740.0973 5540.984 6686.024 79.00 55.00 171678.00 22950.00 70337.65 264965.65 9.34 1.42 0.07 1.62 12.45 44.04 7584.34 110175.00 -436447.37 -557953.0175% 371 573 3.75 8.2125 3.51 0.2996 75616.5753 31431.6521 21630.292 3427.068 4182.1082 79.00 55.00 171678.00 55650.00 105506.47 332834.47 3.56 2.13 0.18 1.62 7.49 66.36 10088.25 110175.00 -377632.94 -567007.41100% 582 764 0 0 3.51 0.3746 100822.1 25097.8909 40453.352 1693.304 2058.3439 79.00 55.00 171678.00 87300.00 140675.29 399653.29 -2.21 2.84 0.28 1.62 2.53 88.65 12212.02 110175.00 -327747.88 -583941.18
Carbon offsetting
582 873 0 0 3.51 0.3746 115206.405 22286.8949 52176.714 772.2132 1137.2532 79.00 55.00 171678.00 87300.00 189751.73 448729.73 -5.15 3.25 0.28 1.62 0.00 100.00 13133.11 110175.00 -306112.40 -611382.13
Carbon offsetting
582 873 0 0 3.51 0.3746 115206.405 22286.8949 52176.714 -2097.51 -1732.466 79.00 55.00 171678.00 87300.00 189751.73 448729.73 -5.15 3.25 0.28 1.62 0.00 100.00 16002.83 110175.00 -238705.62 -543975.35
provided Elec. & heating
TSC area m2
PV area m2
Heating (KWh/m2)
Lighting (KWh/m2)
Hot water (KWh/m2)
TSC fan power
(KWh/m2)
generated Elec by PV
(KWh)
purchased from grid
elec (KWh)
Exported Elec
(KWh)
Elec cost £
Energy cost Inc
FIT £
Wall Insulation price £/m2
Roof Insulation price £/m2
Total Insulation
price £
TSC cost £
PV Cost £Fabric cost
£
Operational CO2
(kgCO2/m2.yr)
PV ECO2
(kgCO2/m2.yr)
TSC ECO2
(kgCO2/m2.yr)
Insulation ECO2
(kgCO2/m2.yr)
Total CO2
(kgCO2/m2.yr)CO2 saving
%
Energy saving (A)
£
Value of external footprint
area £
PV(A) £
NPV £
0 0 0 18.73 32.85 3.51 0 0 0 0 11957.4 14270.36 66.00 46.00 143460.00 0.00 0.00 143460.00 21.59 0.00 0.00 0.66 22.25 0.00 0.00 0.00 0.0025% 55 190 10.65 24.6375 3.51 0.1616 25073.559 60344.3764 0 8448.213 9920.8527 82.00 57.00 178140.00 8250.00 35168.82 221558.82 15.04 0.71 0.03 1.72 17.49 21.40 4349.51 115825.00 -605550.75 -683649.5750% 150 382 7.1 16.425 3.51 0.2326 50411.0502 41744.9171 6740.0973 5540.984 6644.424 82.00 57.00 178140.00 22500.00 70337.65 270977.65 9.26 1.42 0.07 1.72 12.48 43.93 7625.94 115825.00 -528590.78 -656108.4375% 365 573 3.55 8.2125 3.51 0.3036 75616.5753 31431.6521 21630.292 3427.068 4161.3082 82.00 57.00 178140.00 54750.00 105506.47 338396.47 3.52 2.13 0.17 1.72 7.55 66.09 10109.05 115825.00 -470264.92 -665201.39100% 575 764 0 0 3.51 0.3746 100822.1 25097.8909 40453.352 1693.304 2058.3439 82.00 57.00 178140.00 86250.00 140675.29 405065.29 -2.21 2.84 0.27 1.72 2.62 88.21 12212.02 115825.00 -420868.44 -682473.73
Carbon offsetting
575 878 0 0 3.51 0.3746 115866.236 22170.1916 52719.069 731.4687 1096.5087 82.00 57.00 178140.00 86250.00 190838.51 455228.51 -5.28 3.27 0.27 1.72 -0.02 100.08 13173.85 115825.00 -398275.91 -710044.42
Carbon offsetting
575 878 0 0 3.51 0.3746 115866.236 22170.1916 52719.069 -2168.08 -1803.04 82.00 57.00 178140.00 86250.00 190838.51 455228.51 -5.28 3.27 0.27 1.72 -0.02 100.08 16073.40 115825.00 -330168.47 -641936.98
TSC + PV + 0.08 - 0.11
TSC + PV + 0.07 - 0.10
Office-London (City)
TSC + PV + 2010 notional building fabric
TSC + PV + 0.17 - 0.24
TSC + PV + 0.15 - 0.21
TSC + PV + 0.13 - 0.19
TSC + PV + 0.12 - 0.17
TSC + PV + 0.11 - 0.15
PV (future FiT) + Insulation + TSC

230
Table B. 37 Office - PV (current FiT) + improving the building fabric U-value down to 0.07-0.1 W/m2.K (PUR) – taking into account the rental loss/gain- West-End
provided Elec. by PV
PV area m2
Heating (KWh/m2)
Lighting (KWh/m2)
Hot water (KWh/m2)
generated Elec by PV
(KWh)
purchased from grid
elec (KWh)
Exported Elec
(KWh)
Elec Cost £
Energy cost Inc FIT
Wall Insulation price £/m2
Roof Insulation price £/m2
Total Insulation
price £
PV cost £
Fabric cost £
Operational CO2
(kgCO2/m2.yr)
PV ECO2
(kgCO2/m2.yr)
Insulation ECO2
(kgCO2/m2.yr)
Total CO2
(kgCO2/m2.yr)CO2 saving
%
Energy saving (A)
£
Value of external footprint
area £
PV(A) £
NPV £
0 0 18.73 32.85 3.51 0 0 0 11957.4 14270.36 66.00 46.00 143460.00 0.00 143460.00 21.59 0.00 0.66 22.25 0.00 0.00 110940.00 0.00 0.0025% 190 18.73 24.6375 3.51 25073.559 60344.37639 0 4812.547 7125.50664 66.00 46.00 143460.00 35168.82 178628.82 16.53 0.71 0.66 17.90 19.55 7144.85 110940.00 167825.31 132656.4950% 382 18.73 16.425 3.51 50411.0502 41744.91709 6740.097 -1768.62 544.341737 66.00 46.00 143460.00 70337.65 213797.65 11.42 1.42 0.66 13.50 39.31 13726.02 110940.00 322410.16 252072.5275% 573 18.73 8.2125 3.51 75616.5753 31431.65212 21630.29 -7537.34 -5224.3753 66.00 46.00 143460.00 105506.47 248966.47 6.34 2.13 0.66 9.13 58.97 19494.74 110940.00 457911.44 352404.97100% 764 18.73 0 3.51 100822.1004 25097.89092 40453.35 -12925.9 -10612.941 66.00 46.00 143460.00 140675.29 284135.29 1.26 2.84 0.66 4.77 78.59 24883.30 110940.00 584483.34 443808.05
Carbon offsetting 972 18.73 0 3.51 128271.0492 20369.73608 63219.18 -18592.4 -16279.442 66.00 46.00 143460.00 211269.96 354729.96 -4.29 3.62 0.66 -0.01 100.04 30549.80 110940.00 717583.68 506313.72
provided Elec. by PV
PV area m2
Heating (KWh/m2)
Lighting (KWh/m2)
Hot water (KWh/m2)
generated Elec by PV
(KWh)
purchased from grid
elec (KWh)
Exported Elec
(KWh)
Elec Cost £
Energy cost Inc FIT
Wall Insulation price £/m2
Roof Insulation price £/m2
Total Insulation
price £
PV cost £
Fabric cost £
Operational CO2
(kgCO2/m2.yr)
PV ECO2
(kgCO2/m2.yr)
Insulation ECO2
(kgCO2/m2.yr)
Total CO2
(kgCO2/m2.yr)CO2 saving
%
Energy saving (A)
£
Value of external footprint
area £
PV(A) £
NPV £
0 0 18.73 32.85 3.51 0 0 0 11957.4 14270.36 66.00 46.00 143460.00 0.00 143460.00 21.59 0.00 0.66 22.25 0.00 0.00 0.00 0.0025% 190 18.05 24.6375 3.51 25073.559 60344.37639 0 4812.547 7054.78664 67.00 47.00 145830.00 35168.82 180998.82 16.40 0.71 0.71 17.82 19.92 7215.57 117132.00 67432.92 29894.0950% 382 18.05 16.425 3.51 50411.0502 41744.91709 6740.097 -1768.62 473.621737 67.00 47.00 145830.00 70337.65 216167.65 11.29 1.42 0.71 13.42 39.69 13796.74 117132.00 222017.77 149310.1275% 573 18.05 8.2125 3.51 75616.5753 31431.65212 21630.29 -7537.34 -5295.0953 67.00 47.00 145830.00 105506.47 251336.47 6.20 2.13 0.71 9.05 59.34 19565.46 117132.00 357519.04 249642.57100% 764 18.05 0 3.51 100822.1004 25097.89092 40453.35 -12925.9 -10683.661 67.00 47.00 145830.00 140675.29 286505.29 1.13 2.84 0.71 4.68 78.96 24954.02 117132.00 484090.94 341045.65
Carbon offsetting 968 18.05 0 3.51 127743.1848 20444.90992 62767.41 -18485 -16242.768 67.00 47.00 145830.00 210400.54 356230.54 -4.31 3.60 0.71 0.00 100.00 30513.13 117132.00 614668.70 401898.16
provided Elec. by PV
PV area m2
Heating (KWh/m2)
Lighting (KWh/m2)
Hot water (KWh/m2)
generated Elec by PV
(KWh)
purchased from grid
elec (KWh)
Exported Elec
(KWh)
Elec Cost £
Energy cost Inc FIT
Wall Insulation price £/m2
Roof Insulation price £/m2
Total Insulation
price £
PV cost £
Fabric cost £
Operational CO2
(kgCO2/m2.yr)
PV ECO2
(kgCO2/m2.yr)
Insulation ECO2
(kgCO2/m2.yr)
Total CO2
(kgCO2/m2.yr)CO2 saving
%
Energy saving (A)
£
Value of external footprint
area £
PV(A) £
NPV £
0 0 18.73 32.85 3.51 0 0 0 11957.4 14270.36 66.00 46.00 143460.00 0.00 143460.00 21.59 0.00 0.66 22.25 0.00 0.00 0.00 0.0025% 190 17.05 24.6375 3.51 25073.559 60344.37639 0 4812.547 6950.78664 68.50 48.00 149061.00 35168.82 184229.82 16.21 0.71 0.81 17.72 20.35 7319.57 123840.00 -40682.23 -81452.0550% 382 17.05 16.425 3.51 50411.0502 41744.91709 6740.097 -1768.62 369.621737 68.50 48.00 149061.00 70337.65 219398.65 11.09 1.42 0.81 13.32 40.12 13900.74 123840.00 113902.62 37963.9775% 573 17.05 8.2125 3.51 75616.5753 31431.65212 21630.29 -7537.34 -5399.0953 68.50 48.00 149061.00 105506.47 254567.47 6.01 2.13 0.81 8.95 59.78 19669.46 123840.00 249403.90 138296.42100% 764 17.05 0 3.51 100822.1004 25097.89092 40453.35 -12925.9 -10787.661 68.50 48.00 149061.00 140675.29 289736.29 0.93 2.84 0.81 4.59 79.39 25058.02 123840.00 375975.80 229699.50
Carbon offsetting 964 17.05 0 3.51 127215.3204 20520.08376 62315.64 -18377.6 -16239.373 68.50 48.00 149061.00 209531.12 358592.12 -4.40 3.59 0.81 0.00 100.02 30509.73 123840.00 504030.97 288898.85
provided Elec. by PV
PV area m2
Heating (KWh/m2)
Lighting (KWh/m2)
Hot water (KWh/m2)
generated Elec by PV
(KWh)
purchased from grid
elec (KWh)
Exported Elec
(KWh)
Elec Cost £
Energy cost Inc FIT
Wall Insulation price £/m2
Roof Insulation price £/m2
Total Insulation
price £
PV cost £
Fabric cost £
Operational CO2
(kgCO2/m2.yr)
PV ECO2
(kgCO2/m2.yr)
Insulation ECO2
(kgCO2/m2.yr)
Total CO2
(kgCO2/m2.yr)CO2 saving
%
Energy saving (A)
£
Value of external footprint
area £
PV(A) £
NPV £
0 0 18.73 32.85 3.51 0 0 0 11957.4 14270.36 66.00 46.00 143460.00 0.00 143460.00 21.59 0.00 0.66 22.25 0.00 0.00 0.00 0.0025% 190 16.49 24.6375 3.51 25073.559 60344.37639 0 4812.547 6892.54664 70.00 49.00 152292.00 35168.82 187460.82 16.10 0.71 0.91 17.71 20.40 7377.81 129000.00 -124358.85 -168359.6750% 382 16.49 16.425 3.51 50411.0502 41744.91709 6740.097 -1768.62 311.381737 70.00 49.00 152292.00 70337.65 222629.65 10.98 1.42 0.91 13.32 40.16 13958.98 129000.00 30226.00 -48943.6475% 573 16.49 8.2125 3.51 75616.5753 31431.65212 21630.29 -7537.34 -5457.3353 70.00 49.00 152292.00 105506.47 257798.47 5.90 2.13 0.91 8.94 59.82 19727.70 129000.00 165727.28 51388.81100% 764 16.49 0 3.51 100822.1004 25097.89092 40453.35 -12925.9 -10845.901 70.00 49.00 152292.00 140675.29 292967.29 0.82 2.84 0.91 4.58 79.43 25116.26 129000.00 292299.18 142791.89
Carbon offsetting 964 16.49 0 3.51 127215.3204 20520.08376 62315.64 -18377.6 -16297.613 70.00 49.00 152292.00 209531.12 361823.12 -4.51 3.59 0.91 -0.01 100.06 30567.97 129000.00 420354.35 201991.23
provided Elec. by PV
PV area m2
Heating (KWh/m2)
Lighting (KWh/m2)
Hot water (KWh/m2)
generated Elec by PV
(KWh)
purchased from grid
elec (KWh)
Exported Elec
(KWh)
Elec Cost £
Energy cost Inc FIT
Wall Insulation price £/m2
Roof Insulation price £/m2
Total Insulation
price £
PV cost £
Fabric cost £
Operational CO2
(kgCO2/m2.yr)
PV ECO2
(kgCO2/m2.yr)
Insulation ECO2
(kgCO2/m2.yr)
Total CO2
(kgCO2/m2.yr)CO2 saving
%
Energy saving (A)
£
Value of external footprint
area £
PV(A) £
NPV £
0 0 18.73 32.85 3.51 0 0 0 11957.4 14270.36 66.00 46.00 143460.00 0.00 143460.00 21.59 0.00 0.66 22.25 0.00 0.00 0.00 0.0025% 190 16 24.6375 3.51 25073.559 60344.37639 0 4812.547 6841.58664 71.50 50.00 155523.00 35168.82 190691.82 16.00 0.71 1.01 17.72 20.38 7428.77 134160.00 -208206.46 -255438.2950% 382 16 16.425 3.51 50411.0502 41744.91709 6740.097 -1768.62 260.421737 71.50 50.00 155523.00 70337.65 225860.65 10.89 1.42 1.01 13.32 40.14 14009.94 134160.00 -53621.61 -136022.2675% 573 16 8.2125 3.51 75616.5753 31431.65212 21630.29 -7537.34 -5508.2953 71.50 50.00 155523.00 105506.47 261029.47 5.80 2.13 1.01 8.94 59.80 19778.66 134160.00 81879.66 -35689.81100% 764 16 0 3.51 100822.1004 25097.89092 40453.35 -12925.9 -10896.861 71.50 50.00 155523.00 140675.29 296198.29 0.73 2.84 1.01 4.58 79.42 25167.22 134160.00 208451.56 55713.27
Carbon offsetting 964 16 0 3.51 127215.3204 20520.08376 62315.64 -18377.6 -16348.573 71.50 50.00 155523.00 209531.12 365054.12 -4.61 3.59 1.01 -0.01 100.05 30618.93 134160.00 336506.73 114912.62
provided Elec. by PV
PV area m2
Heating (KWh/m2)
Lighting (KWh/m2)
Hot water (KWh/m2)
generated Elec by PV
(KWh)
purchased from grid
elec (KWh)
Exported Elec
(KWh)
Elec Cost £
Energy cost Inc FIT
Wall Insulation price £/m2
Roof Insulation price £/m2
Total Insulation
price £
PV cost £
Fabric cost £
Operational CO2
(kgCO2/m2.yr)
PV ECO2
(kgCO2/m2.yr)
Insulation ECO2
(kgCO2/m2.yr)
Total CO2
(kgCO2/m2.yr)CO2 saving
%
Energy saving (A)
£
Value of external footprint
area £
PV(A) £
NPV £
0 0 18.73 32.85 3.51 0 0 0 11957.4 14270.36 66.00 46.00 143460.00 0.00 143460.00 21.59 0.00 0.66 22.25 0.00 0.00 0.00 0.0025% 190 15.52 24.6375 3.51 25073.559 60344.37639 0 4812.547 6791.66664 73.00 51.00 158754.00 35168.82 193922.82 15.91 0.71 1.11 17.72 20.35 7478.69 141900.00 -334600.82 -385063.6450% 382 15.52 16.425 3.51 50411.0502 41744.91709 6740.097 -1768.62 210.501737 73.00 51.00 158754.00 70337.65 229091.65 10.79 1.42 1.11 13.32 40.12 14059.86 141900.00 -180015.97 -265647.6175% 573 15.52 8.2125 3.51 75616.5753 31431.65212 21630.29 -7537.34 -5558.2153 73.00 51.00 158754.00 105506.47 264260.47 5.71 2.13 1.11 8.95 59.78 19828.58 141900.00 -44514.69 -165315.16100% 764 15.52 0 3.51 100822.1004 25097.89092 40453.35 -12925.9 -10946.781 73.00 51.00 158754.00 140675.29 299429.29 0.63 2.84 1.11 4.59 79.39 25217.14 141900.00 82057.21 -73912.08
Carbon offsetting 964 15.52 0 3.51 127215.3204 20520.08376 62315.64 -18377.6 -16398.493 73.00 51.00 158754.00 209531.12 368285.12 -4.70 3.59 1.11 0.00 100.02 30668.85 141900.00 210112.38 -14712.74
provided Elec. by PV
PV area m2
Heating (KWh/m2)
Lighting (KWh/m2)
Hot water (KWh/m2)
generated Elec by PV
(KWh)
purchased from grid
elec (KWh)
Exported Elec
(KWh)
Elec Cost £
Energy cost Inc FIT
Wall Insulation price £/m2
Roof Insulation price £/m2
Total Insulation
price £
PV cost £
Fabric cost £
Operational CO2
(kgCO2/m2.yr)
PV ECO2
(kgCO2/m2.yr)
Insulation ECO2
(kgCO2/m2.yr)
Total CO2
(kgCO2/m2.yr)CO2 saving
%
Energy saving (A)
£
Value of external footprint
area £
PV(A) £
NPV £
0 0 18.73 32.85 3.51 0 0 0 11957.4 14270.36 66.00 46.00 143460.00 0.00 143460.00 21.59 0.00 0.66 22.25 0.00 0.00 0.00 0.0025% 190 15 24.6375 3.51 25073.559 60344.37639 0 4812.547 6737.58664 79.00 55.00 171678.00 35168.82 206846.82 15.80 0.71 1.62 18.13 18.52 7532.77 167700.00 -758553.61 -821940.4350% 382 15 16.425 3.51 50411.0502 41744.91709 6740.097 -1768.62 156.421737 79.00 55.00 171678.00 70337.65 242015.65 10.69 1.42 1.62 13.73 38.28 14113.94 167700.00 -603968.76 -702524.4175% 573 15 8.2125 3.51 75616.5753 31431.65212 21630.29 -7537.34 -5612.2953 79.00 55.00 171678.00 105506.47 277184.47 5.61 2.13 1.62 9.36 57.94 19882.66 167700.00 -468467.48 -602191.95100% 764 15 0 3.51 100822.1004 25097.89092 40453.35 -12925.9 -11000.861 79.00 55.00 171678.00 140675.29 312353.29 0.53 2.84 1.62 4.99 77.56 25271.22 167700.00 -341895.58 -510788.88
Carbon offsetting 987 15.52 0 3.51 130250.5407 20087.83418 64913.32 -18995.1 -17016.011 79.00 55.00 171678.00 214530.30 386208.30 -5.31 3.67 1.62 -0.02 100.09 31286.37 167700.00 -200605.83 -443354.14
provided Elec. by PV
PV area m2
Heating (KWh/m2)
Lighting (KWh/m2)
Hot water (KWh/m2)
generated Elec by PV
(KWh)
purchased from grid
elec (KWh)
Exported Elec
(KWh)
Elec Cost £
Energy cost Inc FIT
Wall Insulation price £/m2
Roof Insulation price £/m2
Total Insulation
price £
PV cost £
Fabric cost £
Operational CO2
(kgCO2/m2.yr)
PV ECO2
(kgCO2/m2.yr)
Insulation ECO2
(kgCO2/m2.yr)
Total CO2
(kgCO2/m2.yr)CO2 saving
%
Energy saving (A)
£
Value of external footprint
area £
PV(A) £
NPV £
0 0 18.73 32.85 3.51 0 0 0 11957.4 14270.36 66.00 46.00 143460.00 0.00 143460.00 21.59 0.00 0.66 22.25 0.00 0.00 0.00 0.0025% 190 14.2 24.6375 3.51 25073.559 60344.37639 0 4812.547 6654.38664 82.00 57.00 178140.00 35168.82 213308.82 15.65 0.71 1.72 18.07 18.78 7615.97 176300.00 -898340.35 -968189.1750% 382 14.2 16.425 3.51 50411.0502 41744.91709 6740.097 -1768.62 73.2217372 82.00 57.00 178140.00 70337.65 248477.65 10.53 1.42 1.72 13.68 38.54 14197.14 176300.00 -743755.50 -848773.1575% 573 14.2 8.2125 3.51 75616.5753 31431.65212 21630.29 -7537.34 -5695.4953 82.00 57.00 178140.00 105506.47 283646.47 5.45 2.13 1.72 9.30 58.20 19965.86 176300.00 -608254.23 -748440.70100% 764 14.2 0 3.51 100822.1004 25097.89092 40453.35 -12925.9 -11084.061 82.00 57.00 178140.00 140675.29 318815.29 0.37 2.84 1.72 4.94 77.81 25354.42 176300.00 -481682.32 -657037.62
Carbon offsetting 980 14.2 0 3.51 129326.778 20219.3884 64122.72 -18807.2 -16965.351 82.00 57.00 178140.00 213008.81 391148.81 -5.39 3.65 1.72 -0.02 100.08 31235.71 176300.00 -343536.82 -591225.63
PV + 0.08 - 0.11
PV + 0.07 - 0.10
PV + 2010 notional building fabric
Office - London (West End)
PV + 0.17 - 0.24
PV + 0.15 - 0.21
PV + 0.13 - 0.19
PV + 0.12 - 0.17
PV + 0.11 - 0.15
PV (current FiT) + Insulation

231
Table B. 38 Office - PV (future FiT) + improving the building fabric U-value down to 0.07-0.1 W/m2.K (PUR) – taking into account the rental loss/gain- West-End
provided Elec. by PV
PV area m2
Heating (KWh/m2)
Lighting (KWh/m2)
Hot water (KWh/m2)
generated Elec by PV
(KWh)
purchased from grid
elec (KWh)
Exported Elec
(KWh)Elec Cost £
Energy cost Inc
FIT
Wall Insulation price £/m2
Roof Insulation price £/m2
Total Insulation
price £
PV cost £
Fabric cost £
Operational CO2
(kgCO2/m2.yr)
PV ECO2
(kgCO2/m2.yr)
Insulation ECO2
(kgCO2/m2.yr)
Total CO2
(kgCO2/m2.yr)CO2 saving
%
Energy saving (A)
£
Value of external footprint
area £
PV(A) £
NPV £
0 0 18.73 32.85 3.51 0 0 0 11957.4 14270.36 66.00 46.00 143460.00 0.00 143460.00 21.59 0.00 0.66 22.25 0.00 0.00 0.00 0.0025% 190 18.73 24.6375 3.51 25073.559 60344.37639 0 8448.2127 10761.173 66.00 46.00 143460.00 35168.82 178628.82 16.53 0.71 0.66 17.90 19.55 3509.19 110940.00 82427.23 47258.4150% 382 18.73 16.425 3.51 50411.0502 41744.91709 6740.0973 5540.984 7853.944 66.00 46.00 143460.00 70337.65 213797.65 11.42 1.42 0.66 13.50 39.31 6416.42 110940.00 150715.06 80377.4275% 573 18.73 8.2125 3.51 75616.5753 31431.65212 21630.292 3427.0682 5740.0282 66.00 46.00 143460.00 105506.47 248966.47 6.34 2.13 0.66 9.13 58.97 8530.33 110940.00 200368.79 94862.32100% 764 18.73 0 3.51 100822.1 25097.89092 40453.352 1693.3039 4006.2639 66.00 46.00 143460.00 140675.29 284135.29 1.26 2.84 0.66 4.77 78.59 10264.10 110940.00 241093.14 100417.85
Carbon offsetting 972 18.73 0 3.51 128271.049 20369.73608 63219.179 6.8999979 2319.86 66.00 46.00 143460.00 211269.96 354729.96 -4.29 3.62 0.66 -0.01 100.04 11950.50 110940.00 280705.05 69435.09Carbon offsetting 972 18.73 0 3.51 128271.049 20369.73608 63219.179 -3470.155 -1157.195 66.00 46.00 143460.00 211269.96 354729.96 -4.29 3.62 0.66 -0.01 100.04 15427.55 110940.00 362377.52 151107.56
provided Elec. by PV
PV area m2
Heating (KWh/m2)
Lighting (KWh/m2)
Hot water (KWh/m2)
generated Elec by PV
(KWh)
purchased from grid
elec (KWh)
Exported Elec
(KWh)Elec Cost £
Energy cost Inc
FIT
Wall Insulation price £/m2
Roof Insulation price £/m2
Total Insulation
price £
PV cost £
Fabric cost £
Operational CO2
(kgCO2/m2.yr)
PV ECO2
(kgCO2/m2.yr)
Insulation ECO2
(kgCO2/m2.yr)
Total CO2
(kgCO2/m2.yr)CO2 saving
%
Energy saving (A)
£
Value of external footprint
area £
PV(A) £
NPV £
0 0 18.73 32.85 3.51 0 0 0 11957.4 14270.36 66.00 46.00 143460.00 0.00 143460.00 21.59 0.00 0.66 22.25 0.00 0.00 0.00 0.0025% 190 18.05 24.6375 3.51 25073.559 60344.37639 0 8448.2127 10690.453 67.00 47.00 145830.00 35168.82 180998.82 16.40 0.71 0.71 17.82 19.92 3579.91 117132.00 -17965.17 -55503.9950% 382 18.05 16.425 3.51 50411.0502 41744.91709 6740.0973 5540.984 7783.224 67.00 47.00 145830.00 70337.65 216167.65 11.29 1.42 0.71 13.42 39.69 6487.14 117132.00 50322.67 -22384.9875% 573 18.05 8.2125 3.51 75616.5753 31431.65212 21630.292 3427.0682 5669.3082 67.00 47.00 145830.00 105506.47 251336.47 6.20 2.13 0.71 9.05 59.34 8601.05 117132.00 99976.39 -7900.08100% 764 18.05 0 3.51 100822.1 25097.89092 40453.352 1693.3039 3935.5439 67.00 47.00 145830.00 140675.29 286505.29 1.13 2.84 0.71 4.68 78.96 10334.82 117132.00 140700.75 -2344.55
Carbon offsetting 968 18.05 0 3.51 127743.185 20444.90992 62767.407 37.754058 2279.9941 67.00 47.00 145830.00 210400.54 356230.54 -4.31 3.60 0.71 0.00 100.00 11990.37 117132.00 179587.92 -33182.62Carbon offsetting 968 18.05 0 3.51 127743.185 20444.90992 62767.407 -3414.453 -1172.213 67.00 47.00 145830.00 210400.54 356230.54 -4.31 3.60 0.71 0.00 100.00 15442.57 117132.00 260676.75 47906.21
provided Elec. by PV
PV area m2
Heating (KWh/m2)
Lighting (KWh/m2)
Hot water (KWh/m2)
generated Elec by PV
(KWh)
purchased from grid
elec (KWh)
Exported Elec
(KWh)Elec Cost £
Energy cost Inc
FIT
Wall Insulation price £/m2
Roof Insulation price £/m2
Total Insulation
price £
PV cost £
Fabric cost £
Operational CO2
(kgCO2/m2.yr)
PV ECO2
(kgCO2/m2.yr)
Insulation ECO2
(kgCO2/m2.yr)
Total CO2
(kgCO2/m2.yr)CO2 saving
%
Energy saving (A)
£
Value of external footprint
area £
PV(A) £
NPV £
0 0 18.73 32.85 3.51 0 0 0 11957.4 14270.36 66.00 46.00 143460.00 0.00 143460.00 21.59 0.00 0.66 22.25 0.00 0.00 0.00 0.0025% 190 17.05 24.6375 3.51 25073.559 60344.37639 0 8448.2127 10586.453 68.50 48.00 149061.00 35168.82 184229.82 16.21 0.71 0.81 17.72 20.35 3683.91 123840.00 -126080.31 -166850.1450% 382 17.05 16.425 3.51 50411.0502 41744.91709 6740.0973 5540.984 7679.224 68.50 48.00 149061.00 70337.65 219398.65 11.09 1.42 0.81 13.32 40.12 6591.14 123840.00 -57792.48 -133731.1375% 573 17.05 8.2125 3.51 75616.5753 31431.65212 21630.292 3427.0682 5565.3082 68.50 48.00 149061.00 105506.47 254567.47 6.01 2.13 0.81 8.95 59.78 8705.05 123840.00 -8138.75 -119246.22100% 764 17.05 0 3.51 100822.1 25097.89092 40453.352 1693.3039 3831.5439 68.50 48.00 149061.00 140675.29 289736.29 0.93 2.84 0.81 4.59 79.39 10438.82 123840.00 32585.60 -113690.69
Carbon offsetting 964 17.05 0 3.51 127215.32 20520.08376 62315.636 68.608117 2206.8481 68.50 48.00 149061.00 209531.12 358592.12 -4.40 3.59 0.81 0.00 100.02 12063.51 123840.00 70748.05 -144384.07Carbon offsetting 964 17.05 0 3.51 127215.32 20520.08376 62315.636 -3358.752 -1220.512 68.50 48.00 149061.00 209531.12 358592.12 -4.40 3.59 0.81 0.00 100.02 15490.87 123840.00 151253.23 -63878.88
provided Elec. by PV
PV area m2
Heating (KWh/m2)
Lighting (KWh/m2)
Hot water (KWh/m2)
generated Elec by PV
(KWh)
purchased from grid
elec (KWh)
Exported Elec
(KWh)Elec Cost £
Energy cost Inc
FIT
Wall Insulation price £/m2
Roof Insulation price £/m2
Total Insulation
price £
PV cost £
Fabric cost £
Operational CO2
(kgCO2/m2.yr)
PV ECO2
(kgCO2/m2.yr)
Insulation ECO2
(kgCO2/m2.yr)
Total CO2
(kgCO2/m2.yr)CO2 saving
%
Energy saving (A)
£
Value of external footprint
area £
PV(A) £
NPV £
0 0 18.73 32.85 3.51 0 0 0 11957.4 14270.36 66.00 46.00 143460.00 0.00 143460.00 21.59 0.00 0.66 22.25 0.00 0.00 0.00 0.0025% 190 16.49 24.6375 3.51 25073.559 60344.37639 0 8448.2127 10528.213 70.00 49.00 152292.00 35168.82 187460.82 16.10 0.71 0.91 17.71 20.40 3742.15 129000.00 -209756.93 -253757.7650% 382 16.49 16.425 3.51 50411.0502 41744.91709 6740.0973 5540.984 7620.984 70.00 49.00 152292.00 70337.65 222629.65 10.98 1.42 0.91 13.32 40.16 6649.38 129000.00 -141469.10 -220638.7475% 573 16.49 8.2125 3.51 75616.5753 31431.65212 21630.292 3427.0682 5507.0682 70.00 49.00 152292.00 105506.47 257798.47 5.90 2.13 0.91 8.94 59.82 8763.29 129000.00 -91815.37 -206153.84100% 764 16.49 0 3.51 100822.1 25097.89092 40453.352 1693.3039 3773.3039 70.00 49.00 152292.00 140675.29 292967.29 0.82 2.84 0.91 4.58 79.43 10497.06 129000.00 -51091.02 -200598.31
Carbon offsetting 964 16.49 0 3.51 127215.32 20520.08376 62315.636 68.608117 2148.6081 70.00 49.00 152292.00 209531.12 361823.12 -4.51 3.59 0.91 -0.01 100.06 12121.75 129000.00 -12928.57 -231291.69Carbon offsetting 964 16.49 0 3.51 127215.32 20520.08376 62315.636 -3358.752 -1278.752 70.00 49.00 152292.00 209531.12 361823.12 -4.51 3.59 0.91 -0.01 100.06 15549.11 129000.00 67576.62 -150786.50
provided Elec. by PV
PV area m2
Heating (KWh/m2)
Lighting (KWh/m2)
Hot water (KWh/m2)
generated Elec by PV
(KWh)
purchased from grid
elec (KWh)
Exported Elec
(KWh)Elec Cost £
Energy cost Inc
FIT
Wall Insulation price £/m2
Roof Insulation price £/m2
Total Insulation
price £
PV cost £
Fabric cost £
Operational CO2
(kgCO2/m2.yr)
PV ECO2
(kgCO2/m2.yr)
Insulation ECO2
(kgCO2/m2.yr)
Total CO2
(kgCO2/m2.yr)CO2 saving
%
Energy saving (A)
£
Value of external footprint
area £
PV(A) £
NPV £
0 0 18.73 32.85 3.51 0 0 0 11957.4 14270.36 66.00 46.00 143460.00 0.00 143460.00 21.59 0.00 0.66 22.25 0.00 0.00 0.00 0.0025% 190 16 24.6375 3.51 25073.559 60344.37639 0 8448.2127 10477.253 71.50 50.00 155523.00 35168.82 190691.82 16.00 0.71 1.01 17.72 20.38 3793.11 134160.00 -293604.55 -340836.3750% 382 16 16.425 3.51 50411.0502 41744.91709 6740.0973 5540.984 7570.024 71.50 50.00 155523.00 70337.65 225860.65 10.89 1.42 1.01 13.32 40.14 6700.34 134160.00 -225316.71 -307717.3675% 573 16 8.2125 3.51 75616.5753 31431.65212 21630.292 3427.0682 5456.1082 71.50 50.00 155523.00 105506.47 261029.47 5.80 2.13 1.01 8.94 59.80 8814.25 134160.00 -175662.99 -293232.46100% 764 16 0 3.51 100822.1 25097.89092 40453.352 1693.3039 3722.3439 71.50 50.00 155523.00 140675.29 296198.29 0.73 2.84 1.01 4.58 79.42 10548.02 134160.00 -134938.63 -287676.93
Carbon offsetting 964 16 0 3.51 127215.32 20520.08376 62315.636 68.608117 2097.6481 71.50 50.00 155523.00 209531.12 365054.12 -4.61 3.59 1.01 -0.01 100.05 12172.71 134160.00 -96776.19 -318370.30Carbon offsetting 964 16 0 3.51 127215.32 20520.08376 62315.636 -3358.752 -1329.712 71.50 50.00 155523.00 209531.12 365054.12 -4.61 3.59 1.01 -0.01 100.05 15600.07 134160.00 -16271.00 -237865.12
provided Elec. by PV
PV area m2
Heating (KWh/m2)
Lighting (KWh/m2)
Hot water (KWh/m2)
generated Elec by PV
(KWh)
purchased from grid
elec (KWh)
Exported Elec
(KWh)Elec Cost £
Energy cost Inc
FIT
Wall Insulation price £/m2
Roof Insulation price £/m2
Total Insulation
price £
PV cost £
Fabric cost £
Operational CO2
(kgCO2/m2.yr)
PV ECO2
(kgCO2/m2.yr)
Insulation ECO2
(kgCO2/m2.yr)
Total CO2
(kgCO2/m2.yr)CO2 saving
%
Energy saving (A)
£
Value of external footprint
area £
PV(A) £
NPV £
0 0 18.73 32.85 3.51 0 0 0 11957.4 14270.36 66.00 46.00 143460.00 0.00 143460.00 21.59 0.00 0.66 22.25 0.00 0.00 0.00 0.0025% 190 15.52 24.6375 3.51 25073.559 60344.37639 0 8448.2127 10427.333 73.00 51.00 158754.00 35168.82 193922.82 15.91 0.71 1.11 17.72 20.35 3843.03 141900.00 -419998.90 -470461.7350% 382 15.52 16.425 3.51 50411.0502 41744.91709 6740.0973 5540.984 7520.104 73.00 51.00 158754.00 70337.65 229091.65 10.79 1.42 1.11 13.32 40.12 6750.26 141900.00 -351711.07 -437342.7175% 573 15.52 8.2125 3.51 75616.5753 31431.65212 21630.292 3427.0682 5406.1882 73.00 51.00 158754.00 105506.47 264260.47 5.71 2.13 1.11 8.95 59.78 8864.17 141900.00 -302057.34 -422857.81100% 764 15.52 0 3.51 100822.1 25097.89092 40453.352 1693.3039 3672.4239 73.00 51.00 158754.00 140675.29 299429.29 0.63 2.84 1.11 4.59 79.39 10597.94 141900.00 -261332.99 -417302.28
Carbon offsetting 964 15.52 0 3.51 127215.32 20520.08376 62315.636 68.608117 2047.7281 73.00 51.00 158754.00 209531.12 368285.12 -4.70 3.59 1.11 0.00 100.02 12222.63 141900.00 -223170.54 -447995.66Carbon offsetting 964 15.52 0 3.51 127215.32 20520.08376 62315.636 -3358.752 -1379.632 73.00 51.00 158754.00 209531.12 368285.12 -4.70 3.59 1.11 0.00 100.02 15649.99 141900.00 -142665.35 -367490.47
provided Elec. by PV
PV area m2
Heating (KWh/m2)
Lighting (KWh/m2)
Hot water (KWh/m2)
generated Elec by PV
(KWh)
purchased from grid
elec (KWh)
Exported Elec
(KWh)Elec Cost £
Energy cost Inc
FIT
Wall Insulation price £/m2
Roof Insulation price £/m2
Total Insulation
price £
PV cost £
Fabric cost £
Operational CO2
(kgCO2/m2.yr)
PV ECO2
(kgCO2/m2.yr)
Insulation ECO2
(kgCO2/m2.yr)
Total CO2
(kgCO2/m2.yr)CO2 saving
%
Energy saving (A)
£
Value of external footprint
area £
PV(A) £
NPV £
0 0 18.73 32.85 3.51 0 0 0 11957.4 14270.36 66.00 46.00 143460.00 0.00 143460.00 21.59 0.00 0.66 22.25 0.00 0.00 0.00 0.0025% 190 15 24.6375 3.51 25073.559 60344.37639 0 8448.2127 10373.253 79.00 55.00 171678.00 35168.82 206846.82 15.80 0.71 1.62 18.13 18.52 3897.11 167700.00 -843951.69 -907338.5250% 382 15 16.425 3.51 50411.0502 41744.91709 6740.0973 5540.984 7466.024 79.00 55.00 171678.00 70337.65 242015.65 10.69 1.42 1.62 13.73 38.28 6804.34 167700.00 -775663.86 -874219.5175% 573 15 8.2125 3.51 75616.5753 31431.65212 21630.292 3427.0682 5352.1082 79.00 55.00 171678.00 105506.47 277184.47 5.61 2.13 1.62 9.36 57.94 8918.25 167700.00 -726010.13 -859734.60100% 764 15 0 3.51 100822.1 25097.89092 40453.352 1693.3039 3618.3439 79.00 55.00 171678.00 140675.29 312353.29 0.53 2.84 1.62 4.99 77.56 10652.02 167700.00 -685285.78 -854179.07
Carbon offsetting 987 15.52 0 3.51 130250.541 20087.83418 64913.322 -108.8027 1870.3173 79.00 55.00 171678.00 214530.30 386208.30 -5.31 3.67 1.62 -0.02 100.09 12400.04 167700.00 -644226.42 -886974.72Carbon offsetting 987 15.52 0 3.51 130250.541 20087.83418 64913.322 -3679.035 -1699.915 79.00 55.00 171678.00 214530.30 386208.30 -5.31 3.67 1.62 -0.02 100.09 15970.28 167700.00 -560365.29 -803113.60
provided Elec. by PV
PV area m2
Heating (KWh/m2)
Lighting (KWh/m2)
Hot water (KWh/m2)
generated Elec by PV
(KWh)
purchased from grid
elec (KWh)
Exported Elec
(KWh)Elec Cost £
Energy cost Inc
FIT
Wall Insulation price £/m2
Roof Insulation price £/m2
Total Insulation
price £
PV cost £
Fabric cost £
Operational CO2
(kgCO2/m2.yr)
PV ECO2
(kgCO2/m2.yr)
Insulation ECO2
(kgCO2/m2.yr)
Total CO2
(kgCO2/m2.yr)CO2 saving
%
Energy saving (A)
£
Value of external footprint
area £
PV(A) £
NPV £
0 0 18.73 32.85 3.51 0 0 0 11957.4 14270.36 66.00 46.00 143460.00 0.00 143460.00 21.59 0.00 0.66 22.25 0.00 0.00 0.00 0.0025% 190 14.2 24.6375 3.51 25073.559 60344.37639 0 8448.2127 10290.053 82.00 57.00 178140.00 35168.82 213308.82 15.65 0.71 1.72 18.07 18.78 3980.31 176300.00 -983738.44 -1053587.2650% 382 14.2 16.425 3.51 50411.0502 41744.91709 6740.0973 5540.984 7382.824 82.00 57.00 178140.00 70337.65 248477.65 10.53 1.42 1.72 13.68 38.54 6887.54 176300.00 -915450.60 -1020468.2575% 573 14.2 8.2125 3.51 75616.5753 31431.65212 21630.292 3427.0682 5268.9082 82.00 57.00 178140.00 105506.47 283646.47 5.45 2.13 1.72 9.30 58.20 9001.45 176300.00 -865796.87 -1005983.35100% 764 14.2 0 3.51 100822.1 25097.89092 40453.352 1693.3039 3535.1439 82.00 57.00 178140.00 140675.29 318815.29 0.37 2.84 1.72 4.94 77.81 10735.22 176300.00 -825072.52 -1000427.82
Carbon offsetting 980 14.2 0 3.51 129326.778 20219.3884 64122.722 -54.80812 1787.0319 82.00 57.00 178140.00 213008.81 391148.81 -5.39 3.65 1.72 -0.02 100.08 12483.33 176300.00 -784011.15 -1031699.96Carbon offsetting 980 14.2 0 3.51 129326.778 20219.3884 64122.722 -3581.558 -1739.718 82.00 57.00 178140.00 213008.81 391148.81 -5.39 3.65 1.72 -0.02 100.08 16010.08 176300.00 -701171.40 -948860.21
PV + 0.07 - 0.10
Office - London (West End)
PV + 2010 notional building fabric
PV + 0.17 - 0.24
PV + 0.15 - 0.21
PV + 0.13 - 0.19
PV + 0.12 - 0.17
PV + 0.11 - 0.15
PV + 0.08 - 0.11
PV (future FiT) + Insulation

232
Table B. 39 Office - PV (current FiT) + improving the building fabric U-value down to 0.07-0.1 W/m2.K (PUR) + TSC – taking into account the rental loss/gain- West-End
provided Elec. & heating
TSC area m2
PV area m2
Heating (KWh/m2)
Lighting (KWh/m2)
Hot water (KWh/m2)
TSC fan power
(KWh/m2)
generated Elec by PV
(KWh)
purchased from grid
elec (KWh)
Exported Elec (KWh)
Elec cost £
Energy cost Inc
FIT £
Wall Insulation price £/m2
Roof Insulation price £/m2
Total Insulation
price £
TSC cost £
PV Cost £Fabric cost
£Operational CO2
(kgCO2/m2.yr)
PV ECO2
(kgCO2/m2.yr)
TSC ECO2
(kgCO2/m2.yr)
Insulation ECO2
(kgCO2/m2.yr)
Total CO2
(kgCO2/m2.yr)CO2 saving
%
Energy saving (A)
£
Value of external footprint
area £
PV(A) £
NPV £
0 0 0 18.73 32.85 3.51 0 0 0 0 11957.4 14270.36 66.00 46.00 143460.00 0.00 0.00 143460.00 21.59 0.00 0.00 0.66 22.25 0.00 0.00 110940.00 0.00 0.0025% 75 190 14.04 24.6375 3.51 0.0938 25073.559 60344.3764 0 4812.547 6637.7466 66.00 46.00 143460.00 11250.00 35168.82 189878.82 15.66 0.71 0.04 0.66 17.07 23.30 7632.61 110940.00 179282.30 132863.4850% 200 382 9.365 16.425 3.51 0.1873 50411.0502 41744.9171 6740.09727 -1768.62 -429.6183 66.00 46.00 143460.00 30000.00 70337.65 243797.65 9.68 1.42 0.09 0.66 11.86 46.70 14699.98 110940.00 345287.49 244949.8475% 425 573 4.68 8.2125 3.51 0.281 75616.5753 31431.6521 21630.292 -7537.34 -6685.575 66.00 46.00 143460.00 63750.00 105506.47 312716.47 3.73 2.13 0.20 0.66 6.72 69.78 20955.94 110940.00 492233.54 322977.07100% 650 764 0 0 3.51 0.3746 100822.1 25097.8909 40453.3519 -12925.9 -12560.86 66.00 46.00 143460.00 97500.00 140675.29 381635.29 -2.21 2.84 0.31 0.66 1.60 92.82 26831.22 110940.00 630238.00 392062.70
Carbon offsetting
650 832 0 0 3.51 0.3746 109795.795 23243.862 47729.4021 -14814.1 -14449.03 66.00 46.00 143460.00 97500.00 180840.13 421800.13 -4.06 3.10 0.310.66
0.01 99.96 28719.39 110940.00 674589.23 396249.10
provided Elec. & heating
TSC area m2
PV area m2
Heating (KWh/m2)
Lighting (KWh/m2)
Hot water (KWh/m2)
TSC fan power
(KWh/m2)
generated Elec by PV
(KWh)
purchased from grid
elec (KWh)
Exported Elec (KWh)
Elec cost £
Energy cost Inc
FIT £
Wall Insulation price £/m2
Roof Insulation price £/m2
Total Insulation
price £
TSC cost £
PV Cost £Fabric cost
£Operational CO2
(kgCO2/m2.yr)
PV ECO2
(kgCO2/m2.yr)
TSC ECO2
(kgCO2/m2.yr)
Insulation ECO2
(kgCO2/m2.yr)
Total CO2
(kgCO2/m2.yr)CO2 saving
%
Energy saving (A)
£
Value of external footprint
area £
PV(A) £
NPV £
0 0 0 18.73 32.85 3.51 0 0 0 0 11957.4 14270.36 66.00 46.00 143460.00 0.00 0.00 143460.00 21.59 0.00 0.00 0.66 22.25 0.00 0.00 0.00 0.0025% 72 190 13.53 24.6375 3.51 0.104 25073.559 60344.3764 0 4812.547 6584.7066 67.00 47.00 145830.00 10800.00 35168.82 191798.82 15.57 0.71 0.03 0.71 17.02 23.51 7685.65 117132.00 78474.62 30135.7950% 185 382 9.025 16.425 3.51 0.1941 50411.0502 41744.9171 6740.09727 -1768.62 -464.9783 67.00 47.00 145830.00 27750.00 70337.65 243917.65 9.62 1.42 0.09 0.71 11.84 46.79 14735.34 117132.00 244064.52 143606.8775% 410 573 4.51 8.2125 3.51 0.2844 75616.5753 31431.6521 21630.292 -7537.34 -6703.255 67.00 47.00 145830.00 61500.00 105506.47 312836.47 3.70 2.13 0.19 0.71 6.74 69.73 20973.62 117132.00 390595.28 221218.81100% 630 764 0 0 3.51 0.3746 100822.1 25097.8909 40453.3519 -12925.9 -12560.86 67.00 47.00 145830.00 94500.00 140675.29 381005.29 -2.21 2.84 0.30 0.71 1.64 92.64 26831.22 117132.00 528184.46 290639.16
Carbon offsetting
630 835 0 0 3.51 0.3746 110191.694 23173.84 48054.8151 -14895.9 -14530.88 67.00 47.00 145830.00 94500.00 181492.20 421822.20 -4.14 3.11 0.30 0.71 -0.02 100.09 28801.24 117132.00 574458.31 296096.11
provided Elec. & heating
TSC area m2
PV area m2
Heating (KWh/m2)
Lighting (KWh/m2)
Hot water (KWh/m2)
TSC fan power
(KWh/m2)
generated Elec by PV
(KWh)
purchased from grid
elec (KWh)
Exported Elec (KWh)
Elec cost £
Energy cost Inc
FIT £
Wall Insulation price £/m2
Roof Insulation price £/m2
Total Insulation
price £
TSC cost £
PV Cost £Fabric cost
£Operational CO2
(kgCO2/m2.yr)
PV ECO2
(kgCO2/m2.yr)
TSC ECO2
(kgCO2/m2.yr)
Insulation ECO2
(kgCO2/m2.yr)
Total CO2
(kgCO2/m2.yr)CO2 saving
%
Energy saving (A)
£
Value of external footprint
area £
PV(A) £
NPV £
0 0 0 18.73 32.85 3.51 0 0 0 0 11957.4 14270.36 66.00 46.00 143460.00 0.00 0.00 143460.00 21.59 0.00 0.00 0.66 22.25 0.00 0.00 0.00 0.0025% 69 190 12.78 24.6375 3.51 0.119 25073.559 60344.3764 0 4812.547 6506.7066 68.50 48.00 149061.00 10350.00 35168.82 194579.82 15.43 0.71 0.03 0.81 16.98 23.69 7763.65 123840.00 -30251.24 -81371.0750% 172 382 8.52 16.425 3.51 0.2042 50411.0502 41744.9171 6740.09727 -1768.62 -517.4983 68.50 48.00 149061.00 25800.00 70337.65 245198.65 9.53 1.42 0.08 0.81 11.84 46.78 14787.86 123840.00 134740.16 33001.5275% 400 573 4.26 8.2125 3.51 0.2894 75616.5753 31431.6521 21630.292 -7537.34 -6729.255 68.50 48.00 149061.00 60000.00 105506.47 314567.47 3.65 2.13 0.19 0.81 6.78 69.51 20999.62 123840.00 280648.00 109540.53100% 615 764 0 0 3.51 0.3746 100822.1 25097.8909 40453.3519 -12925.9 -12560.86 68.50 48.00 149061.00 92250.00 140675.29 381986.29 -2.21 2.84 0.29 0.81 1.73 92.22 26831.22 123840.00 417626.46 179100.16
Carbon offsetting
615 838 0 0 3.51 0.3746 110587.592 23103.818 48380.2282 -14977.8 -14612.74 68.50 48.00 149061.00 92250.00 182144.27 423455.27 -4.22 3.12 0.29 0.81 0.01 99.98 28883.10 123840.00 465822.93 185827.66
provided Elec. & heating
TSC area m2
PV area m2
Heating (KWh/m2)
Lighting (KWh/m2)
Hot water (KWh/m2)
TSC fan power
(KWh/m2)
generated Elec by PV
(KWh)
purchased from grid
elec (KWh)
Exported Elec (KWh)
Elec cost £
Energy cost Inc
FIT £
Wall Insulation price £/m2
Roof Insulation price £/m2
Total Insulation
price £
TSC cost £
PV Cost £Fabric cost
£Operational CO2
(kgCO2/m2.yr)
PV ECO2
(kgCO2/m2.yr)
TSC ECO2
(kgCO2/m2.yr)
Insulation ECO2
(kgCO2/m2.yr)
Total CO2
(kgCO2/m2.yr)CO2 saving
%
Energy saving (A)
£
Value of external footprint
area £
PV(A) £
NPV £
0 0 0 18.73 32.85 3.51 0 0 0 0 11957.4 14270.36 66.00 46.00 143460.00 0.00 0.00 143460.00 21.59 0.00 0.00 0.66 22.25 0.00 0.00 0.00 0.0025% 66 190 12.36 24.6375 3.51 0.1274 25073.559 60344.3764 0 4812.547 6463.0266 70.00 49.00 152292.00 9900.00 35168.82 197360.82 15.35 0.71 0.03 0.91 17.00 23.60 7807.33 129000.00 -114269.86 -168170.6850% 165 382 8.24 16.425 3.51 0.2098 50411.0502 41744.9171 6740.09727 -1768.62 -546.6183 70.00 49.00 152292.00 24750.00 70337.65 247379.65 9.48 1.42 0.08 0.91 11.89 46.58 14816.98 129000.00 50379.55 -53540.1075% 392 573 4.12 8.2125 3.51 0.2922 75616.5753 31431.6521 21630.292 -7537.34 -6743.815 70.00 49.00 152292.00 58800.00 105506.47 316598.47 3.63 2.13 0.19 0.91 6.86 69.19 21014.18 129000.00 195945.38 22806.91100% 605 764 0 0 3.51 0.3746 100822.1 25097.8909 40453.3519 -12925.9 -12560.86 70.00 49.00 152292.00 90750.00 140675.29 383717.29 -2.21 2.84 0.29 0.91 1.83 91.79 26831.22 129000.00 332581.84 92324.55
Carbon offsetting
605 843 0 0 3.51 0.3746 111247.422 22987.1147 48922.5833 -15114.2 -14749.16 70.00 49.00 152292.00 90750.00 183231.05 426273.05 -4.35 3.14 0.29 0.91 -0.01 100.06 29019.52 129000.00 383982.68 101169.63
provided Elec. & heating
TSC area m2
PV area m2
Heating (KWh/m2)
Lighting (KWh/m2)
Hot water (KWh/m2)
TSC fan power
(KWh/m2)
generated Elec by PV
(KWh)
purchased from grid
elec (KWh)
Exported Elec (KWh)
Elec cost £
Energy cost Inc
FIT £
Wall Insulation price £/m2
Roof Insulation price £/m2
Total Insulation
price £
TSC cost £
PV Cost £Fabric cost
£Operational CO2
(kgCO2/m2.yr)
PV ECO2
(kgCO2/m2.yr)
TSC ECO2
(kgCO2/m2.yr)
Insulation ECO2
(kgCO2/m2.yr)
Total CO2
(kgCO2/m2.yr)CO2 saving
%
Energy saving (A)
£
Value of external footprint
area £
PV(A) £
NPV £
0 0 0 18.73 32.85 3.51 0 0 0 0 11957.4 14270.36 66.00 46.00 143460.00 0.00 0.00 143460.00 21.59 0.00 0.00 0.66 22.25 0.00 0.00 0.00 0.0025% 63 190 12 24.6375 3.51 0.1346 25073.559 60344.3764 0 4812.547 6425.5866 71.50 50.00 155523.00 9450.00 35168.82 200141.82 15.29 0.71 0.03 1.01 17.03 23.45 7844.77 134160.00 -198435.05 -255116.8750% 160 382 8 16.425 3.51 0.2146 50411.0502 41744.9171 6740.09727 -1768.62 -571.5783 71.50 50.00 155523.00 24000.00 70337.65 249860.65 9.43 1.42 0.08 1.01 11.94 46.35 14841.94 134160.00 -34078.78 -140479.4375% 382 573 4 8.2125 3.51 0.2946 75616.5753 31431.6521 21630.292 -7537.34 -6756.295 71.50 50.00 155523.00 57300.00 105506.47 318329.47 3.60 2.13 0.18 1.01 6.93 68.87 21026.66 134160.00 111193.91 -63675.56100% 595 764 0 0 3.51 0.3746 100822.1 25097.8909 40453.3519 -12925.9 -12560.86 71.50 50.00 155523.00 89250.00 140675.29 385448.29 -2.21 2.84 0.28 1.01 1.92 91.36 26831.22 134160.00 247537.23 5548.93
Carbon offsetting
595 846 0 0 3.51 0.3746 111775.287 22893.7521 49356.4674 -15223.3 -14858.29 71.50 50.00 155523.00 89250.00 184100.47 428873.47 -4.45 3.15 0.28 1.01 -0.01 100.06 29128.65 134160.00 301501.55 16088.08
provided Elec. & heating
TSC area m2
PV area m2
Heating (KWh/m2)
Lighting (KWh/m2)
Hot water (KWh/m2)
TSC fan power
(KWh/m2)
generated Elec by PV
(KWh)
purchased from grid
elec (KWh)
Exported Elec (KWh)
Elec cost £
Energy cost Inc
FIT £
Wall Insulation price £/m2
Roof Insulation price £/m2
Total Insulation
price £
TSC cost £
PV Cost £Fabric cost
£Operational CO2
(kgCO2/m2.yr)
PV ECO2
(kgCO2/m2.yr)
TSC ECO2
(kgCO2/m2.yr)
Insulation ECO2
(kgCO2/m2.yr)
Total CO2
(kgCO2/m2.yr)CO2 saving
%
Energy saving (A)
£
Value of external footprint
area £
PV(A) £
NPV £
0 0 0 18.73 32.85 3.51 0 0 0 0 11957.4 14270.36 66.00 46.00 143460.00 0.00 0.00 143460.00 21.59 0.00 0.00 0.66 22.25 0.00 0.00 0.00 0.0025% 60 190 11.64 24.6375 3.51 0.1418 25073.559 60344.3764 0 4812.547 6388.1466 73.00 51.00 158754.00 9000.00 35168.82 202922.82 15.22 0.71 0.03 1.11 17.07 23.31 7882.21 141900.00 -325122.54 -384585.3750% 156 382 7.76 16.425 3.51 0.2194 50411.0502 41744.9171 6740.09727 -1768.62 -596.5383 73.00 51.00 158754.00 23400.00 70337.65 252491.65 9.39 1.42 0.07 1.11 11.99 46.10 14866.90 141900.00 -161059.42 -270091.0775% 377 573 3.88 8.2125 3.51 0.297 75616.5753 31431.6521 21630.292 -7537.34 -6768.775 73.00 51.00 158754.00 56550.00 105506.47 320810.47 3.58 2.13 0.18 1.11 7.00 68.53 21039.14 141900.00 -16079.87 -193430.34100% 589 764 0 0 3.51 0.3746 100822.1 25097.8909 40453.3519 -12925.9 -12560.86 73.00 51.00 158754.00 88350.00 140675.29 387779.29 -2.21 2.84 0.28 1.11 2.02 90.93 26831.22 141900.00 119970.30 -124348.99
Carbon offsetting
589 851 0 0 3.51 0.3746 112303.151 22800.3895 49790.3514 -15332.5 -14967.43 73.00 51.00 158754.00 88350.00 184969.90 432073.90 -4.56 3.17 0.28 1.11 0.00 100.02 29237.79 141900.00 176498.12 -112115.78
provided Elec. & heating
TSC area m2
PV area m2
Heating (KWh/m2)
Lighting (KWh/m2)
Hot water (KWh/m2)
TSC fan power
(KWh/m2)
generated Elec by PV
(KWh)
purchased from grid
elec (KWh)
Exported Elec (KWh)
Elec cost £
Energy cost Inc
FIT £
Wall Insulation price £/m2
Roof Insulation price £/m2
Total Insulation
price £
TSC cost £
PV Cost £Fabric cost
£Operational CO2
(kgCO2/m2.yr)
PV ECO2
(kgCO2/m2.yr)
TSC ECO2
(kgCO2/m2.yr)
Insulation ECO2
(kgCO2/m2.yr)
Total CO2
(kgCO2/m2.yr)CO2 saving
%
Energy saving (A)
£
Value of external footprint
area £
PV(A) £
NPV £
0 0 0 18.73 32.85 3.51 0 0 0 0 11957.4 14270.36 66.00 46.00 143460.00 0.00 0.00 143460.00 21.59 0.00 0.00 0.66 22.25 0.00 0.00 0.00 0.0025% 57 190 11.25 24.6375 3.51 0.1496 25073.559 60344.3764 0 4812.547 6347.5866 79.00 55.00 171678.00 8550.00 35168.82 215396.82 15.15 0.71 0.03 1.62 17.50 21.35 7922.77 167700.00 -749392.91 -821329.7350% 153 382 7.5 16.425 3.51 0.2246 50411.0502 41744.9171 6740.09727 -1768.62 -623.5783 79.00 55.00 171678.00 22950.00 70337.65 264965.65 9.34 1.42 0.07 1.62 12.45 44.04 14893.94 167700.00 -585647.36 -707153.0075% 371 573 3.75 8.2125 3.51 0.2996 75616.5753 31431.6521 21630.292 -7537.34 -6782.295 79.00 55.00 171678.00 55650.00 105506.47 332834.47 3.56 2.13 0.18 1.62 7.49 66.36 21052.66 167700.00 -440985.38 -630359.85100% 582 764 0 0 3.51 0.3746 100822.1 25097.8909 40453.3519 -12925.9 -12560.86 79.00 55.00 171678.00 87300.00 140675.29 399653.29 -2.21 2.84 0.28 1.62 2.53 88.65 26831.22 167700.00 -305252.77 -561446.07
Carbon offsetting
582 873 0 0 3.51 0.3746 115206.405 22286.8949 52176.7139 -15932.7 -15567.68 79.00 55.00 171678.00 87300.00 189751.73 448729.73 -5.15 3.25 0.28 1.62 0.00 100.00 29838.04 167700.00 -234625.76 -539895.48
provided Elec. & heating
TSC area m2
PV area m2
Heating (KWh/m2)
Lighting (KWh/m2)
Hot water (KWh/m2)
TSC fan power
(KWh/m2)
generated Elec by PV
(KWh)
purchased from grid
elec (KWh)
Exported Elec (KWh)
Elec cost £
Energy cost Inc
FIT £
Wall Insulation price £/m2
Roof Insulation price £/m2
Total Insulation
price £
TSC cost £
PV Cost £Fabric cost
£Operational CO2
(kgCO2/m2.yr)
PV ECO2
(kgCO2/m2.yr)
TSC ECO2
(kgCO2/m2.yr)
Insulation ECO2
(kgCO2/m2.yr)
Total CO2
(kgCO2/m2.yr)CO2 saving
%
Energy saving (A)
£
Value of external footprint
area £
PV(A) £
NPV £
0 0 0 18.73 32.85 3.51 0 0 0 0 11957.4 14270.36 66.00 46.00 143460.00 0.00 0.00 143460.00 21.59 0.00 0.00 0.66 22.25 0.00 0.00 0.00 0.0025% 55 190 10.65 24.6375 3.51 0.1616 25073.559 60344.3764 0 4812.547 6285.1866 82.00 57.00 178140.00 8250.00 35168.82 221558.82 15.04 0.71 0.03 1.72 17.49 21.40 7985.17 176300.00 -889668.22 -967767.0450% 150 382 7.1 16.425 3.51 0.2326 50411.0502 41744.9171 6740.09727 -1768.62 -665.1783 82.00 57.00 178140.00 22500.00 70337.65 270977.65 9.26 1.42 0.07 1.72 12.48 43.93 14935.54 176300.00 -726411.24 -853928.8975% 365 573 3.55 8.2125 3.51 0.3036 75616.5753 31431.6521 21630.292 -7537.34 -6803.095 82.00 57.00 178140.00 54750.00 105506.47 338396.47 3.52 2.13 0.17 1.72 7.55 66.09 21073.46 176300.00 -582237.83 -777174.30100% 575 764 0 0 3.51 0.3746 100822.1 25097.8909 40453.3519 -12925.9 -12560.86 82.00 57.00 178140.00 86250.00 140675.29 405065.29 -2.21 2.84 0.27 1.72 2.62 88.21 26831.22 176300.00 -446993.80 -708599.09
Carbon offsetting
575 878 0 0 3.51 0.3746 115866.236 22170.1916 52719.069 -16069.1 -15704.1 82.00 57.00 178140.00 86250.00 190838.51 455228.51 -5.28 3.27 0.27 1.72 -0.02 100.08 29974.46 176300.00 -373162.42 -684930.93
TSC + PV + 0.08 - 0.11
TSC + PV + 0.07 - 0.10
Office - London (West End)
TSC + PV + 2010 notional building fabric
TSC + PV + 0.17 - 0.24
TSC + PV + 0.15 - 0.21
TSC + PV + 0.13 - 0.19
TSC + PV + 0.12 - 0.17
TSC + PV + 0.11 - 0.15
PV (current FiT) + Insulation + TSC

233
Table B. 40 Office - PV (future FiT) + improving the building fabric U-value down to 0.07-0.1 W/m2.K (PUR) + TSC – taking into account the rental loss/gain- West-End
provided Elec. & heating
TSC area m2
PV area m2
Heating (KWh/m2)
Lighting (KWh/m2)
Hot water (KWh/m2)
TSC fan power
(KWh/m2)
generated Elec by PV
(KWh)
purchased from grid
elec (KWh)
Exported Elec
(KWh)
Elec cost £
Energy cost Inc
FIT £
Wall Insulation price £/m2
Roof Insulation price £/m2
Total Insulation
price £
TSC cost £
PV Cost £Fabric cost
£
Operational CO2
(kgCO2/m2.yr)
PV ECO2
(kgCO2/m2.yr)
TSC ECO2
(kgCO2/m2.yr)
Insulation ECO2
(kgCO2/m2.yr)
Total CO2
(kgCO2/m2.yr)CO2 saving
%
Energy saving (A)
£
Value of external footprint
area £
PV(A) £
NPV £
0 0 0 18.73 32.85 3.51 0 0 0 0 11957.4 14270.36 66.00 46.00 143460.00 0.00 0.00 143460.00 21.59 0.00 0.00 0.66 22.25 0.00 0.00 110940.00 0.00 0.0025% 75 190 14.04 24.6375 3.51 0.0938 25073.559 60344.3764 0 8448.213 10273.413 66.00 46.00 143460.00 11250.00 35168.82 189878.82 15.66 0.71 0.04 0.66 17.07 23.30 3996.95 110940.00 93884.21 47465.3950% 200 382 9.365 16.425 3.51 0.1873 50411.0502 41744.9171 6740.0973 5540.984 6879.984 66.00 46.00 143460.00 30000.00 70337.65 243797.65 9.68 1.42 0.09 0.66 11.86 46.70 7390.38 110940.00 173592.39 73254.7475% 425 573 4.68 8.2125 3.51 0.281 75616.5753 31431.6521 21630.292 3427.068 4278.8282 66.00 46.00 143460.00 63750.00 105506.47 312716.47 3.73 2.13 0.20 0.66 6.72 69.78 9991.53 110940.00 234690.89 65434.42100% 650 764 0 0 3.51 0.3746 100822.1 25097.8909 40453.352 1693.304 2058.3439 66.00 46.00 143460.00 97500.00 140675.29 381635.29 -2.21 2.84 0.31 0.66 1.60 92.82 12212.02 110940.00 286847.80 48672.50
Carbon offsetting
650 832 0 0 3.51 0.3746 109795.795 23243.862 47729.402 1106.318 1471.3576 66.00 46.00 143460.00 97500.00 180840.13 421800.13 -4.06 3.10 0.31 0.66 0.01 99.96 12799.00 110940.00 300635.51 22295.37
Carbon offsetting
650 832 0 0 3.51 0.3746 109795.795 23243.862 47729.402 -1518.8 -1153.76 66.00 46.00 143460.00 97500.00 180840.13 421800.13 -4.06 3.10 0.310.66
0.01 99.96 15424.12 110940.00 362296.83 83956.70
provided Elec. & heating
TSC area m2
PV area m2
Heating (KWh/m2)
Lighting (KWh/m2)
Hot water (KWh/m2)
TSC fan power
(KWh/m2)
generated Elec by PV
(KWh)
purchased from grid
elec (KWh)
Exported Elec
(KWh)
Elec cost £
Energy cost Inc
FIT £
Wall Insulation price £/m2
Roof Insulation price £/m2
Total Insulation
price £
TSC cost £
PV Cost £Fabric cost
£
Operational CO2
(kgCO2/m2.yr)
PV ECO2
(kgCO2/m2.yr)
TSC ECO2
(kgCO2/m2.yr)
Insulation ECO2
(kgCO2/m2.yr)
Total CO2
(kgCO2/m2.yr)CO2 saving
%
Energy saving (A)
£
Value of external footprint
area £
PV(A) £
NPV £
0 0 0 18.73 32.85 3.51 0 0 0 0 11957.4 14270.36 66.00 46.00 143460.00 0.00 0.00 143460.00 21.59 0.00 0.00 0.66 22.25 0.00 0.00 0.00 0.0025% 72 190 13.53 24.6375 3.51 0.104 25073.559 60344.3764 0 8448.213 10220.373 67.00 47.00 145830.00 10800.00 35168.82 191798.82 15.57 0.71 0.03 0.71 17.02 23.51 4049.99 117132.00 -6923.47 -55262.2950% 185 382 9.025 16.425 3.51 0.1941 50411.0502 41744.9171 6740.0973 5540.984 6844.624 67.00 47.00 145830.00 27750.00 70337.65 243917.65 9.62 1.42 0.09 0.71 11.84 46.79 7425.74 117132.00 72369.42 -28088.2275% 410 573 4.51 8.2125 3.51 0.2844 75616.5753 31431.6521 21630.292 3427.068 4261.1482 67.00 47.00 145830.00 61500.00 105506.47 312836.47 3.70 2.13 0.19 0.71 6.74 69.73 10009.21 117132.00 133052.63 -36323.84100% 630 764 0 0 3.51 0.3746 100822.1 25097.8909 40453.352 1693.304 2058.3439 67.00 47.00 145830.00 94500.00 140675.29 381005.29 -2.21 2.84 0.30 0.71 1.64 92.64 12212.02 117132.00 184794.26 -52751.04
Carbon offsetting
630 835 0 0 3.51 0.3746 110191.694 23173.84 48054.815 1081.871 1446.9109 67.00 47.00 145830.00 94500.00 181492.20 421822.20 -4.14 3.11 0.30 0.71 -0.02 100.09 12823.45 117132.00 199156.20 -79206.01
Carbon offsetting
630 835 0 0 3.51 0.3746 110191.694 23173.84 48054.815 -1561.14 -1196.104 67.00 47.00 145830.00 94500.00 181492.20 421822.20 -4.14 3.11 0.30 0.71 -0.02 100.09 15466.46 117132.00 261237.92 -17124.28
provided Elec. & heating
TSC area m2
PV area m2
Heating (KWh/m2)
Lighting (KWh/m2)
Hot water (KWh/m2)
TSC fan power
(KWh/m2)
generated Elec by PV
(KWh)
purchased from grid
elec (KWh)
Exported Elec
(KWh)
Elec cost £
Energy cost Inc
FIT £
Wall Insulation price £/m2
Roof Insulation price £/m2
Total Insulation
price £
TSC cost £
PV Cost £Fabric cost
£
Operational CO2
(kgCO2/m2.yr)
PV ECO2
(kgCO2/m2.yr)
TSC ECO2
(kgCO2/m2.yr)
Insulation ECO2
(kgCO2/m2.yr)
Total CO2
(kgCO2/m2.yr)CO2 saving
%
Energy saving (A)
£
Value of external footprint
area £
PV(A) £
NPV £
0 0 0 18.73 32.85 3.51 0 0 0 0 11957.4 14270.36 66.00 46.00 143460.00 0.00 0.00 143460.00 21.59 0.00 0.00 0.66 22.25 0.00 0.00 0.00 0.0025% 69 190 12.78 24.6375 3.51 0.119 25073.559 60344.3764 0 8448.213 10142.373 68.50 48.00 149061.00 10350.00 35168.82 194579.82 15.43 0.71 0.03 0.81 16.98 23.69 4127.99 123840.00 -115649.33 -166769.1550% 172 382 8.52 16.425 3.51 0.2042 50411.0502 41744.9171 6740.0973 5540.984 6792.104 68.50 48.00 149061.00 25800.00 70337.65 245198.65 9.53 1.42 0.08 0.81 11.84 46.78 7478.26 123840.00 -36954.94 -138693.5875% 400 573 4.26 8.2125 3.51 0.2894 75616.5753 31431.6521 21630.292 3427.068 4235.1482 68.50 48.00 149061.00 60000.00 105506.47 314567.47 3.65 2.13 0.19 0.81 6.78 69.51 10035.21 123840.00 23105.35 -148002.12100% 615 764 0 0 3.51 0.3746 100822.1 25097.8909 40453.352 1693.304 2058.3439 68.50 48.00 149061.00 92250.00 140675.29 381986.29 -2.21 2.84 0.29 0.81 1.73 92.22 12212.02 123840.00 74236.26 -164290.04
Carbon offsetting
615 838 0 0 3.51 0.3746 110587.592 23103.818 48380.228 1057.424 1422.4643 68.50 48.00 149061.00 92250.00 182144.27 423455.27 -4.22 3.12 0.29 0.81 0.01 99.98 12847.90 123840.00 89172.42 -190822.85
Carbon offsetting
615 838 0 0 3.51 0.3746 110587.592 23103.818 48380.228 -1603.49 -1238.448 68.50 48.00 149061.00 92250.00 182144.27 423455.27 -4.22 3.12 0.29 0.81 0.01 99.98 15508.81 123840.00 151674.54 -128320.73
provided Elec. & heating
TSC area m2
PV area m2
Heating (KWh/m2)
Lighting (KWh/m2)
Hot water (KWh/m2)
TSC fan power
(KWh/m2)
generated Elec by PV
(KWh)
purchased from grid
elec (KWh)
Exported Elec
(KWh)
Elec cost £
Energy cost Inc
FIT £
Wall Insulation price £/m2
Roof Insulation price £/m2
Total Insulation
price £
TSC cost £
PV Cost £Fabric cost
£
Operational CO2
(kgCO2/m2.yr)
PV ECO2
(kgCO2/m2.yr)
TSC ECO2
(kgCO2/m2.yr)
Insulation ECO2
(kgCO2/m2.yr)
Total CO2
(kgCO2/m2.yr)CO2 saving
%
Energy saving (A)
£
Value of external footprint
area £
PV(A) £
NPV £
0 0 0 18.73 32.85 3.51 0 0 0 0 11957.4 14270.36 66.00 46.00 143460.00 0.00 0.00 143460.00 21.59 0.00 0.00 0.66 22.25 0.00 0.00 0.00 0.0025% 66 190 12.36 24.6375 3.51 0.1274 25073.559 60344.3764 0 8448.213 10098.693 70.00 49.00 152292.00 9900.00 35168.82 197360.82 15.35 0.71 0.03 0.91 17.00 23.60 4171.67 129000.00 -199667.95 -253568.7750% 165 382 8.24 16.425 3.51 0.2098 50411.0502 41744.9171 6740.0973 5540.984 6762.984 70.00 49.00 152292.00 24750.00 70337.65 247379.65 9.48 1.42 0.08 0.91 11.89 46.58 7507.38 129000.00 -121315.55 -225235.2075% 392 573 4.12 8.2125 3.51 0.2922 75616.5753 31431.6521 21630.292 3427.068 4220.5882 70.00 49.00 152292.00 58800.00 105506.47 316598.47 3.63 2.13 0.19 0.91 6.86 69.19 10049.77 129000.00 -61597.27 -234735.74100% 605 764 0 0 3.51 0.3746 100822.1 25097.8909 40453.352 1693.304 2058.3439 70.00 49.00 152292.00 90750.00 140675.29 383717.29 -2.21 2.84 0.29 0.91 1.83 91.79 12212.02 129000.00 -10808.36 -251065.65
Carbon offsetting
605 843 0 0 3.51 0.3746 111247.422 22987.1147 48922.583 1016.68 1381.7198 70.00 49.00 152292.00 90750.00 183231.05 426273.05 -4.35 3.14 0.29 0.91 -0.01 100.06 12888.64 129000.00 5084.85 -277728.20
Carbon offsetting
605 843 0 0 3.51 0.3746 111247.422 22987.1147 48922.583 -1674.06 -1309.022 70.00 49.00 152292.00 90750.00 183231.05 426273.05 -4.35 3.14 0.29 0.91 -0.01 100.06 15579.38 129000.00 68287.64 -214525.41
provided Elec. & heating
TSC area m2
PV area m2
Heating (KWh/m2)
Lighting (KWh/m2)
Hot water (KWh/m2)
TSC fan power
(KWh/m2)
generated Elec by PV
(KWh)
purchased from grid
elec (KWh)
Exported Elec
(KWh)
Elec cost £
Energy cost Inc
FIT £
Wall Insulation price £/m2
Roof Insulation price £/m2
Total Insulation
price £
TSC cost £
PV Cost £Fabric cost
£
Operational CO2
(kgCO2/m2.yr)
PV ECO2
(kgCO2/m2.yr)
TSC ECO2
(kgCO2/m2.yr)
Insulation ECO2
(kgCO2/m2.yr)
Total CO2
(kgCO2/m2.yr)CO2 saving
%
Energy saving (A)
£
Value of external footprint
area £
PV(A) £
NPV £
0 0 0 18.73 32.85 3.51 0 0 0 0 11957.4 14270.36 66.00 46.00 143460.00 0.00 0.00 143460.00 21.59 0.00 0.00 0.66 22.25 0.00 0.00 0.00 0.0025% 63 190 12 24.6375 3.51 0.1346 25073.559 60344.3764 0 8448.213 10061.253 71.50 50.00 155523.00 9450.00 35168.82 200141.82 15.29 0.71 0.03 1.01 17.03 23.45 4209.11 134160.00 -283833.13 -340514.9650% 160 382 8 16.425 3.51 0.2146 50411.0502 41744.9171 6740.0973 5540.984 6738.024 71.50 50.00 155523.00 24000.00 70337.65 249860.65 9.43 1.42 0.08 1.01 11.94 46.35 7532.34 134160.00 -205773.88 -312174.5375% 382 573 4 8.2125 3.51 0.2946 75616.5753 31431.6521 21630.292 3427.068 4208.1082 71.50 50.00 155523.00 57300.00 105506.47 318329.47 3.60 2.13 0.18 1.01 6.93 68.87 10062.25 134160.00 -146348.74 -321218.21100% 595 764 0 0 3.51 0.3746 100822.1 25097.8909 40453.352 1693.304 2058.3439 71.50 50.00 155523.00 89250.00 140675.29 385448.29 -2.21 2.84 0.28 1.01 1.92 91.36 12212.02 134160.00 -95852.97 -337841.27
Carbon offsetting
595 846 0 0 3.51 0.3746 111775.287 22893.7521 49356.467 984.0843 1349.1243 71.50 50.00 155523.00 89250.00 184100.47 428873.47 -4.45 3.15 0.28 1.01 -0.01 100.06 12921.24 134160.00 -79194.13 -364607.60
Carbon offsetting
595 846 0 0 3.51 0.3746 111775.287 22893.7521 49356.467 -1730.52 -1365.481 71.50 50.00 155523.00 89250.00 184100.47 428873.47 -4.45 3.15 0.28 1.01 -0.01 100.06 15635.84 134160.00 -15430.81 -300844.28
provided Elec. & heating
TSC area m2
PV area m2
Heating (KWh/m2)
Lighting (KWh/m2)
Hot water (KWh/m2)
TSC fan power
(KWh/m2)
generated Elec by PV
(KWh)
purchased from grid
elec (KWh)
Exported Elec
(KWh)
Elec cost £
Energy cost Inc
FIT £
Wall Insulation price £/m2
Roof Insulation price £/m2
Total Insulation
price £
TSC cost £
PV Cost £Fabric cost
£
Operational CO2
(kgCO2/m2.yr)
PV ECO2
(kgCO2/m2.yr)
TSC ECO2
(kgCO2/m2.yr)
Insulation ECO2
(kgCO2/m2.yr)
Total CO2
(kgCO2/m2.yr)CO2 saving
%
Energy saving (A)
£
Value of external footprint
area £
PV(A) £
NPV £
0 0 0 18.73 32.85 3.51 0 0 0 0 11957.4 14270.36 66.00 46.00 143460.00 0.00 0.00 143460.00 21.59 0.00 0.00 0.66 22.25 0.00 0.00 0.00 0.0025% 60 190 11.64 24.6375 3.51 0.1418 25073.559 60344.3764 0 8448.213 10023.813 73.00 51.00 158754.00 9000.00 35168.82 202922.82 15.22 0.71 0.03 1.11 17.07 23.31 4246.55 141900.00 -410520.63 -469983.4550% 156 382 7.76 16.425 3.51 0.2194 50411.0502 41744.9171 6740.0973 5540.984 6713.064 73.00 51.00 158754.00 23400.00 70337.65 252491.65 9.39 1.42 0.07 1.11 11.99 46.10 7557.30 141900.00 -332754.52 -441786.1775% 377 573 3.88 8.2125 3.51 0.297 75616.5753 31431.6521 21630.292 3427.068 4195.6282 73.00 51.00 158754.00 56550.00 105506.47 320810.47 3.58 2.13 0.18 1.11 7.00 68.53 10074.73 141900.00 -273622.52 -450972.99100% 589 764 0 0 3.51 0.3746 100822.1 25097.8909 40453.352 1693.304 2058.3439 73.00 51.00 158754.00 88350.00 140675.29 387779.29 -2.21 2.84 0.28 1.11 2.02 90.93 12212.02 141900.00 -223419.89 -467739.19
Carbon offsetting
589 851 0 0 3.51 0.3746 112303.151 22800.3895 49790.351 951.4887 1316.5287 73.00 51.00 158754.00 88350.00 184969.90 432073.90 -4.56 3.17 0.28 1.11 0.00 100.02 12953.83 141900.00 -205995.41 -494609.31
Carbon offsetting
589 851 0 0 3.51 0.3746 112303.151 22800.3895 49790.351 -1786.98 -1421.941 73.00 51.00 158754.00 88350.00 184969.90 432073.90 -4.56 3.17 0.28 1.11 0.00 100.02 15692.30 141900.00 -141671.56 -430285.46
provided Elec. & heating
TSC area m2
PV area m2
Heating (KWh/m2)
Lighting (KWh/m2)
Hot water (KWh/m2)
TSC fan power
(KWh/m2)
generated Elec by PV
(KWh)
purchased from grid
elec (KWh)
Exported Elec
(KWh)
Elec cost £
Energy cost Inc
FIT £
Wall Insulation price £/m2
Roof Insulation price £/m2
Total Insulation
price £
TSC cost £
PV Cost £Fabric cost
£
Operational CO2
(kgCO2/m2.yr)
PV ECO2
(kgCO2/m2.yr)
TSC ECO2
(kgCO2/m2.yr)
Insulation ECO2
(kgCO2/m2.yr)
Total CO2
(kgCO2/m2.yr)CO2 saving
%
Energy saving (A)
£
Value of external footprint
area £
PV(A) £
NPV £
0 0 0 18.73 32.85 3.51 0 0 0 0 11957.4 14270.36 66.00 46.00 143460.00 0.00 0.00 143460.00 21.59 0.00 0.00 0.66 22.25 0.00 0.00 0.00 0.0025% 57 190 11.25 24.6375 3.51 0.1496 25073.559 60344.3764 0 8448.213 9983.2527 79.00 55.00 171678.00 8550.00 35168.82 215396.82 15.15 0.71 0.03 1.62 17.50 21.35 4287.11 167700.00 -834790.99 -906727.8250% 153 382 7.5 16.425 3.51 0.2246 50411.0502 41744.9171 6740.0973 5540.984 6686.024 79.00 55.00 171678.00 22950.00 70337.65 264965.65 9.34 1.42 0.07 1.62 12.45 44.04 7584.34 167700.00 -757342.45 -878848.1075% 371 573 3.75 8.2125 3.51 0.2996 75616.5753 31431.6521 21630.292 3427.068 4182.1082 79.00 55.00 171678.00 55650.00 105506.47 332834.47 3.56 2.13 0.18 1.62 7.49 66.36 10088.25 167700.00 -698528.03 -887902.50100% 582 764 0 0 3.51 0.3746 100822.1 25097.8909 40453.352 1693.304 2058.3439 79.00 55.00 171678.00 87300.00 140675.29 399653.29 -2.21 2.84 0.28 1.62 2.53 88.65 12212.02 167700.00 -648642.97 -904836.27
Carbon offsetting
582 873 0 0 3.51 0.3746 115206.405 22286.8949 52176.714 772.2132 1137.2532 79.00 55.00 171678.00 87300.00 189751.73 448729.73 -5.15 3.25 0.28 1.62 0.00 100.00 13133.11 167700.00 -627007.49 -932277.22
Carbon offsetting
582 873 0 0 3.51 0.3746 115206.405 22286.8949 52176.714 -2097.51 -1732.466 79.00 55.00 171678.00 87300.00 189751.73 448729.73 -5.15 3.25 0.28 1.62 0.00 100.00 16002.83 167700.00 -559600.71 -864870.44
provided Elec. & heating
TSC area m2
PV area m2
Heating (KWh/m2)
Lighting (KWh/m2)
Hot water (KWh/m2)
TSC fan power
(KWh/m2)
generated Elec by PV
(KWh)
purchased from grid
elec (KWh)
Exported Elec
(KWh)
Elec cost £
Energy cost Inc
FIT £
Wall Insulation price £/m2
Roof Insulation price £/m2
Total Insulation
price £
TSC cost £
PV Cost £Fabric cost
£
Operational CO2
(kgCO2/m2.yr)
PV ECO2
(kgCO2/m2.yr)
TSC ECO2
(kgCO2/m2.yr)
Insulation ECO2
(kgCO2/m2.yr)
Total CO2
(kgCO2/m2.yr)CO2 saving
%
Energy saving (A)
£
Value of external footprint
area £
PV(A) £
NPV £
0 0 0 18.73 32.85 3.51 0 0 0 0 11957.4 14270.36 66.00 46.00 143460.00 0.00 0.00 143460.00 21.59 0.00 0.00 0.66 22.25 0.00 0.00 0.00 0.0025% 55 190 10.65 24.6375 3.51 0.1616 25073.559 60344.3764 0 8448.213 9920.8527 82.00 57.00 178140.00 8250.00 35168.82 221558.82 15.04 0.71 0.03 1.72 17.49 21.40 4349.51 176300.00 -975066.31 -1053165.1350% 150 382 7.1 16.425 3.51 0.2326 50411.0502 41744.9171 6740.0973 5540.984 6644.424 82.00 57.00 178140.00 22500.00 70337.65 270977.65 9.26 1.42 0.07 1.72 12.48 43.93 7625.94 176300.00 -898106.34 -1025623.9975% 365 573 3.55 8.2125 3.51 0.3036 75616.5753 31431.6521 21630.292 3427.068 4161.3082 82.00 57.00 178140.00 54750.00 105506.47 338396.47 3.52 2.13 0.17 1.72 7.55 66.09 10109.05 176300.00 -839780.48 -1034716.95100% 575 764 0 0 3.51 0.3746 100822.1 25097.8909 40453.352 1693.304 2058.3439 82.00 57.00 178140.00 86250.00 140675.29 405065.29 -2.21 2.84 0.27 1.72 2.62 88.21 12212.02 176300.00 -790384.00 -1051989.29
Carbon offsetting
575 878 0 0 3.51 0.3746 115866.236 22170.1916 52719.069 731.4687 1096.5087 82.00 57.00 178140.00 86250.00 190838.51 455228.51 -5.28 3.27 0.27 1.72 -0.02 100.08 13173.85 176300.00 -767791.47 -1079559.98
Carbon offsetting
575 878 0 0 3.51 0.3746 115866.236 22170.1916 52719.069 -2168.08 -1803.04 82.00 57.00 178140.00 86250.00 190838.51 455228.51 -5.28 3.27 0.27 1.72 -0.02 100.08 16073.40 176300.00 -699684.03 -1011452.53
TSC + PV + 0.08 - 0.11
TSC + PV + 0.07 - 0.10
Office-London (West End)
TSC + PV + 2010 notional building fabric
TSC + PV + 0.17 - 0.24
TSC + PV + 0.15 - 0.21
TSC + PV + 0.13 - 0.19
TSC + PV + 0.12 - 0.17
TSC + PV + 0.11 - 0.15
PV (future FiT) + Insulation + TSC