shake-table tests of a 3-story, full-scale masonry wall...
TRANSCRIPT

Shake-Table Tests of a 3-Story, Full-scale Masonry Wall System March 25, 2011
1
SHAKE-TABLE TESTS OF A 3-STORY, FULL-SCALE MASONRY WALL SYSTEM
Andreas Stavridis1, Farhad Ahmadi2, Marios Mavros3, Ioannis Koutromanos3, Jaime Hernández2, Juan
Diego Rodríguez2, P. Benson Shing4, and Richard E. Klingner5
Abstract Between January 12 and February 8, 2011, a 3-story, full-scale, reinforced masonry shear wall specimen was tested on the large outdoor shake table at the University of California at San Diego. In this summary report, the characteristics of the specimen are reviewed; its development is described; its performance in the shake-table testing is summarized; and its response is compared to predictions from nonlinear finite-element modeling. The specimen was very strong and stiff, and suffered little damage when subjected to ground motions with intensities exceeding the MCE level. Its performance validates 2008 MSJC Code requirements for design and detailing of special reinforced masonry shear walls.
1. DESCRIPTION OF 3-STORY, FULL-SCALE MASONRY SPECIMEN
The 3-story, full-scale masonry specimen is shown schematically in Figure 1-1, and as constructed on the shake table, in Figure 1-2.
Figure 1-1 Schematic views of 3-story, full-scale reinforced masonry specimen The specimen was designed according to requirements of ASCE7-05 and the 2008 MSJC Code for Seismic Design Category D, and was thus considered a special load-bearing wall system. It was detailed in accordance with 2008 MSJC Code requirements. 1 Post-doctoral Researcher, University of California at San Diego, La Jolla, California. 2 Graduate Research Assistant, The University of Texas at Austin, Austin, Texas. 3 Graduate Student Researcher, University of California at San Diego, La Jolla, California. 4 Professor, Department of Structural Engineering, University of California at San Diego, La Jolla, California. 5 L. P. Gilvin Professor in Civil Engineering, The University of Texas at Austin, Austin, Texas.

Shake-Table Tests of a 3-Story, Full-scale Masonry Wall System March 25, 2011
2
Wall 2Wall 1 Wall 3
West East
Figure 1-2 3-story, full-scale masonry specimen as constructed on UCSD shake-table
Shake-Table Tests of a 3-Story, Full-scale Masonry Wall System March 25, 2011
3
2. DESIGN OF SPECIMEN
2.1 Plan and Elevation of Prototype Building
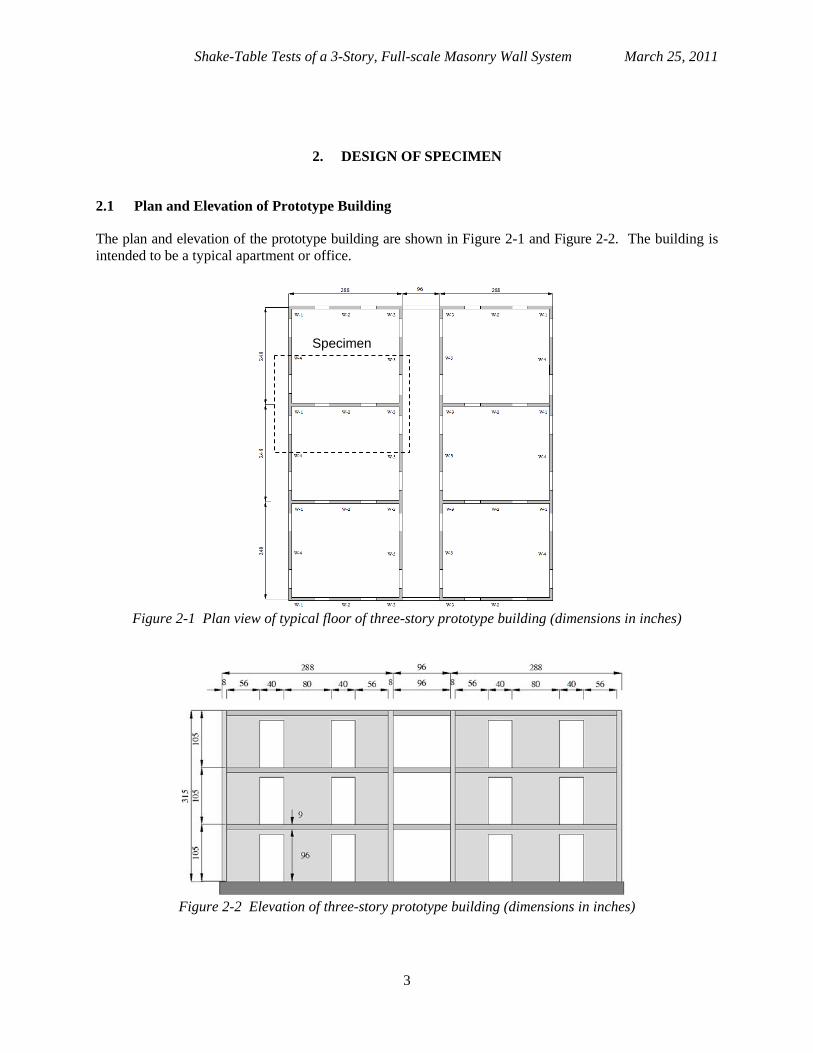
The plan and elevation of the prototype building are shown in Figure 2-1 and Figure 2-2. The building is intended to be a typical apartment or office.
Figure 2-1 Plan view of typical floor of three-story prototype building (dimensions in inches)
Figure 2-2 Elevation of three-story prototype building (dimensions in inches)
Specimen

Shake-Table Tests of a 3-Story, Full-scale Masonry Wall System March 25, 2011
4
2.2 Plan and Elevation of Specimen
The dashed rectangle in the plan view on the left-hand side of Figure 2-1 shows the plan area occupied by the specimen. In the specimen, the walls parallel to the direction of shaking are two symmetrical T-walls and one lineal wall. The walls perpendicular to the direction of shaking are two lineal half-walls. For consistency in describing the specimen, the walls parallel to the direction of shaking are described as “longitudinal” walls, and the walls perpendicular to the direction of shaking are described as “transverse” walls.
2.3 Force-based Seismic Design of Specimen
Design earthquake loads are calculated according to Section 1613 of the 2009 IBC. That section essentially references ASCE 7-05 (Supplement). Seismic design criteria are given in Chapter 11 of ASCE 7-05. The seismic design provisions of ASCE 7-05 (Supplement) begin in Chapter 12, which prescribes basic requirements (including the requirement for continuous load paths) (Section 12.1); selection of structural systems (Section 12.2); diaphragm characteristics and other possible irregularities (Section 12.3); seismic load effects and combinations (Section 12.4); direction of loading (Section 12.5); analysis procedures (Section 12.6); modeling procedures (Section 12.7); and specific design approaches. Four procedures are prescribed: an equivalent lateral force procedure (Section 12.8); a modal response-spectrum analysis procedure (Section 12.9); a simplified alternative procedure (Section 12.14); and a seismic response history procedure (Chapter 16 of ASCE7-05). The equivalent lateral-force procedure was used here, because it is relatively simple, and is permitted in most situations. The simplified alternative procedure is permitted in only a few situations. The other procedures are permitted in all situations, and are required in only a few situations. Because the equivalent lateral force procedure is being considered, the response spectrum curve is not required. Nevertheless, for completeness, it is shown here for a typical site in the San Diego area, which is considered for the design of the test specimen.
0
0.2
0.4
0.6
0.8
1
1.2
0 0.5 1 1.5 2 2.5 3 3.5 4
Respon
se Acceleration, g
Period, sec. Figure 2-3 Design response spectrum for San Diego, CA
The specimen was designed neglecting the effects of coupling effect of the floor and roof slabs. This greatly simplifies the design, and is generally conservative. Wall segments were designed and detailed to meet the requirements of the 2008 MSJC Code for special wall systems, including capacity design for shear. Wall 1 (Figure 1-2) had vertical reinforcement spliced at the mid-height of ground story, while wall

Shake-Table Tests of a 3-Story, Full-scale Masonry Wall System March 25, 2011
5
3 had vertical reinforcement spliced at the base, in a potential plastic hinge zone. The former complies with the requirement of ASCE 7-05, while the latter is permitted by the MSJC code. Walls were not provided with shear keys. Horizontal reinforcement in walls was placed starting in the lowest course. Control joints were introduced on each side of the lintel beams above door openings, and the flexural reinforcing bars in the lintels were debonded in regions beyond the control joints to reduce the coupling moments transmitted to the wall elements.
Shake-Table Tests of a 3-Story, Full-scale Masonry Wall System March 25, 2011
6
3. TESTING OF SPECIMEN
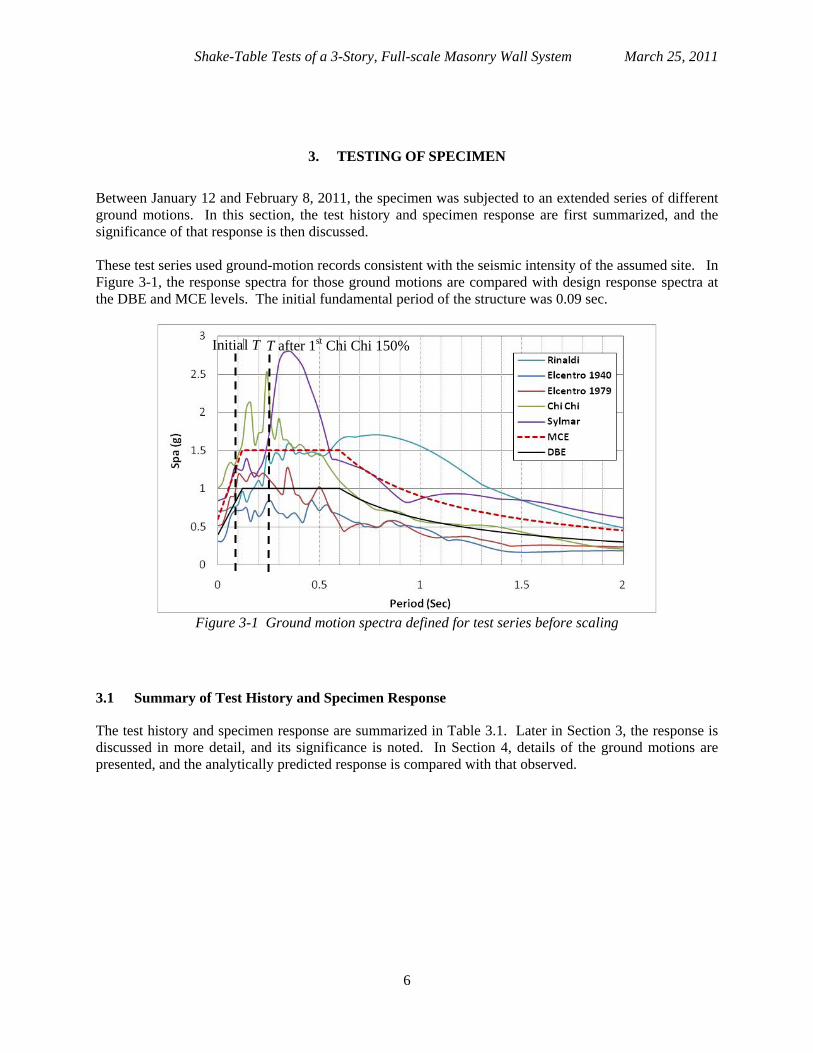
Between January 12 and February 8, 2011, the specimen was subjected to an extended series of different ground motions. In this section, the test history and specimen response are first summarized, and the significance of that response is then discussed. These test series used ground-motion records consistent with the seismic intensity of the assumed site. In Figure 3-1, the response spectra for those ground motions are compared with design response spectra at the DBE and MCE levels. The initial fundamental period of the structure was 0.09 sec.
Figure 3-1 Ground motion spectra defined for test series before scaling
3.1 Summary of Test History and Specimen Response
The test history and specimen response are summarized in Table 3.1. Later in Section 3, the response is discussed in more detail, and its significance is noted. In Section 4, details of the ground motions are presented, and the analytically predicted response is compared with that observed.
Initia
l T T after 1st Chi Chi 150%

Shake-Table Tests of a 3-Story, Full-scale Masonry Wall System March 25, 2011
7
Table 3.1 Summary of test history and specimen response Date Ground Motion Level of Excitation Observations
1/12/2011 20% El Centro 1979 Structural period T before and after test = 0.09 sec
45% El Centro 1979 1/13/2011 90% El Centro 1979 Expected Design Level
Earthquake based on original ground motion record
1/18/2011 120% El Centro 1979
Realized Design Level Earthquake based on table motion
Flexural cracks developed at ends of lintel beams near control joints
150% El Centro 1979
Slightly below MCE Flexural cracks developed at wall base; vertical reinforcement in flange of Wall 1 (west T-wall) reached tensile strain of 0.01; similar strain level for rebars in Wall 2 (middle wall)
1/19/2011 180% El Centro 1979
Slightly above MCE
250% El Centro 1979
(direction of shaking reversed)
Wall 2 (middle wall) had very minor base sliding; fine diagonal shear cracks developed on Wall 1 (west T-wall); max. 1st story drift = 0.25%; after test T = 0.2 sec
300% El Centro 1940
Max. 1st story drift = 0.14%; after test T = 0.2 sec
1/20/2011 125% Sylmar Slightly above MCE Diagonal shear cracks extended in Wall 1 (west T-wall); horizontal flexural cracks develop near top of 1st and 2nd story walls; max. 1st story drift = 0.23%
1/26/2011 160% Sylmar Above MCE Diagonal shear cracks extended in Wall 1 (west T-wall); flexural cracks observed on top of 2nd story slab close to edges of door openings; max. 1st story drift = 0.38%
140% Rinaldi Slightly above MCE After test T= 0.22 sec 2/8/2011 100% Chi Chi Above MCE Flexural –shear cracks developed near bottom
of T-walls; cracks on top of 2nd story slab extended throughout the entire width (10ft); max. 1st story drift = 0.35%
1st 150% Chi Chi About 2 X MCE Severe diagonal shear cracks developed in both 1st story T-walls; residual shear crack width of 0.06 in.; Wall 2 (middle wall) slid on the base; max. 1st story drift = 0.73%; after test T = 0.25 sec
2nd 150% Chi Chi Structure was severely damaged; residual shear crack width of 0.38 in.; signs of toe crushing in webs of T walls; max. 1st story drift = 1.52 %

Shake-Table Tests of a 3-Story, Full-scale Masonry Wall System March 25, 2011
8
3.2 Significance of Specimen from a Code Viewpoint
The specimen was stiffer and stronger than anticipated. It successfully resisted repeated ground motions well in excess of MCE. Its response was a validation of 2008 MSJC Code requirements for the design and detailing of special reinforced masonry shear walls. The 2008 MSJC permits splices of vertical reinforcement in potential plastic hinge zones, and does not require shear keys at wall bases. ASCE7-05, in contrast, prohibits splices in plastic hinge zones, and requires shear keys. In this specimen, Wall 1 (the west wall) had its vertical reinforcement spliced at mid-height, while Wall 3 (the east wall) had its vertical reinforcement spliced at the base. No difference in performance was observed, even though both splices were subjected to severe histories of reversed cyclic shear. The response of this specimen may argue for the validity of the MSJC requirements over those of ASCE7-05. However, it should be noted that the coupling shear of the roof and floor slabs reduced the axial compressive force in a T-wall when its web was subjected to flexural compression, and thereby, alleviated toe crushing. The performance of lap splices in plastic hinge zones with severe flexural compression requires further investigations. This will be investigated in the quasi-static tests of wall segments to be conducted at the Washington State University. Response of the specimen validates 2008 MSJC Code requirements that transverse reinforcement be hooked around extreme-fiber vertical reinforcement. It also suggests that horizontal reinforcement should be placed in the lowest course. Response of the specimen validates the 2008 MSJC Code requirements for capacity design for shear of special reinforced masonry shear walls. Because of the unexpected strength of the coupling slabs, the walls in the direction of shaking were subjected to greater shears than anticipated in design. Nevertheless, they continued to be effective in resisting shear, with no visible signs of fracture of transverse reinforcement.
3.3 Significance of Specimen from a Design Viewpoint
From a design viewpoint, the specimen’s response was quite interesting. In contrast to the design assumption of zero coupling, the floor planks actually were very stiff, strong coupling elements. The coupling moments developed by the slabs contributed to the high lateral stiffness and strength of the structure. The coupling helped to prevent toe crushing in the web of the T-walls by alleviating the compressive stress when the web was subjected to flexural compression. In the later stage of the test series, the middle wall began to slide, and did not contribute much to the lateral load resistance. Most of the lateral resistance came from the T-wall on the leeward side (the T-wall acting in compression). The rotational restraints introduced at the top of the bottom-story walls by the floor slab reduced the effective shear-span ratio of the walls and eventually led to the shear failure of the T-walls.
3.4 Details of Specimen Response
Details of specimen response are shown in the following figures, and are explained below with reference to those figures. As shown in Figure 3-2 through Figure 3-5, initial response of the specimen was marked by the appearance of flexural cracks at the bases of Wall 1, Wall 2, and Wall 3, and by the appearance of lintel cracks at the control joints on both ends of the lintel connecting Wall 1 and Wall 2. Although the longitudinal reinforcement passing through the lintels had been debonded on one side of each control joint, the strong connection between the precast planks and Walls 1, 2, and 3 caused the lintels to move

Shake-Table Tests of a 3-Story, Full-scale Masonry Wall System March 25, 2011
9
with the planks rather than the walls, and caused some lintel cracking. The strut action of the lintels also tended to reduce the clear height of the walls.
Figure 3-2 Lintel cracks after 120% El Centro
1979
Figure 3-3 Flexural crack at base of Wall 2 after
150% El Centro 1979
Figure 3-4 Flexural crack at base of Wall 1 flange
after 150% El Centro 1979
Figure 3-5 Flexural crack at base of Wall 1 web
after 180% El Centro 1979

Shake-Table Tests of a 3-Story, Full-scale Masonry Wall System March 25, 2011
10
As shown in Figure 3-6 through Figure 3-9, more severe shaking caused the start of shear cracks at the bases of Wall 1 and Wall 3, and produced some minor base sliding of Wall 2.
Figure 3-6 Shear cracks on web of Wall 1 after 250% El Centro 1979
Figure 3-7 Evidence of minor base sliding of Wall
2 after 250% El Centro 1979
Figure 3-8 Shear cracking of Wall 1 after 100% Chi Chi
Figure 3-9 Shear cracking of Wall 3 after 100% Chi Chi

Shake-Table Tests of a 3-Story, Full-scale Masonry Wall System March 25, 2011
11
As shown in Figure 3-10 though Figure 3-14, still stronger shaking increased the observed flexural and shear cracking.
Figure 3-10 Cracks on 2nd level slab after 100%
Chi Chi
Figure 3-11 Wall 3, second story after 100% Chi Chi
Figure 3-12 Wall 2, second story after 100% Chi
Chi
Figure 3-13 Base of Wall 3 after 100% Chi Chi

Shake-Table Tests of a 3-Story, Full-scale Masonry Wall System March 25, 2011
12
Figure 3-14 Base of Wall 2 after 100% Chi Chi
Figure 3-15 Wall 3 after first run of 150% Chi Chi
Shake-Table Tests of a 3-Story, Full-scale Masonry Wall System March 25, 2011
13
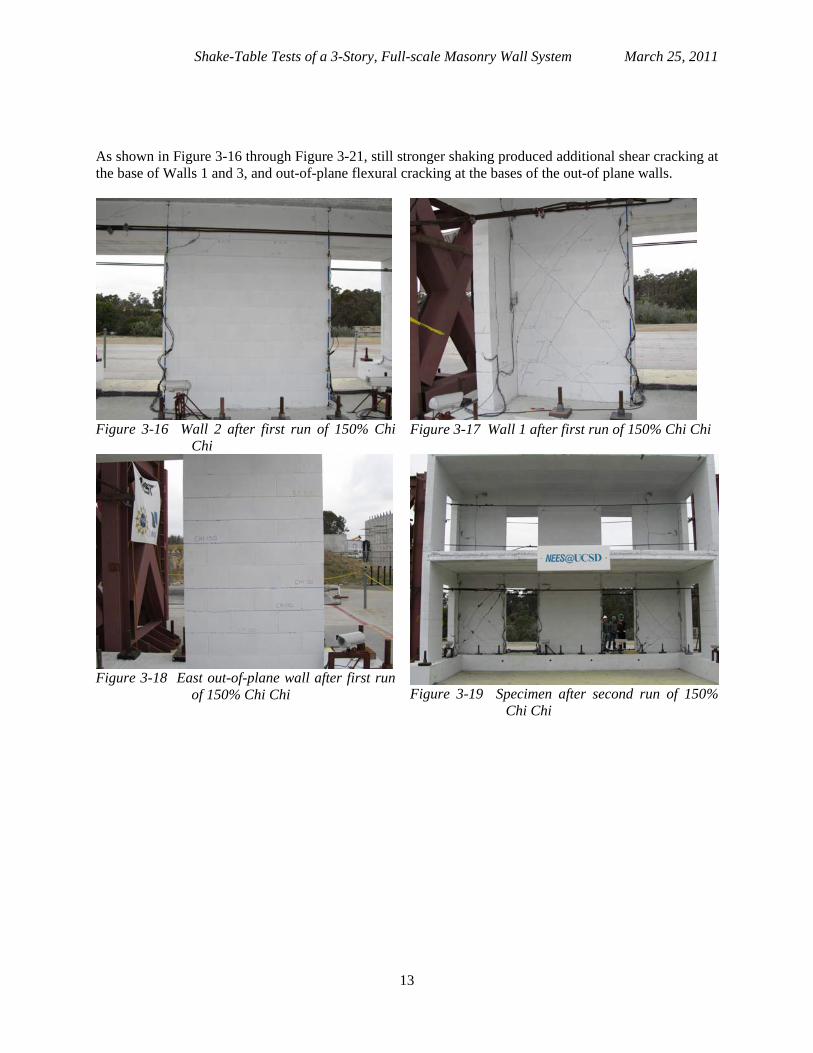
As shown in Figure 3-16 through Figure 3-21, still stronger shaking produced additional shear cracking at the base of Walls 1 and 3, and out-of-plane flexural cracking at the bases of the out-of plane walls.
Figure 3-16 Wall 2 after first run of 150% Chi
Chi
Figure 3-17 Wall 1 after first run of 150% Chi Chi
Figure 3-18 East out-of-plane wall after first run
of 150% Chi Chi
Figure 3-19 Specimen after second run of 150% Chi Chi

Shake-Table Tests of a 3-Story, Full-scale Masonry Wall System March 25, 2011
14
Figure 3-20 Base of Wall 1 after second run of
150% Chi Chi
Figure 3-21 Base of Wall 3 after second run of
150% Chi Chi

Shake-Table Tests of a 3-Story, Full-scale Masonry Wall System March 25, 2011
15
As shown in Figure 3-22 through Figure 3-25, continued shaking caused crushing at the corner of a door opening due to the rocking of the lintel beam, the widening of shear cracks at the bases of Wall 1 and Wall 3, and the crushing of the toe of Wall 3. Of particular significance is the splice region at the compression toe of base of Wall 3, shown in Figure 3-25. Note how the lowest transverse reinforcing bar, hooked around the splice, keeps the spliced bars from coming apart.
Figure 3-22 Corner of first-story lintel beam after
second run of 150% Chi Chi
Figure 3-23 Base of Wall 1 after second run of
150% Chi Chi
Figure 3-24 Toe at base of of Wall 3 after second
run of 150% Chi Chi
Figure 3-25 Toe at base of of Wall 3 after second
run of 150% Chi Chi

Shake-Table Tests of a 3-Story, Full-scale Masonry Wall System March 25, 2011
16
Finally, at the end of the test, Figure 3-26 shows how wide shear cracks had opened in Wall 1 and Wall 3 at the ground level. As shown in Figure 3-27, flexural cracking near the top of Wall 2 indicated that the floor planks were still acting as stiff, strong coupling elements.
Figure 3-26 Shear crack on ground story of Wall 1
after second run of 150% Chi Chi
Figure 3-27 Wall 2 at second story after second
run of 150% Chi Chi

Shake-Table Tests of a 3-Story, Full-scale Masonry Wall System March 25, 2011
17
4. RESPONSE TIME HISTORIES AND COMPARISON TO ANALYTICAL RESULTS
In this section, selected response time histories are provided, and the response as predicted by an OpenSees model is compared with that observed.
260 261 262 263 264 265 266 267 268-0.3
-0.25
-0.2
-0.15
-0.1
-0.05
0
0.05
0.1
0.15
0.2
time (sec)
dri
ft (
in)
El Centro 1940 250%
Test resultsModel results
Figure 4-1 Response history for 250% El Centro 1979
342 344 346 348 350 352 354-0.5
-0.4
-0.3
-0.2
-0.1
0
0.1
0.2
0.3
time (sec)
dri
ft (
in)
Sylmar 160%
Test resultsModel results
Figure 4-2 Response history for 160% Sylmar

Shake-Table Tests of a 3-Story, Full-scale Masonry Wall System March 25, 2011
18
435 440 445 450 455 460 465-0.5
-0.4
-0.3
-0.2
-0.1
0
0.1
0.2
0.3
time (sec)
dri
ft (
in)
Chi Chi 100%
Test resultsModel results
Figure 4-3 Response history for 100% Chi Chi
540 545 550 555 560 565 570-0.8
-0.6
-0.4
-0.2
0
0.2
0.4
0.6
0.8
time (sec)
dri
ft (
in)
Chi Chi 150%
Test resultsModel results
Figure 4-4 Response history for first run of 150% Chi Chi

Shake-Table Tests of a 3-Story, Full-scale Masonry Wall System March 25, 2011
19
-0.4 -0.3 -0.2 -0.1 0 0.1 0.2 0.3 0.4-400
-300
-200
-100
0
100
200
300
drift (in)
bas
e sh
ear
(kip
s)
Chi Chi 100%
Test resultsModel results
Figure 4-5 Base shear versus ground-story drift, 100% Chi Chi
-0.8 -0.6 -0.4 -0.2 0 0.2 0.4 0.6 0.8-500
-400
-300
-200
-100
0
100
200
300
400
drift (in)
bas
e sh
ear
(kip
s)
Chi Chi 150%
Test resultsModel results
Figure 4-6 Base shear versus ground-story drift, first run of 150% Chi Chi