shale gas plays: development, economics, and the future
TRANSCRIPT

Shale Gas Plays: Development, Economics, and the Future
University of Texas Center for Energy Economics
2010 Annual Meeting & Natural Gas Forum
December 1, 2010
Richard G. SmeadDirector, Navigant Consulting Inc.
Navigant Consulting Inc.30 South Wacker DriveSuite 3100Chicago, IL 60606(312) 583‐5700
www.navigantconsulting.com
909 Fannin StreetSuite 1900Houston, TX(713) 646‐5029
©2010 Navigant Consulting, Inc.

1©2010 Navigant Consulting, Inc. 1
Proved Reserves Plus Assessed Resources—Life of the Gas Resource
Yes, There Is a Lot of Gas Resource: The Recognition Started with the American Clean Skies Foundation
2008
82 years at
2006 Prod. Rate
88 years at
2007 Prod. Rate
118 years at
2007 Prod. Rate
-
U.S. Total Gas Supply (Tcf)
500
1,000
1,500
2,000
2,500
PGC 2006 MeanAssessment
Navigant Study PGC 2008 EstimateReleased June 2009
tcf
ShaleResource
All OtherTechnicallyRecoverableResource
• In 2006, the Potential Gas Committee (PGC) estimated 1,530 Tcf of total Recoverable Resource.
• In 2008, the American Clean Skies Foundation had Navigant perform the North AmericanNatural Gas Supply Assessment. This study found that shale and other unconventional supplieshad increased the resource to as much as 2,247 Tcf, including 842 Tcf of shale gas.. This would be118 years of production at 2007 levels.
• In June 2009, PGC issued its 2008 updated study—2,076 Tcf, including 616 Tcf of shale, also over100 years’worth.

U.S. Shale Gas Basins Align with the Nationwide Pipeline Grid
American Clean Skies Foundation
Sources: EIA, US Natural Gas Pipeline Nework
©2010 Navigant Consulting, Inc.

3©2010 Navigant Consulting, Inc.
‐
10.0
20.0
30.0
40.0
50.0
60.0
70.01990
1991
1992
1993
1994
1995
1996
1997
1998
1999
2000
2001
2002
2003
2004
2005
2006
2007
2008
2009
2010
Bcf per Day
Sources of U.S. Gas Supply, 1990 to 2010
Net LNG Imports
Net Pipeline Imports
Net Dry Gas Production
Total Gas Supply: For 15 years, Domestic Production was Flat, with Growing Imports—Then in 2005, the Ramp‐up Began

4©2010 Navigant Consulting, Inc.
45.0
50.0
55.0
60.0
65.0
70.0
2005 2006 2007 2008 2009 2010
Bcf per Day
The Rapid Change from 2005
Net LNG Imports
Net Pipeline Imports
Net Dry Gas Production
Total Consumption
The Last Five Years Have Been Very Different—Thanks to Domestic Growth, Supply Now Exceeds Demand, and Imports are Shrinking

©2010 Navigant Consulting, Inc. 5
40.0
42.0
44.0
46.0
48.0
50.0
52.0
54.0
56.0
58.0
60.0
Jan‐05
Jun‐05
Nov‐05
Apr‐06
Sep‐06
Feb‐07
Jul‐0
7
Dec‐07
May‐08
Oct‐08
Mar‐09
Aug‐09
Jan‐10
Jun‐10
Lower 48 Production, Total and Onshore, 2005‐2010Bcf p
er Day, D
ry
Average Total Pre‐Katrina
Gustav
and Ike
Katrina
and Rita
The Really Dramatic Story is Onshore, where Between 2005 and 2008, Enough Production Was Added to Replace Offshore
From 2005 to 2008, the
daily energy added from onshore sources
exceeds the thermal
content of all the oil we
import from Saudi Arabia.

6©2010 Navigant Consulting, Inc.
0.0
2.0
4.0
6.0
8.0
10.0
12.0
14.0
16.0
1990
1995
2000
2005
2010
2015
2020
2025
2030
EIA Projected Shale Production EstimatesBcf p
er Day, D
ry
Actuals to 2006
What about Shale Gas? EIA Developed a Robust Forecast in 2010

7©2010 Navigant Consulting, Inc.
0.0
2.0
4.0
6.0
8.0
10.0
12.0
14.0
16.0
1990
1995
2000
2005
2010
2015
2020
2025
2030
Shale Actual Production Through 2010Bcf p
er Day, D
ry
But Actual Production has Far Exceeded Even the Aggressive 2010 Forecast

©2010 Navigant Consulting, Inc. 8
Why? Didn’t drilling drop off a lot since 2008?
Yes, in total—but horizontal drilling is going strong. . .
0
200
400
600
800
1,000
1,200
1,400
1,600
1,800
Source: Smith Bits
Gas‐Dire
cted
Drilling Rigs in
Service

9©2010 Navigant Consulting, Inc.
0.0
5.0
10.0
15.0
20.0
25.0
30.0
35.0
40.0
1990
1995
2000
2005
2010
2015
2020
2025
2030
Producer 2009 Composite ForecastBcf p
er Day, D
ry
Producers Expect the Trend to Continue if There’s a Demand for the Gas—2010 Actuals Exceeded Even the Producers’ 2009 Forecast

10©2010 Navigant Consulting, Inc.
50.0
55.0
60.0
65.0
70.0
75.0
80.0
85.0
90.0
95.0
100.0
1990
1995
2000
2005
2010
2015
2020
2025
2030
Total Supply per EIA and with Producer EstimateBcf p
er Day, D
ry
20 Bcf/Day
Based on that Producer Forecast, There Would Be Enough Additional Supply by 2020 to Displace Over Half of All U.S. Coal‐Fired Generation
11©2010 Navigant Consulting, Inc.
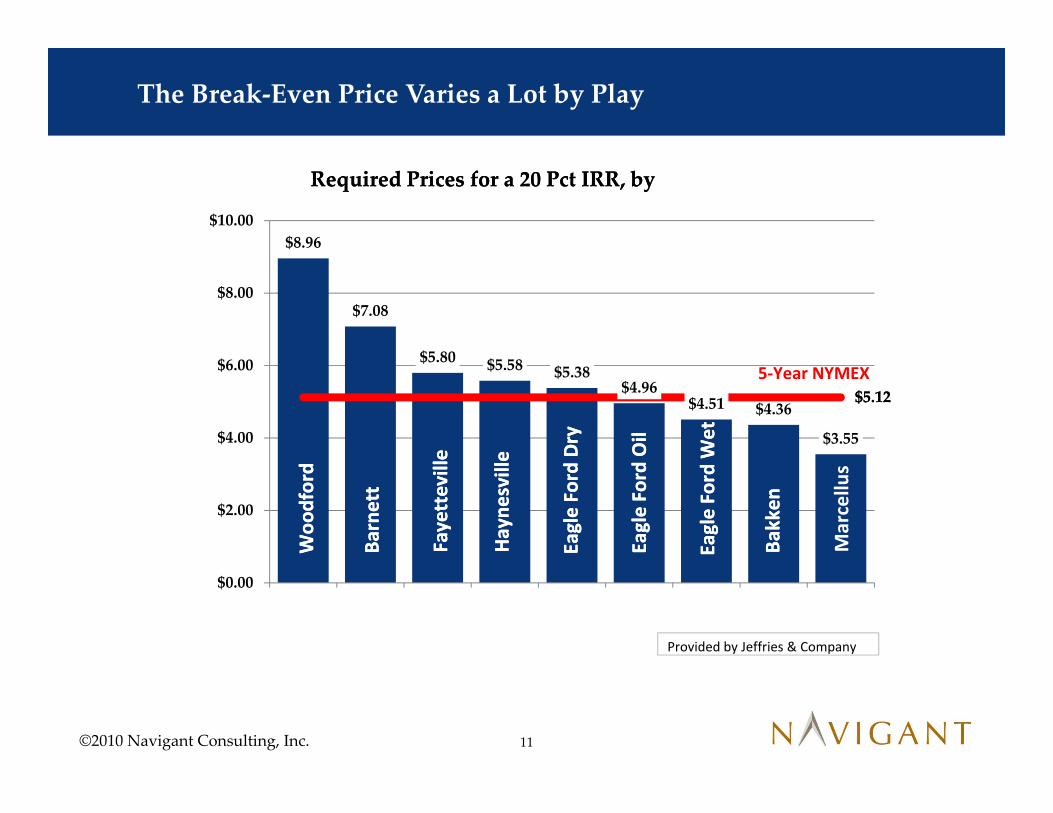
The Break‐Even Price Varies a Lot by Play
$8.96
$7.08
$5.80 $5.58 $5.38$4.96
$4.51 $4.36
$3.55
$0.00
$2.00
$4.00
$6.00
$8.00
$10.00
1 2 3 4 5 6 7 8 9
Woo
dford
Barnett
Fayetteville
Hayne
sville
Eagle Ford Dry
Eagle Ford Oil
Eagle Ford W
et
Bakken
$5.12
Required Prices for a 20 Pct IRR, by
5‐Year NYMEX
Woo
dford
Barnett
Fayetteville
Hayne
sville
Eagle Ford Dry
Eagle Ford Oil
Eagle Ford W
et
Bakken
$5.12
Required Prices for a 20 Pct IRR, by
Provided by Jeffries & Company
Marcellu
s

12©2010 Navigant Consulting, Inc.
Schlumberger Sees a Steady Decline in Break‐Even Costs Because of Technological Advances

13©2010 Navigant Consulting, Inc.
Not the Result of Big Tech Breakthroughs—Just Getting Very Good at Using the Existing Tools

14©2010 Navigant Consulting, Inc.
What Has All this Meant for the Competitive Position of Gas?
Delivered Eastern Coal vs. Appalachian Gas
$0.00
$2.00
$4.00
$6.00
$8.00
$10.00
$12.00
$14.00
$16.00
Dominion, South Point Central Appalachian Coal
Delivered Price per M
MBtu

15©2010 Navigant Consulting, Inc.
44.0%
45.0%
46.0%
47.0%
48.0%
49.0%
19.0%
20.0%
21.0%
22.0%
23.0%
24.0%
Dec 08
Jan 09
Feb 09
Mar 09
Apr 09
May 09
June 09
July 09
Aug 09
Sept 09
Oct 09
Nov 09
Dec 09
Jan 10
Feb 10
Mar 10
Apr 10
May 10
June 10
July 10
Gas and Coal Generation Market ShareRolling 12‐Month Totals 2008 ‐ 2010
Gas M
arket S
hare
Coal M
arket S
hare
Gas Has Gained Market Share vs. Coal, A Little Over 2 Percent

Market and Development Impact• The Market is oversupplied—So prices have been in the $3 to $4 range, when
most think it takes $6 for full development—We need more demand.— Until now, lease retention, NGL production, and being in the “Sweet Spots”
has kept development going at a high pace.— But without a stronger market, the industry will redirect toward oil, slowing
the pace of development .
• The added supply, on top of EIA’s highest estimates, is enough to replace half of all coal use by 2020! This is a huge opportunity, but it is also a huge amount of supply to find a home for.
• Meanwhile, land impact, water questions around hydraulic fracturing, and road impacts are causing opposition to development.
• Of all those issues, hydraulic fracturing has been the most controversial—water supply and produced‐water handling are the biggest environmental issues faced by the industry.
©2010 Navigant Consulting, Inc. 16
Challenges Faced in the United States

KeyC O N T A C T S
17©2010 Navigant Consulting, Inc. Confidential and proprietary. Do not distribute or copy. E N E R G Y
Rick Smead | [email protected] direct
Gordon Pickering \ [email protected] direct