shale oil as steam cracking feedstock -gc × gc ... · gc ×gc characterization and coilsim1d...
TRANSCRIPT
Shale oil as steam cracking feedstock:
GC × GC characterization and COILSIM1D modeling
Nenad D. Ristic, Marko R. Djokic, Ismaël Amghizar, Kevin M. Van Geem, Guy B. Marin
2017 AICHE ANNUAL MEETING, 30TH OF OCTOBER 2017
Laboratory for Chemical Technology, Ghent University

OUTLINE
• Introduction
• Shale Oil characterization
• CoilSim1D simulation: Shale Oil as a steam cracking feed
• Conclusions
2/22

INTRODUCTION
Ethane
LPG
Naphtha
Kerosene
Atmospheric Gas Oil
Shale oil
Ethylene
Propylene
1,3-Butadiene
BTX
Heart of a petrochemical plant
The main source of ethylene, propylene and other valuable hydrocarbons
3/22
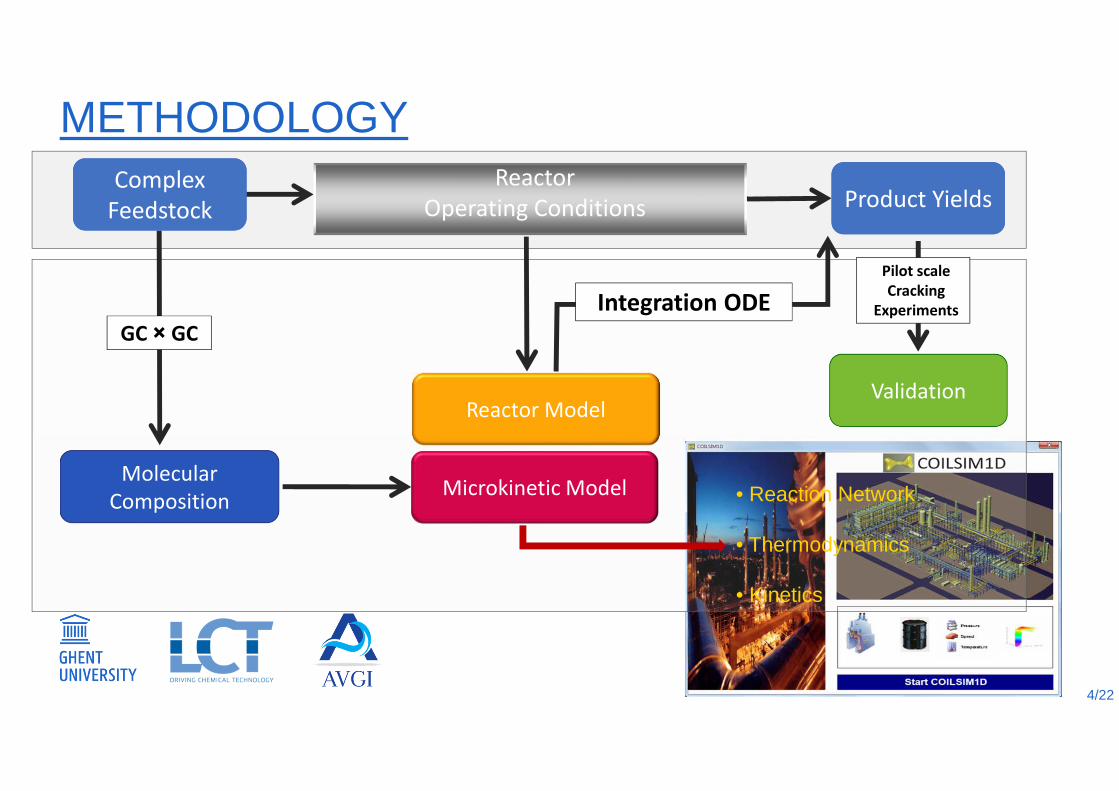
Molecular
Composition
Validation
Integration ODE
Reactor
Operating Conditions
Reactor Model
Microkinetic Model
Product YieldsProduct YieldsComplex
Feedstock
Complex
Feedstock
METHODOLOGY
Pilot scale
Cracking
Experiments
• Reaction Network
• Thermodynamics
• Kinetics
GC × GC
4/22
OUTLINE
• Introduction
• Shale Oil characterization
• CoilSim1D simulation: Shale Oil as a steam cracking feed
• Conclusions
5/22
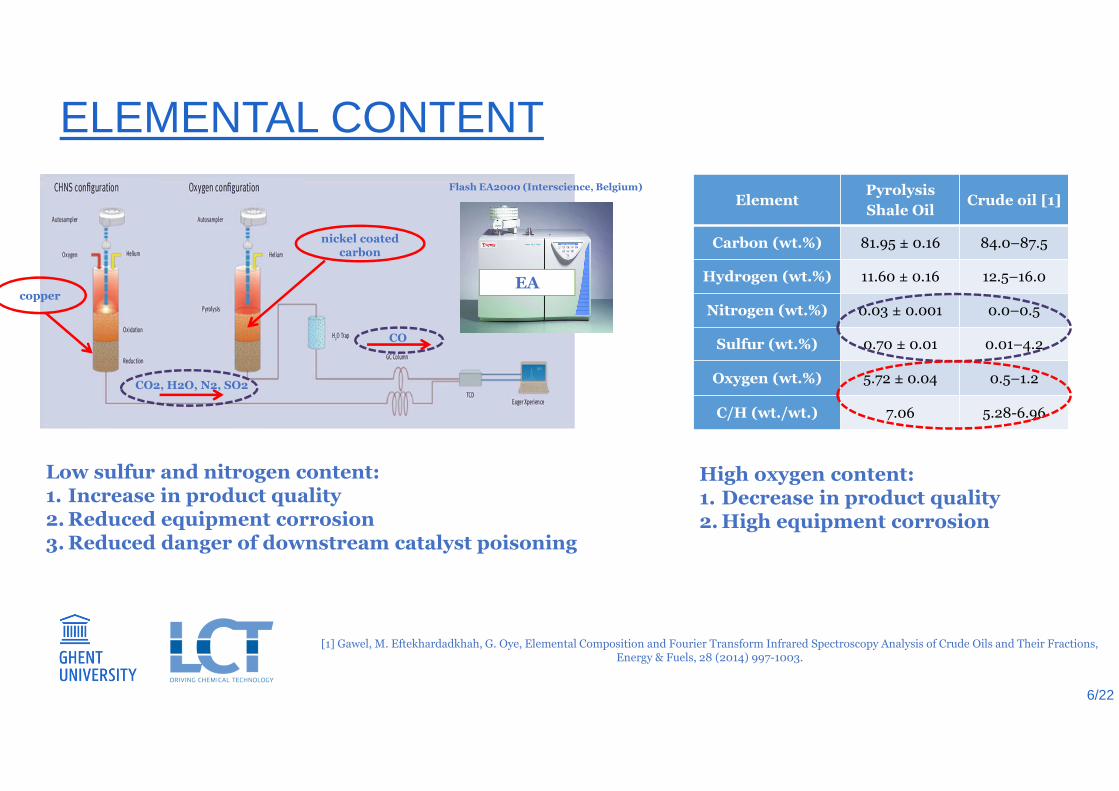
ELEMENTAL CONTENT
copper
CO2, H2O, N2, SO2
CO
nickel coated carbon
Flash EA2000 (Interscience, Belgium)
EA
ElementPyrolysis
Shale OilCrude oil [1]
Carbon (wt.%) 81.95 ± 0.16 84.0–87.5
Hydrogen (wt.%) 11.60 ± 0.16 12.5–16.0
Nitrogen (wt.%) 0.03 ± 0.001 0.0–0.5
Sulfur (wt.%) 0.70 ± 0.01 0.01–4.2
Oxygen (wt.%) 5.72 ± 0.04 0.5–1.2
C/H (wt./wt.) 7.06 5.28-6.96
Low sulfur and nitrogen content: 1. Increase in product quality2. Reduced equipment corrosion3. Reduced danger of downstream catalyst poisoning
High oxygen content: 1. Decrease in product quality2. High equipment corrosion
[1] Gawel, M. Eftekhardadkhah, G. Oye, Elemental Composition and Fourier Transform Infrared Spectroscopy Analysis of Crude Oils and Their Fractions, Energy & Fuels, 28 (2014) 997-1003.
6/22
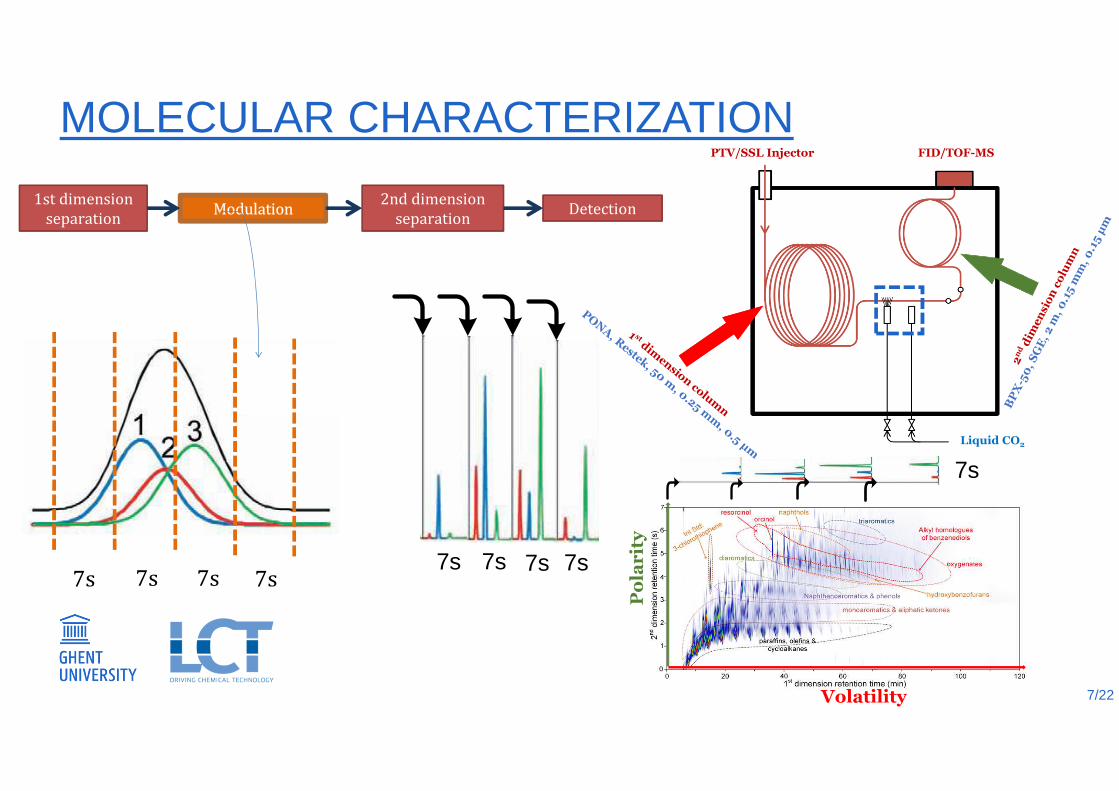
MOLECULAR CHARACTERIZATION
7s7s 7s 7s
1st dimension
separationModulation
2nd dimension
separationDetection
PTV/SSL Injector FID/TOF-MS
Liquid CO2
Volatility
Po
lar
ity
7s 7s 7s 7s
7s
7/22
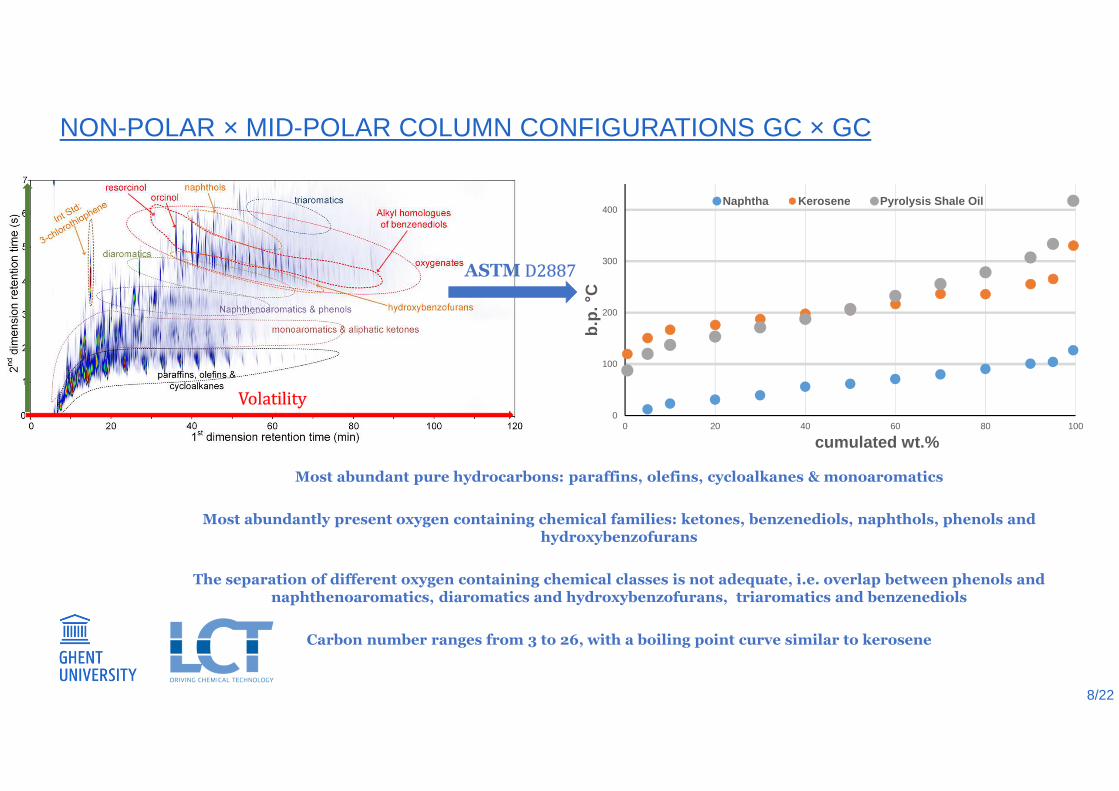
NON-POLAR × MID-POLAR COLUMN CONFIGURATIONS GC × GC
0
100
200
300
400
0 20 40 60 80 100
b.p.
°C
cumulated wt.%
Naphtha Kerosene Pyrolysis Shale Oil
Volatility
ASTM D2887
Most abundant pure hydrocarbons: paraffins, olefins, cycloalkanes & monoaromatics
Most abundantly present oxygen containing chemical families: ketones, benzenediols, naphthols, phenols and hydroxybenzofurans
The separation of different oxygen containing chemical classes is not adequate, i.e. overlap between phenols and naphthenoaromatics, diaromatics and hydroxybenzofurans, triaromatics and benzenediols
Carbon number ranges from 3 to 26, with a boiling point curve similar to kerosene
8/22
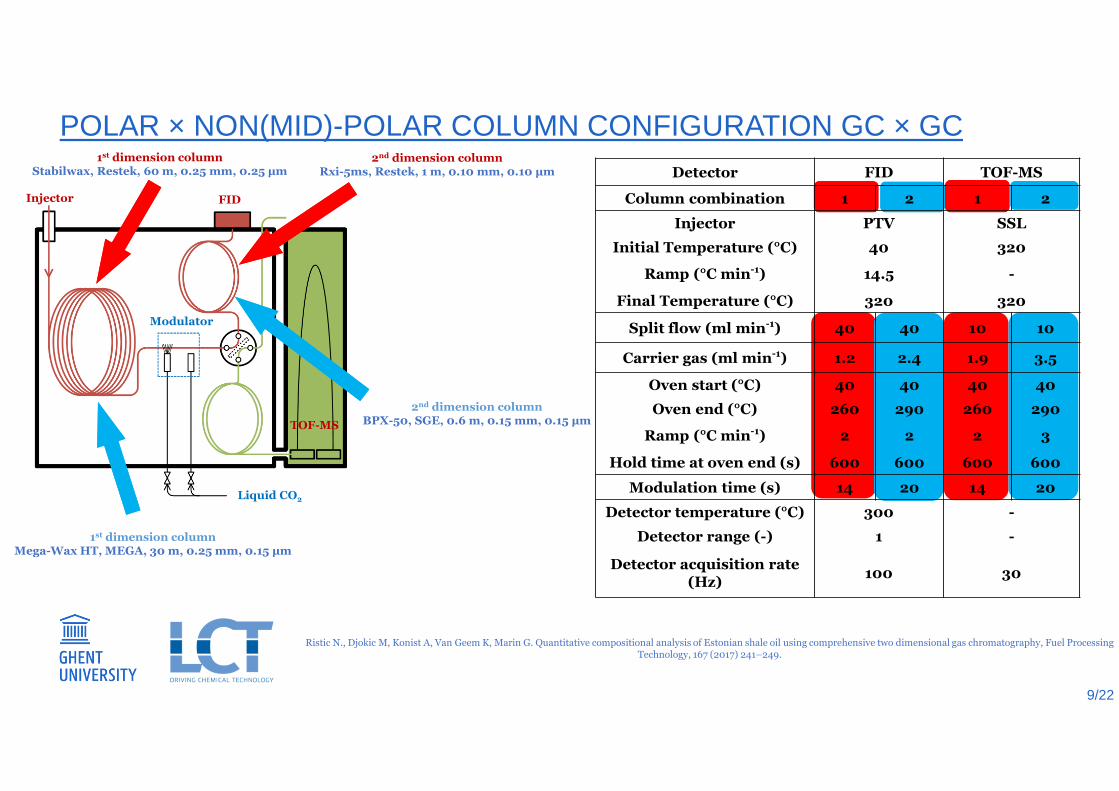
POLAR × NON(MID)-POLAR COLUMN CONFIGURATION GC × GC
Liquid CO2
1st dimension columnStabilwax, Restek, 60 m, 0.25 mm, 0.25 µm
2nd dimension columnRxi-5ms, Restek, 1 m, 0.10 mm, 0.10 µm
Injector FID
Modulator
TOF-MS
1st dimension columnMega-Wax HT, MEGA, 30 m, 0.25 mm, 0.15 µm
2nd dimension columnBPX-50, SGE, 0.6 m, 0.15 mm, 0.15 µm
Detector FID TOF-MS
Column combination 1 2 1 2
Injector PTV SSL
Initial Temperature (°C) 40 320
Ramp (°C min-1) 14.5 -
Final Temperature (°C) 320 320
Split flow (ml min-1) 40 40 10 10
Carrier gas (ml min-1) 1.2 2.4 1.9 3.5
Oven start (°C) 40 40 40 40
Oven end (°C) 260 290 260 290
Ramp (°C min-1) 2 2 2 3
Hold time at oven end (s) 600 600 600 600
Modulation time (s) 14 20 14 20
Detector temperature (°C) 300 -
Detector range (-) 1 -
Detector acquisition rate (Hz)
100 30
Ristic N., Djokic M, Konist A, Van Geem K, Marin G. Quantitative compositional analysis of Estonian shale oil using comprehensive two dimensional gas chromatography, Fuel Processing Technology, 167 (2017) 241–249.
9/22
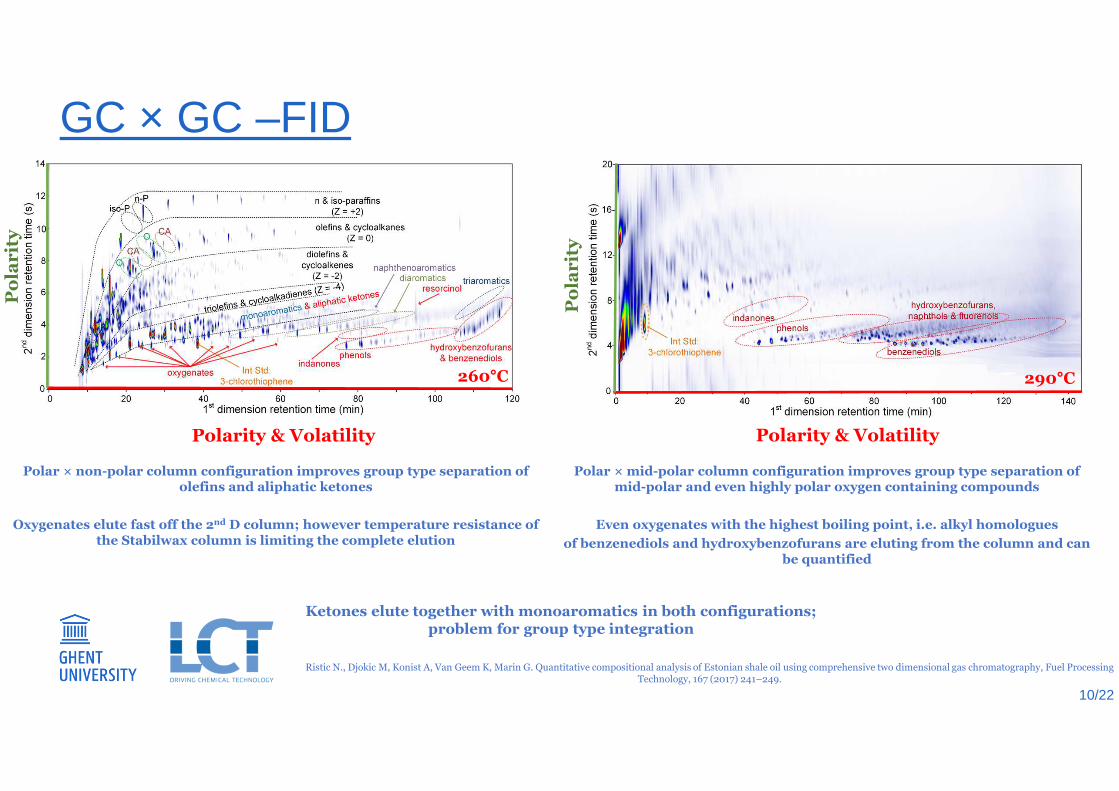
GC × GC –FID
Polarity & Volatility Polarity & Volatility
Po
lar
ity
Po
lar
ity
Polar × non-polar column configuration improves group type separation of olefins and aliphatic ketones
Oxygenates elute fast off the 2nd D column; however temperature resistance of the Stabilwax column is limiting the complete elution
Polar × mid-polar column configuration improves group type separation of mid-polar and even highly polar oxygen containing compounds
Even oxygenates with the highest boiling point, i.e. alkyl homologues
of benzenediols and hydroxybenzofurans are eluting from the column and can be quantified
Ketones elute together with monoaromatics in both configurations; problem for group type integration
260°C 290°C
Ristic N., Djokic M, Konist A, Van Geem K, Marin G. Quantitative compositional analysis of Estonian shale oil using comprehensive two dimensional gas chromatography, Fuel Processing Technology, 167 (2017) 241–249.
10/22

COMPOSITION OF PYROLYSIS SHALE OIL
0
2
4
6
8
10
12
4 5 6 7 8 9 10 11 12 13 14 15 16 17 18 19 20 21 22 23
wt.%
Carbon Number
paraffins isoparaffins
olefins cycloaromatics
mono-aromatics naphtheno-aromatics
di-aromatics naphthenodi-aromatics
tri-aromatics
0
0.5
1
1.5
2
2.5
3
3.5
5 6 7 8 9 10 11 12 13 14 15 16 17 18 19 20 21 22 23 24 25 26
wt.%
Carbon Number
benzenediols
phenols
naphthols
ketones
hydroxybenzofuranes
other oxygenates
Carbon number ranges from C3 to C26, C<21 account for 95 wt.% of the sample
Olefins and cycloalkanes, with concentrations of 17.5 wt.% and 16.8 wt.% respectively, are the major chemical classes
Oxygen containing compounds mainly belong to the classes of benzenediols, aliphatic ketones, hydroxybenzofurans and phenols with concentrations of 13.4 wt.%, 9.2 wt.%, 9.7 wt.% and 4.1 wt.%, respectively
CO production
Process threats:
1. Unstable feed due to high olefin content
2. Oxygen coupling reaction
3. Equipment corrosion
4. Downstream catalyst poisoning due to high CO production 11/22
OUTLINE
• Introduction
• Shale Oil characterization
• CoilSim1D simulation: Shale Oil as a steam cracking feed
• Conclusions
12/22
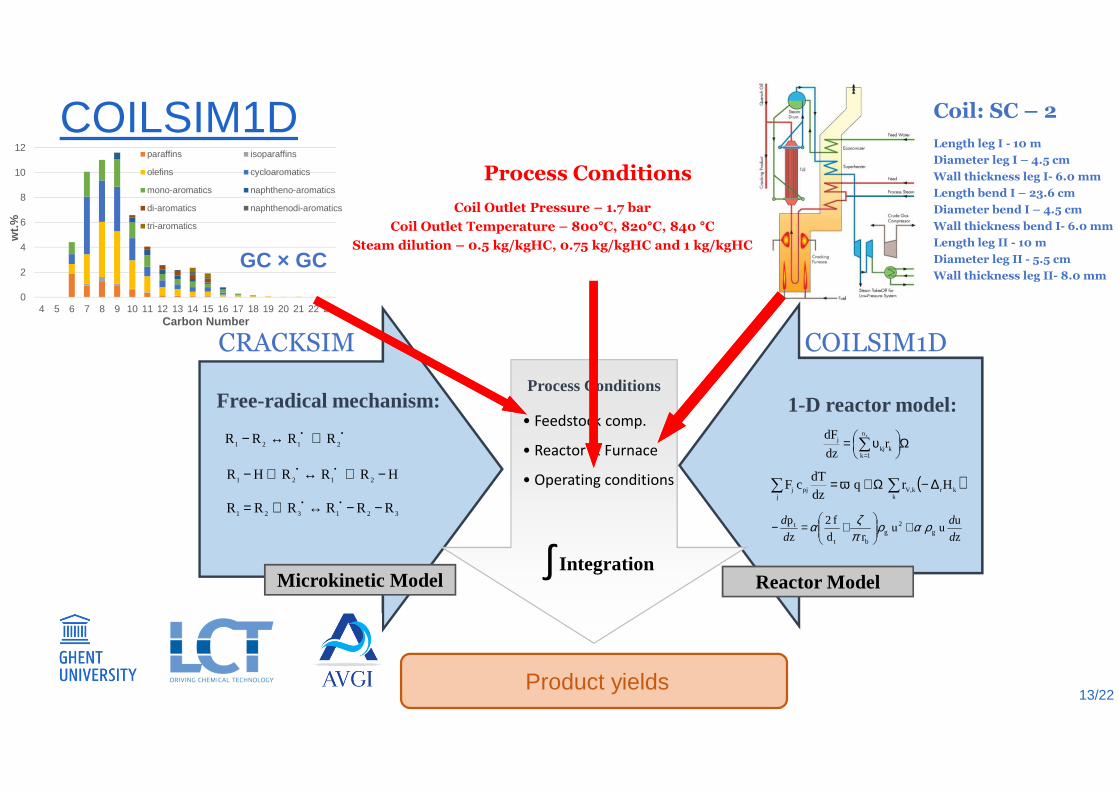
COILSIM1D
Integration∫Microkinetic Model
Process Conditions
• Feedstock comp.
• Reactor & Furnace
• Operating conditions
Ω
υ= ∑=
k
n
1kkj
j rdz
dF r
Free-radical mechanism: •• +↔− 2121 RRRR
HRRRHR 2121 −+↔+− ••
321321 RRRRRR −−↔+= ••
Reactor Model
( )∑ ∑ ∆−Ω+ω=j k
krkV,pjj Hrq dzdT
c F
z
uu u
r d
f 2
z
pg
2g
bt
t
d
d
d
d ραρπζα +
+=−
1-D reactor model:
Product yields
CRACKSIM COILSIM1D
0
2
4
6
8
10
12
4 5 6 7 8 9 10 11 12 13 14 15 16 17 18 19 20 21 22 23
wt.%
Carbon Number
paraffins isoparaffins
olefins cycloaromatics
mono-aromatics naphtheno-aromatics
di-aromatics naphthenodi-aromatics
tri-aromatics
Length leg I - 10 m
Diameter leg I – 4.5 cm
Wall thickness leg I- 6.0 mm
Length bend I – 23.6 cm
Diameter bend I – 4.5 cm
Wall thickness bend I- 6.0 mm
Length leg II - 10 m
Diameter leg II - 5.5 cm
Wall thickness leg II- 8.0 mm GC × GC
Coil: SC – 2
Coil Outlet Pressure – 1.7 bar
Coil Outlet Temperature – 800°C, 820°C, 840 °C
Steam dilution – 0.5 kg/kgHC, 0.75 kg/kgHC and 1 kg/kgHC
Process Conditions
13/22

PRIM-O NETWORKDeveloped kinetic model consists of two parts:β-network: “describes the thermal decomposition of small molecules”µ-network: “describes the thermal decomposition of large molecules”
µ-hypothesisFor large (C6+) radicals, bimolecular reactions can be neglected
Feed molecule Reaction family
Search for reaction possibilities
Assign reaction rate coefficients
Assign reaction rate coefficients
Generate decomposition reactions
Apply PSSA to µ-radicals
Are all µ-radicalsdecomposed?
Select µ-radical
Generate equivalent single-step reaction
Yes
No
Identify products: molecules, β-radicals, µ-radicals
Identify products: molecules, β-radicals, µ-radicals
k1 k2k3
k4 k5 k6 k7
CC C CC C C *• R,-.,/.,0
RH *k2
k2 * k3 * k4
CC 5 CC C C
*k3
k2 * k3 * k4
IC6H7 * CC • C
*k4
k2 * k3 * k4
k8
k8 * k9
• IC6H: * C4H8
*k4
k2 * k3 * k4
k9
k8 * k9
C 5 CCC C C
*k2
k2 * k3 * k4
*k4
k2 * k3 * k4
k9
k8 * k9
;<4
Inclusion of oxygen containing compounds enables simulating CO yields
Example: decomposition of phenol
S. P. Pyl, C. M. Schietekat, M. F. Reyniers, R. Abhari, G. B. Marin, K. M. Van Geem, “Biomass to olefins: Cracking of renewable naphtha” Chemical Engineering Journal, 176– 177, pp. 178– 187, 2011
K. M. Van Geem, M. F. Reyniers and G. B. Marin, “Challenges of Modeling Steam Cracking of Heavy Feedstocks” Oil & Gas Science and Technology – Rev. IFP, 63, pp. 79-94, 2008
Scheer, A.M., Mukarakate, C., Robichaud, D.J., Nimlos, M.R., Carstensen, H.-H., Barney Ellison, G., 2012. Unimolecular thermal decomposition of phenol and d5-phenol: Direct observation of cyclopentadiene formation via cyclohexadienone. J. Chem. Phys. 136, 044309. 14/22
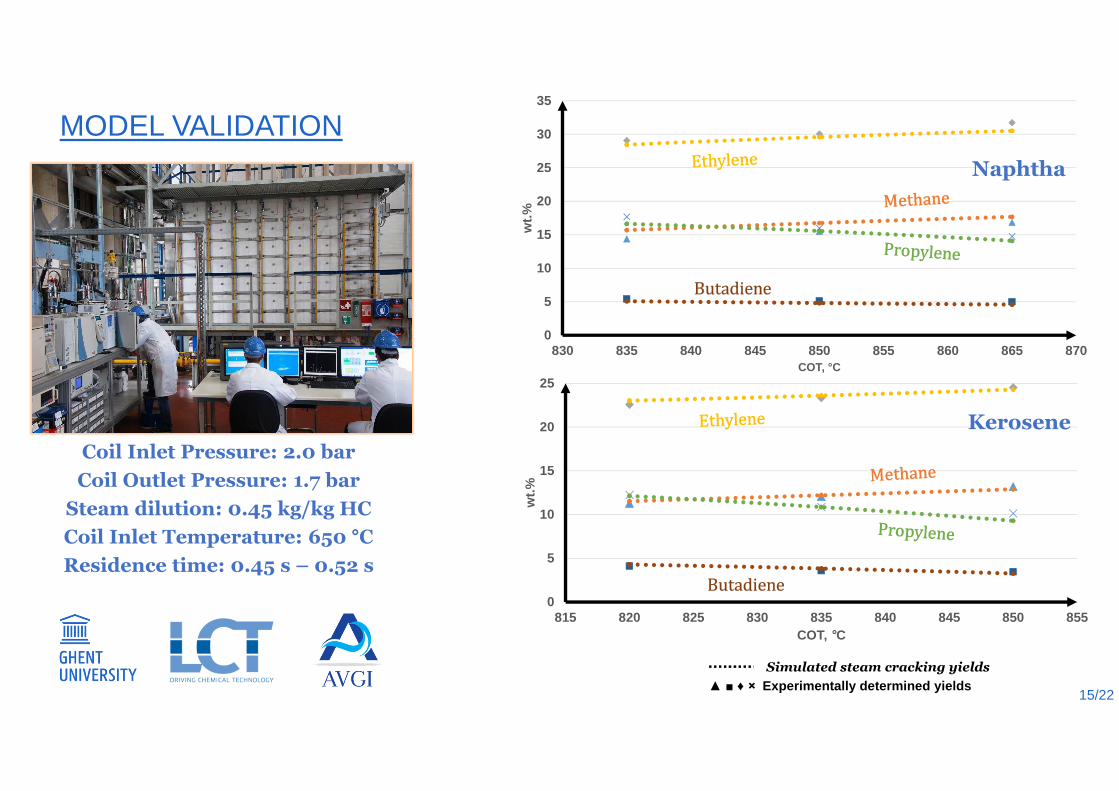
MODEL VALIDATION
0
5
10
15
20
25
815 820 825 830 835 840 845 850 855
wt.%
COT, °C
Butadiene
Kerosene
0
5
10
15
20
25
30
35
830 835 840 845 850 855 860 865 870
wt.%
COT, °C
Naphtha
Coil Inlet Pressure: 2.0 bar
Coil Outlet Pressure: 1.7 bar
Steam dilution: 0.45 kg/kg HC
Coil Inlet Temperature: 650 °C
Residence time: 0.45 s – 0.52 s
Butadiene
15/22
Simulated steam cracking yields
♦ × Experimentally determined yields
0
5
10
15
20
25
30
795 800 805 810 815 820 825 830 835 840 845
wt.%
COT, °C
0
5
10
15
20
25
30
795 800 805 810 815 820 825 830 835 840 845
wt.%
COT, °C
0
5
10
15
20
25
30
795 800 805 810 815 820 825 830 835 840 845
wt.%
COT, °C
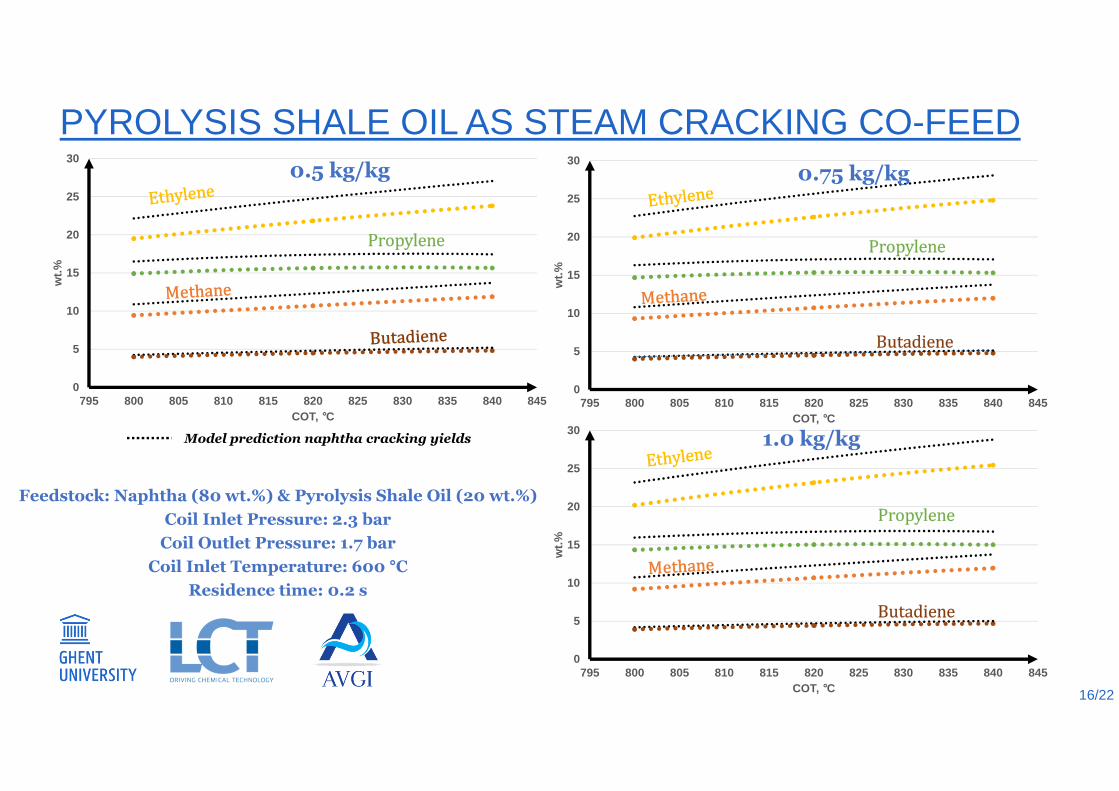
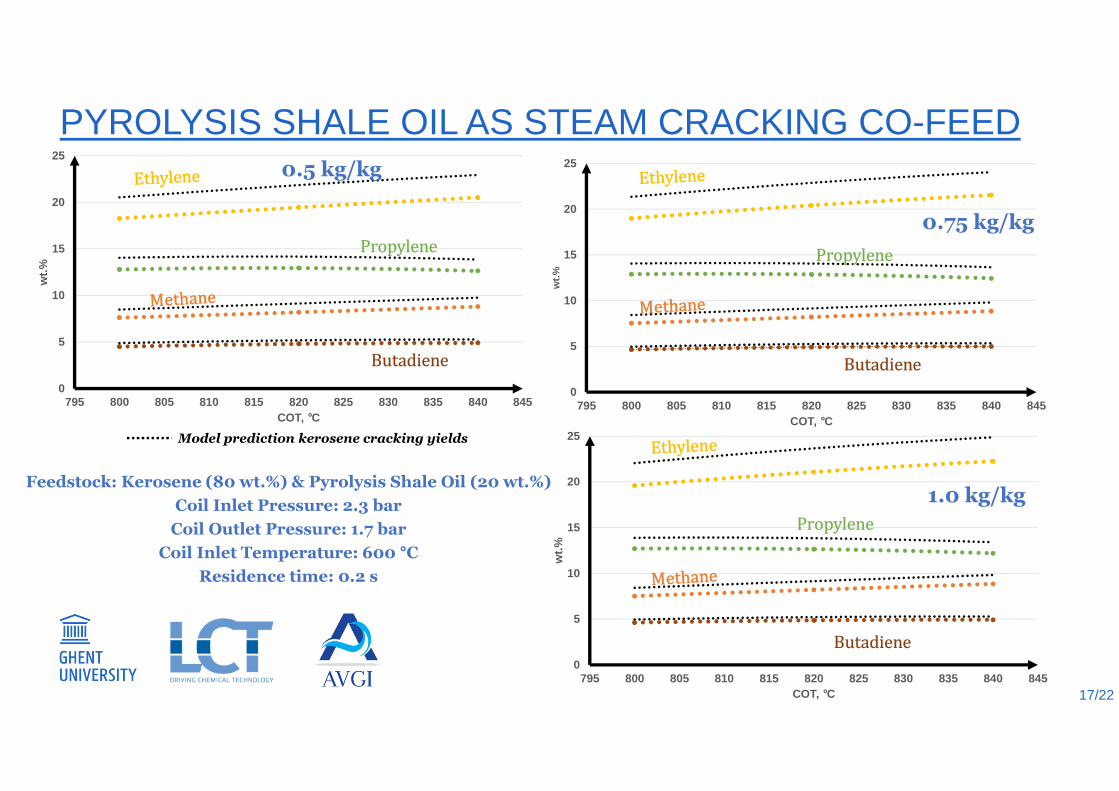
PYROLYSIS SHALE OIL AS STEAM CRACKING CO-FEED
Propylene
0.5 kg/kg
Propylene
Butadiene
0.75 kg/kg
Propylene
Butadiene
1.0 kg/kg
Feedstock: Naphtha (80 wt.%) & Pyrolysis Shale Oil (20 wt.%)
Coil Inlet Pressure: 2.3 bar
Coil Outlet Pressure: 1.7 bar
Coil Inlet Temperature: 600 °C
Residence time: 0.2 s
Model prediction naphtha cracking yields
16/22
0
5
10
15
20
25
795 800 805 810 815 820 825 830 835 840 845
wt.%
COT, °C
0
5
10
15
20
25
795 800 805 810 815 820 825 830 835 840 845
wt.%
COT, °C
0
5
10
15
20
25
795 800 805 810 815 820 825 830 835 840 845
wt.%
COT, °C
PYROLYSIS SHALE OIL AS STEAM CRACKING CO-FEED0.5 kg/kg
0.75 kg/kg
1.0 kg/kgFeedstock: Kerosene (80 wt.%) & Pyrolysis Shale Oil (20 wt.%)
Coil Inlet Pressure: 2.3 bar
Coil Outlet Pressure: 1.7 bar
Coil Inlet Temperature: 600 °C
Residence time: 0.2 s
Propylene
Butadiene
Propylene
Butadiene
Propylene
Butadiene
Model prediction kerosene cracking yields
17/22
0
5
10
15
20
25
795 800 805 810 815 820 825 830 835 840 845
wt.%
COT, °C
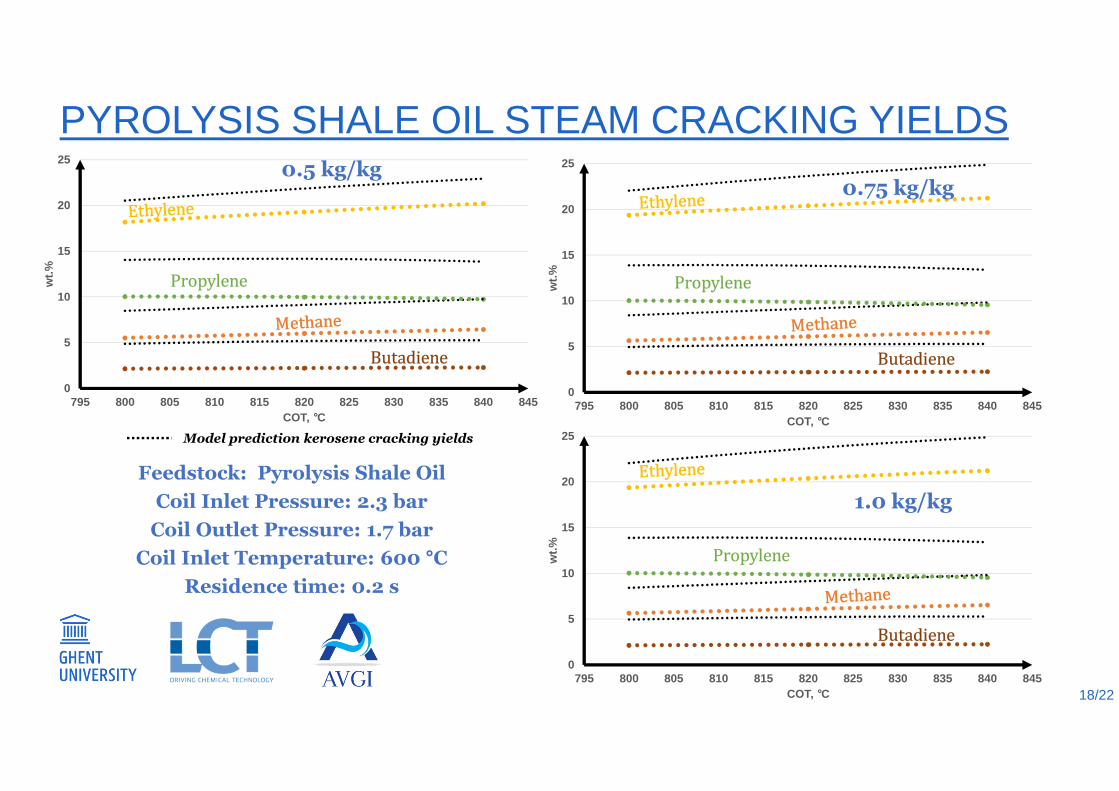
PYROLYSIS SHALE OIL STEAM CRACKING YIELDS
Feedstock: Pyrolysis Shale Oil
Coil Inlet Pressure: 2.3 bar
Coil Outlet Pressure: 1.7 bar
Coil Inlet Temperature: 600 °C
Residence time: 0.2 s
Model prediction kerosene cracking yields
0.5 kg/kg
Propylene
Butadiene
0
5
10
15
20
25
795 800 805 810 815 820 825 830 835 840 845
wt.%
COT, °C
Propylene
Butadiene
0.75 kg/kg
0
5
10
15
20
25
795 800 805 810 815 820 825 830 835 840 845
wt.%
COT, °C
Propylene
Butadiene
1.0 kg/kg
18/22
0
0.1
0.2
0.3
0.4
0.5
0.6
0.7
0.8
795 800 805 810 815 820 825 830 835 840 845
wt.%
COT, °C
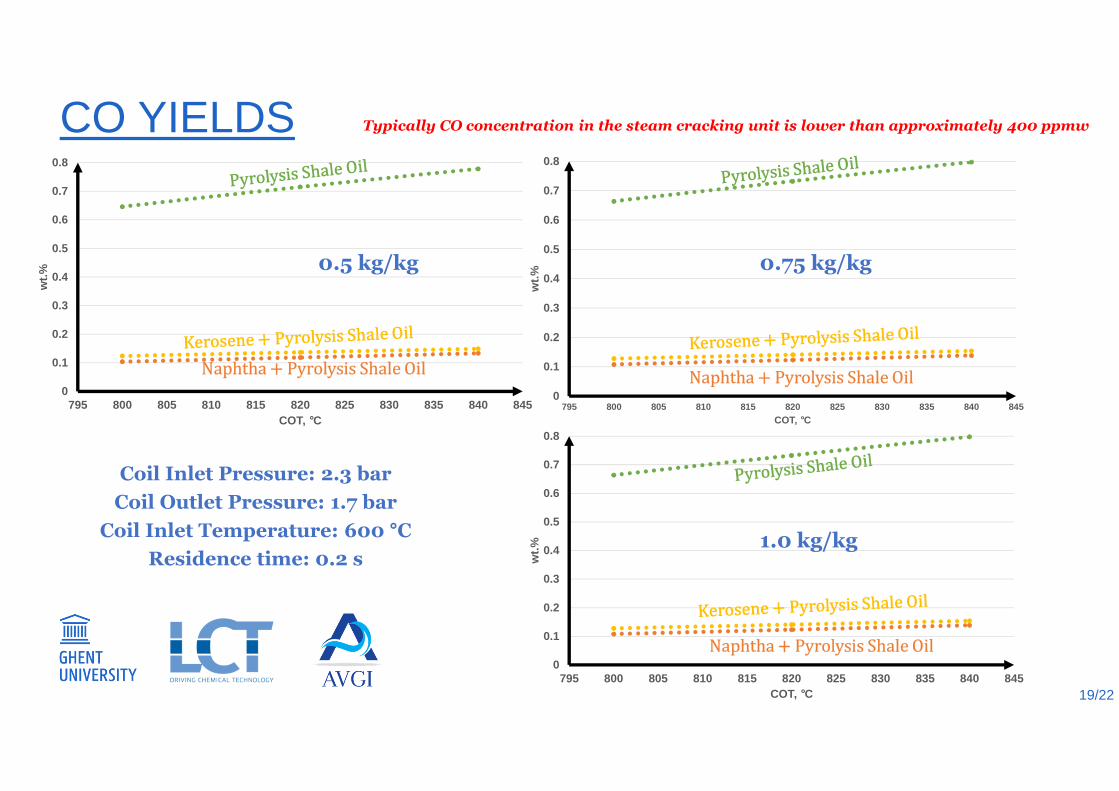
CO YIELDS
0
0.1
0.2
0.3
0.4
0.5
0.6
0.7
0.8
795 800 805 810 815 820 825 830 835 840 845
wt.%
COT, °C
Coil Inlet Pressure: 2.3 bar
Coil Outlet Pressure: 1.7 bar
Coil Inlet Temperature: 600 °C
Residence time: 0.2 s
0.5 kg/kg
Naphtha * Pyrolysis Shale Oil
0.75 kg/kg
Naphtha * Pyrolysis Shale Oil
0
0.1
0.2
0.3
0.4
0.5
0.6
0.7
0.8
795 800 805 810 815 820 825 830 835 840 845
wt.%
COT, °C
Naphtha * Pyrolysis Shale Oil
1.0 kg/kg
Typically CO concentration in the steam cracking unit is lower than approximately 400 ppmw
19/22

OUTLINE
• Introduction
• Shale Oil characterization
• CoilSim1D simulation: Shale Oil as a steam cracking feed
• Conclusions
20/22
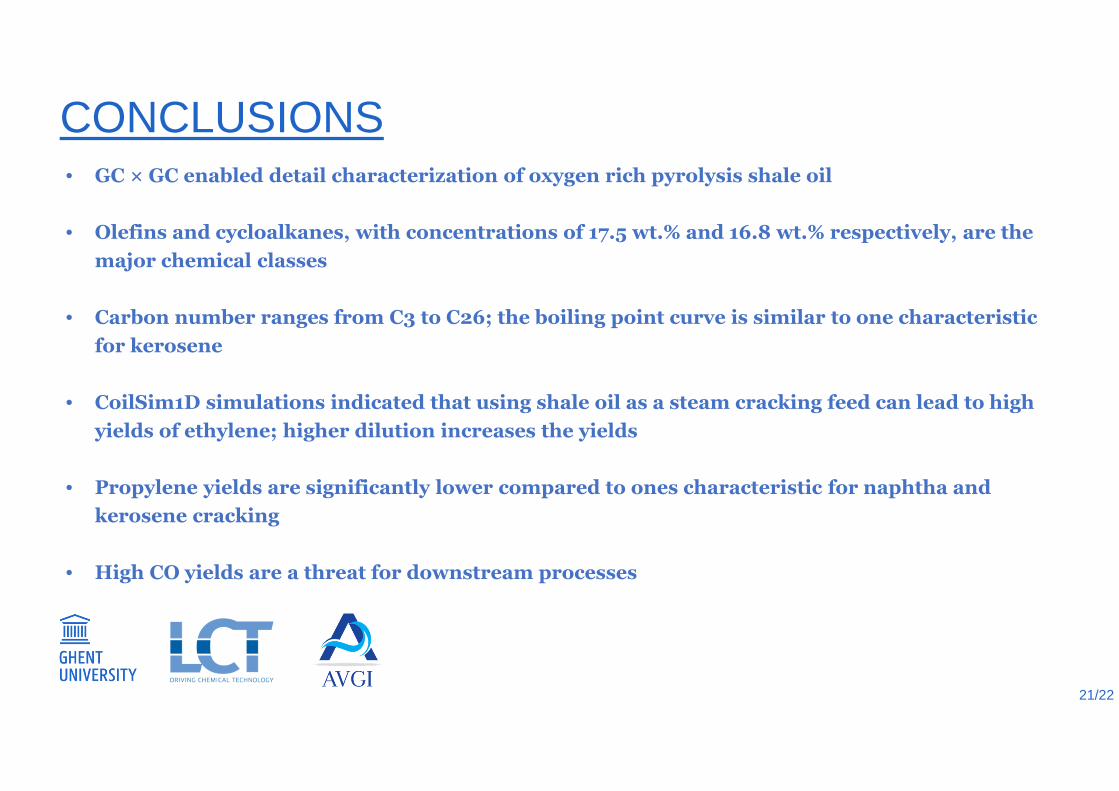
CONCLUSIONS• GC × GC enabled detail characterization of oxygen rich pyrolysis shale oil
• Olefins and cycloalkanes, with concentrations of 17.5 wt.% and 16.8 wt.% respectively, are the
major chemical classes
• Carbon number ranges from C3 to C26; the boiling point curve is similar to one characteristic
for kerosene
• CoilSim1D simulations indicated that using shale oil as a steam cracking feed can lead to high
yields of ethylene; higher dilution increases the yields
• Propylene yields are significantly lower compared to ones characteristic for naphtha and
kerosene cracking
• High CO yields are a threat for downstream processes
21/22
ACKNOWLEDGMENTSThank you for your attention!
Long Term Structural Methusalem Funding by the Flemish Government
22/22
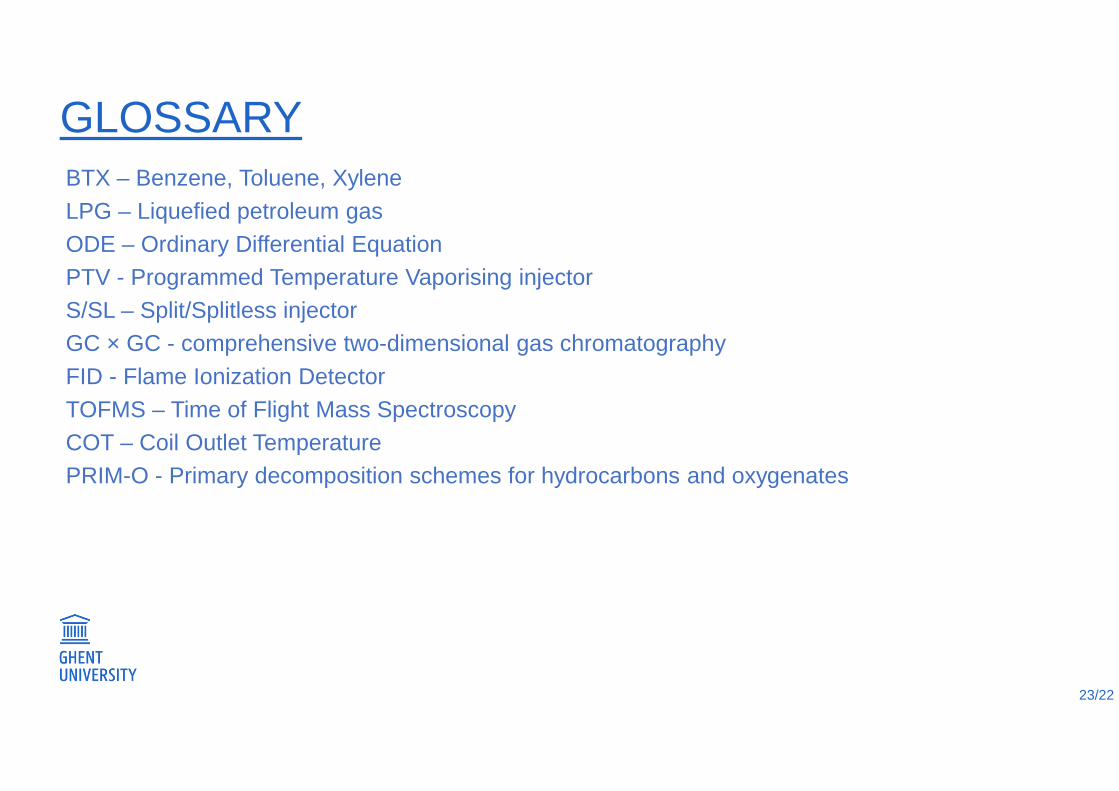
GLOSSARYBTX – Benzene, Toluene, XyleneLPG – Liquefied petroleum gas ODE – Ordinary Differential EquationPTV - Programmed Temperature Vaporising injectorS/SL – Split/Splitless injectorGC × GC - comprehensive two-dimensional gas chromatographyFID - Flame Ionization DetectorTOFMS – Time of Flight Mass Spectroscopy COT – Coil Outlet TemperaturePRIM-O - Primary decomposition schemes for hydrocarbons and oxygenates
23/22
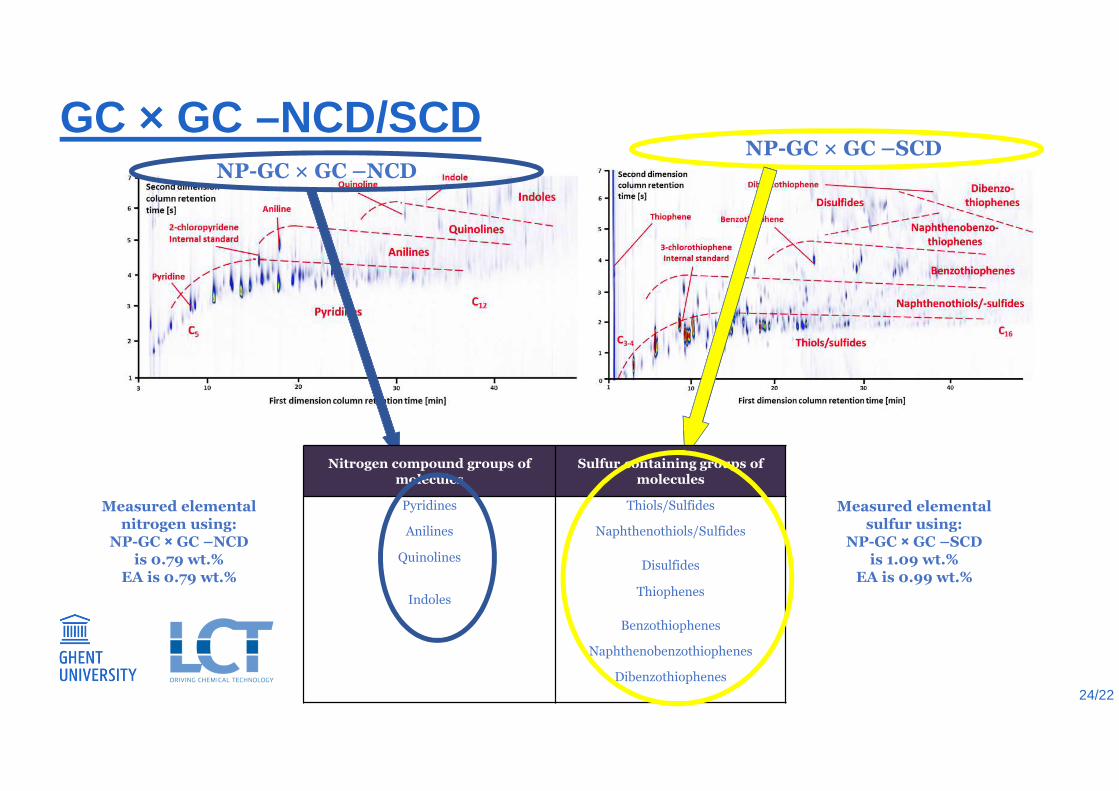
GC × GC –NCD/SCDNP-GC × GC –NCD
NP-GC × GC –SCD
Nitrogen compound groups of molecules
Sulfur containing groups ofmolecules
Pyridines Thiols/Sulfides
Anilines Naphthenothiols/Sulfides
QuinolinesDisulfides
IndolesThiophenes
Benzothiophenes
Naphthenobenzothiophenes
Dibenzothiophenes
Measured elemental nitrogen using:
NP-GC × GC –NCDis 0.79 wt.%
EA is 0.79 wt.%
Measured elemental sulfur using:
NP-GC × GC –SCDis 1.09 wt.%
EA is 0.99 wt.%
24/22
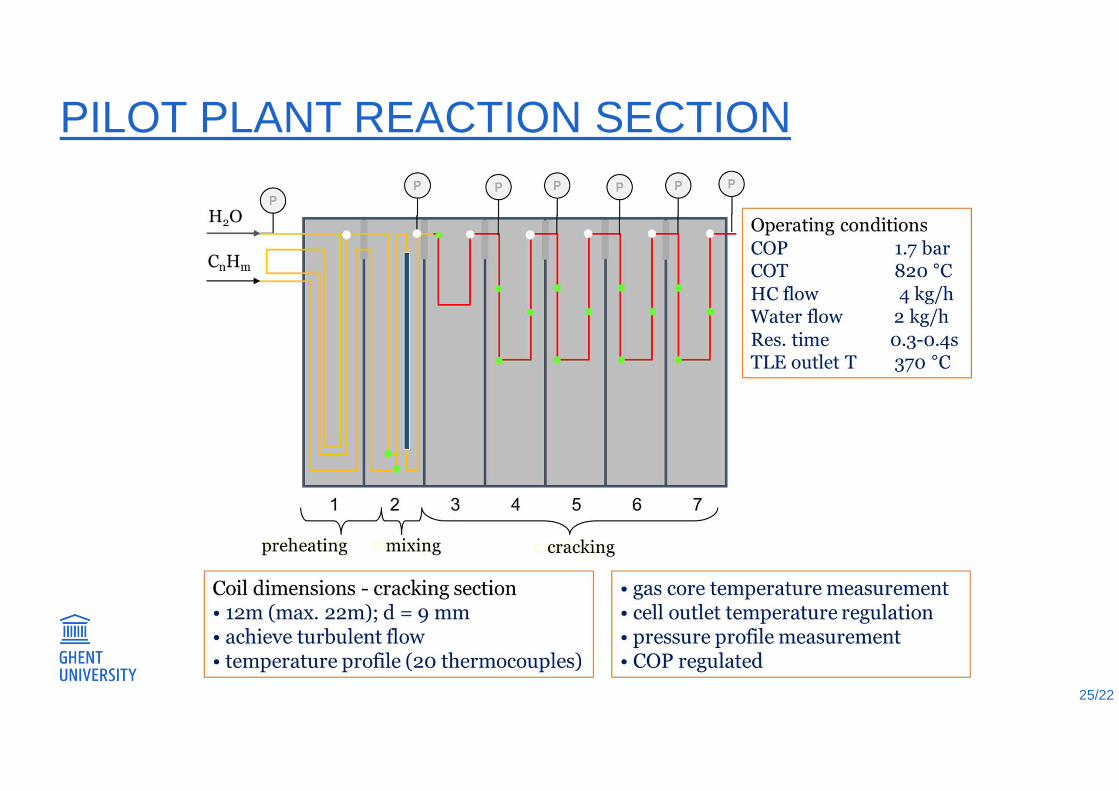
PILOT PLANT REACTION SECTION
25/22