shale oil: catalyst for growth - annualreports.com · petsec energy ltd annual report 2011 shale...
TRANSCRIPT

PETSEC ENERGYLTDANNUAL REPORT 2011
Shale Oil:Catalyst for Growth

0
20
40
60
80
100
120
140XEJ
PSA
1/03/121/02/121/01/121/12/111/11/111/10/111/09/111/08/111/07/111/06/111/05/111/04/111/03/11
CONTENTSYear in Brief 2011 1
Chairman’s Report 2
Operations Report 3
Strategy for Growth: 2011-2013 Business Plan 5
Directors’ Report and Financial Report 9
Corporate Governance Statement 76
Exploration & Production Interests 80
Shareholder Information 81
Five Year Comparative Data Summary 82
PETSEC ENERGY LTD ABN 92 000 602 700
The Company is listed on the Australian
Stock Exchange (symbol: PSA) and traded
over the counter in the USA in the form
of ADRs (symbol: PSJEY). Its corporate
offi ce is in Sydney, Australia, and its
USA operations offi ces are in Houston,
Texas and Lafayette, Louisiana.
ANNUAL GENERAL MEETING TO BE HELD AT:
11.00 am (AEST) on Wednesday,
23 May 2012, at the Museum of Sydney,
corner of Bridge and Phillip Streets, Sydney.
CAPITAL STRUCTURE – AS AT 26 MARCH 2012
AUSTRALIA EXCHANGE ASX
TICKER PSA
SHARES ON ISSUE 235.7 MILLION
OPTIONS ON ISSUE 4.3 MILLION
SHARE PRICE 0.235
MARKET CAPITALISATION $55.4 MILLION
SOURCE: AUSTRALIAN STOCK EXCHANGE (ASX)
USAEXCHANGE OTC PINK SHEETS
TICKER PSJEY
PETSEC SHARE PRICE PERFORMANCE VERSUS S&P/ASX200 ENERGY INDEX
YEAR IN BRIEF 2011FINANCIAL
Net profi t after tax: US$14.0 million.
Oil & gas sales (net of royalties): US$13.0 million (US$5.69/Mcfe).
EBITDAX: US$1.6 million (US$0.72/Mcfe).
US$29.2 million term debt settled in May 2011 – Company now debt free; gain of US$11.4 million.
China oil interests sold in June 2011 – cash consideration of A$38 million; gain of US$29.8 million.
Dry hole, impairment and abandonment expense of US$20.2 million.
Acquisition, development & exploration expenditure: US$3.9 million.
Plug and abandonment expenditure: US$8.4 million.
Cash at 31.12.2011: US$41.6 million.
Ryder Scott independently estimated proved and probable (2P) oil and gas reserves at 31.12.2011
were 15.4 Bcfe, PV10 US$39 million.
OPERATIONS
Production: 2.3 Bcfe – down 41% on 2010; due to the effect of natural decline coupled with shut
ins and curtailments at a number of the Company’s main producing fi elds.
Main Pass 270 A-3 well ceased producing in April 2011 due to infl ux of sand and remains shut
in until a work-over can be undertaken to restore production from the well.
Marathon Field production constrained by limited sales pipeline capacity.
Marathon gas/condensate Field development, Louisiana Gulf Coast:
• The Marathon #2 well in August 2011 confi rmed the productive reservoirs found in the fi rst well
and extended the known pays across the structure. Production of the well commenced in November 2011.
• A third Marathon well with a target depth of 19,000 feet was spud in early March 2012 to serve as a further
development well for the fi eld.
• New pipeline options for the Marathon Field are currently being evaluated to allow for increased production
from the existing two wells, the third well being drilled, and further development wells.
Plug and abandonment work completed for the Mobile Bay and Main Pass Block 20 fi elds.
SHALE OIL
Established a number of strategic alliances to capture shale oil expertise, commenced regional studies
and technical evaluation in four areas in North America. Leasing was initiated in two areas and drilling in one.
In February 2012, the Company agreed to participate in a shale oil project in Alberta, Canada where it can
earn a 24.5% working interest in leases covering 17,280 acres by participating in up to four wells. First well
was spud in March 2012.
SHALE OIL:CATALYST FOR GROWTH
ANNUAL REPORT 2011 1
CHAIRMAN’SREPORT2011 was a year of signifi cant change in direction
for the Company in response to continuing low
natural gas prices in the USA and a diffi cult
operating environment in the Gulf of Mexico
following the Macondo well blow out and oil
spill in early 2010.
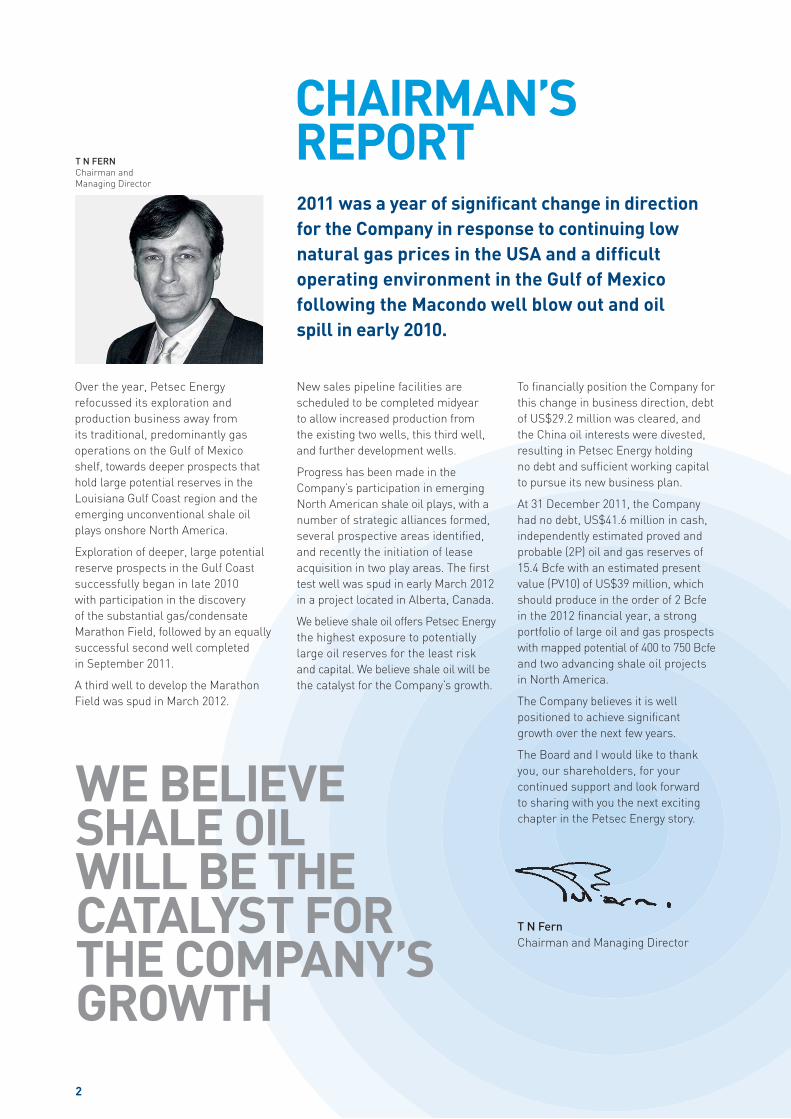
T N FERN
Chairman and
Managing Director
Over the year, Petsec Energy
refocussed its exploration and
production business away from
its traditional, predominantly gas
operations on the Gulf of Mexico
shelf, towards deeper prospects that
hold large potential reserves in the
Louisiana Gulf Coast region and the
emerging unconventional shale oil
plays onshore North America.
Exploration of deeper, large potential
reserve prospects in the Gulf Coast
successfully began in late 2010
with participation in the discovery
of the substantial gas/condensate
Marathon Field, followed by an equally
successful second well completed
in September 2011.
A third well to develop the Marathon
Field was spud in March 2012.
New sales pipeline facilities are
scheduled to be completed midyear
to allow increased production from
the existing two wells, this third well,
and further development wells.
Progress has been made in the
Company’s participation in emerging
North American shale oil plays, with a
number of strategic alliances formed,
several prospective areas identifi ed,
and recently the initiation of lease
acquisition in two play areas. The fi rst
test well was spud in early March 2012
in a project located in Alberta, Canada.
We believe shale oil offers Petsec Energy
the highest exposure to potentially
large oil reserves for the least risk
and capital. We believe shale oil will be
the catalyst for the Company’s growth.
To fi nancially position the Company for
this change in business direction, debt
of US$29.2 million was cleared, and
the China oil interests were divested,
resulting in Petsec Energy holding
no debt and suffi cient working capital
to pursue its new business plan.
At 31 December 2011, the Company
had no debt, US$41.6 million in cash,
independently estimated proved and
probable (2P) oil and gas reserves of
15.4 Bcfe with an estimated present
value (PV10) of US$39 million, which
should produce in the order of 2 Bcfe
in the 2012 fi nancial year, a strong
portfolio of large oil and gas prospects
with mapped potential of 400 to 750 Bcfe
and two advancing shale oil projects
in North America.
The Company believes it is well
positioned to achieve signifi cant
growth over the next few years.
The Board and I would like to thank
you, our shareholders, for your
continued support and look forward
to sharing with you the next exciting
chapter in the Petsec Energy story.
T N Fern
Chairman and Managing Director
WE BELIEVE SHALE OIL WILL BE THE CATALYST FOR THE COMPANY’S GROWTH
2
OPERATIONS REPORT
PRODUCTION
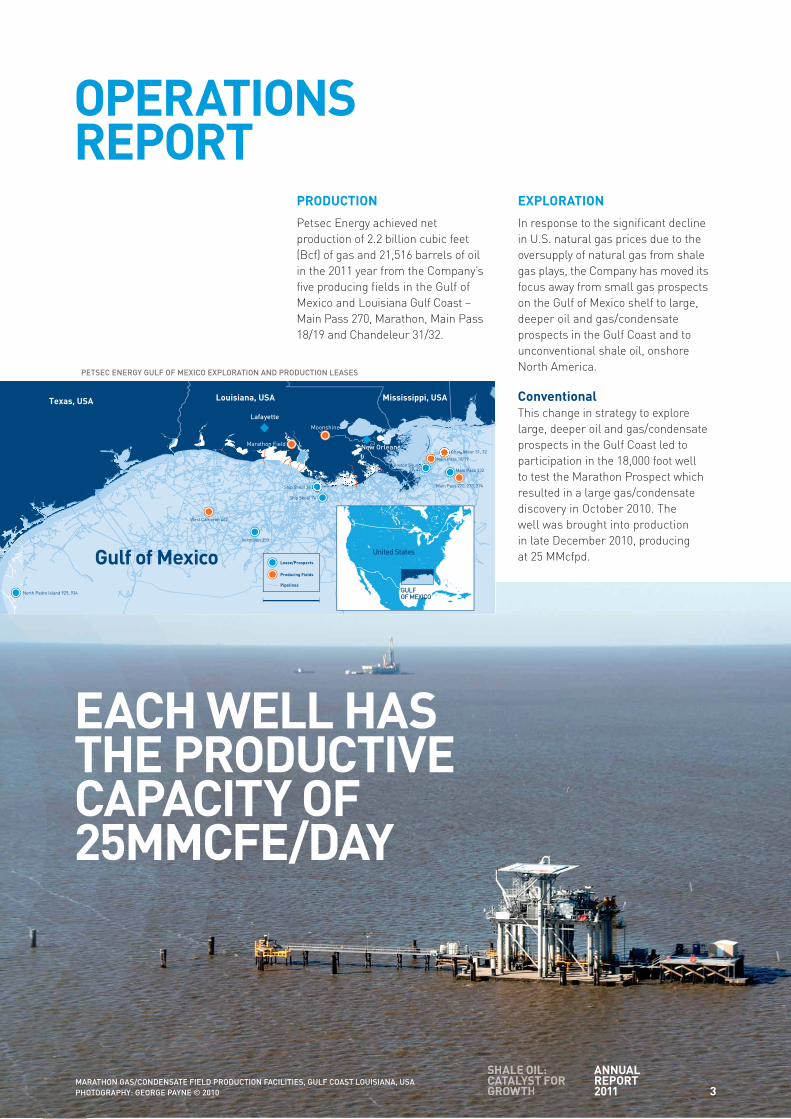
Petsec Energy achieved net
production of 2.2 billion cubic feet
(Bcf) of gas and 21,516 barrels of oil
in the 2011 year from the Company’s
fi ve producing fi elds in the Gulf of
Mexico and Louisiana Gulf Coast –
Main Pass 270, Marathon, Main Pass
18/19 and Chandeleur 31/32.
EXPLORATION
In response to the signifi cant decline
in U.S. natural gas prices due to the
oversupply of natural gas from shale
gas plays, the Company has moved its
focus away from small gas prospects
on the Gulf of Mexico shelf to large,
deeper oil and gas/condensate
prospects in the Gulf Coast and to
unconventional shale oil, onshore
North America.
Conventional
This change in strategy to explore
large, deeper oil and gas/condensate
prospects in the Gulf Coast led to
participation in the 18,000 foot well
to test the Marathon Prospect which
resulted in a large gas/condensate
discovery in October 2010. The
well was brought into production
in late December 2010, producing
at 25 MMcfpd.
EACH WELL HAS THE PRODUCTIVE CAPACITY OF 25MMCFE/DAY
MARATHON GAS/CONDENSATE FIELD PRODUCTION FACILITIES, GULF COAST LOUISIANA, USA
PHOTOGRAPHY: GEORGE PAYNE © 2010
New Orleans
Moonshine
Chandeleur 31, 32
Main Pass 18/19
Breton Sound39, 42
Main Pass 270, 273, 274Ship Shoal 36
Main Pass 132
Marathon Field
Ship Shoal 74
United States
GULF OF MEXICO
Lease/Prospects
Producing Fields
Pipelines
Gulf of MexicoVermilion 353
West Cameron 462
North Padre Island 929, 934
Texas, USA Louisiana, USA
Lafayette
Mississippi, USA
PETSEC ENERGY GULF OF MEXICO EXPLORATION AND PRODUCTION LEASES
3
ANNUAL REPORT 2011
SHSHSHSHSHSSSHSHHSSSS ALALALALALALLALALLLLE E EEEEEE OIOIOOOOIOOO L:L:LLL:L:L:L::CACACACACACACACAACATATATATATATATAAT LYLYLYLYLYLYLYYYYLYSTSTSTSTSTSTSTSTSSSTSTSTSST FFFFFFFFORORORORORORROORRRRO GRGRGRRRGRGRGRRGRRRGRG OWOWOWOWOWWOOOWOWOWOWWO THTHTHTHTHTHTHHH

In April 2011, a second well was drilled,
which confi rmed the productive
reservoirs found in the fi rst well, and
extended the known fi eld pays across
the structure. Proved and probable
(2P) reserves are now estimated
to be 150 to 200 Bcfe for the fi eld.
The second well was brought into
production in November 2011
at a restricted rate of 10 million
cubic feet of gas equivalent (MMcfe)
per day due to pipeline capacity
constraints which also required the
shut-in of the initial producing well.
Each well has the productive capacity
of 25MMcfe/day. In mid 2012 new
pipeline facilities are expected
to be completed to allow maximum
production rates for the current
and future development wells.
The third well on the fi eld was
spud in March 2012.
The Company has a portfolio of ten
large deep prospects each ranging
in size between 20 and 200 Bcfe,
with a total mapped potential of
400 to 750 Bcfe. We do not expect
to test these prospects before 2013,
while gas prices are so low. Instead
the Company will concentrate on
developing unconventional shale
oil in onshore North America.
UnconventionalIn the 2011 year, the Company
embarked on its onshore shale oil
strategy in North America.
The Company established a number
of strategic alliances with parties who
possess shale oil expertise in North
America and commenced regional
studies and technical evaluation
in four areas where it is expected
large leaseholds can be acquired at
reasonable lease and royalty costs.
In two areas the technical evaluation
has located areas of high potential
(‘Sweet Spots’) and leasing has been
initiated. The Company aims to secure
a suffi ciently large lease area during
2012, which can hold the potential for
a 100 MMbbl resource within which
through further drilling a 2P reserve
of 35 MMbbl could be established.
In February 2012, the Company
farmed-in to a shale oil project in
Alberta, Canada where it can earn
a 24.5% working interest in leases
covering 17,280 acres by participating
in up to four wells. The fi rst well was
spud on 9 March 2012 and reached
target depth in late March 2012. The
well was extensively logged and cored
to provide the necessary data to allow
correlation with previously drilled wells
and to confi rm the viability of the
shale oil play and the areas which
should next be leased. Full evaluation
will take three to four months, and
further drilling is contemplated in the
fourth quarter of 2012.
OPERATIONS REPORT CONTINUED
IN THE 2011 YEAR, THE COMPANY EMBARKED ON ITS ONSHORE SHALE OIL STRATEGY IN NORTH AMERICA
4

2011–2013 BUSINESS PLAN
Major changes in trading conditions
in the Gulf of Mexico (GoM) over
the last few years due to the global
fi nancial crisis, the repercussions
of the Macondo well oil spill, and a
75% decline in the U.S. natural gas
prices, has caused the Company
to change its business plan which
had served it well over the years from
2002 to 2007. The Company’s historic
operations of drilling small (5 to 10 Bcfe)
gas prospects, with a record of 80%
drilling success, high returns and
payback within a year, is no longer
viable under the current gas price
and operating conditions in the GoM.
The 75% decline of U.S. natural gas
prices from an average of US$9.16/Mcf
in 2008 to US$2.30/Mcf in March 2012
has been caused by an oversupply of
natural gas due to the success of shale
gas horizontal wells and fracking in
the U.S. The U.S. natural gas storage
level of 2.4 Tcf on 23 March 2012 was
59% above the fi ve year average which
has impacted the NYMEX 12 and
36 month forward strip prices which
at 4 April 2012 were US$2.86/Mcf and
US$3.58/Mcf, respectively. U.S. shale
gas production has risen from 1%
of total U.S. natural gas production
in 2005 to 28% in 2010 with estimates
by the U.S. Energy Information
Administration estimating it could
reach 49% of total annual U.S. gas
production of 27 Tcf by 2035. This
increase in gas supply is likely to
keep U.S. gas prices at these low
levels for the next few years.
The Company’s new business plan
is to operate in North America, focus
on oil rather than gas, and on large
resources rather than small, with
an objective within the 2011-2013
timeframe to establish an oil resource
of the order of 100 million barrels
and a 2P reserve of 35 million barrels
of oil in unconventional shale oil,
and 100 Bcfe in conventional deep
geologic section.
To accomplish this objective the
Company would eliminate debt,
sell non-core assets to fund the new
plan, focus on unconventional shale
oil in onshore North America and
on conventional large, deep geologic
section exploration prospects on
the Louisiana Gulf Coast of the USA,
while reducing our operational
exposure to the Federal waters
of the Gulf of Mexico shelf.
In 2011 the Company’s US$29.4
million of debt was eliminated, some
US$40 million was raised through the
disposition of the China oil interests,
STRATEGY FOR FUTURE GROWTH
ESTABLISH AN OIL RESOURCE OF THE ORDER OF 100 MILLION BARRELS OF OIL
HORIZONTAL DRILLING FOR SHALE OIL, USA
CACACACACACACACACACACAAATATATATATATATATATATATATATAAATT LYLYLYLYLYLYLYLYLYLYLYLYLLL STSTSTSTSTSTSTSSSSSTT F FFFFFFFORORORRORORRORORORRORO GRGRGRGRRGRRGRGRGGRRGG OWOWOWOWOWOWOWOWOWOWOWWOWOWOWWOWWWTHTHTHTHTHTTHTHTHTHHT
ANNUAL REPORT 2011 5

STRATEGY FOR FUTURE GROWTH CONTINUED
offshore leases were signifi cantly
culled to those which held large
prospects only – 10 prospects with
a combined mapped gross potential
of 400 to 750 Bcfe, the large, deep
section Marathon gas/condensate
Field was discovered in late 2010
and further developed in 2011 with
estimated reserves of 150 to 200 Bcfe,
and strategic alliances were forged
with experienced shale oil players,
regional studies were completed
resulting in the selection of four
study areas, two of which were
evaluated in detail and on which
leasing has proceeded.
SHALE OIL – CATALYST
FOR GROWTH
Unconventional shale oil plays will
be Petsec Energy’s primary focus
of exploration in 2012/2013 while
U.S. natural gas prices remain low.
Why Shale Oil?
Petsec Energy believes that shale
oil offers the Company the highest
exposure to large potential oil
reserves for the least risk and
capital because: Recent advances
in horizontal drilling and multi-stage
fracking of horizontal wells in the
U.S. have made extraction of oil
from shale commercially viable:
• The shale oil play is emerging
– large areas of open land are
available to lease at modest prices;
• Potential to acquire large oil
resources (>100 MMbbl recoverable)
within the bounds of Petsec Energy’s
current working capital;
• Potential to increase investment
value by an order of magnitude with
a modest drilling programme;
• The Company has valuable shale oil
expertise relationships in the U.S.
through its 22 year North American
operations history; these include
Mike Harvey, Petsec director and
an early and successful participant
in the Eagle Ford shale oil play.
Why Shale Oil in North America?
Petsec Energy has operated in the U.S.
since 1989 and has explored offshore
in the Gulf of Mexico and onshore
in Louisiana, Texas, California, Utah,
Colorado, Wyoming, Montana and
North Dakota. North America is
at the forefront of shale oil extraction
technology, has vast remaining oil
reserves, large oil demand and
extensive infrastructure to develop and
sell oil. Importantly North America has:
• Large shale oil reserves potential:
USGS estimates greater than
3 trillion barrels of oil recoverable
from shale;
• Extensive lease availability:
– Many shale basins;
– Private mineral ownership;
SHALE OIL OFFERS THE COMPANY THE HIGHEST EXPOSURE TO LARGE POTENTIAL OIL RESERVES
WORKING BEAM OIL PUMP, TEXAS, USA
6
• Largest market for oil:
– Net imports of 9.6 MMbbl per day;
• Forefront of shale oil technology:
– Exploration, drilling, fracking
and development;
• Best oil and gas infrastructure:
– Extensive network of pipelines;
• Highly liquid transaction market
for funding and exit.
Petsec Energy Shale Oil Objectives
The Company’s objectives within
its 2011-2013 business plan is to:
• Establish a net resource of
100 MMbbl (4P) recoverable;
• Secure farm-out partners for
reserves drilling and further
lease acquisition;
• Establish net reserves of
>35 MMbbl – demonstrate fl ow
rates from horizontal fracked wells
that provide 12 month pay back of
development wells;
• Monetise.
Petsec Energy Shale Oil Strategy
The Company’s strategy to achieve
its shale oil objectives is to:
• Work with our shale expertise
partners to identify areas with
appropriate resource play
characteristics – porosity,
permeability, TOC, brittleness,
containment etc;
• Focus on historic producing areas
that are relatively inactive and where
the source rocks are oil-prone,
thick, rich and at appropriate
drilling depths;
• Utilise existing well log data and
geological data to recognise and
quantify the potential of source
rocks as resource play targets;
• Determine the core areas of the new
plays (‘Sweet Spots’), and acquire
key acreage at low royalty level
and costs per acre before the play
is actively developed;
• Drill test wells to calibrate logs to
geology and for ‘proof of concept’;
• Expand leasehold to signifi cant
acreage position that indicates a
suffi ciently large resource (>100
MMbbl recoverable) to be attractive
to a large E&P company;
• Farm-out or sell all or a portion
of the acreage to a large E&P with
the fi nancial capacity and drilling
technology capability to fully exploit
the play.
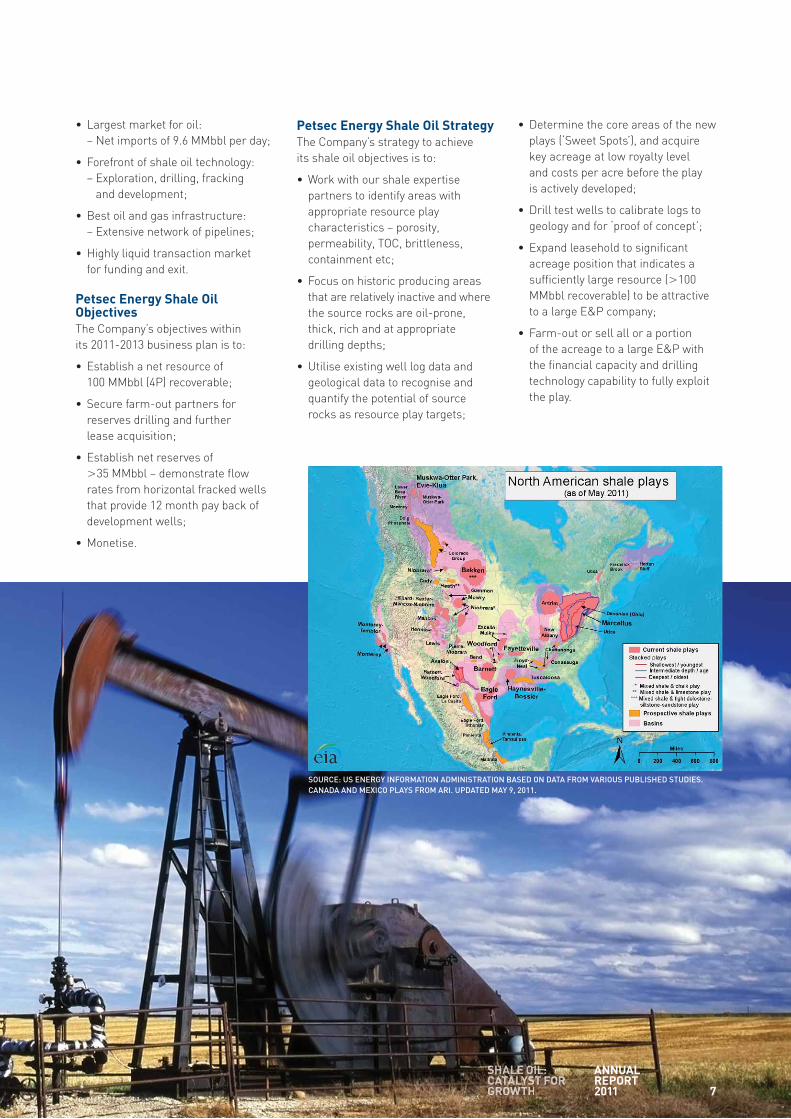
SOURCE: US ENERGY INFORMATION ADMINISTRATION BASED ON DATA FROM VARIOUS PUBLISHED STUDIES.
CANADA AND MEXICO PLAYS FROM ARI. UPDATED MAY 9, 2011.
7
ANNUAL REPORT 2011
SHSHSHSHSHSHSHSHSHSHSSSSHS ALALALALALALALALALALLLLE E EE EEEEEEEE OIOIOIOIIOOIOOIOIOIOOO L:L:L:L:LLL:L:LL:LL:L:CACACACACACACACACACACAAC TATATATATATATTATALYLYLYLYYLYLYLYLLLYLYLYSTSTSTSTTSTSTTSTSSS FF F FFF F FFFFORORORORORORORORRROROORORR GRGRGRGRRGRRGROWOWOWOWOWTHTHTHTHTH
ACHIEVEMENTS TO DATE OF THE 2011-2013 BUSINESS PLAN
Corporate
• Eliminated US$29 million debt in May 2011 – now debt free;
• A$38 million raised from disposition of China oil interests in June 2011;
• 15.4 Bcfe (2P) reserves; PV10: US$39 million at 31/12/11.
Conventional: Oil & gas/condensate; high potential prospects
• Drilled 2 successful wells to-date on the large gas/condensate Marathon Field – a third well is currently
being drilled and further wells planned;
• Estimated gross reserves of the Marathon Field: 150 to 200 Bcfe (Petsec share: 8 to 12 Bcfe);
• 10 mapped prospects with gross potential: 400 to 750 Bcfe (67 to 125 MMboe); (20 to 200 Bcfe each).
Unconventional: Shale Oil
• Established joint ventures with experienced shale oil partners;
• Regional studies – 4 study areas selected;
• Determination of ‘Sweet Spots’ in 2 areas: potential > 2,000 bbl of oil recoverable per acre;
• Leasing commenced in 2 areas;
• Confi rmation drilling in Alberta, Canada.
WHY WILL THE COMPANY SUCCEED WITH ITS SHALE OIL OBJECTIVE?
Petsec Energy has operated successfully in the U.S. since 1989 creating substantial value from limited capital through
drilling success. It has many valuable relationships in the North American oil and gas industry which will be brought to bear
in our pursuit of shale oil.
The extraction of oil from shale with fracked, horizontal wells will see oil reserve growth in North America not seen since
the 1970’s and affords the small independent E&P company the opportunity to acquire and determine substantial resources
far and above that which could be achieved normally from conventional drilling.
Petsec Energy has the U.S. operational knowledge, shale oil expertise alliances, funding and determination to succeed
and in so doing the ability to increase the value of the Company by an order of magnitude within the 2011–2013 plan.
2012 EXPLORATION AND DEVELOPMENT PROGRAMME
Conventional: Gas/Condensate Marathon #3 well:
• Spud 4th March 2012 TD 19,000 feet
• Estimated 107 days to drill, log & case
Facilities to accommodate well fl ows of the order of 25 MMcfe/day per well
Unconventional: Shale Oil Lease acquisition: 2–3 areas
Drilling:
• Vertical: 1–3 wells
• Horizontal: 1–2 wells
STRATEGY FOR FUTURE GROWTH CONTINUED
8

CONTENTS
Directors’ Report 10
Auditor’s Independence Declaration 27
Statements of Comprehensive Income 28
Statements of Changes in Equity 29
Balance Sheets 31
Consolidated Statement of Cashfl ows 32
Notes to the Consolidated Financial Statements 33
Directors’ Declaration 73
Independent Auditor’s Report 74
Corporate Governance Statement 76
Exploration and Production Interests – USA 80
Shareholder Information 81
Five Year Comparative Data Summary 82
Petsec Energy Ltd Corporate Directory 85
DIRECTORS’ REPORT ANDFINANCIAL REPORTS
9
DIRECTORS’ REPORTFor the year ended 31 December 2011
The directors present their report together with the Financial Report of Petsec Energy Ltd (“the Company”) and of the
consolidated entity, being the Company and its subsidiaries, for the fi nancial year ended 31 December 2011 and the
independent auditor’s report thereon.
1. Directors
The names and particulars of the qualifi cations and experience of each director during or since the end of the fi nancial
year are:
Terrence N Fern
Chairman and Chief Executive Offi cer
Mr Fern has been a director since 1987 and has over 35 years of extensive international experience in petroleum and
minerals exploration, development and fi nancing. He holds a Bachelor of Science degree from the University of Sydney
and has followed careers in both exploration geophysics and natural resource investment. Mr Fern was formerly a director
of TSX and ASX listed company Oceana Gold Corporation from 2006 until June 2011.
David A Mortimer AO
Non-executive Director
Chairman of the Audit Committee and the Nomination and Remuneration Committee
Mr Mortimer was appointed to the Board in 1985 and has over 40 years of corporate fi nance experience. He was a senior
executive of TNT Limited Group from 1973, serving as Finance Director and then as Chief Executive Offi cer until his
resignation in October 1997. He is presently Chairman of Australia Post, Crescent Capital Partners Limited and Buildcorp
Advisory Board and is a Director of the Defence Strategic Reform Advisory Board, Clayton Utz Foundation and the Grant
Samuel Advisory Board. In 2011, Mr Mortimer was appointed as Chairman of the Defence Industry Innovation Board.
Mr Mortimer holds a Bachelor of Economics degree (First Class Honours) from the University of Sydney and is a Fellow
of the University of Sydney Senate and the Australian Institute of Company Directors. Mr Mortimer’s other roles include
Governor of the Australia Israel Chamber of Commerce, President of the Sydney University Football Club, and Director
of the Australian Schoolboys Rugby Foundation.
Mr Mortimer was formerly a non-executive director and more recently Chairman of ASX listed company Leighton Holdings
Limited from 1997 until August 2011.
Michael L Harvey
Non-executive Director
Member of the Audit Committee and the Nomination and Remuneration Committee
Mr Harvey was appointed to the Board in 2008 and is a third generation Texan oil man who brings a wealth of experience
of establishment and successful growth of exploration and production (E&P) companies in South-East Asia and the
Gulf of Mexico, USA. After receiving his degree from Texas A&M University in 1970, Mr Harvey served as an offi cer
in the US Army in Vietnam.
Subsequently, he began his career in the oil industry with Shell Oil Company in their Corporate Planning and Economics
department. Since 1987 to date, he has founded and been the CEO of four private US E&P companies operating in the
Gulf of Mexico and the Gulf Coast of the USA. Between 1987 and 1998 he established, grew and sold Gulfstar Petroleum
Corporation and Gulfstar Energy Inc. In 2000 he founded Gryphon Exploration Inc., which was acquired by Woodside
Petroleum Ltd for US$285 million in 2005. In 2007 he founded Stonegate Production Company, where he is Chairman and
CEO. Stonegate was an early entrant to the Eagle Ford shale oil play in Texas and is now in joint venture with Chesapeake
and China National Offshore Oil Corporation. Mr Harvey was formerly a non-executive director of the listed Norwegian
company Scorpion Offshore from 2006 until its sale in May 2010.
10
2. Executive Offi cers
Ross A Keogh
President of Petsec Energy Inc. (“PEI”) and Group Chief Financial Offi cer
Mr Keogh joined the Company in 1989 and has over 30 years experience in the oil and gas industry. Between 1979 and 1989,
Mr Keogh worked in the fi nancial accounting and budgeting divisions of Total Oil Company and as Joint Venture Administrator
for Bridge Oil Limited in Australia. Mr Keogh holds a Bachelor of Economics degree, with a major in Accounting, from
Macquarie University in Sydney. Mr Keogh was appointed Chief Financial Offi cer in November 1998 until April 2002, and
appointed President of PEI in April 2002. Mr Keogh took on the extended role of Group Chief Financial Offi cer in February
2012, in addition to his current role of President of PEI.
Ron Krenzke
Executive Vice President of Exploration of PEI
Mr. Krenzke joined the Company in November 2009 as the Executive Vice President of Exploration of Petsec Energy Inc.
Mr. Krenzke has 37 years of experience in the oil and gas exploration and production industry. His career includes experience
in management and growth, exploration program development, prospect generation and acquisition, joint ventures, and
corporate divestiture. In his early career Mr. Krenzke worked for major and large independent oil companies including:
Mobil Oil, Texas Eastern, Monsanto Oil and Amerada Hess. Since 1990 Mr. Krenzke has founded and co-founded three
private E&P companies operating in the Gulf Coast region of the USA. Mr. Krenzke co-founded Gryphon Exploration
Company which was formed in 2000 and was ultimately sold in 2005 for US$285 million. From 2006 through 2008,
Mr. Krenzke worked as a consultant in business development and evaluation of exploration and producing properties
in the Gulf Coast, Gulf of Mexico and North Sea regions. In 2008 he joined Saxet Petroleum as Executive Vice President
of Exploration, leaving in 2009 to join Petsec. Mr. Krenzke holds a Bachelor of Science degree in Geophysics from Texas
A&M University.
Denis Swords
General Counsel and Corporate Secretary of PEI
Mr Swords joined the Company in 2005 as the General Counsel and Corporate Secretary of Petsec Energy Inc. Mr Swords
has over 29 years of experience working in and with the oil and gas industry. He earned a Master of Science degree in
Geology from the University of New Orleans and worked as an exploration geologist for Tenneco Exploration and Production
Company and Sandefer Offshore from 1982 until he enrolled in the Louisiana State University Law School in 1989. After
receiving his Juris Doctor Degree in 1992, Mr Swords became a partner in a mid-sized law fi rm where he counselled
numerous oil and gas clients, until joining Petsec.
Fiona A Robertson
Chief Financial Offi cer
Ms Robertson joined the Company in 2002 as the Chief Financial Offi cer of the Petsec Energy Ltd group. Ms Robertson has
over 30 years of corporate fi nance experience including more than 20 in the resources industry. She spent 14 years working
for The Chase Manhattan Bank in London, New York and Sydney, and eight years with Delta Gold Ltd as General Manager,
Finance/Chief Financial Offi cer. In October 2011, Ms Robertson became a Non-Executive Director of One Asia Resources
Limited. Ms Robertson is also a Non-Executive Director of Drillsearch Energy Limited. Ms Robertson holds a Master of
Arts degree in geology from Oxford University, is a Fellow of the Australian Institute of Company Directors and a Member
of the Australasian Institute of Mining and Metallurgy. Ms Robertson resigned her position of Chief Financial Offi cer on
3 February 2012 to devote more time to her non-executive roles with other companies.
Paul Gahdmar
Company Secretary and Group Financial Controller
Mr Gahdmar joined the Company in 1999 as the Financial Accountant of the Petsec Energy Ltd group and has since held
a number of management positions within the Company. Mr Gahdmar was appointed as the Company Secretary of Petsec
Energy Ltd in 2008 and has over 15 years experience in corporate accounting and fi nance in listed companies within the
resources industry. Mr Gahdmar holds a Master of Business and Technology degree from The University of New South Wales
and a Diploma in Investor Relations from the Australasian Investor Relations Association. Mr Gahdmar is a Fellow of the
Institute of Public Accountants and a Member of the Australian Institute of Company Directors.
SHALE OIL:CATALYST FOR GROWTH
ANNUAL REPORT 2011 11

DIRECTORS’ REPORT CONT.
For the year ended 31 December 2011
3. Directors’ meetings
The Board has a formally constituted Audit Committee and a Nomination and Remuneration Committee, of which each
director is a member. A non-executive director chairs both committees.
The number of directors’ meetings (including meetings of committees of directors) and number of meetings attended
by each of the directors of the Company during the fi nancial year are:
Nomination & Audit Remuneration Regular Additional Committee Committee Board Meetings Board Meetings Meetings Meetings
Total number held during the year 11 – 4 3
T N Fern 11 – 4* 3*
D A Mortimer 11 – 4 3
M L Harvey 10 – 4 3
* Mr Fern attended as an invitee.
4. Remuneration report
The Remuneration Report is set out on pages 18 to 26 and forms part of the Directors’ Report for the fi nancial year ended
31 December 2011.
5. Principal activities
The principal activities of the consolidated entity during the course of the fi nancial year were oil and gas exploration and
production in the USA within the shallow waters of the Gulf of Mexico and onshore Louisiana and Texas, and oil exploration
in the shallow waters of the Beibu Gulf off the south coast of China.
In June 2011, Petsec Energy sold its wholly owned subsidiary which held the Company’s entire interest in Block 22/12
Beibu Gulf, China, a separate reportable segment (see notes 28 Segment Reporting and 29 Discontinued Operation of the notes
of the consolidated fi nancial statements for further details).
There were no other signifi cant changes in the nature of the activities of the consolidated entity during the year.
6. Financial review
Highlights
Petsec Energy generated revenues (after royalties and realised hedge gains) of US$13.0 million for the twelve months
to 31 December 2011, representing a decrease of 52% on the previous corresponding period (2010: US$27.1 million) due
to the combined effect of lower production volumes and lower average gas equivalent sales prices received for the year
– 2,277 MMcfe and US$5.69/Mcfe, respectively (2010: 3,882 MMcfe and US$6.98/Mcfe).
The lower production volumes for the current period resulted from natural decline in fi eld production, production shut ins
and curtailments at various times during the year due to sales pipeline issues, and the shut in of the Main Pass 270 A-3 well
in April 2011 due to an infl ux of sand in the well bore.
Lease operating expense of US$4.7 million (2010: US$6.9 million) and geological, geophysical and administrative expense
of US$6.7 million (2010: US$8.2 million) for the full year were both lower than in the previous corresponding period,
refl ecting lower production and the reduction and streamlining of the consolidated entity’s U.S. Gulf of Mexico operations.
Earnings before interest, income tax, DD&A and exploration expense and including realised hedge gains (“EBITDAX”)
for the twelve months to 31 December 2011 of US$1.6 million (2010: US$13.1 million) refl ected the lower net revenues
generated for the period.
The EBITDAX (cash operating) margin for the current period was US$0.72/Mcfe (2010: US$3.36/Mcfe), representing
a 13% (2010: 48%) gross operating margin.
12
6. Financial review cont.
Highlights cont.
Depreciation, depletion, and amortisation (“DD&A”) expense for the current period decreased 58% to US$5.2 million
(2010: US$12.5 million) as a result of the lower production for the year and the reduction in the carrying values of certain
U.S. oil and gas properties resulting from impairments recognised in 2010.
Financial expenses of US$0.6 million (2010: US$3.5 million) were lower, refl ecting the settlement of the U.S. subordinated
term loan during the current period.
The consolidated entity periodically reviews the carrying values (i.e. book value) of its oil and gas properties and, in
accordance with accounting standards and the consolidated entity’s policy, is required to demonstrate that the carrying
value of its properties are no less than, the estimated future discounted cash fl ow to be generated from the expected
production from these properties.
For the current period, the consolidated entity recognised dry hole, impairment and abandonment expense of
US$20.2 million (2010: US$19.5 million) mainly comprised of impairment provisions against certain producing properties
due to lower than anticipated future performance of certain of the wells coupled with the continued softening of natural
gas prices since the beginning of the year (see note 7 – Profi t/(loss) for the Period of the notes to the consolidated fi nancial
statements for further details).
The consolidated entity recorded a net profi t after tax for the twelve months to 31 December 2011 of US$14.0 million
(2010: loss of US$35.2 million) after one-off accounting gains recognised on the discharge of the subordinated term
loan (US$11.4 million) and the disposal of the wholly owned subsidiary which held the China joint venture interests
(US$29.8 million) – see note 29 Discontinued Operations of the notes to the consolidated fi nancial statements for further
details. The net impact of the one-off accounting gains were offset to some extent by the recognition of dry hole, impairment
and abandonment expense of US$20.2 million in the current period (see note 7: Profi t/(loss) for the Period of the notes
to the consolidated fi nancial statements for further details).
Financial position
During the year, all outstanding amounts under the subordinated term loan owed by the U.S. subsidiary Petsec Energy Inc.
(“PEI”) were settled. The amount of the term loan of US$29.2 million was fully extinguished in exchange for US$12 million
in cash plus, the conveyance of a part interest in some of the Company’s US properties, these being a 2.5% working interest
in the three Main Pass 270 producing wells, a 2.0% working interest in Petsec Energy’s leases over the Marathon gas/
condensate discovery, and 25% of PEI’s working interest in ten non-producing leases in the Gulf of Mexico and the
exploration area of Main Pass 270 (see note 18 Borrowings of the notes to the consolidated fi nancial statements for further
details). The consolidated entity is now debt free.
In June 2011, the Company sold its wholly owned subsidiary, Petsec Petroleum LLC, which held its interest in Block 22/12
in the Beibu Gulf, China, to Horizon Oil Limited for cash consideration of A$38 million, plus 15 million share options with
a three year term and an exercise price of A$0.37 (see note 29 Discontinued Operations of the notes to the consolidated
fi nancial statements for further details).
The proceeds received from the sale of the China interests together with the settlement of the U.S. subordinated term
loan considerably strengthened the balance sheet and cash position of the consolidated entity.
At 31 December 2011, the consolidated entity had no debt and held total cash deposits of US$41.6 million including
US$6.6 million of cash deposits held in an escrow account to partially secure US$7.4 million of operator bonds that are on
issue to the Bureau of Ocean Energy Management, Regulation and Enforcement (“BOEMRE”). In the previous corresponding
period the consolidated entity had secured bank loans of US$29.2 million (before US$0.3 million of unamortised debt issue
costs) and held total cash deposits of US$23.1 million including US$5.7 million of restricted cash deposits.
SHALE OIL:CATALYST FOR GROWTH
ANNUAL REPORT 2011 13
DIRECTORS’ REPORT CONT.
For the year ended 31 December 2011
7. Operations review
USA, Gulf of Mexico/Onshore Louisiana
Gulf of Mexico
Operating conditions in the Gulf of Mexico continue to be negatively impacted by low gas prices, and a more diffi cult
operating environment post the 2010 Macondo well blowout. The Company responded to these diffi cult operating conditions
by eliminating debt, raising capital through the disposition of its China oil interests and redirecting its exploration focus
away from the Gulf of Mexico shelf, to deep large potential reserve prospects in the Louisiana Gulf Coast region, and
to the emerging North American unconventional shale oil resource plays (see Shale Oil section below for further details).
Operations
Petsec Energy currently produces oil and gas in the offshore shallow waters of the Gulf of Mexico and the Gulf Coast of
Louisiana in fi ve producing fi elds. The main oil and gas fi elds are Main Pass 270, Marathon (Atchafalaya Bay), Main Pass
18/19, and Chandeleur Area 31/32.
The Company experienced a number of curtailments of production at its larger fi elds, particularly Main Pass 270 and the
Marathon Field throughout the year, mainly due to third party sales pipeline shut-ins, resulting in a 23% reduction to the
expected production for the year of 3 Bcfe. In addition to the pipeline issues, the Main Pass 270 A-3 well ceased producing
in April 2011 due to an infl ux of sand, and remains shut in until a work-over can be undertaken to restore production from
the well. The Company is currently waiting on a proposal from the operator regarding the timing of future well operations.
Production from the Marathon Field had been restricted since mid July 2011 because of third party sales pipeline capacity
issues. Currently, pipeline capacity for Marathon production is restricted to 10 MMcfpd, resulting in the Marathon #1 well
being shut-in and the Marathon #2 well which was brought into production in November 2011, restricted to 10 MMcfpd.
The Marathon #1 well was producing at a gross daily rate of 24 MMcfpd prior to the pipeline restrictions. The Marathon
#2 well is expected to be capable of similar rates.
New facilities are scheduled to be built mid 2012 to allow optimal production from the existing two wells, the third well due
to spud in March 2012, and further development wells (see Exploration/Development section below for further details).
Exploration/Development
In April 2011, the Company participated in the drilling of the Marathon #2 well – the second well drilled in the Marathon
gas/condensate Field, Louisiana Gulf Coast.
The Marathon #2 well, located approximately 2,950 feet (900 metres) from the successful Marathon #1 well, reached target
depth of 21,160 feet (6,450 metres) in August 2011 confi rming the productive reservoirs found in the #1 well and extended
the known fi eld pays across the structure. The #2 well commenced production in November 2011. While the well is capable
of producing at 24 MMcfe per day similar to the #1 well it is currently restricted to a gross production rate of 10 MMcfe per
day due to the third party pipeline constraints.
Shale Oil
In response to continuing low US natural gas prices, the Company has redirected itself to oil prospects, particularly the
emerging unconventional shale oil plays, onshore North America, where it believes the Company can achieve the highest
return on its capital invested. During the year, the Company made a number of strategic alliances and conducted regional
reviews to identify areas of shale oil potential which are not being actively explored. The Company expects to be an “early
mover” in areas where the shale source rocks are liquid rich and to acquire a sizeable holding of high quality acreage
before it becomes competitive and costly to lease.
For competitive reasons, the location of the projects and leasing activities will remain confi dential until the desired lease
acquisition has been completed.
In February 2012, the Company agreed to participate in a shale oil project in Alberta, Canada where it can earn a 24.5%
working interest in leases covering 17,280 acres. To earn its interest in the leases, the Company will pay 35% of the costs
to drill one initial commitment well and 35% of the costs of drilling up to three optional wells.
The initial commitment well is expected to spud in early March 2012. The results of the well will be extensively evaluated
over a 3 – 4 month period after which the Company can elect to participate in the drilling of the fi rst optional well.
14

7. Operations review cont.
USA, Gulf of Mexico/Onshore Louisiana cont.
Plug and abandonment
During the year, the Company plugged and abandoned the Mobile Bay Area and Main Pass Block 20 fi elds, completing
the work in October 2011. In addition, the plug and abandonment of the Company’s South Sunrise onshore fi eld was
substantially complete as of 31 December 2011. The Company has no immediate plans to plug and abandon any of the
other producing fi elds.
Oil and gas reserves – USA
Independently estimated proved and probable (2P) oil and gas reserves at 31 December 2011 were 15.4 Bcfe, after reductions
in reserves of 1.3 Bcfe for the conveyance of certain working interests as part of the settlement of the subordinated term
loan (refer to note 18 Borrowings of the notes to the consolidated fi nancial statements for further details), net additions
of 2.1 Bcfe, and production of 2.3 Bcfe for the twelve months to 31 December 2011. The table below provides a summary
of both the independently assessed and the Company’s reserve estimates and movements.
Independent Assessment1 Petsec Energy
Estimated Proved and Recoverable Proved Probable Probable Proved andGas Equivalent (Bcfe *) Reserves Reserves Reserves Probable Reserves
USA Reserves
Reserves at 31 December 2010 13.1 3.8 16.9 16.7
Conveyance of working interests (0.9) (0.4) (1.3) (1.3)
Net additions2 1.2 0.9 2.1 1.6
Production (2.3) – (2.3) (2.3)
USA Reserves at 31 December 2011 11.1 4.3 15.4 14.7
* Billion cubic feet of gas equivalent using ratio of six thousand cubic feet of natural gas to one barrel of oil.1 The independent reserve assessments at 31 December 2011 were estimated by petroleum engineers Ryder Scott Company.2 Net additions comprise reserves added during the period and the effect of downward reserve adjustments made for the period.
Competent Person Statement
In accordance with ASX Listing Rules, the Petsec Energy Inc. internal reserve estimates information in this report is based
upon information compiled, reviewed and signed off by Mr Ron Krenzke, Executive Vice President Exploration, a full-time
employee of Petsec Energy Inc. Mr Krenzke has at least fi ve years’ relevant experience within the sector and consents
to the disclosure of this information in the form and context in which it appears.
8. Objectives, strategy and future performance
It is the consolidated entity’s objective to increase shareholder value through successful oil and gas exploration, development
and production and through acquisitions. The consolidated entity intends to produce its current reserves, continue oil
and gas exploration and development drilling activities in the Louisiana Gulf Coast region, and advance its shale oil projects
in North America.
9. Dividends
Directors do not recommend the payment of a dividend for the fi nancial year ended 31 December 2011. No dividends were
paid during the fi nancial year.
10. Signifi cant changes in state of affairs
There were no signifi cant changes to the state of affairs of Petsec Energy during the fi nancial year, other than those detailed
in the “Financial review” and “Operations review” sections of this report.
SHALE OIL:CATALYST FOR GROWTH
ANNUAL REPORT 2011 15

DIRECTORS’ REPORT CONT.
For the year ended 31 December 2011
11. Environmental regulation
The consolidated entity’s oil and gas exploration and production activities are subject to signifi cant environmental
regulation under U.S. Federal and State legislation.
The consolidated entity is committed to achieving a high standard of environmental performance and compliance with
all lease conditions. Directors are not aware of any breach of environmental compliance requirements relating to the
consolidated entity’s activities during the year.
12. Likely developments
Petsec Energy’s focus in 2012 will be on shale oil exploration due to the anticipated soft U.S. natural gas prices over the
next twelve months and the increased regulatory burden for operating in the Gulf of Mexico. In 2012, the consolidated
entity expects to acquire a number of lease positions and commence drilling.
13. Directors’ interests
The relevant interest of each director in the shares or options over such instruments issued by the Company, as notifi ed
by the directors to the Australian Securities Exchange in accordance with S205G (1) of the Corporations Act 2001, at the
date of this report is as follows:
Options overDirector Ordinary Shares Ordinary Shares
T N Fern 28,826,876 2,000,000
D A Mortimer 9,326,550 Nil
M L Harvey Nil Nil
14. Share options
Options granted to directors and offi cers of the Company
During or since the end of the fi nancial year, no grants of options were made to directors or the fi ve most highly
remunerated offi cers of the Company as part of their remuneration.
As at 31 December 2011, there were 3,366,000 options over ordinary shares in Petsec Energy Ltd on issue, all of which
are employee options exercisable at prices ranging from A$0.20 to A$3.11 per share expiring at various dates between
23 January 2012 and 31 December 2014 with exercise dependent on completion of vesting period and satisfaction of share
price hurdles ranging from A$0.30 to A$6.84 being achieved on the Australian Securities Exchange. During the year,
no options were granted or exercised and 1,906,000 options were forfeited.
Subsequent to 31 December 2011 through the date of this report, no employee options have been exercised.
Unissued shares under option
At the date of this report, unissued ordinary shares of the Company under option are:
Expiry date Exercise price Number of shares
23 January 2012 A$2.27 35,000
14 June 2012 A$2.40 1,500,000
14 June 2012 A$3.11 500,000
17 July 2012 A$1.48 30,000
12 February 2013 A$1.19 75,000
31 December 2013 A$0.20 373,500
31 December 2014 A$0.23 852,500
3,366,000
16
14. Share options cont.
Shares issued on exercise of options
During the fi nancial year, there were no ordinary shares issued by the Company as result of the exercise of options.
15. Indemnifi cation and insurance of offi cers
During the year ended 31 December 2011, the Company maintained policies of insurance in respect of directors and offi cers
liability. The policies insure persons who are directors or offi cers of the Company and its controlled entities against certain
costs and expenses which may be incurred by them in defending proceedings and against other liabilities which may arise
from their positions. The insured directors and offi cers are the directors, executive offi cers and secretaries of the Company
and the directors, executive offi cers and secretaries of controlled entities.
The insurance contracts prohibit the disclosure of particulars of the premiums and the nature of the liabilities insured.
The Company has entered into Deeds of Indemnity and Access with directors on the terms approved by shareholders.
The agreements stipulate that the Company will meet the full amount of any liabilities to another person that might arise
from their position (except where the liability arises out of conduct involving a lack of good faith).
The Company has made during or since the end of the fi nancial year no payments in relation to indemnifi cation. The Company
provides the normal indemnities to directors and offi cers in relation to the work carried out on behalf of or at the request
of the Company.
16. Non-audit services
During the year KPMG, the Company’s auditor, has performed certain other services in addition to their statutory duties.
The Board has considered the non-audit services provided during the year by the auditor and, in accordance with advice
provided by resolution of the audit committee, is satisfi ed that the provision of those non-audit services during the year by
the auditor is compatible with, and did not compromise, the auditor independence requirements of the Corporation Act 2001
for the following reasons:
• All non-audit services were subject to the corporate governance procedures adopted by the Company and have been
reviewed by the audit committee to ensure they do not impact the integrity and objectivity of the auditor; and
• The non-audit services provided do not undermine the general principles relating to auditor independence as set out in
APES 110 Code of Ethics for Professional Accountants, as they did not involve reviewing or auditing the auditor’s own work,
acting in a management or decision-making capacity for the Company, acting as an advocate for the Company or jointly
sharing risks and rewards.
Details of the amounts paid to the auditor of the Company, KPMG, and its related practices for audit and non-audit services
provided during the year are set out in Note 9 of the accompanying Financial Statements.
17. Lead auditor’s independence declaration
The Lead Auditor’s Independence Declaration is set out on page 27 and forms part of the Directors’ Report for the fi nancial
year ended 31 December 2011.
18. Rounding off
The Company is of a kind referred to in ASIC Class Order 98/100 dated 10 July 1998 and in accordance with that Class Order,
amounts in the Financial Report and Directors’ Report have been rounded off to the nearest one thousand dollars, unless
otherwise stated.
SHALE OIL:CATALYST FOR GROWTH
ANNUAL REPORT 2011 17

DIRECTORS’ REPORT CONT.
For the year ended 31 December 2011
19. Events subsequent to balance date
On 15 February 2012, Petsec Energy announced that it had agreed to participate in a shale oil project in Alberta, Canada
where it can earn a 24.5% working interest in leases covering 17,280 acres. To earn its interest in the leases, the Company
will pay 35% of the costs to drill one initial commitment well and 35% of the costs of drilling up to three optional wells.
The Company’s share of the drilling costs for the initial commitment well, which is expected to spud in early March 2012,
is approximately US$0.7 million.
Further details relating to the farm-in to the shale oil project are contained within the media release made to ASX
on 15 February 2012.
This report is made with a resolution of the directors:
T N Fern
Director
Sydney, 28 February 2012
20. Remuneration Report – Audited
20.1 Introduction
This Remuneration Report forms part of the Directors’ Report. It outlines the overall remuneration strategy, framework
and practices adopted by the Company and the consolidated entity (“Petsec Energy Group”) for the year ended 31 December 2011
and has been prepared in accordance with Section 300A of the Corporations Act 2001 and its regulations.
In accordance with the Corporations Act 2001, remuneration details are disclosed for the Petsec Energy Group’s Key
Management Personnel, which includes the fi ve most highly remunerated executives.
Key management personnel are those persons having authority and responsibility for planning, directing and controlling
the activities of the Petsec Energy Group. Key management personnel comprise the directors of the Company and senior
executives of the Petsec Energy Group, whose names appear in the tables in section 20.5 of this report.
20.2 Executive summary
The Board’s remuneration policy is to provide fair and market competitive levels of remuneration for all employees,
including directors and key management personnel in order for the Company and the Petsec Energy Group to benefi t
by attracting and retaining a high quality team.
The Company has a Nomination and Remuneration Committee to assist the Board in the implementation
and administration of the remuneration policy – refer to section 20.3, below.
Key developments during the year in the implementation and administration of the remuneration policy were:
20.2.1 The Board reviewed the form of the executive employment agreements offered to key management personnel
and amended its terms to standardise the agreements and ensure that termination payments payable to key
management personnel would not exceed 12 months of base salary. This amendment ensures alignment with
the Corporations Act 2001. The Board negotiated and entered into the new form of agreement with Mr Keogh,
President of Petsec Energy Inc. (“PEI”) and Group Chief Financial Offi cer, to refl ect the changes outlined above.
18
20. Remuneration Report – Audited cont.
20.2 Executive summary cont.
20.2.2 The Board determined that Mr Keogh, President of PEI and Group Chief Financial Offi cer and Mr Krenzke, Executive
Vice President of Petsec Energy Inc. would receive an increase in annual base salary, taking into account the scope
and added responsibilities associated with each of the positions, their skills and experience, and to ensure that such
remuneration remains competitive and in line with market conditions.
20.2.3 In 2011, key management personnel were awarded discretionary bonuses in recognition of their personal efforts,
particularly in relation to the achievement of the settlement of the US term debt, and the Marathon discovery.
20.3 Nomination and Remuneration Committee
The Nomination and Remuneration Committee oversees the appointment and induction process for directors and
committee members, and the selection, appointment and succession planning process of the Company’s Chief Executive
Offi cer. The Committee makes recommendations to the Board on the appropriate skill mix, personal qualities, expertise
and diversity of each position. When a vacancy exists or there is a need for particular skills, the Committee in consultation
with the Board determines the selection criteria based on the skills deemed necessary.
The Committee reviews and makes recommendations to the Board on compensation packages and policies applicable to the
executive offi cers and directors of the Petsec Energy Group. It is also responsible for oversight of diversity, employee share
and option schemes, incentive performance packages, superannuation entitlements, retirement and termination entitlements,
fringe benefi ts policies, deeds of access and indemnity, and professional indemnity and liability insurance policies.
Executive compensation and other terms of employment are reviewed annually by the Nomination and Remuneration
Committee having regard to performance against goals set at the start of the year, relevant corporate information and
where appropriate independent expert advice.
The Nomination and Remuneration Committee comprised the following members during the year:
• D A Mortimer (Chairman) – Independent Non-Executive Director
• M L Harvey – Independent Non-Executive Director
The Board policy is that the Nomination and Remuneration Committee will comprise a majority of non-executive directors
and a non-executive chairman.
The Nomination and Remuneration Committee meets at least twice a year and as required. The Committee met three times
during the year and the Committee members’ attendance record is disclosed in the table of directors’ meetings.
The Nomination and Remuneration Committee’s Charter is available on the Company’s website www.petsec.com.au.
20.4 Principles of compensation
Compensation levels for key management personnel are competitively set to attract and retain appropriately qualifi ed
and experienced directors and senior executives. The Nomination and Remuneration Committee obtains peer comparisons
and/or independent advice on the appropriateness of compensation packages of the Petsec Energy Group, given trends
in comparative companies both locally and internationally and the objectives of the Company’s compensation strategy.
The compensation structures explained below are designed to attract suitably qualifi ed candidates, reward the
achievement of the Company’s objectives, and achieve the broader outcome of creation of value for shareholders.
The compensation structures take into account:
• the capability and experience of the key management personnel; and
• the key management personnel’s ability to control the relevant performance of their segment of operation.
SHALE OIL:CATALYST FOR GROWTH
ANNUAL REPORT 2011 19
DIRECTORS’ REPORT CONT.
For the year ended 31 December 2011
20. Remuneration Report – Audited cont.
20.4 Principles of compensation cont.
Compensation packages include a mix of fi xed compensation and performance-based incentives, including equity-based
incentives as set out below.
In addition to their salaries, the Petsec Energy Group also provides non-cash benefi ts to its key management personnel as
set out below, and contributes to several post-employment defi ned contribution superannuation plans in Australia and also
matches contributions made by U.S.-based key management personnel to a voluntary savings plan under Section 401(k)
of the U.S. tax code.
Fixed compensation
Fixed compensation consists of base compensation (which is calculated on a total cost basis and includes any FBT charges
related to employee benefi ts), as well as employer contributions to superannuation funds in Australia and employer
matching contributions to voluntary savings plans under Section 401(k) of the U.S. tax code. Non-cash benefi ts comprise
employer payments towards U.S. health, dental and vision plans, as well as life and salary continuance insurance benefi ts.
The Nomination and Remuneration Committee reviews compensation levels and other terms of employment annually
through a process that considers individual, segment and overall performance of the Company against goals set at the
start of the year. In addition, where necessary, external consultants provide analysis and advice to ensure the directors’
and senior executives’ compensation is competitive in the market place.
Performance-linked compensation
Performance-linked compensation includes both short-term and long-term incentives and is designed to reward key
management personnel for meeting or exceeding the Company’s fi nancial objectives and agreed individual objectives.
The short-term incentive (STI) is an “at risk” bonus provided in the form of cash, while the long-term incentive (LTI) is
provided as either shares or options over ordinary shares of the Company under the rules of the Employee Share and
Option Plans approved by shareholders at the Annual General Meeting held on 21 May 2010 (see note 19(c) to fi nancial
statements). The maximum number of securities in aggregate that may be issued under the Employee Share and Option
Plans is 15,033,435.
Short-term incentive
Short-term incentives are provided to employees through bonuses and the Company’s Nomination and Remuneration
Committee has the right to grant discretionary bonuses. Factors considered by the Committee when granting discretionary
bonuses include personal performance, the achievement of strategic objectives, and the retention and motivation of employees.
During the year, the Company awarded discretionary bonuses to certain key management personnel in recognition of their
personal efforts, particularly in relation to the achievement of the settlement of the US term debt, and Marathon discovery
(see section 20.5 of this Directors’ Report).
Long-term incentive
Eligible employees are also provided with long-term incentives through participation in the Company’s Employee Share
and Option Plans, subject to the approval of the Committee. Employees are typically offered options on an annual basis with
the exercise price of the shares or options based on the weighted average market price of the Company’s ordinary shares
for the fi ve trading days preceding the date of issue, subject to a minimum exercise price of 20 cents.
During the reporting period, two senior executives were each issued 2,000,000 shares, Mr Keogh (President of Petsec
Energy Inc. and Group Chief Financial Offi cer) and Mr Krenzke (Vice President of Exploration of Petsec Energy Inc.),
as long-term incentive compensation (2010: nil). The shares were issued at a price of A$0.20 per share and funded by
a loan from the Company, repayable on or before 1 January 2016 and secured by a full recourse promissory note bearing
interest at the rate of 2.26% per annum (U.S. based interest rate as the executives are U.S. residents).
20
20. Remuneration Report – Audited cont.
20.4 Principles of compensation cont.
Long-term incentive cont.
The shares are subject to a holding lock which prevents them from being sold or assigned. For each of the two executives
1,000,000 shares were released from the holding lock on 1 January 2012, and unless there is a prior change of control of
the Company or involuntary cessation of employment of the key management personnel, further shares will be released
to each of the executives from the holding lock as follows:
i) 500,000 shares on 1 January 2013
ii) 500,000 shares on 1 January 2014
The shares were issued outside the Employee Share Plan as the executives are based in the U.S. and the plan was designed
specifi cally to comply with Australian regulatory and taxation requirements. The progressive release of shares from the
holding lock is designed to assist with the retention of the executives.
Service agreements
Remuneration and other terms of engagement of executive employees are formalised in service agreements that are
unlimited in term but capable of termination by varying periods of notice or by payment of an amount in lieu of notice.
The service agreements generally outline the components of compensation paid, but do not prescribe how compensation
levels are modifi ed from year-to-year. Compensation levels are reviewed each year in light of cost-of-living changes,
performance of and changes in the scope of the role performed by the executive and changes required to meet the
principles of the compensation policy.
The Managing Director, Mr Fern, is engaged via a company of which Mr Fern is a director. The Company may terminate
this agreement without cause by giving not less than twelve months’ notice or pay an amount equal to the fees for
twelve months in lieu of notice. Mr Fern may terminate the agreement with not less than six months’ notice. With cause,
Mr Fern may terminate the agreement by giving one month’s notice and would be entitled to a payment equal to fees for
a twelve-month period.
The President of Petsec Energy Inc. and Group Chief Financial Offi cer, Mr Keogh and Executive Vice President of Exploration
of Petsec Energy Inc., Mr Krenzke have employment agreements that are capable of termination without cause by the
company by a lump sum payment equal to one times their annual Base Salary. Mr Keogh and/or Mr Krenzke may terminate
the agreement without cause by giving the company at least 120 days notice in writing. Mr Keogh and/or Mr Krenzke may
terminate their agreement for cause and in this event are entitled to receive a lump sum payment equal to one times their
annual base salary at that time.
Other executives have service agreements which are capable of termination by the Company without cause by the payment
of between one and three months’ notice, or are “at-will” employment contracts entered into in the USA where either party
may terminate the employment relationship at any time and for any reason without any further liability, except as required
by law.
Non-executive directors
Directors’ fees are set having regard to periodic advice from external remuneration consultants, market surveys and
the level of fees paid relative to those of other comparable companies. Directors’ fees for the 2011 year were unchanged
from the 2010 year and comprise base fees, plus statutory superannuation for Australian directors. Directors are also
entitled to reasonable travel, accommodation and other expenses incurred in attending meetings or while engaged on
Company business.
Non-executive directors do not receive performance-related compensation. Directors’ fees cover all main Board activities
and membership of committees and are subject to the aggregate limit of A$300,000 approved by shareholders at the 1996
Annual General Meeting.
Non-executive directors appointed prior to 2003 are entitled to receive a retirement benefi t equivalent to the remuneration
received in the three years prior to retirement. Incoming non-executive directors are not entitled to retirement benefi ts.
SHALE OIL:CATALYST FOR GROWTH
ANNUAL REPORT 2011 21
DIRECTORS’ REPORT CONT.
For the year ended 31 December 2011
20. Remuneration Report – Audited cont.
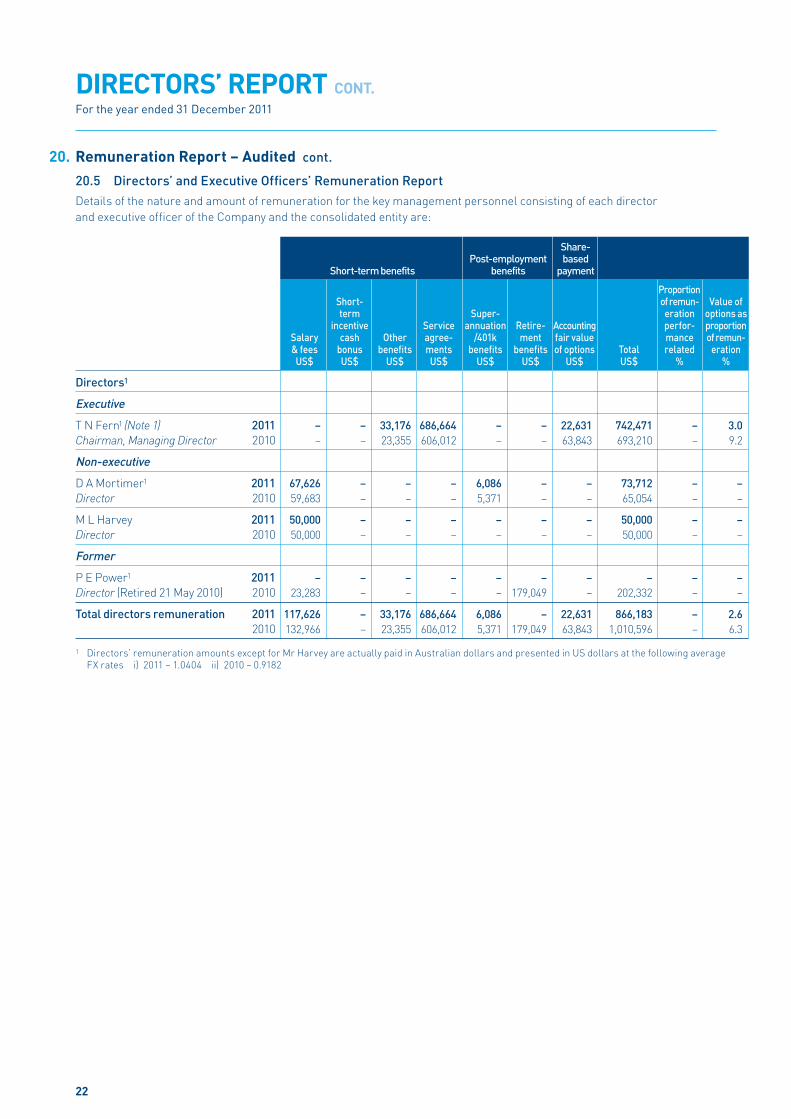
20.5 Directors’ and Executive Offi cers’ Remuneration Report
Details of the nature and amount of remuneration for the key management personnel consisting of each director
and executive offi cer of the Company and the consolidated entity are:
Share- Post-employment based Short-term benefits benefits payment
Proportion Short- of remun- Value of term Super- eration options as incentive Service annuation Retire- Accounting perfor- proportion Salary cash Other agree- /401k ment fair value mance of remun- & fees bonus benefi ts ments benefi ts benefi ts of options Total related eration US$ US$ US$ US$ US$ US$ US$ US$ % %
Directors1
Executive
T N Fern1 (Note 1) 2011 – – 33,176 686,664 – – 22,631 742,471 – 3.0
Chairman, Managing Director 2010 – – 23,355 606,012 – – 63,843 693,210 – 9.2
Non-executive
D A Mortimer1 2011 67,626 – – – 6,086 – – 73,712 – –
Director 2010 59,683 – – – 5,371 – – 65,054 – –
M L Harvey 2011 50,000 – – – – – – 50,000 – –
Director 2010 50,000 – – – – – – 50,000 – –
Former
P E Power1 2011 – – – – – – – – – –
Director (Retired 21 May 2010) 2010 23,283 – – – – 179,049 – 202,332 – –
Total directors remuneration 2011 117,626 – 33,176 686,664 6,086 – 22,631 866,183 – 2.6
2010 132,966 – 23,355 606,012 5,371 179,049 63,843 1,010,596 – 6.3
1 Directors’ remuneration amounts except for Mr Harvey are actually paid in Australian dollars and presented in US dollars at the following average
FX rates i) 2011 – 1.0404 ii) 2010 – 0.9182
22

20. Remuneration Report – Audited cont.
20.5 Directors’ and Executive Offi cers’ Remuneration Report cont.
Details of the nature and amount of remuneration for the key management personnel consisting of each director
of the Company and executive offi cer of the Company and the consolidated entity are:
Share- Post-employment based Short-term benefits benefits payment
Proportion Short- of remun- Value of term Super- eration options as incentive Service annuation Retire- Accounting perfor- proportion Salary cash Other agree- /401k ment fair value mance of remun- & fees bonus benefi ts ments benefi ts benefi ts of options Total related eration US$ US$ US$ US$ US$ US$ US$ US$ % %
Executives
R A Keogh 2011 280,000 117,000 29,309 – 33,212 – 1,316 460,837 25.4 0.3
President, Petsec Energy Inc. 2010 234,000 – 27,917 – 33,212 – 55,222 350,351 – 15.8
(PEI) and Group Chief
Financial Offi cer
R Krenzke 2011 280,000 93,000 29,309 – 34,467 – – 436,776 21.3 –
Executive Vice President 2010 234,000 – 27,917 – 24,300 – – 286,217 – –
Exploration, PEI
D Swords 2011 177,000 26,550 29,276 – 17,700 – 299 250,825 10.6 0.1
General Counsel/ Corporate 2010 177,000 – 27,884 – 17,700 – 10,221 232,805 – 4.4
Secretary, PEI
F Robertson1 (Note 2) 2011 – – 18,941 142,691 – – – 161,632 – –
Chief Financial Offi cer 2010 – – 7,374 217,687 – – 25,602 250,663 – 10.2
(resigned 3 February 2012)
P Gahdmar1 2011 167,037 27,311 6,152 – 15,033 – 667 216,200 12.6 0.3
Company Secretary, 2010 147,417 – 2,230 – 13,268 – 8,945 171,860 – 5.2
Group Financial Controller
Former
F Steele 2011 – – – – – – – – – –
Vice President Land, PEI 2010 109,320 – 16,285 – 10,932 – 839 137,376 – 0.6
(resigned 26 July 2010)
Total executive remuneration 2011 904,037 263,861 112,987 142,691 100,412 – 2,282 1,526,270 17.3 0.1
2010 901,737 – 109,607 217,687 99,412 – 100,829 1,429,272 – 7.1
Total directors and executive 2011 1,021,663 263,861 146,163 829,355 106,498 – 24,913 2,392,453 11.0 1.0
offi cer remuneration
(Consolidated) 2010 1,034,703 – 132,962 823,699 104,783 179,049 164,672 2,439,868 – 6.7
Total directors and executive 2011 234,663 27,311 58,269 829,355 21,119 – 23,298 1,194,015 2.3 2.0
offi cer remuneration
(Company) 2010 230,383 – 32,959 823,699 18,639 179,049 98,390 1,383,119 – 7.1
1 Australian-based executive offi cers’ remuneration amounts are actually paid in Australian dollars and presented in US dollars at the following
average FX rates i) 2011 – 1.0404 ii) 2010 – 0.9182.
SHALE OIL:CATALYST FOR GROWTH
ANNUAL REPORT 2011 23
DIRECTORS’ REPORT CONT.
For the year ended 31 December 2011
20. Remuneration Report – Audited cont.
20.5 Directors’ and Executive Offi cers’ Remuneration Report cont.
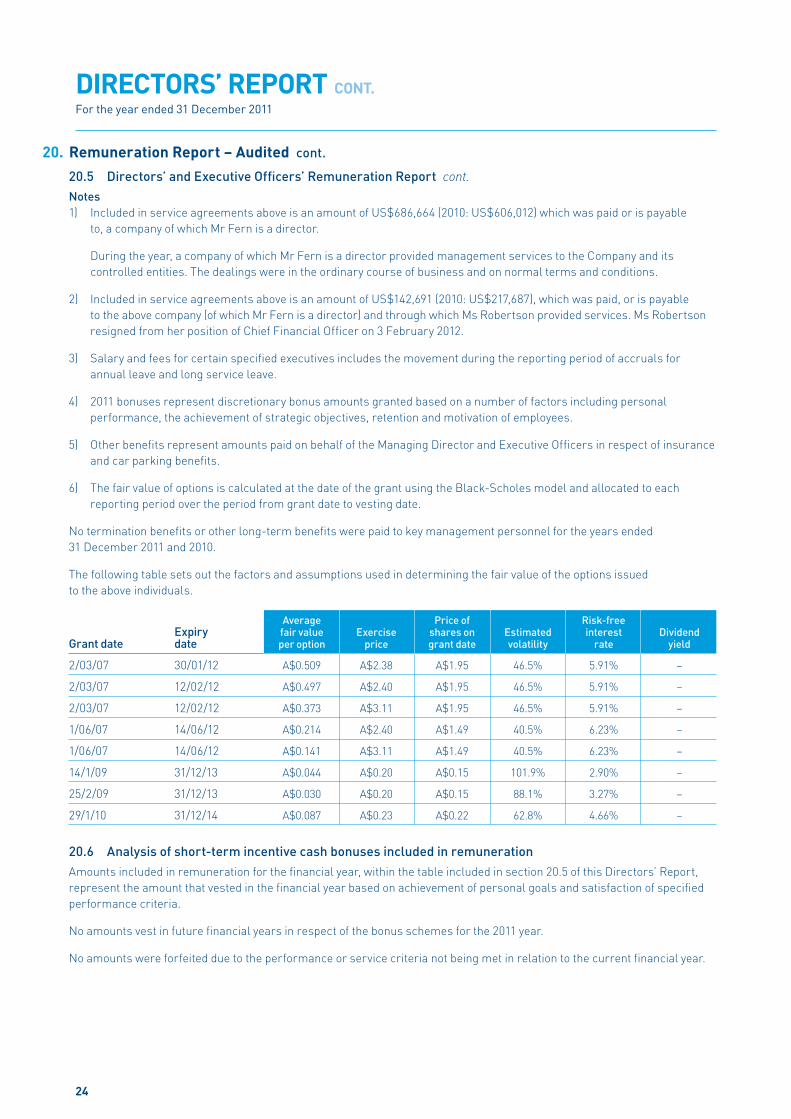
Notes
1) Included in service agreements above is an amount of US$686,664 (2010: US$606,012) which was paid or is payable
to, a company of which Mr Fern is a director.
During the year, a company of which Mr Fern is a director provided management services to the Company and its
controlled entities. The dealings were in the ordinary course of business and on normal terms and conditions.
2) Included in service agreements above is an amount of US$142,691 (2010: US$217,687), which was paid, or is payable
to the above company (of which Mr Fern is a director) and through which Ms Robertson provided services. Ms Robertson
resigned from her position of Chief Financial Offi cer on 3 February 2012.
3) Salary and fees for certain specifi ed executives includes the movement during the reporting period of accruals for
annual leave and long service leave.
4) 2011 bonuses represent discretionary bonus amounts granted based on a number of factors including personal
performance, the achievement of strategic objectives, retention and motivation of employees.
5) Other benefi ts represent amounts paid on behalf of the Managing Director and Executive Offi cers in respect of insurance
and car parking benefi ts.
6) The fair value of options is calculated at the date of the grant using the Black-Scholes model and allocated to each
reporting period over the period from grant date to vesting date.
No termination benefi ts or other long-term benefi ts were paid to key management personnel for the years ended
31 December 2011 and 2010.
The following table sets out the factors and assumptions used in determining the fair value of the options issued
to the above individuals.
Average Price of Risk-free Expiry fair value Exercise shares on Estimated interest DividendGrant date date per option price grant date volatility rate yield
2/03/07 30/01/12 A$0.509 A$2.38 A$1.95 46.5% 5.91% –
2/03/07 12/02/12 A$0.497 A$2.40 A$1.95 46.5% 5.91% –
2/03/07 12/02/12 A$0.373 A$3.11 A$1.95 46.5% 5.91% –
1/06/07 14/06/12 A$0.214 A$2.40 A$1.49 40.5% 6.23% –
1/06/07 14/06/12 A$0.141 A$3.11 A$1.49 40.5% 6.23% –
14/1/09 31/12/13 A$0.044 A$0.20 A$0.15 101.9% 2.90% –
25/2/09 31/12/13 A$0.030 A$0.20 A$0.15 88.1% 3.27% –
29/1/10 31/12/14 A$0.087 A$0.23 A$0.22 62.8% 4.66% –
20.6 Analysis of short-term incentive cash bonuses included in remuneration
Amounts included in remuneration for the fi nancial year, within the table included in section 20.5 of this Directors’ Report,
represent the amount that vested in the fi nancial year based on achievement of personal goals and satisfaction of specifi ed
performance criteria.
No amounts vest in future fi nancial years in respect of the bonus schemes for the 2011 year.
No amounts were forfeited due to the performance or service criteria not being met in relation to the current fi nancial year.
24
20. Remuneration Report – Audited cont.
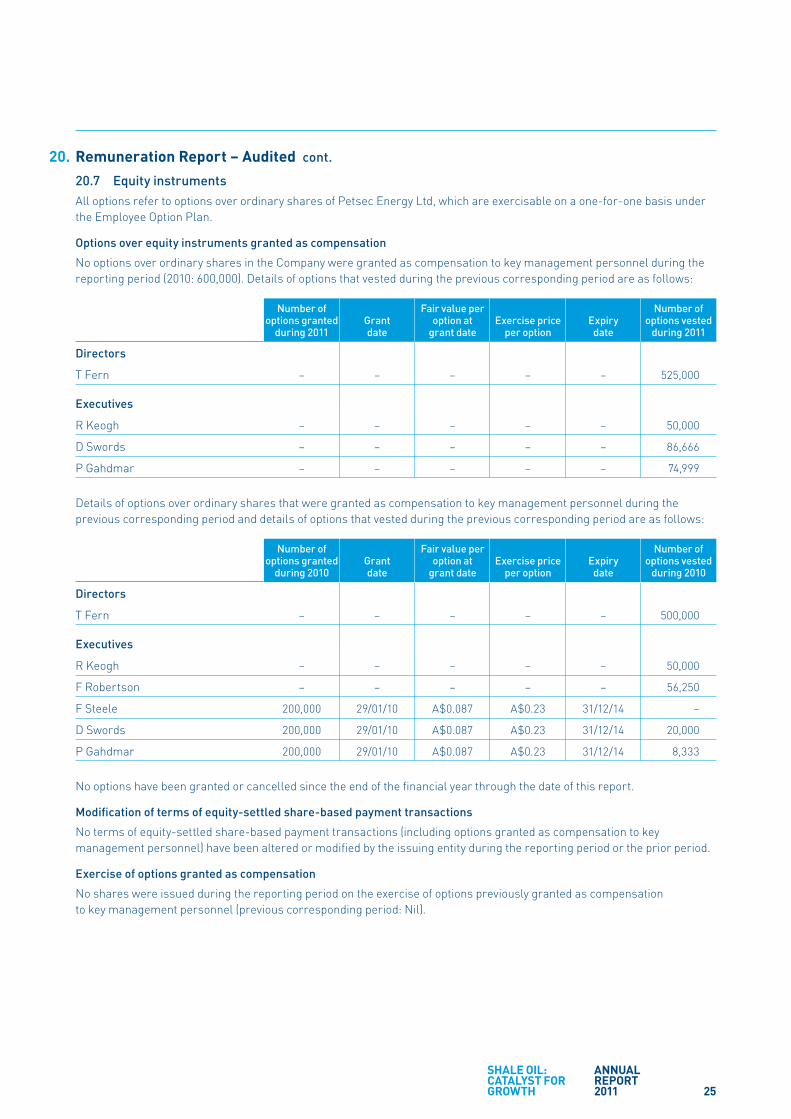
20.7 Equity instruments
All options refer to options over ordinary shares of Petsec Energy Ltd, which are exercisable on a one-for-one basis under
the Employee Option Plan.
Options over equity instruments granted as compensation
No options over ordinary shares in the Company were granted as compensation to key management personnel during the
reporting period (2010: 600,000). Details of options that vested during the previous corresponding period are as follows:
Number of Fair value per Number of options granted Grant option at Exercise price Expiry options vested during 2011 date grant date per option date during 2011
Directors
T Fern – – – – – 525,000
Executives
R Keogh – – – – – 50,000
D Swords – – – – – 86,666
P Gahdmar – – – – – 74,999
Details of options over ordinary shares that were granted as compensation to key management personnel during the
previous corresponding period and details of options that vested during the previous corresponding period are as follows:
Number of Fair value per Number of options granted Grant option at Exercise price Expiry options vested during 2010 date grant date per option date during 2010
Directors
T Fern – – – – – 500,000
Executives
R Keogh – – – – – 50,000
F Robertson – – – – – 56,250
F Steele 200,000 29/01/10 A$0.087 A$0.23 31/12/14 –
D Swords 200,000 29/01/10 A$0.087 A$0.23 31/12/14 20,000
P Gahdmar 200,000 29/01/10 A$0.087 A$0.23 31/12/14 8,333
No options have been granted or cancelled since the end of the fi nancial year through the date of this report.
Modifi cation of terms of equity-settled share-based payment transactions
No terms of equity-settled share-based payment transactions (including options granted as compensation to key
management personnel) have been altered or modifi ed by the issuing entity during the reporting period or the prior period.
Exercise of options granted as compensation
No shares were issued during the reporting period on the exercise of options previously granted as compensation
to key management personnel (previous corresponding period: Nil).
SHALE OIL:CATALYST FOR GROWTH
ANNUAL REPORT 2011 25
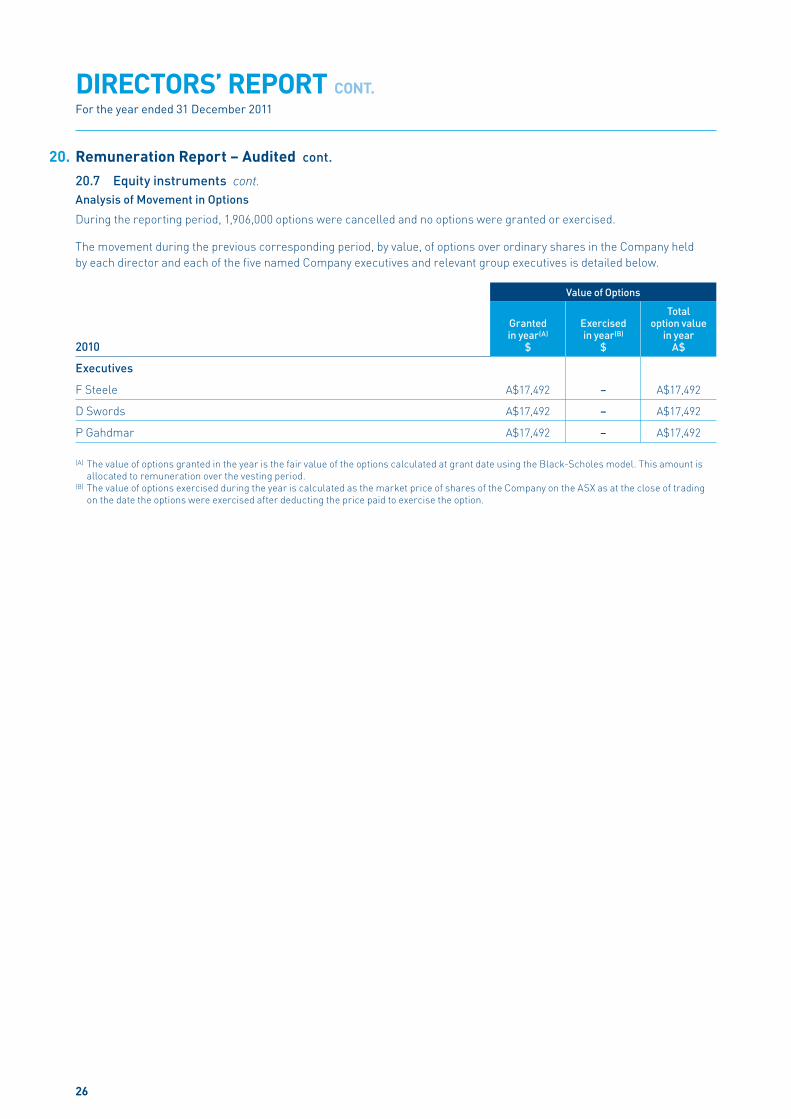
DIRECTORS’ REPORT CONT.
For the year ended 31 December 2011
20. Remuneration Report – Audited cont.
20.7 Equity instruments cont.
Analysis of Movement in Options
During the reporting period, 1,906,000 options were cancelled and no options were granted or exercised.
The movement during the previous corresponding period, by value, of options over ordinary shares in the Company held
by each director and each of the fi ve named Company executives and relevant group executives is detailed below.
Value of Options
Total Granted Exercised option value in year(A) in year(B) in year2010 $ $ A$
Executives
F Steele A$17,492 – A$17,492
D Swords A$17,492 – A$17,492
P Gahdmar A$17,492 – A$17,492
(A) The value of options granted in the year is the fair value of the options calculated at grant date using the Black-Scholes model. This amount is
allocated to remuneration over the vesting period.(B) The value of options exercised during the year is calculated as the market price of shares of the Company on the ASX as at the close of trading
on the date the options were exercised after deducting the price paid to exercise the option.
26

AUDITOR’S INDEPENDENCE DECLARATION
Lead Auditor’s Independence Declaration under Section 307C of the Corporations Act 2001
To: the directors of Petsec Energy Ltd
I declare that, to the best of my knowledge and belief, in relation to the audit for the fi nancial year ended 31 December 2011
there have been:
(i) no contraventions of the auditor independence requirements as set out in the Corporations Act 2001 in relation to the
audit; and
(ii) no contraventions of any applicable code of professional conduct in relation to the audit.
KPMG
David Sinclair
Partner
Sydney, 28 February 2012
SHALE OIL:CATALYST FOR GROWTH
ANNUAL REPORT 2011 27
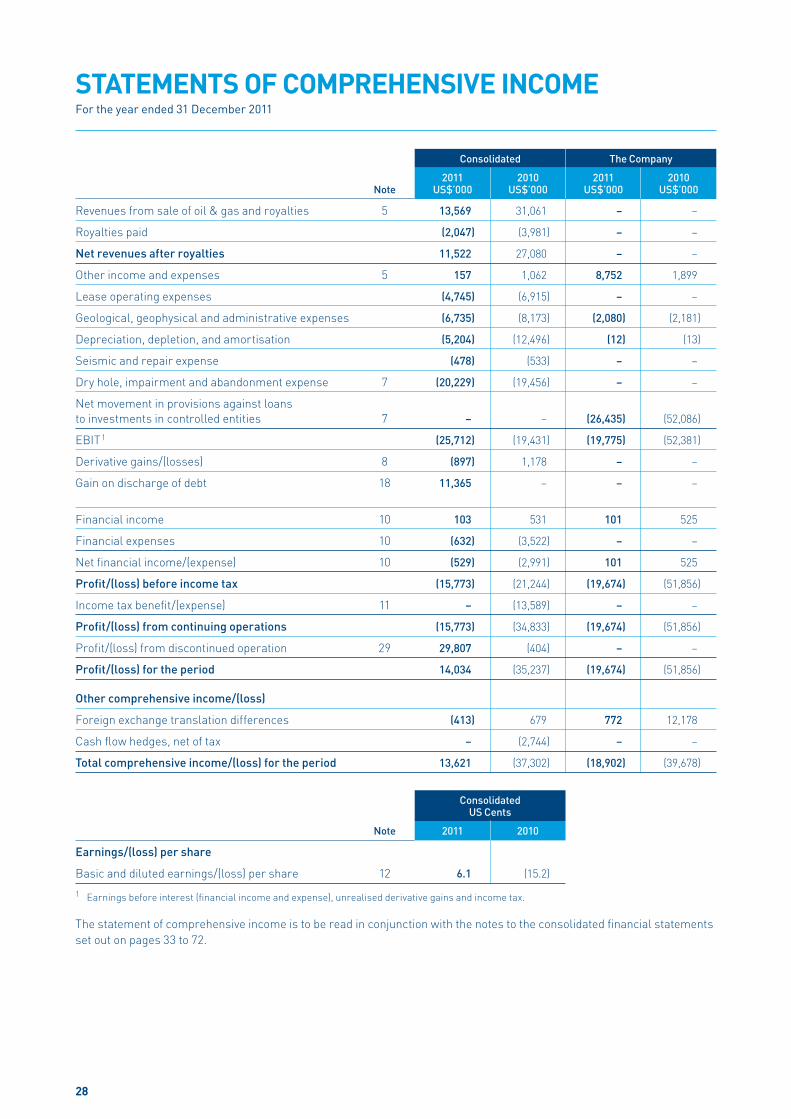
STATEMENTS OF COMPREHENSIVE INCOMEFor the year ended 31 December 2011
Consolidated The Company
2011 2010 2011 2010 Note US$’000 US$’000 US$’000 US$’000
Revenues from sale of oil & gas and royalties 5 13,569 31,061 – –
Royalties paid (2,047) (3,981) – –
Net revenues after royalties 11,522 27,080 – –
Other income and expenses 5 157 1,062 8,752 1,899
Lease operating expenses (4,745) (6,915) – –
Geological, geophysical and administrative expenses (6,735) (8,173) (2,080) (2,181)
Depreciation, depletion, and amortisation (5,204) (12,496) (12) (13)
Seismic and repair expense (478) (533) – –
Dry hole, impairment and abandonment expense 7 (20,229) (19,456) – –
Net movement in provisions against loans
to investments in controlled entities 7 – – (26,435) (52,086)
EBIT 1 (25,712) (19,431) (19,775) (52,381)
Derivative gains/(losses) 8 (897) 1,178 – –
Gain on discharge of debt 18 11,365 – – –
Financial income 10 103 531 101 525
Financial expenses 10 (632) (3,522) – –
Net fi nancial income/(expense) 10 (529) (2,991) 101 525
Profi t/(loss) before income tax (15,773) (21,244) (19,674) (51,856)
Income tax benefi t/(expense) 11 – (13,589) – –
Profi t/(loss) from continuing operations (15,773) (34,833) (19,674) (51,856)
Profi t/(loss) from discontinued operation 29 29,807 (404) – –
Profi t/(loss) for the period 14,034 (35,237) (19,674) (51,856)
Other comprehensive income/(loss)
Foreign exchange translation differences (413) 679 772 12,178
Cash fl ow hedges, net of tax – (2,744) – –
Total comprehensive income/(loss) for the period 13,621 (37,302) (18,902) (39,678)
Consolidated US Cents
Note 2011 2010
Earnings/(loss) per share
Basic and diluted earnings/(loss) per share 12 6.1 (15.2)
1 Earnings before interest (fi nancial income and expense), unrealised derivative gains and income tax.
The statement of comprehensive income is to be read in conjunction with the notes to the consolidated fi nancial statements
set out on pages 33 to 72.
28
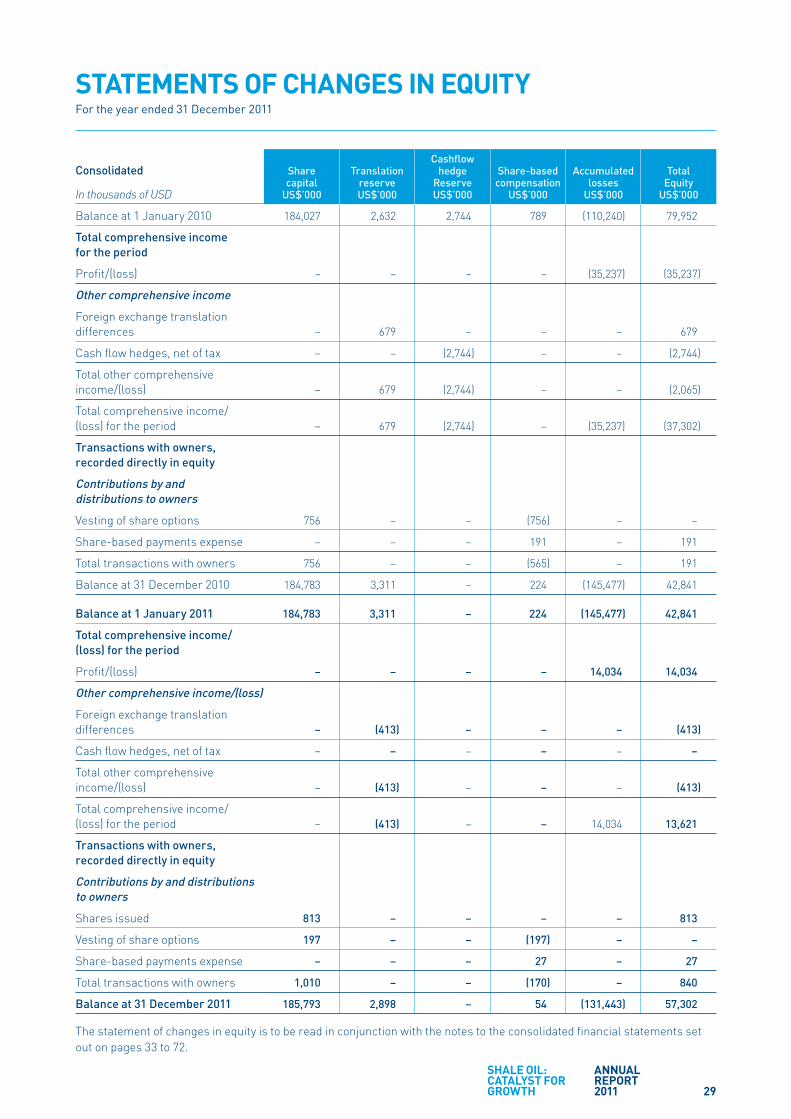
STATEMENTS OF CHANGES IN EQUITYFor the year ended 31 December 2011
Cashfl ow Consolidated Share Translation hedge Share-based Accumulated Total capital reserve Reserve compensation losses EquityIn thousands of USD US$’000 US$’000 US$’000 US$’000 US$’000 US$’000
Balance at 1 January 2010 184,027 2,632 2,744 789 (110,240) 79,952
Total comprehensive income
for the period
Profi t/(loss) – – – – (35,237) (35,237)
Other comprehensive income
Foreign exchange translation
differences – 679 – – – 679
Cash fl ow hedges, net of tax – – (2,744) – – (2,744)
Total other comprehensive
income/(loss) – 679 (2,744) – – (2,065)
Total comprehensive income/
(loss) for the period – 679 (2,744) – (35,237) (37,302)
Transactions with owners,
recorded directly in equity
Contributions by and
distributions to owners
Vesting of share options 756 – – (756) – –
Share-based payments expense – – – 191 – 191
Total transactions with owners 756 – – (565) – 191
Balance at 31 December 2010 184,783 3,311 – 224 (145,477) 42,841
Balance at 1 January 2011 184,783 3,311 – 224 (145,477) 42,841
Total comprehensive income/
(loss) for the period
Profi t/(loss) – – – – 14,034 14,034
Other comprehensive income/(loss)
Foreign exchange translation
differences – (413) – – – (413)
Cash fl ow hedges, net of tax – – – – – –
Total other comprehensive
income/(loss) – (413) – – – (413)
Total comprehensive income/
(loss) for the period – (413) – – 14,034 13,621
Transactions with owners,
recorded directly in equity
Contributions by and distributions
to owners
Shares issued 813 – – – – 813
Vesting of share options 197 – – (197) – –
Share-based payments expense – – – 27 – 27
Total transactions with owners 1,010 – – (170) – 840
Balance at 31 December 2011 185,793 2,898 – 54 (131,443) 57,302
The statement of changes in equity is to be read in conjunction with the notes to the consolidated fi nancial statements set
out on pages 33 to 72.
SHALE OIL:CATALYST FOR GROWTH
ANNUAL REPORT 2011 29

STATEMENTS OF CHANGES IN EQUITYFor the year ended 31 December 2011
Cashfl ow The Company Share Translation hedge Share-based Accumulated Total capital reserve Reserve compensation losses EquityIn thousands of USD US$’000 US$’000 US$’000 US$’000 US$’000 US$’000
Balance at 1 January 2010 184,027 24,317 – 789 (79,010) 130,123
Total comprehensive income
for the period
Profi t/(loss) – – – – (51,856) (51,856)
Other comprehensive income
Foreign exchange
translation differences – 12,178 – – – 12,178
Total other comprehensive
income/(loss) – 12,178 – – – 12,178
Total comprehensive income/(loss)
for the period – 12,178 – – (51,856) (39,678)
Transactions with owners,
recorded directly in equity
Contributions by and
distributions to owners
Vesting of share options 756 – – (756) – –
Share-based payments expense – – – 191 – 191
Total transactions with owners 756 – – (565) – 191
Balance at 31 December 2010 184,783 36,495 – 224 (130,866) 90,636
Balance at 1 January 2011 184,783 36,495 – 224 (130,866) 90,636
Total comprehensive income/(loss)
for the period
Profi t/(loss) – – – – (19,674) (19,674)
Other comprehensive income/(loss)
Foreign exchange
translation differences – 772 – – – 772
Total other comprehensive
income/(loss) – 772 – – – 772
Total comprehensive income/(loss)
for the period – 772 – – (19,674) (18,902)
Transactions with owners,
recorded directly in equity
Contributions by and
distributions to owners
Shares issued 813 – – – – 813
Vesting of share options 197 – – (197) – –
Share-based payments expense – – – 27 – 27
Total transactions with owners 1,010 – – (170) – 840
Balance at 31 December 2011 185,793 37,267 – 54 (150,540) 72,574
The statement of changes in equity is to be read in conjunction with the notes to the consolidated fi nancial statements set
out on pages 33 to 72.
30
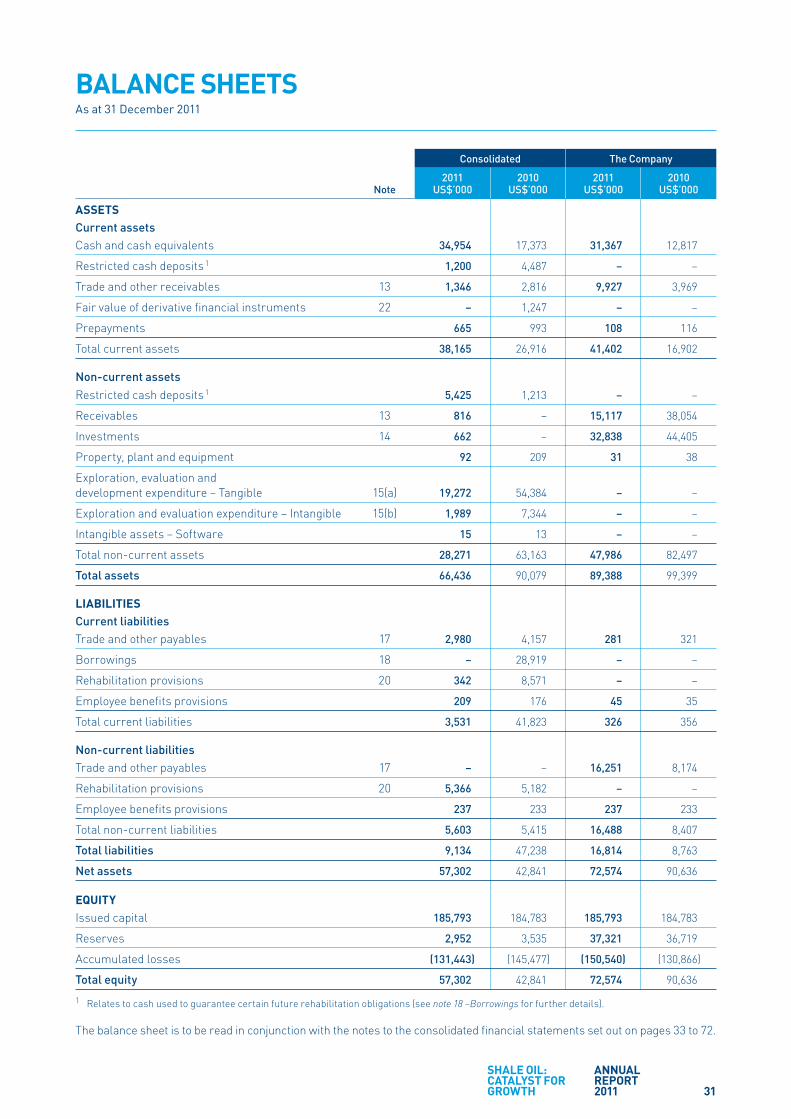
BALANCE SHEETSAs at 31 December 2011
Consolidated The Company
2011 2010 2011 2010 Note US$’000 US$’000 US$’000 US$’000
ASSETS
Current assets
Cash and cash equivalents 34,954 17,373 31,367 12,817
Restricted cash deposits 1 1,200 4,487 – –
Trade and other receivables 13 1,346 2,816 9,927 3,969
Fair value of derivative fi nancial instruments 22 – 1,247 – –
Prepayments 665 993 108 116
Total current assets 38,165 26,916 41,402 16,902
Non-current assets
Restricted cash deposits 1 5,425 1,213 – –
Receivables 13 816 – 15,117 38,054
Investments 14 662 – 32,838 44,405
Property, plant and equipment 92 209 31 38
Exploration, evaluation and
development expenditure – Tangible 15(a) 19,272 54,384 – –
Exploration and evaluation expenditure – Intangible 15(b) 1,989 7,344 – –
Intangible assets – Software 15 13 – –
Total non-current assets 28,271 63,163 47,986 82,497
Total assets 66,436 90,079 89,388 99,399
LIABILITIES
Current liabilities
Trade and other payables 17 2,980 4,157 281 321
Borrowings 18 – 28,919 – –
Rehabilitation provisions 20 342 8,571 – –
Employee benefi ts provisions 209 176 45 35
Total current liabilities 3,531 41,823 326 356
Non-current liabilities
Trade and other payables 17 – – 16,251 8,174
Rehabilitation provisions 20 5,366 5,182 – –
Employee benefi ts provisions 237 233 237 233
Total non-current liabilities 5,603 5,415 16,488 8,407
Total liabilities 9,134 47,238 16,814 8,763
Net assets 57,302 42,841 72,574 90,636
EQUITY
Issued capital 185,793 184,783 185,793 184,783
Reserves 2,952 3,535 37,321 36,719
Accumulated losses (131,443) (145,477) (150,540) (130,866)
Total equity 57,302 42,841 72,574 90,636
1 Relates to cash used to guarantee certain future rehabilitation obligations (see note 18 –Borrowings for further details).
The balance sheet is to be read in conjunction with the notes to the consolidated fi nancial statements set out on pages 33 to 72.
SHALE OIL:CATALYST FOR GROWTH
ANNUAL REPORT 2011 31

CONSOLIDATED STATEMENT OF CASHFLOWSFor the year ended 31 December 2011
Consolidated The Company
2011 2010 2011 2010 Note US$’000 US$’000 US$’000 US$’000
Cashfl ows from operating activities
Cash receipts from customers 16,708 33,163 – –
Cash payments for royalties (2,718) (3,958) – –
Cash payments to suppliers and employees (19,697) (20,091) (2,160) (2,232)
Interest received 103 531 101 525
Management fees received – related parties – – 4,707 978
Taxes refunded – 480 – –
Interest paid (66) (2,584) – –
Restricted deposits 1 (925) (5,700) – –
Net cash from operating activities 32 (6,595) 1,841 2,648 (729)
Cashfl ows from investing activities
Payments for property, plant and equipment (33) (124) (4) (10)
Payments for exploration, evaluation
and development expenditure (3,859) (11,815) – –
Loans from/(to) controlled entities – – 15,874 (5,954)
Proceeds from sale of investments 29 40,869 – – –
Proceeds from sale of assets – 12 – –
Net cash from investing activities 36,977 (11,927) 15,870 (5,964)
Cashfl ows from fi nancing activities
Debt facility repayments including transaction costs 18 (12,833) (225) – –
Net cash from fi nancing activities (12,833) (225) – –
Net increase/(decrease) in cash and cash equivalents 17,549 (10,311) 18,518 (6,693)
Cash and cash equivalents at 1 January 17,373 25,356 12,817 17,182
Effects of exchange rate changes on cash held 32 2,328 32 2,328
Cash and cash equivalents at 31 December 34,954 17,373 31,367 12,817
1 Relates to cash used to guarantee certain future rehabilitation obligations (see note 18 – Borrowings for further details).
The statement of cashfl ows is to be read in conjunction with the notes to the consolidated fi nancial statements set out
on pages 33 to 72.
32

NOTES TO THE CONSOLIDATEDFINANCIAL STATEMENTSFor the year ended 31 December 2011
1. Reporting entity
Petsec Energy Ltd (the “Company”) is a company domiciled in Australia. The registered offi ce of the Company is Level 13,
1 Alfred Street Sydney NSW 2000. The consolidated fi nancial statements of the Company as at and for the year ended
31 December 2011 comprise the Company and its subsidiaries (together referred to as the “consolidated entity”).
The fi nancial report is presented in United States dollars, which is the consolidated entity’s choice of presentation currency.
2. Basis of preparation
(a) Statement of compliance
The fi nancial report is a general purpose fi nancial report which has been prepared in accordance with Australian
Accounting Standards (“AASBs”) (including Australian Interpretations) adopted by the Australian Accounting Standards
Board (“AASB”) and the Corporations Act 2001. The consolidated fi nancial report of the consolidated entity and the fi nancial
report of the Company comply with International Financial Reporting Standards (“IFRSs”) and interpretations adopted
by the International Accounting Standards Board (IASB).
The Board of Directors approved the fi nancial statements on 28 February 2012.
(b) Basis of measurement
The consolidated fi nancial statements have been prepared on the historical cost basis except for the following:
• Derivative fi nancial instruments are measured at fair value;
The methods used to measure fair values are discussed further in note 4.
The consolidated entity is of a kind referred to in ASIC Class Order 98/100 dated 10 July 1998 (updated by CO 05/641 effective
28 July 2005 and CO 06/51 effective 31 January 2006) and in accordance with that Class Order, all fi nancial information
presented in US dollars has been rounded to the nearest thousand unless otherwise stated.
(c) Use of estimates and judgements
The preparation of fi nancial statements requires management to make judgements, estimates and assumptions that affect
the application of accounting policies and the reported amounts of assets, liabilities, income and expenses. Actual results
may differ from these estimates.
Estimates and underlying assumptions are reviewed on an ongoing basis. Revisions to accounting estimates are recognised
in the period in which the estimate is revised and in any future periods affected.
In particular, information about signifi cant areas of estimation uncertainty and critical judgements in applying accounting
policies that have the most signifi cant effect on the amount recognised in the fi nancial statements are described in
Note 3 (d) – Exploration, evaluation and development expenditure – Intangible and tangible, Note 3(m) Rehabilitation
provision and Note 3 (r) – Income tax.
The estimated recoverable amount of oil and gas assets is based on discounted cash fl ow projections which are based on
estimates and assumptions that are subject to change. Key assumptions include the ultimate prices realised on the sale
of oil and gas and the reserves ultimately recovered. A sustained deterioration in prices or reduction in reserves may result
in further future asset impairments.
(d) Going concern basis of preparation
The fi nancial statements of the consolidated entity have been prepared on the basis of a going concern. The going concern
basis of preparation assumes that an entity will realise its assets and discharge its liabilities in the normal course of business.
SHALE OIL:CATALYST FOR GROWTH
ANNUAL REPORT 2011 33

NOTES TO THE CONSOLIDATEDFINANCIAL STATEMENTS CONT.
For the year ended 31 December 2011
3. Signifi cant accounting policies cont.
(a) Basis of consolidation
(i) Subsidiaries
The accounting policies set out below have been applied consistently to all periods presented in these consolidated fi nancial
statements, and have been applied consistently by the Company and consolidated entity.
Subsidiaries are entities controlled by the Company. Control exists when the Company has the power to govern the fi nancial
and operating policies of an entity so as to obtain benefi ts from its activities. In assessing control, potential voting rights
that presently are exercisable or convertible are taken into account. The fi nancial statements of subsidiaries are included
in the consolidated fi nancial statements from the date that control commences until the date that control ceases.
The accounting policies of subsidiaries have been changed when necessary to align them with the policies adopted
by the consolidated entity.
In the Company’s fi nancial statements, investments in subsidiaries are carried at the lower of cost and recoverable amount.
(ii) Joint operating arrangements
Joint operating arrangements are those entities over whose activities the consolidated entity has joint control, established
by contractual agreement. The interest of the consolidated entity in unincorporated joint operating arrangements and jointly
operated assets are brought to account by recognising in its fi nancial statements the assets it controls, the liabilities and
the expenses it incurs and its share of income that it earns from the sale of goods or services by the joint operations.
(iii) Transactions eliminated on consolidation
Intra-group balances and any unrealised gains and losses or income and expenses arising from intra-group transactions,
are eliminated in preparing the consolidated fi nancial statements. Unrealised losses are eliminated in the same way
as unrealised gains, but only to the extent that there is no evidence of impairment.
(iv) Loss of control
Upon the loss of control, the consolidated entity derecognises the assets and liabilities of the subsidiary, any non-controlling
interests and the other components of equity related to the subsidiary. Any surplus or defi cit arising on the loss of control
is recognised in profi t or loss. If the consolidated entity retains any interest in the previous subsidiary, then such interest
is measured at fair value at the date that control is lost. Subsequently it is accounted for as an equity-accounted investee
or as an available-for-sale fi nancial asset depending on the level of infl uence retained.
(b) Foreign currency
(i) Functional and presentation currency
Items included in the fi nancial statements of each of the consolidated entity’s subsidiaries are measured using the currency
of the primary economic environment in which the subsidiary operates (“the functional currency”). The functional currency
of the Company and its Australian subsidiaries is Australian dollars (A$) and the functional currency of the Company’s
overseas subsidiaries is United States dollars (US$).
The fi nancial statements are presented in United States dollars. The consolidated entity believes the US dollar is the best
measure of performance for Petsec Energy Ltd because oil and gas, the consolidated entity’s dominant sources of revenue,
are priced in US dollars and the consolidated entity’s main operations are based in the USA with most of the costs incurred
in US dollars.
Prior to consolidation, the results and fi nancial position of each entity within the group are translated from the functional
currency into the group’s presentation currency as follows:
• Assets and liabilities are translated at the closing rate at the date of that balance sheet;
• Income and expenses are translated at average exchange rates (unless this is not a reasonable approximation of the
cumulative effect of the rates prevailing on the transaction dates, in which case income and expenses are translated
at the dates of the transactions);
• Components of equity are translated at the historical rates; and
• All resulting exchange differences are recognised as a separate component of equity.
34
3. Signifi cant accounting policies cont.
(b) Foreign currency cont.
(ii) Foreign currency transactions and balances
Foreign currency transactions are translated into the functional currency at the exchange rates prevailing at the date of
the transaction. Monetary assets and liabilities denominated in foreign currencies at the balance sheet date are translated
to the respective functional currency at the foreign exchange rate ruling at that date. Foreign exchange gains and losses
resulting from the settlement of such transactions and from the translation at year-end exchange rates of monetary assets
and liabilities denominated in foreign currencies are recognised in the statement of comprehensive income.
Non-monetary assets and liabilities that are measured in terms of historical cost in a foreign currency are translated using
the exchange rate at the date of the transaction.
Foreign exchange gains and losses arising from a monetary item receivable from or payable to a foreign operation, the
settlement of which is neither planned nor likely in the foreseeable future, are considered to form part of a net investment
in a foreign operation and are recognised directly in equity in the foreign currency translation reserve (“FCTR”).
(c) Derivative fi nancial instruments and hedging activities
The consolidated entity’s revenues are exposed to changes in commodity prices. From time to time, the consolidated entity
enters into derivative fi nancial instruments to manage a portion of its oil and gas sales price risks.
The consolidated entity’s interest expense is exposed to changes in short-term interest rates. From time to time,
the consolidated entity enters into derivative fi nancial instruments to manage a portion of its interest rate risks.
The consolidated entity does not hold derivative fi nancial instruments for speculative purposes.
Derivative fi nancial instruments are initially recognised at fair value on the date a derivative contract is entered into and
are subsequently remeasured to their fair value each reporting date. The method of recognising the resulting gain or loss
depends on whether the derivative is designated as a hedging instrument, and if so, the nature of the item being hedged.
The consolidated entity designates certain derivatives as hedges of highly probable forecast transactions (cash fl ow hedges).
The consolidated entity documents at the inception of the transaction the relationship between hedging instruments
and hedged items, as well as its risk management objective and strategy for undertaking various hedge transactions.
The consolidated entity also documents its assessment, both at hedge inception and on an ongoing basis, of whether the
derivatives that are used in hedging transactions have been and will continue to be highly effective in offsetting changes
in fair values or cash fl ows of hedged items.
(i) Cash fl ow hedge
Changes in the fair value of the derivative-hedging instrument designated as a cash fl ow hedge are recognised directly
in equity to the extent that the hedge is effective. To the extent that the hedge is ineffective, changes in fair value are
recognised in the statement of comprehensive income.
If the hedging instrument no longer meets the criteria for hedge accounting, expires or is sold, terminated or exercised,
then hedge accounting is discontinued prospectively. The cumulative gain or loss previously recognised in equity remains
there until the forecast transaction occurs. When the hedged item is a non-fi nancial asset, the amount recognised in equity
is transferred to the carrying amount of the asset when it is recognised. In other cases the amount recognised in equity
is transferred to the income statement in the same period that the hedged item affects profi t or loss.
(ii) Derivative fi nancial instruments that do not qualify for hedge accounting
Certain derivative fi nancial instruments do not qualify for hedge accounting. Changes in the fair value of any derivative
fi nancial instrument that does not qualify for hedge accounting are recognised immediately in the statement
of comprehensive income.
(iii) Other derivative fi nancial instruments
Other derivative fi nancial instruments are recognised initially at fair value; attributable transaction costs are recognised
in profi t or loss as incurred. Subsequent to initial recognition, derivatives are measured at fair value and changes therein
are recognised immediately in profi t or loss.
SHALE OIL:CATALYST FOR GROWTH
ANNUAL REPORT 2011 35

NOTES TO THE CONSOLIDATEDFINANCIAL STATEMENTS CONT.
For the year ended 31 December 2011
3. Signifi cant accounting policies cont.
(d) Exploration, evaluation and development expenditure – Intangible and tangible
Exploration, evaluation and development costs are accumulated in respect of each separate area of interest.
The consolidated entity’s capitalisation policy for its natural gas and crude oil exploration and development activities is to
capitalise costs of productive exploratory wells, development drilling and productive wells, and costs to acquire mineral
interests. Exploration costs, including personnel costs, certain geological and geophysical expenses including seismic
costs where exploration rights have not been obtained for oil and natural gas leases, are charged to expense as incurred.
Exploratory drilling costs are initially capitalised, but charged to expense if and when the well is determined not to have
found reserves in commercial quantities.
Exploration and evaluation expenditures relating to an area of interest are capitalised as intangible deferred costs where
exploration rights have been obtained. These intangible deferred costs are carried forward only to the extent that they are
expected to be recouped through successful development and exploitation, or sale of the area, or where exploration and
evaluation activities have not yet reached a stage which permits a reasonable assessment of the existence of economically
recoverable reserves, and active and signifi cant exploration operations are continuing. These intangible deferred costs are
not subject to amortisation. Once management has determined the existence of economically recoverable reserves for an
area of interest, deferred costs are reclassifi ed from intangible to tangible assets on the balance sheet. Tangible deferred
costs are amortised using a units-of-production method, as further discussed in note 3(e).
Development expenditures relating to an area of interest are capitalised as tangible deferred costs, and are carried forward
to the extent that they are expected to be recouped either through the sale or successful exploitation of the area of interest.
Exploration, evaluation and development assets are assessed for impairment when facts and circumstances suggest that
the carrying amount of the asset may exceed its recoverable amount. In the event that indicators of impairment are present,
an impairment loss is recorded based on the higher of an asset’s fair value less costs to sell and value in use (see note 3(h)).
When an area of interest is abandoned or the directors decide that it is not commercial, any accumulated costs in respect
of that area are written off in the fi nancial period the decision is made.
(e) Amortisation of exploration, evaluation and development expenditure
Exploration, evaluation and development expenditure in the production phase is amortised on a units-of-production method
based on the ratio of actual production to remaining proved and probable reserves (2P). Remaining 2P reserves are
measured at the lower of 2P reserves estimated by external independent petroleum engineers and internal estimates.
Amortisation is not charged on costs carried forward in respect of areas of interest in the development phase until
commercial production commences.
(f) Intangible assets – Software
Software acquired by the consolidated entity, which have fi nite useful lives, is measured at cost less accumulated amortisation.
(g) Property, plant and equipment
(i) Recognition and measurement
Items of property, plant and equipment are measured at cost less accumulated depreciation and impairment losses.
Cost includes expenditures that are directly attributable to the acquisition of the asset. The cost of self-constructed assets
includes the cost of materials and direct labour, any other costs directly attributable to bringing the asset to a working
condition for its intended use, and the costs of dismantling and removing the items and restoring the site on which they
are located. Purchased software that is integral to the functionality of the related equipment is capitalised as part of the
equipment. Borrowing costs related to the acquisition or construction of qualifying assets are recognised in profi t and loss
as incurred.
When parts of an item of property, plant and equipment have different useful lives, they are accounted for as separate items
(major components) of property, plant and equipment.
36
3. Signifi cant accounting policies cont.
(g) Property, plant and equipment cont.
(i) Recognition and measurement cont.
Gains and losses on disposal of an item of property, plant and equipment are determined by comparing the proceeds from
disposal with the carrying amount of property, plant and equipment and are recognised net within “other income” in profi t
and loss.
(ii) Leased assets
Leases in terms of which the consolidated entity assumes substantially all the risks and rewards of ownership
are classifi ed as fi nance leases. Lease payments are accounted for as described in accounting policy 3(o).
(iii) Subsequent costs
The cost of replacing part of an item of property, plant and equipment is recognised in the carrying amount of the item
if it is probable that the future economic benefi ts embodied within the part will fl ow to the consolidated entity and its costs
can be measured reliably. The costs of the day-to-day servicing of property, plant and equipment are recognised in the
income statement as incurred.
(iv) Depreciation and amortisation
Depreciation of property, plant and equipment is recognised in the statement of comprehensive income on a straight-line
basis over the estimated useful lives of each part of an item. Leased assets are depreciated over the shorter of the lease
term and their useful lives. Assets are depreciated or amortised from the date of acquisition or, in respect of internally
constructed assets, from the time an asset is completed and held ready for use.
Depreciation methods, useful lives and residual values are reassessed at the reporting date. When changes are made,
adjustments are refl ected prospectively in current and future periods only.
The estimated useful lives or the amortisation method used for each class of asset in the current and comparative periods
are as follows:
2011 2010
Property, plant and equipment
Furniture and fi ttings 5 – 8 years 5 – 8 years
Offi ce equipment 3 – 4 years 3 – 4 years
Leasehold improvements 5 – 7 years 5 – 7 years
(h) Impairment – Non-fi nancial assets
The carrying amounts of the consolidated entity’s and the Company’s non-fi nancial assets, other than deferred tax assets
(see note 3(r)), are reviewed at each reporting date to determine whether there is any indication of impairment. If any such
indication exists then the asset’s recoverable amount is estimated. For intangible assets that have indefi nite lives or that
are not yet available for use, recoverable amount is estimated at each reporting date.
An impairment loss is recognised if the carrying amount of an asset or its cash-generating unit exceeds its recoverable
amount. A cash-generating unit is the smallest identifi able asset group that generates cash fl ows that largely are
independent from other assets or groups. Impairment losses are recognised in the income statement. Impairment losses
recognised in respect of cash-generating units are allocated fi rst to reduce the carrying amount of any goodwill allocated
to the units and then to reduce the carrying amount of the other assets in the unit (group of units) on a pro rata basis.
The recoverable amount of an asset or cash-generating unit is the greater of its value in use and its fair value less costs
to sell. In assessing value in use, the estimated future cash fl ows are discounted to their present value using a pre-tax
discount rate that refl ects current market assessment of the time value of money and the risks specifi c to the asset.
The measurement of recoverable amount for the consolidated entity’s exploration, evaluation and development expenditure
requires signifi cant estimation and judgement. Note 15 provides further details of the key assumptions adopted by the
consolidated entity in measuring the recoverable amount of exploration, evaluation and development expenditure.
SHALE OIL:CATALYST FOR GROWTH
ANNUAL REPORT 2011 37
NOTES TO THE CONSOLIDATEDFINANCIAL STATEMENTS CONT.
For the year ended 31 December 2011
3. Signifi cant accounting policies cont.
(h) Impairment – Non-fi nancial assets cont.
Impairment losses recognised in prior periods are assessed at each reporting date for any indications that the loss
has decreased or no longer exists. An impairment loss is reversed if there has been a change in the estimates used to
determine the recoverable amount. An impairment loss is reversed only to the extent that the asset’s carrying amount
does not exceed the carrying amount that would have been determined, net of depreciation or amortisation, if no
impairment loss had been recognised.
(i) Trade and other receivables
Trade receivables, which generally have 30-60 day terms, are recognised and carried at original invoice amount less
an allowance for any uncollectible amounts.
An estimate for doubtful debts is made when collection of the full amount is no longer probable. Bad debts are written
off when identifi ed.
(j) Cash and cash equivalents
Cash and cash equivalents in the balance sheet comprise cash at bank and on hand and short-term deposits with
an original maturity of three months or less.
For the purposes of the Statement of Cash Flows, cash and cash equivalents consist of cash and cash equivalents
as defi ned above, net of outstanding bank overdrafts.
(k) Interest-bearing loans and borrowings
All loans and borrowings are initially recognised at cost, being the fair value of the consideration received net of debt issue
costs associated with the borrowing.
After initial recognition, interest-bearing loans and borrowings are subsequently measured at amortised cost using the
effective interest method. Amortised cost is calculated by taking into account any issue costs, and any discount or premium
on settlement.
(l) Borrowing costs
Borrowing costs comprise interest payable on borrowings calculated using the effective interest rate method, lease fi nance
charges and amortisation of discounts or premiums relating to borrowings. Borrowing costs are expensed as incurred
unless they relate to qualifying assets.
(m) Provisions
A provision is recognised if, as a result of a past event, the consolidated entity has a present legal or constructive obligation
that can be estimated reliably, and it is probable that an outfl ow of economic benefi ts will be required to settle the
obligation. Provisions are determined by discounting the expected future cash fl ows at a pre-tax rate that refl ects current
market assessments of the time value of money and the risks specifi c to the liability.
Where discounting is used, the increase in the provision due to the passage of time is recognised as a fi nance cost.
Rehabilitation
The consolidated entity recognises a provision for the legal obligation associated with the retirement of long-lived
assets that results from the acquisition, construction, development, and (or) the normal operation of oil and natural
gas properties. The initial recognition of a liability for rehabilitation, which is discounted using a credit-adjusted risk-free
interest rate, increases the carrying amount of the related long-lived asset by the same amount as the liability. In periods
subsequent to initial measurement, period-to-period changes in the liability are recognised for the passage of time
(unwinding of discount) as fi nancial expense. Additionally, the capitalised asset retirement cost is subsequently allocated
to expense on a units-of-production basis over its estimated useful life.
Changes in the estimate of the liability arising from revised timing or estimated cost-to-complete the rehabilitation
are recognised with a corresponding adjustment to the relevant long-lived asset.
38

3. Signifi cant accounting policies cont.
(m) Provisions cont.
Rehabilitation cont.
The rehabilitation provision requires signifi cant estimation and judgement. These estimates include:
• Expected method of remediation;
• Forecast costs-to-complete the future remediation; and
• Anticipated timing of the remediation work.
The consolidated entity monitors the estimates and judgements involved in measuring this provision. Changes in estimated
rehabilitation provisions are accounted for on a prospective basis and affect provisions.
(n) Employee benefi ts and director benefi ts
(i) Short-term employee benefi ts
Liabilities for employee benefi ts for wages, salaries, annual leave and sick leave represent present obligations resulting
from employees’ services provided to reporting date and are calculated at undiscounted amounts based on remuneration
wage and salary rates that the consolidated entity expects to pay as at reporting date including related on-costs, such
as workers’ compensation insurance and payroll tax.
(ii) Long-term employee benefi ts
The provision for employee benefi ts for long service leave represents the present value of the estimated future cash
outfl ows to be made resulting from employees’ services provided to reporting date.
The provision is calculated using expected future increases in wage and salary rates including related on-costs and
expected settlement dates based on turnover history and is discounted using the rates attaching to national government
bonds at reporting date which most closely match the terms of maturity of the related liabilities.
(iii) Defi ned contribution pension plans
The Company and other controlled entities contribute to several defi ned contribution pension plans. Obligations for
contributions to defi ned contribution pension plans are recognised as an expense in the statement of comprehensive
income when they are due.
(iv) Employee incentive plans
Under the employee incentive plan, a liability may be recognised for bonuses for eligible employees based on the
consolidated entity’s performance for the year based on a number of pre-determined performance criteria.
(v) Share-based compensation transactions
Share-based compensation benefi ts are provided to employees of the consolidated entity, including directors, via the
Company’s Employee Option Plan and Employee Share Plan.
The grant date fair value of options granted to employees is recognised as an employee expense, with a corresponding
increase in equity, over the period in which the employees become unconditionally entitled to the options.
(o) Leases
Leases in terms of which the consolidated entity assumes substantially all the risks and rewards of ownership are classifi ed
as fi nance leases. Upon initial recognition the leased asset is measured at an amount equal to the lower of its fair value
and the present value of the minimum lease payments. Subsequent to initial recognition, the asset is accounted for in
accordance with the accounting policy applicable to that asset.
Lease payments are apportioned between the fi nance charges and reduction of the lease liability so as to achieve a
constant rate of interest on the remaining balance of the liability. Finance charges are charged directly against income.
Leases where the lessor retains substantially all the risks and benefi ts of ownership of the asset are classifi ed as operating
leases. Operating lease payments are recognised as an expense in the statement of comprehensive income on a straight-
line basis over the lease term. Lease incentives received are recognised as an integral part of the total lease expense, over
the term of the lease.
SHALE OIL:CATALYST FOR GROWTH
ANNUAL REPORT 2011 39
NOTES TO THE CONSOLIDATEDFINANCIAL STATEMENTS CONT.
For the year ended 31 December 2011
3. Signifi cant accounting policies cont.
(p) Revenue and other income recognition
Revenue is recognised to the extent that it is probable that the economic benefi ts will fl ow to the consolidated entity
and the revenue can be reliably measured. The following specifi c recognition criteria must also be met before revenue
is recognised:
Sale of oil and gas
Revenues are recognised when the product is in the form in which it is to be delivered and an actual physical quantity has
been provided or allocated to a purchaser pursuant to a contract. Revenue from oil and gas sales is measured at the fair
value of the consideration receivable.
Revenue from oil and gas royalties is recognised on an accrual basis in accordance with the terms of underlying royalty
agreements. Revenue from oil and gas royalties is measured at the fair value of the consideration receivable.
Sale of non-current assets
Gains or losses on sale of non-current assets are recognised as other income at the date control of the asset passes
to the buyer, usually when an unconditional contract of sale is signed.
Dividend income
Dividend income is recognised by the Company when controlled subsidiaries declare dividends.
Interest income
Interest income is recognised as the interest accrues (using the effective interest method, which is the rate that discounts
estimated future cash receipts through the expected life of the fi nancial instrument).
(q) Earnings per share
The consolidated entity presents basic and diluted earnings per share (EPS) data for its ordinary shares. Basic EPS is
calculated by dividing the profi t or loss attributable to ordinary shareholders of the Company by the weighted average
number of ordinary shares outstanding during the period. Diluted EPS is determined by adjusting the profi t or loss
attributable to ordinary shareholders and the weighted average number of ordinary shares outstanding for the effects
of all dilutive potential ordinary shares, which comprise share options granted to employees.
(r) Income tax
Income tax expense comprises current and deferred tax. Income tax expense is recognised in the statement
of comprehensive income except to the extent that it relates to items recognised directly in equity, in which case
it is recognised in equity.
Current tax is the expected tax payable on the taxable income for the year, using tax rates enacted or substantively enacted
at the reporting date, and any adjustment to tax payable in respect of previous years.
Deferred tax is recognised using the balance sheet method, providing for temporary differences between the carrying
amounts of assets and liabilities for fi nancial reporting purposes and the amounts used for taxation purposes. Deferred
tax is not recognised for the following temporary differences: the initial recognition of assets or liabilities that affect neither
accounting nor taxable profi t nor differences relating to investments in subsidiaries to the extent that they will probably not
reverse in the foreseeable future. Deferred tax is measured at the tax rates that are expected to be applied to the temporary
differences when they reverse, based on the laws that have been enacted or substantively enacted by the reporting date.
A deferred tax asset is recognised to the extent that it is probable that future taxable profi ts will be available against which
the temporary difference or tax losses can be utilised. Deferred tax assets are reviewed at each reporting date and are
reduced to the extent that it is no longer probable that the related tax benefi t will be realised.
40
3. Signifi cant accounting policies cont.
(r) Income tax cont.
Tax consolidation
The Company and its wholly owned Australian resident entities have formed a tax-consolidated group with effect from
1 July 2002 and are therefore taxed as a single entity from that date. The head entity within the tax-consolidated group
is Petsec Energy Ltd.
Current tax expense/income, deferred tax liabilities and deferred tax assets arising from temporary differences of the
members of the tax-consolidated group are recognised in the separate fi nancial statements of the members of the tax-
consolidated group using the ‘separate taxpayer within group’ approach by reference to the carrying amount of assets
and liabilities in the separate fi nancial statements of each entity and the tax values applying under tax consolidation.
Any current tax liabilities (or assets) and deferred tax assets arising from unused Australian tax losses of the subsidiaries
are assumed by the head entity in the tax-consolidated group and are recognised by the Company as amounts payable
(receivable) to/(from) other entities in the tax-consolidated group in conjunction with any tax funding arrangement amounts
(refer below). Any difference between these amounts is recognised by the Company as an equity contribution or distribution.
The Company recognises deferred tax assets arising from unused tax losses of the tax-consolidated group to the extent that
it is probable that future taxable profi ts of the tax-consolidated group will be available against which the asset can be utilised.
Any subsequent period adjustments to deferred tax assets arising from unused tax losses as a result of revised
assessments of the probability of recoverability are recognised by the head entity only.
Nature of tax funding arrangements and tax sharing arrangements
The head entity, in conjunction with other members of the Australian tax-consolidated group, has entered into a tax funding
arrangement, which sets out the funding obligations of members of the tax-consolidated group in respect of tax amounts.
The tax funding arrangements require payments to/from the head entity equal to the current tax liability/(asset) assumed
by the head entity and any tax-loss deferred tax asset assumed by the head entity, resulting in the head entity recognising
an inter-entity receivable/(payable) equal in amount to the tax liability/(asset) assumed. The inter-entity receivable/
(payable) is at call.
The head entity in conjunction with other members of the Australian tax-consolidated group has also entered into a tax
sharing agreement. The tax sharing agreement provides for the determination of the allocation of income tax liabilities
between the entities should the head entity default on its tax payment obligations. No amounts have been recognised
in the fi nancial statements in respect of this agreement, as payment of any amounts under the tax sharing agreement
is considered remote.
(s) Goods and services tax
Revenues, expenses and assets are recognised net of the amount of goods and services tax (GST), except where the amount
of GST incurred is not recoverable from the taxation authority. In these circumstances, the GST is recognised as part of the
cost of acquisition of the asset or as part of the expense.
Receivables and payables are stated with the amount of GST included. The net amount of GST recoverable from, or payable
to, the taxation authority is included as a current asset or liability in the balance sheet.
Cash fl ows are included in the Statement of Cash Flows on a gross basis. The GST components of cash fl ows arising from
investing and fi nancing activities, which are recoverable from or payable to the taxation authority, are classifi ed as
operating cash fl ows.
(t) Segment reporting
An operating segment is a distinguishable component of the consolidated entity whose information is reviewed regularly
by the CEO, the Group’s chief decision making offi cer who is engaged in providing related products or services which are
subject to risk and rewards that are different to other segments.
SHALE OIL:CATALYST FOR GROWTH
ANNUAL REPORT 2011 41
NOTES TO THE CONSOLIDATEDFINANCIAL STATEMENTS CONT.
For the year ended 31 December 2011
3. Signifi cant accounting policies cont.
(u) New standards and interpretations not yet adopted
A number of new standards, amendments to standards and interpretations are effective for annual periods beginning after
1 January 2011, and have not been applied in preparing these consolidated fi nancial statements. None of these is expected
to have a signifi cant effect on the consolidated fi nancial statements of the consolidated entity.
4. Determination of fair values
A number of the consolidated entity’s accounting policies and disclosures require the determination of fair value, for both
fi nancial and non-fi nancial assets and liabilities. Fair values have been determined for measurement and/or disclosure
purposes based on the following methods. Where applicable, further information about the assumptions made in
determining fair values is disclosed in the notes specifi c to that asset or liability.
Commodity derivatives
The fair value of commodity derivative hedging instruments are based on the relationship between the agreed contracted
fi xed and fl oor prices and quoted market prices at period end.
Equity securities
The fair value of equity securities is determined using the Black-Scholes formula. Measurement inputs include the share
price on the measurement date, the exercise price of the instrument, expected volatility, expected term of the instruments,
expected dividends, and the risk-free interest rate (based on government bonds).
5. Revenue and other income and expenses
Consolidated The Company
2011 2010 2011 2010 US$’000 US$’000 US$’000 US$’000
Revenue
Revenues from sale of oil and gas 13,569 24,311 – –
Derivative hedging gains/(losses) – 6,750 – –
13,569 31,061 – –
Other income and expenses
Drilling, production and prospect overhead income 185 699 – –
Management fee income – – 4,758 857
Dividend income – – 2,686 2,787
Net foreign exchange gains (losses) (33) 368 1,308 (1,741)
Net profi t/(loss) on disposal of property, plant and equipment 5 (5) – (4)
157 1,062 8,752 1,899
42
6. Personnel expenses
Consolidated The Company
2011 2010 2011 2010 US$’000 US$’000 US$’000 US$’000
Wages and salaries 2,792 2,536 295 232
Service agreements for executives 830 824 830 824
Contract labour 247 670 – –
Superannuation & 401(k) plans 111 121 29 23
Share-based payment compensation 28 173 24 76
Other employee-related expenses 10 9 10 9
4,018 4,333 1,188 1,164
7. Profi t/(loss) for the period
Profi t/(loss) for the period includes the following items that are signifi cant because of their nature, size or incidence:
Consolidated The Company
2011 2010 2011 2010 US$’000 US$’000 US$’000 US$’000
Expenses
Dry hole, impairment and abandonment expense (20,229) (19,456) – –
Net movements in provisions against loans
to and investments in controlled entities – – (26,435) (52,086)
Dry hole, impairment and abandonment expense
The estimated recoverable amount of all oil and gas assets is based on discounted cash fl ow projections that are based
on a range of estimates and assumptions that are subject to change. Key assumptions include the ultimate prices realised
on the sale of oil and gas and the reserves ultimately recovered. A sustained deterioration in prices or reduction in reserves
may result in further future asset impairments.
For the year ended 31 December 2011, the consolidated entity recognised total impairment and abandonment expense of
US$20,229,000 primarily due to the effect of low gas prices at year end in combination with downward reserve adjustments
on certain fi elds.
In 2010, the consolidated entity recognised total dry hole, impairment and abandonment expense of US$19,456,000
comprising US$2,873,000 of dry hole costs mainly in relation to the Main Pass Block 20 #4 exploration well; US$16,462,000
of net impairment provisions against certain oil & gas properties; and US$115,000 increase in the Company’s rehabilitation
provision due to the reassessment of future plug and abandonment cost estimates.
Net movement in provisions against loans to and investments in controlled entities
During the year ended 31 December 2011, the Company recognised a further provision of US$26,435,000 against the
carrying amount of its investment in controlled entities (2010: US$52,086,000). This additional provision refl ects the
cumulative effect of reserve revisions and the impact of lower commodity prices on estimates of recoverable amounts
of oil and gas properties. Refer to Note 15 for further discussion of the factors that infl uence the estimation uncertainty
associated with the underlying oil and gas properties.
SHALE OIL:CATALYST FOR GROWTH
ANNUAL REPORT 2011 43
NOTES TO THE CONSOLIDATEDFINANCIAL STATEMENTS CONT.
For the year ended 31 December 2011
8. Derivative gains/(losses)
The consolidated entity had entered into natural gas collar derivative contracts to hedge the price risk associated with
selling a portion of its 2011 gas production. Whilst these instruments represent an economic hedge, the consolidated
entity does not use hedge accounting. Accordingly all changes in the fair value of these contracts are recognised in profi t
or loss immediately in the period incurred.
Whilst changes in fair value are recognised over the life of the natural gas collars, for internal reporting, management
monitors the price realised for production during the period. The price realised on production represents the aggregation
of the spot selling price, net of royalties, plus the impact of the gain that is realised on the settlement of the instrument.
The proceeds realised upon settlement of the collar hedge contracts were $1,433,000 for the year ended 31 December 2011
(2010: nil).
The consolidated entity acquired 15 million options as part consideration for the sale of Petsec Petroleum LLC – refer
to note 29 Discontinued Operations for further details. The options are measured at fair value and changes therein are
recognised immediately in profi t or loss.
The following table presents details of the change in fair value recognised in the current and comparative period:
Consolidated The Company
2011 2010 2011 2010 US$’000 US$’000 US$’000 US$’000
Change in fair value of collar hedge contracts 186 1,178 – –
Change in fair value of options held in unrelated entities (1,083) – – –
(897) 1,178 – –
9. Auditor’s remuneration
Consolidated The Company
2011 2010 2011 2010 US$ US$ US$ US$
Audit services:
Auditors of the Company
KPMG Australia
Audit and review of fi nancial reports 86,000 105,000 86,000 105,000
Overseas KPMG Firms
Audit and review of fi nancial reports 25,000 20,000 – 20,000
Other services:
Auditors of the Company
KPMG Australia
Corporate, tax and compliance services 10,200 – 10,200 –
Overseas KPMG Firms
Audit and review of fi nancial reports – 15,800 – –
121,200 140,800 96,200 125,000
44

10. Finance income and expense
Consolidated The Company
2011 2010 2011 2010 US$’000 US$’000 US$’000 US$’000
Interest income – Other parties 103 531 101 525
Financial income 103 531 101 525
Interest expense (66) (2,583) – –
Unwinding of discount (566) (939) – –
Financial expense (632) (3,522) – –
Net fi nancial income (529) (2,991) 101 525
11. Income tax expense
Recognised in the statement of comprehensive income
Consolidated The Company
2011 2010 2011 2010 US$’000 US$’000 US$’000 US$’000
Deferred tax expense
Origination and reversal of temporary differences – 13,589 – –
Total income tax benefi t/(expense) in the
statement of comprehensive income – 13,589 – –
Consolidated The Company
2011 2010 2011 2010 US$’000 US$’000 US$’000 US$’000
Numerical reconciliation between tax expense
and pre-tax net profi t/(loss)
Profi t/(loss) before tax 14,034 (21,648) (19,674) (51,856)
Income tax expense/(benefi t) using the Australian corporation
tax rate of 30% (2010: 30%) 4,210 (6,494) (5,902) (15,557)
Increase/(decrease) in income tax expense due to:
Non-assessable income – – (1,576) (911)
Non-deductible expenses 379 216 7,944 15,652
U.S. income taxes assessed at different rate (671) (1,043) – –
Australian tax losses utilised – – – –
Deferred tax movements not brought to account in current year (3,809) 8,798 (466) 816
Provisions against deferred tax assets recognised in prior years – 12,513 – –
Under/(over) provided in prior years (109) (401) – –
Income tax expense/(benefi t) on pre-tax net profi t/(loss) – 13,589 – –
In the previous corresponding period, the consolidated entity’s tax expense included a provision of US$12,513,000 to reduce
the overall carrying value of the recognised deferred tax asset to nil. This provision refl ected the impact of revised estimates
of probable future US taxable income made by management at that time. Refer to Note 15 for further discussion of the factors
that infl uence the estimation uncertainty associated with the recoverability of oil and gas properties, and consequently the
probability of generation of US taxable income in future periods.
SHALE OIL:CATALYST FOR GROWTH
ANNUAL REPORT 2011 45
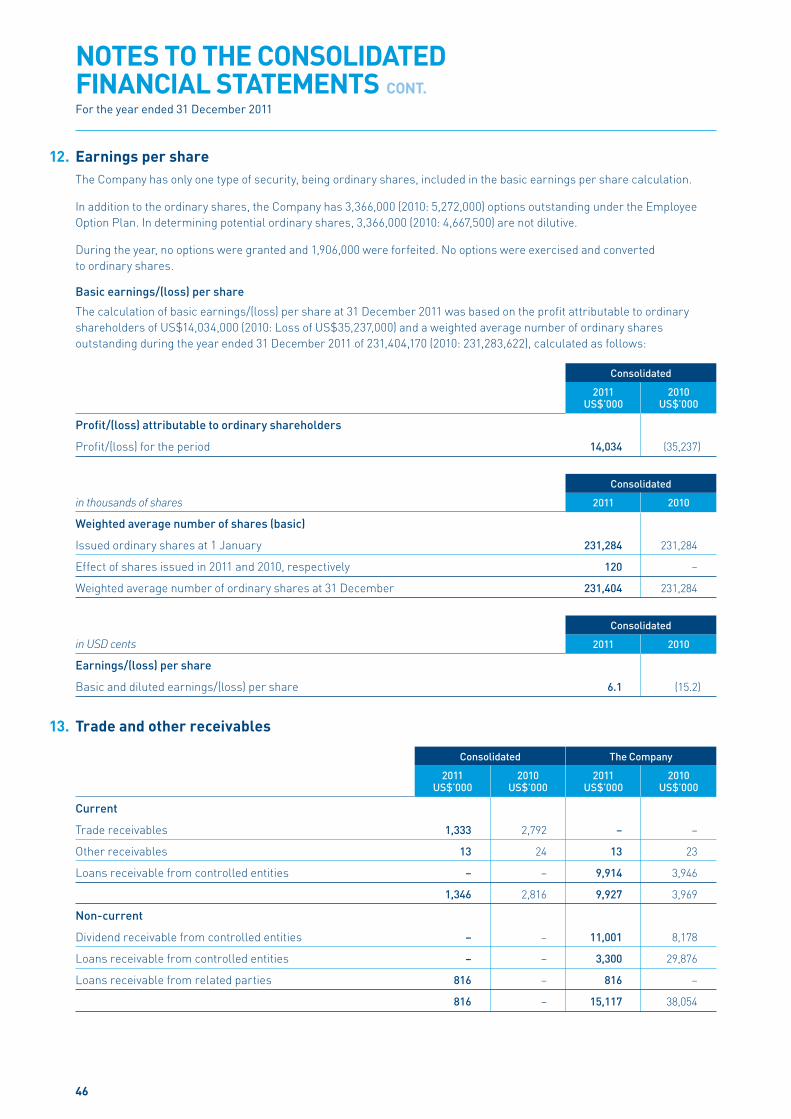
NOTES TO THE CONSOLIDATEDFINANCIAL STATEMENTS CONT.
For the year ended 31 December 2011
12. Earnings per share
The Company has only one type of security, being ordinary shares, included in the basic earnings per share calculation.
In addition to the ordinary shares, the Company has 3,366,000 (2010: 5,272,000) options outstanding under the Employee
Option Plan. In determining potential ordinary shares, 3,366,000 (2010: 4,667,500) are not dilutive.
During the year, no options were granted and 1,906,000 were forfeited. No options were exercised and converted
to ordinary shares.
Basic earnings/(loss) per share
The calculation of basic earnings/(loss) per share at 31 December 2011 was based on the profi t attributable to ordinary
shareholders of US$14,034,000 (2010: Loss of US$35,237,000) and a weighted average number of ordinary shares
outstanding during the year ended 31 December 2011 of 231,404,170 (2010: 231,283,622), calculated as follows:
Consolidated
2011 2010 US$’000 US$’000
Profi t/(loss) attributable to ordinary shareholders
Profi t/(loss) for the period 14,034 (35,237)
Consolidated
in thousands of shares 2011 2010
Weighted average number of shares (basic)
Issued ordinary shares at 1 January 231,284 231,284
Effect of shares issued in 2011 and 2010, respectively 120 –
Weighted average number of ordinary shares at 31 December 231,404 231,284
Consolidated
in USD cents 2011 2010
Earnings/(loss) per share
Basic and diluted earnings/(loss) per share 6.1 (15.2)
13. Trade and other receivables
Consolidated The Company
2011 2010 2011 2010 US$’000 US$’000 US$’000 US$’000
Current
Trade receivables 1,333 2,792 – –
Other receivables 13 24 13 23
Loans receivable from controlled entities – – 9,914 3,946
1,346 2,816 9,927 3,969
Non-current
Dividend receivable from controlled entities – – 11,001 8,178
Loans receivable from controlled entities – – 3,300 29,876
Loans receivable from related parties 816 – 816 –
816 – 15,117 38,054
46
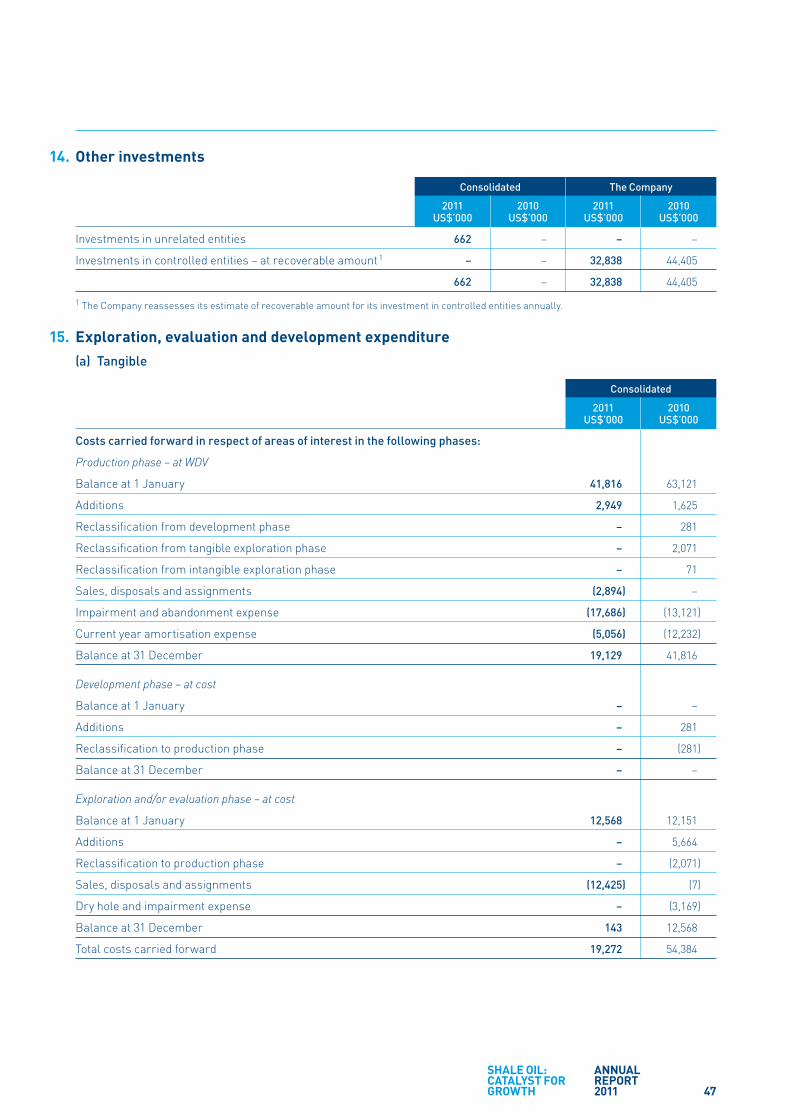
14. Other investments
Consolidated The Company
2011 2010 2011 2010 US$’000 US$’000 US$’000 US$’000
Investments in unrelated entities 662 – – –
Investments in controlled entities – at recoverable amount 1 – – 32,838 44,405
662 – 32,838 44,405
1 The Company reassesses its estimate of recoverable amount for its investment in controlled entities annually.
15. Exploration, evaluation and development expenditure
(a) Tangible
Consolidated
2011 2010 US$’000 US$’000
Costs carried forward in respect of areas of interest in the following phases:
Production phase – at WDV
Balance at 1 January 41,816 63,121
Additions 2,949 1,625
Reclassifi cation from development phase – 281
Reclassifi cation from tangible exploration phase – 2,071
Reclassifi cation from intangible exploration phase – 71
Sales, disposals and assignments (2,894) –
Impairment and abandonment expense (17,686) (13,121)
Current year amortisation expense (5,056) (12,232)
Balance at 31 December 19,129 41,816
Development phase – at cost
Balance at 1 January – –
Additions – 281
Reclassifi cation to production phase – (281)
Balance at 31 December – –
Exploration and/or evaluation phase – at cost
Balance at 1 January 12,568 12,151
Additions – 5,664
Reclassifi cation to production phase – (2,071)
Sales, disposals and assignments (12,425) (7)
Dry hole and impairment expense – (3,169)
Balance at 31 December 143 12,568
Total costs carried forward 19,272 54,384
SHALE OIL:CATALYST FOR GROWTH
ANNUAL REPORT 2011 47

NOTES TO THE CONSOLIDATEDFINANCIAL STATEMENTS CONT.
For the year ended 31 December 2011
15. Exploration, evaluation and development expenditure cont.
(b) Intangible
Consolidated
2011 2010 US$’000 US$’000
Costs carried forward in respect of areas of interest in the following phase:
Exploration and/or evaluation phase – at cost
Balance at 1 January 7,344 6,917
Additions 556 3,420
Disposals, assignments and lease relinquishments (3,097) (314)
Reclassifi cation to tangible production phase – (71)
Impairment expense (2,814) (2,608)
Balance at 31 December 1,989 7,344
Recoverable amount
The ultimate recoupment of costs carried forward for exploration and evaluation phases is dependent on the successful
development and commercial exploitation or sale of the respective areas.
The estimated recoverable amount of all cash generating units in the development and production phases is determined
by discounting the estimated future cash fl ows to their present value using a pre-tax discount rate that refl ects current
market assessments of the time value of money and the risks specifi c to the assets. The consolidated entity utilises
discounted future cash fl ows as estimated by independent petroleum engineers for this assessment. The key assumptions
used include:
• Estimated proved and probable reserves (2P reserves);
• For wells now in production – initial production rates based on current producing rates for those wells;
• For wells not currently in production – initial production rates based on test data and other related information;
• Estimated rates of production decline based on current trends;
• Hydrocarbon prices that the consolidated entity estimates to be reasonable taking into account historical prices, current
prices, and prices used in making its exploration and development decisions;
• Operating costs directly applicable to the leases or wells;
• Development costs based on authorisations for expenditure for the proposed work or actual costs for similar projects;
• Pre-tax discount rate of 10%.
Risk of future impairments
The determination of the estimated recoverable amount of Petsec’s producing oil and gas properties is highly sensitive
to a change in estimated recoverable reserves and oil and gas prices.
As a result of historical impairments, certain properties are carried at recoverable amounts. Consequently any
reduction in recoverable reserves or a reduction in the oil or gas price may trigger the need for further impairment
on these specifi c properties.
48
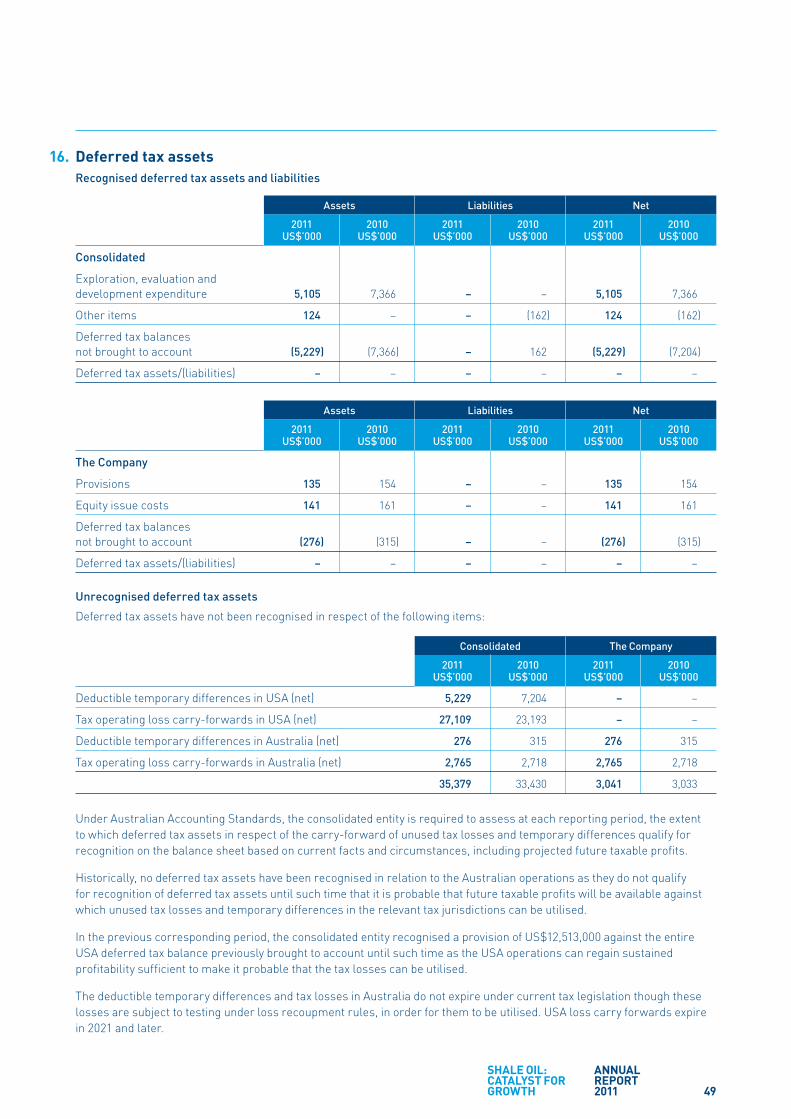
16. Deferred tax assets
Recognised deferred tax assets and liabilities
Assets Liabilities Net
2011 2010 2011 2010 2011 2010 US$’000 US$’000 US$’000 US$’000 US$’000 US$’000
Consolidated
Exploration, evaluation and
development expenditure 5,105 7,366 – – 5,105 7,366
Other items 124 – – (162) 124 (162)
Deferred tax balances
not brought to account (5,229) (7,366) – 162 (5,229) (7,204)
Deferred tax assets/(liabilities) – – – – – –
Assets Liabilities Net
2011 2010 2011 2010 2011 2010 US$’000 US$’000 US$’000 US$’000 US$’000 US$’000
The Company
Provisions 135 154 – – 135 154
Equity issue costs 141 161 – – 141 161
Deferred tax balances
not brought to account (276) (315) – – (276) (315)
Deferred tax assets/(liabilities) – – – – – –
Unrecognised deferred tax assets
Deferred tax assets have not been recognised in respect of the following items:
Consolidated The Company
2011 2010 2011 2010 US$’000 US$’000 US$’000 US$’000
Deductible temporary differences in USA (net) 5,229 7,204 – –
Tax operating loss carry-forwards in USA (net) 27,109 23,193 – –
Deductible temporary differences in Australia (net) 276 315 276 315
Tax operating loss carry-forwards in Australia (net) 2,765 2,718 2,765 2,718
35,379 33,430 3,041 3,033
Under Australian Accounting Standards, the consolidated entity is required to assess at each reporting period, the extent
to which deferred tax assets in respect of the carry-forward of unused tax losses and temporary differences qualify for
recognition on the balance sheet based on current facts and circumstances, including projected future taxable profi ts.
Historically, no deferred tax assets have been recognised in relation to the Australian operations as they do not qualify
for recognition of deferred tax assets until such time that it is probable that future taxable profi ts will be available against
which unused tax losses and temporary differences in the relevant tax jurisdictions can be utilised.
In the previous corresponding period, the consolidated entity recognised a provision of US$12,513,000 against the entire
USA deferred tax balance previously brought to account until such time as the USA operations can regain sustained
profi tability suffi cient to make it probable that the tax losses can be utilised.
The deductible temporary differences and tax losses in Australia do not expire under current tax legislation though these
losses are subject to testing under loss recoupment rules, in order for them to be utilised. USA loss carry forwards expire
in 2021 and later.
SHALE OIL:CATALYST FOR GROWTH
ANNUAL REPORT 2011 49

NOTES TO THE CONSOLIDATEDFINANCIAL STATEMENTS CONT.
For the year ended 31 December 2011
16. Deferred tax assets cont.
Movement in temporary differences during the year cont.
Consolidated
Reclassifi ed to other Balance Recognised Recognised balance sheet Balance 1 Jan 10 in income in equity account 31 Dec 10 US$’000 US$’000 US$000 US$000 US$’000
Exploration, evaluation and development expenditure 5,415 1,951 – – 7,366
Cash fl ow hedges (1,478) 1,478 – – –
Other items 600 (360) – (402) (162)
U.S. operating loss carry-forwards 7,976 (7,976) – – –
Deferred tax balances in USA not brought to account – (7,204) – – (7,204)
12,513 (12,111) – (402) –
Consolidated
Reclassifi ed from other Balance Recognised Recognised balance sheet Balance 1 Jan 11 in income in equity account 31 Dec 11 US$’000 US$’000 US$000 US$000 US$’000
Exploration, evaluation and development expenditure 7,366 (2,261) – – 5,105
Other items (162) 286 – – 124
Deferred tax balances in USA not brought to account (7,204) 1,975 – – (5,229)
– – – – –
The Company
Reclassifi ed from other Balance Recognised Recognised balance sheet Balance 1 Jan 10 in income in equity account 31 Dec 10 US$’000 US$’000 US$000 US$000 US$’000
Provisions 169 (15) – – 154
Equity issue costs 145 16 – – 161
Deferred tax balances in Australia
not brought to account (314) (1) – – (315)
– – – – –
The Company
Reclassifi ed from other Balance Recognised Recognised balance sheet Balance 1 Jan 11 in income in equity account 31 Dec 11 US$’000 US$’000 US$000 US$000 US$’000
Provisions 154 (19) – – 135
Equity issue costs 161 (20) – – 141
Deferred tax balances in Australia
not brought to account (315) 39 – – (276)
– – – – –
50
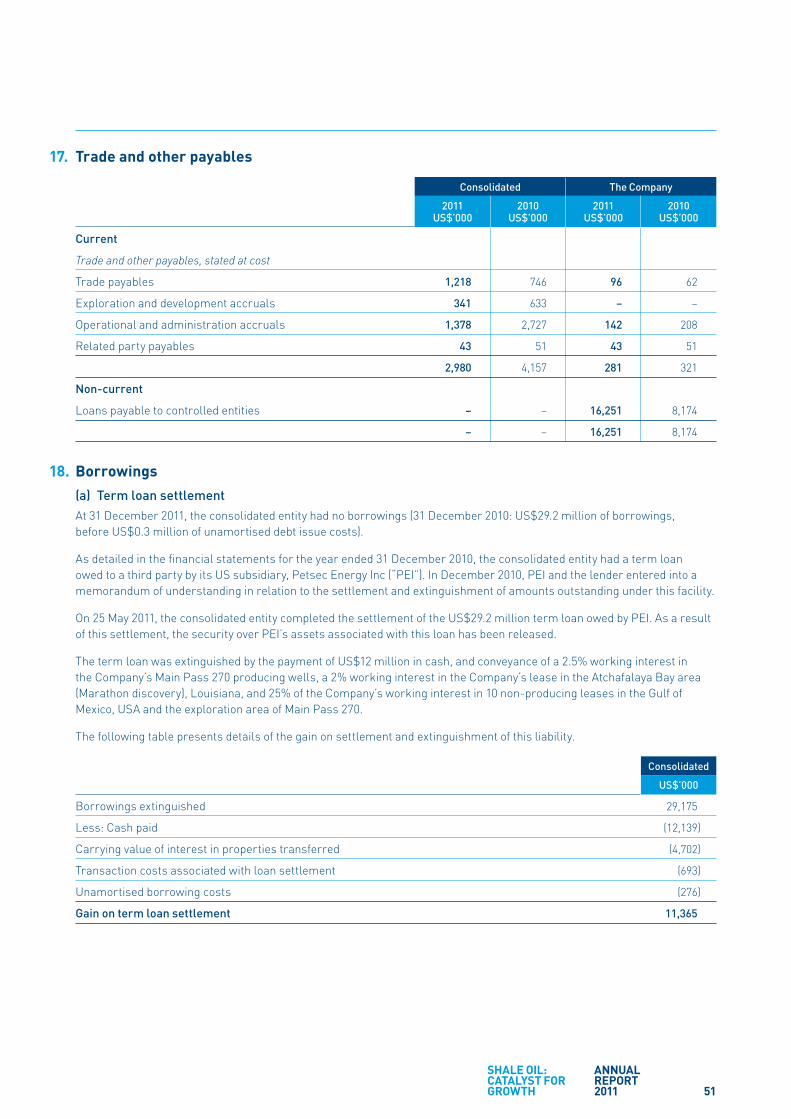
17. Trade and other payables
Consolidated The Company
2011 2010 2011 2010 US$’000 US$’000 US$’000 US$’000
Current
Trade and other payables, stated at cost
Trade payables 1,218 746 96 62
Exploration and development accruals 341 633 – –
Operational and administration accruals 1,378 2,727 142 208
Related party payables 43 51 43 51
2,980 4,157 281 321
Non-current
Loans payable to controlled entities – – 16,251 8,174
– – 16,251 8,174
18. Borrowings
(a) Term loan settlement
At 31 December 2011, the consolidated entity had no borrowings (31 December 2010: US$29.2 million of borrowings,
before US$0.3 million of unamortised debt issue costs).
As detailed in the fi nancial statements for the year ended 31 December 2010, the consolidated entity had a term loan
owed to a third party by its US subsidiary, Petsec Energy Inc (“PEI”). In December 2010, PEI and the lender entered into a
memorandum of understanding in relation to the settlement and extinguishment of amounts outstanding under this facility.
On 25 May 2011, the consolidated entity completed the settlement of the US$29.2 million term loan owed by PEI. As a result
of this settlement, the security over PEI’s assets associated with this loan has been released.
The term loan was extinguished by the payment of US$12 million in cash, and conveyance of a 2.5% working interest in
the Company’s Main Pass 270 producing wells, a 2% working interest in the Company’s lease in the Atchafalaya Bay area
(Marathon discovery), Louisiana, and 25% of the Company’s working interest in 10 non-producing leases in the Gulf of
Mexico, USA and the exploration area of Main Pass 270.
The following table presents details of the gain on settlement and extinguishment of this liability.
Consolidated
US$’000
Borrowings extinguished 29,175
Less: Cash paid (12,139)
Carrying value of interest in properties transferred (4,702)
Transaction costs associated with loan settlement (693)
Unamortised borrowing costs (276)
Gain on term loan settlement 11,365
SHALE OIL:CATALYST FOR GROWTH
ANNUAL REPORT 2011 51
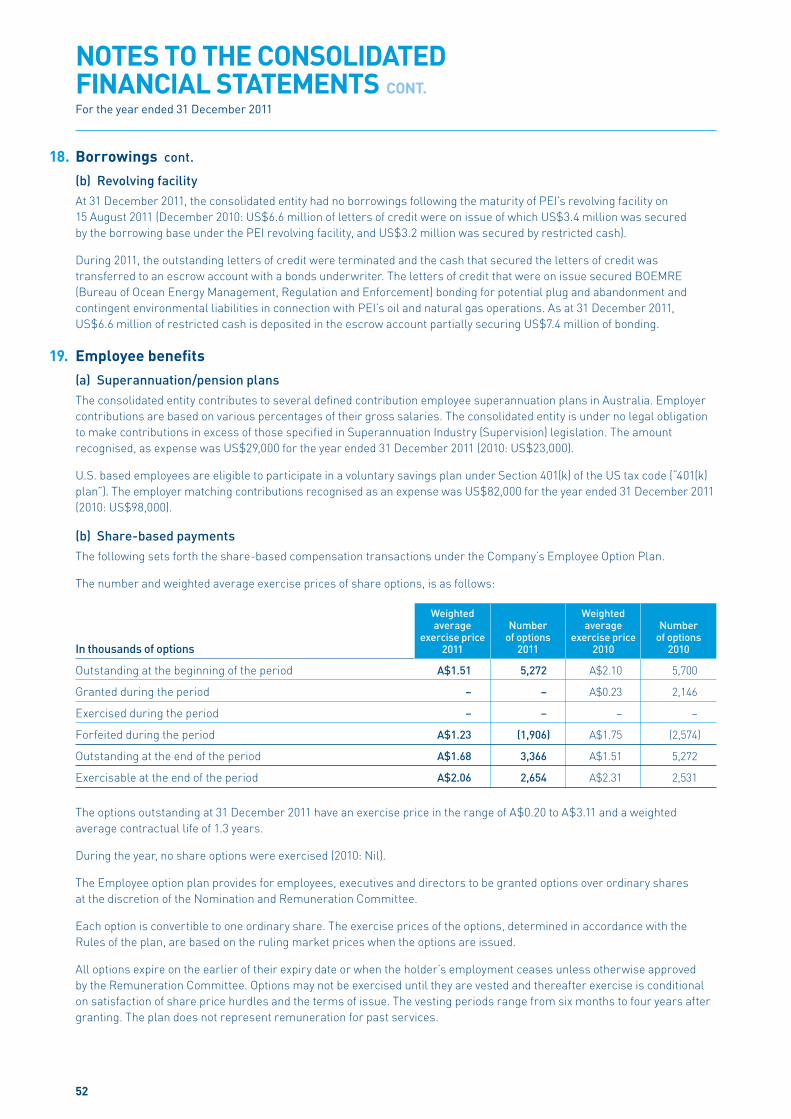
NOTES TO THE CONSOLIDATEDFINANCIAL STATEMENTS CONT.
For the year ended 31 December 2011
18. Borrowings cont.
(b) Revolving facility
At 31 December 2011, the consolidated entity had no borrowings following the maturity of PEI’s revolving facility on
15 August 2011 (December 2010: US$6.6 million of letters of credit were on issue of which US$3.4 million was secured
by the borrowing base under the PEI revolving facility, and US$3.2 million was secured by restricted cash).
During 2011, the outstanding letters of credit were terminated and the cash that secured the letters of credit was
transferred to an escrow account with a bonds underwriter. The letters of credit that were on issue secured BOEMRE
(Bureau of Ocean Energy Management, Regulation and Enforcement) bonding for potential plug and abandonment and
contingent environmental liabilities in connection with PEI’s oil and natural gas operations. As at 31 December 2011,
US$6.6 million of restricted cash is deposited in the escrow account partially securing US$7.4 million of bonding.
19. Employee benefi ts
(a) Superannuation/pension plans
The consolidated entity contributes to several defi ned contribution employee superannuation plans in Australia. Employer
contributions are based on various percentages of their gross salaries. The consolidated entity is under no legal obligation
to make contributions in excess of those specifi ed in Superannuation Industry (Supervision) legislation. The amount
recognised, as expense was US$29,000 for the year ended 31 December 2011 (2010: US$23,000).
U.S. based employees are eligible to participate in a voluntary savings plan under Section 401(k) of the US tax code (“401(k)
plan”). The employer matching contributions recognised as an expense was US$82,000 for the year ended 31 December 2011
(2010: US$98,000).
(b) Share-based payments
The following sets forth the share-based compensation transactions under the Company’s Employee Option Plan.
The number and weighted average exercise prices of share options, is as follows:
Weighted Weighted average Number average Number exercise price of options exercise price of optionsIn thousands of options 2011 2011 2010 2010
Outstanding at the beginning of the period A$1.51 5,272 A$2.10 5,700
Granted during the period – – A$0.23 2,146
Exercised during the period – – – –
Forfeited during the period A$1.23 (1,906) A$1.75 (2,574)
Outstanding at the end of the period A$1.68 3,366 A$1.51 5,272
Exercisable at the end of the period A$2.06 2,654 A$2.31 2,531
The options outstanding at 31 December 2011 have an exercise price in the range of A$0.20 to A$3.11 and a weighted
average contractual life of 1.3 years.
During the year, no share options were exercised (2010: Nil).
The Employee option plan provides for employees, executives and directors to be granted options over ordinary shares
at the discretion of the Nomination and Remuneration Committee.
Each option is convertible to one ordinary share. The exercise prices of the options, determined in accordance with the
Rules of the plan, are based on the ruling market prices when the options are issued.
All options expire on the earlier of their expiry date or when the holder’s employment ceases unless otherwise approved
by the Remuneration Committee. Options may not be exercised until they are vested and thereafter exercise is conditional
on satisfaction of share price hurdles and the terms of issue. The vesting periods range from six months to four years after
granting. The plan does not represent remuneration for past services.
52
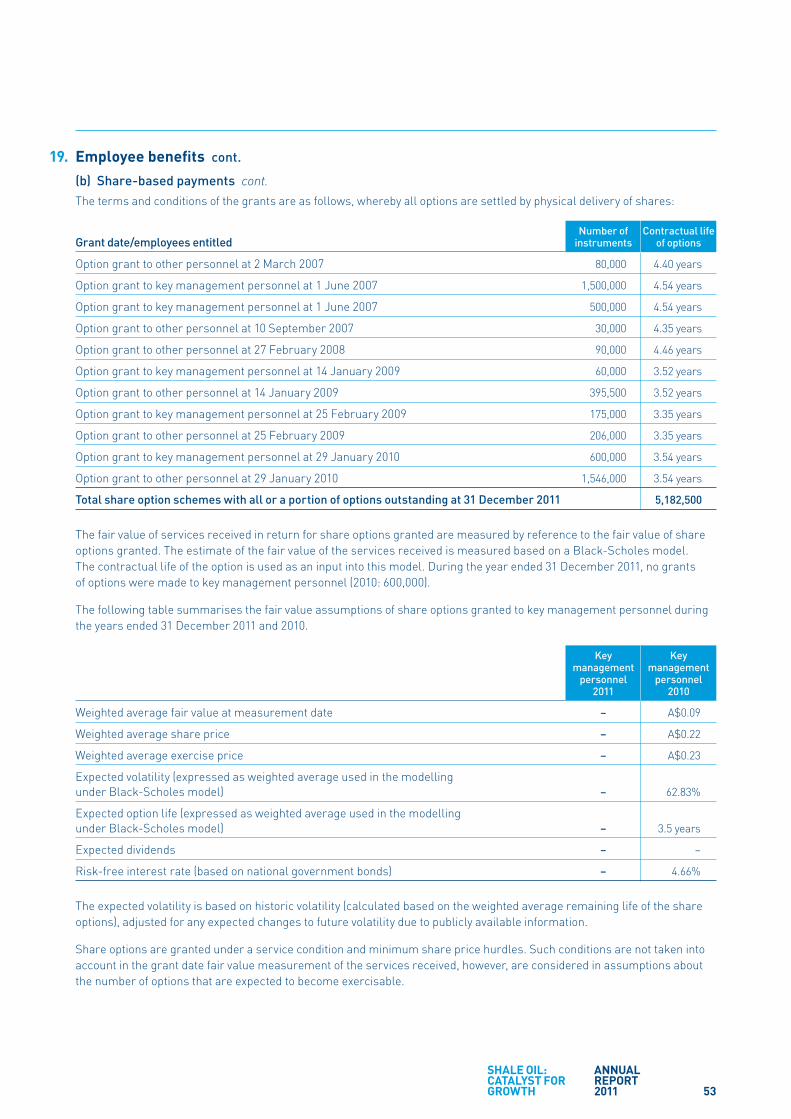
19. Employee benefi ts cont.
(b) Share-based payments cont.
The terms and conditions of the grants are as follows, whereby all options are settled by physical delivery of shares:
Number of Contractual lifeGrant date/employees entitled instruments of options
Option grant to other personnel at 2 March 2007 80,000 4.40 years
Option grant to key management personnel at 1 June 2007 1,500,000 4.54 years
Option grant to key management personnel at 1 June 2007 500,000 4.54 years
Option grant to other personnel at 10 September 2007 30,000 4.35 years
Option grant to other personnel at 27 February 2008 90,000 4.46 years
Option grant to key management personnel at 14 January 2009 60,000 3.52 years
Option grant to other personnel at 14 January 2009 395,500 3.52 years
Option grant to key management personnel at 25 February 2009 175,000 3.35 years
Option grant to other personnel at 25 February 2009 206,000 3.35 years
Option grant to key management personnel at 29 January 2010 600,000 3.54 years
Option grant to other personnel at 29 January 2010 1,546,000 3.54 years
Total share option schemes with all or a portion of options outstanding at 31 December 2011 5,182,500
The fair value of services received in return for share options granted are measured by reference to the fair value of share
options granted. The estimate of the fair value of the services received is measured based on a Black-Scholes model.
The contractual life of the option is used as an input into this model. During the year ended 31 December 2011, no grants
of options were made to key management personnel (2010: 600,000).
The following table summarises the fair value assumptions of share options granted to key management personnel during
the years ended 31 December 2011 and 2010.
Key Key management management personnel personnel 2011 2010
Weighted average fair value at measurement date – A$0.09
Weighted average share price – A$0.22
Weighted average exercise price – A$0.23
Expected volatility (expressed as weighted average used in the modelling
under Black-Scholes model) – 62.83%
Expected option life (expressed as weighted average used in the modelling
under Black-Scholes model) – 3.5 years
Expected dividends – –
Risk-free interest rate (based on national government bonds) – 4.66%
The expected volatility is based on historic volatility (calculated based on the weighted average remaining life of the share
options), adjusted for any expected changes to future volatility due to publicly available information.
Share options are granted under a service condition and minimum share price hurdles. Such conditions are not taken into
account in the grant date fair value measurement of the services received, however, are considered in assumptions about
the number of options that are expected to become exercisable.
SHALE OIL:CATALYST FOR GROWTH
ANNUAL REPORT 2011 53
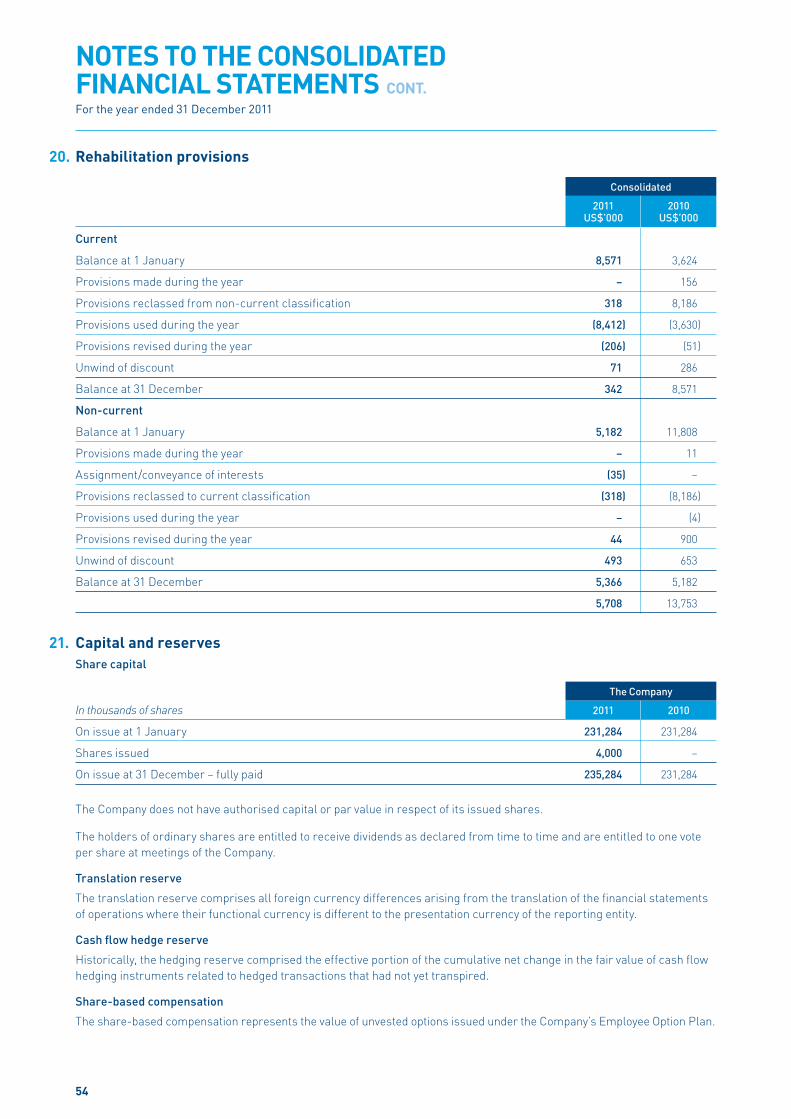
NOTES TO THE CONSOLIDATEDFINANCIAL STATEMENTS CONT.
For the year ended 31 December 2011
20. Rehabilitation provisions
Consolidated
2011 2010 US$’000 US$’000
Current
Balance at 1 January 8,571 3,624
Provisions made during the year – 156
Provisions reclassed from non-current classifi cation 318 8,186
Provisions used during the year (8,412) (3,630)
Provisions revised during the year (206) (51)
Unwind of discount 71 286
Balance at 31 December 342 8,571
Non-current
Balance at 1 January 5,182 11,808
Provisions made during the year – 11
Assignment/conveyance of interests (35) –
Provisions reclassed to current classifi cation (318) (8,186)
Provisions used during the year – (4)
Provisions revised during the year 44 900
Unwind of discount 493 653
Balance at 31 December 5,366 5,182
5,708 13,753
21. Capital and reserves
Share capital
The Company
In thousands of shares 2011 2010
On issue at 1 January 231,284 231,284
Shares issued 4,000 –
On issue at 31 December – fully paid 235,284 231,284
The Company does not have authorised capital or par value in respect of its issued shares.
The holders of ordinary shares are entitled to receive dividends as declared from time to time and are entitled to one vote
per share at meetings of the Company.
Translation reserve
The translation reserve comprises all foreign currency differences arising from the translation of the fi nancial statements
of operations where their functional currency is different to the presentation currency of the reporting entity.
Cash fl ow hedge reserve
Historically, the hedging reserve comprised the effective portion of the cumulative net change in the fair value of cash fl ow
hedging instruments related to hedged transactions that had not yet transpired.
Share-based compensation
The share-based compensation represents the value of unvested options issued under the Company’s Employee Option Plan.
54

21. Capital and reserves cont.
Capital management
The Board’s policy is to maintain an appropriate capital base to sustain future development of the consolidated entity.
This capital base may comprise equity and borrowings.
At 31 December 2011, the consolidated entity had no outstanding borrowings following the completion during the year of
the settlement of the term loan owed to a third party by its US subsidiary, PEI (see note 18 Borrowings for further details).
Neither the Company nor any of its subsidiaries are subject to externally imposed capital requirements.
22. Additional fi nancial instruments disclosures
Overview
The consolidated entity has exposure to the following risks from its use of fi nancial instruments:
• Credit risk
• Liquidity risk
• Market risk
This note presents information about the consolidated entity’s exposure to each of the above risks, their objectives, policies
and processes for measuring and managing risk, and the management of capital. Further quantitative disclosures are
included throughout this fi nancial report.
Risk Management Framework
The Board of Directors has overall responsibility for the establishment and oversight of the risk management framework.
There is no separate risk management committee.
Risk management policies are established to identify and analyse the risks faced by the consolidated entity, to set
appropriate risk limits and controls, and to monitor risks and adherence to limits. Risk management policies and systems
are reviewed regularly to refl ect changes in market conditions and the consolidated entity’s activities. The consolidated
entity, through their training and management standards and procedures, aim to develop a disciplined and constructive
control environment in which all employees understand their roles and obligations.
The forecast fi nancial position of the consolidated entity is continually monitored and derivative fi nancial instruments can
be used to hedge exposure to fl uctuations in commodity prices (refer to Commodity Price Risk below for further details).
The Board oversees how management monitors compliance with the consolidated entity’s risk management policies
and procedures and reviews the adequacy of the risk management framework in relation to the risks faced by the
consolidated entity.
Credit risk
Credit risk represents the loss that would be recognised if counterparties failed to perform as contracted. The credit risk
on fi nancial assets of the consolidated entity that have been recognised is the carrying amount, net of any provision for
doubtful debts. The consolidated entity has assessed that the counterparties credit ratings determined by a recognised
ratings agency remains acceptable.
Exposure to credit risk
The carrying amount of the consolidated entity’s fi nancial assets represents the maximum credit exposure.
The consolidated entity’s maximum exposure to credit risk at the reporting date was:
Consolidated
2011 2010 US$’000 US$’000
Cash and restricted cash deposits 41,579 23,073
Trade and other receivables 1,346 2,816
42,925 25,889
SHALE OIL:CATALYST FOR GROWTH
ANNUAL REPORT 2011 55

NOTES TO THE CONSOLIDATEDFINANCIAL STATEMENTS CONT.
For the year ended 31 December 2011
22. Additional fi nancial instruments disclosures cont.
Exposure to credit risk cont.
As at 31 December 2011, there was no material exposure to credit risk in relation to cash held by banks as $31 million was
held with Australian fi nancial institutions rated AA with the remaining balances held in the USA with institutions rated A
or higher. In addition, U.S. demand deposits are fully insured by the Federal Deposit Insurance Corporation (FDIC).
The consolidated entity manages its credit risk on trade receivables by dealing with only large reputable customers
for its oil and gas sales. At balance date, approximately 50% of trade and other receivables were due from four such
customers. The remainder of the receivables were due mainly from a number of joint owners of the jointly owned
properties. The consolidated entity does not consider there to be any impairment indicators associated with these debtors.
The consolidated entity’s credit risk is limited to the carrying value of its fi nancial assets. None of the consolidated entity’s
receivables are materially past due (2010: is consistent with 2011).
Liquidity risk
Liquidity risk is the risk that the consolidated entity and companies within the consolidated entity will not be able to meet
their fi nancial obligations as they fall due. The consolidated entity’s approach to managing liquidity is to ensure, as far
as possible, that it will always have suffi cient liquidity to meet its liabilities when due, under both normal and stressed
conditions, without incurring unacceptable losses or risking damage to the consolidated entity’s reputation.
Ultimate responsibility for liquidity risk management rests with the Board of Directors. The consolidated entity manages
liquidity risk by monitoring of future rolling cash fl ow forecasts. These refl ect management’s expectations of the settlement
of fi nancial assets and liabilities.
The following are the contractual maturities of fi nancial liabilities, including estimated interest payments.
31 December 2011
Contractual cashfl ows
Carrying 6 mths 6 – 1 – 2 – 5 years amount or less 12 mths 2 years 5 years or moreConsolidated US$000 US$000 US$000 US$000 US$000 US$000
Trade and other payables 2,980 2,980 – – – –
Total 2,980 2,980 – – – –
31 December 2010
Contractual cashfl ows
Carrying 6 mths 6 – 1 – 2 – 5 years amount or less 12 mths 2 years 5 years or moreConsolidated US$000 US$000 US$000 US$000 US$000 US$000
Trade and other payables 4,157 4,157 – – – –
Borrowings 28,919 28,919 – – – –
Total 33,076 33,076 – – – –
Market risk
Market risk is the risk that changes in market prices, such as foreign exchange rates, commodity prices, interest rates will
affect the consolidated entity’s income or the value of its holdings of fi nancial instruments. The objective of market risk
management is to manage and control market risk exposures within acceptable parameters, while optimising the return.
Foreign exchange risk
During 2010 and 2011, operating costs were incurred in both Australian and US dollars.
Throughout 2010 and 2011, the consolidated entity held the majority of its liquid funds in US dollars.
Fluctuations in the Australian dollar/US dollar exchange rate have impacted the underlying performance of the consolidated
entity. The consolidated entity’s policy is not to hedge the Australian dollar/US dollar exchange rate risk as income (cash
infl ows) and expenses (cash outfl ows), are predominantly denominated in US dollars, with the exception of Australian dollar
denominated equity funding, consequently surplus funds are primarily held in US dollars.
56
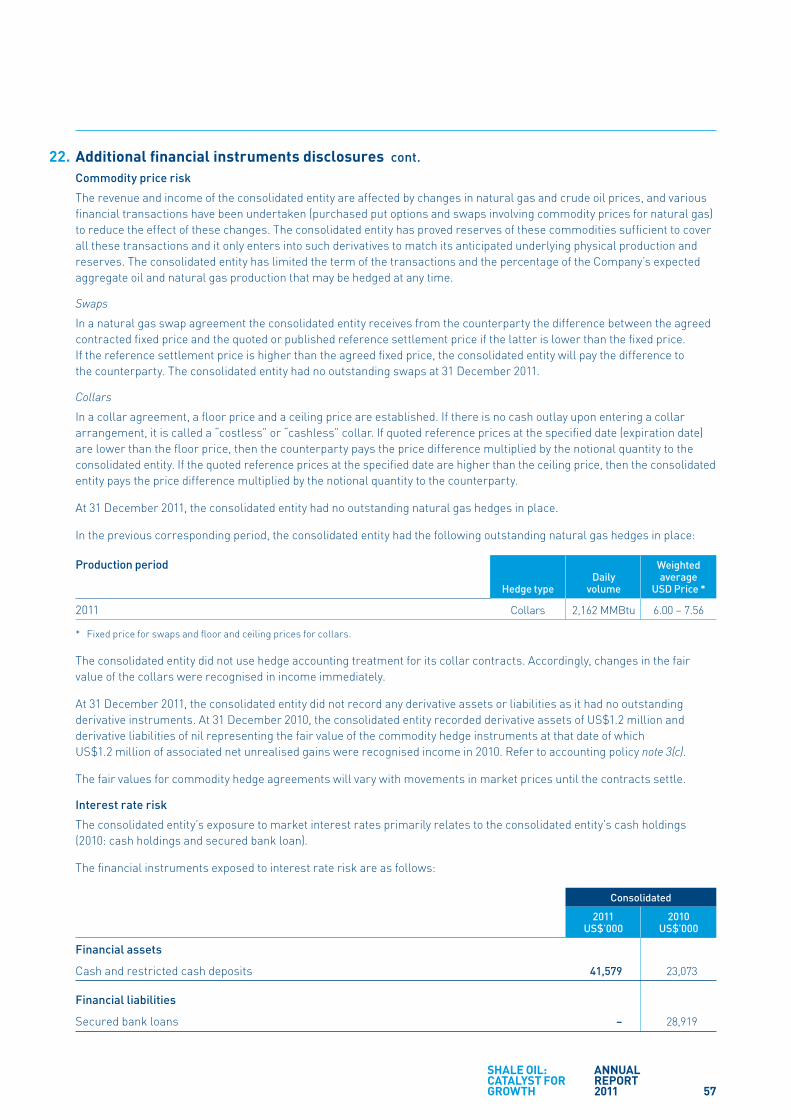
22. Additional fi nancial instruments disclosures cont.
Commodity price risk
The revenue and income of the consolidated entity are affected by changes in natural gas and crude oil prices, and various
fi nancial transactions have been undertaken (purchased put options and swaps involving commodity prices for natural gas)
to reduce the effect of these changes. The consolidated entity has proved reserves of these commodities suffi cient to cover
all these transactions and it only enters into such derivatives to match its anticipated underlying physical production and
reserves. The consolidated entity has limited the term of the transactions and the percentage of the Company’s expected
aggregate oil and natural gas production that may be hedged at any time.
Swaps
In a natural gas swap agreement the consolidated entity receives from the counterparty the difference between the agreed
contracted fi xed price and the quoted or published reference settlement price if the latter is lower than the fi xed price.
If the reference settlement price is higher than the agreed fi xed price, the consolidated entity will pay the difference to
the counterparty. The consolidated entity had no outstanding swaps at 31 December 2011.
Collars
In a collar agreement, a fl oor price and a ceiling price are established. If there is no cash outlay upon entering a collar
arrangement, it is called a “costless” or “cashless” collar. If quoted reference prices at the specifi ed date (expiration date)
are lower than the fl oor price, then the counterparty pays the price difference multiplied by the notional quantity to the
consolidated entity. If the quoted reference prices at the specifi ed date are higher than the ceiling price, then the consolidated
entity pays the price difference multiplied by the notional quantity to the counterparty.
At 31 December 2011, the consolidated entity had no outstanding natural gas hedges in place.
In the previous corresponding period, the consolidated entity had the following outstanding natural gas hedges in place:
Production period Weighted Daily average Hedge type volume USD Price *
2011 Collars 2,162 MMBtu 6.00 – 7.56
* Fixed price for swaps and fl oor and ceiling prices for collars.
The consolidated entity did not use hedge accounting treatment for its collar contracts. Accordingly, changes in the fair
value of the collars were recognised in income immediately.
At 31 December 2011, the consolidated entity did not record any derivative assets or liabilities as it had no outstanding
derivative instruments. At 31 December 2010, the consolidated entity recorded derivative assets of US$1.2 million and
derivative liabilities of nil representing the fair value of the commodity hedge instruments at that date of which
US$1.2 million of associated net unrealised gains were recognised income in 2010. Refer to accounting policy note 3(c).
The fair values for commodity hedge agreements will vary with movements in market prices until the contracts settle.
Interest rate risk
The consolidated entity’s exposure to market interest rates primarily relates to the consolidated entity’s cash holdings
(2010: cash holdings and secured bank loan).
The fi nancial instruments exposed to interest rate risk are as follows:
Consolidated
2011 2010 US$’000 US$’000
Financial assets
Cash and restricted cash deposits 41,579 23,073
Financial liabilities
Secured bank loans – 28,919
SHALE OIL:CATALYST FOR GROWTH
ANNUAL REPORT 2011 57
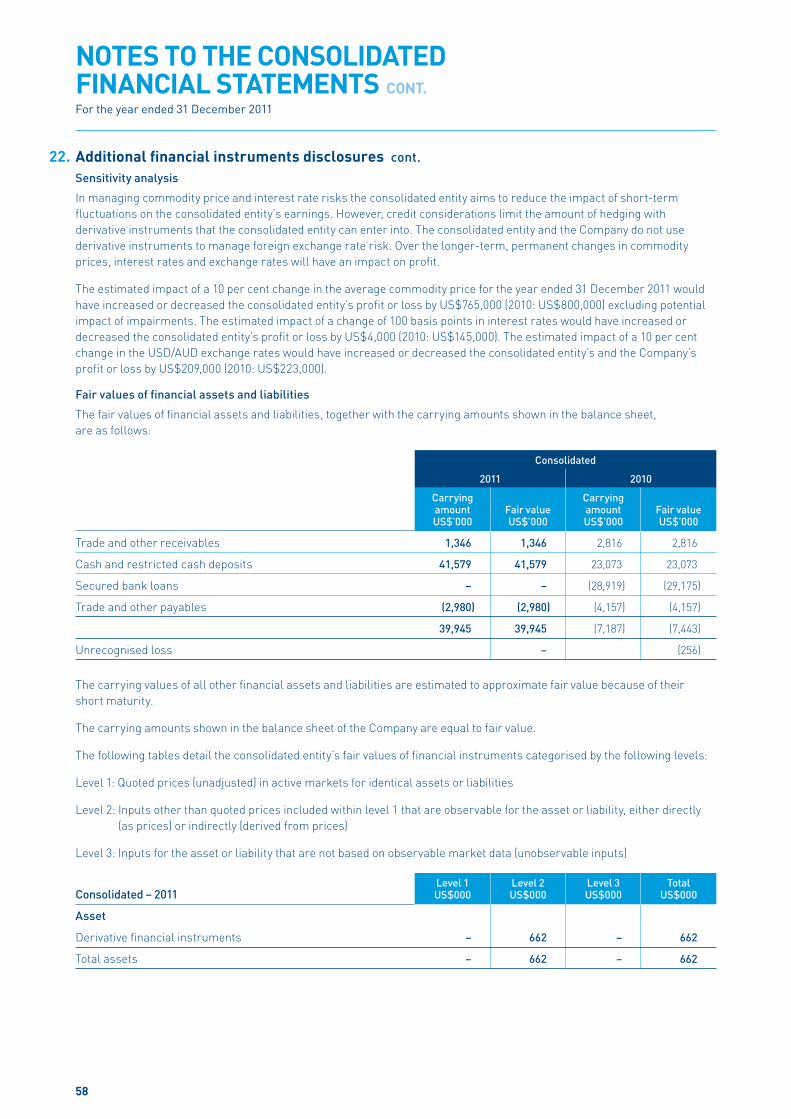
NOTES TO THE CONSOLIDATEDFINANCIAL STATEMENTS CONT.
For the year ended 31 December 2011
22. Additional fi nancial instruments disclosures cont.
Sensitivity analysis
In managing commodity price and interest rate risks the consolidated entity aims to reduce the impact of short-term
fl uctuations on the consolidated entity’s earnings. However, credit considerations limit the amount of hedging with
derivative instruments that the consolidated entity can enter into. The consolidated entity and the Company do not use
derivative instruments to manage foreign exchange rate risk. Over the longer-term, permanent changes in commodity
prices, interest rates and exchange rates will have an impact on profi t.
The estimated impact of a 10 per cent change in the average commodity price for the year ended 31 December 2011 would
have increased or decreased the consolidated entity’s profi t or loss by US$765,000 (2010: US$800,000) excluding potential
impact of impairments. The estimated impact of a change of 100 basis points in interest rates would have increased or
decreased the consolidated entity’s profi t or loss by US$4,000 (2010: US$145,000). The estimated impact of a 10 per cent
change in the USD/AUD exchange rates would have increased or decreased the consolidated entity’s and the Company’s
profi t or loss by US$209,000 (2010: US$223,000).
Fair values of fi nancial assets and liabilities
The fair values of fi nancial assets and liabilities, together with the carrying amounts shown in the balance sheet,
are as follows:
Consolidated
2011 2010
Carrying Carrying amount Fair value amount Fair value US$’000 US$’000 US$’000 US$’000
Trade and other receivables 1,346 1,346 2,816 2,816
Cash and restricted cash deposits 41,579 41,579 23,073 23,073
Secured bank loans – – (28,919) (29,175)
Trade and other payables (2,980) (2,980) (4,157) (4,157)
39,945 39,945 (7,187) (7,443)
Unrecognised loss – (256)
The carrying values of all other fi nancial assets and liabilities are estimated to approximate fair value because of their
short maturity.
The carrying amounts shown in the balance sheet of the Company are equal to fair value.
The following tables detail the consolidated entity’s fair values of fi nancial instruments categorised by the following levels:
Level 1: Quoted prices (unadjusted) in active markets for identical assets or liabilities
Level 2: Inputs other than quoted prices included within level 1 that are observable for the asset or liability, either directly
(as prices) or indirectly (derived from prices)
Level 3: Inputs for the asset or liability that are not based on observable market data (unobservable inputs)
Level 1 Level 2 Level 3 TotalConsolidated – 2011 US$000 US$000 US$000 US$000
Asset
Derivative fi nancial instruments – 662 – 662
Total assets – 662 – 662
58

22. Additional fi nancial instruments disclosures cont.
Level 1 Level 2 Level 3 TotalConsolidated – 2010 US$000 US$000 US$000 US$000
Asset
Derivative fi nancial instruments – 1,247 – 1,247
Total assets – 1,247 – 1,247
Unless otherwise stated, the carrying amounts of fi nancial instruments refl ect their fair value.
23. Operating leases
Leases as lessee
Non-cancellable operating lease rentals are payable as follows:
Consolidated The Company
2011 2010 2011 2010 US$’000 US$’000 US$’000 US$’000
Less than one year 489 418 177 172
Between one and fi ve years 195 329 – 177
684 747 177 349
The consolidated entity leases offi ce space in Australia and the USA under operating leases. The leases typically run for
a period of 3 to 5 years. None of the leases includes contingent rentals.
One of the leased properties has been sublet by the consolidated entity. The lease and subleases expire in 2012. Sub-lease
payments of A$15,000 are expected to be received during the following fi nancial year.
During the year ended 31 December 2011, US$1,002,000 was recognised as an expense in the statement of comprehensive
income in respect of operating leases (2010: US$1,197,000). US$27,000 (2010: US$25,000) was recognised as income in the
statement of comprehensive income in respect of sub-leases.
24. Capital and other commitments
Consolidated
2011 2010 US$’000 US$’000
Capital expenditure commitments
Exploration, evaluation and development expenditure
Contracted but not provided for and payable:
Within one year 1,151 1,216
One year or later and no later than fi ve years 278 624
1,429 1,840
Consolidated
2011 2010 US$’000 US$’000
Joint operating arrangements commitments
Share of capital commitments of the joint operating arrangements:
Within one year – 1,356
SHALE OIL:CATALYST FOR GROWTH
ANNUAL REPORT 2011 59
NOTES TO THE CONSOLIDATEDFINANCIAL STATEMENTS CONT.
For the year ended 31 December 2011
25. Contingencies and legal matters
The consolidated entity is a defendant from time to time in legal proceedings. Where appropriate the consolidated entity
engages legal counsel.
The production, handling, storage, transportation and disposal of oil and natural gas, by-products thereof and other
substances and materials produced or used in connection with oil and natural gas operations were subject to regulation
under U.S. federal, state and local laws and regulations primarily relating to protection of human health and environment.
To date, expenditure related to complying with these laws and for remediation of existing environmental contamination has
not been signifi cant in relation to the results of operations of the Company.
The Company’s U.S. subsidiary, Petsec Energy Inc. (“PEI”) is required to provide bonding or security for the benefi t of U.S.
regulatory authorities and lease owners in relation to its obligations to pay lease rentals and royalties, the plugging and
abandonment of oil and natural gas wells, and the removal of related facilities. As of 31 December 2011, the consolidated
entity was contingently liable for US$7,425,000 of surety and supplemental bonds (2010: US$10,075,000) issued through
a surety company to secure those obligations. At balance date US$6,625,000 of these bonds were collateralised by cash
(2010: US$6,625,000 by cash and letters of credit).
26. Deed of cross guarantee
Pursuant to an ASIC Class Order 98/1418 dated 13 August 1998, relief is granted to certain wholly owned Australian
subsidiaries of the Company from the Corporations Act requirements for preparation, audit, and publication of Financial
Reports and Directors’ Reports.
It is a condition of the Class Order that the Company and each of its subsidiaries enter into a Deed of Cross Guarantee
Indemnity. The effect of the deed is that the Company guarantees to each creditor payment in full of any debt in the event
of winding up of any of the subsidiaries under certain provisions of the Corporations Act. If a winding-up occurs under other
provisions of the Act, the Company will only be liable in the event that after six months any creditor has not been paid in full.
The subsidiaries have also given similar guarantees in the event that the Company is wound up.
The subsidiaries subject to the Deed are:
• Petsec Investments Pty. Limited
• Petroleum Securities Pty. Limited
• Najedo Pty. Ltd
• Petroleum Securities Share Plan Pty Limited
• Laurel Bay Petroleum Limited
• Ginida Pty. Limited
• Western Medical Products Pty. Limited
A consolidated statement of comprehensive income and consolidated balance sheet, comprising the Company and
subsidiaries which are a party to the Deed, after eliminating all transactions between parties to the Deed of Cross
Guarantee, as at 31 December 2011 and 2010, is set out as follows:
Summarised statement of comprehensive income and retained earnings/(accumulated losses)
Consolidated
2011 2010 US$’000 US$’000
Retained earnings/(accumulated losses) at beginning of year (130,902) (79,044)
Profi t/(loss) after related income tax expense (19,676) (51,858)
Retained earnings/(accumulated losses) at end of year (150,578) (130,902)
60

26. Deed of cross guarantee
Balance sheet
Consolidated
2011 2010 US$’000 US$’000
Assets
Cash and cash equivalents 31,367 12,817
Other receivables 9,927 3,969
Prepayments 108 116
Total current assets 41,402 16,902
Loans receivable from controlled entities – 26,592
Loans receivable from related parties 817 –
Other fi nancial assets 11,000 8,178
Other investments 27,920 39,509
Property, plant and equipment 31 38
Total non-current assets 39,768 74,317
Total assets 81,170 91,219
Liabilities
Trade and other payables 281 322
Employee benefi ts provision 45 35
Total current liabilities 326 357
Loans payable to controlled entities 8,042 –
Employee benefi ts provision 237 233
Total non-current liabilities 8,279 233
Total liabilities 8,605 590
Net assets 72,565 90,629
Equity
Issued capital 185,793 184,783
Reserves 37,350 36,748
Retained earnings/(accumulated losses) (150,578) (130,902)
Total equity 72,565 90,629
SHALE OIL:CATALYST FOR GROWTH
ANNUAL REPORT 2011 61
NOTES TO THE CONSOLIDATEDFINANCIAL STATEMENTS CONT.
For the year ended 31 December 2011
27. Consolidated entities
Ownership interest
Country of 2011 2010 Incorporation % %
Parent entity
Petsec Energy Ltd
Signifi cant subsidiaries
Petsec Investments Pty. Limited Australia 100 100
Petroleum Securities Pty. Limited Australia 100 100
Najedo Pty. Limited Australia 100 100
Petroleum Securities Share Plan Pty. Limited Australia 100 100
Petsec America Pty. Limited Australia 100 100
Petsec (U.S.A.) Inc. USA 100 100
Petsec Petroleum LLC1 USA – 100
Petsec Energy Inc. USA 100 100
Petsec Exploration and Production LLC USA 100 100
Laurel Bay Petroleum Limited Australia 100 100
Ginida Pty. Limited Australia 100 100
Western Medical Products Pty. Limited Australia 100 100
1 Petsec Petroleum LLC was sold to Horizon Oil in June 2011 (refer to note 29 Discontinued Operations for further details).
All entities carry on business in the country where they were incorporated with the exception of Petsec Petroleum LLC,
which held the consolidated entity’s interests in the Beibu Gulf, China.
28. Segment reporting
The consolidated entity operates in the oil and gas industry.
Segment information is presented in the consolidated fi nancial statements in respect of the consolidated entity’s
geographic segments, which refl ects the presentation of information to the chief operating decision maker and may
differ from the information required to be disclosed in accordance with the Accounting Standards.
Segment results include items directly attributable to a segment as well as those that can be allocated on a reasonable
basis. Segment acquisition of property, plant and equipment, intangibles and exploration, evaluation and development
assets is the total cost incurred during the period to acquire segment assets that are expected to be utilised for more
than one period.
In presenting information on the basis of geographical segments, segment revenue and assets are based on the
geographical location of operations. Segment net revenues after royalties include the effect of realised hedge gains
of US$1,433,000. The realised hedge gain is not revenue under Accounting Standards (refer to note 8 Derivative Gains
for further details).
62

28. Segment reporting cont.
During the current period, Petsec Energy sold the subsidiary through which it conducted its China operations (refer to note
29 Discontinued Operations for further details). The effective date of the sale was 1 January 2011.
Australia USA China Consolidated
2011 2010 2011 2010 2011 2010 2011 2010 US$’000 US$’000 US$’000 US$’000 US$’000 US$’000 US$’000 US$’000
Oil and gas sales and royalties – – 15,002 31,061 – – 15,002 31,061
Royalties paid – – (2,047) (3,981) – – (2,047) (3,981)
Net revenues after royalties* – – 12,955 27,080 – – 12,955 27,080
Segment net profi t/(loss)
before tax 26,524 (1,342) (12,490) (19,902) – (404) 14,034 (21,648)
Income tax expense – (13,589)
Profi t/(loss) after tax 14,034 (35,237)
Depreciation, depletion
and amortisation 12 13 5,192 12,483 – – 5,204 12,496
Dry hole, impairment and
abandonment expense – – 20,229 19,456 – – 20,229 19,456
Seismic and repair expense – – 478 533 – – 478 533
Segment assets 32,997 12,993 33,439 63,424 – 13,662 66,436 90,079
Acquisition of property, plant
and equipment and exploration,
evaluation and development assets 4 10 3,888 11,323 – 606 3,892 11,939
* There are no inter-segment sales
Australia USA China Consolidated
2011 2010 2011 2010 2011 2010 2011 2010 US$’000 US$’000 US$’000 US$’000 US$’000 US$’000 US$’000 US$’000
Segment liabilities 563 589 8,571 45,963 – 686 9,134 47,238
Cash fl ows from
operating activities (2,059) (1,707) (4,536) 3,942 – (394) (6,595) 1,841
Cash fl ows from
investing activities 40,865 (10) (3,888) (11,198) – (719) 36,977 (11,927)
Cash fl ows from
fi nancing activities – – (12,833) (225) – – (12,833) (225)
SHALE OIL:CATALYST FOR GROWTH
ANNUAL REPORT 2011 63
NOTES TO THE CONSOLIDATEDFINANCIAL STATEMENTS CONT.
For the year ended 31 December 2011
29. Discontinued operation
On 2 June 2011, the Company entered into an agreement with Horizon Oil Limited for the sale of Petsec Energy’s wholly
owned subsidiary, Petsec Petroleum LLC, which held Petsec Energy’s entire interest in Block 22/12 Beibu Gulf, China.
The effective sale date was 1 January 2011 and the total consideration comprised A$38 million cash and 15,000,000 options
over Horizon Oil Limited ordinary shares with a three year term and exercise price of A$0.37 cents per share. Following
approval from the Chinese National Offshore Oil Corporation, this transaction completed in June 2011 resulting in the
recognition of an accounting gain of US$29.8 million on disposal.
The Block 22/12 Beibu Gulf interest represented Petsec Energy’s China segment. The following table presents details
of contribution of this discontinued operation and the gain on sale.
Consolidated
2011 2010 US$’000 US$’000
Results from discontinued operation
GG&A expense – (404)
Tax expense – –
Result from operating activities, net of income tax – –
Net gain on sale of discontinued operation 29,807 –
Tax expense on net gain on sale of discontinued operations – –
Profi t/(loss) for the period 29,807 (404)
Cash fl ows from discontinued operations
Net cash from (used in) operating activities – (394)
Net cash from (used in) investing activities – (719)
Net cash from (used in) fi nancing activities – –
The net gain on the sale of Block 22/12 Beibu Gulf has been calculated using the prevailing USD/AUD exchange rates on the
date of the transaction, as follows:
Consolidated
2011 US$’000
Sale proceeds
– Cash 40,869
– Receivable 683
– Fair value of options in Horizon Oil Limited* 1,817
Total sales proceeds 43,369
Carrying value of net assets disposed (13,562)
Net gain on sale of discontinued operations 29,807
* The options have an exercise price of A$0.37 per share, and can be exercised at any time up until 30 June 2014. The options are unlisted.
There are no restrictions on Petsec selling the unexercised options to a third party. At the grant date, the options had a fair value of
A$0.1126 per option.
64

30. Interests in unincorporated joint operating arrangements
Included in the assets of the consolidated entity are the following items which represent the consolidated entity’s interest
in the assets and liabilities in joint operating arrangements:
Consolidated
2011 2010 US$’000 US$’000
Assets
Exploration, evaluation and development expenditure – Tangible:
Leases now in production
Producing leases – at cost 86,859 138,230
Less: accumulated amortisation and impairment (69,634) (102,391)
17,225 35,839
Represented by the following lease carrying values:
– Main Pass 270 10,261 24,691
– Main Pass 19 2,920 8,724
– Onshore Louisiana 4,044 2,424
17,225 35,839
Leases not yet in production
– Block 22/12 Beibu Gulf, China1 – 12,315
– Other Gulf of Mexico leases – 110
– 12,425
Total exploration, evaluation and development expenditure – Tangible 17,225 48,264
Exploration and evaluation expenditure – Intangible:
Not in production
– Block 22/12 Beibu Gulf, China1 – 1,338
– Onshore Louisiana – 2,814
– Other Gulf of Mexico leases 1,573 2,640
Total exploration, evaluation and development expenditure – Intangible 1,573 6,792
1 Interest in Block 22/12 Beibu Gulf, China sold in June 2011.
Consolidated
2011 2010 US$’000 US$’000
Liabilities
Rehabilitation provision:
– Main Pass 19 1,510 1,340
– Mobile Bay Area2 – 4,836
– Main Pass 270 338 336
– Onshore Louisiana 522 711
2,370 7,223
2 Mobile Bay Area fi eld ceased production during the fi rst half 2010. Plug and abandonment operations commenced during the current period
and the work was completed by October 2011.
SHALE OIL:CATALYST FOR GROWTH
ANNUAL REPORT 2011 65

NOTES TO THE CONSOLIDATEDFINANCIAL STATEMENTS CONT.
For the year ended 31 December 2011
30. Interests in unincorporated joint operating arrangements cont.
The contribution of the consolidated entity’s joint operating arrangements to EBIT (including exploration write-offs
and impairments; and excluding the effects of hedging):
Consolidated
2011 2010 US$’000 US$’000
– Main Pass 19 (5,973) (5,215)
– Mobile Bay Area (624) (1,317)
– Main Pass 270 (9,088) (6,882)
– Main Pass 20 Deep #4 well – (2,860)
– Block 22/12 Beibu Gulf, China1 – (404)
– Onshore Louisiana (1,152) 1,357
– Other Gulf of Mexico leases 28 230
(16,809) (15,091)
The principal activity of all the joint operating arrangements is oil & gas exploration. Listed below is the name of each
of the joint operating arrangements and the percentage working interest held in the joint operating arrangement by the
consolidated entity as at and during the year ended 31 December:
Consolidated
Interest held Interest held 2011 2010
– Main Pass 19 55.00% 55.00%
– Mobile Bay Area – 40.00% to 50.00%
– Main Pass 270 18.75% to 22.50% 25.00%
– Block 22/12 Beibu Gulf, China1 – 12.25% to 25.00%
– Onshore Louisiana 46.21% to 80.00% 10.00% to 80.00%
– Other Gulf of Mexico leases2 37.50% to 75.00% 25.00% to 50.00%
1 Interest in Block 22/12 Beibu Gulf, China sold in June 2011.2 Refl ects interest held following conveyance of minority interests as part of the terms of the settlement of the subordinated term debt
in May 2011.
66
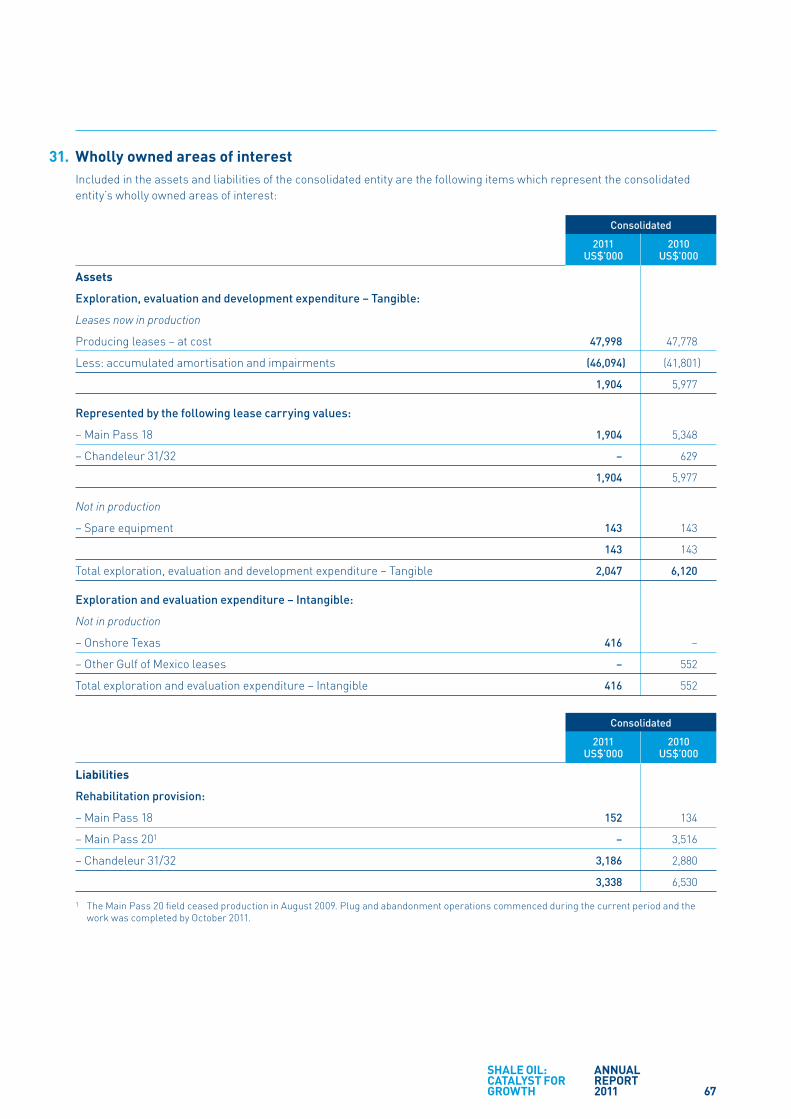
31. Wholly owned areas of interest
Included in the assets and liabilities of the consolidated entity are the following items which represent the consolidated
entity’s wholly owned areas of interest:
Consolidated
2011 2010 US$’000 US$’000
Assets
Exploration, evaluation and development expenditure – Tangible:
Leases now in production
Producing leases – at cost 47,998 47,778
Less: accumulated amortisation and impairments (46,094) (41,801)
1,904 5,977
Represented by the following lease carrying values:
– Main Pass 18 1,904 5,348
– Chandeleur 31/32 – 629
1,904 5,977
Not in production
– Spare equipment 143 143
143 143
Total exploration, evaluation and development expenditure – Tangible 2,047 6,120
Exploration and evaluation expenditure – Intangible:
Not in production
– Onshore Texas 416 –
– Other Gulf of Mexico leases – 552
Total exploration and evaluation expenditure – Intangible 416 552
Consolidated
2011 2010 US$’000 US$’000
Liabilities
Rehabilitation provision:
– Main Pass 18 152 134
– Main Pass 201 – 3,516
– Chandeleur 31/32 3,186 2,880
3,338 6,530
1 The Main Pass 20 fi eld ceased production in August 2009. Plug and abandonment operations commenced during the current period and the
work was completed by October 2011.
SHALE OIL:CATALYST FOR GROWTH
ANNUAL REPORT 2011 67
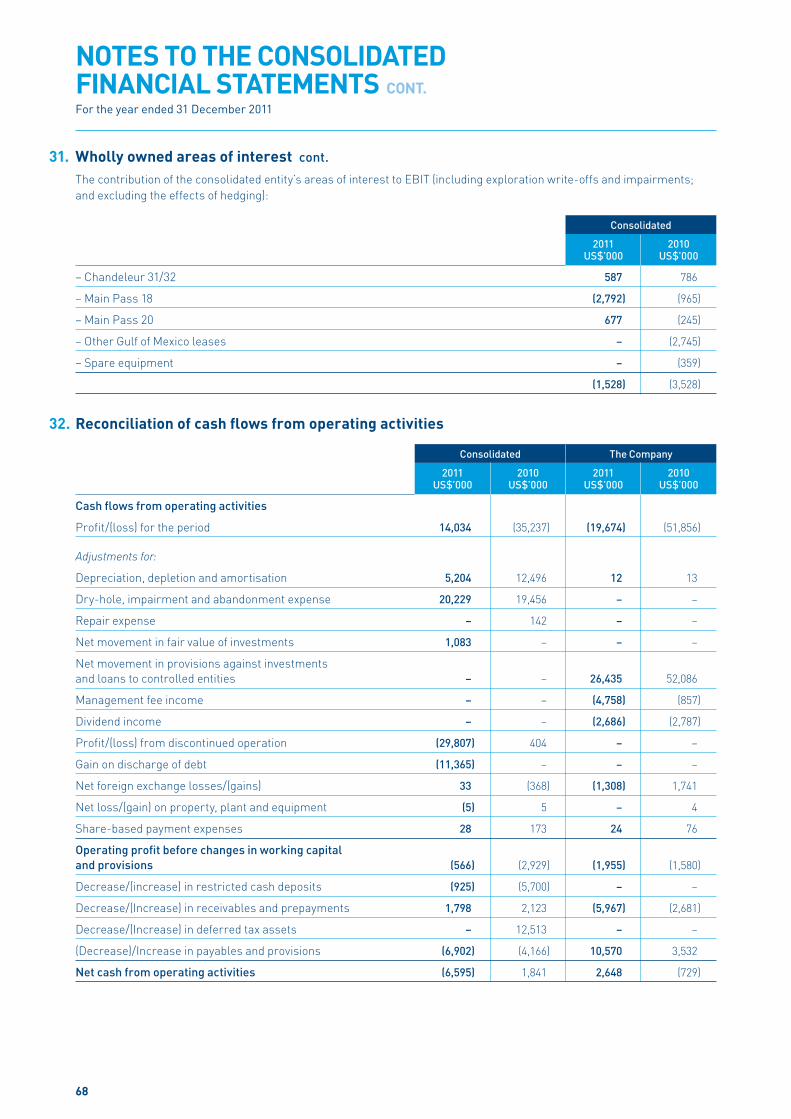
NOTES TO THE CONSOLIDATEDFINANCIAL STATEMENTS CONT.
For the year ended 31 December 2011
31. Wholly owned areas of interest cont.
The contribution of the consolidated entity’s areas of interest to EBIT (including exploration write-offs and impairments;
and excluding the effects of hedging):
Consolidated
2011 2010 US$’000 US$’000
– Chandeleur 31/32 587 786
– Main Pass 18 (2,792) (965)
– Main Pass 20 677 (245)
– Other Gulf of Mexico leases – (2,745)
– Spare equipment – (359)
(1,528) (3,528)
32. Reconciliation of cash fl ows from operating activities
Consolidated The Company
2011 2010 2011 2010 US$’000 US$’000 US$’000 US$’000
Cash fl ows from operating activities
Profi t/(loss) for the period 14,034 (35,237) (19,674) (51,856)
Adjustments for:
Depreciation, depletion and amortisation 5,204 12,496 12 13
Dry-hole, impairment and abandonment expense 20,229 19,456 – –
Repair expense – 142 – –
Net movement in fair value of investments 1,083 – – –
Net movement in provisions against investments
and loans to controlled entities – – 26,435 52,086
Management fee income – – (4,758) (857)
Dividend income – – (2,686) (2,787)
Profi t/(loss) from discontinued operation (29,807) 404 – –
Gain on discharge of debt (11,365) – – –
Net foreign exchange losses/(gains) 33 (368) (1,308) 1,741
Net loss/(gain) on property, plant and equipment (5) 5 – 4
Share-based payment expenses 28 173 24 76
Operating profi t before changes in working capital
and provisions (566) (2,929) (1,955) (1,580)
Decrease/(increase) in restricted cash deposits (925) (5,700) – –
Decrease/(Increase) in receivables and prepayments 1,798 2,123 (5,967) (2,681)
Decrease/(Increase) in deferred tax assets – 12,513 – –
(Decrease)/Increase in payables and provisions (6,902) (4,166) 10,570 3,532
Net cash from operating activities (6,595) 1,841 2,648 (729)
68
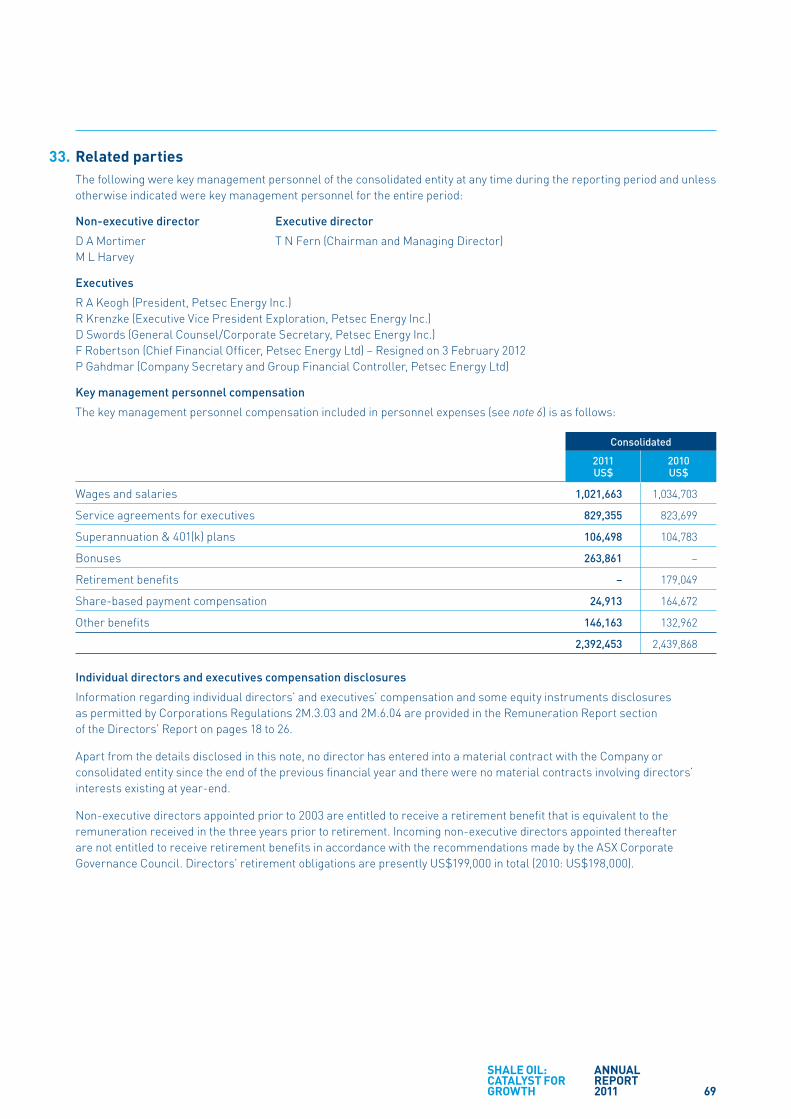
33. Related parties
The following were key management personnel of the consolidated entity at any time during the reporting period and unless
otherwise indicated were key management personnel for the entire period:
Non-executive director Executive director
D A Mortimer T N Fern (Chairman and Managing Director)
M L Harvey
Executives
R A Keogh (President, Petsec Energy Inc.)
R Krenzke (Executive Vice President Exploration, Petsec Energy Inc.)
D Swords (General Counsel/Corporate Secretary, Petsec Energy Inc.)
F Robertson (Chief Financial Offi cer, Petsec Energy Ltd) – Resigned on 3 February 2012
P Gahdmar (Company Secretary and Group Financial Controller, Petsec Energy Ltd)
Key management personnel compensation
The key management personnel compensation included in personnel expenses (see note 6) is as follows:
Consolidated
2011 2010 US$ US$
Wages and salaries 1,021,663 1,034,703
Service agreements for executives 829,355 823,699
Superannuation & 401(k) plans 106,498 104,783
Bonuses 263,861 –
Retirement benefi ts – 179,049
Share-based payment compensation 24,913 164,672
Other benefi ts 146,163 132,962
2,392,453 2,439,868
Individual directors and executives compensation disclosures
Information regarding individual directors’ and executives’ compensation and some equity instruments disclosures
as permitted by Corporations Regulations 2M.3.03 and 2M.6.04 are provided in the Remuneration Report section
of the Directors’ Report on pages 18 to 26.
Apart from the details disclosed in this note, no director has entered into a material contract with the Company or
consolidated entity since the end of the previous fi nancial year and there were no material contracts involving directors’
interests existing at year-end.
Non-executive directors appointed prior to 2003 are entitled to receive a retirement benefi t that is equivalent to the
remuneration received in the three years prior to retirement. Incoming non-executive directors appointed thereafter
are not entitled to receive retirement benefi ts in accordance with the recommendations made by the ASX Corporate
Governance Council. Directors’ retirement obligations are presently US$199,000 in total (2010: US$198,000).
SHALE OIL:CATALYST FOR GROWTH
ANNUAL REPORT 2011 69

NOTES TO THE CONSOLIDATEDFINANCIAL STATEMENTS CONT.
For the year ended 31 December 2011
33. Related parties cont.
Transactions with key management personnel
Key management personnel of the Company and their immediate relatives control approximately 17.4 percent of the voting
shares of the Company.
During the year, two key US management personnel were each issued 2,000,000 shares as long term incentive compensation.
The shares were issued at a price of A$0.20 per share and funded by a loan from the Company, repayable on or before
1 January 2016 and secured by a recourse promissory note bearing interest at the rate of 2.26% (U.S. based rate as the key
management personnel are U.S. residents). The shares are subject to a holding lock which prevents them from being sold
or assigned. For each of the two executives 1,000,000 shares were released from the holding lock on 1 January 2012, and
unless there is a prior change of control of the Company or involuntary cessation of employment of the key management
personnel, the shares will be released to each of the executives from the holding lock as follows:
i. 500,000 shares on 1 January 2013
ii. 500,000 shares on 1 January 2014
The shares were issued outside the Employee Share Plan as the executives are based in the U.S. and the plan was designed
specifi cally to meet Australian regulatory and taxation requirements. The progressive release of shares from the holding
lock is designed to assist with retention of the executives.
The aggregate amounts recognised during the year relating to key management personnel and their personally related
entities, were a total expense of US$830,000 (2010: US$824,000). Refer to Remuneration Report for further details.
Assets and liabilities arising from the above related party transactions
The Company
2011 2010 US$’000 US$’000
Non-current assets
Related party receivables 816 –
Current liabilities
Related party payables 56 3
Other related party disclosures
Information relating to subsidiaries is set out in note 27.
70
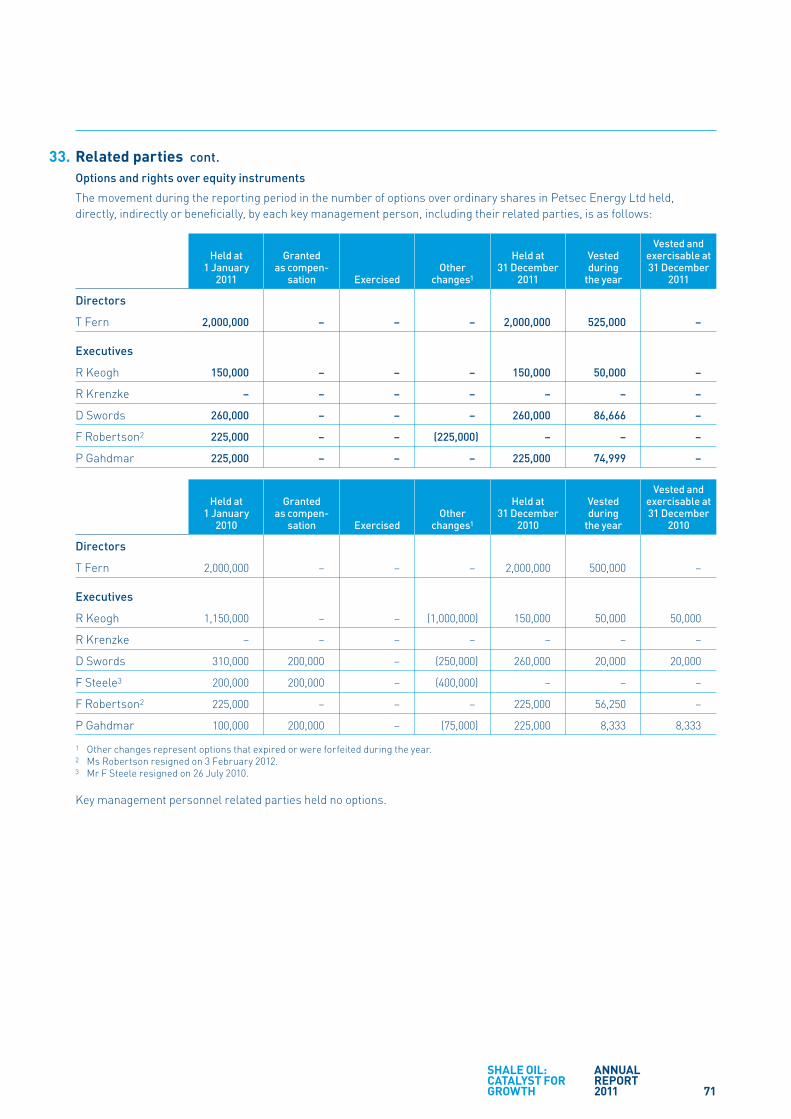
33. Related parties cont.
Options and rights over equity instruments
The movement during the reporting period in the number of options over ordinary shares in Petsec Energy Ltd held,
directly, indirectly or benefi cially, by each key management person, including their related parties, is as follows:
Vested and Held at Granted Held at Vested exercisable at 1 January as compen- Other 31 December during 31 December 2011 sation Exercised changes1 2011 the year 2011
Directors
T Fern 2,000,000 – – – 2,000,000 525,000 –
Executives
R Keogh 150,000 – – – 150,000 50,000 –
R Krenzke – – – – – – –
D Swords 260,000 – – – 260,000 86,666 –
F Robertson2 225,000 – – (225,000) – – –
P Gahdmar 225,000 – – – 225,000 74,999 –
Vested and Held at Granted Held at Vested exercisable at 1 January as compen- Other 31 December during 31 December 2010 sation Exercised changes1 2010 the year 2010
Directors
T Fern 2,000,000 – – – 2,000,000 500,000 –
Executives
R Keogh 1,150,000 – – (1,000,000) 150,000 50,000 50,000
R Krenzke – – – – – – –
D Swords 310,000 200,000 – (250,000) 260,000 20,000 20,000
F Steele3 200,000 200,000 – (400,000) – – –
F Robertson2 225,000 – – – 225,000 56,250 –
P Gahdmar 100,000 200,000 – (75,000) 225,000 8,333 8,333
1 Other changes represent options that expired or were forfeited during the year.2 Ms Robertson resigned on 3 February 2012.3 Mr F Steele resigned on 26 July 2010.
Key management personnel related parties held no options.
SHALE OIL:CATALYST FOR GROWTH
ANNUAL REPORT 2011 71

NOTES TO THE CONSOLIDATEDFINANCIAL STATEMENTS CONT.
For the year ended 31 December 2011
33. Related parties cont.
Movements in shares
The movement during the reporting period in the number of ordinary shares in Petsec Energy Ltd held, directly, indirectly
or benefi cially, by each key management person, including their related parties, is as follows:
Sales/ Held at Granted Received Disposal Held at 1 January as compen- on exercise of relevant 31 December 2011 sation Purchases of options interest 2011
Directors
T Fern 28,826,876 – – – – 28,826,876
D Mortimer 9,326,550 – – – – 9,326,550
M Harvey – – – – – –
Executives
R Keogh 1,612,500 2,000,000 – – – 3,612,500
R Krenzke 250,000 2,000,000 – – – 2,250,000
D Swords – – – – – –
F Robertson1 172,625 – – – – 172,625
P Gahdmar 120,000 – – – – 120,000
Sales/ Held at Granted Received Disposal Held at 1 January as compen- on exercise of relevant 31 December 2010 sation Purchases of options interest 2010
Directors
T Fern 28,826,876 – – – – 28,826,876
D Mortimer 9,326,550 – – – – 9,326,550
M Harvey – – – – – –
Executives
R Keogh 1,612,500 – – – – 1,612,500
R Krenzke – – 250,000 – – 250,000
D Swords – – – – – –
F Robertson1 172,625 – – – – 172,625
P Gahdmar 120,000 – – – – 120,000
1 Ms Robertson resigned on 3 February 2012.
34. Events subsequent to balance date
On 15 February 2012, Petsec Energy announced that it had agreed to participate in a shale oil project in Alberta, Canada
where it can earn a 24.5% working interest in leases covering 17,280 acres. To earn its interest in the leases, the Company
will pay 35% of the costs to drill one initial commitment well and 35% of the costs of drilling up to three optional wells.
The Company’s share of the drilling costs for the initial commitment well, which is expected to spud in early March 2012,
is approximately US$0.7 million.
Further details relating to the farm-in to the shale oil project are contained within the media release made to ASX
on 15 February 2012.
72
DIRECTORS’ DECLARATION
1 In the opinion of the directors of Petsec Energy Ltd (“the Company”):
(a) the fi nancial statements and notes and the Remuneration report in the Directors’ Report, set out on pages 18 to 72,
are in accordance with the Corporations Act 2001 including:
(i) giving a true and fair view of the fi nancial position of the Company and the consolidated entity as at 31 December
2011 and of their performance, as represented by the results of their operations and their cash fl ows, for the year
ended on that date; and
(ii) complying with Australian Accounting Standards and the Corporations Regulation 2001; and
(b) the fi nancial report also complies with International Financial Reporting Standards as disclosed in note 2; and
(c) there are reasonable grounds to believe that the Company will be able to pay its debts as and when they become
due and payable.
2 There are reasonable grounds to believe that the Company and the controlled entities identifi ed in Note 26 will be able
to meet any obligations or liabilities to which they are or may become subject to by virtue of the Deed of Cross Guarantee
between the Company and those controlled entities pursuant to ASIC Class Order 98/1418.
3 The directors have been given the declarations required by Section 295A of the Corporations Act 2001 from the chief
executive offi cer and chief fi nancial offi cer for the fi nancial year ended 31 December 2011.
Signed in accordance with a resolution of the directors:
T N Fern
Director
Sydney, 28 February 2012
SHALE OIL:CATALYST FOR GROWTH
ANNUAL REPORT 2011 73
INDEPENDENT AUDITOR’S REPORTto the members of Petsec Energy Ltd
74

SHALE OIL:CATALYST FOR GROWTH
ANNUAL REPORT 2011 75
CORPORATE GOVERNANCE STATEMENT
The Board of Petsec Energy Ltd (“Petsec”) is committed to good corporate governance.
This statement sets out the main corporate governance practices adopted by the Company in the format of the Corporate
Governance Principles and Recommendations (2nd Edition) (Recommendations) issued by the ASX Corporate Governance Council.
Unless otherwise stated, the Company’s corporate governance practices were in place throughout the 2011 year and
comply with the Recommendations. In a limited number of instances there are departures from the Recommendations,
with the details and reasons for the departures stated below in italics.
1. Laying Solid Foundations for Management and Oversight
The Board operates within the requirements of the Company’s Constitution and Board Charter which sets out the
functions and responsibilities reserved for the Board and the matters which have been delegated to executive management.
The Board Charter is posted on the Company’s website.
The performance of the CEO and senior executives is reviewed annually by the Nomination and Remuneration Committee
and is reported to and confi rmed by the full Board.
2. Structure the Board to Add Value
Board Composition and Director Independence
A majority of the Board are independent Directors. Currently the Board comprises three Directors, being one executive
Director and two non-executive Directors. The non-executive Directors are considered by the Board to be independent,
based on the criteria in the Recommendations.
Mr T N Fern acts in the roles of both Chairman and Managing Director. Although Recommendations 2.2 and 2.3 provide that
the Chairman should be an independent director and the roles of Chairman and Managing Director should not be exercised by the
same individual, Directors consider that the current composition of the Board is appropriate for the Company at its current stage
of development.
To ensure that independent judgment is achieved and maintained in respect of its decision-making processes, the Board
has adopted a number of measures which include the following:
• Directors are entitled to seek independent professional advice at the Company’s expense,
• Directors having a confl ict of interest in relation to a particular item of business must declare their interest and not vote
on that item of business and absent themselves from the Board Meeting if required by the Board before commencement
of discussion on the topic; and
• Non-executive Directors confer on a needs basis without management in attendance.
The Board is balanced in its composition with each Director bringing a range of complementary skills and experience
to the Company as set out in the Directors’ Report.
Board Committees
To assist the Board in discharging its responsibilities, the Board has a Nomination and Remuneration Committee and
an Audit Committee. Each of these committees has its own written charter which has been approved by the Board.
Both Committees comprise two independent Directors and are chaired by Mr D A Mortimer. The Company does not comply
with Recommendations 4.2 and 8.2, as the Audit Committee and the Nomination and Remuneration Committee do not have three
members, as the size of the Board does not allow for this.
It is the Board’s policy that Board Committees should:
• be chaired by a non-executive Director;
• should comprise a majority of non-executive Directors;
• be entitled to obtain independent professional or other advice at the cost of the Company; and
• be entitled to obtain such resources and information from the Company, including direct access to employees
of and advisors to the Company, as they may require.
76

The qualifi cations and experience of Directors and Committee Members are included in the Directors’ Report,
as are details of the number of Board and Committee meetings held during the year.
Evaluation of performance of the Board, its Committees and individual Directors
A review of the Board’s own performance is conducted annually, together with reviews of the performance of Board
Committees and individual Directors. Each Director completes a questionnaire, with the collective responses being
discussed by the Board to identify actions and goals to guide performance improvement. The questionnaire covers general
and governance issues, overall Board performance and performance of individual Directors. Each of these evaluations
has been performed during the past year.
Further details of the Company’s performance evaluation processes are detailed in the Board Charter and Nomination
and Remuneration Committee Charter, which are posted on the Company’s website.
3. Promoting Ethical and Responsible Decision Making
Code of Corporate Conduct
Petsec has always placed great importance on the maintenance of high ethical standards. The Board has adopted a Code
of Corporate Conduct which is contained within the Board Charter posted on the Company’s website. A similar document
has been issued to all employees setting out the principles and standards with which they are expected to comply. Petsec
participates in a “whistle-blower” programme with an independent third party which provides a means for staff to report
any violation of the Company’s Code of Ethics and Corporate Conduct or other wrongdoing.
The Company also has a Share Trading Policy, which is posted on the website.
Diversity
The Company adopted a Diversity Policy in August 2011, which is posted on the website. Notwithstanding the requirements
of Recommendations 2.6, 3.2, 3.3 and 3.4 to establish and disclose measurable objectives and results for achieving gender diversity,
the Board has not adopted any numerical benchmarks or targets, given the small size of the Company’s board and workforce.
The Company will reconsider the need for measurable objectives as it grows.
4. Safeguarding Integrity in Financial Reporting
The Audit Committee is comprised of two independent Directors, each with relevant fi nancial and technical experience,
and is chaired by Mr D A Mortimer. Details of the qualifi cations of the Audit Committee members are set out in the
Directors’ Report.
The responsibilities of the Audit Committee include the monitoring and review of the external audit function, management
reporting and internal controls, integrity of fi nancial reporting and risk management. The Committee’s Charter is posted
on the Company’s website.
The Audit Committee also appoints the auditor and monitors the 5-year auditor rotation policy, as set out in the Company’s
Auditor Appointment Policy posted on the website.
5. Making Timely and Balanced Disclosure
The Company has policies and procedures in place to ensure the timely and appropriate release of all information required
to be disclosed to shareholders in accordance with the ASX Continuous Disclosure regime. The Company Secretary has
been appointed as the Continuous Disclosure Offi cer and with the approval of the Managing Director is responsible for
ensuring compliance by overseeing and coordinating the release of information to the ASX, brokers, shareholders, the
media and the public. The Continuous Disclosure Policy is posted on the Company’s website.
SHALE OIL:CATALYST FOR GROWTH
ANNUAL REPORT 2011 77

6. Respecting the Rights of Shareholders
In addition to market disclosure through the ASX, Directors ensure that shareholders and other interested parties are
informed through a range of other means including the Company’s website at www.petsec.com.au which contains copies
of all key disclosure information including announcements to the market, periodic reports, broker and analyst briefi ngs
and notices of meetings. The website also contains corporate governance information and general information regarding
the Company’s activities.
Shareholders and other interested parties are also able to register their email address with the Company to receive
announcements made to the ASX.
It is the Company’s policy that its external auditors attend each Annual General Meeting and be available to respond
to questions from shareholders.
The Communications Policy is posted on the Company’s website.
7. Recognising and Managing Risk
The Company recognises that an effective system of risk oversight, management and internal control is critical
for its success.
A brief summary of the Company’s processes are set out below. A more detailed summary is posted in the Corporate
Governance section of the Company’s website.
(a) Control Environment
The Board oversees the overall risk management and control framework of the Company to ensure an appropriate control
environment is established and maintained spanning Petsec’s operations, fi nancial reporting and compliance activities.
The Audit Committee assists the Board in fulfi lling its responsibilities in this regard by reviewing and monitoring fi nancial
and reporting matters, and the Company’s risk management and internal control processes.
(b) Risk Assessment
Petsec runs two parallel risk management processes, one to identify and manage business and operational risk and the
other to manage the fi nancial reporting risks and underlying internal controls.
Identifi cation and evaluation of key business and operational risks is conducted through:
I. the annual risk management review, a formal process which is based on the approach prescribed in Australian Standard
AS/NZS ISO 31000:2009 and carried out in the fourth quarter each year in conjunction with the preparation of the budget
and strategic plan; and
II. assessment of risk as part of all business proposals for management or Board approval.
Key fi nancial statement and fi nancial reporting risks are reviewed and assessed, prior to the commencement of the internal
and external audit programmes each year.
(c) Mitigation and Control
Petsec employs a range of techniques to mitigate and control risk including insurance, oil and gas price hedging,
establishment of management accountabilities, and compliance with policies and procedures documented in the
Company’s Internal Control Policy manual and supporting documents.
(d) Information and Communication
Monthly management reports to the Board, which draw from both structured management information systems
and management input, provide a regular and formal channel of communication within Petsec.
CORPORATE GOVERNANCE STATEMENT CONT.
78

(e) Monitoring
Formal monitoring of risk and controls at senior management and Board level is achieved by means of:
I. the monthly management report to the Board;
II. detailed audit questionnaires and management sign-offs, which form part of the semi-annual audit process, and
III. an internal audit programme to evaluate and test the key controls over fi nancial reporting that is conducted over
the course of each year.
Petsec’s Managing Director and Chief Financial Offi cer have provided a written statement to the Audit Committee in relation
to each recent six-month reporting period in accordance with section 295A of the Corporations Act stating that, to the best
of their knowledge and belief:
• the declaration given is founded on a sound system of risk management and internal compliance and control which
implements the policies adopted by the Board; and
• the Company’s risk management and internal compliance and control framework is operating effi ciently and effectively
in all material respects.
8. Remunerate Fairly and Responsibly
The objective of the Company’s remuneration policies is to provide fair and competitive remuneration to its Board,
executives and staff in order for the Company to benefi t by attracting and retaining a high quality team. The level and
composition of Directors’ and senior executives’ remuneration is set out in the Remuneration Report in the Directors’
Report together with further information on the structure and basis of remuneration paid.
The Nomination and Remuneration Committee is responsible for reviewing and making recommendations on remuneration
policies for Directors and senior executives based on assessment of relevant market conditions, and linking remuneration
to the Company’s fi nancial and operational performance. The Nomination and Remuneration Committee consists of two
independent Directors, and is chaired by Mr D A Mortimer.
Executive remuneration may comprise salary, short term bonuses and share participation. All equity-based remuneration
is made in accordance with thresholds approved by shareholders.
Non-executive Directors are remunerated by fees which are not performance-based. Non-executive Directors appointed
prior to 2003 are entitled to receive a retirement allowance which is equivalent to the remuneration received in the three
years prior to retirement. Incoming non-executive Directors are not entitled to receive retirement benefi ts, in accordance
with the Recommendations.
SHALE OIL:CATALYST FOR GROWTH
ANNUAL REPORT 2011 79
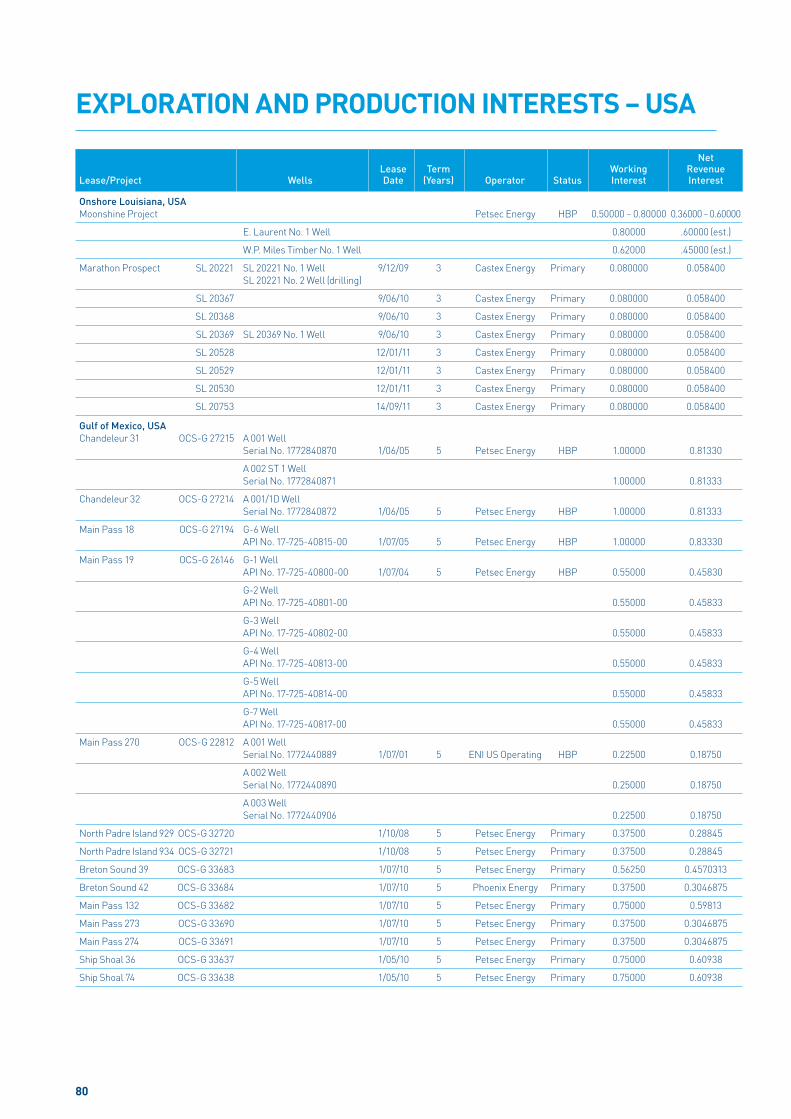
EXPLORATION AND PRODUCTION INTERESTS – USA
Net Lease Term Working RevenueLease/Project Wells Date (Years) Operator Status Interest Interest
Onshore Louisiana, USA
Moonshine Project Petsec Energy HBP 0.50000 – 0.80000 0.36000 – 0.60000
E. Laurent No. 1 Well 0.80000 .60000 (est.)
W.P. Miles Timber No. 1 Well 0.62000 .45000 (est.)
Marathon Prospect SL 20221 SL 20221 No. 1 Well 9/12/09 3 Castex Energy Primary 0.080000 0.058400
SL 20221 No. 2 Well (drilling)
SL 20367 9/06/10 3 Castex Energy Primary 0.080000 0.058400
SL 20368 9/06/10 3 Castex Energy Primary 0.080000 0.058400
SL 20369 SL 20369 No. 1 Well 9/06/10 3 Castex Energy Primary 0.080000 0.058400
SL 20528 12/01/11 3 Castex Energy Primary 0.080000 0.058400
SL 20529 12/01/11 3 Castex Energy Primary 0.080000 0.058400
SL 20530 12/01/11 3 Castex Energy Primary 0.080000 0.058400
SL 20753 14/09/11 3 Castex Energy Primary 0.080000 0.058400
Gulf of Mexico, USA
Chandeleur 31 OCS-G 27215 A 001 Well
Serial No. 1772840870 1/06/05 5 Petsec Energy HBP 1.00000 0.81330
A 002 ST 1 Well
Serial No. 1772840871 1.00000 0.81333
Chandeleur 32 OCS-G 27214 A 001/1D Well
Serial No. 1772840872 1/06/05 5 Petsec Energy HBP 1.00000 0.81333
Main Pass 18 OCS-G 27194 G-6 Well
API No. 17-725-40815-00 1/07/05 5 Petsec Energy HBP 1.00000 0.83330
Main Pass 19 OCS-G 26146 G-1 Well
API No. 17-725-40800-00 1/07/04 5 Petsec Energy HBP 0.55000 0.45830
G-2 Well
API No. 17-725-40801-00 0.55000 0.45833
G-3 Well
API No. 17-725-40802-00 0.55000 0.45833
G-4 Well
API No. 17-725-40813-00 0.55000 0.45833
G-5 Well
API No. 17-725-40814-00 0.55000 0.45833
G-7 Well
API No. 17-725-40817-00 0.55000 0.45833
Main Pass 270 OCS-G 22812 A 001 Well
Serial No. 1772440889 1/07/01 5 ENI US Operating HBP 0.22500 0.18750
A 002 Well
Serial No. 1772440890 0.25000 0.18750
A 003 Well
Serial No. 1772440906 0.22500 0.18750
North Padre Island 929 OCS-G 32720 1/10/08 5 Petsec Energy Primary 0.37500 0.28845
North Padre Island 934 OCS-G 32721 1/10/08 5 Petsec Energy Primary 0.37500 0.28845
Breton Sound 39 OCS-G 33683 1/07/10 5 Petsec Energy Primary 0.56250 0.4570313
Breton Sound 42 OCS-G 33684 1/07/10 5 Phoenix Energy Primary 0.37500 0.3046875
Main Pass 132 OCS-G 33682 1/07/10 5 Petsec Energy Primary 0.75000 0.59813
Main Pass 273 OCS-G 33690 1/07/10 5 Petsec Energy Primary 0.37500 0.3046875
Main Pass 274 OCS-G 33691 1/07/10 5 Petsec Energy Primary 0.37500 0.3046875
Ship Shoal 36 OCS-G 33637 1/05/10 5 Petsec Energy Primary 0.75000 0.60938
Ship Shoal 74 OCS-G 33638 1/05/10 5 Petsec Energy Primary 0.75000 0.60938
80
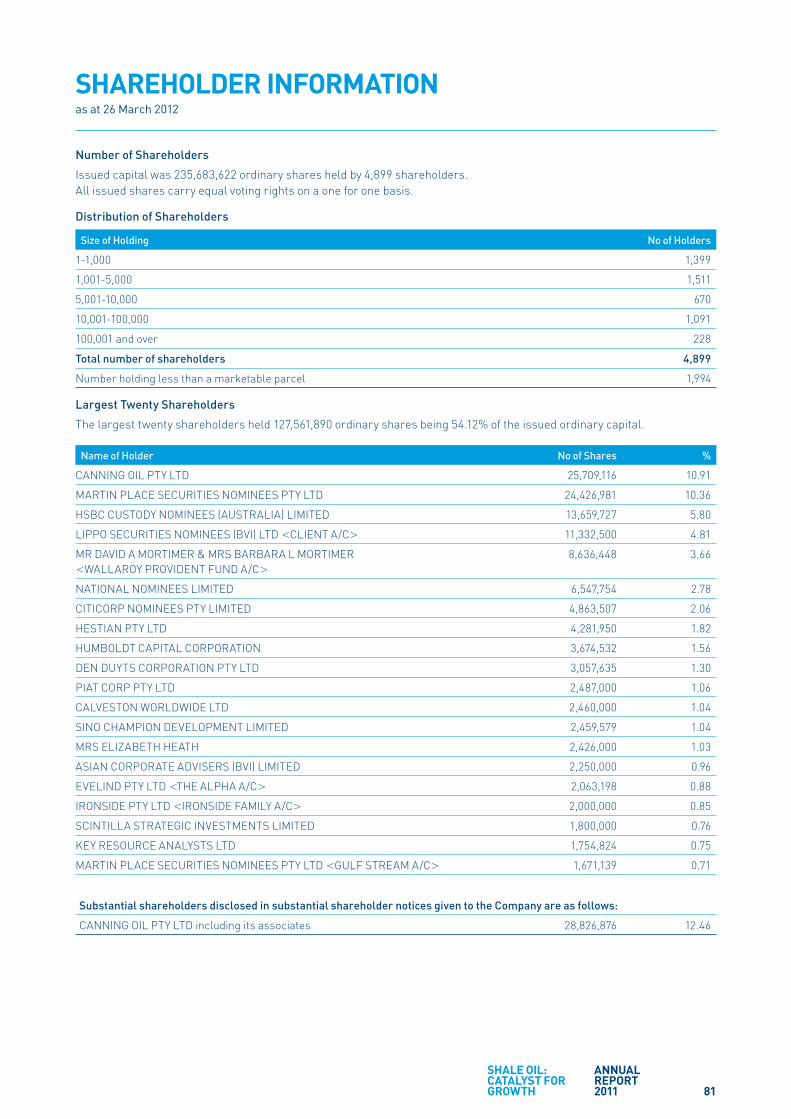
SHAREHOLDER INFORMATIONas at 26 March 2012
Number of Shareholders
Issued capital was 235,683,622 ordinary shares held by 4,899 shareholders.
All issued shares carry equal voting rights on a one for one basis.
Distribution of Shareholders
Size of Holding No of Holders
1-1,000 1,399
1,001-5,000 1,511
5,001-10,000 670
10,001-100,000 1,091
100,001 and over 228
Total number of shareholders 4,899
Number holding less than a marketable parcel 1,994
Largest Twenty Shareholders
The largest twenty shareholders held 127,561,890 ordinary shares being 54.12% of the issued ordinary capital.
Name of Holder No of Shares %
CANNING OIL PTY LTD 25,709,116 10.91
MARTIN PLACE SECURITIES NOMINEES PTY LTD 24,426,981 10.36
HSBC CUSTODY NOMINEES (AUSTRALIA) LIMITED 13,659,727 5.80
LIPPO SECURITIES NOMINEES (BVI) LTD <CLIENT A/C> 11,332,500 4.81
MR DAVID A MORTIMER & MRS BARBARA L MORTIMER
<WALLAROY PROVIDENT FUND A/C>8,636,448 3.66
NATIONAL NOMINEES LIMITED 6,547,754 2.78
CITICORP NOMINEES PTY LIMITED 4,863,507 2.06
HESTIAN PTY LTD 4,281,950 1.82
HUMBOLDT CAPITAL CORPORATION 3,674,532 1.56
DEN DUYTS CORPORATION PTY LTD 3,057,635 1.30
PIAT CORP PTY LTD 2,487,000 1.06
CALVESTON WORLDWIDE LTD 2,460,000 1.04
SINO CHAMPION DEVELOPMENT LIMITED 2,459,579 1.04
MRS ELIZABETH HEATH 2,426,000 1.03
ASIAN CORPORATE ADVISERS (BVI) LIMITED 2,250,000 0.96
EVELIND PTY LTD <THE ALPHA A/C> 2,063,198 0.88
IRONSIDE PTY LTD <IRONSIDE FAMILY A/C> 2,000,000 0.85
SCINTILLA STRATEGIC INVESTMENTS LIMITED 1,800,000 0.76
KEY RESOURCE ANALYSTS LTD 1,754,824 0.75
MARTIN PLACE SECURITIES NOMINEES PTY LTD <GULF STREAM A/C> 1,671,139 0.71
Substantial shareholders disclosed in substantial shareholder notices given to the Company are as follows:
CANNING OIL PTY LTD including its associates 28,826,876 12.46
SHALE OIL:CATALYST FOR GROWTH
ANNUAL REPORT 2011 81
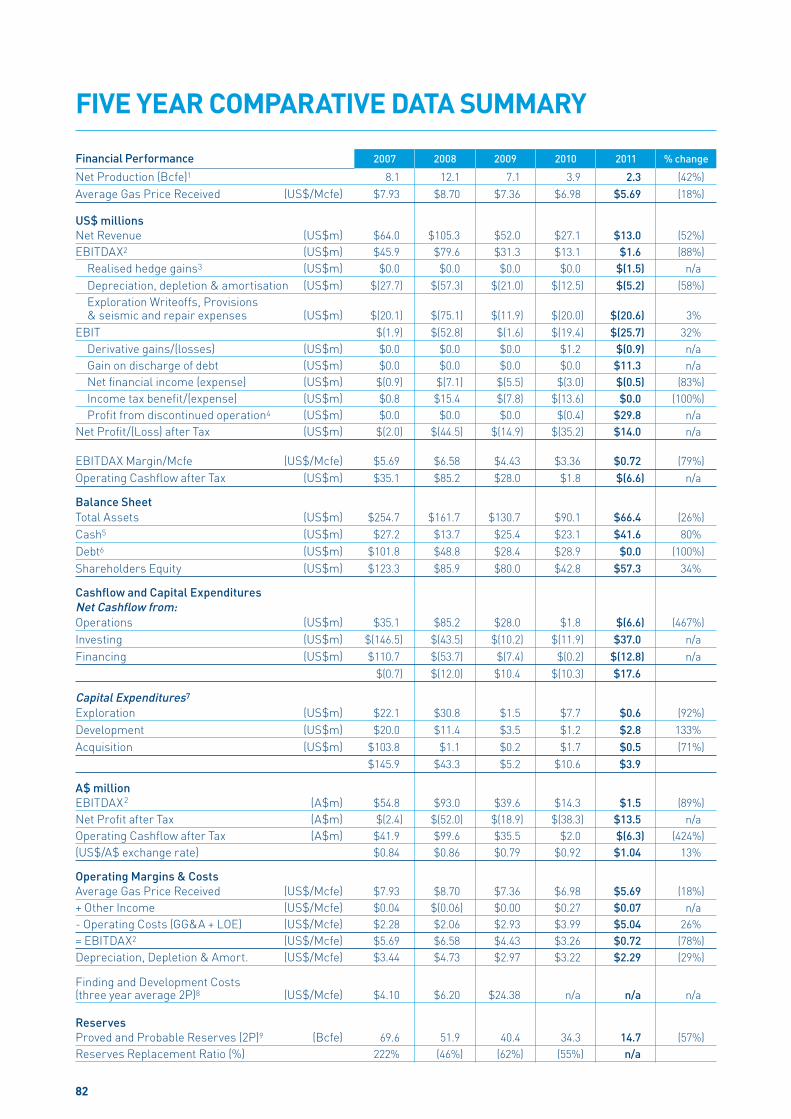
Financial Performance 2007 2008 2009 2010 2011 % change
Net Production (Bcfe)1 8.1 12.1 7.1 3.9 2.3 (42%)
Average Gas Price Received (US$/Mcfe) $7.93 $8.70 $7.36 $6.98 $5.69 (18%)
US$ millions
Net Revenue (US$m) $64.0 $105.3 $52.0 $27.1 $13.0 (52%)
EBITDAX2 (US$m) $45.9 $79.6 $31.3 $13.1 $1.6 (88%)
Realised hedge gains3 (US$m) $0.0 $0.0 $0.0 $0.0 $(1.5) n/a
Depreciation, depletion & amortisation (US$m) $(27.7) $(57.3) $(21.0) $(12.5) $(5.2) (58%)
Exploration Writeoffs, Provisions & seismic and repair expenses (US$m) $(20.1) $(75.1) $(11.9) $(20.0) $(20.6) 3%
EBIT $(1.9) $(52.8) $(1.6) $(19.4) $(25.7) 32%
Derivative gains/(losses) (US$m) $0.0 $0.0 $0.0 $1.2 $(0.9) n/a
Gain on discharge of debt (US$m) $0.0 $0.0 $0.0 $0.0 $11.3 n/a
Net fi nancial income (expense) (US$m) $(0.9) $(7.1) $(5.5) $(3.0) $(0.5) (83%)
Income tax benefi t/(expense) (US$m) $0.8 $15.4 $(7.8) $(13.6) $0.0 (100%)
Profi t from discontinued operation4 (US$m) $0.0 $0.0 $0.0 $(0.4) $29.8 n/a
Net Profi t/(Loss) after Tax (US$m) $(2.0) $(44.5) $(14.9) $(35.2) $14.0 n/a
EBITDAX Margin/Mcfe (US$/Mcfe) $5.69 $6.58 $4.43 $3.36 $0.72 (79%)
Operating Cashfl ow after Tax (US$m) $35.1 $85.2 $28.0 $1.8 $(6.6) n/a
Balance Sheet
Total Assets (US$m) $254.7 $161.7 $130.7 $90.1 $66.4 (26%)
Cash5 (US$m) $27.2 $13.7 $25.4 $23.1 $41.6 80%
Debt6 (US$m) $101.8 $48.8 $28.4 $28.9 $0.0 (100%)
Shareholders Equity (US$m) $123.3 $85.9 $80.0 $42.8 $57.3 34%
Cashfl ow and Capital Expenditures
Net Cashfl ow from:
Operations (US$m) $35.1 $85.2 $28.0 $1.8 $(6.6) (467%)
Investing (US$m) $(146.5) $(43.5) $(10.2) $(11.9) $37.0 n/a
Financing (US$m) $110.7 $(53.7) $(7.4) $(0.2) $(12.8) n/a
$(0.7) $(12.0) $10.4 $(10.3) $17.6
Capital Expenditures7
Exploration (US$m) $22.1 $30.8 $1.5 $7.7 $0.6 (92%)
Development (US$m) $20.0 $11.4 $3.5 $1.2 $2.8 133%
Acquisition (US$m) $103.8 $1.1 $0.2 $1.7 $0.5 (71%)
$145.9 $43.3 $5.2 $10.6 $3.9
A$ million
EBITDAX 2 (A$m) $54.8 $93.0 $39.6 $14.3 $1.5 (89%)
Net Profi t after Tax (A$m) $(2.4) $(52.0) $(18.9) $(38.3) $13.5 n/a
Operating Cashfl ow after Tax (A$m) $41.9 $99.6 $35.5 $2.0 $(6.3) (424%)
(US$/A$ exchange rate) $0.84 $0.86 $0.79 $0.92 $1.04 13%
Operating Margins & Costs
Average Gas Price Received (US$/Mcfe) $7.93 $8.70 $7.36 $6.98 $5.69 (18%)
+ Other Income (US$/Mcfe) $0.04 $(0.06) $0.00 $0.27 $0.07 n/a
- Operating Costs (GG&A + LOE) (US$/Mcfe) $2.28 $2.06 $2.93 $3.99 $5.04 26%
= EBITDAX2 (US$/Mcfe) $5.69 $6.58 $4.43 $3.26 $0.72 (78%)
Depreciation, Depletion & Amort. (US$/Mcfe) $3.44 $4.73 $2.97 $3.22 $2.29 (29%)
Finding and Development Costs(three year average 2P)8 (US$/Mcfe) $4.10 $6.20 $24.38 n/a n/a n/a
Reserves
Proved and Probable Reserves (2P)9 (Bcfe) 69.6 51.9 40.4 34.3 14.7 (57%)
Reserves Replacement Ratio (%) 222% (46%) (62%) (55%) n/a
FIVE YEAR COMPARATIVE DATA SUMMARY
82

1 Bcfe = billion cubic feet of gas equivalent. Mcfe = thousand cubic feet of gas equivalent.
2 EBITDAX = earnings before interest (fi nancial income and expense), income tax, depreciation, depletion, amortisation, rehabilitation and
exploration (including dry hole, impairment and abandonment expense, seismic and repair expense) and realised hedge gains.
3 Realised hedge gains relate to derivative natural gas collar contracts which settled during the period. The Company has included the impact
of the realised hedge gains, in the reported Net Revenue and EBITDAX amounts in the above table and elsewhere in the Directors’ Report
and Full Year Financial Statements to better refl ect the commercial impact and rationale for holding these derivative instruments.
4 Profi t from discontinued operation refl ects the accounting gain recognised on the disposal of the wholly owned subsidairy which held
the China oil interests.
5 Includes US$6.6m of cash deposits held in an escrow account to partially secure US$7.4 million of operator bonds that are on issue to the
Bureau of Ocean Energy Management, restricted cash deposits used to collaterise letter of credit amounts in excess of the Company’s bank
borrowing base facility and amounts held in escrow to Regulation and Enforcement (“BOEMRE”).
6 2007 through 2010 debt is shown net of original issue discount and transaction costs (refer note 18 – Borrowings of the notes to the consolidated
fi nancial statements).
7 Excludes minor (non oil & gas) property, plant & equipment expenditure and investments.
8 Finding & Development (F&D) costs include all exploration writeoffs. 2007 through 2009 includes the cost of acquiring interests in producing
assets in 2007.
9 Petsec Energy – estimated recoverable proved and probable (2P) reserves. Current period decrease refl ects disposal of previously booked
China oil reserves in June 2011.
SHALE OIL:CATALYST FOR GROWTH
ANNUAL REPORT 2011 83
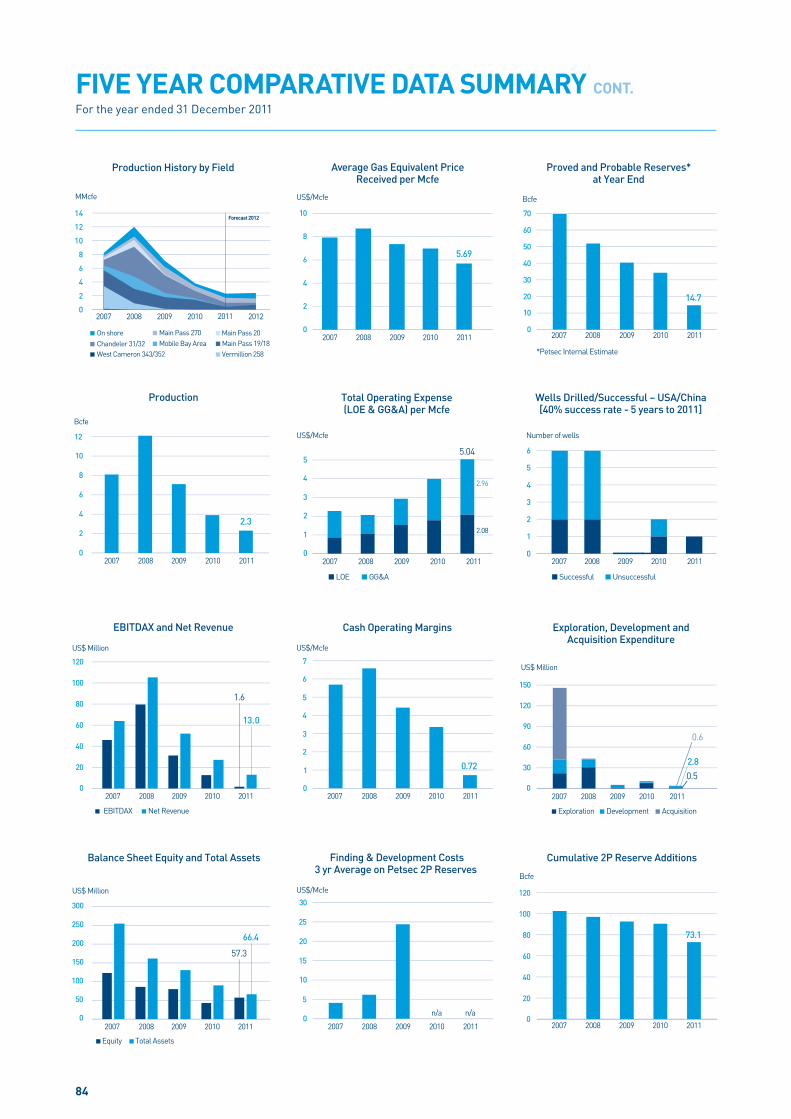
FIVE YEAR COMPARATIVE DATA SUMMARY CONT.
For the year ended 31 December 2011
0
20
40
60
80
100
120
20112010200920082007
Cumulative 2P Reserve Additions
Bcfe
73.1
0
1
2
3
4
5
6
7
20112010200920082007
Cash Operating Margins
US$/Mcfe
0.72
0
20
40
60
80
100
120
20112010200920082007
EBITDAX Net Revenue
EBITDAX and Net Revenue
US$ Million
1.6
13.0
0
30
60
90
120
150
20112010200920082007
Exploration, Development andAcquisition Expenditure
US$ Million
2.8
0.5
0.6
Exploration Development Acquisition
0
5
10
15
20
25
30
20112010200920082007
n/an/a
Finding & Development Costs3 yr Average on Petsec 2P Reserves
US$/Mcfe
0
2
4
6
8
10
12
14
20122010200920082007 2011
Main Pass 20Chandeler 31/32 Mobile Bay AreaOn shore
Main Pass 19/18Main Pass 270
West Cameron 343/352 Vermillion 258
Forecast 2012
Production History by Field
MMcfe
0
2
4
6
8
10
12
20112010200920082007
Bcfe
Production
2.3
0
10
20
30
40
50
60
70
20112010200920082007
Proved and Probable Reserves*at Year End
Bcfe
14.7
*Petsec Internal Estimate
0
1
2
3
4
5
20112010200920082007
Total Operating Expense(LOE & GG&A) per Mcfe
US$/Mcfe
2.96
2.08
5.04
LOE GG&A
0
2
4
6
8
10
20112010200920082007
Average Gas Equivalent PriceReceived per Mcfe
US$/Mcfe
5.69
0
50
100
150
200
250
300
20112010200920082007
Equity Total Assets
Balance Sheet Equity and Total Assets
US$ Million
66.4
57.3
Wells Drilled/Successful – USA/China[40% success rate - 5 years to 2011]
Number of wells
Successful Unsuccessful
0
1
2
3
4
5
6
20112010200920082007
84
PETSEC ENERGY LTD CORPORATE DIRECTORY
Board of Directors
Terry N Fern – Chairman & Managing Director
Mike L Harvey – Non-executive Director
David A Mortimer – Non-executive Director
Company Secretary
Paul Gahdmar
Australian Management
Paul Gahdmar – Company Secretary & Group
Financial Controller
USA Management
Ross A Keogh – President, Petsec Energy Inc.
and Group Chief Financial Offi cer
Ron A Krenzke – Executive Vice President – Exploration
Patrick Webb – Vice President Business Development and Land
Registered Offi ce and Principal Business Offi ce
Level 13, 1 Alfred Street
Sydney NSW 2000 Australia
Telephone: +61 2 9247 4605
Facsimile: +61 2 9251 2410
USA Offi ces
1000 Louisiana
Suite 5550
Houston, TX 77002
Telephone: +1 713 457 5800
Facsimile: +1 713 457 5838
3861 Ambassador Caffery Parkway
Suite 500
Lafayette, LA 70503
Telephone: +1 337 989 1942
Facsimile: +1 337 989 7271
Share Register
Boardroom Pty Limited
Offi ce: Level 7, 207 Kent Street, Sydney NSW 2000 Australia
Postal: GPO Box 3993, Sydney NSW 2001
Telephone: 1300 737 760
International: +61 2 9290 9600
Facsimile: 1300 653 459
International: +61 2 9279 0664
Email: [email protected]
Depositary Receipts Register
The Bank of New York
6th Floor
620 Avenue of the Americas
New York NY 10011 USA
Telephone: +1 646 885 3300
Facsimile: +1 646 885 3043
Auditors
KPMG Chartered Accountants
King Street Wharf
10 Shelley Street
Sydney NSW 2000 Australia
Stock Exchange
Listed on the Australian Stock Exchange, Symbol: PSA Traded
in USA on ADRs, Symbol: PSJEY
For further information
Web: www.petsec.com.au
www.colliercreative.com.au #PET0002 85

PETSEC ENERGY LTDABN 92 000 602 700
Certain statements in this report regarding future expectations and plans of the Company may be regarded as ‘forward-looking statements.’Although the Company believes that its expectations and plans are based upon reasonable assumptions, it can give no assurance that its goals will be met. Actual results may vary signifi cantly from those anticipated due to many factors, including oil and gas prices, operating hazards, drilling risks, environmental risks and uncertainties in interpreting engineering and other data relating to oil and gas reservoirs, as well as other risks.