shallow seismic reflection survey at wickiup dam in ... subject to seg license or copyright; ......
TRANSCRIPT

SHALLOW SEISMIC REFLECTION SURVEY AT WICKIUP DAM IN CENTRAL OREGON
Richard D. Miller, Kansas Geological Survey, 1930 Constant Avenue, Lawrence, Kansas 66047 Richard D. Markiewicz, U.S. Bureau of Reclamation, P.O. Box 25007, m/s D8330,
Denver, Colorado 80225
ABSTRACT
Concerns about potential liquefaction and resulting flowslide type failures at Wickiup Dam in Central Oregon prompted geophysical studies of the left wing dike, studies which includ- ed a high resolution seismic reflection survey. High resolution seismic reflection data effectively delineated structures and correlated lithologies to shallow borehole data above the surface of the dipping, basalt bedrock on the downstream side of the dam. Unconsolidated, Quaternary lacus- nine, fluvial, and volcanic-derived sediments overlay the bedrock surface, which is encountered within 50 feet of the ground surface near the dam outlet works and plunges to depths of at least 1000 fi below ground surface 5000 ft west of the outlet works. Sediments that filled the seis- mically defined bedrock surface possess a wide range of bedding geometries likely indicative of multiple episodes of erosion and deposition, driven by the modern and ancestral Deschutes River system. Dominant frequencies in excess of 250 Hz evident on stacked sections provide vertical bed resolution on the order of 10 ft at depths of over 900 ft. Layering interpreted on stacked seismic data within the basaltic bedrock has been inferred to represent contacts between different basalt flow episodes and volcanic sediments (ash, cinder, etc.) originating from Wickiup Butte.
Frequency inversions, which are common indicators of inappropriately stackedinter- preted seismic sections, evident on these stacked data are actual inversions that can be verified by correlating the stacked sections with shot gathers, a process rarely possible on high resolution stacked seismic sections. If geologic interpretations, instrumental in engineering designs for resistance to seismic loading, would have been based on existing drill data from the upper 300 ft alone, a relatively flat laying, cyclic sequence of sands, gravels, volcanic ash, silt, and clay over- lying the mudflow and basalt materials would have been inferred to an estimated depth of several hundred to more than one thousand feet. Seismic data provided an extremely detailed image of the subsurface, delineating channel features within the sediments and a dipping basalt bedrock surface. Amplification potential of these kinds of geometries may impact the levels of expected ground motion for a given size seismic event.
INTRODUCTION
Understanding and quantifying the properties of shallow subsurface materials are critical to characterizations used for design and retrofitting of structures to withstand expected ground motions. Dam safety is a high priority and concerns about the Wickiup Dam’s performance during potential earthquakes and flooding prompted the Bureau of Reclamation to embark on an extensive drilling and geophysical site characterization program. Prior to commencing the study at Wickiup, potentially liquefiable foundation materials had been identified at the dam along the left wing dike.
1246
Dow
nloa
ded
07/0
3/14
to 1
29.2
37.1
43.2
0. R
edis
trib
utio
n su
bjec
t to
SEG
lice
nse
or c
opyr
ight
; see
Ter
ms
of U
se a
t http
://lib
rary
.seg
.org
/

Wickiup Dam, dikes, and appurtenant structures were constructed between 1939 and 1949 and are located 30 miles southwest of Bend, Oregon, in Deschutes County, on the Deschutes River (Figure 1). Inflows to the reservoir are significantly impacted by releases from Crane Prairie Dam, located approximately 2 miles upstream from Wickiup Reservoir. The dam is a zoned, rolled earthfill embankment and has a structural height of 100 feet. The foundation of the dam consists of volcanic bedrock (primarily basalt) overlain by layers of sands, gravels, silts and clays, with variable amounts of volcanic debris (lava, tuff breccia, and pumice). The majority of the 13,860-foot long dam is less than 40 feet high. Seepage and major leaks through the foundation of the dam have been a continual problem since the first filling of the reservoir.
- High resolution seismic reflection was one of a variety of geophysical techniques employed at Wickiup Dam. Seismic reflection data were intended to delineate the bedrock sur- face and provide improved correlations between existing as well as future boreholes. High- resolution seismic reflection techniques possessed the necessary resolution potential to both map the bedrock surface and delineate the intricate bedding geometries likely present but perhaps undetected in the borehole data at this site. Of secondary concern was faulting interpreted from potential fields data to be present at the surface of bedrock. High resolution seismic reflection is a non-invasive geophysical technique that relies on the introduction, reflection from subsurface geologic contacts (represented by changes in density and/or velocity), and recording of broad band, higher frequency (~80 Hz) sound waves especially suited for delineating thin beds and laterally small targets. Near-surface applications of high resolution seismic reflection have been quite successful delineating thin layers (Miller et al,, 1995; Gochioco, 1991; Gochioco, 1992), and mapping bedrock (Pullan and Hunter, 1990; Miller et al., 1989). These documented suc- cesses of high resolution seismic reflection were effectively extended to this relatively thin (5 ft), extremely dry, unsorted vadose zone setting.
GEOLOGY AND LIQUEFACTION POTENTIAL
Wickiup Dam was constructed across a deep section of the meandering valley of the main stem of the Deschutes River at the toe of Wickiup Butte (U.S. Bureau of Reclamation, 1997). The right abutment of the dam is founded on basaltic lava flows which erupted from Wickiup Butte (QTb), and on an overlying material described as mudflow debris (QTmd) (Figure 1). The channel section of the main dam and the entire left abutment, including the left wing dike, are founded on bedded fluviolacustrine sediments (Qf) which include interbedded layers of sand (Qfs), gravel (Qfg), volcanic ash (Qfv), diatomaceous silt (Qfd), dense silt and sand (Qfds), and clay and silt (Qfc). A surficial mantle of Mazama Ash (Qma) that ranges from 3 to 5 feet thick blankets the area, but was removed from the foundation beneath the dam in most areas.
The liquefaction potentials of the foundation materials at Wickiup Dam have been primarily based on data from standard penetration tests and cone penetrometer tests performed during several geologic investigation programs (U.S. Bureau of Reclamation, 1993). Investi- gations and analysis for the left wing dike have concluded that significant areas of potentially liquefiable materials are present in the foundation of the left wing dike for most of its length (LaForge, 1994). Analyses show that liquefaction of the foundation materials could cause insta- bility of the dike resulting in flow&de type failures. Large deformations resulting from these
1247
Dow
nloa
ded
07/0
3/14
to 1
29.2
37.1
43.2
0. R
edis
trib
utio
n su
bjec
t to
SEG
lice
nse
or c
opyr
ight
; see
Ter
ms
of U
se a
t http
://lib
rary
.seg
.org
/

4360
4200
I A
Figure 1. Site map and generalized geologic cross-section for drill holes near the outlet works.
Dow
nloa
ded
07/0
3/14
to 1
29.2
37.1
43.2
0. R
edis
trib
utio
n su
bjec
t to
SEG
lice
nse
or c
opyr
ight
; see
Ter
ms
of U
se a
t http
://lib
rary
.seg
.org
/

flowslide type failures could cause overtopping, or transverse cracking, which could then lead to internal erosion of embankment materials and eventual failure of the embankment.
ACQUISITION
The 24-fold data were acquired using a standard CMP roll-along technique employing a 4%channel Geometries Strataview and variable sized charges of Kinepak’ high explosive. Station spacings, shotpoint intervals, charge size, and charge depths were selected based on a series of walkaway tests performed during and prior to acquisition of production data. This approach was used to insure the data were optimized for both resolution and penetration depths. An uphole survey, using a single hydrophone suspended in an existing borehole located along the seismic profile, was conducted to provide a confident tie between average velocity and NM0 velocity in the shallowest portion of the imaged section. Based on both the drill-determined and geologist-interpreted dip on the bedrock surface, data were recorded end-on with a source to nearest receiver distance ranging from 65 ft on the west to 25 Et on the east, a spread length of 470 ft, and an up-dip shooting orientation.
Seismograph settings were selected to avoid aliasing and capture energy returning from within the shallower portion of the basaltic bedrock. A total of six 40 Hz receivers were deployed along about a 3 ft spread, with each receiver group separated by 10 ft. This spacing was a compromise between a need to resolve the shallow (~300 ft) stratigraphy interpreted in the borings along the line and record the bedrock reflection all within the optimum offset window (Hunter et al., 1984) contrasted with the limited number of recording channels. Shot station spacing was selected based on the need for near offset traces to resolve the shallow structure, concerns that the powdery near surface would require higher fold to maintain the minimal signal- to-noise requirements, and productivity. In hind site, signal-to-noise ratio would have easily been sufficient with 20 ft spacing, which in turn would have permitted the line to be extended, possibly allowing imaging of the bedrock dip reversal suspected to form the opposing side of the bedrock basin and very likely beginning just off the west end of the existing profile. Shot charges were nominally buried 5 ft below ground surface and ranged in size from l/6 to 1 lb depending on the depth to bedrock as calculated from shot gathers and the apparent amplitude/signal-to- noise ratio of the bedrock reflection. Each shot record was analyzed as it was recorded to insure the highest QC possible.
DATA PROCESSING
Data from this study were processed on an Intel Pentium-based microcomputer using WinSeis, a set of commercially available algorithms. It is becoming exceedingly important as shallow seismic data processing capabilities expand throughout the commercial and academic communities that only operations or processes be used that enhance the signal-to-noise ratio and/or resolution potential. Verification that coherent events on stacked sections are reflection requires careful evaluation of high-confidence reflections identified on field files and traced throughout the processing sequence.
‘Trade names for equipment and services are given for information purposes only and do not constitute an endorsement by the Kansas Geological Survey or the Bureau of Reclamation.
1249
Dow
nloa
ded
07/0
3/14
to 1
29.2
37.1
43.2
0. R
edis
trib
utio
n su
bjec
t to
SEG
lice
nse
or c
opyr
ight
; see
Ter
ms
of U
se a
t http
://lib
rary
.seg
.org
/

Most CDP processing steps used for this study were a simple scaling down of established petroleum-based processing techniques and methods (Yilmaz, 1987; Steeples and Miller, 1990). The main distinctions in the processing flow of this data as compared to basic petroleum flows relate to the conservative use and application of correlation statics, avoidance of deconvolution, precision required during velocity and spectral analysis, and the accuracy of the muting opera- tions. A very low (by conventional standards) allowable NM0 stretch (< 20%) was extremely critical in minimizing contributions from the very shallow reflected energy at offsets signiti- cantly beyond the critical angle. Limiting wavelet stretch through muting maximizes resolution potential and minimizes distortion in the stacked wavelets. Complex geometries that change quite rapidly across this profile required the velocity function be defined on 20 CMP intervals and every 50 msec or so. This extremely detailed velocity function was necessary to obtain the wavelet characteristics observed on the stacked section. Processing/processes used on this data have been carefully executed with no a priori assumptions. Extreme care was taken to enhance through processing only what can be identified on shot gathers and not to create coherency on stacked sections.
RESULTS
Unequivocal identification and verification of reflections on shot gathers is not only necessary, it is mandatory for meaningful interpretations of near-surface seismic data (Figure 2). The most conclusive means to both verify and analyze reflections is to match modeled NM0 curves (based on uphole velocity information when possible) with reflection hyperbola inter- preted on shot gathers. This combination incorporates ground truth (borehole-determined veloc- ity), geometric curve fitting (forward and inverse modeling), and event identification directly from single-fold shot gather data. Too many times the power of seismic processing software and lack of careful attention to detail results in stacked seismic reflection data that inaccurately represent the subsurface, and is ustified by happenstance, consistency with existing drill data, and geologists’ models.
Reflections are prevalent on raw shot gathers from across this entire 4000 ft long profile (Figure 2A). Bandwidth, dominant frequency, and signal-to-noise ratio change quite dramatically from one end of the profile to the other. Most of this change can be directly attributed to vari- ability in the upper 5 fi, charge size, and ground elevation relative to the piezometric surface. The ground surface became much harder (compacted road bed) near the low numbered end of the line as the piezometric surface got further below ground surface. This likely explains the more pronounced refraction and increase in guided wave energy. The percentage of groundroll to body wave is quite high near the low numbered (southeast) end of the profile when compared to the high numbered (northwest) end of the line. Percentage of groundroll to body wave, however, cannot be completely related to a deepening piezometric surface or increased compaction. Groundroll amplitudes are comparable at CMP 925 on the far northwest with those at CMP 440 in the southeast where the compaction and depth to water increases. It is likely that the signifi- cant increase in guided wave energy is related to both factors. Reflections on raw shot records easily provide the confidence necessary to experiment with signal-to-noise ratio and wavelet enhancement processes to optimize these data.
1250
Dow
nloa
ded
07/0
3/14
to 1
29.2
37.1
43.2
0. R
edis
trib
utio
n su
bjec
t to
SEG
lice
nse
or c
opyr
ight
; see
Ter
ms
of U
se a
t http
://lib
rary
.seg
.org
/

CMP number
(4
Figure 2. Raw shot gathers (A) identified by equivalent CMP number showing general characteristic and wave field across line. Spectral balanced shot gathers (B) clearly show the broad spectrum and dominant nature of reflections.
.I
Dow
nloa
ded
07/0
3/14
to 1
29.2
37.1
43.2
0. R
edis
trib
utio
n su
bjec
t to
SEG
lice
nse
or c
opyr
ight
; see
Ter
ms
of U
se a
t http
://lib
rary
.seg
.org
/

Spectral balanced shot gathers provide an excellent measure of the quality and quantity of extremely high frequency reflections recorded at this site (Figure 2B). Reflection frequencies in excess of 250 Hz are evident on these 48-channel470 Et long shot gathers. At the line’s southeast end where bedrock is shallow and near-surface conditions are less conducive, reflections from contacts above bedrock are a bit more difficult to confidently interpret in comparison to shot gathers from the northwestern end of the profile where reflections from as shallow as 25 msec are pronounced. Interestingly, the direct wave/refraction is not well developed on shot gathers where the reflections are of the highest quality. It is quite easy to interpret the bedrock reflection directly off these processed shot gathers. Moving from northwest to southeast the bedrock reflection rises from about 250 msec near CMP location 925 to as shallow as 50 msec at CMP 290. The bedrock reflection has a very distinctive signature that is not consistent with reflection characteristics documented on other studies in basaltic areas (e.g., Miller and Steeples, 1990). It is possible that the reflection event identified as basaltic bedrock may be related to a mudflow or water-laid ash deposit resting directly over basalt bedrock and hence its coherent, uniform source signature.
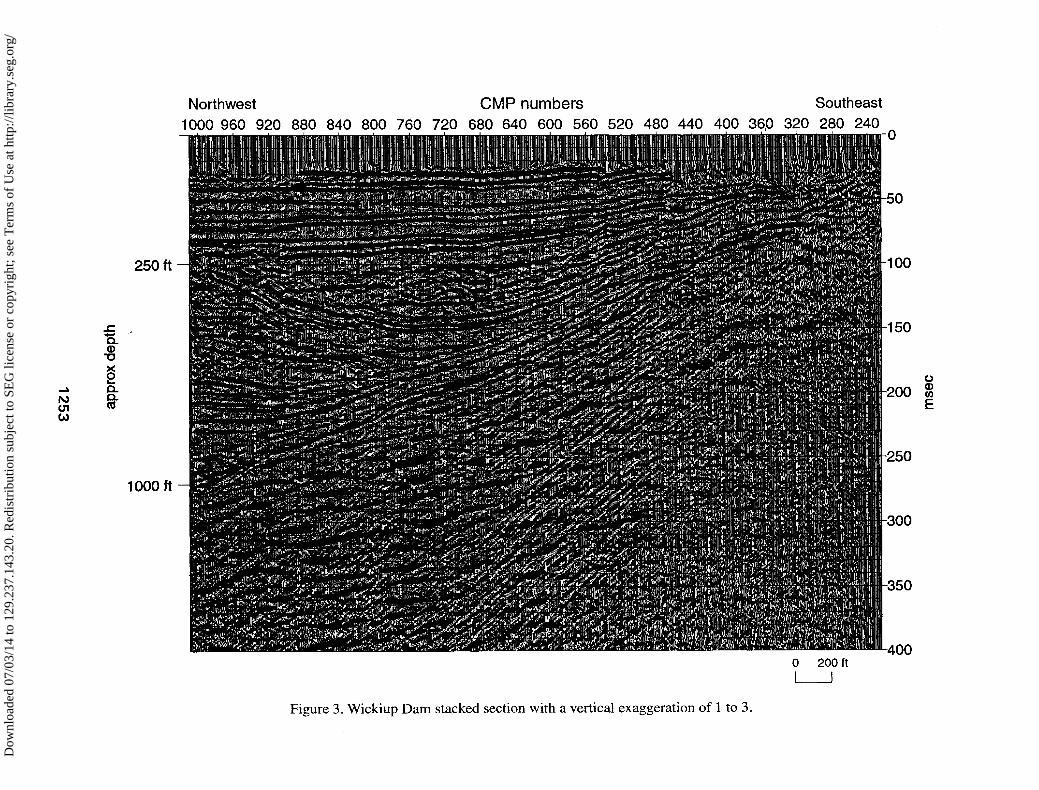
CMP stacked data from this line are of excellent quality (Figure 3). Most pronounced is the west-dipping bedrock surface reflection and the channel feature within the unconsolidated sediment section. Shallow reflections (~250 ft) appear relatively flat with only minor (small scale) apparent variations in lithology or structure. This shallow portion of the geologic section is where almost all the drill data has sampled. Extending those interpretations based on drill data alone would have likely resulted a significantly different image of the subsurface than is evident on the stacked section. Many of the subtle details are difficult to distinguish on this 1 to 3 verti- cal exaggeration (Figure 3). The 2000 ft wide and 300 ft deep channel feature centered on CMP 720 at about 150 msec is quite dramatic and suggestive of a high volume of water moving through the ancestral Deschutes River system. Most of the bedding apparent within this channel is relatively flat, likely indicative of a low energy depositional environment resulting horn a shift in the main river channel. Clearly the older sediments (>250 Et) were deposited during dramatic swings in the river’s position and water volume.
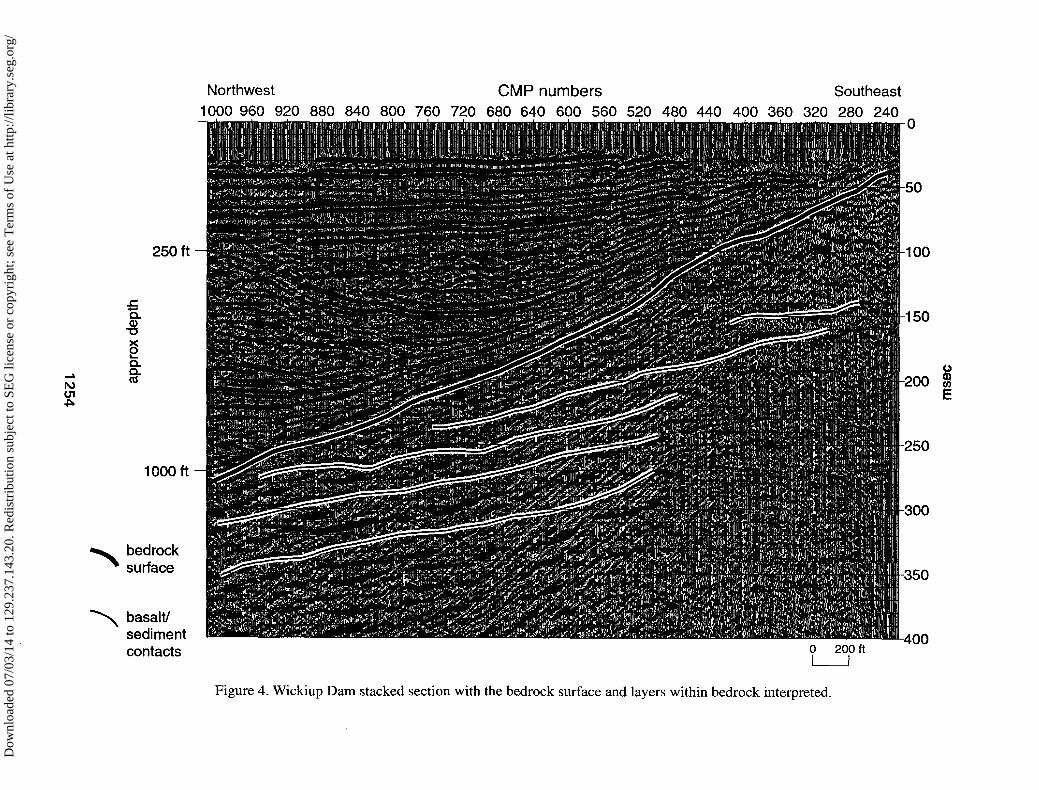
Several features on the stacked section are of particular interest (Figure 4). First are the apparent offsets beneath CMP 530 and CMP 460. Both appear to penetrate to depths very near the bedrock and they both have a relatively consistent dip angle. These features could not be con- firmed as faults from drilling or surface geology. The bedrock surface does seem to have a break in slope in this general area. Velocity analysis indicates a subtle reduction in the values in the velocity field in this area. Another feature of interest previously discussed is the large channel near the center of the sedimentary section. The surface of bedrock is interpreted as a smooth, relatively coherent event that dips steeply to the west. It is unlikely this is the actual surface of bedrock; more likely this smooth surface is a layer of sediments deposited directly onto the sequence of basalt flows that make up the bedrock surface. Of particular interest is the apparent indication that layering has been imaged within the basalt. Mapping layering within basalt has been notoriously difficult, with coherent events observed on seismic data within a basalt section generally dismissed as multiples. These events clearly cannot be multiples if their very unique dip is considered. Fading of these coherent events toward the southeast end of the profile is due to decreased charge size, reduced source offset, and a less conducive near-surface.
1252
Dow
nloa
ded
07/0
3/14
to 1
29.2
37.1
43.2
0. R
edis
trib
utio
n su
bjec
t to
SEG
lice
nse
or c
opyr
ight
; see
Ter
ms
of U
se a
t http
://lib
rary
.seg
.org
/
qlddap xo.idde
1253
Dow
nloa
ded
07/0
3/14
to 1
29.2
37.1
43.2
0. R
edis
trib
utio
n su
bjec
t to
SEG
lice
nse
or c
opyr
ight
; see
Ter
ms
of U
se a
t http
://lib
rary
.seg
.org
/
1254
Q
8
Dow
nloa
ded
07/0
3/14
to 1
29.2
37.1
43.2
0. R
edis
trib
utio
n su
bjec
t to
SEG
lice
nse
or c
opyr
ight
; see
Ter
ms
of U
se a
t http
://lib
rary
.seg
.org
/
CONCLUSIONS
High resolution seismic reflection was an effective tool in a near-surface setting routinely classified as difficult. Dominant frequencies were observed clearly exceeding 200 Hz to depths over 1000 ft. Dramatic bedding geometries, completely unexpected based on drill data alone, were imaged. Apparent reflections from within the basalt section have characteristics unique to true reflections. Data provided an excellent compliment to existing borehole and geophysical data sets, providing a solid scientific basis for estimating site response and appropriately engineering this structure to comply with safety standards.
REFERENCES
Gochioco, L.M., 1991, Tuning effect and interference reflections from thin beds and coal seams: Geophysics, v. 56, p. 12881295.
Gochioco, L.M., 1992, Modeling studies of interference reflections in thin-layered media bounded by coal seams: Geophysics, v. 57, p. 1209-1216.
Hunter, J.A., S.E. Pullan, R.A. Burns, R.M. Gagne, and R.S. Good, 1984, Shallow seismic- reflection mapping of the overburden-bedrock interface with the engineering seismograph- some simple techniques: Geophysics, v. 29, p. 1381-1385.
LaForge, Roland, 1994, Ground motions for Wickiup Dam, Deschutes Project, Oregon: U.S. Bureau of Reclamation, Denver.
Miller, R.D., N.L. Anderson, H.R. Feldman, and E.K. Franseen, 1995, Vertical resolution of a seismic survey in stratigraphic sequences less than 100 m deep in Southeastern Kansas: Geophysics, v. 60, p. 423-430.
Miller, R.D., and D.W. Steeples, 1990, A shallow seismic reflection survey in basalts of the Snake River Plain, Idaho: Geophysics, v. 55, p. 761-768.
Miller, R.D., D.W. Steeples, and M. Brannan, 1989, Mapping a bedrock surface under dry allu- vium with shallow seismic reflections: Geophysics, v. 54, p. 1528-1534.
Pullan, S.E., and J.A. Hunter, 1990, Delineation of buried bedrock valleys using the optimum offset shallow seismic reflection technique: Sot. Explor. Geophys. Investigations in Geo- physics no. 5, Stan H. Ward, ed., Volume 3: Geotechnical, p. 75-87.
Steeples, D.W., and R.D. Miller, 1990, Seismic reflection methods applied to engineering, environmental, and groundwater problems: Sot. Explor. Geophys. Investigations in Geo- physics no. 5, Stan H. Ward, ed., Volume 1: Review and Tutorial, p. l-30.
U.S. Bureau of Reclamation, 1993, Evaluation of liquefaction potential, post-liquefaction stability analyses, and other geotechnical issues: Technical Memorandum No.WI-3620-1, Denver.
U.S. Bureau of Reclamation, 1997, Final report-Risk assessment of Wickiup Dam and dikes: Technical Service Center, Denver, Colorado.
Yilmaz, O., 1987, Seismic data processing: Sot. Explor. Geophys. Investigations in Geophysics no. 2, S.M. Doherty and E.B. Neitzel, series Eds.
1255
Dow
nloa
ded
07/0
3/14
to 1
29.2
37.1
43.2
0. R
edis
trib
utio
n su
bjec
t to
SEG
lice
nse
or c
opyr
ight
; see
Ter
ms
of U
se a
t http
://lib
rary
.seg
.org
/