shaping india’s urban agenda - mcrhrdi.gov.in administration/municipal... · what we will cover...
TRANSCRIPT
Municipal Finance Wed 12 August 2015
LBSNAA, ITP

What we will cover today
1.India’s Urbanisation
2.Basic features of Municipal Governance in India
3.Municipal Finance The Big 5 Issues Objectives and Strategy Solution Roadmap Getting Started Municipal Bonds
Section 1: India’s Urbanisation
India’s Urbanisation
0
200
400
600
800
1000
1200
1400
1600
1800
2011 2030 2050
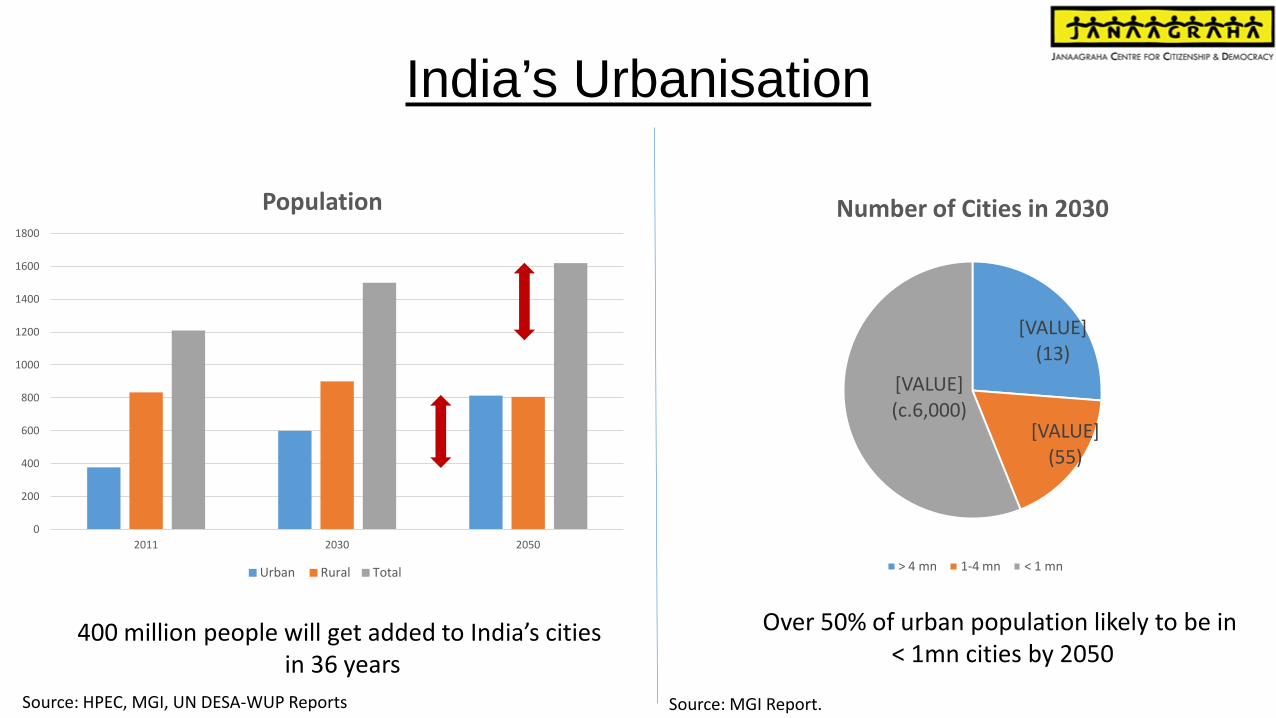
Population
Urban Rural Total
Source: HPEC, MGI, UN DESA-WUP Reports
400 million people will get added to India’s cities in 36 years
[VALUE] (13)
[VALUE] (55)
[VALUE] (c.6,000)
Number of Cities in 2030
> 4 mn 1-4 mn < 1 mn
Source: MGI Report.
Over 50% of urban population likely to be in < 1mn cities by 2050

India’s Urbanisation: Risks and Opportunities
Source: Planning Commission, HPEC, MGI, Reports on AH by JLL et al Source: MGI, Hotspots 2025 Reports
Shortfall in Service Delivery
• Housing and Poverty Urban Poor: 14%
Slum Popln: 17-24% Affordable Housing: 19-25m units • Water 64%, 1-6 hours • Sewerage
Network deficit: 4,861 out of 5,161 cities Storm Water Drains: <20% of urban roads Treatment: 20-30%
• Transport
Public transport share: c.25%
Economic Imperative and Opportunity
• GDP 70% by 2030 • Jobs 70% by 2030 • Competitiveness
Mumbai and Delhi rank 51 and 56 globally, improving 16 and 13 places from 2012 to 2025. 7 Indian cities in the top 120, driven primarily by economic strength, financial maturity and cultural vibrancy. Indian cities fare poorly in physical capital, institutional character, environmental hazards, human capital and global appeal
• Large-scale Investment
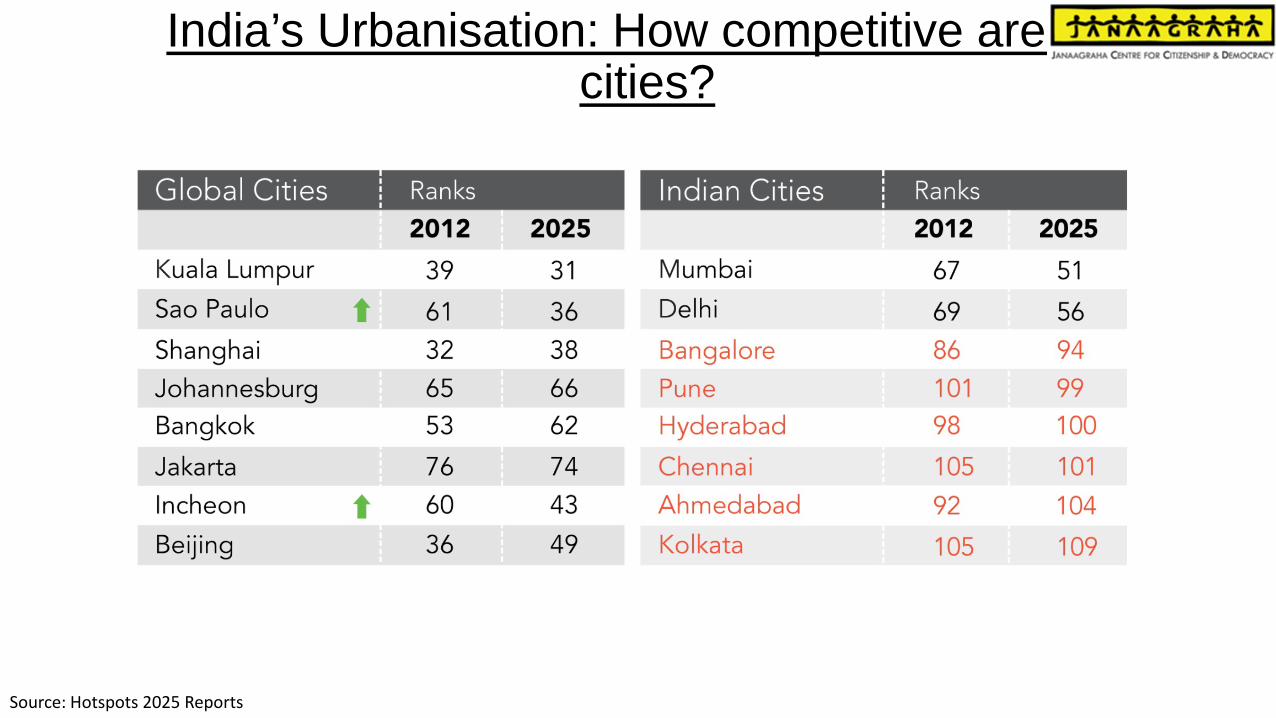
India’s Urbanisation: How competitive are our cities?
Source: Hotspots 2025 Reports

India’s Urbanisation: Key Message There are two distinct but inter-related parts to the challenge of urbanization in India: The Quality of Life challenge and The Economic challenge. The Quality of Life Challenge which is about providing adequate good quality infrastructure and services, in turn depends on the ability of cities to invest and execute projects to achieve citizen outcomes. The Economic challenge is one of creating an ecosystem that can attract (and manage) capital, attract and retain high quality talent and drive economic growth not just of cities themselves but of the region and the country as well. This in turn also depends on improvement in quality of life. While there is a need for short-term measures for improving Quality of Life, for a sustained improvement in Quality of Life and for cities to realize their economic potential, there is a need for institutional strengthening in the medium and long-term.
? Are Indian cities presently capable of meeting this challenge

Section 2: Basic features of Municipal Governance in India
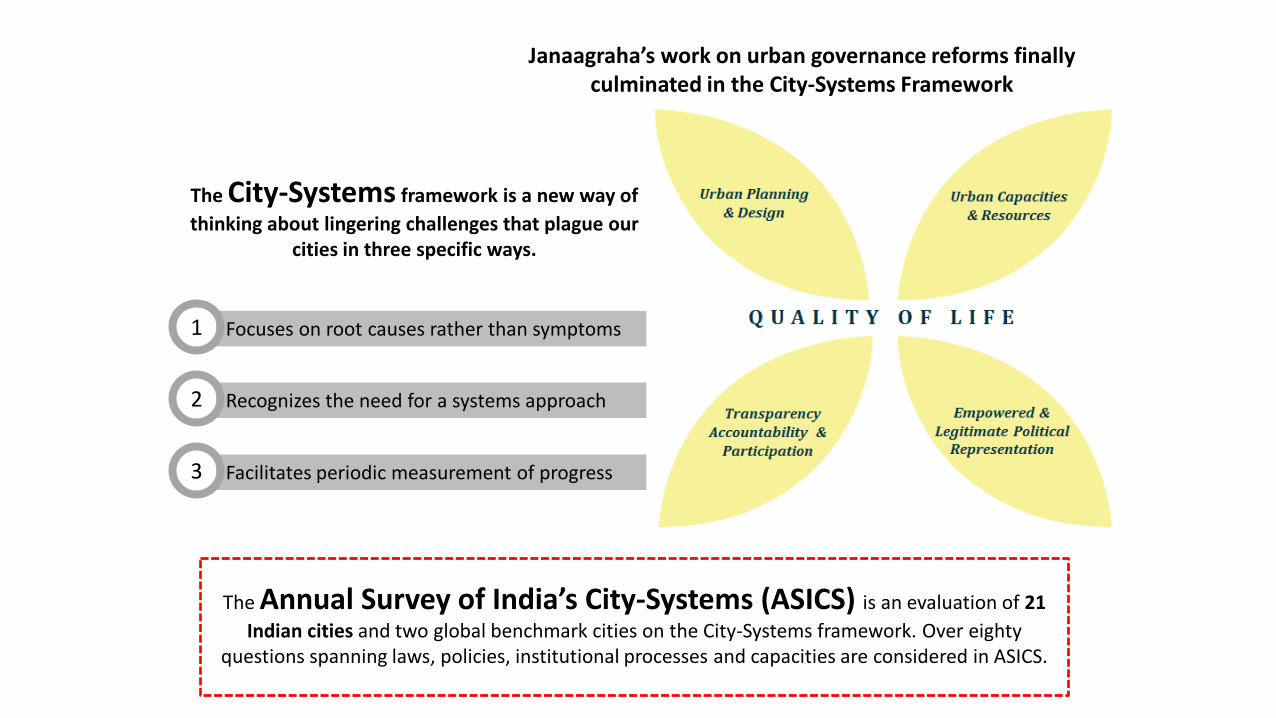
The City-Systems framework is a new way of thinking about lingering challenges that plague our
cities in three specific ways.
Focuses on root causes rather than symptoms 1
Recognizes the need for a systems approach 2
Facilitates periodic measurement of progress 3
The Annual Survey of India’s City-Systems (ASICS) is an evaluation of 21 Indian cities and two global benchmark cities on the City-Systems framework. Over eighty
questions spanning laws, policies, institutional processes and capacities are considered in ASICS.
Janaagraha’s work on urban governance reforms finally culminated in the City-Systems Framework

• Cities are tightly controlled by States, not viewed as engines of growth. Cities constitute neither a whole unit of Governance nor of the Economy
• Municipal Corporation (aka ULBs) are glorified service providers, not the 3rd tier of government as envisaged by the Constitution
• Municipal Corporations (MC) in India are weak institutions Restricted powers Handle only few functions, with the State covering several critical functions, services Staffing is a critical and weak link; both quantity and quality Finances are scarce, most MCs are not financially self-sufficient; exacerbated by
absence of robust performance measurement and audit/accountability mechanisms Opacity in finances and operations; absence of citizen participation
• Land and Spatial Planning: Characterised by poor technical capacities, outdated policy framework and tepid implementation; downstream impact on land-based revenues
• Legitimate political leadership at a city-level is absent
Basic features of Municipal Governance in India

Devolution of Funds
Institutional Weakness
City Directly Elected Mayor
(Yes/No)
Term of Mayor (Years)
Capex per Capita (Rs)
Staff adequacy (per 100,000
citizens)
Delhi No 1 NA 1,260
Mumbai No 2.5 7,587 895
T’puram No 5 4,263 277
Pune No 1.25 4,010 723
Bangalore No 1 3,652 323
Ahmedabad No 2.5 3,256 596
Surat No 2.5 2,726 463

Devolution of Funds
City Directly Elected Mayor (Yes/No)
Term of Mayor (Years)
Capex per Capita (Rs)
Staff adequacy (per 100,000
citizens)
Chennai Yes 5 2,389 488
Hyderabad No 5 1,950 382
Bhopal Yes 5 1,941 200
Jaipur Yes 5 298 252
Kanpur Yes 5 1,721 202
Ranchi Yes 5 509 87
Raipur Yes 5 1,485 238
Patna Yes 5 166 236
Institutional Weakness

Section 3: Municipal Finance

Municipal Finance: An Overview • Fund requirement of c.USD 1 trillion in next two decades
• Total revenues of ULBs in the range of 1-2% of GDP; Brazil and South Africa >
6%
• Main sources of revenues – Own Revenues (Property tax, Other taxes, fees and user charges) – Grants and Assignments (Central, State) – Loans
• Per Capita Capex in cities approx. Rs 2,700; requirement is 3X on an average

Municipal Finance: Issues and Challenges • Institutional Design
– No integrated view of city’s finances – No integrated treasury management
• Fiscal decentralization – Few eligible revenue streams – No control over tax rates and capital/base values – Low threshold for expenditure limits
• Fiscal Responsibility and Budget Management – No MTFP’s – Poor quality of budgeting, sometimes not presented on time – Absence of citizen participation in budgeting – Backlog in audit/preparation of annual accounts – Weak internal control environment, no robust internal audit function – Poor collection efficiencies
• Transparency and Accountability – Poorly drafted laws and policies – No penalties for non-compliance; no redressal mechanism
• Institutional Capacities – Staffing, both quality and quantity – Information systems

Municipal Finance: Objectives and Strategy
Objectives 1. Financial self-sufficiency 2. Value for money spending i.e. optimum citizen outcomes for every Re
Strategy 1. Maximise revenues 2. Optimise expenditure 3. Measure financial performance and financial position

Municipal Finance: Solution Roadmap Onus Immediate Medium
Term Maximise revenues Review and revise lease agreements to ensure marking to market of rentals from time to time
City
Create a GIS-based database of all land and property owned by the municipality
City
Improve revenue generation from hoardings / advertisements • GIS based mapping of all hoardings • Revising license fee to reflect market rates
City
Advocate for a portion of Stamp duty and registration charges to be assigned to municipality in line with recommendations of 14th FC
State
Improve Property Tax collection • Outsource collection to external agencies • Rationalize guidance values
City
State Facilitate levy of service charges on government properties in accordance with the Supreme Court judgment
State
Advocate for powers to levy and collect Profession Tax and Entertainment Tax
State

Onus Immediate
Medium Term
Optimize expenditure
Mandate a 3/5 year Medium Term Fiscal Plan Undertake debt restructuring exercise to reduce significant debt burden and emaciated operating cash flows
City
Establish a comprehensive and integrated financial management information system
City
Strengthen bank payments process, rationalize number of bank accounts, timely bank reconciliation, centralize payments & make them online
City
Measure financial performance and financial position
Bring municipality under FRBM
Produce well-defined Performance MIS reports in each department at pre-defined frequencies
City
Empanel CAs as external auditors; clear backlog of accounts and get audited annual accounts up to date (in compliance with NMAM)
City
Municipal Finance: Solution Roadmap

Solution Roadmap: Some long-term ideas 1. Metropolitan Financial Governance
– City Finance Commission – Land and property management – Integrated treasury management – Lateral hiring of Finance professionals
2. Strategic land-based financing in collaboration with Defence, Railways 3. GST share for cities 4. Accounting Standards of the ICAI 5. Open Data standards 6. Participatory Budgeting
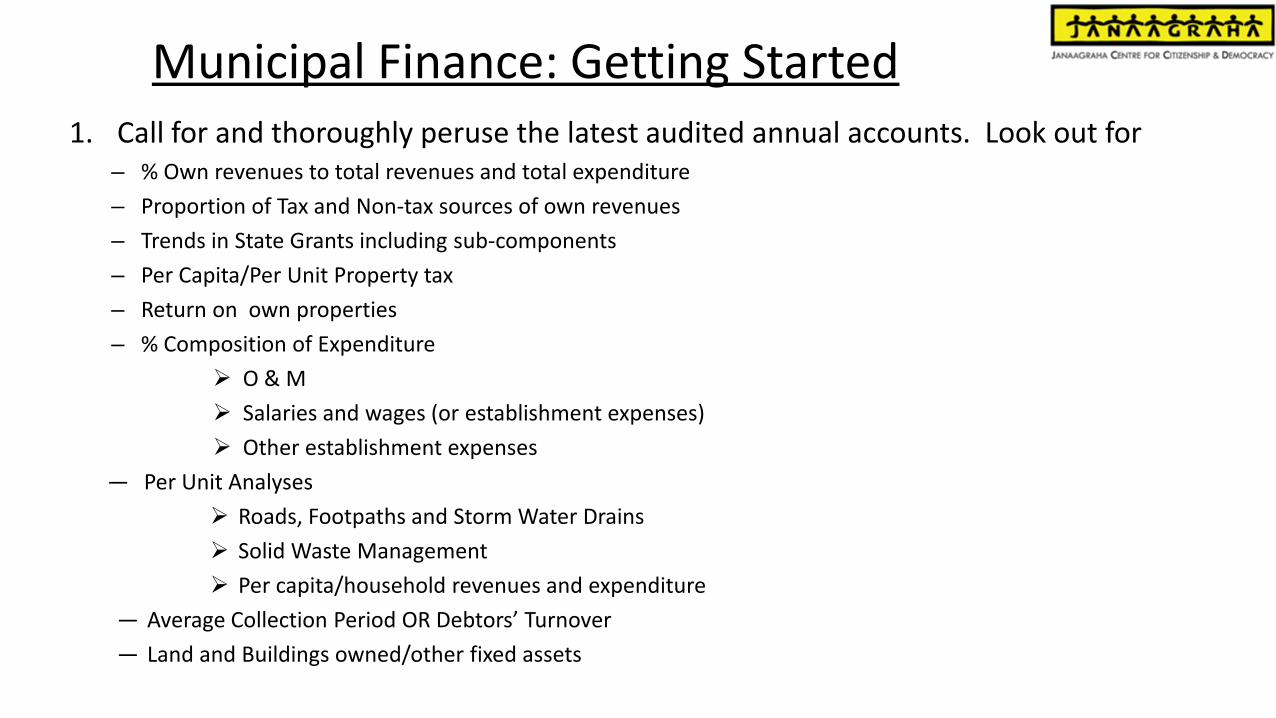
Municipal Finance: Getting Started 1. Call for and thoroughly peruse the latest audited annual accounts. Look out for
– % Own revenues to total revenues and total expenditure – Proportion of Tax and Non-tax sources of own revenues – Trends in State Grants including sub-components – Per Capita/Per Unit Property tax – Return on own properties – % Composition of Expenditure
O & M Salaries and wages (or establishment expenses) Other establishment expenses
— Per Unit Analyses Roads, Footpaths and Storm Water Drains Solid Waste Management Per capita/household revenues and expenditure
— Average Collection Period OR Debtors’ Turnover — Land and Buildings owned/other fixed assets
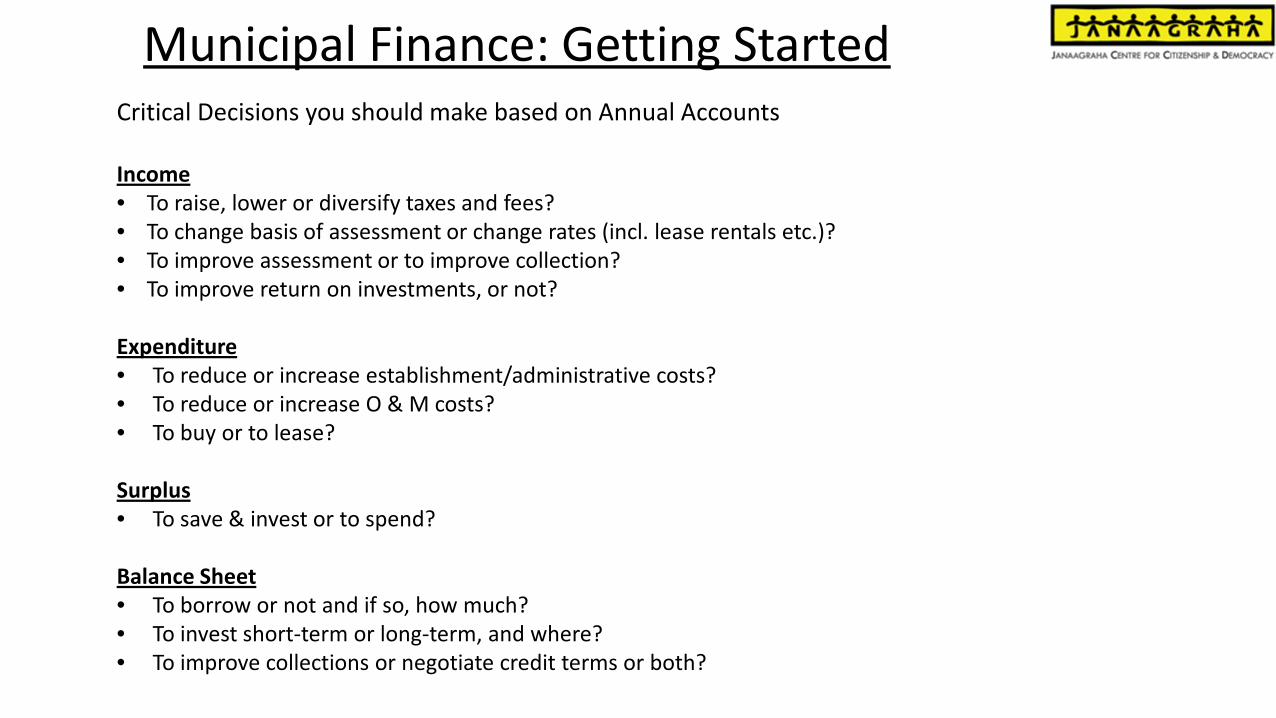
Critical Decisions you should make based on Annual Accounts Income • To raise, lower or diversify taxes and fees? • To change basis of assessment or change rates (incl. lease rentals etc.)? • To improve assessment or to improve collection? • To improve return on investments, or not? Expenditure • To reduce or increase establishment/administrative costs? • To reduce or increase O & M costs? • To buy or to lease? Surplus • To save & invest or to spend? Balance Sheet • To borrow or not and if so, how much? • To invest short-term or long-term, and where? • To improve collections or negotiate credit terms or both?
Municipal Finance: Getting Started
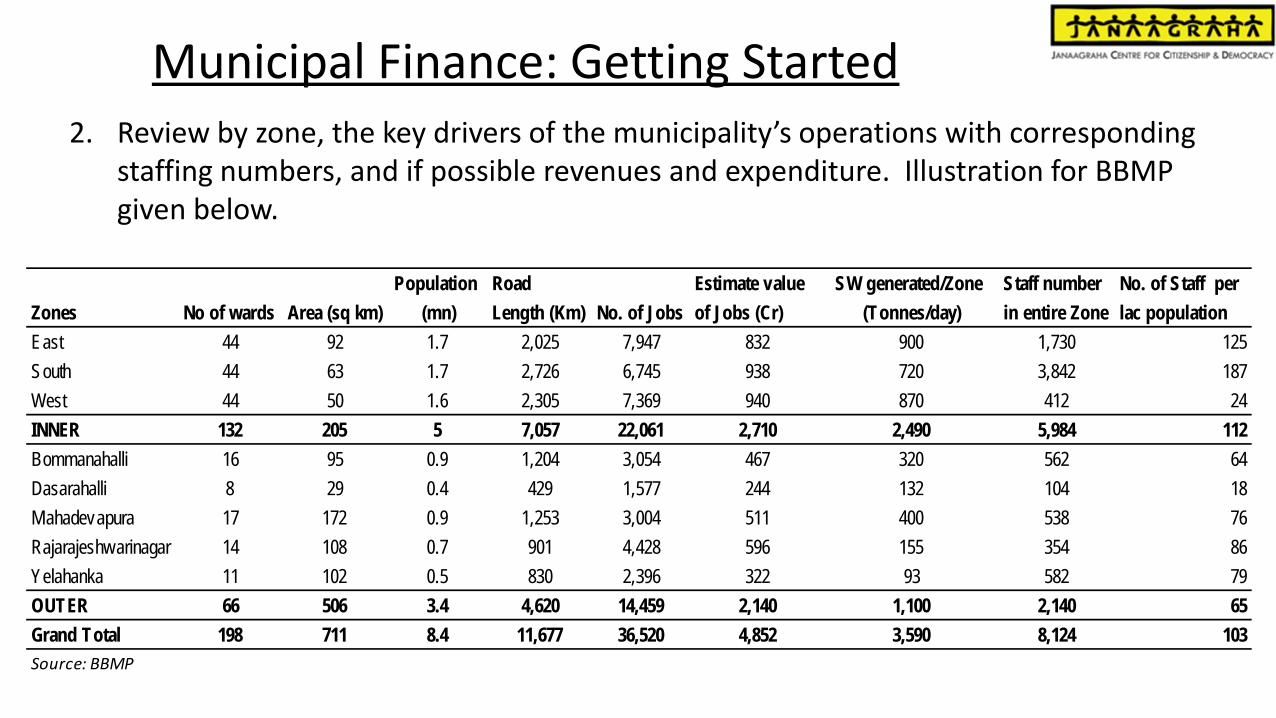
Municipal Finance: Getting Started 2. Review by zone, the key drivers of the municipality’s operations with corresponding
staffing numbers, and if possible revenues and expenditure. Illustration for BBMP given below.
Zones No of wards Area (sq km)Population
(mn)Road Length (Km) No. of Jobs
Estimate value of Jobs (Cr)
SW generated/Zone (Tonnes/day)
Staff number in entire Zone
No. of Staff per lac population
East 44 92 1.7 2,025 7,947 832 900 1,730 125South 44 63 1.7 2,726 6,745 938 720 3,842 187West 44 50 1.6 2,305 7,369 940 870 412 24INNER 132 205 5 7,057 22,061 2,710 2,490 5,984 112Bommanahalli 16 95 0.9 1,204 3,054 467 320 562 64Dasarahalli 8 29 0.4 429 1,577 244 132 104 18Mahadevapura 17 172 0.9 1,253 3,004 511 400 538 76Rajarajeshwarinagar 14 108 0.7 901 4,428 596 155 354 86Yelahanka 11 102 0.5 830 2,396 322 93 582 79OUTER 66 506 3.4 4,620 14,459 2,140 1,100 2,140 65Grand Total 198 711 8.4 11,677 36,520 4,852 3,590 8,124 103Source: BBMP

Municipal Finance: Getting Started 3. Ascertain the following
– Number of staff, grades and skills and competencies in Accounts department – Information systems and processes in place – Audit mechanisms that are prevalent (what audits, who does them, at what frequency, status, open items,
action taken etc.) – Current status of disclosures on website/other
4. Empanel CAs for accounting services/MIS, audit of annual accounts and internal audit
5. Call for and review specific MIS reports on daily/weekly/monthly frequency
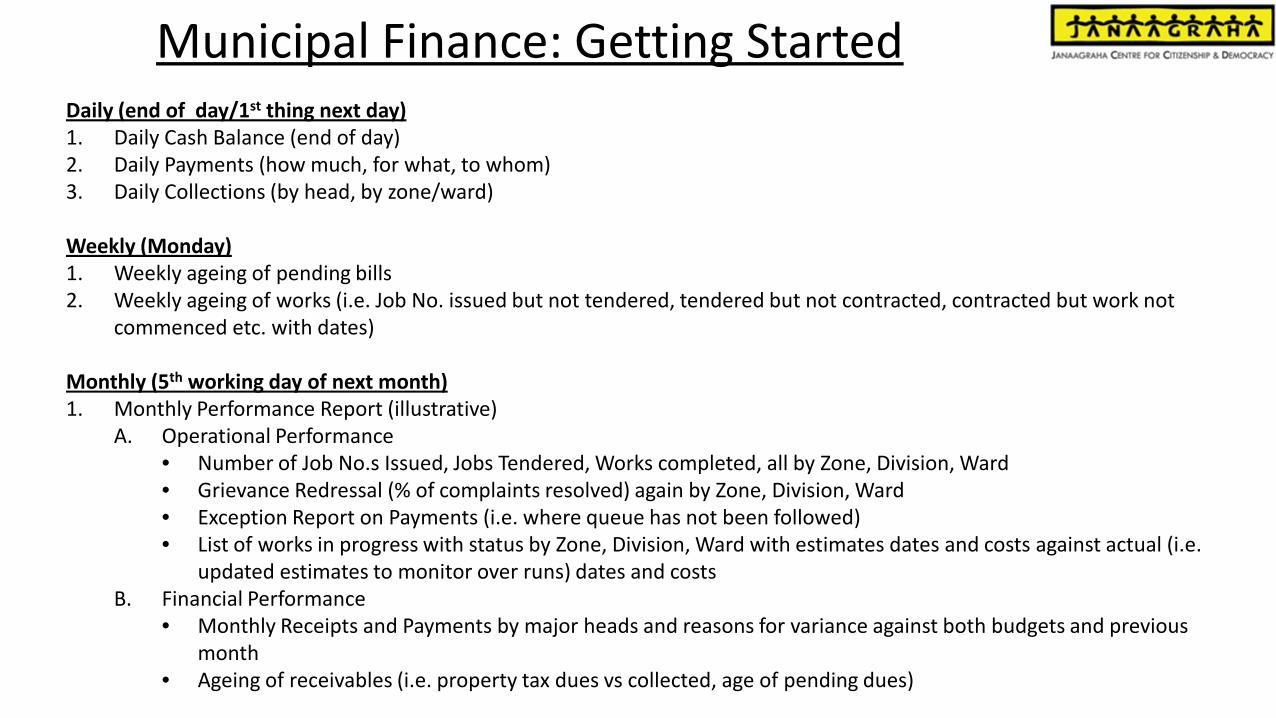
Daily (end of day/1st thing next day) 1. Daily Cash Balance (end of day) 2. Daily Payments (how much, for what, to whom) 3. Daily Collections (by head, by zone/ward)
Weekly (Monday) 1. Weekly ageing of pending bills 2. Weekly ageing of works (i.e. Job No. issued but not tendered, tendered but not contracted, contracted but work not
commenced etc. with dates) Monthly (5th working day of next month) 1. Monthly Performance Report (illustrative)
A. Operational Performance • Number of Job No.s Issued, Jobs Tendered, Works completed, all by Zone, Division, Ward • Grievance Redressal (% of complaints resolved) again by Zone, Division, Ward • Exception Report on Payments (i.e. where queue has not been followed) • List of works in progress with status by Zone, Division, Ward with estimates dates and costs against actual (i.e.
updated estimates to monitor over runs) dates and costs B. Financial Performance
• Monthly Receipts and Payments by major heads and reasons for variance against both budgets and previous month
• Ageing of receivables (i.e. property tax dues vs collected, age of pending dues)
Municipal Finance: Getting Started

Municipal Finance: Some best practices
Karnataka • All 200 odd municipalities excl BBMP covered by FRBM (KMABR 2006), empanel CAs and get audited accounts
done on time, have standardised accounting policies and systems. Initiative by • Andhra Pradesh appears to have embarked on a similar endeavour recently
Chennai • Integrated ERP system, with real-time dashboards Pune • Participatory Budgeting process in place for close to a decade

KMABR 2006
• Timeliness of Budget estimates • Systematic and time-bound citizen participation in budgeting • Empanelment of Chartered Accountants as independent auditors of annual accounts • Specified timelines for filing of auditor’s report and audited financial statements • Timely disclosure of a comprehensive Annual Performance Report that contains
— City Management Report — Audited annual accounts — Cost and performance indicators and — A budget variance statement
• The City Management Report shall contain — Commentary on the financial performance and position, — Reasons for deviations from plan or any adverse performance — Current progress and future plans and — Management comments on adverse comments in the auditor’s report
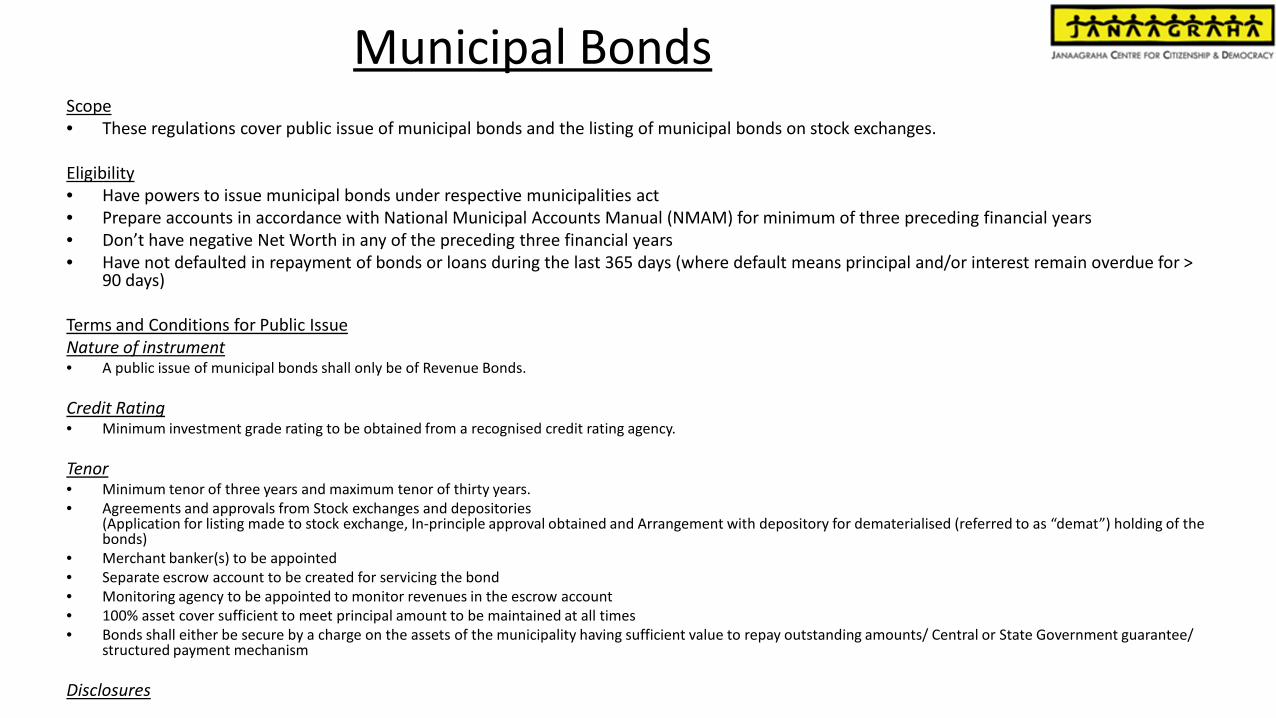
Municipal Bonds Scope • These regulations cover public issue of municipal bonds and the listing of municipal bonds on stock exchanges. Eligibility • Have powers to issue municipal bonds under respective municipalities act • Prepare accounts in accordance with National Municipal Accounts Manual (NMAM) for minimum of three preceding financial years • Don’t have negative Net Worth in any of the preceding three financial years • Have not defaulted in repayment of bonds or loans during the last 365 days (where default means principal and/or interest remain overdue for >
90 days) Terms and Conditions for Public Issue Nature of instrument • A public issue of municipal bonds shall only be of Revenue Bonds. Credit Rating • Minimum investment grade rating to be obtained from a recognised credit rating agency. Tenor • Minimum tenor of three years and maximum tenor of thirty years. • Agreements and approvals from Stock exchanges and depositories
(Application for listing made to stock exchange, In-principle approval obtained and Arrangement with depository for dematerialised (referred to as “demat”) holding of the bonds)
• Merchant banker(s) to be appointed • Separate escrow account to be created for servicing the bond • Monitoring agency to be appointed to monitor revenues in the escrow account • 100% asset cover sufficient to meet principal amount to be maintained at all times • Bonds shall either be secure by a charge on the assets of the municipality having sufficient value to repay outstanding amounts/ Central or State Government guarantee/
structured payment mechanism Disclosures

Municipal Bond Issuance: A summary
Type Amt in Rs Cr
Taxable bonds 445.0 Tax-free bonds 679.5 Pooled finance 622.1 Total 1,746.6

Municipal Bond Issuance: Listing
City Bond Issuance
Issue Year Issue size
(Cr) State
Guarantee Tax-free Purpose
Ahmedabad 1998 100 No No Water Supply and Sewerage 2002 100 Yes Water Supply and Sewerage
2004 58 Yes Water Supply, Storm water drainage,
roads and bridges 2005 100 Yes Roads and water supply
Bangalore 1997 125 Yes No City roads and drains
Chennai 2003 42 Yes Yes Chennai water supply augmentation project- Chennai Metropolitan Water
Supply & Sewerage Board
2005 50 Yes Yes Water Supply- Chennai Metropolitan
Water Supply & Sewerage Board 2005 45.8 Yes Roads
Hyderabad 2003 82.5 Yes Yes Road construction and widening
2003 50 Yes Yes Drinking water- Hyderabad
Metropolitan Water Supply and Sewerage Board
Ludhiana 1999 10 No Water Supply and Sewerage
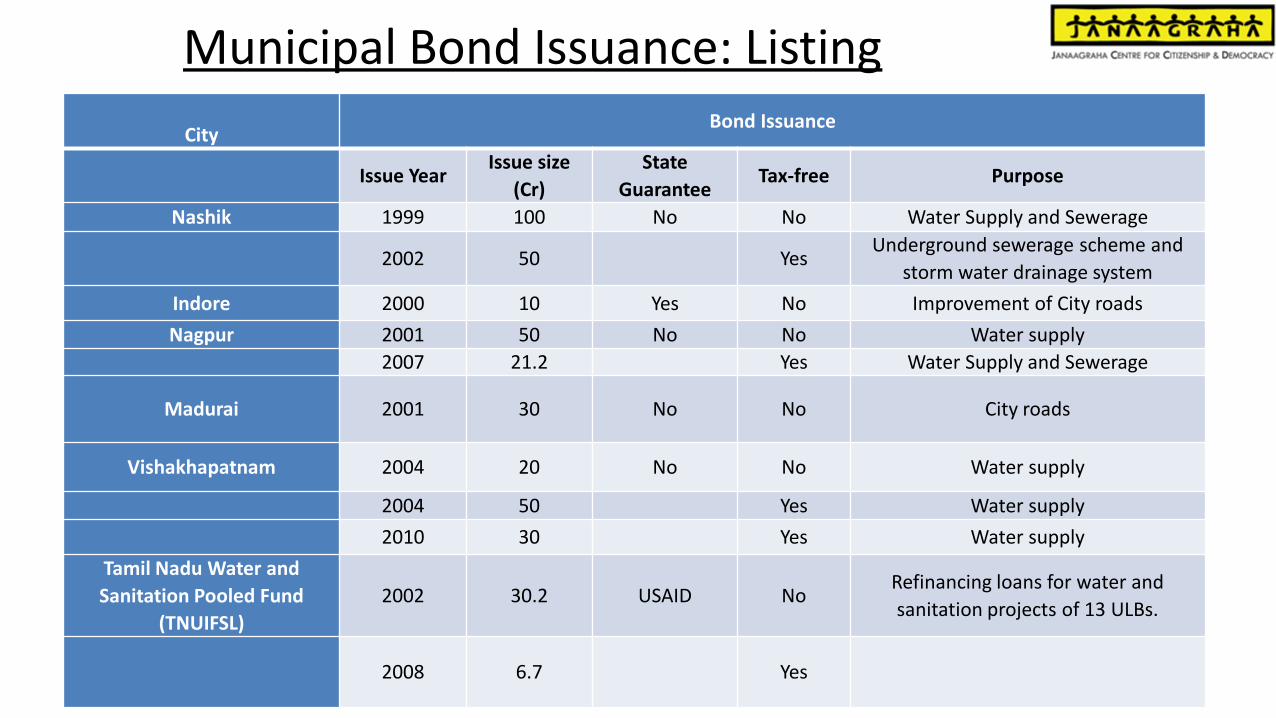
Municipal Bond Issuance: Listing
City Bond Issuance
Issue Year Issue size
(Cr) State
Guarantee Tax-free Purpose
Nashik 1999 100 No No Water Supply and Sewerage
2002 50 Yes Underground sewerage scheme and
storm water drainage system Indore 2000 10 Yes No Improvement of City roads Nagpur 2001 50 No No Water supply
2007 21.2 Yes Water Supply and Sewerage
Madurai 2001 30 No No City roads
Vishakhapatnam 2004 20 No No Water supply
2004 50 Yes Water supply 2010 30 Yes Water supply
Tamil Nadu Water and Sanitation Pooled Fund
(TNUIFSL) 2002 30.2 USAID No
Refinancing loans for water and sanitation projects of 13 ULBs.
2008 6.7 Yes

Municipal Bond Issuance: Listing
City
Bond Issuance
Issue Year Issue size
(Cr) State
Guarantee Tax-free Purpose
Tamil Nadu Water and Sanitation Pooled Fund
(TNUIFSL) contd. 2010 83.19 Yes
2012 51 No 2013 51 No
Karnataka Water and Sanitation Pooled Fund1
2005 100 USAID Yes
2010 300 Lending to ULBs through Directorate of
Municipal Administration
Total
1,746.59
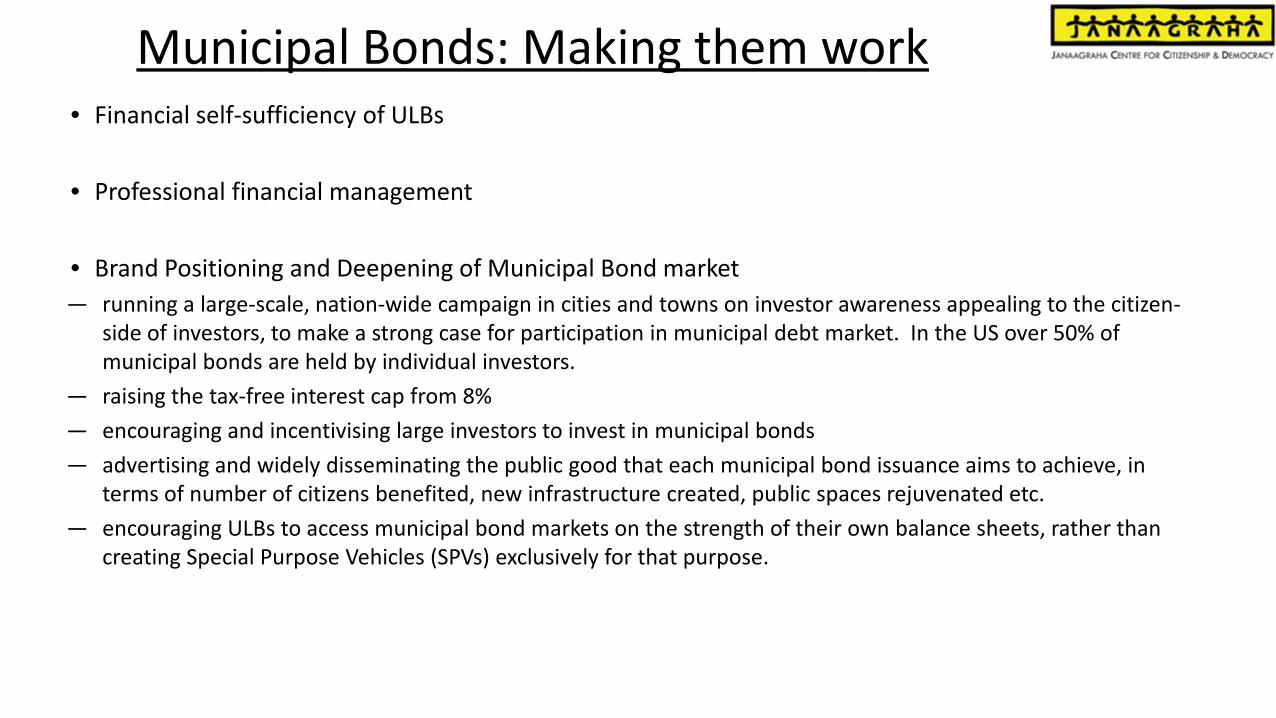
Municipal Bonds: Making them work • Financial self-sufficiency of ULBs
• Professional financial management
• Brand Positioning and Deepening of Municipal Bond market — running a large-scale, nation-wide campaign in cities and towns on investor awareness appealing to the citizen-
side of investors, to make a strong case for participation in municipal debt market. In the US over 50% of municipal bonds are held by individual investors.
— raising the tax-free interest cap from 8% — encouraging and incentivising large investors to invest in municipal bonds — advertising and widely disseminating the public good that each municipal bond issuance aims to achieve, in
terms of number of citizens benefited, new infrastructure created, public spaces rejuvenated etc. — encouraging ULBs to access municipal bond markets on the strength of their own balance sheets, rather than
creating Special Purpose Vehicles (SPVs) exclusively for that purpose.
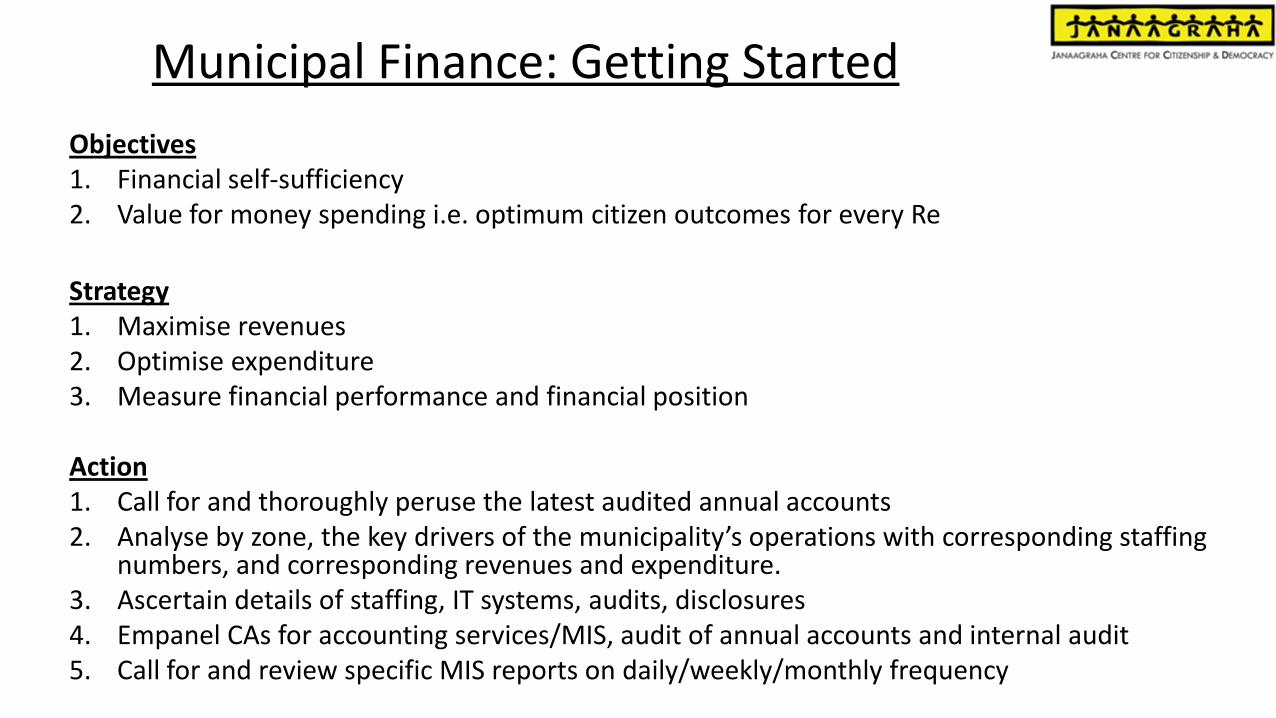
Municipal Finance: Getting Started Objectives 1. Financial self-sufficiency 2. Value for money spending i.e. optimum citizen outcomes for every Re
Strategy 1. Maximise revenues 2. Optimise expenditure 3. Measure financial performance and financial position Action 1. Call for and thoroughly peruse the latest audited annual accounts 2. Analyse by zone, the key drivers of the municipality’s operations with corresponding staffing
numbers, and corresponding revenues and expenditure. 3. Ascertain details of staffing, IT systems, audits, disclosures 4. Empanel CAs for accounting services/MIS, audit of annual accounts and internal audit 5. Call for and review specific MIS reports on daily/weekly/monthly frequency

Annexures
Components of Financial Statements
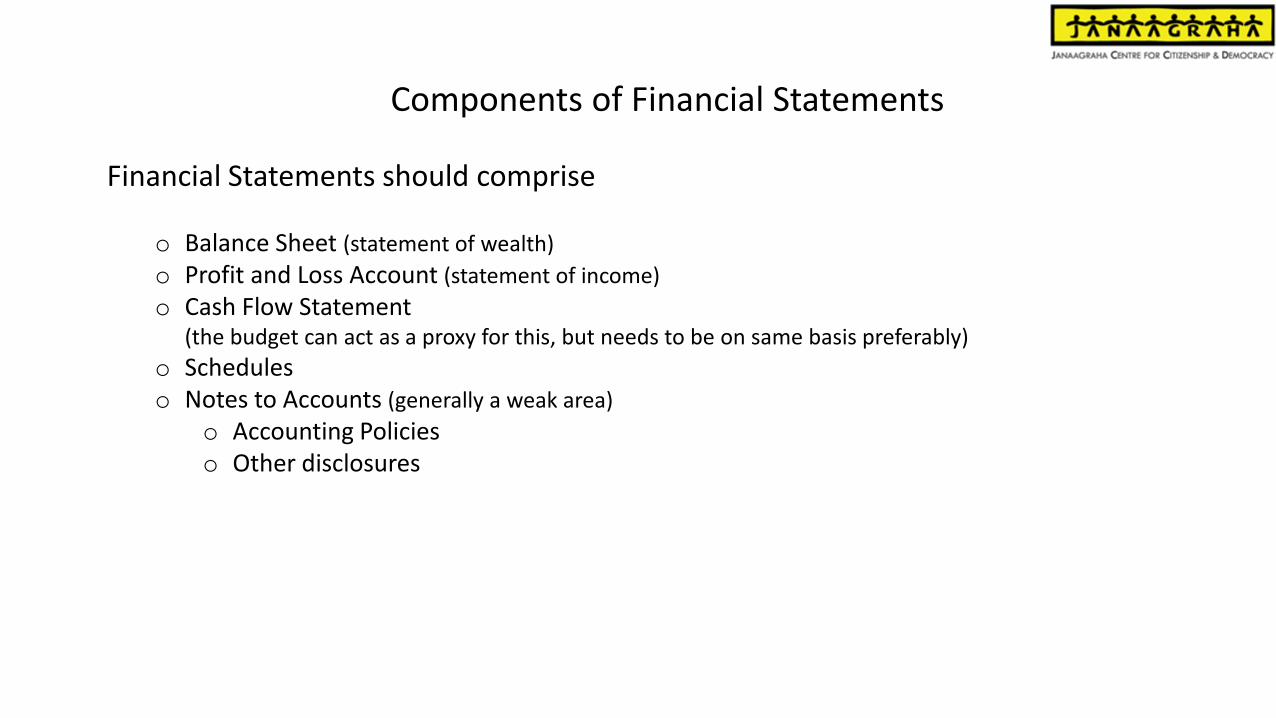
Financial Statements should comprise
o Balance Sheet (statement of wealth) o Profit and Loss Account (statement of income) o Cash Flow Statement
(the budget can act as a proxy for this, but needs to be on same basis preferably) o Schedules o Notes to Accounts (generally a weak area)
o Accounting Policies o Other disclosures

Balance Sheet
format as per
NMAM

P & L Account format as per
NMAM
Financial Statements Analysis
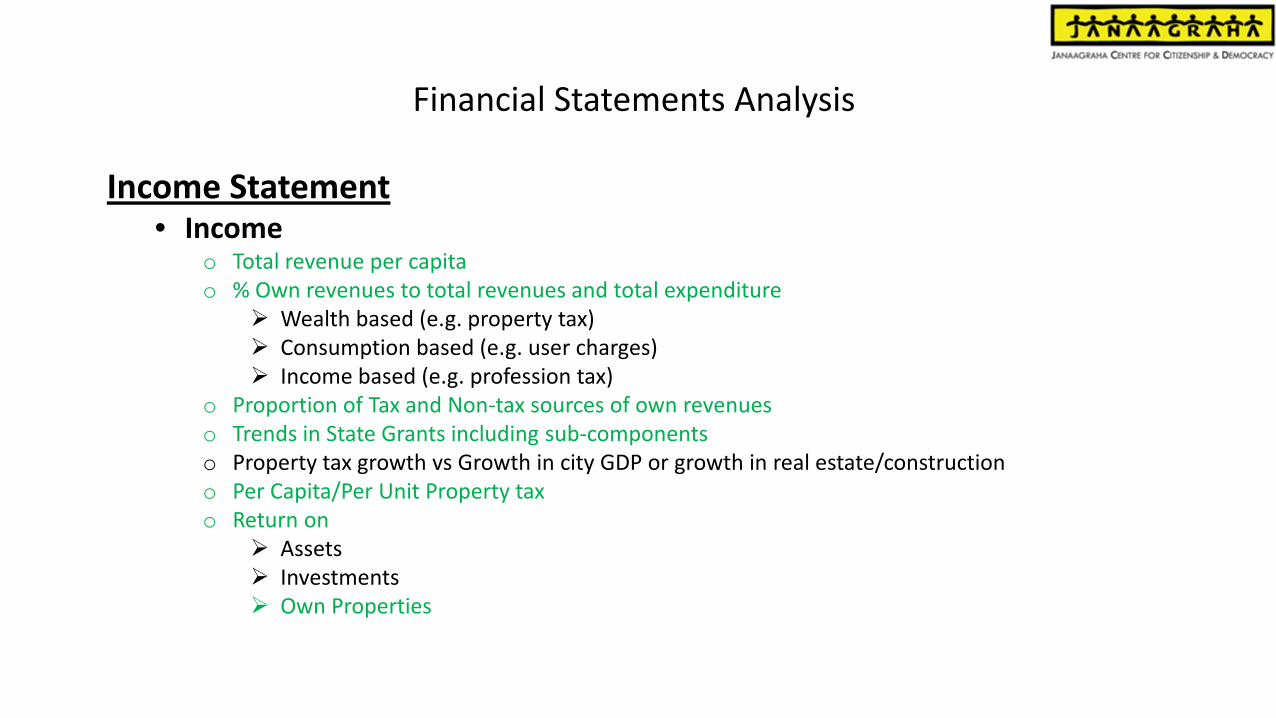
Income Statement • Income
o Total revenue per capita o % Own revenues to total revenues and total expenditure
Wealth based (e.g. property tax) Consumption based (e.g. user charges) Income based (e.g. profession tax)
o Proportion of Tax and Non-tax sources of own revenues o Trends in State Grants including sub-components o Property tax growth vs Growth in city GDP or growth in real estate/construction o Per Capita/Per Unit Property tax o Return on
Assets Investments Own Properties

Financial Statements Analysis
Income Statement • Expenditure
o Per capita total expenditure o % Composition of Expenditure
O & M Salaries and wages (or establishment expenses) Other establishment expenses
o % Interest cost on own revenues and total expenditure o Per Unit Analyses
Roads Solid Waste Management Others
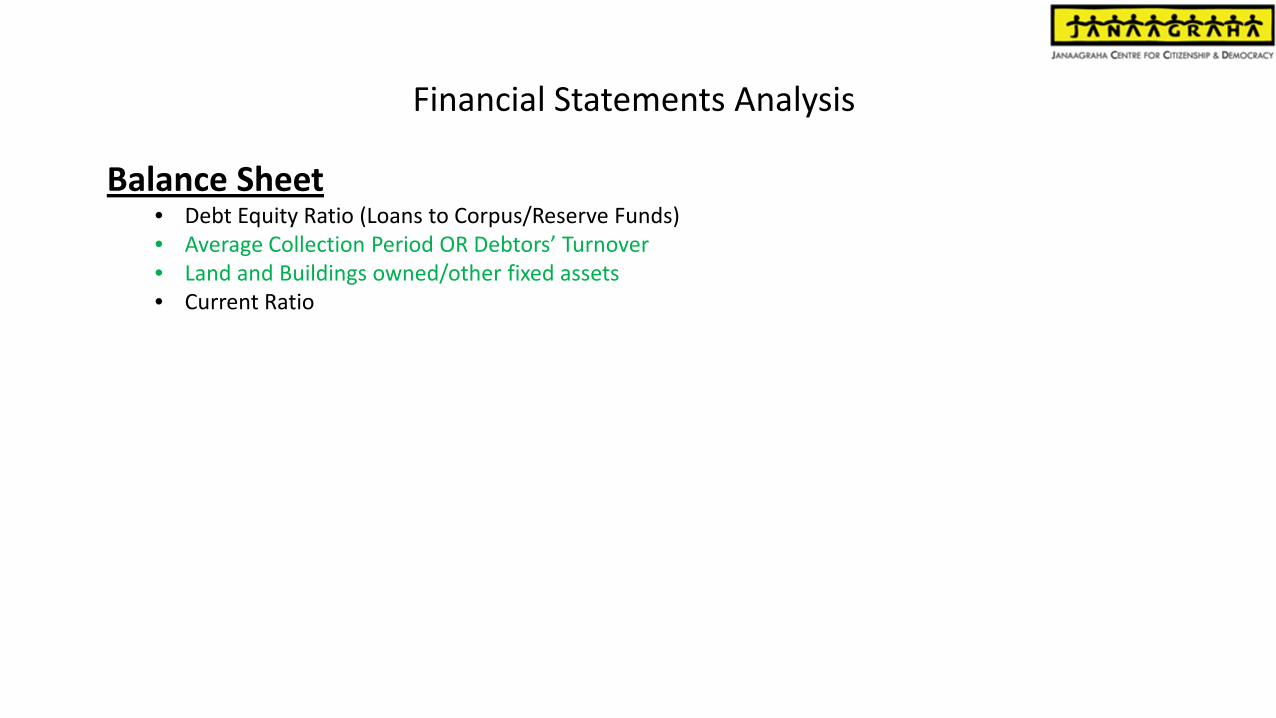
Financial Statements Analysis
Balance Sheet • Debt Equity Ratio (Loans to Corpus/Reserve Funds) • Average Collection Period OR Debtors’ Turnover • Land and Buildings owned/other fixed assets • Current Ratio

Illustrative Audit and Accounts Checklist
Devolution of Funds
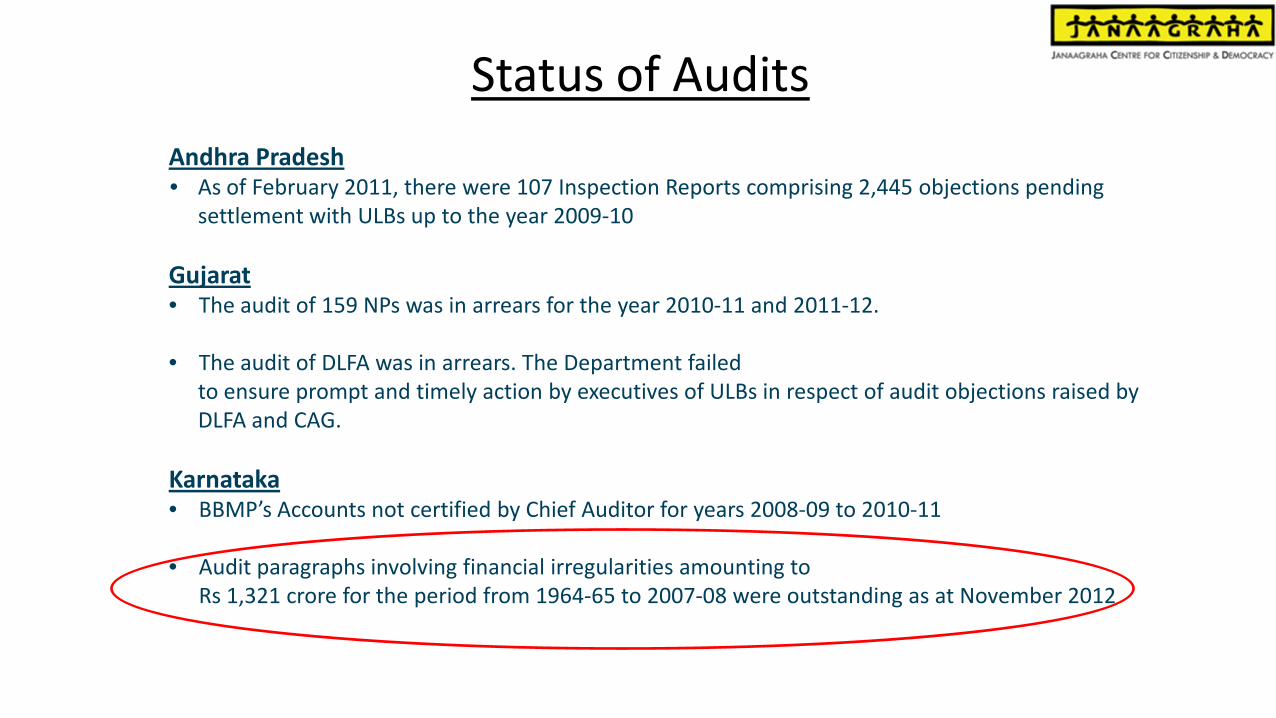
Status of Audits Andhra Pradesh • As of February 2011, there were 107 Inspection Reports comprising 2,445 objections pending
settlement with ULBs up to the year 2009-10
Gujarat • The audit of 159 NPs was in arrears for the year 2010-11 and 2011-12.
• The audit of DLFA was in arrears. The Department failed
to ensure prompt and timely action by executives of ULBs in respect of audit objections raised by DLFA and CAG.
Karnataka • BBMP’s Accounts not certified by Chief Auditor for years 2008-09 to 2010-11
• Audit paragraphs involving financial irregularities amounting to
Rs 1,321 crore for the period from 1964-65 to 2007-08 were outstanding as at November 2012

Devolution of Funds
Maharashtra • Large pendency in Inspection Reports and Paragraphs issued by the Principal Accountant General/Accountant General, Maharashtra to the Corporations, was a reflection of inadequate internal controls. •Although Government of Maharashtra adopted (July 2005) the National Municipal Accounting Manual for implementation from 2005-06, the ULBs did not implement the same. Rajasthan • Out of 184 ULBs, audit of 84 ULBs was pending for the period 2007-08 to 2010-11 as on 31 May 2012
•1,045 IRs issued by the PAG containing 10,151 paras involving Rs 4,339 Cr pending as of May 2012 •None of the ULBs have prepared accounts on accrual basis
Status of Audits

Devolution of Funds
Tamil Nadu
• Audit of 52 municipalities, 31 town panchayats and two municipal corporations
was pending for the year 2010-11.
• 2,402 paragraphs contained in 449 IRs of the PAG for the period 2009-10 to 2011-12 were pending for settlement for want of satisfactory replies
Delhi • Annual Accounts delayed for each of the years from 2004-05 to 2011-12, and
not submitted for audit
• Monthly Accounts not made available to audit for eight years from 2004 to 2012
• Over 30,000 audit objections pending closure from 1966
Status of Audits

Devolution of Funds
15 out of the 18 Major states have enacted the Public Disclosure Law and notified Rules;
status of Implementation very poor
City
% Compliance with Model Disclosure
Audited F/S
Quarterly F/S Works
1 Delhi - X X X
2 Mumbai 100 2012-13 X X
3 Bangalore 11 X X X
4 Hyderabad 100 2009-10 X X 5 Ahmedabad - 2007-08 X X 6 Surat - 2011-12 X X 7 Chennai 64 X X X 8 Kolkata 59 X X X 9 Pune 100 X X X
Status of Disclosures