shaping modern mathematics: are averages typical? raymond flood gresham professor of geometry this...
TRANSCRIPT

Shaping Modern Mathematics:
Are Averages Typical?Raymond Flood
Gresham Professor of Geometry
This lecture will soon be available on the Gresham College website,where it will join our online archive of almost 1,500 lectures.
www.gresham.ac.uk

A knowledge of statistical methods is not only essential for those who present statistical arguments, it is also needed by those on the receiving end.
Allen, R.G.D. Statistics for Economists Chapter 1 p.9
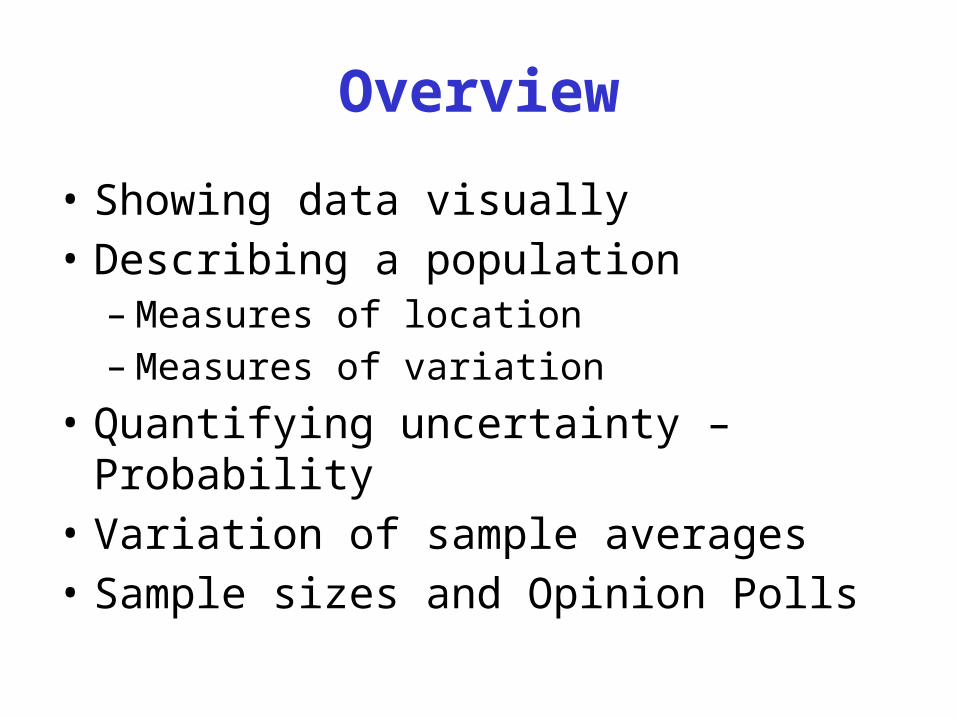
Overview
• Showing data visually• Describing a population
– Measures of location– Measures of variation
• Quantifying uncertainty – Probability• Variation of sample averages• Sample sizes and Opinion Polls
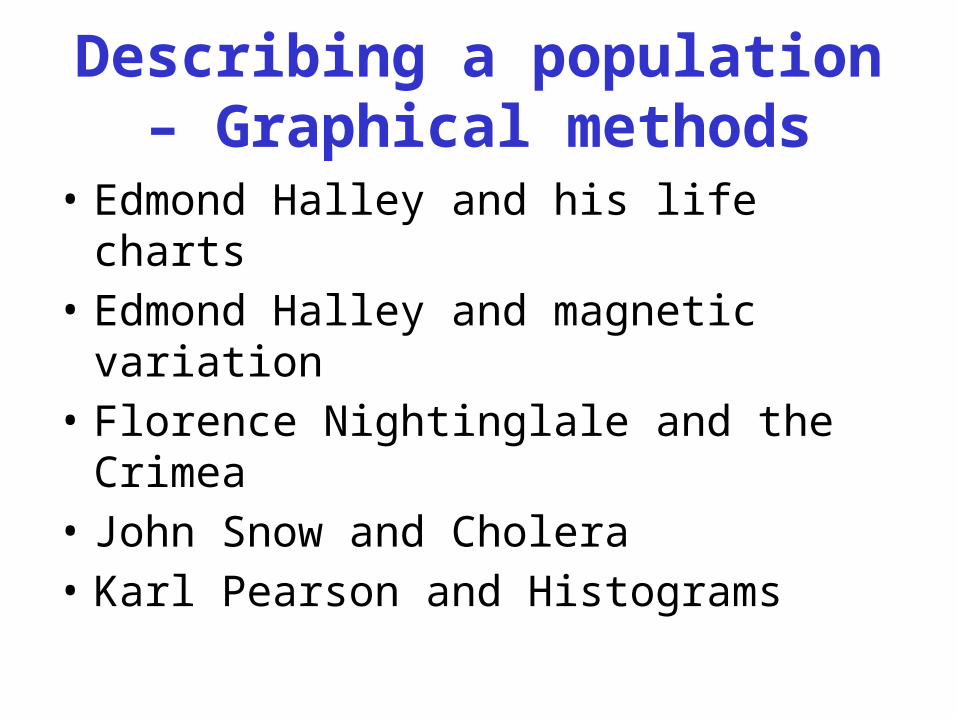
Describing a population – Graphical methods
• Edmond Halley and his life charts• Edmond Halley and magnetic variation• Florence Nightinglale and the Crimea• John Snow and Cholera• Karl Pearson and Histograms

Edmond Halley 1656 - 1742
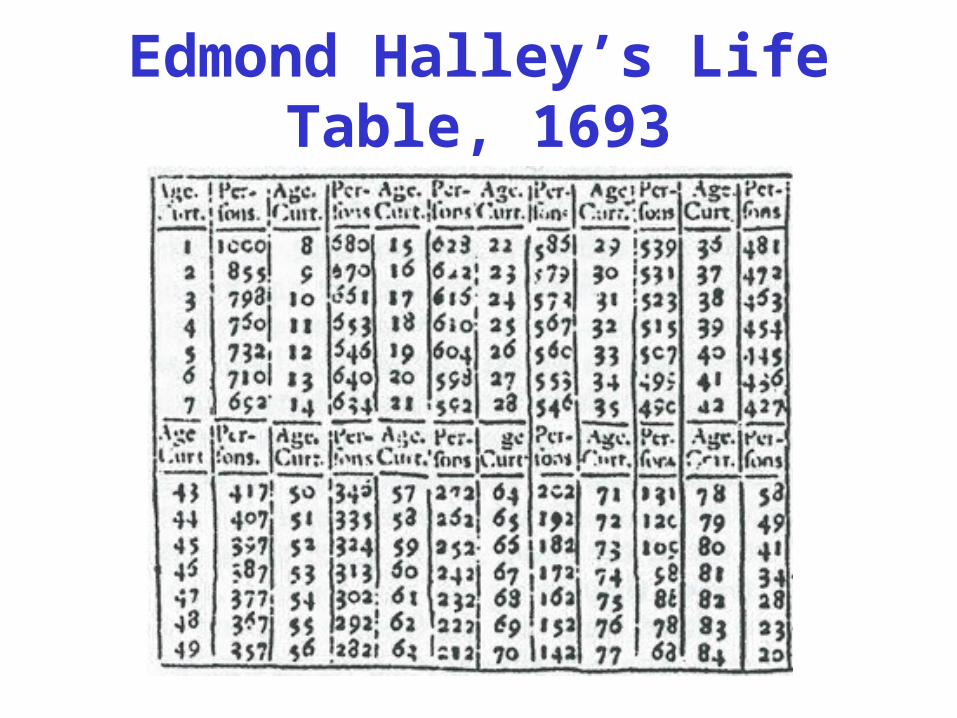
Edmond Halley’s Life Table, 1693
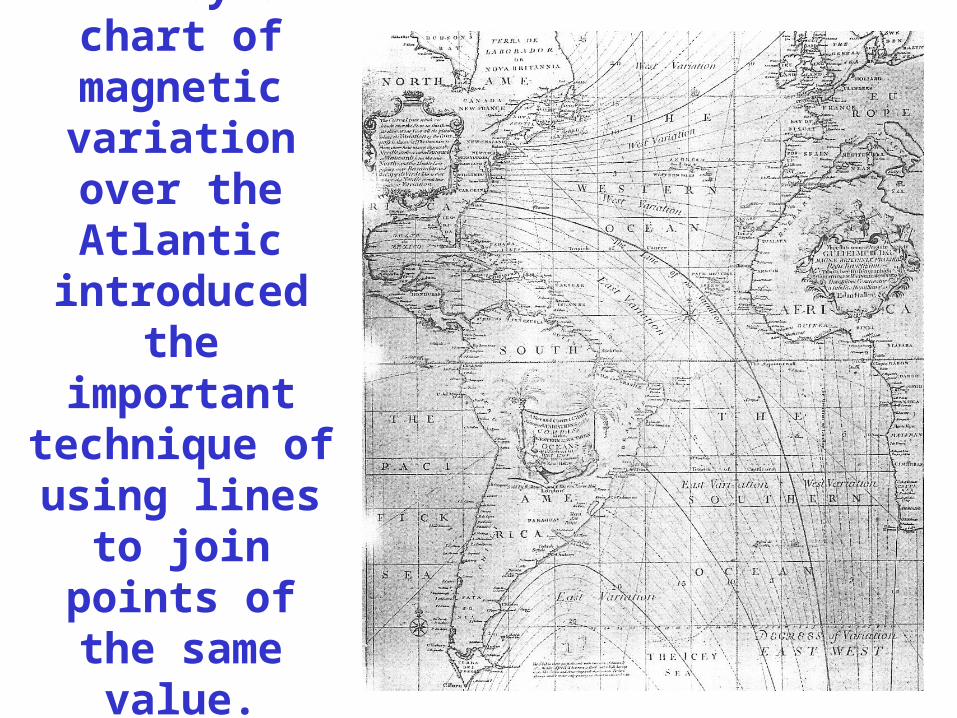
Halley’s chart of magnetic
variation over the Atlantic
introduced the important
technique of using lines to join
points of the same value.

Florence Nightingale 1820 - 1910


John Snow 1813 – 1858Father of contemporary epidemiology
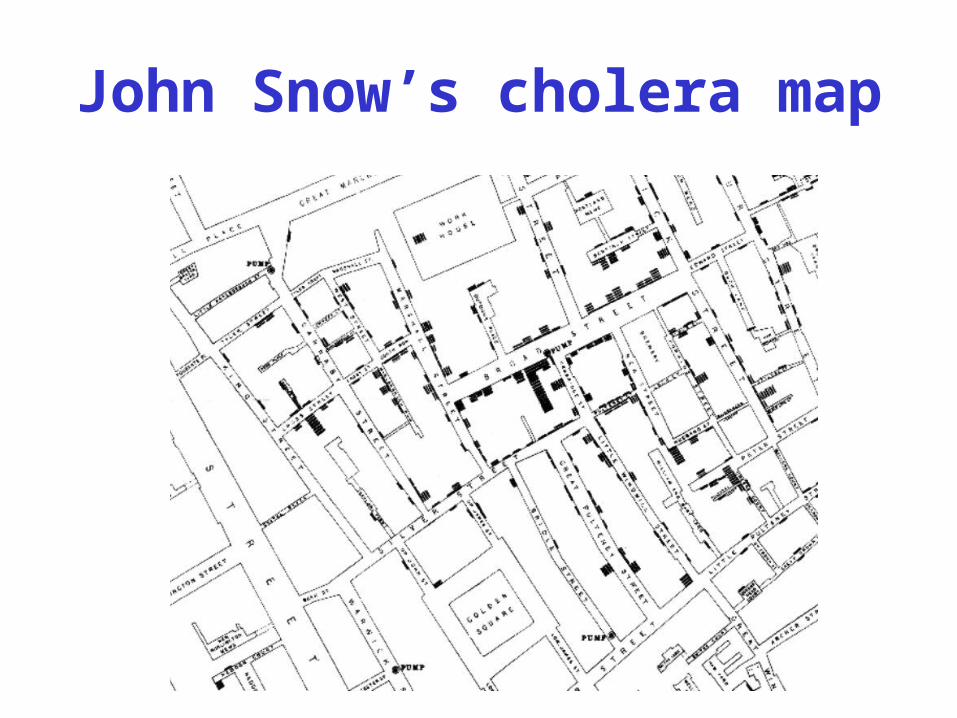
John Snow’s cholera map

Karl Pearson 1857 - 1936

Histograms
Heights of 31 cherry trees
70 65 63 72 81 83 66 75 80 75 79 76 76 69 75 74 85 86 71 64 78 80 74 72 77 81 82 80 80 80 87
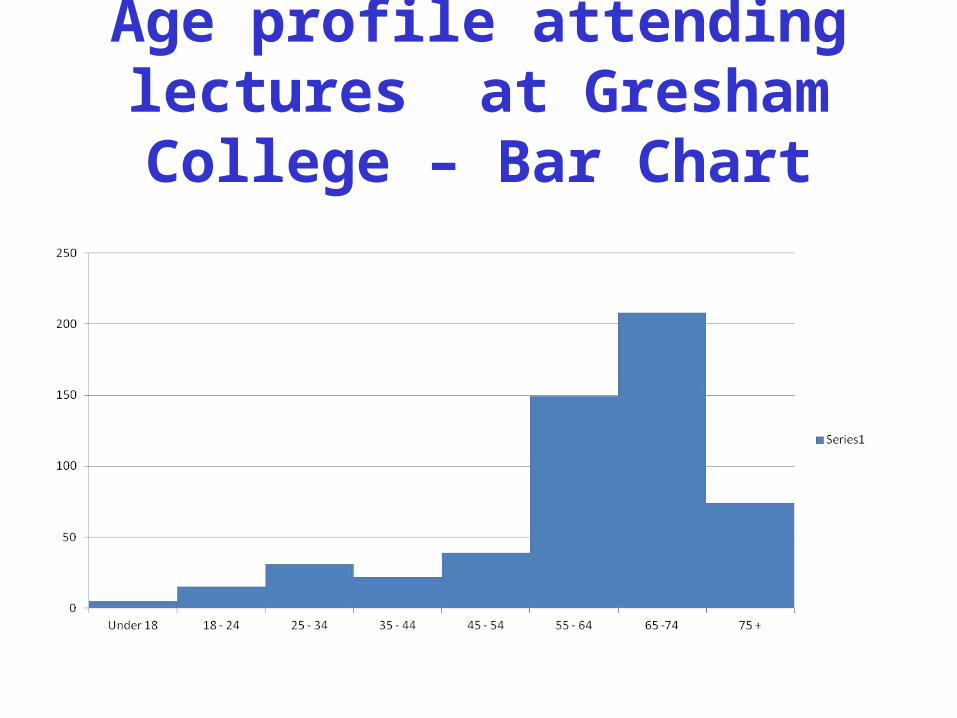
Age profile attending lectures at Gresham College – Bar Chart
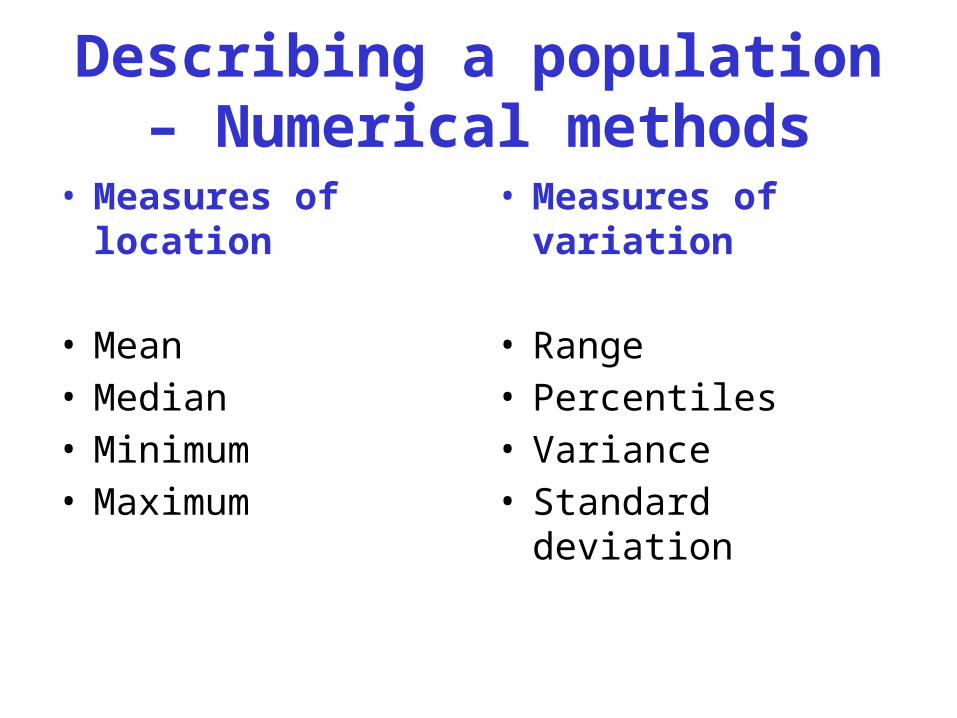
Describing a population – Numerical methods
• Measures of location
• Mean• Median• Minimum • Maximum
• Measures of variation
• Range• Percentiles• Variance• Standard deviation
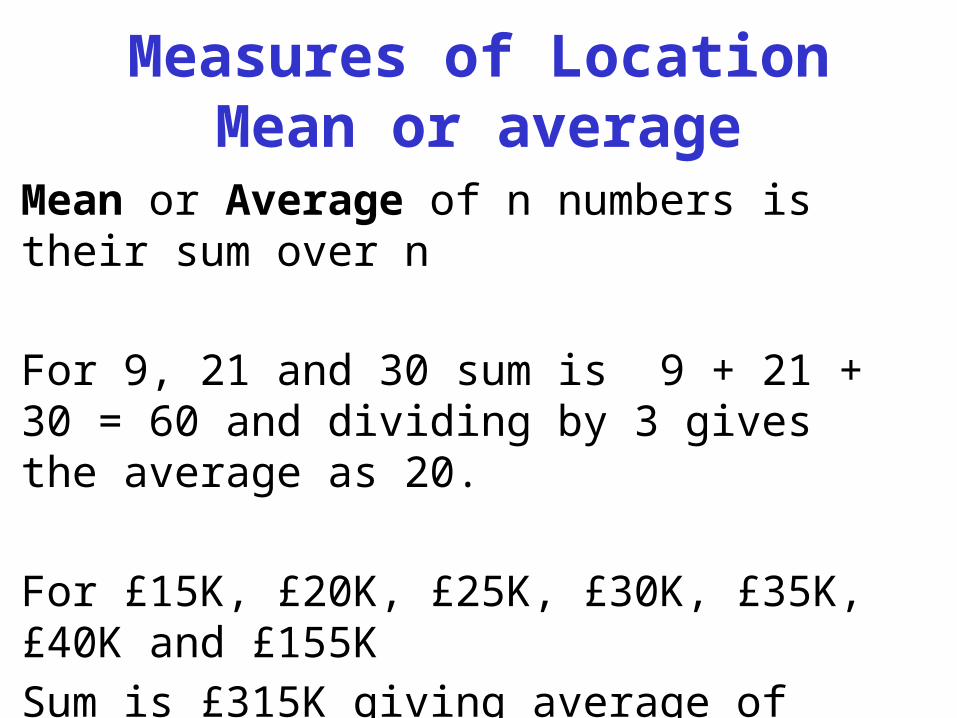
Measures of LocationMean or average
Mean or Average of n numbers is their sum over n
For 9, 21 and 30 sum is 9 + 21 + 30 = 60 and dividing by 3 gives the average as 20.
For £15K, £20K, £25K, £30K, £35K, £40K and £155KSum is £315K giving average of £315K / 7 = £45K
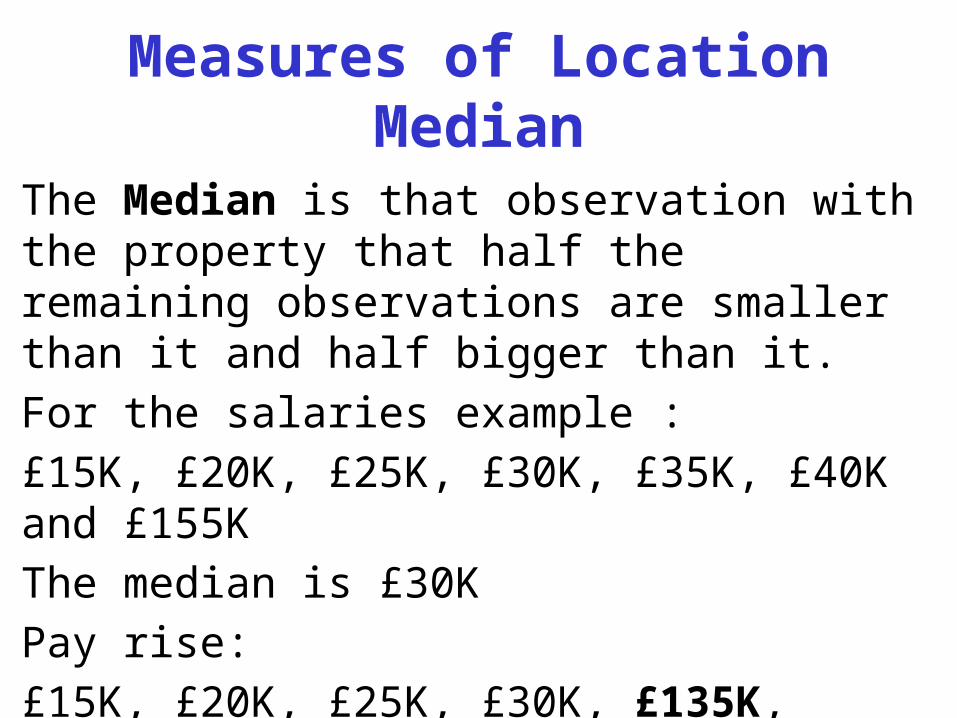
Measures of LocationMedian
The Median is that observation with the property that half the remaining observations are smaller than it and half bigger than it. For the salaries example :£15K, £20K, £25K, £30K, £35K, £40K and £155KThe median is £30KPay rise:£15K, £20K, £25K, £30K, £135K, £140K and £155K The median is still £30K

Alan Stewart on Averages The Times, Monday, January 4, 1954, p7Sir, In your issue of December 31 you quoted Mr. B.S. Morris as saying that many people are disturbed that about half the children are below the average in reading ability. This is only one of many similarly disturbing facts. About half the church steeples in the country are below average height; about half our coal scuttles below average capacity, and about half our babies below average weight. The only remedy would seem to be to repeal the law of averages.
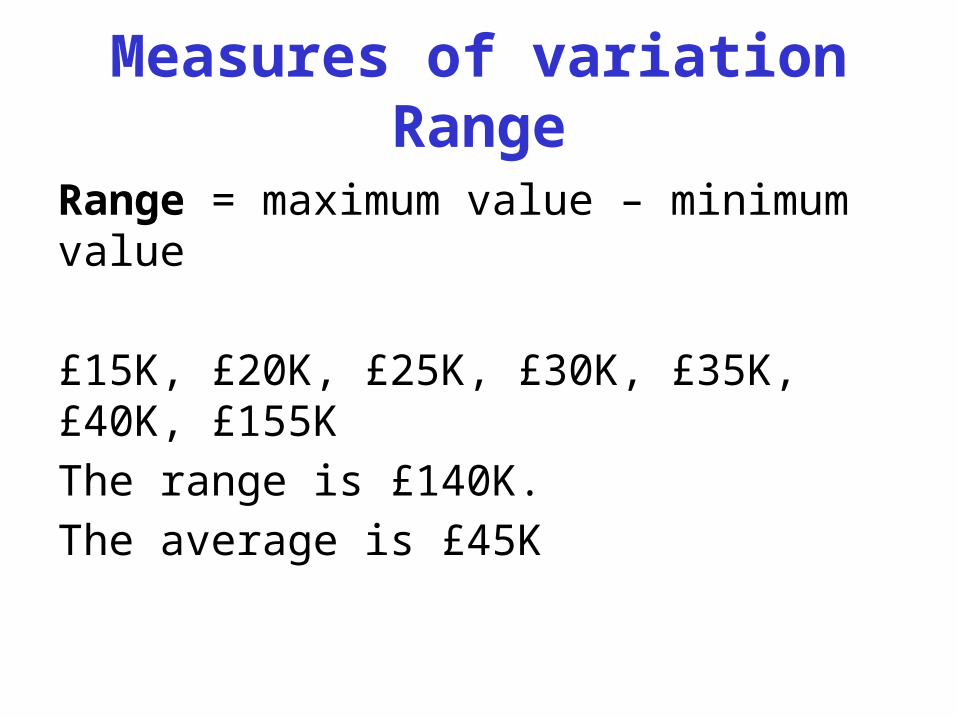
Measures of variationRange
Range = maximum value – minimum value
£15K, £20K, £25K, £30K, £35K, £40K, £155KThe range is £140K.The average is £45K

Measures of variationPercentiles
The pth percentile in a data set or population is that observation where p% of the population is smaller than or equal to it.Example: If ‘41’ is the 80th percentile in a set of observations then 80% of the numbers are smaller than or equal to 41.The median is the 50th percentileThe name given to the 25th percentile it is the first quartile.The name given to the 75th percentile it is the third quartile.
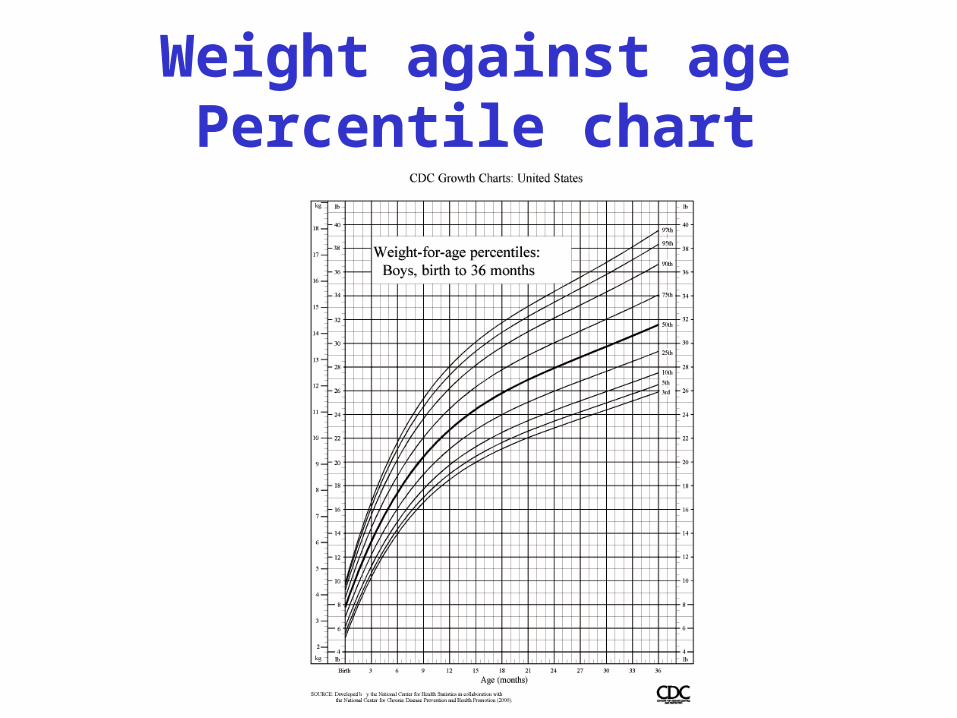
Weight against age Percentile chart
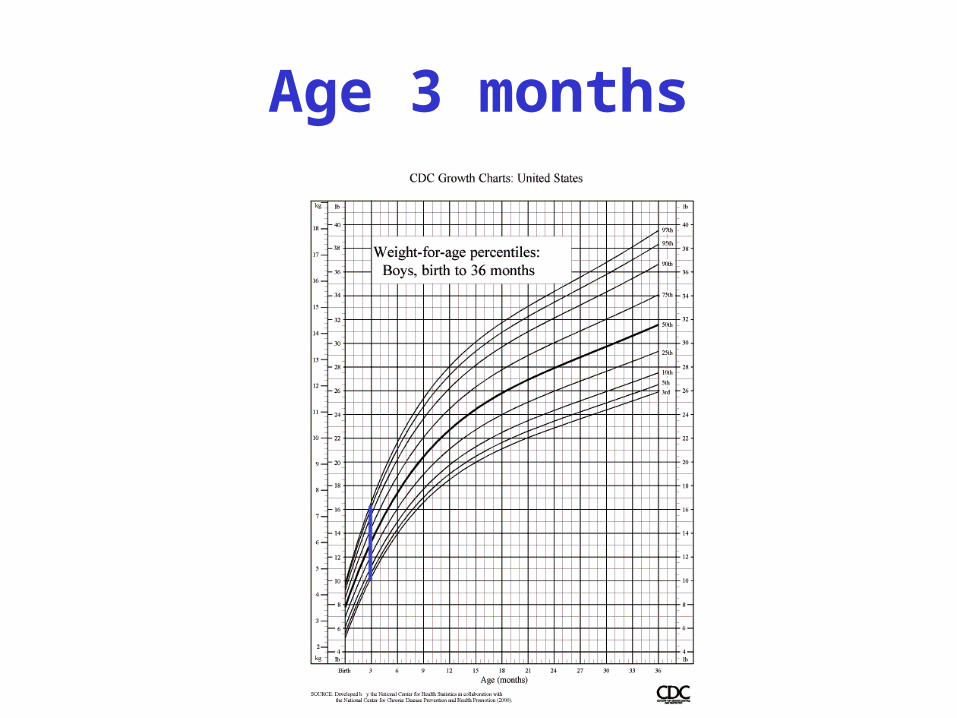
Age 3 months
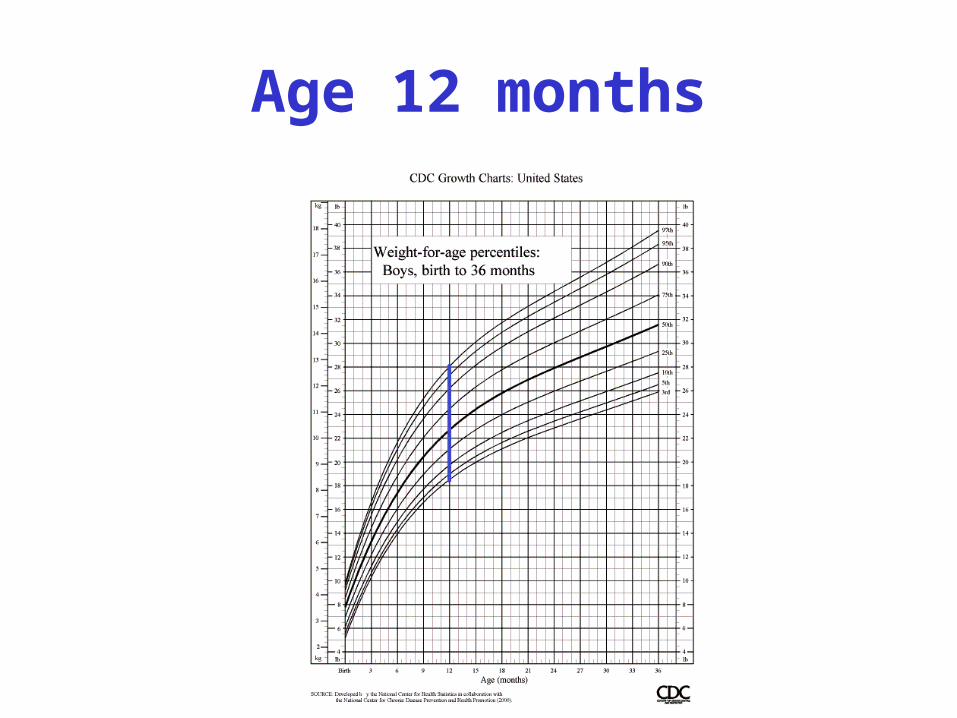
Age 12 months
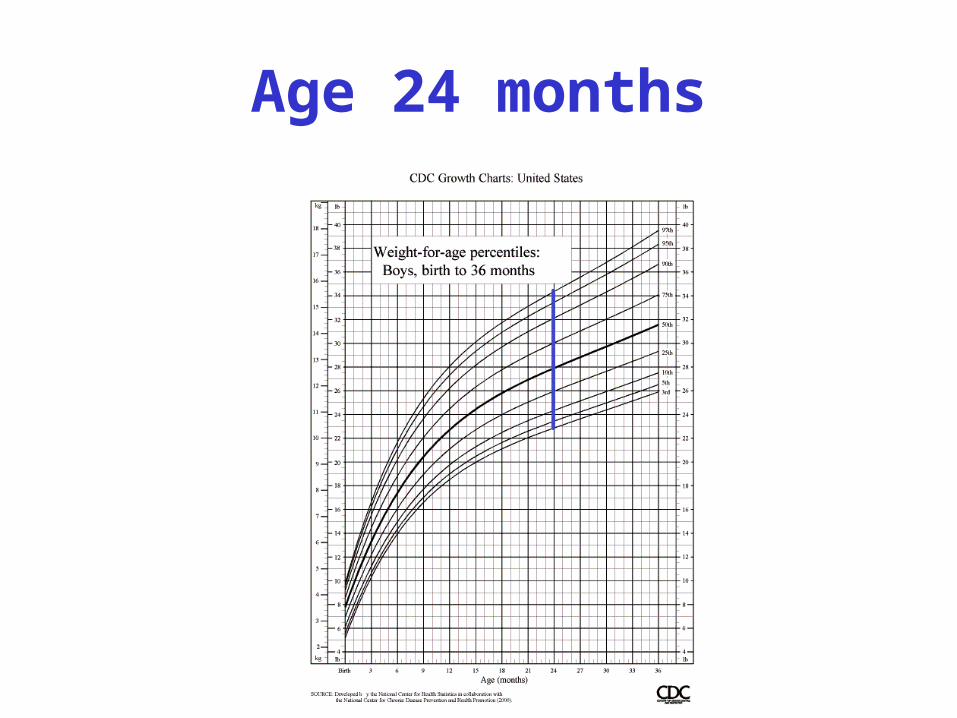
Age 24 months

Age 33 months

Age 33 months percentiles
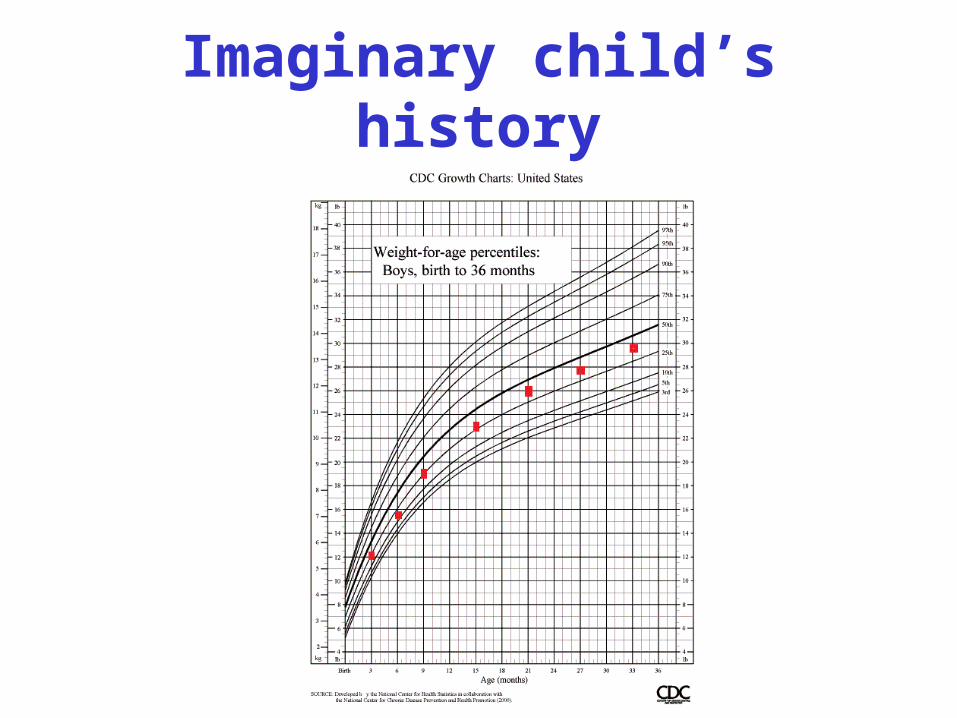
Imaginary child’s history
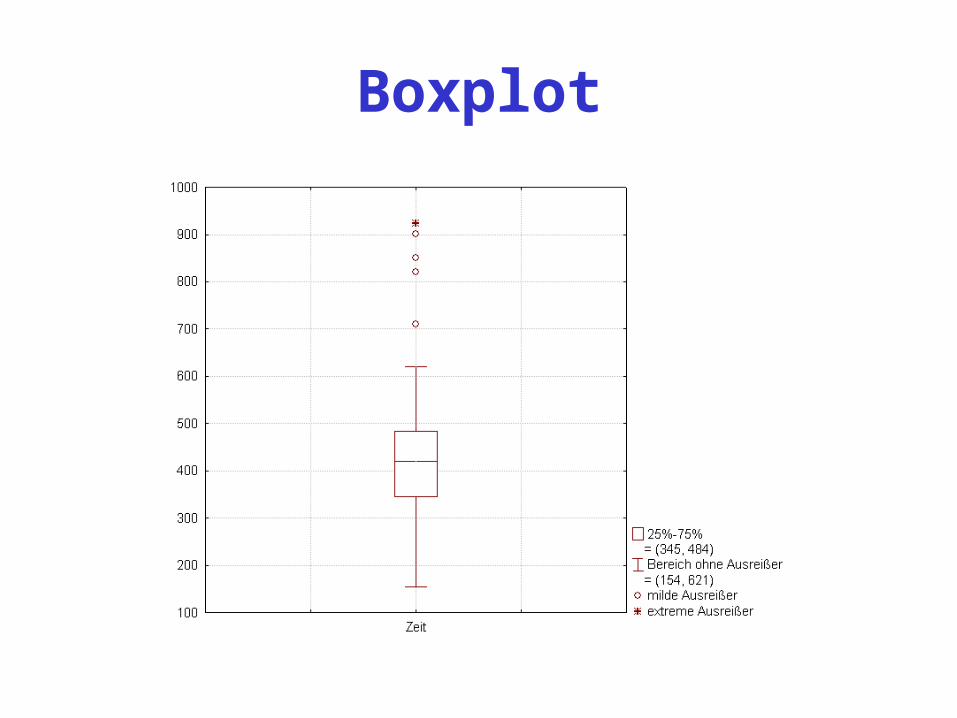
Boxplot

Standard deviation, σ•
σ = ට(𝑥1−μ)2 + (𝑥2−μ)2 + (𝑥3−μ)2 + (𝑥4−μ)2 + ··· + (𝑥𝑛−μ)2𝑛
μ = (𝑥1 + 𝑥2 + 𝑥3 + 𝑥4 + ··· + 𝑥𝑛) 𝑛
Quantifying Uncertainty
• What is probability?• Examples: coins, lottery, measurements,
annuities• Normal curve.

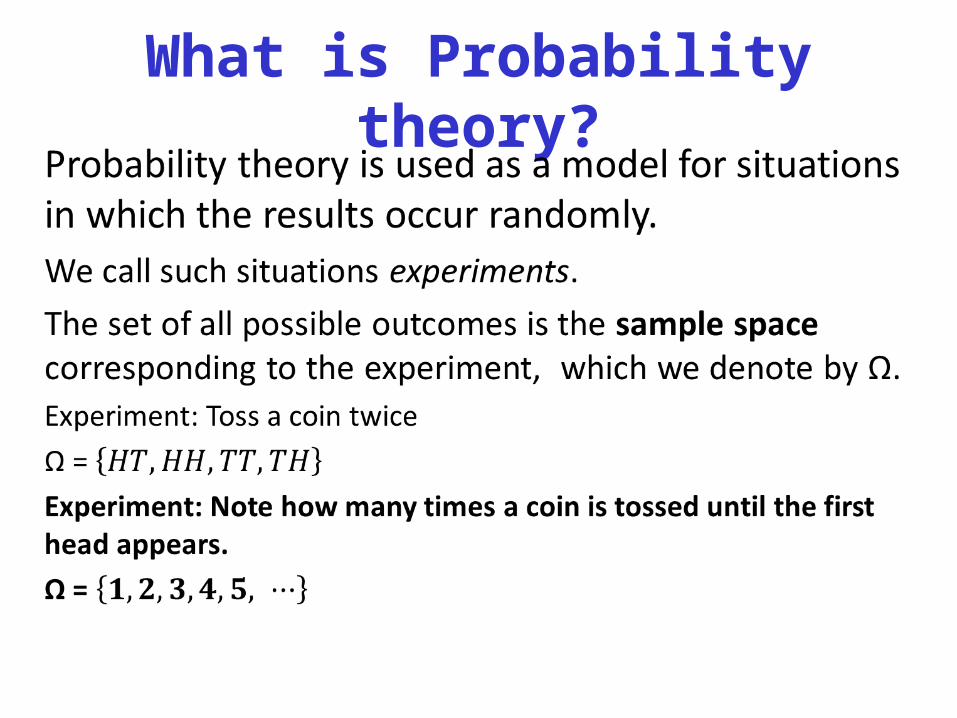
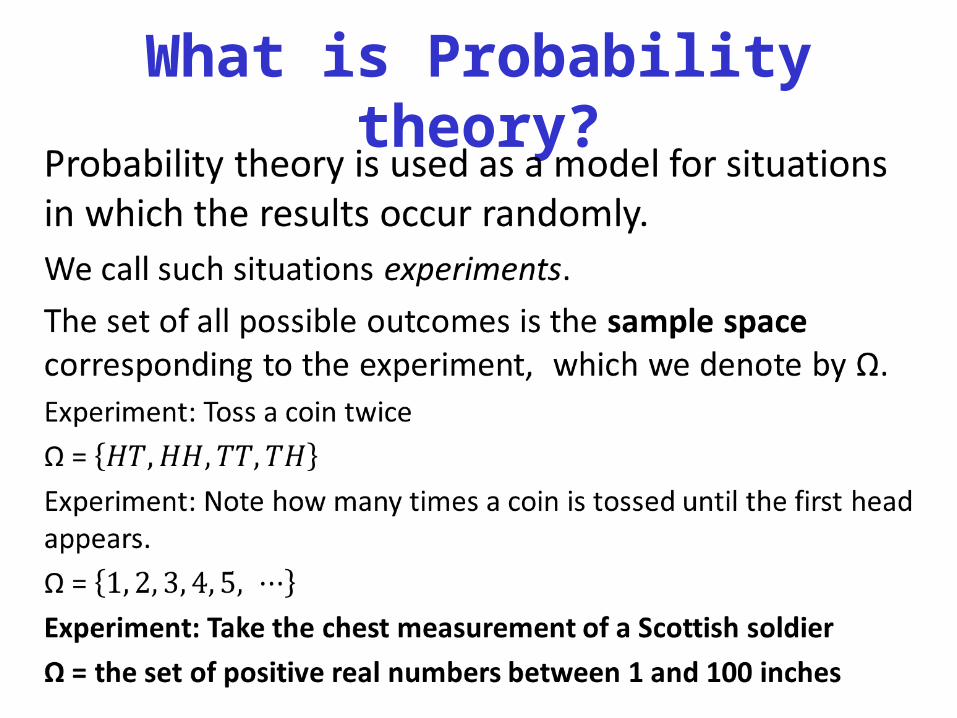
What is Probability theory?Probability theory is used as a model for situations in which the results occur randomly. We call such situations experiments.The set of all possible outcomes is the sample space corresponding to the experiment, which we denote by Ω.

What is Probability theory?•
What is Probability theory?•
What is Probability theory?•
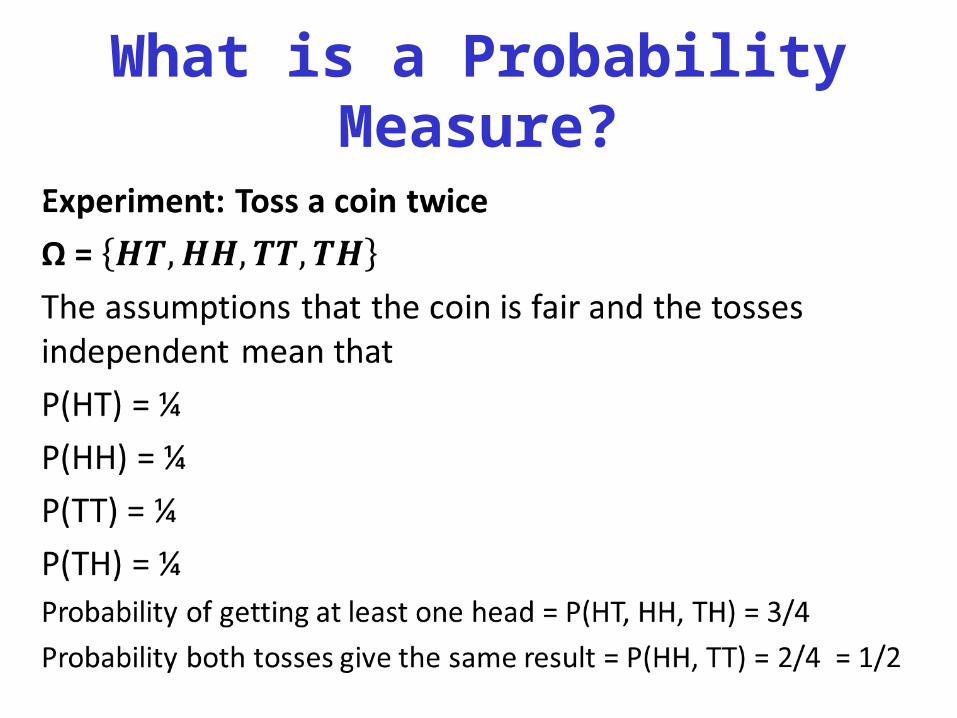
What is a Probability Measure?
•
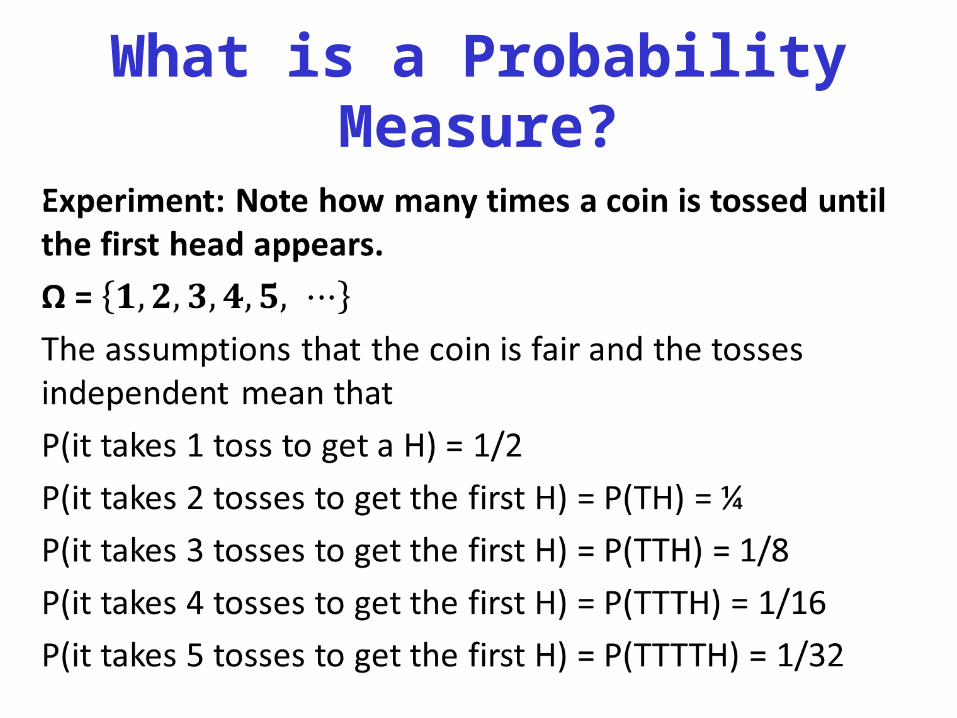
What is a Probability Measure?
•
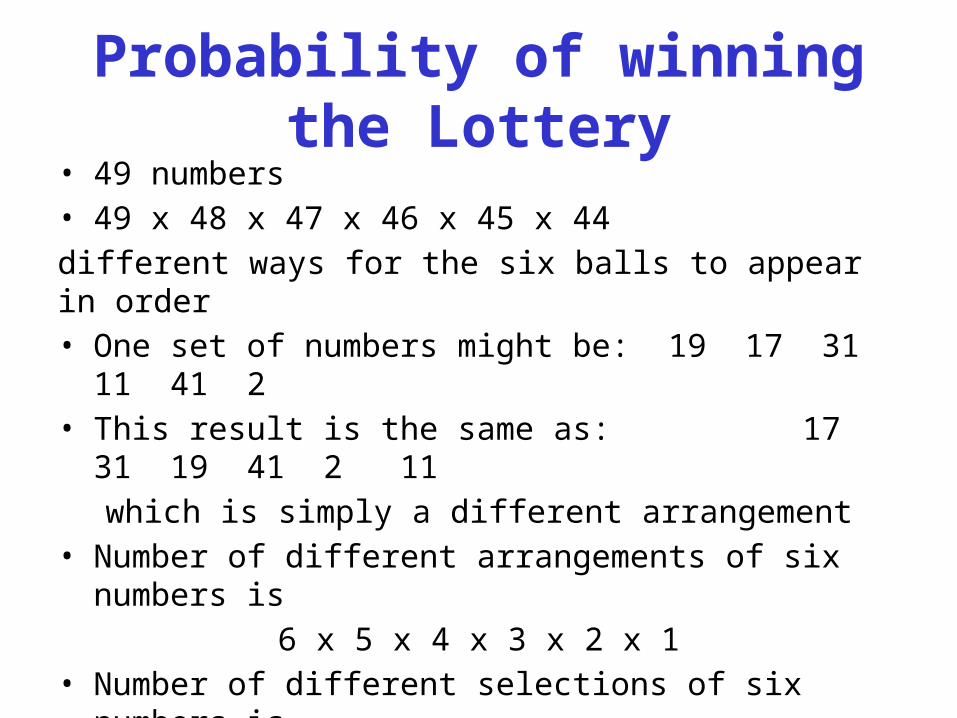
Probability of winning the Lottery• 49 numbers• 49 x 48 x 47 x 46 x 45 x 44different ways for the six balls to appear in order• One set of numbers might be: 19 17 31 11 41 2• This result is the same as: 17 31 19 41 2 11 which is simply a different arrangement• Number of different arrangements of six numbers is
6 x 5 x 4 x 3 x 2 x 1• Number of different selections of six numbers is
(49 x 48 x 47 x 46 x 45 x 44) / (6 x 5 x 4 x 3 x 2 x 1)=13,983,816.
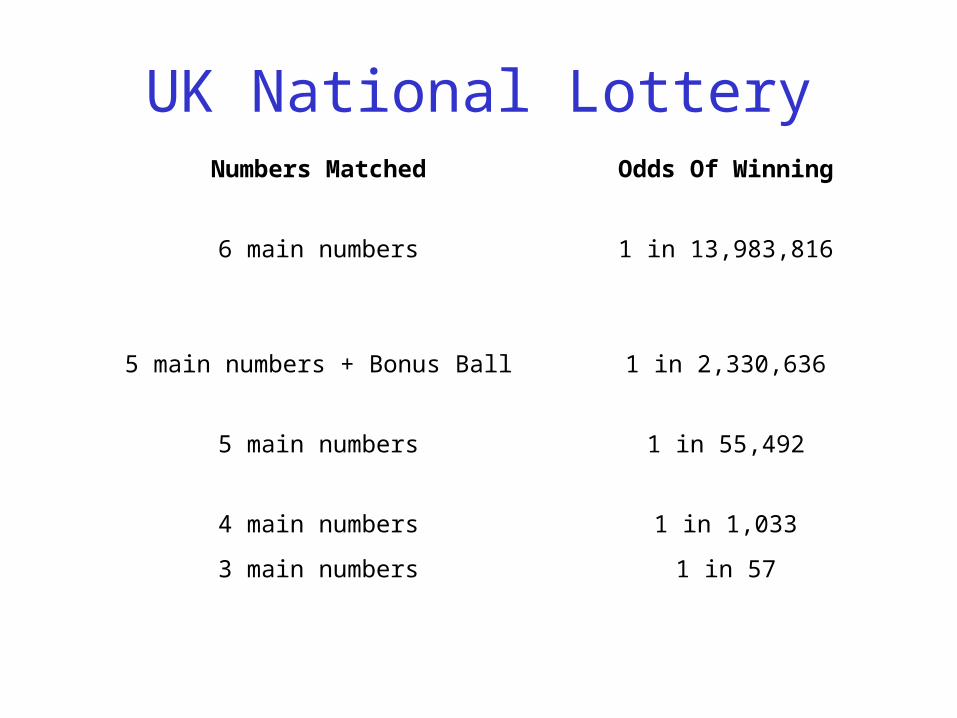
UK National LotteryNumbers Matched Odds Of Winning
6 main numbers 1 in 13,983,816
5 main numbers + Bonus Ball 1 in 2,330,636
5 main numbers 1 in 55,492
4 main numbers 1 in 1,033
3 main numbers 1 in 57
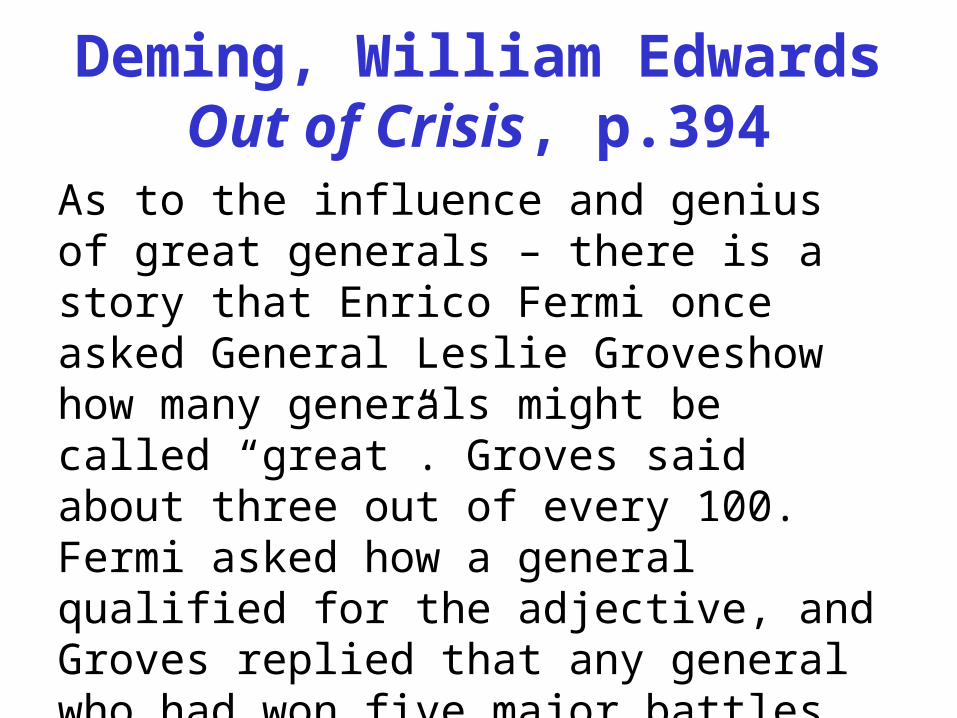
Deming, William Edwards Out of Crisis, p.394
As to the influence and genius of great generals – there is a story that Enrico Fermi once asked General Leslie Groveshow how many generals might be called “great”. Groves said about three out of every 100. Fermi asked how a general qualified for the adjective, and Groves replied that any general who had won five major battles in a row might safely be called great.
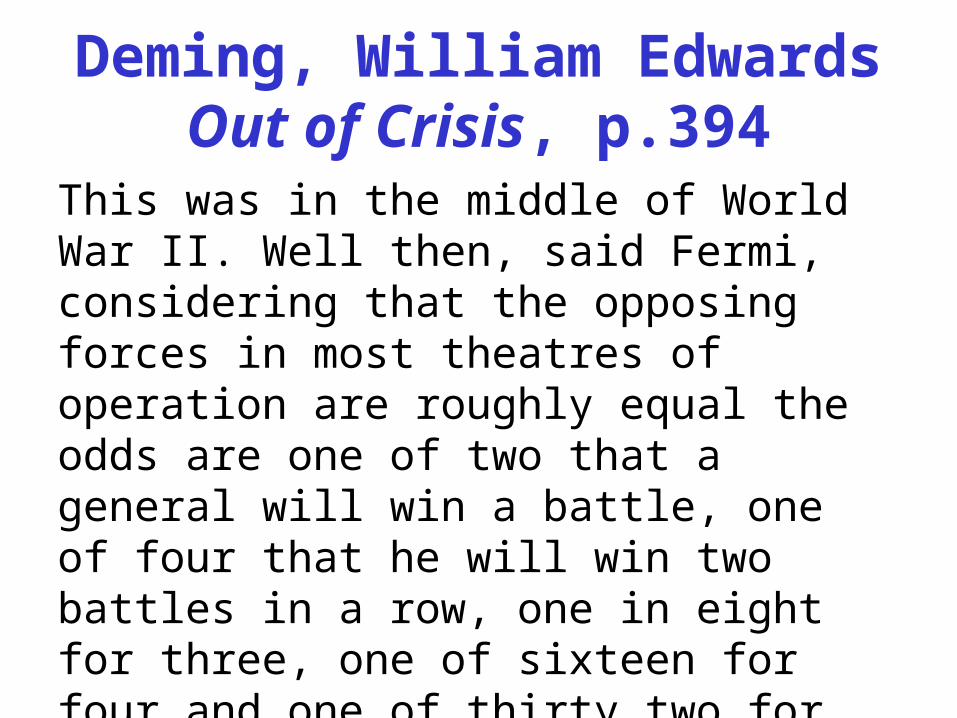
Deming, William Edwards Out of Crisis, p.394
This was in the middle of World War II. Well then, said Fermi, considering that the opposing forces in most theatres of operation are roughly equal the odds are one of two that a general will win a battle, one of four that he will win two battles in a row, one in eight for three, one of sixteen for four and one of thirty two for five.“So you are right, General, about three out of every 100.Mathematical probability, not genius.”

Pricing an AnnuityProbability from data
Price of Annuity bought at age 50 to deliver £1 on each subsequent birthday.Probability of living to 51 is 335/346Probability of living to 52 is 324/346Probability of living to 53 is 313/346Probability of living to 54 is 302/346….Probability of living to 84 is 20/346
The expected price of the annuity at age 50 is
335/346 + 324/346 + 313/346 + 302/346 + … + 20/346= £16.45
Age 1 it is £33Age 6 it is £41

Adolphe Quetelet
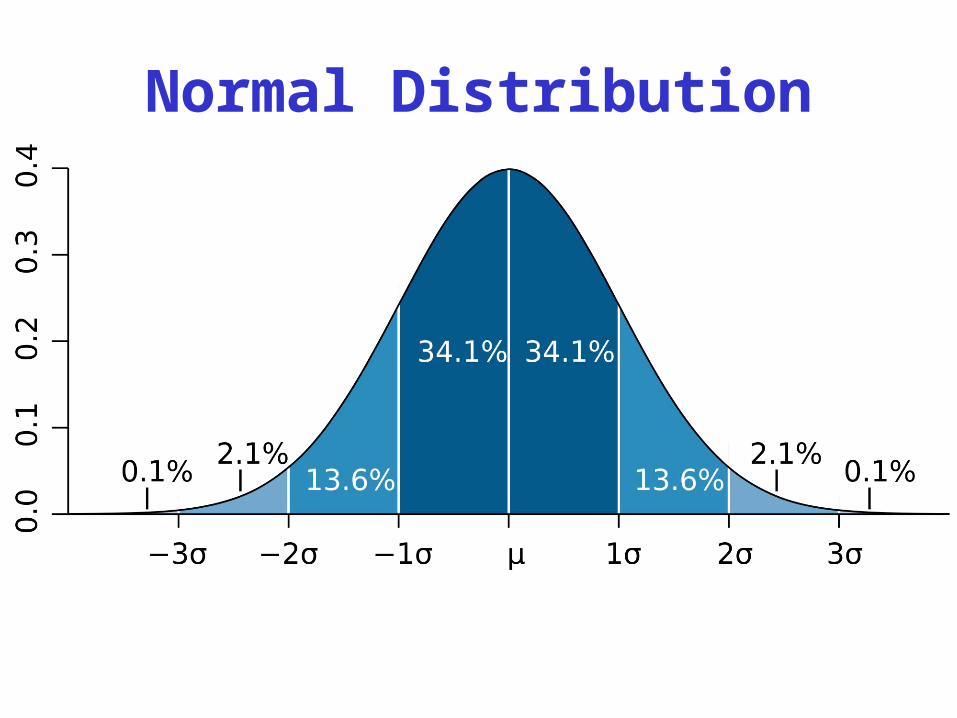
Normal Distribution

Normal Distribution

Central Limit Theorem - 1
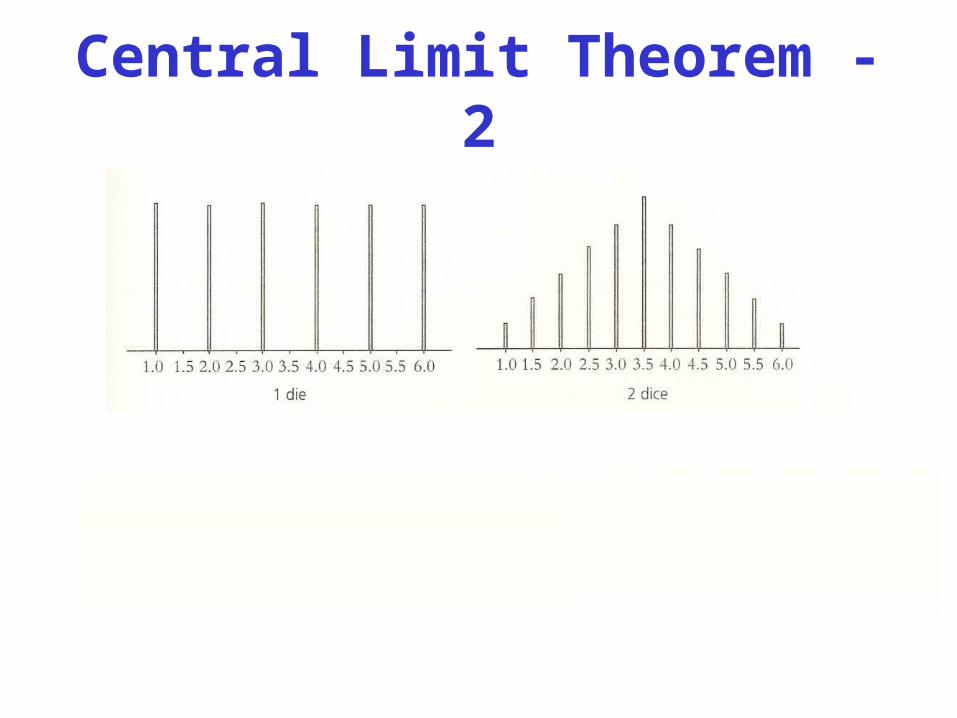
Central Limit Theorem - 2
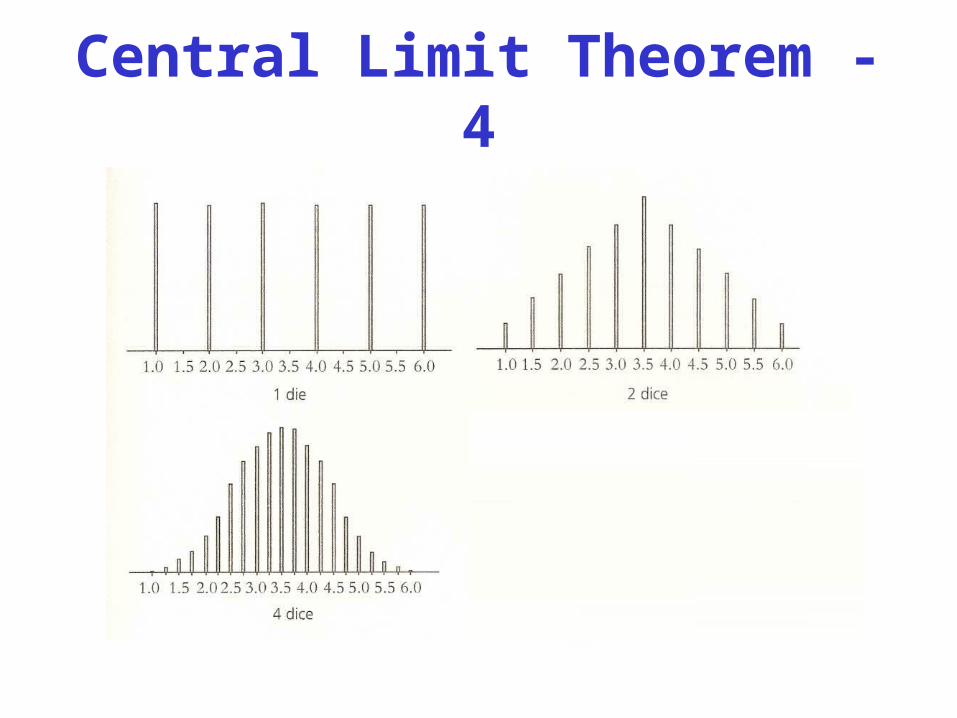
Central Limit Theorem - 4

Central Limit Theorem – 10

Central Limit Theorem
•

Central Limit Theorem for dice
•
For the Normal distribution 99.6% lie within 3 standard deviations of the mean, that is between3.5 – 3 x 0.54 and 3.5 + 3 x 0.54Which is 1.88 to 5.12
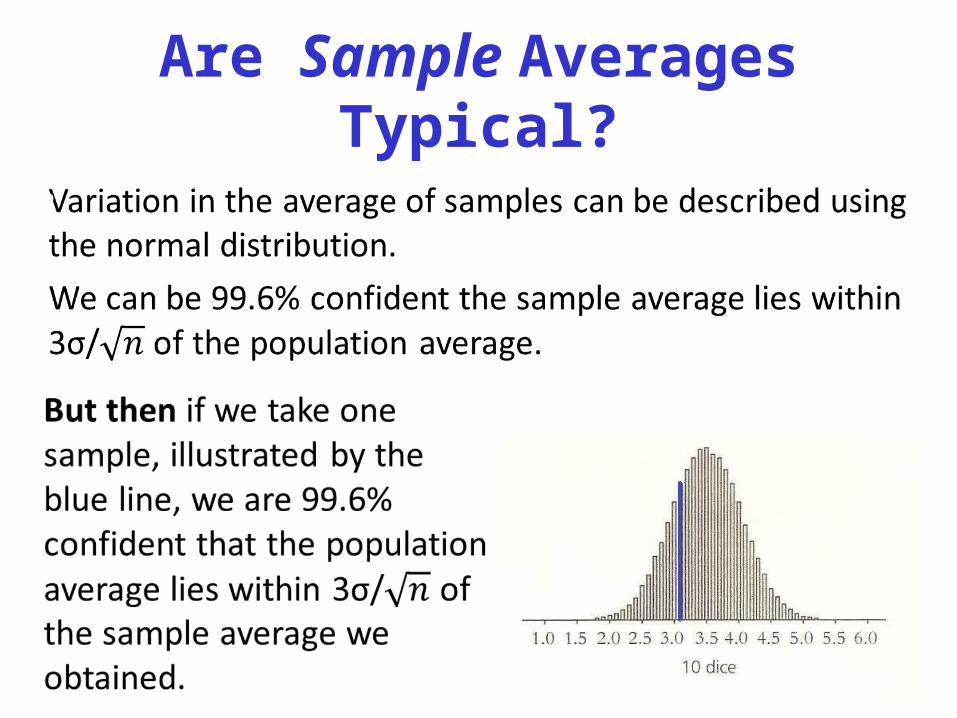
Are Sample Averages Typical?
•
Example of Opinion polls
Can we apply this to estimating the proportion, p, of people voting for Party A.With a sample size of about 1050 we can be 95% confident that the answer our poll gives will be within 3% of the underlying proportion p.
With a sample size of 2500 we can be 99.6% confident that the answer our poll gives will be within 3% of the underlying proportion p
Quote from the Introduction to Stephen Stigler’s History of Statistics.
Over the two centuries from 1700 to 1900, statistics underwent what might be described as simultaneous
horizontal and vertical development: horizontal in that the methods spread among disciplines from astronomy and geodesy to psychology, to biology, and to the social sciences and was transformed in the process; vertical in
that the understanding of the role of probability advanced as the analogy of games of chance gave way
to probability models for measurement…
Lectures At the Museum of London
• Ghosts of Departed Quantities: Calculus and its Limits Tuesday 25 September 2012
• Polynomials and their Roots Tuesday 6 November 2012
• From One to Many Geometries Tuesday 11 December 2012
• The Queen of Mathematics Tuesday 22 January 2013
• Are Averages Typical? Tuesday 19 February 2013
• Modelling the World Tuesday 19 March 2013


With a sample size of about 1050 we can be 95% confident that the answer our poll gives will be within 3% of the
underlying proportion p
•

What is a Probability Measure?
•