shaping schools: what timss tells us about education systems
TRANSCRIPT

Shaping Schools: What TIMSS tells us about education systemsEemer Eivers and Emma Chubb
2017
ERC Research Series: 1
1

Shaping Schools: What TIMSS tells us about education systems Introduction
Back to ContentsERC Research Series: 1
i
Table of Contents
Introduction 1
Demography 3
School size and population density 3
Languages of instruction 5
Structural Characteristics 8
Pre-school and early childhood education 8
Compulsory schooling 10
Private and public schools 11
Ability grouping and promotion 12
The school year 13
Mathematics and Science Curricula 16
Structure of the curriculum 16
Instructional time 18
Official time allocations 18
Actual time allocations 18
Teacher Qualification and Certification 21
Summary 23
References 25

Shaping Schools: What TIMSS tells us about education systems Introduction
ERC Research Series: 1
1Back to Contents
Introduction
This report draws on data collected as part of the 2015 cycle of TIMSS (Trends in International Mathematics and Science Study), one of the largest and most in-depth studies of educational achievement in the world. TIMSS is designed to assess the mathematics and science skills of students in Fourth grade (equivalent to Fourth Class in Ireland) and Eighth grade (Second Year) in participating countries. Ireland was one of the 56 countries and seven benchmark participants1 that took part in the 2015 cycle of TIMSS.
TIMSS is run under the auspices of the International Association for the Evaluation of Educational Achievement (IEA), a non-profit consortium of research institutes. TIMSS takes place every four years and the Educational Research Centre (ERC) manages Ireland’s participation. The 2015 cycle was the sixth in a series that began in 1995. Ireland participated in TIMSS 1995 (both primary and post-primary), 2011 (primary only), and 2015 (primary and post-primary).
Ireland’s initial national report for TIMSS 2015 (Clerkin, Perkins & Cunningham, 2016) was released to coincide with the international science and mathematics reports for TIMSS 2015 (Martin, Mullis, Foy & Hooper, 2016; Mullis, Martin, Foy & Hooper, 2016). The national report focussed on the main achievement results, whereas the international reports also contain a variety of contextual analyses (linked to achievement). Readers who are interested in the details of performance on science or mathematics in Ireland relative to other countries, or within the Irish student population, are referred to Clerkin et al. (2016), and to the international TIMSS website (https://timssandpirls.bc.edu/), from which the international reports and international databases can be accessed.
In contrast, the present report is one of a series of TIMSS-related reports that examines a specific aspect of TIMSS – in this case, the structural characteristics of education systems in Ireland and a set of “comparison countries” – with relatively little emphasis on achievement. With the release of any cycle of TIMSS data, attention tends to concentrate on the achievement outcomes, and the relative positions of countries in so-called league tables. However, a key element of TIMSS is the collection of contextual information, and attempting to use that information to understand the context within which teaching and learning takes place. Countries differ from each other in many ways, and some of those differences are reflected in education systems, which are in turn reflected in educational outcomes.
Although the links are rarely made explicit, country curricula and policies are, to a large extent, dictated by wider political, cultural and demographic considerations. Therefore, this report compares the education system in Ireland to those in other countries, focussing not just on policy and curriculum, but also on broader structural characteristics, and how demography and cultural contexts influence the learning experiences of children in schools. As TIMSS has been collecting contextual data since the 1995 cycle, the paper also examines some changes in education systems over that 20-year time frame. As well as the national and international initial TIMSS reports (Clerkin et al., 2016; Martin et al., 2016; Mullis et al., 2016), this report draws on information provided by countries for the TIMSS
1 Benchmarking participants must follow the same procedures as countries, and typically are regional divisions within large federalised countries (e.g., Florida, Quebec).

ERC Research Series: 1
2
Shaping Schools: What TIMSS tells us about education systems Introduction
Back to Contents
encyclopedia (Mullis, Martin, Goh & Cotter, 2016). The TIMSS encyclopedia is a reference document describing key details about the education systems in each country participating in TIMSS, outlining – by country – national mathematics and science curricula and how each are taught, the structure of education systems, and any policies related to mathematics and science instruction.
Although 56 countries participated in TIMSS 2015 in at least one grade level, this report focusses on a subset of these countries, selected on the basis of either being high-performing on the TIMSS assessments, or culturally or linguistically similar to Ireland. These selected comparison countries are shown in Table 1, in alphabetical order. Other TIMSS countries are also occasionally referred to in text where especially noteworthy findings are observed. Readers should note that, when referring to other countries, the terms ‘Fourth grade’ and ‘Eighth grade’ are used while ‘Fourth Class’ and ‘Second Year’ are used when referring specifically to Ireland.
Table 1: Selected comparison countries
Grade levels Reason for inclusion
Australia Both Cultural/linguistic similarity
England Both Cultural/linguistic similarity
Finland Grade 4 only High performance (science)
Hong Kong SAR Both High performance
New Zealand Both Cultural/linguistic similarity
Northern Ireland Grade 4 only Cultural/linguistic similarity
Rep. of Korea Both High performance
Russian Fed. Both High performance
Singapore Both High performance
Slovenia Both High performance (science)
United States Both Cultural/linguistic similarity
The remainder of this report is grouped around four main themes: demographic characteristics, structural characteristics, the nature of mathematics and science curricula (including instructional time), and teacher qualifications and certification.

Shaping Schools: What TIMSS tells us about education systems Demography
ERC Research Series: 1
3Back to Contents
Demography
This section outlines some general demographic characteristics of Ireland and selected comparison countries, relating them to school size and language of instruction.
School size and population density A somewhat unusual feature of the Irish education system is the preponderance of small, mainly rural, primary schools. Of primary schools open during the 2016/17 school year, 19% had an enrolment of 50 pupils or fewer, while 41% had fewer than 100 pupils. Irish schools were smaller than the average across all TIMSS countries (Table 2). At primary level, average enrolment was approximately half that of the TIMSS average (303 vs 623, respectively). At post-primary level, Irish schools were also smaller than average, but the difference was less pronounced (624 versus a TIMSS average enrolment of 825). In TIMSS 1995, a similar pattern was apparent. Then, the average size of Irish primary schools was slightly less than half that of the international average, while the average size of Irish post-primary schools was also slightly smaller although the size difference was not as pronounced as for primary level.
In many countries, school size at primary level is broadly linked to a combination of a country’s population density and the percentage of the population living in urban areas. For example, Ireland has the smallest average primary school size of all the countries shown in Table 2. Ireland also has both a relatively low population density (67 people per square km) and a relatively low percentage of the population (63%) living in urban areas. In contrast, both Singapore and Hong Kong have extremely high population densities (over 100 times more dense than in Ireland), all living in urban areas, while Korea has a relatively high urban population and a very high population density. The largest average primary school enrolments are found in these three countries. Notable exceptions to the general trend are Australia and the Russian Federation, both with medium-sized primary schools despite very low population densities. However, this may be because both have large swathes of almost entirely uninhabited land (i.e., the overall population density is a poor reflection of the density in inhabited areas).
The relationship between population density, urbanicity and post-primary school size is less pronounced. Among the comparison countries shown in Table 2, Singapore and Hong Kong again had the largest average enrolment, followed by England, while Ireland and Slovenia had the smallest average enrolment. Across all TIMSS participating countries, the largest average post-primary enrolments were found in the UAE (1802 students) and Qatar (1652 students), while smallest average enrolments were in Iran (206 students) and Saudi Arabia (328 students).

ERC Research Series: 1
4
Shaping Schools: What TIMSS tells us about education systems Demography
Back to Contents
Table 2: National population density, percent living in urban areas, enrolment sizes
Population Mean school enrolment
Density (sq. km) % urban Primary Post-Primary
Australia 3 89 524 986
England 411 81 364 1153
Finland 18 84 330 -
Hong Kong SAR 6,897 100 729 855
Ireland 67 63 303 624
New Zealand 17 86 385 1085
Northern Ireland 133 64 308 -
Rep. of Korea 517 82 809 814
Russian Fed. 9 74 742 811
Singapore 7,737 100 1424 1255
Slovenia 102 50 472 476
United States 35 81 547 749
TIMSS - - 623 825
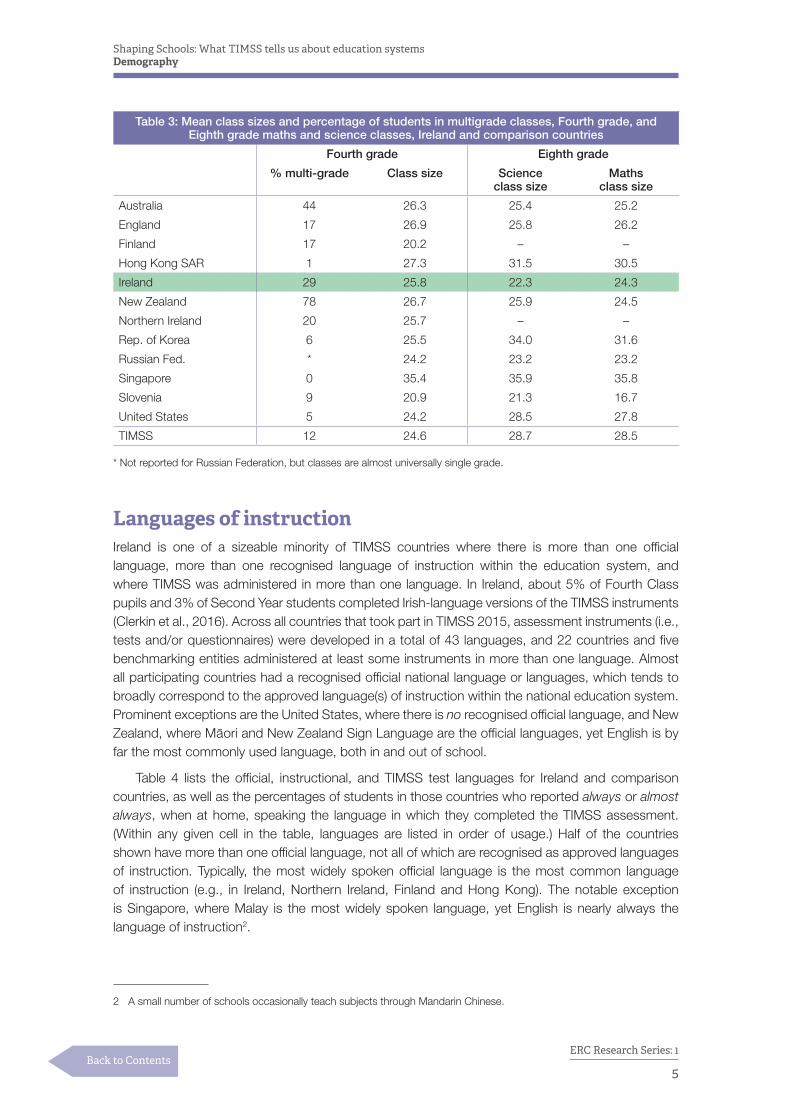
Average Fourth Grade class size was 24.6 pupils per classroom (including pupils at other grade levels, where a multi-grade setting applied) (Table 3). At 25.8 students per class, Irish classes were slightly larger than the international average, as were classes in most of our comparison countries. For example, Australia, England, Hong Kong, New Zealand and Singapore all had average class sizes larger than both the TIMSS and Irish averages. Across all TIMSS countries, average class size ranged from 19.2 (Slovak Republic) to 35.4 (Singapore) – a difference of 16 students per average classroom. For more information on classroom characteristics at Fourth Class, see Clerkin, Perkins and Chubb (in press-a).
In most countries, Eighth grade classes were larger than Fourth grade classes. Across TIMSS as a whole, mathematics and science classes averaged 28.5 and 28.7 students per class – i.e., approximately four more students per class than at Fourth grade. Ireland is one of a small number of countries where Eighth grade classes tended to be smaller than Fourth grade classes. On average, Second Year science classes had 22.3 students while mathematics classes had 24.3 students – both smaller than the TIMSS averages for Eighth grade, and for Fourth Class in Ireland. As at primary level, Slovenia averaged smaller classes than most countries (particularly for mathematics where average class size was 16.7 students). In contrast, Singapore had much larger classes than all other comparison countries (35.8 students in the average mathematics and 35.9 in the average science class). For more information on the characteristics of mathematics and science classes in Second Year, see Clerkin, Perkins and Chubb (in press-b).
As well as being slightly larger than the TIMSS average, classes in Irish primary schools were more likely to be multi-grade. Across all TIMSS countries, 12% of Fourth grade pupils were in multi-grade classrooms, compared to 29% in Ireland. Multi-grade classrooms were also common in Australia (44% of pupils), New Zealand (78%) and Northern Ireland (20%), but rare or non-existent in Hong Kong, Singapore, the US and Korea. Broadly, multi-grade classrooms were more likely to be found in countries with low population density and/or small school sizes. However, in the case of Australia and New Zealand, multi-grade classes or composite classes are sometimes a deliberate decision rather than necessitated by small or unevenly distributed enrolment (as is often the case in Ireland). Schools in both countries often adopt what is called a “stages, not ages” approach to structuring classes, partly in the belief that composite classes can have socio-emotional benefits and foster cross age-group friendships (Smith, 2003).
Shaping Schools: What TIMSS tells us about education systems Demography
ERC Research Series: 1
5Back to Contents
Table 3: Mean class sizes and percentage of students in multigrade classes, Fourth grade, and Eighth grade maths and science classes, Ireland and comparison countries
Fourth grade Eighth grade
% multi-grade Class size Science class size
Maths class size
Australia 44 26.3 25.4 25.2
England 17 26.9 25.8 26.2
Finland 17 20.2 – –
Hong Kong SAR 1 27.3 31.5 30.5
Ireland 29 25.8 22.3 24.3
New Zealand 78 26.7 25.9 24.5
Northern Ireland 20 25.7 – –
Rep. of Korea 6 25.5 34.0 31.6
Russian Fed. * 24.2 23.2 23.2
Singapore 0 35.4 35.9 35.8
Slovenia 9 20.9 21.3 16.7
United States 5 24.2 28.5 27.8
TIMSS 12 24.6 28.7 28.5
* Not reported for Russian Federation, but classes are almost universally single grade.
Languages of instructionIreland is one of a sizeable minority of TIMSS countries where there is more than one official language, more than one recognised language of instruction within the education system, and where TIMSS was administered in more than one language. In Ireland, about 5% of Fourth Class pupils and 3% of Second Year students completed Irish-language versions of the TIMSS instruments (Clerkin et al., 2016). Across all countries that took part in TIMSS 2015, assessment instruments (i.e., tests and/or questionnaires) were developed in a total of 43 languages, and 22 countries and five benchmarking entities administered at least some instruments in more than one language. Almost all participating countries had a recognised official national language or languages, which tends to broadly correspond to the approved language(s) of instruction within the national education system. Prominent exceptions are the United States, where there is no recognised official language, and New Zealand, where Māori and New Zealand Sign Language are the official languages, yet English is by far the most commonly used language, both in and out of school.
Table 4 lists the official, instructional, and TIMSS test languages for Ireland and comparison countries, as well as the percentages of students in those countries who reported always or almost always, when at home, speaking the language in which they completed the TIMSS assessment. (Within any given cell in the table, languages are listed in order of usage.) Half of the countries shown have more than one official language, not all of which are recognised as approved languages of instruction. Typically, the most widely spoken official language is the most common language of instruction (e.g., in Ireland, Northern Ireland, Finland and Hong Kong). The notable exception is Singapore, where Malay is the most widely spoken language, yet English is nearly always the language of instruction2.
2 A small number of schools occasionally teach subjects through Mandarin Chinese.

ERC Research Series: 1
6
Shaping Schools: What TIMSS tells us about education systems Demography
Back to Contents
Table 4: Official languages, approved languages of instruction, languages in which the TIMSS test was administered, and percentage of students who always or almost always spoke the TIMSS test
language at home
National language TIMSS test language % speaking test language
Official Instruction Primary Post-primary Primary Post-primary
Australia English English English English 85 93
England English English English English 83 95
Finland Finnish, Swedish
Finnish, Swedish
Finnish, Swedish - 89 -
Hong Kong Chinese, English
None (Prim.), Chinese, English (P-Pr.)
Chinese, English
Chinese, English 71 84
Ireland English, Irish English, Irish English, Irish English, Irish 88 89
New ZealandMāori, NZ Sign Language*
English, Māori, Samoan
English English 84 93
Northern Ireland
English, Irish, Ulster Scots English, Irish English, Irish English, Irish 92 -
Rep. of Korea Korean Korean Korean Korean 92 100
Russian Fed. RussianRussian, 39 other languages
Russian Russian 91 95
Singapore
Malay, Chinese (Mandarin), Tamil, English
English English English 49 65
Slovenia SlovenianSlovenian, Hungarian, Italian
Slovenian Slovenian 86 91
United States None English, Spanish English English 79 91
TIMSS - - - - 79 76
* Although English is by far the most widely-spoken language, it does not have official status under acts of Parliament.
Hong Kong does not have a formally approved language of instruction at primary level but most primary pupils are taught through Cantonese (a Chinese dialect, and by far the most widely spoken language in Hong Kong). As part of the transfer of sovereignty in 1997, most post-primary schools were required to change their medium of instruction from English to Chinese, but a minority of “approved” schools were allowed to retain English as the medium of instruction. New Zealand is unusual in that the English is not a recognised official language, yet it is the language of instruction in the vast majority of schools. Māori, which is a recognised official language, is the language of instruction for about 4% of students who are enrolled in bilingual or full immersion Māori-medium instruction. Most students learning in Māori-medium settings have English as their first language and Māori as their second.
New Zealand, Russia, Slovenia and the United States were among those countries that opted to restrict the TIMSS assessment to a single language, despite having more than one language of instruction. The inexact match between official, instructional, and TIMSS test languages is part of the reason for the large between-country differences in the percentages of students who reported that they always or almost always spoke the language of the test at home. In Ireland, 88% of primary and 89% of post-primary students always or almost always did so, higher than the equivalent TIMSS averages (79% and 76%, respectively) but lower than that reported in Ireland in TIMSS 1995 (92% and 98%, respectively).

Shaping Schools: What TIMSS tells us about education systems Demography
ERC Research Series: 1
7Back to Contents
The percentages are also lower than the equivalent percentages for 2015 in Northern Ireland, the Republic of Korea and the Russian Federation. In contrast, in Hong Kong, only 71% of primary school pupils always or almost always spoke the language of the test at home, while only half of primary school pupils in Singapore did so. Of course, both Singapore and Hong Kong are among the highest-performing countries in TIMSS, illustrating that associations between home and instructional languages and achievement are by no means as direct as often assumed.

ERC Research Series: 1
8
Shaping Schools: What TIMSS tells us about education systems Structural Characteristics
Back to Contents
Structural Characteristics
This section outlines the structure of education systems, including the availability of pre-school and early childhood programmes, the ages/grade levels for which schooling is compulsory, and practices related to ability grouping and promotion.
Pre-school and early childhood educationPre-school and early childhood educational provision are frequently divided into those directed at children under three and those aged three and over (e.g., European Commission/EACEA /Eurydice, 2016; Mullis, Martin, Goh & Cotter, 2016). In TIMSS 2015, almost all countries (and all of our comparison countries) reported that they had universal availability of early childhood programmes available for children aged three and older (Table 5). Exceptions were Botswana, Oman, and The Netherlands.3 In contrast, just under half of TIMSS participating countries (24 of 50) had universal availability of early childhood programmes available for children under the age of three. Amongst Ireland’s 11 comparison countries, five (England, Northern Ireland, Republic of Korea, Russian Federation and Slovenia) had universal programmes for children under the age of three.
Table 5: Availability of universal early childhood education programs for those aged under three and those aged three and older, Ireland and comparison countries
Aged under 3 Aged 3 or older
Australia N Y
England Y Y
Finland N Y
Hong Kong SAR N Y
Ireland N Y
New Zealand N Y
Northern Ireland Y Y
Rep. of Korea Y Y
Russian Fed. Y Y
Singapore N Y
Slovenia Y Y
United States Varies by state Varies by state
In terms of trends in early childhood education and pre-school provision, similar data are not available from TIMSS 1995. However, we know that pre-school provision for the over threes has been a longstanding feature of the Irish education system. This is because, as outlined in the box, international classifications consider the Infant grades to be ISCED 0 rather than ISCED 1 (i.e., pre-primary, not primary).4 In relation to provision for younger children, other sources (e.g., OECD, 1996) indicate that in 1995 Ireland had quite limited availability of early childhood education, and what
3 The response from The Netherlands is slightly misleading as 90% of Dutch three-year olds and 100% of four-year olds participate in early childhood programmes (European Commission/EACEA/Eurydice, 2016). While Dutch children are not universally “entitled” to access, access in universally available.
4 The International Standard Classification of Education (ISCED) framework is a tool used to categorise and report cross-nationally comparable education statistics (OECD, 1999; OECD/EUROSTAT/UNESCO, 2015).

Shaping Schools: What TIMSS tells us about education systems Structural Characteristics
ERC Research Series: 1
9Back to Contents
was available tended to be expensive relative to other countries. This is likely to have contributed to the fact that many parents enrolled their child in Junior Infants as soon as they reached 4 years of age, well ahead of age 6, when schooling officially becomes compulsory. For example, the OECD’s Education at a Glance report shows that in 1994, only 1% of Irish three-year olds were enrolled in an early childhood education programme (OECD average: 40%), compared to 54% of four-year olds (i.e., when Junior Infants became available as an option) and all five-year olds (OECD, 1996).
When primary school is not primary school – the unusual case of the Infants grades
In Ireland, the Infants grades are considered to be part of primary school, and primary education is seen to consist of an eight-year cycle (from Junior Infants to Sixth class). However, under ISCED-97, “… in countries where primary education starts at an early age (e.g., at age 4 or 4-and-a-half), children enrolled in these grades should be classified as ISCED 1 only if the duration of the school day, the qualifications of the school staff, and the level of content of the programmes are similar to the grades where children of age 6 are enrolled” (p.29). Therefore, due to the shorter school day, Infants were classified as pre-primary, not primary level. The more recent ISCED-2011 uses slightly different criteria (mainly age-based) but still classifies Infants grades as pre-primary.
As such, attending a two-year pre-school programme is almost universal in Ireland, as almost every child spends two years in the Infant grades before starting First Class and what is considered, internationally, to be primary school. Nonetheless, most people in Ireland believe that primary school begins with Junior Infants, and that average primary school starting age is about four or five, not six or seven.
This causes considerable interpretation issues with Irish data in international studies. For example, in TIMSS 2015, 5% of parents in Ireland indicated that their child had never attended pre-school, while a further 25% indicated that they had done so for less than a year. These data are not plausible. Similar issues arise where parents and teachers are asked to rate children’s preparedness for primary school or when pupils and students are asked at what age they started school.
All TIMSS questionnaires are adapted to an Irish context. They include instructions to treat Infants grades as part of pre-school, or have been rephrased to ask about starting ‘First Class’ rather than starting ‘primary school’. However, a sizeable minority of respondents still answer questions with reference to Junior Infants, not First class, thus generating some data that are unusable. How best to address what “primary school” means in Ireland – and communicate this to parents and teachers – is an issue that crops up in each cycle of TIMSS (and its companion study, PIRLS). As yet, no simple solution has been found, and it remains an illustrative example of how international comparisons, while generally informative, can occasionally mislead.
Internationally, there has been an increase in participation in early childhood education programmes over the last 20 years but there are few countries where the increase had been as pronounced as in Ireland. For example, on average across OECD countries, participation levels for 3-year olds had risen by 30% to 71%, while, in Ireland, the increase was from 1% to 46% (OECD, 2016a). The increase can be largely attributed to the introduction of the Early Childhood Care and Education (ECCE) Scheme in 2010.

ERC Research Series: 1
10
Shaping Schools: What TIMSS tells us about education systems Structural Characteristics
Back to Contents
A consequence of the ECCE scheme is that parents are now more likely to delay enrolment in Junior Infants. For example, while over half of all four-year-olds were enrolled in Junior Infants in 1994, by 2015 this had dropped to 34%.5 The recent extension of the scheme to cover ages 3 to 5½ can be expected to further raise the average age at which children start Junior Infants, and to have a knock-on effect on primary school starting age and the age at which Irish children participate in TIMSS.
Compulsory schoolingWhile children in Ireland can be enrolled in school from as young as four years old, as indicated, schooling is compulsory only between the ages of 6 and 16. Having completed two years in Junior and Senior Infants, almost all children start primary school (First class) around age six or age seven. Of the countries that took part in TIMSS 2015, all but two (Oman and Botswana) had particular ages and/or grade levels at which schooling was compulsory. Age six was by far the most common age at which compulsory schooling began (32 countries). Ireland was one of 11 countries where schooling was compulsory between the ages of 6 and 16, while a further 10 countries had compulsory schooling between the ages of 6 and 17.
Table 6 shows compulsory age and grade levels for Ireland and our comparison countries. As can be seen, children in Northern Ireland are required to attend school from the age of four, which is the youngest statutory starting age in Europe. However, between the ages of four and six, the Northern Irish curriculum is play-based and is quite different to that for subsequent years. England is one of five countries where schooling is compulsory for five-year olds, while Finland is one of seven countries where schooling is compulsory only from seven years of age. In the United States, policies on school attendance age vary by state, but compulsory schooling usually begins between the ages of five and seven years.
There was more variation between countries for minimum school-leaving age. For example, it is possible for students to leave school at 14 in the Republic of Korea and Singapore, and at 15 in Slovenia. In contrast, the Russian Federation was one of nine countries where students cannot leave school until they reach 17 or 18 years of age.
Table 6: Ages and grade levels for which schooling is compulsory, Ireland and comparison countries
Compulsory schooling
Ages Grades
Australia 6-16 1-9
England 5-16 1-11
Finland 7-17 1-9
Hong Kong SAR – 1-9
Ireland 6-16 –
New Zealand 6-16 –
Northern Ireland 4-16 1-12
Rep. of Korea 6-14 1-9
Russian Fed. 6.5-17 or 18 1-11
Singapore 6-14 1-6
Slovenia 6-15 1-9
United States Varies Varies
A dash (–) indicates data not provided.
5 Data obtained from the DES interactive statistics database, available from http://education.ie/en/Publications/Statistics/Education-Statistics-Database/

Shaping Schools: What TIMSS tells us about education systems Structural Characteristics
ERC Research Series: 1
11Back to Contents
Private and public schoolsAlthough not examined as part of TIMSS, it should be noted that one quite unusual structural characteristic of the Irish education system – particularly at primary level – is the extent of private ownership. Almost all publicly funded primary schools and a large proportion of post-primary schools are privately owned and managed by denominational bodies, usually the Roman Catholic Church.
Based on data from the Department of Education and Skills’ website, 89.7% of primary schools open during the 2016/17 school year have a Catholic ethos, meaning that they are (usually) under the ownership and patronage of the local Catholic bishop.6 A majority of the remainder of schools have some form of specific Christian ethos, with only 4% being inter- or multi-denominational. At post-primary level, almost all Irish schools are either Roman Catholic (48.5%), Church of Ireland (3.2%), or multi-/inter-denominational (47.7%). As at primary level, denominational schools are privately owned and managed, although publicly funded.
Internationally, most education systems have at least some privately owned schools, and many have denominational schools, but usually to a lesser extent than is the case in Ireland. For example, OECD data from PISA 2015 indicate that 83.5% of post-primary students across all OECD countries attended public schools whereas, in Ireland, only 45% did so (OECD, 2016b). The OECD defines private schools as those managed by a non-government organisation, whereas public schools are “managed directly or indirectly by a public education authority, government agency, or governing board appointed by government or elected by public franchise” (OECD, 2016b, p. 56). The OECD further distinguishes between privately owned schools that are largely state-funded and those that are largely privately funded. Ireland is again atypical in that almost all private post-primary schools are funded by the state and are denominational, whereas across the OECD a majority of private schools are non-denominational, and about one quarter are not state-dependent.
Among our comparison countries, privately owned schools are not a feature of the primary or post-primary systems in Finland or the Russian Federation and are extremely unusual in Slovenia (where they “barely reach double figures” [Protner, 2010, p. 63]). At the other end of the spectrum, 35% of students in Australia attend private schools. Such schools include a mixture of denominational and non-denominational ethos, are typically fee-paying (although also receiving some state funds), and are more likely to be in urban areas and to target a post-primary population. In the US, 10% of all students attend private schools, most of which are denominational (National Center for Educational Statistics, 2016). As is the case in Australia, such schools are typically found in urban areas, are often fee-paying, more commonly found at post-primary level, and parents must actively choose to send their child to them.
In England, approximately 7% of all students attend private schools (many fee-paying), while 47% of primary and 19% of post-primary schools are denominational (Department for Education, 2017). However, the 93% of public schools include a variety of governance structures, many of which mean that they are de facto private schools. For example, Academy schools (comprising 15% of primary and 63% of post-primary schools (Eyles & Machin, 2015)) are state-funded but are self-governing, may have corporate sponsors, and are not required to follow the National Curriculum (although they typically do so).
In sum, in many countries, private denominational schools tend to be more common at post-primary level, and in urban areas. The decision to send a child to such a school is usually an active one,
6 A regularly updated list of schools is available from http://education.ie/en/Publications/Statistics/Data-on-Individu-al-Schools/.

ERC Research Series: 1
12
Shaping Schools: What TIMSS tells us about education systems Structural Characteristics
Back to Contents
often related to issues of social class, perceived quality of instruction, religious belief, and educational outcomes (Ajuwon & Bradshaw, 2009; Denessen et al., 2005; Gorard, 1999). In contrast, almost all primary schools in Ireland are private denominational schools. Parents – particularly in rural areas – rarely have the opportunity to choose a primary school that is not a private denominational school.
Ability grouping and promotionData collected from principal teachers revealed that setting (assigning students to classes based on their academic achievement in a particular subject) was more common at post-primary level than at primary, and more likely to be used for mathematics than for science classes (Table 7). Across all participating TIMSS countries, 24% of primary pupils were in schools where Fourth grade pupils were ability-grouped for mathematics classes, compared to 14% for science classes. At post-primary, 44% were in schools where Eighth grade students were ability-grouped for mathematics classes, compared to 31% for science classes.
There was wide variation, both between and within countries, in setting practices. For example, setting was relatively uncommon in Irish primary schools, very common at post-primary level for mathematics (88% of students), but rare for science (7% of students). Among our comparison countries, setting was very common in Singapore (primary and post-primary level) and in Australia, New Zealand and the United States (post-primary level only). England is unusual in the extent to which setting is used at post-primary level. For Eighth grade students in England, setting for mathematics was more or less universal (99%), while setting for science was also very common (89% of students, approximately three times the international average of 31%). Setting in mathematics lessons was also common in English primary schools (49% of Fourth grade pupils).
Table 7: Percentage of students in schools where students are ability-grouped for mathematics and science lessons, and national policy on grade promotion, Ireland and comparison countries
Primary Post-primaryPromotion policy
Maths Science Maths Science
Australia 23 2 57 28Varies by state, but usually automatic in Grades 1-8.
England 49 7 99 89 No policy. In practice, automatic
Finland 15 3 – – Generally automatic.
Hong Kong SAR 28 10 45 21 No policy. Schools decide.
Ireland 14 <1 88 7 Generally automatic.
New Zealand 24 5 69 47 Generally automatic.
N. Ireland 15 0 – – Automatic promotion.
Rep. of Korea 12 9 47 5 Dependent on attendance.
Russian Fed. 10 5 20 17 Dependent on academic progress.
Singapore 78 45 64 63Automatic for Grades 1-4. Dependent on academic progress Grades 5-8.
Slovenia 24 13 44 20Automatic for Grades 1-9, except for those with special needs.
United States 32 11 76 29 Varies by state.
TIMSS 24 14 44 31
Taking TIMSS data as a whole, there was no clear association between student achievement and the use of setting (Figure 1). For example, the international average for Fourth grade mathematics and science scores were more or less identical for pupils who were placed in ability groups and

Shaping Schools: What TIMSS tells us about education systems Structural Characteristics
ERC Research Series: 1
13Back to Contents
those who were not (511 vs 510 for mathematics; 507 vs 507 for science). At Eighth grade, setting was associated with slightly higher international average scores for mathematics (482 vs 479), but slightly lower scores for science (479 vs 489). Also, there is no obvious link between a country’s performance and the extent to which setting is used. For example, the Republic of Korea and the Russian Federation are among the top-performing countries, yet the use of setting is relatively uncommon. Among our comparison countries, setting is most widely used (at post-primary level) in England, Singapore, and New Zealand, three countries whose national mean scores are quite different.
Figure 1: International average scores for those who were ability grouped or not for mathematics and for science lessons
460
470
480
490
500
510
520
MathsPrimary
511 510 507 507 482 479 479 489
SciencePrimary
MathsPost-primary
SciencePost-primary
■ Ability grouped
■ Not grouped
There was also considerable variety between countries in policies related to promotion or retention at a grade level. Like Ireland, most countries had more-or-less automatic promotion for pupils in Grades 1-4, while a (smaller) majority also had more-or-less automatic promotion in Grades 5-8 (i.e., up to the equivalent of Second Year in Ireland). While some countries (e.g., Australia, England) did not have a national policy on grade retention or promotion, it was normal practice for students to be automatically promoted. However, in other countries without a national policy, the policy was decided at state level (e.g., Canada, United States) or at school level (e.g., Hong Kong, Lithuania). In countries where grade promotion was automatic, many also allowed grade retention if there were exceptional circumstances, if the student had special educational needs, or if parents requested it. Unusually, Chinese Taipei has a policy that parents of intellectually gifted students can apply to accelerate their child through the grade levels (i.e., skip grades).
Countries with stricter promotional policies include the Republic of Korea (students cannot be promoted unless they reach a specified attendance level) and Singapore (after Grade 5 promotion is dependent on academic progress). The Russian Federation has an unusually strict policy on promotion – students must not only demonstrate satisfactory academic progress, but must also successfully “defend” a project at the end of grades 3-8.
The school yearTIMSS 2015 data for Ireland indicate that primary school pupils receive 854 instructional hours (i.e., excluding non-instructional time such as roll call, breaks) per year, which is 33 hours fewer than the TIMSS average (Table 8). However, this does not include assembly time, which, in Ireland, is typically included in counts of instructional hours. Including it means that Irish primary pupils receive 915

ERC Research Series: 1
14
Shaping Schools: What TIMSS tells us about education systems Structural Characteristics
Back to Contents
instructional hours per annum, slightly more than the TIMSS average (887). Among our comparison countries, the highest number of primary school instructional hours were in the United States (1088) and the lowest in the Russian Federation (661).
In Second Year, Irish students have an average of 963 instructional hours per year, 58 hours fewer than the TIMSS average for Eighth grade students. Among our comparison countries, the highest number of instructional hours were in the United States (1135) and the lowest in Slovenia (867).
There is no clear relationship between overall formal school instructional time and performance on TIMSS. For example, looking at all participating countries, those with the longest instructional hours per annum are Indonesia (primary: 1095 hours) and Morocco (post-primary: 1364 hours), both of which are among the lowest-performing TIMSS countries (see Clerkin et al., 2016). Examining four of the high-achieving countries (Singapore, Hong Kong, the Republic of Korea, Russian Federation) there is variety in the length of formal instruction time provided. At primary level, two of the four have less instruction time than the TIMSS average, while at post-primary level, three of the four have less instruction time than the TIMSS average. Only in Singapore is instruction time above the TIMSS average at both primary and post-primary level (986 hours and 1065 hours, respectively).
Table 8: Average instructional hours per annum for Fourth and Eighth grade students, and participation in shadow education, Ireland and comparison countries
Instructional hours Participation in shadow education (Grade 8)
Grade 4 Grade 8Maths Science
% Yes % 8 months+ % Yes % 8 months+
Australia 1014 1011 24 8 21 4
England 994 1009 19 5 11 3
Finland 737 - - - - -
Hong Kong SAR 999 995 48 19 22 6
Ireland 854* 963 16 4 5 2
New Zealand 923 966 23 5 13 3
Northern Ireland 962 - - - - -
Rep. of Korea 712 947 71 46 33 15
Russian Fed. 661 884 40 9 25 6
Singapore 986 1065 55 25 35 12
Slovenia 716 867 38 7 30 4
United States 1088 1135 25 5 14 4
TIMSS 887 1021 44 12 33 8
*Excludes assembly time.
Table 8 also shows data on so-called “shadow education systems”. Eighth grade students were asked if they had received any additional lessons or tutoring in mathematics or science in the 12 months preceding the assessment, and if yes, for how long had they attended. On average across all TIMSS countries, 33% of students reported they had additional tutoring for science, as had 44% for mathematics. In Ireland, the percentages were considerably lower (5% and 16%, respectively). In contrast, approximately half of Eighth grade students in Singapore and Hong Kong, and 71% in the Republic of Korea, had attended extra mathematics lessons, and typically for a much longer period of time than students in other countries. For example, 46% of all Korean Eighth grade students had attended extra mathematics lessons for at least eight of the previous 12 months, compared to a TIMSS average of 12% of students, and only 4% of students in Ireland.

Shaping Schools: What TIMSS tells us about education systems Structural Characteristics
ERC Research Series: 1
15Back to Contents
The TIMSS student questionnaire did not ask how much time students spent in shadow education, only for how long they had been attending. However, it is likely that, for a sizeable minority of students in countries such as Singapore, Japan, and the Republic of Korea, the formal school day may not be an accurate reflection of the time spent in a classroom. While there is a scarcity of international data on private supplementary tutoring, previous research has highlighted the ubiquity of shadow education in many Asian countries. Drawing on a range of smaller studies, Bray and Lykins (2012) estimated that in the Republic of Korea, 88% of primary pupils received private tutoring, as did 72% of middle school students and 60% of high school students. Their estimates for Hong Kong were that 72% of upper-primary pupils received tutoring, as did over 80% of post-primary students. However, as their estimates are based on multiple studies, employing a variety of methodologies, focussing on different levels of education systems, and in some cases, using different definitions of shadow education, their conclusions must be interpreted with caution.
While it is difficult to disentangle the effects on achievement of formal education and shadow education, the latter should not be discounted when considering the effects of instructional time on achievement. More generally, it is worth noting that – at least in some countries – the amount of time students spend in an educational setting may be quite different from the official data supplied by the Education Ministry.

ERC Research Series: 1
16
Shaping Schools: What TIMSS tells us about education systems Mathematics and Science Curricula
Back to Contents
Mathematics and Science Curricula
This section outlines how curricula are structured in participating countries, and the amount of time allocated, both formally, and in terms of how much time teachers reported spending.
Structure of the curriculumAlmost all of the TIMSS 2015 countries, including Ireland, had a nationally defined curriculum for mathematics and science, at both Fourth and Eighth grade, including content, objectives, and a general grade structure (Tables 9 and 10). However, there was often variation in the extent to which schools must adhere to a national curriculum. For example, in England, academies and free schools can diverge from the National Curriculum once they provide a broad and balanced curriculum (Richardson & Isaacs, 2016).7 In Australia, standards and the curriculum framework are centrally defined but schools have autonomy in deciding how to implement the curriculum – particularly at the primary and lower secondary levels (Wernert & Thomson, 2016). Even in Singapore, where the education system is very centralised and almost all schools are publicly funded, schools are “highly encouraged to customise the implementation of national curriculum policies and programs …to suit the learning needs of their students” (Chee et al., 2016).
The countries that did not have a central curriculum were mainly those with a federal type of government, such as the Russian Federation, United States, Germany, Belgium, and Canada. In such cases, the curriculum was usually agreed at state/province/Länder level, although in the Unites States, curriculum decisions are devolved to the level of school district. In countries where the curriculum was centrally-agreed, it was primarily the responsibility of the Ministry. However, in a sizeable minority of countries, the curriculum is defined either by an independent body or by the national Ministry based on the advice of an independent body (similar in function to Ireland’s National Council for Curriculum and Assessment).
In Ireland, the Fourth Class curriculum for mathematics was introduced in 2001, and the curriculum for science was introduced in 2003. The mathematics curriculum is currently under revision but the science curriculum is not. As can be seen from Table 9, Ireland’s primary school mathematics and science curricula are older than any of our comparison countries (and, with the exception of Belgium, older than those in any other TIMSS country). The Irish curriculum for science is structured into two-grade units (e.g., First and Second Class, Third and Fourth Class). This structure is also relatively common in other countries, as are three-grade units, with some countries (such as Slovenia and Northern Ireland) using a mixture of the two structures. In contrast, the primary mathematics curriculum in Ireland is structured on a grade-by-grade basis, which is quite atypical. Across all TIMSS countries, only Belgium and Japan structure their primary school mathematics curriculum similarly.
7 In practice, the extent of divergence is likely to be considerably constrained by the fact that students in such schools have to take state examinations based on the National Curriculum.

Shaping Schools: What TIMSS tells us about education systems Mathematics and Science Curricula
ERC Research Series: 1
17Back to Contents
Table 9: Mathematics and science curricula by year of introduction and grade structure, Ireland and comparison countries, Grade 4
Maths Science
National Curriculum
Year introduced
Grade structure
National Curriculum
Year introduced
Grade structure
Australia Y 2011 1-4 Y 2011 1-2, 3-6
England Y 2014 2-5 Y 2014 2-5
Finland Y 2004 1-2, 3-5 Y 2004 1-4, 5-6
Hong Kong SAR Y 2002 1-6 Y 2011 1-6
Ireland Y 2001 1,2,3,4,5,6 Y 20031-2, 3-4,
5-6
New Zealand Y 20088 levels of learning
Y 20088 levels of learning
Northern Ireland Y 20071-2, 3-4,
5-7Y 2007
1-2, 3-4, 5-7
Rep. of Korea Y 20111-2, 3-4,
5-6Y 2011
1-2, 3-4, 5-6
Russian Federation Y* 2011 1-4 Y* 2011 1-4
Singapore Y 2007 1-6 Y 2008 3-6
Slovenia Y 2011 1-9 Y 20111-3, 4-5, 6-7, 8-9
United States Nvaries by
statevaries by
state/districtN
varies by state
varies by state/district
*Federal authorities establish federal and state educational standards and develop model curricula
At post-primary level, the TIMSS cohort of Second Years had been taught using curricula for mathematics and science introduced in 2010 and 2003, respectively (Table 10). Both are currently under revision. At the time that TIMSS was administered (spring 2015), only three TIMSS countries (Hong Kong, Lebanon, Morocco) had science curricula that pre-dated Ireland’s. In terms of structure, Ireland’s science and mathematics curricula are structured as a three-grade unit, mirroring the Junior Cycle grades (7-9). Across all TIMSS countries, this was the most common structure for both science and mathematics curricula, adopted by slightly less than half of countries.
Table 10: Mathematics and science curricula by year of introduction and grade structure, Ireland and comparison countries, Grade 8
Maths Science
National Curriculum
Year introduced
Grade structure
National Curriculum
Year introduced
Grade structure
Australia Y 2011 7-10 Y 2011 7-10
England Y 2014 6-8 Y 2014 6-8
Hong Kong SAR Y 2001 7-9 Y 1998 7-9
Ireland Y 2010 7-9 Y 2003 7-9
New Zealand Y 2008 7-9, 9-11 Y 2008 7-9, 9-11
Rep. of Korea Y 2011 7-9 Y 2011 7-9
Russian Federation Y 2004 5-6, 7-9 Y 2004 5-9
Singapore Y 2013 7,8 Y 2013 7,8
Slovenia Y 2011 1-9 Y 20111-3, 4-5, 6-7, 8-9
United Statesvaries by
statevaries by
statevaries by
statevaries by
statevaries by
statevaries by
state

ERC Research Series: 1
18
Shaping Schools: What TIMSS tells us about education systems Mathematics and Science Curricula
Back to Contents
Instructional timeTIMSS gathered data about the amount of time allocated to mathematics and science instruction from two sources: National Research Coordinators and class teachers. The former indicated the amount of time formally allocated while the latter indicated the amount of time allocated in practice.
Official time allocationsOverall, approximately three-quarters of TIMSS participating countries had national policies regarding the allocation of instructional time to Fourth and Eighth grade mathematics and science. Despite this, cross-national comparisons of the official time allocation is difficult. For example, while Korea, the Russian Federation and Slovenia each give a specific percent of time to be allocated to mathematics and science at Fourth and Eighth grade, other countries are less specific. Amongst our comparison countries, some:
■■ have policies that vary by state (Australia and United States); ■■ do not give any specific amount of time to be allocated to mathematics and/or science
(Northern Ireland, England, New Zealand and Finland);■■ specify an acceptable range of time (Hong Kong and Singapore).
With the exception of Chinese Taipei, all countries with national policies at Fourth grade reported allocating more time to mathematics (ranging from 10-25% of instructional time) than to science (4-17%). In Ireland, primary schools are expected to allocate 19% of time to teaching mathematics. This is not only considerably higher than the time to be allocated to science, but also considerably higher than the formal allocation of 13% reported in TIMSS 2011. The increase can be attributed to the Literacy and Numeracy Strategy (Department of Education and Skills, 2011), introduced shortly after TIMSS 2011 took place. In contrast, the percentage of time that is officially allocated to science (4%) remains unchanged since TIMSS 2011. Then, only Austria allocated less time to primary science instruction than Ireland. Austria did not participate in the 2015 cycle. Thus, Ireland allocated less time to science at primary level than any other country in TIMSS 2015.
At Eighth grade, the allocation of time to each subject was more mixed, ranging from 10-20% of time for mathematics and 6-33% of time allocated to science. In contrast to Fourth grade, a number of countries (including the Russian Federation and Slovenia) required that more time be allocated to science than to mathematics.
Actual time allocationsFourth grade teachers and Eighth grade subject teachers were asked how much time per week they spent on mathematics and on science. This was used to calculate the national total instructional hours per year for each of the two domains (Figures 2 and 3) (see also Clerkin et al., in press-a, and Clerkin et al., in press-b).
At primary level, roughly twice as much instructional time was devoted to mathematics as to science (TIMSS averages of 157 and 76 hours, respectively). Among Ireland’s comparison countries, pupils in the US and Northern Ireland spent the most time in mathematics lessons (216 and 215 hours, respectively). US pupils also spend 100 hours per year in science lessons, considerably more than pupils in our other comparison countries. At 165 hours, pupils in Ireland spent slightly more time than the TIMSS average in mathematics lessons. In contrast, the time allocated to science lessons (32 hours per year) was less than half the TIMSS average, and lower than in any other participating country. Across all TIMSS countries, only Northern Ireland and the Czech Republic came close – each averaged 38 hours of primary science instruction per year.

Shaping Schools: What TIMSS tells us about education systems Mathematics and Science Curricula
ERC Research Series: 1
19Back to Contents
Figure 2: Instructional hours per year at Fourth grade for mathematics and science (reported by teachers)8
0
40
80
120
160
200
240■ Maths
■ Science
Austra
lia
Englan
d
Finlan
d
Hong K
ong S
AR
Irelan
d
New Z
ealan
d
Northe
rn Ire
land
Rep. o
f Kor
ea
Russia
n Fed
.
Singap
ore
Sloven
ia
United
Stat
es
TIMSS
202
57
189
61
115
82
159
0
165
32
163
43
215
38
100
76
106
49
201
85
144
86
216
100
157
76
At Eighth grade, the amount of time allocated to mathematics and science is more evenly distributed, averaging 138 hours for mathematics and 144 hours for science across all TIMSS countries. Both Slovenia and the Russian Federation were slightly atypical in that students spent over 220 hours per year in science lessons, which is not only well above the TIMSS average, but also well above the hours their own students spent in mathematics lessons.
At 90 hours, students in Ireland spent considerably less time than the TIMSS average in science lessons, lower than in any comparison country. Among all TIMSS countries, only Norway (81 hours) and Italy (71 hours) allocated less time to science. Irish students also spent less time than the TIMSS average in mathematics lessons (109 hours). None of our comparison countries, and only three countries that took part in the Eighth grade assessment (Japan, Norway, and Sweden) allocated less time to mathematics than did Ireland.
Figure 3: Instructional hours per year at Eighth grade for mathematics and science (reported by teachers)
0
40
80
120
160
200
240
■ Maths
■ Science
Austra
lia
Englan
d
Hong K
ong S
AR
Irelan
d
New Z
ealan
d
Rep. o
f Kor
ea
Russia
n Fed
.
Singap
ore
Sloven
ia
United
Stat
es
TIMSS
139126 126
97
139
102 109
90
144133
114
94
145
219
129
106114
221
155144 138 144
8 In Hong Kong SAR, science instructional hours are not shown as data were provided for less than 50% of pupils.

ERC Research Series: 1
20
Shaping Schools: What TIMSS tells us about education systems Mathematics and Science Curricula
Back to Contents
As Ireland took part in TIMSS 2011 at Fourth Class only, no recent trend data are available at post-primary level. However, at primary level, there has been a noticeable increase (from 150 to 165 hours per annum) in the time allocated to mathematics at Fourth Class. This contrasts with a slight drop in the TIMSS international average over the same period (from 162 to 157 hours). As a corollary, there has been a sharp drop over the same period in the amount of time Irish Fourth Class pupils spend in science lessons (from 63 to only 32 hours), which is much larger than the drop in the TIMSS international average over the same period (from 85 to 76 hours). It is worth noting that the drop in the international averages cannot be entirely attributed to policy changes affecting practices related to instructional time (as was the case in Ireland). A small amount of variation between cycles also occurs because the participating countries vary slightly between cycles (e.g., Canada participated in 2015 but not 2011, while Austria participated in 2011 but not 2015).
TIMSS 1995 also included a question about the amount of time allocated to teaching, but using banded categories of weekly hours (e.g., less than 2 hours per week), meaning that those data cannot be directly matched with data from 2015. However, broadly speaking, Ireland was approximately average in the amount of time given to mathematics at primary level and slightly below average in the amount of time allocated for mathematics at post-primary level. For science, Ireland was well below average on the amount of time allocated at primary level and was below average on time allocated at post-primary level (Beaton, Mullis, Martin, Gonzalez, Kelly & Smith, 1996a; Beaton, Martin, Mullis, Gonzalez, Smith & Kelly, 1996b; Martin, Mullis, Beaton, Gonzalez, Smith & Kelly, 1997; Mullis, Martin, Beaton, Gonzalez, Kelly & Smith, 1997). As such, Ireland’s relative time allocations remains similar to the pattern reported in TIMSS 1995.

Shaping Schools: What TIMSS tells us about education systems Teacher Qualification and Certification
ERC Research Series: 1
21Back to Contents
Teacher Qualification and Certification
In Ireland, teaching is a graduate profession, with two possible routes to qualification and certification:
■■ Concurrent model: Completion of a four-year Bachelor of Education program, or
■■ Consecutive model: Those who have already completed a basic degree complete a two-year postgraduate Professional Master’s in Education.
Primary school teachers complete their initial teacher education through either the concurrent or consecutive model. Post-primary mathematics and science teachers usually qualify through a consecutive model (where their primary degree contains at least one subject from the post-primary curriculum for Leaving Certificate). However, in some universities, the concurrent model is followed on the basis of a degree that consists of both academic study and teaching practice.
Teaching is a graduate profession in almost all of the countries that took part in TIMSS 2015. For primary school teaching, a three-year or four-year degree (or diploma) through a university or a teacher college was the most common route to qualification. A degree was the minimum expected and/or required qualification of prospective primary teachers in almost all participating countries. Some countries required additional qualifications (e.g., Finland, France, Serbia, and the Slovak Republic required a Master’s degree, while Italy, Serbia, Slovenia and Croatia had a five-year university program). In contrast, teachers in England’s academy schools do not need to be qualified, but teachers in Local Authority schools must be. In the US, certification is at the level of individual states, but it is not required that primary teachers receive a degree from a college of education in order to be certified to teach.
A small number of countries had teacher preparation routes that differed somewhat from the norm, including Singapore. Singapore is unusual in two ways. Firstly, although the majority of entrants to pre-service teacher education programmes are university graduates, it is not a strict necessity and a small proportion of those undergoing training hold A-level or polytechnic qualifications. Secondly, Singapore use competitive terms of employment and alternative training routes to attract mid-career professionals from other industries in the belief that they can bring valuable experience to teaching.
The main teacher preparation routes for post-primary schools are similar to that of primary, and almost all countries reported that teachers receive their education through a university program. As with Ireland, many countries offered both consecutive and concurrent models, and consecutive models were reported as being quite common in several countries (e.g., England, Australia, and Singapore). As is the case at primary, teachers in post-primary level academy schools in England do not need to be qualified.
In Ireland and elsewhere, there are additional requirements for newly-qualified primary and post-primary teachers beyond a basic degree, postgraduate diploma or Master’s degree. In Ireland, primary teachers must complete approximately 20 weeks of supervised practicum, pass a qualifying examination, and complete a probationary teaching period which lasts at least 100 days. Further, primary teachers must take part in the structured mentoring and training offered by the National Induction Programme. Newly qualified post-primary teachers must also undergo a supervised practicum, though the length of this varies depending on the teacher education program. They must also pass a qualifying examination, complete 300 hours of probationary teaching and the National Induction Programme.

ERC Research Series: 1
22
Shaping Schools: What TIMSS tells us about education systems Teacher Qualification and Certification
Back to Contents
As can be seen from Table 11, a supervised practicum was an almost universal requirement for primary school teacher certification, and was very common for post-primary certification. However, probationary periods and mentoring programmes were part of the certification process in only about half of countries.
At primary level, all but five countries (Georgia, Iran, Jordan, Qatar, United Arab Emirates) required newly-qualified teachers to undergo a period of supervised practicum before being certified, while 36 of 50 countries required teachers to pass a qualifying examination. Australia, New Zealand and Finland were among those countries that did not set this as a requirement for newly-qualified primary teachers. Completion of a probationary teaching period was required in 48% of countries, while a mentoring or induction program was a requirement in 44% of countries.
Regarding qualification routes for post-primary teachers, most countries (85%) required completion of a supervised practicum, and 61% required a qualifying examination. However, a probationary period of teaching was a requirement in only just over half (54%) of countries, and the completion of a mentoring or induction program was required by only 41% of countries.
Table 11: Qualification and certification requirements for teachers, percentage of all TIMSS countries
Supervised practicum
Qualifying exam
Probationary period
Mentoring / induction
4th Grade
Ireland Y Y Y Y
2015 (N=50) 95% 72% 48% 44%
1995 (N=26) 92% 73% - -
8th Grade
Ireland Y Y Y Y
2015 (N= 39) 85% 61% 54% 41
1995 (N=42) 91% 79% - -
Data available from 1995 indicate that for the countries then taking part, a supervised practicum was a very common requirement (for over 90% of countries, at both primary and post-primary level) and qualifying examinations were required in about three-quarters of countries. No data were gathered on the extent to which probationary periods and mentoring programmes were required, perhaps suggesting that they were then less likely to be considered as requirements.

Shaping Schools: What TIMSS tells us about education systems Summary
ERC Research Series: 1
23Back to Contents
Summary
This research brief has examined aspects of the educational system in Ireland and selected participating countries in TIMSS 2015, drawing on trend data from TIMSS 1995 where available. In Ireland average primary school size was much smaller than the TIMSS international average, while average post-primary school size was also slightly smaller than the average. In a related vein, multi-grade classes were a more common feature of primary provision in Ireland than in most participating countries – notable exceptions were New Zealand and Australia (where multi-grade classes were often by design rather than by necessity).
In Ireland, TIMSS could be completed in Irish or English and almost all completed it through English. Almost 90% of pupils and students in Ireland always or almost always spoke the language of the test at home, higher than the TIMSS averages, but lower than the equivalent percentages in TIMSS 1995. However, while Ireland has become slightly more linguistically diverse since 1995, we remain considerably less diverse than high-performing countries such as Singapore and Hong Kong (where 29-51% of students had home languages that differed from the assessment language).
Another notable difference since 1995 for Ireland is in the availability and uptake of early childhood education. Almost no three-year olds were in early childhood education settings in 1995, compared to almost half in 2016.9 Using the international ISCED definitions, Junior and Senior Infants are classified as pre-school, while First Class marks the beginning of primary school. Thus, under international classifications, most children in Ireland start school at about six years of age, broadly in line with school starting age in other countries. Also, as the Infants grades are internationally classified as pre-school rather than primary school, almost all Irish children spend at least two years in a formal pre-school setting. However, parental reports consistently underestimate pre-school attendance as most people in Ireland consider the Infants grades to be part of primary school.
Another unusual feature of the education system in Ireland is that almost all primary schools, and half of post-primary schools, are private and denominational, although almost all are publicly funded. In contrast, in other countries where private schools are a feature of the education system, they are more likely to be found at post-primary level, in urban areas, and are often fee-paying.
At primary level, setting (ability grouping by subject) was relatively unusual in Ireland for both mathematics and science, and was less common than was the average across TIMSS countries. At post-primary level, most Second Year students were in schools where setting was used for mathematics (with setting used more often than the international average), while this was the case for relatively few students in science (with setting used less often than the international average).
At primary level, Ireland’s mathematics and science curricula are older than those in all but one TIMSS participating country (Belgium). Further, while the science curriculum is structured into two-grade units, a relatively common approach, the mathematics curriculum is structured on a grade-by-grade basis, an approach used in only two other countries (Belgium and Japan). Ireland’s post-primary level mathematics and science curricula are also older than in most TIMSS countries.
The amount of time spent teaching science to Fourth Class pupils was lower than in any other TIMSS country, while the amount of time allocated to teaching science to Second Year students
9 As the entry age for ECCE was lowered in September 2016, current enrolment is likely to be significantly higher than this.
ERC Research Series: 1
24
Shaping Schools: What TIMSS tells us about education systems Summary
Back to Contents
was one of the lowest among participating countries. In contrast, the amount of time spent on mathematics in Irish primary schools was broadly average, while the time spent on mathematics in post-primary school was below average. Since TIMSS 2011, there has been a noticeable increase in mathematics instructional time at Fourth Class, and a noticeable decrease in the amount of time devoted to science instruction.
Across TIMSS, there is no clear relationship between country-level performance and instruction time (either officially allocated actual amount of time spent, based on teacher reports). However, this does not take into account differences in instruction time outside of formal schooling. Eighth grade students were asked about additional lessons or tutoring in mathematics or science. Students in Ireland had lower than average levels of participation in shadow education, whereas participation was well above average in Singapore, Hong Kong, and the Republic of Korea.
Ireland’s teacher qualification routes are similar to those in many other participating countries. Both consecutive and concurrent models are available for primary and post-primary teachers, but post-primary mathematics and science teachers usually qualify through a consecutive model. Most countries also had additional requirements for newly-qualified primary and post-primary teachers beyond a basic degree, diploma or Masters.
As noted earlier, this is the first of a series of research briefs examining aspects of TIMSS 2015 from an Irish perspective. It will be followed shortly by two reports (one for Fourth Class and one for Second Year) examining teacher characteristics and teaching practices in mathematics and science lessons (Clerkin et al., in press-a, and Clerkin et al., in press-b). Later publications in the series will include analyses of ICT in schools, of pupil and student engagement, and interaction between the school and home.

Shaping Schools: What TIMSS tells us about education systems References
ERC Research Series: 1
25Back to Contents
References
Australian Bureau of Statistics. (2017). Government school enrolments on the rise: press release February 2 2017. Retrieved from www.abs.gov.au
Ajuwon, P. M. and Bradshaw, B. K. (2009). An empirical study on factors influencing parents’ school choice. Religion & Education, 36(3), 39–53. DOI:10.1080/15507394.2009.10012456.
Beaton, A., Mullis, I.V.S., Martin, M.O., Gonzalez, E., Kelly, D., & Smith, T. (1996a). Mathematics achievement in the middle school years. IEA’s Third International Mathematics and Science Study. Boston: TIMSS International Study Center.
Beaton, A., Martin, M.O., Mullis, I.V.S., Gonzalez, E., Smith, T., & Kelly, D. (1996b). Science achievement in the middle school years. IEA’s Third International Mathematics and Science Study. Boston: TIMSS International Study Center.
Bray, M., & Lykins, C. (2012). Shadow Education: Private supplementary tutoring and its implications for policy makers in Asia. Manila: Asian Development Bank.
Chee, M.T., Chin, T.Y., Loh, M.Y., Ng, H.L., Poon, C.L., Sin, H.K., Tang, S.Y., Tay, W.B., & Yen, Y.P. (2016). Singapore. In Mullis, I. V. S., Martin, M. O., Goh, S., & Cotter, K. (Eds.) (2016). TIMSS 2015 Encyclopedia: Education Policy and Curriculum in Mathematics and Science. Retrieved from: http://timssandpirls.bc.edu/timss2015/encyclopedia/.
Clerkin, A., Perkins, R., & Cunningham, R. (2016). TIMSS 2015 in Ireland: Mathematics and science in primary and post-primary schools. Dublin: Educational Research Centre.
Clerkin, A., Perkins, R., & Chubb, E. (in press-a). Inside the primary classroom: What happens in Fourth Class? ERC Research Series: 2. Dublin: Educational Research Centre.
Clerkin, A., Perkins, R., & Chubb, E. (in press-b). Inside the post-primary classroom: What happens in Second Year? ERC Research Series: 3. Dublin: Educational Research Centre.
Denessen, E., Driessena, G., & Sleegers, P. (2005). Segregation by choice? A study of group-specific reasons for school choice. Journal of Education Policy, 20(3), 347-368. DOI: 10.1080/02680930500108981.
Department for Education (2017). Schools, pupils and their characteristics: January 2017. Retrieved from https://www.gov.uk/government/statistics/schools-pupils-and-their-characteristics-january-2017
Department of Education and Skills. (2011). Literacy and numeracy for learning and life: The National Strategy to Improve Literacy and Numeracy among Children and Young People 2011-20. Dublin: Author. Retrieved from: http://www.education.ie/en/Schools-Colleges/Information/Literacy-and-Numeracy/Literacy-and-Numeracy-Learning-For-Life.pdf
Eivers, E., & Clerkin, A. (2012). PIRLS & TIMSS 2011: Reading, mathematics and science outcomes for Ireland. Dublin: Educational Research Centre.
European Commission/EACEA/Eurydice (2016). Structural Indicators for Monitoring Education and Training Systems in Europe – 2016. Eurydice Background Report to the Education and Training Monitor 2016. Eurydice Report. Luxembourg: Publications Office of the European Union.
Eyles, A., & Machin, S. (2015). The introduction of Academy Schools to England’s education. CEP Discussion Paper No 1370. Retrieved from http://cep.lse.ac.uk/pubs/download/dp1370.pdf

ERC Research Series: 1
26
Shaping Schools: What TIMSS tells us about education systems References
Back to Contents
Gorard, S. (1999). ‘Well. That about wraps it up for school choice research’: A state of the art review, School Leadership & Management, 19(1), 25-47. DOI: 10.1080/13632439969320.
Government of Ireland (2000). Education (Welfare) Act 2000. Dublin: Statutory Office. Retrieved: http://www.oireachtas.ie/documents/bills28/acts/2000/a2200.pdf
Martin, M.O., Mullis, I.V.S., Beaton, A., Gonzalez, E., Smith, T., & Kelly, D. (1997). Science achievement in the primary school years. IEA’s Third International Mathematics and Science Study. Boston: TIMSS International Study Center.
Martin, M. O., Mullis, I. V. S., Foy, P., & Hooper, M. (2016). TIMSS 2015 International Results in Science. Retrieved from http://timssandpirls.bc.edu/timss2015/international-results
Mullis, I.V.S., Martin, M.O., Beaton, A., Gonzalez, E., Kelly, D., & Smith, T. (1997). Mathematics achievement in the primary school years. IEA’s Third International Mathematics and Science Study. Boston: TIMSS International Study Center.
Mullis, I. V. S., Martin, M. O., Foy, P., & Hooper, M. (2016). TIMSS 2015 International Results in Mathematics. Retrieved from http://timssandpirls.bc.edu/timss2015/international-results
Mullis, I. V. S., Martin, M. O., Goh, S., & Cotter, K. (Eds.) (2016). TIMSS 2015 Encyclopedia: Education Policy and Curriculum in Mathematics and Science. Retrieved from Boston College, TIMSS & PIRLS International Study Center website: http://timssandpirls.bc.edu/timss2015/encyclopedia/
National Center for Educational Statistics. (2016). Public and private school comparison. Retrieved from https://nces.ed.gov/fastfacts/display.asp?id=55 (Accessed 21.03.2016).
OECD [Organisation for Economic Cooperation and Development] Centre for Educational Research and Innovation (1996). Education at a glance: OECD indicators 1996, Education at a glance. Paris: OECD.
OECD (1999). Classifying educational programmes. Manual for ISCED-97 implementation in OECD countries. Paris: OECD Publishing.
OECD (2016a). Education at a Glance 2016: OECD Indicators. Paris: OECD Publishing. DOI: http://dx.doi.org/10.1787/eag-2016-en
OECD (2016b). “PISA 2015 data”, In PISA 2015 Results (Volume II): Policies and Practices for Successful Schools. Paris: OECD Publishing. DOI: http://dx.doi.org/10.1787/9789264267510-13-en
OECD/Eurostat/UNESCO Institute for Statistics (2015). ISCED 2011 Operational Manual: Guidelines for Classifying National Education Programmes and Related Qualifications. Paris: OECD Publishing. DOI: http://dx.doi.org/10.1787/9789264228368-en
Protner, E. (2010). General education private schools in Slovenia from the past to the present. Journal of Contemporary Educational Studies, 61(5), 60-80.
Richardson, M. & Isaacs, T. (2016). England. In Mullis, I. V. S., Martin, M. O., Goh, S., & Cotter, K. (Eds.) (2016). TIMSS 2015 Encyclopedia: Education Policy and Curriculum in Mathematics and Science. Retrieved from: http://timssandpirls.bc.edu/timss2015/encyclopedia/
Smith, B. (November 17, 2003). Getting the right mix. The Age. Retrieved from http://www.theage.com.au/articles/2003/11/14/1068674374150.html
Wernert, N., & Thomson, S. (2016) Australia. In Mullis, I. V. S., Martin, M. O., Goh, S., & Cotter, K. (Eds.) (2016). TIMSS 2015 Encyclopedia: Education Policy and Curriculum in Mathematics and Science. Retrieved from: http://timssandpirls.bc.edu/timss2015/encyclopedia/

ISSN 2565-5612