share orlando 2015 ibm cics ts for z/os performance lead€¦ · console queue processing cics now...
TRANSCRIPT

SHARE Orlando 2015
Tuesday, 11th August
Ian Burnett
IBM CICS TS for z/OS Performance Lead
@IanBurnett
1 © 2015 IBM Corporation

© 2015 IBM Corporation 2

3 © 2015 IBM Corporation

© 2015 IBM Corporation 4

© 2015 IBM Corporation 5

© 2015 IBM Corporation 6

This section covers some of the workloads which are executed during the
development phase to ensure that upgrading to a release does not incur a
performance overhead.
7 © 2015 IBM Corporation

© 2015 IBM Corporation 8

© 2015 IBM Corporation 9

© 2015 IBM Corporation 10

11 © 2015 IBM Corporation

12 © 2015 IBM Corporation

13 © 2015 IBM Corporation

14 © 2015 IBM Corporation

15 © 2015 IBM Corporation

The tables show RMF data extracted from 5 different transactions rates for
both CICS TS V5.1 and CICS TS V5.2.
16 © 2015 IBM Corporation

© 2015 IBM Corporation 17

The tables show RMF data extracted from 5 different transactions rates for
both CICS TS V5.1 and CICS TS V5.2.
© 2015 IBM Corporation 18

Overview of the JDBC+JCICS servlet
The VSAM file contains a copy data held in the DB2 sample database used by
the JDBC servlet.
19 © 2015 IBM Corporation

Representation of CICS/Liberty configuration.
Liberty runs within a JVM server within a CICS region.
Simulated browser requests are made to Liberty listener port specified in the
JVM profile parameter -Dcom.ibm.cics.jvmserver.wlp.server.http.port=nnnnn
The servlet runs on a T8 TCB within CICS and is capable of JCICS and SQL
calls.
20 © 2015 IBM Corporation

Both using DB2 V10
Single JVMserver with maximum 100 threads
Java environments:
Both use Java7-64bit SR7
Both used fixed generational heaps
-Xgcpolicy:gencon
–Xnompressedheap
-XXnosuballoc32bitmem
–Xmx200M –Xms200M –Xmnx60M –Xmns60M -Xmox140M -Xmos140M
Data collected from RMF report
Workload driven by WSIM.
20 minutes warmup period
Injection rate increased every 10 minutes.
Mean CPU usage per request reported for last 5 minutes of 10 minute interval.
21 © 2015 IBM Corporation

© 2015 IBM Corporation 22

Internal performance improvements are made in many areas of the CICS TS
V5.3 open beta offering to help reduce CPU overhead. These include the
exploitation of a number of the new hardware instructions introduced with the
IBM z9, cache alignment of some key CICS control blocks, the use of
prefetch, reduced lock contention within monitoring algorithms, improvements
to the MRO session management algorithms, and further tuning of internal
procedures.
Improvements in efficiency have noticeable improvements in the CICS trace
facility, the CICS monitoring facility, and for MRO connections with high
session counts.
© 2015 IBM Corporation 23

24 © 2015 IBM Corporation

Stack storage for Syncpoint, Transient Data and Journal Control moved to 31-
bit from 24-bit
Modules for Journal Control and Transient data move to 31-bit from 24-bit
Extrapartition Transient data buffers and control blocks moves to 31-bit from
24-bit
All CICS transactions now have TASKDATALOC(ANY) as default
25 © 2015 IBM Corporation

26 © 2015 IBM Corporation

Console queue processing
CICS now uses 64-bit storage for the console queue processing trace table and the console
queue transaction entry table. These tables were previously in 31-bit storage taken from the
ECDSA.
Storage allocation control blocks
CICS now uses 64-bit storage for the storage element descriptor (SCE) and free storage
descriptor (SCF) control blocks, which control storage allocation. Use of 24-bit and 31-bit
storage is reduced, especially in systems with a lot of storage allocation activity, for example,
systems with subpools that keep an element chain and that have many small records.
Loader control blocks
CICS now uses 64-bit storage for the Active Program Element (APE), Current Program
Element (CPE), and CSECT descriptor control blocks in the loader domain. These control
blocks were previously in 31-bit storage, and could occupy a significant amount of storage.
To provide access to the 64-bit storage, the size of the tokens used on the
PROGRAM_TOKEN and NEW_PROGRAM_TOKEN options on the XPI calls
ACQUIRE_PROGRAM, DEFINE_PROGRAM, and RELEASE_PROGRAM has increased
from 4 bytes to 8 bytes. You must change and recompile global user exit programs that use
these options. Exit programs that do not use the PROGRAM_TOKEN or
NEW_PROGRAM_TOKEN option are not affected.
27 © 2015 IBM Corporation

28 © 2015 IBM Corporation

29 © 2015 IBM Corporation

30 © 2015 IBM Corporation

31 © 2015 IBM Corporation

32 © 2015 IBM Corporation

33 © 2015 IBM Corporation

34 © 2015 IBM Corporation

35 © 2015 IBM Corporation

36 © 2015 IBM Corporation

Chart shows an application which alternately executes DB2 SQL calls and
then WRITEQ TD commands.
37 © 2015 IBM Corporation

Chart shows a extracts from CICS Performance Analyzer reports for each of
the various CICS TS levels.
V4.1 shows a significant number of TCB switches, with a large fraction of
CPU consumed on the QR TCB.
V4.2 introduced CONCURRENCY(REQUIRED), which does not reduce the
TCB switches, but reduces significantly the amount of CPU time the
application spends executing on the QR TCB.
V5.1 introduces threadsafe transient data, which removes the need to switch
the the QR TCB for the WRITEQ TD command.
38 © 2015 IBM Corporation

Note that the V4.1 line hits a limit around the 210 transactions per second
mark. This is because (as shown on the previous slide), each transaction costs
around 4.60ms of CPU time on the QR TCB. Therefore, the maximum
throughput for this transaction will be 1000 ms / 4.60 ms/tran = 217
transactions per second.
The V4.2 and V5.1 lines do not see this limit as there is significantly less CPU
time spent on the QR TCB.
The V5.1 line is slightly lower than the V4.2 line due to the reduction in CPU
cost of the incurred TCB switches.
39 © 2015 IBM Corporation

40 © 2015 IBM Corporation

41 © 2015 IBM Corporation

With CICS TS V4.2, the RO TCB quickly reaches capacity, while V5.1 shows
loading on an open TCB, which scales significantly better.
42 © 2015 IBM Corporation

© 2015 IBM Corporation 43

© 2015 IBM Corporation 44

© 2015 IBM Corporation 45

Benchmark used a modified version of the CICS-supplied JDBC sample
application CICSDB2DynamicSQLExample.
Application reads 43 rows from DB2 table and writes results to CICS terminal
to give a mix of JDBC and JCICS calls.
Both measurements use DB2 V10.
Both configurations scale well, while CICS V5.1 gets a small benefit from
reduced TCB switching.
© 2015 IBM Corporation 46

Modified CICSDB2DynamicSQLExample to write results to CICS terminal
rather than HFS file.
Small amount of L8 time used for SYNCPOINT at transaction completion.
© 2015 IBM Corporation 47

48 © 2015 IBM Corporation
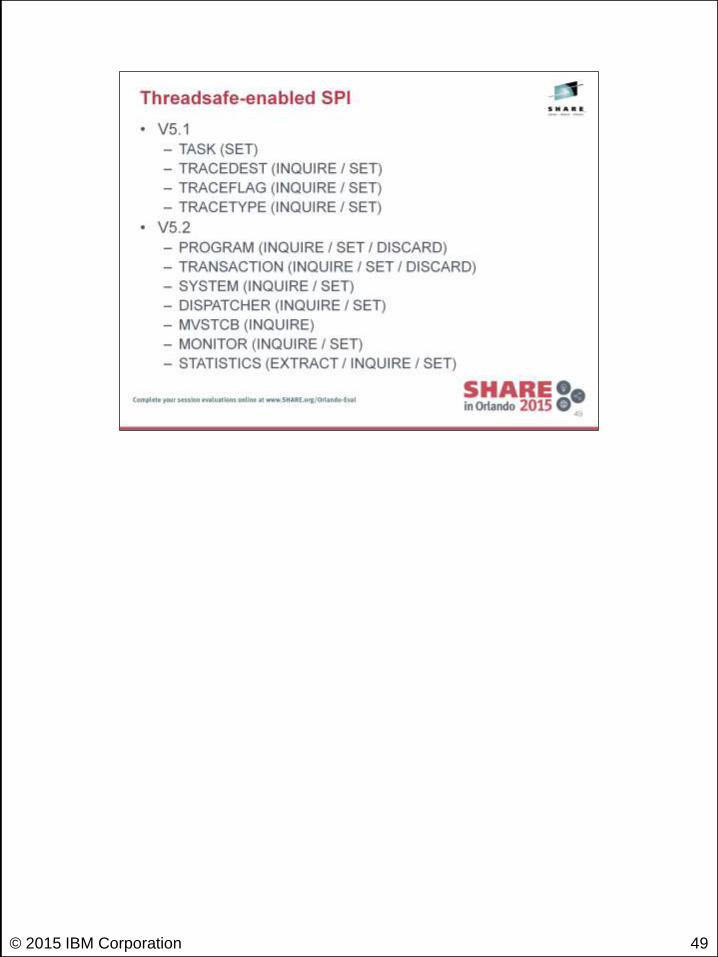
49 © 2015 IBM Corporation

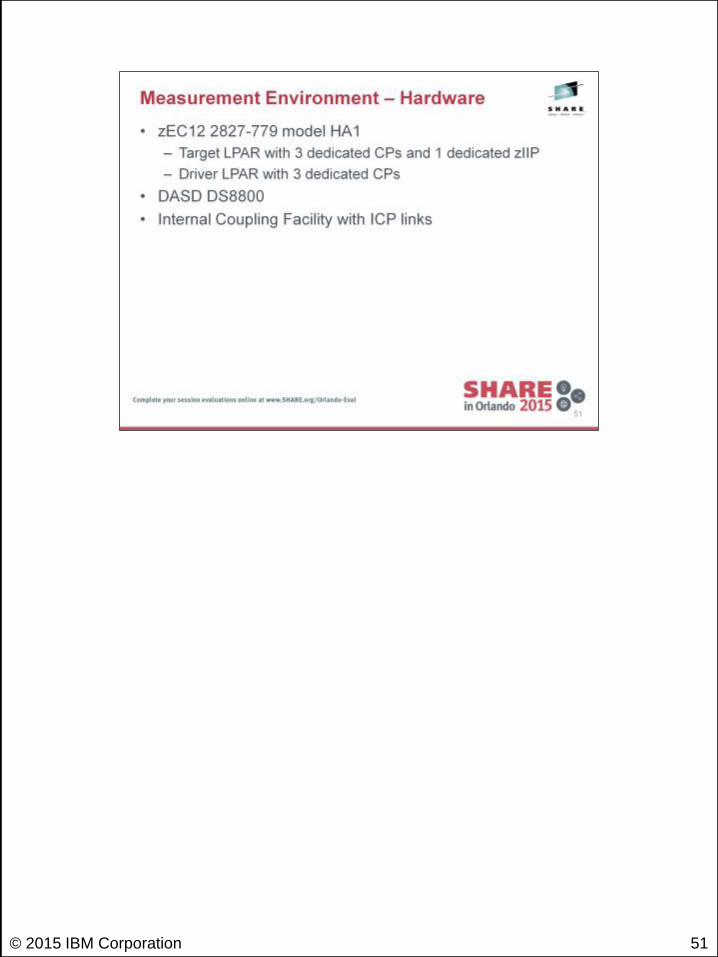
50 © 2015 IBM Corporation
51 © 2015 IBM Corporation
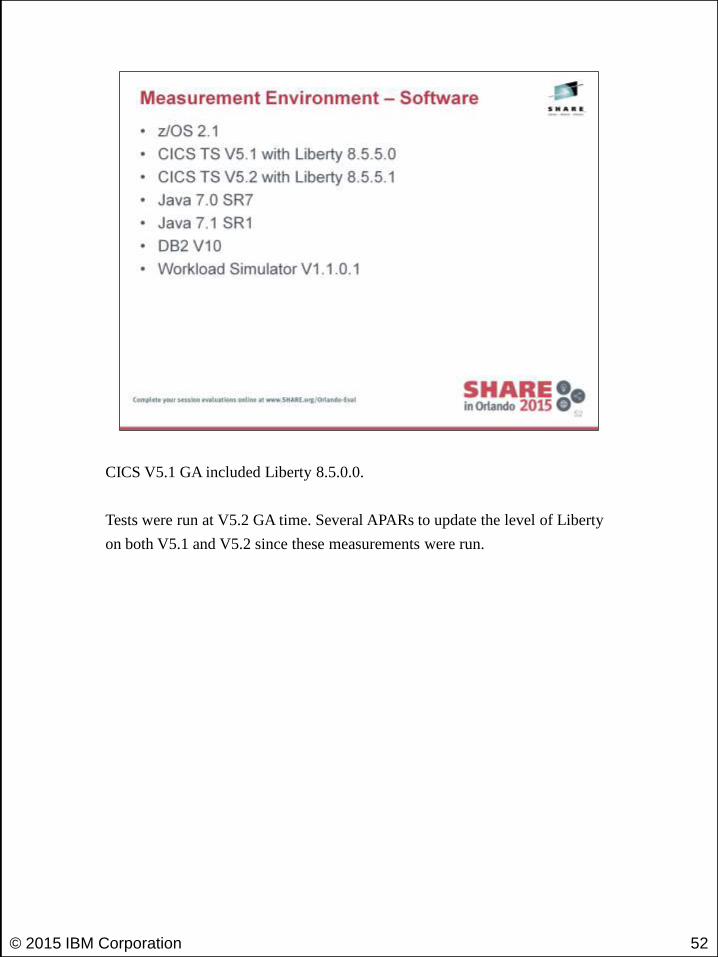
CICS V5.1 GA included Liberty 8.5.0.0.
Tests were run at V5.2 GA time. Several APARs to update the level of Liberty
on both V5.1 and V5.2 since these measurements were run.
52 © 2015 IBM Corporation

z196 configuration: an LPAR on a 2817-779 machine with 4 dedicated CPs -
considered to be equivalent to a 2817-704. Running z/OS V1R13
zEC12 configuration: an LPAR on a 2827-778 machine with 4 dedicated CPs -
considered to be equivalent to a 2827-704. Running z/OS V1R13
CICS V5.1 used Java 7 SR3
CICS V4.2 used Java 6.0.1 SR3
Data collected from RMF report
zEC12 expoitation enabled with:
–Xaggressive and -Xjit:noResumableTrapHandler
Simple Java workload shows 24% improvement on zEC12 and 25% with
–Xaggressive option, in line with LSPR expectations
https://www.ibm.com/servers/resourcelink/lib03060.nsf/pages/lsprITRzOSv1r13
Using complex Java workload – Axis2 webservice
Equivalent throughput using CICS V5.1 on z196 compared to CICS V4.2
30% improvement in throughput using CICS V5.1 on zEC12 compared to CICS V4.2
on z196
39% improvement in throughput using CICS V5.1 with Java 7 zEC12 exploitation
compared to CICS V4.2 on z196
53 © 2015 IBM Corporation

54 © 2015 IBM Corporation

A thorough review of the trace points took place and many were changed to
only be emitted with L2 trace enabled.
The result is that enabling trace in a region running Java costs approximately
the same as would enabling trace for an equivalent application in a non-Java
environment.
© 2015 IBM Corporation 55

Chart shows that enabling default trace in V5.1 adds a large overhead to the
region.
Enabling the same level of trace in V5.2 significantly reduces this overhead.
© 2015 IBM Corporation 56

Application performs 120 JCICS FILE READ operations.
Chart shows that enabling default trace in V5.1 adds a large overhead to the
region.
Enabling the same level of trace in V5.2 significantly reduces this overhead.
© 2015 IBM Corporation 57

© 2015 IBM Corporation 58
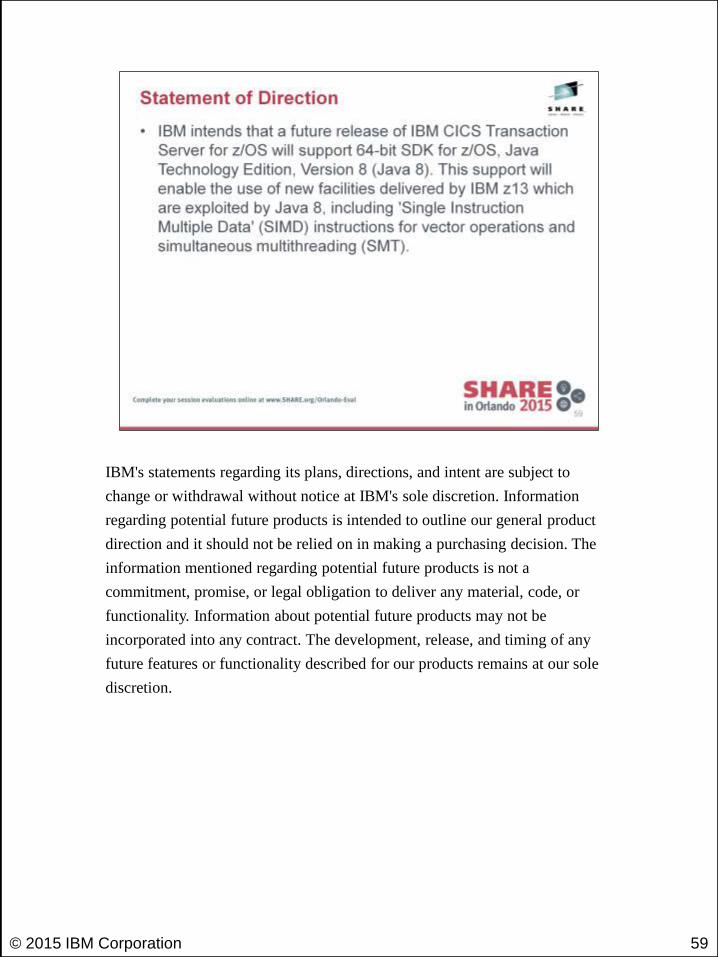
IBM's statements regarding its plans, directions, and intent are subject to
change or withdrawal without notice at IBM's sole discretion. Information
regarding potential future products is intended to outline our general product
direction and it should not be relied on in making a purchasing decision. The
information mentioned regarding potential future products is not a
commitment, promise, or legal obligation to deliver any material, code, or
functionality. Information about potential future products may not be
incorporated into any contract. The development, release, and timing of any
future features or functionality described for our products remains at our sole
discretion.
© 2015 IBM Corporation 59

© 2015 IBM Corporation 60

© 2015 IBM Corporation 61

The new CPUTONCP and OFFLCPUT fields in the DFHTASK performance class
group for a transaction can be used to calculate the processor time that a task spends
on a zIIP or zAAP specialty processor, and also show you the processor time that the
task could have spent on a specialty processor.
Field 436, CPUTONCP, shows the total task processor time spent on a standard
processor. To calculate the task processor time spent on a specialty processor, subtract
the time recorded in this field from the time recorded in field 008, USRCPUT.
Field 437, OFFLCPUT, shows the total task processor time that was eligible for
offload to a specialty processor, but actually ran on a standard processor. To calculate
the total task processor time that was not eligible for offload, subtract the time
recorded in this field from the time recorded in field 436, CPUTONCP.
To calculate the total task processor time that was either actually spent on a specialty
processor, or eligible to be spent on a specialty processor, use the following equation:
(OFFLCPUT + (USRCPUT - CPUTONCP))
Note: The times shown in the CPUTONCP and OFFLCPUT fields are only available
when running on a system that supports the Extract CPU Time instruction service that
is available on IBM System z9® or later hardware. For z/OS, Version 1 Release 13,
the PTF for APAR OA38409 must also be applied.
© 2015 IBM Corporation 62

© 2015 IBM Corporation 63

64 © 2015 IBM Corporation

65 © 2015 IBM Corporation

66 © 2015 IBM Corporation

67 © 2015 IBM Corporation

68 © 2015 IBM Corporation

69 © 2015 IBM Corporation

70 © 2015 IBM Corporation

71 © 2015 IBM Corporation

72 © 2015 IBM Corporation

73 © 2015 IBM Corporation

74 © 2015 IBM Corporation

75 © 2015 IBM Corporation

76 © 2015 IBM Corporation

77 © 2015 IBM Corporation

CICS IA V5.2 can scan load modules to identify CICS commands which are
non-threadsafe.
Collector can also understand EXEC CPSM commands, along with being able
to differentiate between MRO and IPIC connections.
Following charts cover the optimise the collector item.
78 © 2015 IBM Corporation

79 © 2015 IBM Corporation

Full parameters:
CINT Collector runtime options for IYCUZC31:
GLOBAL OPTIONS:
VSAM_FILE_SHARE=Y HL_TRACE=N RESTORE= N LANGUAGE=E
DATE_FORMAT='YYYY/MM/DD' TIME_FORMAT='HH:MM:SS 24 hrs'
GENERAL OPTIONS:
DATA_TO_COLLECT=I PERIODIC_SAVES=Y CINB_TRIGGER=5
RESTORE_DATA=N MULTIPLE_SIGNON=N
MAINTAIN_USAGE_COUNTS=Y DS_SIZE=16 TRANSID_PREFIX=''
PROGRAM_EXCLUDE_LIST='CIUXPROG' RESOURCE_PREFIX_LIST='CIUPFXTB'
TRANSACTION_EXCLUDE_LIST='CIUXTRAN'
DUMP_HLQ='DUMP ' DYNAMIC_CALL=Y
TRIGGER FOR TASK COLLECTION=9999 COLLECT LONG RUNNING TASKS=N
Collect Application Data = 'N'; Application data is not collected
DATE/TIME OPTIONS:
HOUR_OF_DAY='YYYYYYYYYYYYYYYYYYYYYYYY' DAY_OF_WEEK='YYYYYYY'
DAY_OF_MOUNTH='YYYYYYYYYYYYYYYYYYYYYYYYYYYYYYY'
MOUNTH_OF_YEAR='YYYYYYYYYYYY'
DEPENDENCY OPTIONS.
CICS API OPTIONS:
PROGRAMS=Y FILES=Y TRANSACTIONS=Y TASK_CONTROL=Y PRESENTATION=Y
TS_QUEUES=Y TD_QUEUES=Y JOURNALS=Y DTP=Y COUNTERS=Y FEPI=Y
WEB_SERVICES=Y EXITS=Y OTHERS=Y EVENT_PROC=Y ATOM_SERVICES=Y
XML_TRANSFORM=Y WSA_ADDRESSING=Y
CICS SPI OPTIONS:
PROGRAMS=Y FILES=Y TRANSACTIONS=Y TEMP_STORAGE=Y
TRANSIENT_DATA=Y DB2=Y DJAR=Y BR_FACILITY=Y CORBASERVER=Y
TCPIP_SERVICE=Y FEPI=Y JOURNALS=Y LIBRARY=Y CONNECTIONS=Y
BTS_PROC=Y BUNDLES=Y ATOM_SERVICES=Y CSD=Y XML_TRANSFORM=Y
MQ_CONN=Y JVM_SERVICES=Y TERMINALS=Y CICS_SYSTEM=Y TASKS=Y
DUMPS=Y VTAM_CONN=Y STATISTICS=Y TRACING=Y SHUTDOWN=Y
DB2/IMS/MQ/CPSM OPTIONS: DB2=N INQUIRE_DB2=Y MQ=N IMS=N CPSM=N
NATURAL OPTIONS: PROGRAM_CALLS=N ADABAS_CALLS=N
AFFINITY OPTIONS.
INTER-TRANSACTION:
ENQ/DEQ=Y TS_QUEUE=Y ADDRESS_CWA=Y RETRIEVE_WAIT=Y LOAD=Y
GETMAIN_SHARED=Y CANCEL=Y
TRANSACTION-SYSTEM:
INQUIRE/SET=Y ENABLE/DISABLE=Y EXTRACT=Y COLLECT_STATS=Y
PERFORM=Y RESYNC=Y WAIT=Y DISCARD=Y CREATE=Y CSD=Y
80 © 2015 IBM Corporation

81 © 2015 IBM Corporation

Left column shows the cost of the workload with IA completely disabled.
Every other column shows where the collection frequency has been set to
every 1 in n tasks. Increasing the frequency of the collection (i.e. towards the
right of the chart), increases the associated overhead.
82 © 2015 IBM Corporation

"% Saving in CPU" is calculated when comparing with CICS IA collecting
data for every task (i.e. second row).
83 © 2015 IBM Corporation

84 © 2015 IBM Corporation

85 © 2015 IBM Corporation

The EXEC CICS LINK between the CICS DPL bridge task and the receiving
application passes a COMMAREA, which is limited to 32kB.
To use this functionality, change the CKBP transaction to the new CKBC transaction
and code your applications to accept data on the DFHMQBR_CHANNEL channel,
using the DFHREQUEST and DFHRESPONSE containers.
Transactions
•CKBR
• CICS Bridge Monitor transaction – long running task
•CKBP (for Commareas) or CKBC (for Containers)
• CICS DPL Bridge task
MQ calls issued
•CKBR – MQGET BROWSE WAIT
•CKBP/CKBC – MQOPEN and MQGETs
• 1 MQGET per inbound message within the UOW
•CKBP/CKBC – MQOPEN and MQPUTs (when reply-to-queue specified)
• 1 MQPUT per outbound message sent within the UOW
• MQPUT1 used when only 1 outbound message per UOW
86 © 2015 IBM Corporation

© 2015 IBM Corporation 87

88 © 2015 IBM Corporation

89 © 2015 IBM Corporation

Chart shows CPU costs for the CICS region only.
© 2015 IBM Corporation 90

© 2015 IBM Corporation 91

Chart shows total CPU cost for all relevant address spaces on the LPAR.
© 2015 IBM Corporation 92

© 2015 IBM Corporation 93

94 © 2015 IBM Corporation

95 © 2015 IBM Corporation

96 © 2015 IBM Corporation

97 © 2015 IBM Corporation

98 © 2015 IBM Corporation

99 © 2015 IBM Corporation

During testing, we found that using a TRANCLASS to throttle work through
the JVM was more efficient than the JVMSERVER THREADLIMIT attribute.
100 © 2015 IBM Corporation

101 © 2015 IBM Corporation

102 © 2015 IBM Corporation

A sample of the JCL used to produce the *.wsbind files for the JSON pipeline
parsing application.
103 © 2015 IBM Corporation

104 © 2015 IBM Corporation

JSON formatting has been added for clarity. The on-the-wire format removed
all unnecessary whitespace as would be found in a typical production
environment.
105 © 2015 IBM Corporation

JSON formatting has been added for clarity.
106 © 2015 IBM Corporation

107 © 2015 IBM Corporation

Data is calculated from RMF data which encapsulates the whole of the CICS
address space.
The IEAOPTxx parmlib member option PROJECTCPU and and IEASYSxx
parmlib member option ZAAPZIIP were both configured to YES to enable
recording of offload-eligible CPU time, and zAAP-on-zIIP execution
respectively.
zIIP figures represent the IIPCP field in the RMF report, while GCP figures
represent the CP fields minus the IIPCP field.
Note that the amount of non-zIIP eligible CPU cost remains approximately
constant, regardless of the response size. The serialisation of the JSON
response occurs in the CICS Java implementation, which is where the
variation in CPU cost originates.
108 © 2015 IBM Corporation

Data is calculated from RMF data which encapsulates the whole of the CICS
address space.
The IEAOPTxx parmlib member option PROJECTCPU and and IEASYSxx
parmlib member option ZAAPZIIP were both configured to YES to enable
recording of offload-eligible CPU time, and zAAP-on-zIIP execution
respectively.
zIIP figures represent the IIPCP field in the RMF report, while GCP figures
represent the CP fields minus the IIPCP field.
Note that the amount of non-zIIP eligible CPU cost remains approximately
constant, regardless of the response size. The serialisation of the JSON
response occurs in the CICS Java implementation, which is where the
variation in CPU cost originates.
109 © 2015 IBM Corporation

Data is calculated from RMF data which encapsulates the whole of the CICS
address space.
The IEAOPTxx parmlib member option PROJECTCPU and and IEASYSxx
parmlib member option ZAAPZIIP were both configured to YES to enable
recording of offload-eligible CPU time, and zAAP-on-zIIP execution
respectively.
zIIP figures represent the IIPCP field in the RMF report, while GCP figures
represent the CP fields minus the IIPCP field.
Note that the amount of non-zIIP eligible CPU cost remains approximately
constant, regardless of the response size. The serialisation of the JSON
response occurs in the CICS Java implementation, which is where the
variation in CPU cost originates.
110 © 2015 IBM Corporation

Data is calculated from RMF data which encapsulates the whole of the CICS
address space.
The IEAOPTxx parmlib member option PROJECTCPU and and IEASYSxx
parmlib member option ZAAPZIIP were both configured to YES to enable
recording of offload-eligible CPU time, and zAAP-on-zIIP execution
respectively.
zIIP figures represent the IIPCP field in the RMF report, while GCP figures
represent the CP fields minus the IIPCP field.
Note that the amount of non-zIIP eligible CPU cost remains approximately
constant, regardless of the response size. The serialisation of the JSON
response occurs in the CICS Java implementation, which is where the
variation in CPU cost originates.
111 © 2015 IBM Corporation

Data is calculated from RMF data which encapsulates the whole of the CICS
address space.
The IEAOPTxx parmlib member option PROJECTCPU and and IEASYSxx
parmlib member option ZAAPZIIP were both configured to YES to enable
recording of offload-eligible CPU time, and zAAP-on-zIIP execution
respectively.
zIIP figures represent the IIPCP field in the RMF report, while GCP figures
represent the CP fields minus the IIPCP field.
Note that the amount of non-zIIP eligible CPU cost remains approximately
constant, regardless of the response size. The serialisation of the JSON
response occurs in the CICS Java implementation, which is where the
variation in CPU cost originates.
112 © 2015 IBM Corporation

© 2015 IBM Corporation 113

Note that overall storage usage has been reduced.
Reduction has been achieved from the 31-bit storage areas.
© 2015 IBM Corporation 114

© 2015 IBM Corporation 115

© 2015 IBM Corporation 116

For each HTTP request into CICS, whether as a web, a web service, or a JSON
request, there are two tasks associated with the request. This results in two
SMF records being emitted from CICS if MN=ON and MNPER=ON.
With the removal of the CWXN transaction, less CPU and storage is required
to process the request, and there will only be one resultant SMF record emitted
from the CICS region.
Application-Transparent Transport Layer Security (AT-TLS) is a feature of
IBM Communications Server, where TLS encryption is handled by the TCPIP
address space, rather than the receiving address space.
CICS TS V5.3 open beta permits TCPIPSERVICE resources to be configured
as AT-TLS aware, enabling CICS to obtain security information from the
network stack.
© 2015 IBM Corporation 117
118 © 2015 IBM Corporation

With CICS TS V5.1, the MXT value can now be set to 2000, rather than 999.
© 2015 IBM Corporation 119

Real storage usage covers all CICS regions in the consolidation configuration.
© 2015 IBM Corporation 120

CPU savings can be achieved by consolidating CICS regions.
For both workloads, the same transaction rate was achieved using fewer
Application Owning Regions (AORs).
© 2015 IBM Corporation 121

Hardware Instrumentation Services data was collected for the final
measurement interval.
ETR is External Throughput Rate (transaction rate).
CICS % refers to the CP field on an RMF report class report.
LPAR % refers to the RMF workload activity report.
© 2015 IBM Corporation 122

CPU savings are achieved because there are significantly fewer CPU cycles
spent waiting for data-cache and TLB misses.
© 2015 IBM Corporation 123

Hardware Instrumentation Services data was collected for the final
measurement interval.
ETR is External Throughput Rate (transaction rate).
CICS % refers to the CP field on an RMF report class report.
LPAR % refers to the RMF workload activity report.
© 2015 IBM Corporation 124

CPU savings are achieved because there are significantly fewer CPU cycles
spent waiting for data-cache and TLB misses.
© 2015 IBM Corporation 125

© 2015 IBM Corporation 126

https://ibm.biz/BdFHFr
© 2015 IBM Corporation 127

See Hardware Instrumentation Services documentation for the production of
SMF 113 records.
The use of SMF 113 records is now recommended by IBM when considering
hardware upgrades.
© 2015 IBM Corporation 128

© 2015 IBM Corporation 129

Table is an extract of the LSPR found here:
https://www.ibm.com/servers/resourcelink/lib03060.nsf/pages/lsprITRzOSv1r
13?OpenDocument
© 2015 IBM Corporation 130

© 2015 IBM Corporation 131

© 2015 IBM Corporation 132

© 2015 IBM Corporation 133

© 2015 IBM Corporation 134