shareholder wealth effects of mergers and acquisitions:...
TRANSCRIPT

Department of Business Finance Author: Casper Flugt Bsc. Business Administration & International Management
Advisor: Ph.D. Jan Bartholdy Associate Professor
Shareholder wealth effects of mergers and acquisitions: An empirical investigation of short-term performance in the
European market
May 2009 Aarhus School of Business, University of Aarhus, Denmark

Abstract This thesis looks at the value generated to target and bidder shareholders by the announcement of
mergers and acquisitions (M&A) in the European Union over the period 2000-2008 in a sample of
288 deals. Cumulative abnormal shareholder returns, the difference between the expected return on
a stock and the actual return that comes from the M&A announcement, reflect the expected value
resulting from synergies. Target firms receive on average a statistically significant cumulative
abnormal return of 14.92% in a five-day window around the announcement day. Bidders’
cumulative abnormal returns are on average zero. The evidence is consistent with previous
empirical findings in the field. When distinguishing in terms of means of payment, the findings
show that share price reaction is sensitive to means of payment for both targets and bidders, but
there is not enough statistical evidence to document a significant difference between the types of
payment. Likewise, it is not possible to find a significant difference between domestic and cross-
border M&A announcements suggesting that the market neither compensate nor penalize for the
obstacles that the target and bidder might face in cross-border M&A. The relatedness between the
target and the bidder based on their SIC-codes is also examined, but no difference is detected
Finally, the study finds that UK targets on average receive larger cumulative abnormal return than
their Continental European counterparts which is consistent with previous findings and theories of
corporate governance regulations and shareholder protection.
Keywords: Mergers and acquisitions; Europe; event study; market model; means of payment;
cross-border M&A; domestic M&A; bidders; targets; takeovers; parametric tests; non-parametric
tests

TABLE OF CONTENTS
1. INTRODUCTION ....................................................................................................................................................... 1
1.1. PROBLEM STATEMENT ........................................................................................................................................... 2 1.2. DELIMITATION ....................................................................................................................................................... 3 1.4. EVALUATION OF SOURCES ..................................................................................................................................... 4
2. THEORY AND LITERATURE REVIEW ...................................................................................................................... 4
2.1. M&A MOTIVES ...................................................................................................................................................... 4 2.1.1. Neoclassical theory ....................................................................................................................................... 4 2.1.2. Behavioral theories ....................................................................................................................................... 6
2.2. DEVELOPMENT OF HYPOTHESES ............................................................................................................................ 7 2.2.1 Target and bidders in European M&A .......................................................................................................... 7 2.2.2. Means of payment in M&A ........................................................................................................................... 9 2.2.3. Domestic versus cross-border M&A ........................................................................................................... 12 2.2.4. UK versus Continental Europe M&A ......................................................................................................... 15 2.2.5 Focus versus diversification M&A ............................................................................................................... 17
3. METHODOLOGY ...................................................................................................................................................... 19
3.1. MARKET EFFICIENCY ........................................................................................................................................... 19 3.2. ESTIMATION PERIOD, EVENT DAY AND EVENT WINDOW ....................................................................................... 20 3.3. MODELS FOR MEASURING “NORMAL” AND ABNORMAL PERFORMANCE ............................................................... 21 3.4 PARAMETRIC AND NON-PARAMETRIC TEST STATISTICS ........................................................................................ 23
3.4.1. Parametric tests .......................................................................................................................................... 23 3.4.2 Non-parametric tests .................................................................................................................................... 24
3.5 TEST OF DIFFERENCE BETWEEN AVERAGE CAR ................................................................................................... 25
4. DATA SELECTION ..................................................................................................................................................... 26
5. DESCRIPTIVE STATISTICS ....................................................................................................................................... 28
6. EMPIRICAL EVIDENCE ............................................................................................................................................ 30
6.1 TARGET VERSUS BIDDING FIRMS ........................................................................................................................... 30 6.2 MEANS OF PAYMENT IN M&A .............................................................................................................................. 33 6.3 DOMESTIC VERSUS CROSS-BORDER M&A ............................................................................................................ 34 6.4 UK VERSUS CONTINENTAL EUROPE ..................................................................................................................... 36 6.5. FOCUS VERSUS DIVERSIFICATION ........................................................................................................................ 37 6.6 EXAMINING DIFFERENCES BETWEEN CAR ............................................................................................................ 39
6.6.1. Target firms ................................................................................................................................................. 39 6.6.1. Bidding firms ............................................................................................................................................... 41
7. EVALUATION AND FUTURE STUDIES .................................................................................................................... 42
8. CONCLUSION ........................................................................................................................................................... 43
9. BIBLIOGRAPHY ....................................................................................................................................................... 45

1
1. Introduction
Mergers & Acquisitions (M&A) continue to play a major role in shaping business activities. Once
a phenomenon seen primarily in the US, M&A are now taking place in countries throughout the
world. Continental Europe has experienced M&A bursts intersperse with relative inactivity both
domestically and across national border since the stock market bull run from the recession 1980-
81, the deregulation of the financial services sector, and development of new financial instruments
and markets, labeled the first European merger wave (Bishop & Kay: 1993, Hitt et al: 2001). The
first real increase in M&A activity in the UK, on the other hand, can be traced back to the 1920’s
when the development of mass production techniques created an increase in the vertical integration
through scale of production, while the second merger wave came in the 1960s as a response to the
internationalization of the world economy. There was a need for M&A to create larger firms that
would be capable of being effective in international competition especially from countries like the
US and Japan (Sundarsanam: 2003). Thus, while Continental Europe experienced their first great
merger wave in the 1980s, this marked the beginning of the third merger wave in the UK.
A sharp increase in the number of European M&A deals appeared in the beginning of the 1990s by
the introduction of the 1992 Single Market programme, the European Monetary Union, the
development of new European stock exchanges and further deregulation, privatization, and growth
in the technological industries (Weston et al: 2001). In 2001, the worldwide collapse of consumer
confidence and aftermath of the dotcom bubble burst saw the pace of M&A transactions in Europe
ease considerably like in the rest of the world. The decline lasted only until 2003 when European
M&A activity started to gain momentum again, in what looked like the beginnings of a re-run of
the M&A that the defined the 1990s. In fact, M&A activity in Europe continued to grow
significantly into the new millennium, exceeding the US M&A activity level in terms of both total
volume and deal value in 2007. However, as the global economical crisis hit the world during
2008, it caused an abrupt reduction (41% decline from 2007 levels) in M&A activity in Europe
that matched a similar global slump in volume1. Appendix A provides graphical illustrations of the
European M&A activity from 1981-2008 in terms of total transaction value and total number of
deals.
1 Based on own calculations from (see appendix A)

2
The recent increase in European M&A activity in the 21st century presented above raises an
interesting question for companies and shareholders all over Europe: Do M&A announcements
create value for the shareholder of European bidder and target firms in the short term? The central
question is whether shareholders are better off compared to the return on a benchmark (the
required return). The question is not only interesting but also highly relevant for a number of
reasons: First of all, several short term studies has proved that on average target shareholders gain
substantially wealth effect from M&A i.e. abnormal returns, but whether bidding firms
shareholders experience a wealth effect from M&A is a matter of ongoing debate among academic
researchers (e.g. Moeller et al: 2005). As the net effects of M&A activity remain unclear despite a
number of studies, a need exists for continued research on this subject. Secondly, the problem with
previous empirical evidence in the field is that the vast majority of studies focuses on observations
and cases from the US, Canada, and to some extent the UK leaving little emphasis on M&A
activity in the rest of Europe (Bruner: 2004, Brealey et al: 2008, Sudarsanam; 2003). Finally,
because scientific evidence on shareholder wealth effects of M&A were published in the 80s and
90s using data from the first and the second European merger waves, a new investigation of
shareholder wealth effects after the latest European merger wave is appropriate to sharpen and
expand our understanding of M&A activity in Europe - from a modern perspective.
1.1. Problem statement
The arguments presented above are the main reasons and motivations for this thesis, and it is the
ambition to conduct the analysis in line with previous academic evidence in the field of M&A.
Therefore, this paper will focus on European M&A profitability from a quantitative perspective by
examining the abnormal stock returns to shareholders in the period surrounding the announcement
date using the event study methodology in a short term window to see whether the findings of the
80s and 90s merger waves are still applicable to European data from the 2000s. The following
research question will be investigated:
Do M&A announcement in the European market create value for shareholders of European bidder and
target firms in the short term window.
In order to ensure a solid answer, the overall research question is analyzed in connection with
the following sub-questions:

3
(a) What are the effects of different means of payment on the abnormal return to shareholders
of the acquiring and target firm?
(b) What are the effects of the target firm or the acquiring firm being involved in domestic
versus cross-border M&A on the abnormal return to shareholders?
(c) What are the effects of the target or the acquiring firm being located in the UK versus being
located in Continental Europe on the abnormal return to shareholders?
(d) What are the effects of the target and the acquirer firm being from the related or unrelated
industries?
To answer these questions the author will test whether shareholders’ wealth gains are enough to
compensate them for the risk they bear in being invested in the acquiring firm or the target firm
following the acquisition announcement. In other words, the return they earn from investing in the
acquirer’s stock or target’s stock is larger than what they could have earned in the market.
Therefore, the report will be structured the following way: Section 1 examines relevant theories and
motives behind M&A. Section 2 offers an extensive literature review, summarizes the main
findings from previous studies on mergers and acquisitions, and establishes relevant hypothesis.
Section 3 describes the event study methodology and the tests statistics used. Section 4 explains the
data selection method and establishes the final sample. Section 5 provides the reader with
descriptive statistic on the final sample. Section 6 presents and compares the results of the
statistical analysis, its implications and validity. Finally, section 7 and section 8 conclude on the
findings of the study.
1.2. Delimitation
Delimitation has been made due to the scope of the thesis. First of all, the paper will focus only on
the short term approach that assumes stock market efficiency whereas the long-term performance
assessment with the assumption that markets take time to evaluate the implications of acquisitions
will be left out. Market efficiency will be discussed in more details in Section 3.
Secondly, the data selection has been narrowed down to domestic and cross-border intra-European
M&A deals for the period 2000-2008 where both the acquiring and target firm are member states of
the EU. The decision to focus on intra-European deals and not European deals in general is not seen
as a pitfall as the vast majority of M&A activity still takes place between to parties located in the
Europe rather than transatlantic deals as figures in appendix B illustrates. A detailed explanation of

4
how the sample has been selected will be presented in Section 4. Thirdly, the thesis will use a
single event window only, whereas a number studies on shareholder wealth effects in the short term
uses different event windows to detect weather or not there the length of the event window has an
impact on the results. This delimitation is not seen as critical weakness as longer windows are
likely to capture noise that could overestimate the true impact of the M&A announcement that
usually happens a few days prior and after the announcement. Finally, the thesis will not go into
details with a full mathematical presentation of the models used, but more importantly focus on the
application and consequences of these in relation to the problem statement.
1.4. Evaluation of sources
The sources used and cited are primarily academic articles published in journals. This choice has
been made to ensure the use of well-documented theories and frameworks that have been through a
critical review process before being release to the public. Also, if the study is carried out in the line
with prior empirical investigation in the field of event studies of M&A announcements, it would
make comparison more reliable and valid. It is the ambition to select and use a variety of sources in
the analysis as we proceed to obtain different perspectives on the relevant issues discussed in the
thesis.
2. Theory and literature review
The first part of the literature review will be compromised of a discussion of the possible motives
for firms to engage in M&A. The main differences between the neoclassical theories and behavioral
theories will be presented as they both are vital in the discussion and understanding of shareholder
wealth effects of M&A to target and bidding firms. The second part develops the hypothesis that
will be tested in order to answer the questions set forward in the problem statement.
2.1. M&A motives
2.1.1. Neoclassical theory
In modern finance theory (e.g. Manne: 1965), shareholder wealth maximization that are in line with
a company’s business strategy is stated as the rational for investment and financing decisions made
by managers. This means that firms should invest when the sum of the present values of future cash
flows exceeds the initial project outlay. With M&A, the shareholder wealth maximization criterion
is satisfied from the bidder’s perspective when the added value by the acquisition of a target

5
company exceeds the cost of acquisition i.e. the transaction costs and the acquisition premium.
Likewise, managers of targets would engage in M&A activity only if it results in gains to the target
shareholders. The result is synergy: positive gains to the bidder and the target (Berkovitch &
Narayanan: 1993). However, Bruner (2004) notes that “true synergies create value for shareholders
by harvesting benefits from mergers that they would be unable to gain on their own”. Therefore,
managers as agents for shareholders should think like shareholders to create value and make a
detailed analysis of possible synergy values. From an economic and operational perspective on
mergers, synergies can be generated by combining the operational resources of two companies if a
strategic fit is present. Costs reduction may be achieved through economies of scale, economies of
scope, or reductions in assets (Porter: 1985). Revenue enhancements synergies are envisioned to
arise from a sale and marketing point of view, while M&A also offers an alternative pathway to
tangible, intangible and human resources and capabilities (Simmonds: 1990).
Financial synergies arise from value of leveraging M&A activities versus individual activities. This
stands in sharp contrast to the early view of Miller & Modigliani (1958), who argued that in a well-
functioning efficient market without taxes, informational asymmetries, and default costs no
financial synergy can be found because the market value of company does not depend on its capital
structure. However, a firm’s capital structure decision can matter if these assumptions are not true.
Therefore, changes in the scope of the firm as a result of M&A, which affect the optimal capital
structure, are likely to create financial synergy. For example Lewellen (1971) used the portfolio
distribution theory to hypothesis the coinsurance hypothesis as a pure rational for M&A. He
explained that a M&A between two or more firms whose cashflows are less than perfectly
correlated would reduce the joint probability of financial distress and thereby increases a measure
of debt capacity for the combined firm. Additional borrowing capacity for the combined firm would
lead to greater optimal leverage and further exploitation of debt tax shields2 that would create value
for shareholders. Likewise, Seth (1990) noted that synergy gains from coinsurance are likely to be
lower for target and bidders facing the same market or demand because of a high correlation
between their earning streams. Supporting empirical evidence of the coinsurance hypothesis for
conglomerate mergers is found in Kim & McConnell (1976) and Higgins & Schall (1975) who
reported that the merged firm value may increase to due lower risk. Another common cited reason
for firms to be engaged in M&A is diversification, i.e. a reduction of risk. However, if the argument
2 Interest expenses carry a tax subsidy.
6
presented above by Bruner (2004) is true, then diversification is less likely to qualify as a pure
financial synergy, as investors in perfect capital markets can combine a personal portfolio with the
similar risk characteristics. In fact, empirical studies such as Lang & Stulz (1994) and Berger &
Ofek(1995) found evidence that in a imperfect market diversified firms has been worth less
(measured by Tobin’s q ) than a portfolio of specialized firms. Thus, shareholders do not seem to
benefit exclusively from diversification from a financial perspective. In summary, although
financial synergies seems to be present and the combination of synergy are likely to shift the
optimal point cost of capital, the economical and operating synergies seems to be the most
dominant value-maximization motives for firms engaged in M&A activity.
2.1.2. Behavioral theories
The hubris hypothesis formulated by Roll (1986) postulates that managers systematically commit
error of optimism in evaluating merger opportunities due to their excessive self-confidence. The
higher valuation of the bidders, compared to the true value of the target, would not have been made
by rational bidders. Thus, managerial motives are important determinants for the outcome of the
M&A as manager may act to maximize their own utility and engage in ‘empire building’
(Trautwein: 1990, Zalewski: 2001) instead of their shareholders’ value – the paramount goal of
classical finance theory as discussed above. For example, Jensen (1986,1988) explains that
managers may invest the free cash flow3 in projects such as acquisitions with negative NPV if that
would lead to increased personal utility rather than maximize shareholder value. These free cash
flows, which are generally found in the reserves, should rather be paid out as to shareholders in the
form of dividends if the firm is to be effective and to maximize the stock price. (Jensen: 1986).
Amihud & Lev (1981) and later Black (1989) argue that managers in conglomerate mergers face an
“employment risk” because their future employment and earnings potential are highly correlated
with the firm’s risk. As a result, risk averse managers may undertake M&A to reduce their
employment risk, rather than benefit shareholders, because such risk cannot be diversified in their
own portfolio (Weston, Siu, and Johnson: 2001). In addition, Mueller (1969) developed a growth
maximization model of M&A based on the argument that managers’ bonuses, social status, salary,
and promotions are related to the size of the firm. He argues that because of this relationship,
managers a more likely to accept a return of the investment that is lower than shareholders
3 Cash flow in excess of that required to fund all of a firm’s projects that have positive net present values when discounted at the relevant cost of capital.

7
requirements. Therefore, managerial hubris can be viewed as an agency problem that arises due to
separation of ownership and control and the resulting divergence between the interest and motives
of managers (the principles) and shareholders (the agents) (Alchian & Demsetz: 1972, Jensen and
Meckling: 1976).
Whether managers act to maximize their own utility or shareholder’s wealth has been tested
empirically in a small number of studies. Lewellen & Rosenfeld (1985) studied the stock returns of
191 acquiring firms during the period 1963-1981 and concluded that positive significant
relationship between abnormal stock returns from M&A and the percentage of management
ownership in the acquiring firm. He found that managers with large personal ownership in the firm
were less like to be engaged in M&A that would reduce acquirer’s shareholder wealth. Similarly,
Firth (1991) tested the relationship between executive reward and M&A and found if shareholder
value is increased then so is executive rewards. Contrary, when shareholder wealth is destroyed
then executives still seem to gain from M&A. These finding are interesting because they support
the view that managers through M&A activities may seek to utilize their own utility at the expense
of shareholders.
In sum, the three motives discussed in this section would lead to following expectations of the
abnormal return to targets and bidders as pointed out by Berkovitch & Narayan (1993): Synergy
motives would have a positive influence on the abnormal return to both bidders and targets, while
agency motives and hubris motives would influence abnormal return to bidders in a negative way.
On the contrary, targets would experience a positive influence on abnormal return if bidder’s M&A
is based on agency and hubris motives. Therefore, it can be concluded that targets are likely to
experience higher abnormal returns than bidders in the case of M&A announcements.
2.2. Development of Hypotheses
2.2.1 Target and bidders in European M&A
Numerous studies have estimated the effects of M&A on stock prices of acquirer and target firms
around the time of announcement of an acquisition using daily stock prices. Evidence indicates
that target shareholder earn significantly positive abnormal returns in the days around an M&A
announcements. For example, for a sample of 1814 US takeovers in the period 1975-1991,
Schwert (1996) found abnormal returns to shareholder of target firms of 10.1 %, whereas Jarrel &

8
Poulsen (1989), reported return to the target equal to 28.99% when examining a sample of 526
transactions of US companies between 1963 and 1986. A similar pattern is observed in Frank &
Harri’s (1989) sample of 1898 UK targets in the period 1955-1985, with a significant return of
23.3%. More recently, Goergen & Renneboog (2004) supported those findings for European
transactions, reporting a significant abnormal return of 9.01% to target shareholders. In fact, the
findings of 17 major studies on short term performance on M&A announcements, summarized in
appendix C, reveal returns that that are significant to target shareholders despite variations in time
period, sample size, and time period. The weighted abnormal market based return to target firms’
shareholders of the entire 17 studies is 19.81% whereas a slightly higher gain of 20.44% is
apparent from the limited number of European M&A transactions. Thus, the results for the
European studies seem to be in line with the evidence found in studies involving US based firms.
These findings are consistent with other surveys provided by Jensen & Ruback (1983), who
summarized 13 studies up to that date and report significant increases in targets stock prices
ranging from 16.7% - 34.1 % around the M&A announcement. Therefore, based on the previous
empirical findings and theories discussed earlier the expectation must be that M&A
announcements would lead to significant abnormal returns to shareholders of target firms in
Europe.
The pattern of findings about shareholder return to the bidding party is more complex. Franks et al
(1991) found for a sample covering 399 US takeovers consummated in the 1975-1984, a small
insignificant negative return to shareholders of the acquiring firm of -1.02%. Supporting evidence
are found in Mulherin & Boone‘s (2000) sample of 138 US acquirers over a 9 year-period (1990-
1999) and Kuiper et al (2003), covering 181 US acquiring companies in the period 1981-1991,
who report negative returns of -0.37% and -0.92%, respectively. On the contrary, there are several
studies that report small positive returns to acquirer shareholders including Bradley el al (1988),
who found evidence of significant positive return of 0.97% in a US sample in the time period
1963-1984 of 161 tender offers. Dod & Ruback (1977) also provided empirical estimates of the
stock market reaction to 169 tender offers. However, their research was split into successful and
unsuccessful acquirers, finding evidence that only successful acquirers earn significant positive
abnormal returns of 2.83% versus an insignificant return of 0.58% for unsuccessful acquirers. This
was later confirmed by Asquith (1983) stating a 3.48% and 0.7% abnormal return to successful
and unsuccessful acquirers, respectively. From Appendix C, which summarizes the findings of 22

9
studies including those already discussed, it is evident that 10 studies report small positive returns,
whereas the cumulative abnormal return of the 12 remaining studies is small and negative.
Therefore, although it cannot be concluded that there is strong support for either positive or
negative cumulative abnormal returns, the very small weighted average cumulative abnormal
return for all 22 studies combined with the fact that all four studies using data from European
M&A show positive returns close to zero, the expectation must be that shareholders of acquiring
firms on average face positive abnormal returns.
In the light of the above review of previous empirical literature, the following hypothesis is
posited:
1 :AH M&A announcement by European firms will generate positive abnormal returns for target
shareholders in the short term
1 :BH M&A announcement by European firms will generate positive abnormal returns for bidding
shareholders in the short term
2.2.2. Means of payment in M&A
When one firm acquirers another it can pay for the acquisition with cash (cash in exchange for
shares), equity (a specified number of the bidder’s shares for each target share), or some
combination (loan notes, deferred payment, share and equity). The method of payment in
takeovers has been suggested to be important for a number of reasons. From a theoretical point of
view Jensen (1986) discusses agency costs of free cash flow and argues that acquisitions financed
with cash and debt will generate larger benefits than those accomplished through exchange of
stocks because “stock acquisitions do nothing to take up the organizations’ financial slack and are
therefore unlikely to motivate managers to use resources more efficiently (Jensen: 1986, p. 36).
Thus, firms that have large amount of cash, or a high cash flow are more likely to make cash
offers. This theory is in line with the signalling hypothesis of information asymmetry presented in
Myers & Majluf (1984), suggesting that because the board of the bidder company holds superior
information about the value of the company and want to act in interest of their current
shareholders, they will use stock as medium of exchange if they believe their shares are
overvalued (low private valuation bidders). Contrary to that, boards who believe that their stocks
are undervalued (high private valuation bidders) will fund the takeover by other means such as

10
cash, debt or abandon the acquisition. Since target shareholders know this, and are insufficiently
informed to determine the “true” value of the acquiring firm, an adverse selection arises, and they
reduce their estimate of the acquirer’s value. The result is that target shareholders are not inclined
to accept a stock offer4. Fishman (1989) expands on this theory assuming both two-sided
information asymmetry5 and more than one bidder in the market. He argues that when the initial
bidder identifies a target, other potential bidders will study the offer and only incur costs to obtain
information concerning the profitability of the offer, if the initial bidder’s valuation of the target is
below a certain threshold. By offering all-cash, the initial bidder, pays a relative high overpayment
costs, because the target only accepts cash offers that exceeds its private valuation, but at the same
time signals a high valuation of the target to the market that indicate that the bidder will be able to
exploit the investment opportunities by the target. This will discourage potential bidders to enter
into competition6 and hence lead to a higher abnormal return for the bidder. In addition, Hansen
(1987) argues that bidders, in the case of uncertainty in target valuation, make stock offers as they
have a “contingency pricing effect” i.e. reduce overpayments because target shareholders share
part of the risk if the bidder overpays when evaluating a stock offer (Hansen: 1997, p. 76). Eckbo
et al (1990), on the other hand, suggest that two-sided information asymmetries between the
bidder and the target can lead to an optimal mix of cash and stocks as payment method. The
authors show that the amount of cash in the composition of the mixed offer to the target, reveal the
true post acquisition value of the bidding firm, and that high private valuation bidder offers more
cash. In addition, and contrary to Fishman (1989) and Myers & Majluf (1984), the authors claim
that abnormal returns will consist of two components: synergy revaluation (expected synergy gain
independent of the method of payment) and signalling (the true bidder/synergy value gain
dependent of the method of payment). Only the synergy revaluation component is present in all-
cash offers, whereas all-equity offers are linked to the signalling component. Mixed offer captures
both a signal component and a synergy revaluation component, and thus are assumed to offer
higher abnormal returns to the bidder, than the other two payment methods.
Finally, it is worth considering the taxation aspect of the different types of payment. Cash
acquisitions are considered as immediately taxable for the target firm shareholder held by
individuals. However, when the shareholder is a capital gains tax-exempt fund, such as a pension
4 This phenomena is coined ”lemons problem” by Akerlof (1979) 5 Bidder and target each have private information about their own value 6 Demonstrated in Fishman (1988)

11
fund or investment trust, this problem does not arise. Stock acquisitions in general are tax
deferrable until the shares are sold. Consequently, in cash offers a larger premium is required to
compensate for the additional tax burden for the target firm (Gordon & Yagil: 1981). However,
Blackburn (1997) notes, the amortization of this goodwill will artificially bring down the earnings
of the bidding firm. Thus, reconciling the benefits of all-cash and all-equity acquisitions for tax
purposes is complicated as the benefits to taxation of a given payment method correspond to a
drawback for the other one.
Empirical research supports the ideas presented above. For example, Wansley et al (1983) tested
for differences in return for the target firm after controlling for payment, and find that targets in
cash acquisitions, on average, gain a 33.54 % abnormal return around the announcement, which is
almost twice the corresponding number (17.47 %) for targets engaged in stock acquisitions. Their
explanation of this difference is the tax effect, discussed above, and the regulatory requirements
that favour cash as means of payment. Likewise, Huang & Walking (1987) reported an average
target abnormal return for cash offers of 29.3 % compared with 14.4% for stock offers, while the
number for mixed payment equalled 23.3%. The difference is statistically significant.
Consequently, it can be conclude that targets are likely to gain more from all-cash offers, than all-
equity or mixed offers.
From the bidder perspective, Travlos (1987) found significant differences between cash
acquisitions and stock acquisitions announcements, for 60 bidding firms. Bidding firms that use
stock offers had a significant negative influence on the cumulative abnormal return of -1.47
percent, whereas bidders using cash offers gained an insignificant cumulative abnormal return of
0.24 percent. Brown & Ryngaert (1991) support these finding using a larger sample of 268,
reporting a 0.06% abnormal return to cash offers, -2.74 % abnormal return to stock offers, while
mixed offers (cash and equity) results in an abnormal return of 2.48% (the latter two statistically
significant). Therefore, as was the case for target shareholders, the expectation is that bidder
shareholders are likely to gain the most abnormal return from all-cash offers.
Based on the evidence presented above the following hypothesis is formulated:
2BH Average abnormal returns to target shareholders in M&A announcements of all-cash offers
are significantly higher than for all-equity offers and mixed offers.

12
2BH Average abnormal returns to bidder shareholders in M&A announcements of all-cash offers
are significantly higher than for all-equity offers and mixed offers.
2.2.3. Domestic versus cross-border M&A
The number of firms engaged in merging with or acquiring companies outside their home country
has continued to increase in the 21st century, to the point that it has become a major strategic tool
for corporate growth (Delios & Beamish: 2004). Viewed originally as primarily an activity of US
firms, cross-border M&A are now becoming more prominent among European companies. The
integration of national economies in the EU, deregulation and privatization of large industries has
decreased the cost of making acquisitions and transactions across European borders, which, in
particular has been facilitated by the introduction of the single currency (Campa & Hernando:
2004). Driving forces behind cross-border M&A, besides growth, are imperfections in product
markets (Caves: 1971), imperfections and asymmetries in capital markets (Chan et al: 1992, Cooke
& Author: 1988), differences in taxation (Weston et al: 2001), and to capture rents resulting from
market inefficiencies (Serveas & Zenner: 1994). These motives will briefly be discussed. The
theory of market imperfections and failures suggests that buyers will recognize profitable
opportunities to take advantage of cheap labour, latent consumer demand, deregulations, trade, and
country integration of capital and product markets into global markets. Asymmetries in capital
markets allow firms to exploit favourable exchange rates movements as variations in exchange
rates can make one country’s firm cheaper or more expensive to buyers from another country. For
example, Froot and Stein (1991) examined the relationship between exchange rate and foreign
direct investments (FDI) and found that the relative wealth of countries because of strong
currencies have a systematic effect on FDI. Likewise, Harris and Ravenscraft (1991) found a
relationship between exchange rate movements and announcement of cross-border M&A. On the
other hand, global tax arbitrage theory suggests that because marginal tax rates vary across the
world permits global companies to move part of the value chain to counties with lower taxes.
However, Dewenter (1995) found no empirical evidence that the US corporate tax changes is
related to the level of M&A activities and Harris and Ravenscraft (1991) found no relationship
between changes in US tax law and cross-border M&A return. Therefore, empirical evidence does
not give full support for this motive. Finally, cross-border acquisitions can reduce risk through
geographical diversification under the assumption that economic activity across countries is less
than perfectly correlated (Adler & Dumas: 1975). For example, Fatemi (1984) compared the share

13
prices of multinational companies (MNC’s) to that of firms only involved in domestic business
and concluded that the beta of the MNC’s were more stabile than domestic firms and that the risk
adjusted abnormal return to MNC’s are similar to that of domestic firms. The problem with this
motive is, as discussed in section 2.1, that such argument must be based on the assumption that
certain restrictions in the capital market make it difficult to replicate such diversification in their
own portfolio.
A firm’s decision to make acquisitions cross-border is based on the theory that if the firm poses a
resource or a unique advantage specific to the firm, then it provides the firm with the competitive
edge required to undertake and sustain FDI activity (Dunning: 1981, Barney: 1991). The sources
of such advantages include intangible assets, technology, management skills, and common
governance that arise from the organization of ownership advantage with complementary assets
that could lead to economies of scale and scope (Cartwright & Cooper: 1993). Alternatively, cross-
border M&A provide opportunities to obtain and internalize valuable and unique resources such as
marketing skills, production skills, patens etc. that complement and strengthen a firm’s own
resource base (Hitt et al 2001; Bartlett & Ghoshell,1989; Barney 1991). The complications of
cross-border M&A from the bidder’s perspective is liability of foreignness (Zeheer: 1995) i.e. lack
of country and firm specific knowledge of the foreign target firm that potentially would lead to
unsuccessful acquisitions and wrong valuation of foreign targets especially in the situations where
the foreign target has high levels of intangible assets (Reuer et al: 2004). The result of information
asymmetry would be greater acquisitions costs and bid premiums that would benefit foreign target
shareholders in the short term, but lead to zero or negative shareholder wealth effects for bidders
(Datta & Puia, 1995, Reuer et al: 2004).
A number of studies have examined the wealth impact of shareholders involved cross-border
acquisitions. Doukas et al (1988) presented evidence on the effect of international acquisitions on
stock prices of 301 US acquirers engaged in M&A activity for the period 1973-19. The total
sample did not show any abnormal performance of US acquirers relative to the pre- and post-
announcement day. However, after dividing the original sample into three homogeneous
subsamples; US firms expanding internationally for the first time, US firms not operating in the
target firm’s country, US firms already in the target firm’s country), the sample of 99 US firms not
operating in the target firm’s country were associated with a small but positive significant

14
abnormal return of 0.31 percent to acquirers. The other two samples showed very small and
insignificant abnormal returns of 0.74 and -0.08 respectively. The authors argue that their findings
show that the abnormal returns are larger when firms expand into new industry and geographical
markets, and most pronounced when the entry is into an emerging market country (Doukas et al:
1988). Likewise, Datta & Puia (1995) report no abnormal returns to shareholders of the acquiring
firm in their study of 112 large cross-border acquisitions between 1978 and 1990, and Fatemi &
Furtato (1998), documents small insignificant negative returns when investigating a sample of 117
US acquirers for the period from 1974 to 1979. Harris & Ravenscraft (1991), on the other hand,
studied shareholder wealth gains for 1273 US targets acquired during the period 1970-1987, and
demonstrated that target wealth gains were significantly higher in cross-border takeovers than in
domestic acquisitions. Eun et al (1996) investigated a sample of foreign acquisitions of US targets
during the period 1979-90 and reported a significantly positive abnormal return for US targets of
37.02%, but significantly negative abnormal return for the overall sample of acquirers of -1.2%,
however, with different returns across countries of acquirers. In a more recent study, Corhay &
Rad (2000) tested wealth effects of international acquisitions using a sample of foreign
acquisitions by Dutch firms during the period 1990-1996. Their results shows small insignificant
negative abnormal returns to Dutch firms engaged in takeovers of firms located in Europe,
whereas M&A involving targets in the US showed significant abnormal returns to the Dutch
shareholders of 4.83% at the time of announcement. Moeller & Schlingemann (2005) found in a
comparison of UK and US acquirer, domestic announcements generating more wealth than cross-
border announcements. Likewise, Campa & Hernando (2004) reached a similar conclusion for
bidders in a sample of 262 European M&A announcements over the period 1998-2000, while
targets gained substantially more from cross-border mergers.
This overview illustrates that there are no clear empirical results confirming the shareholder wealth
effects of the bidding firm due to domestic or cross-border takeover announcements, whereas
target shareholders seems to gain in both domestic and cross-border M&A, however it is expected
that target’s shareholder gain is higher for cross-border announcements. Thus, the following
hypotheses are posited:
3 :AH Average abnormal returns to target shareholder in cross-border M&A announcements are
significantly higher than for domestic M&A announcements.

15
3 :BH Average abnormal returns to bidder shareholder in cross-border M&A announcements are
significantly higher than for domestic M&A announcements. 2.2.4. UK versus Continental Europe M&A
The UK and Continental Europe corporate governance arrangements originate from two different
commercial law systems; the common law system and the civil law system, respectively7 (La Porta
et al: 1998). Legal traditions are important due to major differences in ownership structure,
shareholder protection, and the capital market. Franks & Mayer (2001) used the terms “outsider”
and “insider” systems to differentiate between the two systems of the Anglo-Saxon countries and
Continental Europe, respectively. In the “outsider system” there is large equity markets and
dispersed ownership of corporate equity among a large number of outside investors that tend not to
hold major shareholdings in any given company. As a consequence, shareholders exert little direct
control over companies, and the separation between ownership and control is high. Therefore, the
principal agency problem that relates to the existence of a general conflict between managers and
all shareholders, as described in section 2, are assumed to be more frequent in common law
countries such as the UK. Likewise, because voting power is dispersed, free-rider problems8 of
corporate control that affects stocks markets are more likely to occur in this system (Shleifer &
Vishney: 1997, Renneborg: 2006). In an “insider system”, like that of many Continental European
countries, the numbers of listed companies as a percentage of the total number of companies is
lower than in the UK, companies are on average smaller in size, and ownership tends to be highly
concentrated, with shares often being owned either by holding companies, families or the state
(Vincke: 1998, Franks & Mayer: 2001). Figure 1 in appendix D supports this idea by comparing
the percentage of listed companied with block holders owing more than 85% of voting shares9.
The percentage in the UK is less than 16%, while the number for countries located in Continental
Europe range between 93.6 and 64.2 %. Likewise, from figure 2 in appendix D it is evident that
the percentage of listed companies under majority control is remarkably higher on the Continent in
comparison with UK.
7 Although no two nations’ laws are exactly a like, scholars agree that countries can be divided into one of the two legal traditions based on the historical background, the legal institutions, and the development of the legal systems (Glendon et al: 1994) 8 Individual investors will bear the costs of control, but will only benefit from it in the percentage of his stake in the firm. 9 Block holder is defined as individual shareholders, groups of shareholders or organizations.

16
The difference in shareholder concentration between the UK and Continental Europe may have an
influential impact on the market reaction to M&A announcements. Some scholars argue that the
presence of a large blockholders in the bidding firms guarantee that the acquisition is driven by
shareholder wealth maximization and synergy effects, because the blockholder is able to control
and monitor corporate decisions (Barclay & Holderness:1992, Agrawal &Mandelker: 1990). This
would result in positive markets reactions for bidder of Continental Europe in the case of an M&A
announcement. The opposing, and more widely held view, is that blockholders are motivated to
use their voting power to expropriate private benefits from minority shareholders (Faccio & Lang,
2002; Bae, Kang, & Kim 2002). The result is that large blockholders in Continental Europe may
control decisions in directions that may exceed the level that would maximize minority
shareholder value (Faccio & Stolin: 2006). Thus, the central problem in the “insider system” is that
large agency costs may occur between blockholders and minority shareholders. As consequence, it
would be expected that the market would react less positively to M&A announcements of target or
bidder companies located in Continental Europe compared to firms in the UK.
The number empirical evidence on the market reaction to M&A announcements by legal origin of
the firm is limited. However, Goergen & Renneborg (2004) reported that the M&A announcement
effect for a sample of 158 deals covering the period 1993-2003 is substantially larger for UK target
firms (12.3%) than for firms located in Continental Europe (6%). Likewise, UK bidders obtain a
cumulative abnormal return of 1.5% whereas the bid premium is only 0.9% for Continental
European bidders. Martynova & Renneborg (2006) supported these findings in a large sample of
2419 deals involving firms from 28 European countries in the period 1993-2001, stating that UK
target firms experience abnormal returns of 17.64 % that are significantly higher than the 10.19 %
abnormal return to their Continental European peers. Contrary, UK bidding firms only experience
a 0.5 % abnormal return which is less than a 0.94 % announcement bid premium for firms in
Continental Europe. Thus, the evidence is unambiguous when it comes to effects on abnormal
return of the target being located in the UK compared to target firms based in Continental Europe,
whereas the findings from an acquirer perspective are more uncertain. Consequently, the fourth
hypothesis can be formulated as follows:
4 :AH Average abnormal returns to UK targets are significantly higher than for targets in
Continental Europe
17
4 :BH Average abnormal returns to UK bidders are significantly higher than for targets in
Continental Europe
2.2.5 Focus versus diversification M&A
The final hypothesis deals with the relatedness between the bidder and the target; a deal is
considered a related or focus-oriented strategy if the bidder and the target are from the same
industry measured by the two first digits of the four-digit Standard Industrial Classification (SIC)
codes. All other M&A are classified as unrelated or diversification strategies (Morgan et al:
2004)10. The question of abnormal return based on relatedness is important because of the relative
high volume of European M&A transactions motivated in part by a theory of need to focus or
diversify. For example, Rondi et al (1996) and Sudarsanam (2003) show that focus-oriented and
diversification firms have increased at the expense of single business firms in France, Germany
and the UK, from the 1950 and up until now. Diversification may be explained in terms of
different perspectives (economic, strategy-based, finance theoretic) that has already been
discussed. However, theory also suggests that diversification may create value as a result of
increase market power i.e. the ability to affect the prices of goods hence hold down entrants and
current single business rivals in the market (Pindyck & Rubinfeld: 2005). This could be achieved
through mutual forbearance, cross-subsidizing, and reciprocal buying strategies that a single-
business competitor will not enjoy and may be driven out of the market (Chevalier: 2004). The
problem is that a curvilinear relationship seems to exist between the extent of diversification and
market power which suggests that as diversification increases, the firm initially enjoy greater
market power, but beyond a certain level of diversification, market power starts to decrease (Palich
et al: 2000). Likewise, empirical evidence on market power of conglomerates is mixed at its best
(Sundarsanam: 2003). Thus there is not much support of the market power proposition in the
discussion of focus versus diversification strategies. Secondly, advocates of diversification such as
Williamson (1975) and Stein (1997) argue that in the case of capital market failure diversified
firms can benefit from the creation of an internal capital market as the cash flow generated
internally can be pooled and may allow a more efficient capital allocation of risk capital. However,
because of the greater diversity and complexity of diversified firms and a lack of control to
monitor and evaluate a firm’s investment decisions, opponents argue that this reduce the
10 Rumlet (1982) uses a different typology based on sale in the main business. For convenience Morgan et al (2004)’s definition is used.

18
attractiveness of internal capital markets relative to external markets (Stulz: 1990, Matsusaka &
Nanda, 1997; Rajan et al, 2000). Also, because investors require more information to value
diversified compared to focused firms, but in general are not provided more information by the
diversified firms, asymmetry of information arises that might cause diversified firms to be traded
at a discount relative to focused firms (Scharfstein & Stein: 2000). Thus, unrelated diversification
is inefficient and a result of agency costs that will not benefit shareholders of the firm.
Empirical evidence on the stock markets reaction to focused versus diversification strategies is
scarce, especially in terms of evidence from Europe. Morck et al (1990) compared abnormal return
to focus-oriented deals and diversification US deals during the 1975-1987 based on the SIC code
categorization described above. The authors found no significant difference between the abnormal
return in focus-oriented deals (within the same two-digit industry) and diversification deals
(outside the two-digit industry) to target and acquirers around the M&A announcement. Walker
(2000) also documented that related acquisitions did not generate higher value than unrelated
acquisitions for both targets and acquirers in a sample of 278 US M&A announcements in the time
period 1980-1996. These findings are in line with a UK study by Sundarsanam et al (1996) who
found no difference between the gains to shareholders in related and unrelated M&A
announcement for sample of 429 deals during 1980-1990. On the contrary, Sicherman and Pettway
(1987) reported in a sample of 147 US M&A announcements, that related firms enhances the
shareholder wealth of acquiring firms whereas the opposite is true for unrelated firms. The
difference between the two is significant. Finally, in a recent European study, Martynova &
Renneboog (2004) found that irrespective of the corporate strategy, target shareholders earned
abnormal return. However, the abnormal returns were significantly larger for unrelated M&A
announcements compared to unrelated M&A announcements. Bidders, on the other hand,
experienced significantly higher short-run wealth effect around the announcement in takeovers of
related firms.
In the light of the above review that showed mixed results, the following hypothesis is posited:
4 :BH Average abnormal returns to targets in diversification M&A announcements are
significantly higher than for focused M&A announcements.

19
4 :BH Average abnormal returns to bidders in focused M&A announcements are significantly
higher than for diversification M&A announcements.
Now that all of the hypotheses have been established, the next part will present the reader to the
methodology used in the thesis to detect abnormal return for European target and bidding firms.
3. Methodology
The event study methodology widely is used to measure the impact of a particular event on value
of the firm such as earnings announcement (Ball & Brown: 1968), stock splits (James Dolley:
1933, Fama et al: 1969), dividend announcements (Asquith & Mullins: 1983), and M&A
announcements (Jarrel & Poulsen: 1989) etc. While the applications possible with event studies
are numerous, the general flow and approach of the analysis is the same (Campell & MacKinlay:
1997). First, the event of interest is identified and the event window is defined. Secondly, the
sample set of firms to include in the analysis is selected. Thirdly, the “normal” return during the
event window in the absence of the event is predicted, and the abnormal return within the event
window is calculated, where the abnormal return is the difference between the actual and the
predicted returns. Finally, it is tested whether the abnormal return is statistically different from
zero. However, it is only appropriate to use event study method when an assumption of market
efficiency is made (McWilliams & Siegel: 1997). The assumption will briefly be discussed below.
3.1. Market efficiency
An efficient market is defined as one in which a stock price fully incorporates all available
information on that stock (Samuelson: 1965, Fama: 1998). If this is true, then any financial
relevant information that is newly revealed to investors will be instantaneously incorporated into
stock prices, because as soon as there is any information indicating that a stock is underpriced,
investors will buy the stock and immediately bid up its price to fair value (Fama: 1965). This will
rule out arbitrage opportunities, and investor will only earn a fair return (Bodie et al: 1989). Fama
(1970) introduced three versions of the efficient market hypothesis (EMH) that differ by their
notions of what is meant by the term “all available information”: the weak, semi-strong, and strong
forms of the hypothesis. The weak form of the EMH suggests that stock prices already reflect all
historical information, which implies that prices follow a “random walk” i.e. changes in stock
prices are independent of each other and have the same probability distribution (Kendall: 1953).
Scholars agree that this form of the EHM is a rather weak test because it fails to control for other

20
factors that are unrelated to the acquisition such as systematic effects and other firm specific
events (Bodie et al: 1989). The semi-strong form asserts that all public available information is
already incorporated into the stock prices. Contrary to the weak test, it controls for factors in the
industry or the entire economy by introducing one or more benchmarks. The problem with the
semi-strong form is that benchmarks are imperfect in the sense that noise and confounding effects
might still influence the results, but by selecting relevant benchmarks and using a large sample
size, the complications can be minimized (Bruner: 2004). Finally, the strong form, which generally
is acknowledge to be extreme (e.g. Seyhun: 1986, Dreman & Berry: 1995), states that stock prices
reflect all information relevant to the firm, both public as well as private. Thus, as no real market
inefficiencies exist, it is theoretically impossible for anyone to earn abnormal returns from the
stock market. Although, a number of scholars disagree on the general validity of EHM (e.g. La
Porta et al: 1997), the semi-strong form of EHM seems to have formed the basis for most
empirical research. Therefore, the notion of semi-strong informationally-efficient markets leads to
the conclusion that one should be able to measure the importance of unanticipated M&A
announcement by examining the difference between the actual post-event return and the return
expected in the absence of the event.
3.2. Estimation period, event day and event window
First the period over which the stock price of the firms involved in M&A announcement will be
examined. Let ( 1 0T T ) denote the estimation period, 1 1T to 2T the event window, and 0 the
announcement day of the M&A (see figure 1). The estimation period denoted 1 0T T of the present
study encompasses 250 days immediately prior to the start of the event window. This length is
based on Peterson (1989) and Armitage (1995), who argue that when dealing with daily studies an
estimation period of 100-300 days are sufficient for satisfactory assessment of the parameters in
statistical pricing models. Furthermore, consistent with MacKinley (1997), the event window is
excluded from the estimation period to avoid that the event itself influences the estimation of the
parameters.
Figure 1: Timeline

21
Determination and correctly identification of the event date is critical. Brown & Warner (1980)
emphasize this point because misidentification of an event can easily obscure the results of the
event study method. To deal with this issue, the event date of this thesis is defined as the official
announcement day of the M&A deal, as suggested by Dodd & Ruback (1977). Also, to minimize
the problem of misidentification of the official event day, extensive cross-checking will be
performed during the sample selection in section 4.
In a perfectly efficient market it would be sufficient to restrain the window only to include the
event day. In practice, the event window is often expanded to a couple of days. This is done to
capture market reactions of announcements where it is unclear whether the market has the
information during trading hours or whether information is available after the stock market closes
(Masulis: 1980). Furthermore, the pattern of return for the days preceding the official M&A
announcement day suggests that information leakage is a problem at a significant level up to 12
trading days prior to the announcement (Keown & Pinkerton 1981). For that reasons, it is common
to detect abnormal returns on both sides of the event day which rejects the strong form of the
EMH. Based on this evidence, a short five day event window spanning from 2 days prior to the
announcement to 2 days after the announcement [-2;+2] is found to be appropriate for this thesis to
maintain the statistical power of the event study methodology.
3.3. Models for measuring “normal” and abnormal performance
A number of statistical models are available to calculate the “normal” return that would be
expected if the M&A announcement did not take place. These include the risk-adjusted model, the
constant mean return model, the market model, and multi-factor models such as that presented by
Fama and French (1993). To discuss all these statistical models would go beyond the scope of this
paper. However, as the market model encompasses the other two models and the fact that this
model is used in the vast majority of previous studies of shareholder wealth effects of M&A
announcements serve as the main justification for the use of the market model to asses the
expected normal return i.e. the market return11. Sharp (1963) and Fama et al (1969) state that for
any given stock i the following ordinary least square (OLS) regression can be applied:
, 252,..., 3i i i m iR R (1)
11 The advantage of the mean adjusted return model and the market adjusted return model is their simplicity and minimum requirements of computing capacity.

22
where iR and mR are the return of stock i and the return of the benchmark market index (the
expected return on the stock) at time respectively. i is the random zero-mean disturbance term
i.e. forecast error and the coefficients α and β are firm specific parameters of the market model to
be estimated. The abnormal return AR for a given stock i is then the difference between the
observed return and the expected predicted return:
ˆˆ( ) , 2,..., 2i i i i m iAR R R (2)
where ˆi and i are estimated by the OLS regression in (1) using data from the estimation period
presented in section 3.3. From equation (2) it is also evident that abnormal return and the forecast
error i in the market model is the same because this coefficient is the part of a stock’s return
resulting from the M&A announcement. To capture the total firm-specific effect stock movements
for the entire event window [-2, +2] in which the market might respond to new information, the
cumulative abnormal return (CAR) is calculated by summing all abnormal return for the window:
2
2iCAR AR
(3)
The benchmark used in the OLS regression is important as it represents the return investors could
have earned on other investment opportunities of similar risk. There is considerable evidence that
the choice of benchmark can have an important impact on abnormal return (e.g. Fama & French:
1996). Typically, the benchmark is estimated by the capital asset pricing model (CAPM) or
represents the return on a broad index at either the international, regional, or industrial level.
Because this thesis deals with M&A announcement of firms in several European countries a
benchmark of the market performance in each of countries is relevant. Therefore, the author will
use the free-float adjusted equity index provided by Morgan Stanley Capital International (MSCI)
which represents approximately 85% of the total market capitalization in each industry group in
the respective European countries. A complete list of the indices and mnemonics is available from
appendix E.

23
3.4 Parametric and non-parametric test statistics
Test statistics to infer whether to attribute observed abnormal returns to chance or the M&A
announcements can be conducted by means of parametric and non-parametric tests. The two
categories of test statistics are briefly discussed below and a battery of test statistics are selected12.
3.4.1. Parametric tests
Parametric test statistics for abnormal performance during the event window are based on a
standard t test to infer if the cumulative abnormal returns are significantly different from zero.
Thus, under the null hypothesis of no abnormal performance no difference between the means
should be detected. The numerator of the t-test measures the impact for the M&A announcement
relative to the “normal” return that would be expected in the absence of the announcement based
on the market model (as discussed above), whereas the denominator takes care of scaling the
number using an estimated variance. The t-test makes four assumptions about the population
parameters i.e. measures computed from all the observations in the population that cannot be
violated in order to rely on the outcome of the test: the observations must be drawn from a
normally distributed population, the observations must be independent, the populations must have
a constant variances (homoscedasticity), and an expected value of the abnormal return of zero.
Especially, the assumption of the underlying population being normally distributed is seen as
incontrovertible for the robustness of the parametric test in event studies (Keller; 2005). Bartholdy
et al (2007) emphasize that skewness and kurtosis should both be zero under the null hypothesis as
positive kurtosis would lead to false rejection frequencies, while skewness different from zero
would lead to rejection frequencies that differ for positive and negative events. Therefore, the
assumption of normality will be discussed in section 5, which present the reader to descriptive
statistics of the data.
Bartholdy et al. (2007) analysed the efficiency of event study method on thin, medium and thickly
traded stocks using data from Copenhagen Stock Exchange. The analysis involved a test on the
performance of three different parametric test statistics, that adjust for different problems in the
data; (a) t -test with adjusted cross sectional independence (Brown & Warner, 1985; Patell, 1976),
(b) t -test with standardized abnormal return (Brown & Warner, 1985), (c) t -test with adjusted
standardized abnormal return (Brown & Warner, 1985; Patell, 1976). They concluded that (c)
12 A full presentation mathematical presentation of the tests is beyond the scope of this thesis.

24
performed best when compared with (a) and (b), and (a) better when compared to (b). Therefore,
in line with these findings, this thesis will use (a) t -test with adjusted cross sectional independence
and (c) t -test with adjusted standardized abnormal return13.
3.4.2 Non-parametric tests
The disadvantage of parametric test statistics is the advantage of the non-parametric test statistics;
they do not embody detailed assumptions about the probability distribution of return. Campell and
Wansley (1993) argue that thinly traded stocks are more likely to be characterized by a high
frequency of zero that would result in non-normal distribution and distort the variance estimates
that are required for the parametric tests. The result is that the parametric t-test rejects a true null
hypothesis too often (Type 1 error) in their sample of stocks traded at NASDAQ. Maynes &
Rumsey (1993) found a similar misspecification of the test in a study of thinly traded stocks at the
Toronto Stock Exchange. A solution to this problem is to use variations of the conventional
parametric t-test as presented above to secure a more robust result or to use non-parametric tests.
Corrado (1989)14 proposed, through simulations using daily stock data from New York Stock
Exchange and American Stock Exchange, a rank test that does not require symmetry in cross-
sectional abnormal return distributions for correct specification. His findings suggest that rank test
is resistant to misspecification caused by an event-date abnormal return variance increase, and is
generally more powerful than its parametric counterparts (Corrado: 1989). Campell and Wansley
(1993) found supporting evidence of this view and demonstrated the rank test to be superior to the
traditional t-test and robust to increases in variance of abnormal returns on event days,
autocorrelation, and overlapping sample periods. In the application of the rank test, each sample
firm’s series of abnormal return is converted into ranks which transform each abnormal return
distribution into a uniform distribution (Corrado 1989; Corrado & Zivney, 1992). After a
standardization procedure, the rank test statistics is the ratio of the mean standard deviation of the
stock’s event window rank to the estimated standard deviation of the total portfolio mean
abnormal rank return.
Corrado and Zivney (1992) introduced a sign test that contrary prior non-parametric sign tests used
a sample abnormal return median to calculate the sign of an event day abnormal return instead of
the assumption of an abnormal median of zero. The result would be a sign test resistant to 13 For a mathematical presentation see Bartholdy et al. (2007) 14 The rank test was later modified in Corrado Zivney (1992)

25
skewness in the distribution (Corrado and Zivney: 1992). By comparing the sign test to a
parametric t-test and the nonparametric rank test described above, their simulations with daily
stock data showed that the sign test performed better under the null hypothesis of zero abnormal
return than the t-test and often more powerful under the alternative hypothesis. However, Corrado
and Zivney (1992) concluded that Corrado’s (1989) rank test still performed better than both the
sign test and the traditional t-test. The objective of the sign test is to test that the abnormal return is
zero in the event window and it an equal number of negative abnormal returns and positive
abnormal returns in this event window would be expected. If a small number of either plus or
minus can be observed then it would to a rejection of the null hypothesis. The sign of each
abnormal return is calculated as the difference between the abnormal return and the median of the
firm’s series of abnormal return transformed into a sign (+1,0,-1) depending on whether the
difference is positive, negative or zero. The test statistic of zero abnormal return on the event day
is calculated by means of the signs across the sample on the event day divided by the estimated
standard deviation of the total portfolio mean abnormal return sign (Corrado and Zivney: 1992).
It is important to stress that non-parametric tests are not perfect. The major disadvantages are that
they are not as powerful as the parametric tests when the assumptions related to test are fulfilled.
Bartholdy et al (2007) also conclude that no individual test (parametric or non-parametric) is
superior to the others for different portfolio sizes and trading frequencies. Therefore, this thesis
will use a battery of four tests statistics (two parametric, two non parametric) to increase the
validity of the conclusions.
3.5 Test of difference between average CAR
In order to test whether a difference exists between the cumulative average abnormal return values
of all-equity sample, all-cash sample, and mixed payment sample the traditional one-way analysis
of variance (ANOVA) or F-test is applied. The reason for this choice is that multiple t-test
increases the probability of making Type I errors i.e. rejecting a true null hypothesis. The test
statistic is computed in accordance with the following rationale. If the null hypothesis is true, the
sample means would all be equal (the sample means would be closer to one another), whereas if
the alternative hypothesis is true there would be large difference between some of the sample
means. From the F-test it can be concluded whether or not at least two treatments means differ, but
it does not indicate which treatment means are responsible for these differences. To deal with this

26
problem, there are several statistical inferences procedures such as Fisher’s Least Significant
Difference (LSD), Bonferroni’s adjustment to LSD, and Turkey’s multiple comparison method.
To draw inferences about the difference between the cumulative average abnormal return of two
samples such as the domestic sample and the cross-border sample, a simple parametric t-test is
applied. The F-test could be used instead of the t-test as the relationship between the two tests
statistics is that F t 2 so exactly the same conclusion would be reached, but as the F-test requires
that the population variances are equal and does not tells us whether one sample mean exceeds the
other, the t-test of equal or unequal variance is found more convenient.
The assumptions related to the ANOVA and the t-test of independence between samples,
normality, independent errors, and variance homogeneity will be discussed and tested as the
empirical findings are presented in section 6. Now follows a detailed description on how the
sample was constructed
4. Data selection
The sample of European M&A deals announced between 2000 and 2008 were collected from the
Bureau van Dijk’s ZEPHYR database which contains detailed financial historical data on M&A
Activity, IPO’s, joint ventures and private equity deals dating back to 1997. Each M&A in the
sample satisfies the following selection criteria: (a) To be included the in the sample, either the
bidder or the target must be listed on a stock exchange in the 2007 enlarged European Union as the
focal point is domestic and cross-border intra-European M&A announcements. (b) Information,
such as the names and location of the firms involved in the M&A, the transaction value (in EUR),
the stake obtained (minority/majority control), means of payment (all cash, all equity, or a
combination of cash, equity or loan notes), SIC codes, and type of deal (merger or acquisition)
must be available to test the hypothesis presented in 2.1. (c) To further restrict the sample, only
bidders who acquired a controlling stake in the target (set to be greater than 50% of the equity), are
included in the sample. (d) Financial institutions such as banks and funds are also eliminated due
to accounting and regulatory differences from those of traditional firms (e) Finally, the deal must
be completed (successful) and the transaction value must be at least EUR. 20 mil. The resulting list
from the ZEPHYR database compromised 1554 European M&A announcements.

27
Next, a manual review of the specifications of each deal was carried out to verify that the selection
criteria required in (a) - (e) in fact was fulfilled from the initial ZEPHYR output: From Thompson
Datastream it was checked whether or not daily historical stock data was available, and in cases
were this was not fulfilled, the deal was eliminated from the sample. In situations were the firm
issued two classes of common stocks, one bearing the right to vote, the other not, only stocks with
voting rights classified as ordinary shares or class-A shares were considered to satisfy the
condition in (c). In accordance with the assumptions of the EHM presented in 3.1, deals with
unequal rumour and official announcement date were excluded as the rumours would be likely to
cause a jump in the stock price prior to the official announcement day which could obscure the
results. Likewise, deals where the bidding party was the management, subsidiary, employees, or
parent company were removed from the sample as it could influence the deal value, price premium
paid and hence stock prices movements. Furthermore, to avoid confounding events, M&A
announcements made by the same bidder within less than 300 trading days since the previous
official M&A announcement was removed from the sample. Also, in order to reduce the problem
related to non-normal return distributions of thinly traded stocks, as identified by Maynes and
Rumsey (1993) and Cowan & Sergeant (1996), a stock needs to be traded at least 150 days of the
250 days estimation period in order to be included in the sample. The trading period is in line with
Bartholdy et al. (2007) who classify thinly traded stocks on the Copenhagen Stock Exchange as
stocks trading less than 40% of all trading days15. These filters reduced the sample to 318 M&A
deals.
Finally, all event dates were cross-checked using Dow Jones Factiva, and any published
information in the database indicating confounding events within the estimation period or the
event window, such as signing of a major contract or announcement of a new product, was
excluded in line with (Nayak & Prabhala: 2001). Also, in cases where the event date differed from
that indentified by ZEPHYR and Dow Jones Factiva, the event date mentioned in the M&A
section of the Thompson One Banker, was used to decide on the final event date, and no match
was found the deal was eliminated.
15 Bartholdy et al. (2007) also states that a medium traded stock trade between 40% to 80% of all trading days, whereas thickly traded stocks trade more than 80% of all trading days.

28
The resulting non-biased sample consists of 288 M&A deals involving firms from 12 EU
countries. In the following section a presentation and description of the data serving as the
empirical framework for the thesis is presented, before proceeding to the empirical findings.
5. Descriptive statistics
The sample of 288 European M&A announcements covering the time can be divided into a
subsample of 159 listed bidders and a subsample of 129 listed targets. Table 1 in appendix F
shows descriptive statistics of stock returns and abnormal returns in the estimation period and the
event window for each of the two subsamples, while the table 2 shows the descriptive statistics for
the event window only. It is evident that the average coefficient of skewness on both the return and
the abnormal return in the sample of targets and the bidder sample are right skewed and excess
kurtosis is high for both samples. Thus, the data shows that stock return and abnormal return
deviate from normality. The consequence is the interpretations of the parametric tests could be
misspecified and lead to doubtful conclusions. As mentioned in section 3, to deal with this
problem a battery of two parametric test and two non-parametric tests is applied to the sample to
check for the robustness of the results. Detailed descriptive statistics and graphical illustrations for
all subsamples are available from appendix G.
The composition of the two samples is provided in appendix H. The distribution of the two
samples across the EU member states is shown in panel A. UK accounts for the largest proportion
in both samples, followed at some distance by the France, and Spain. The proportion of mergers in
which the target or the bidder belongs to one of the five largest EU countries is around 78%.
Furthermore, the sample is composed of firms from 12 EU member states only, which in total
make up the EU member states as of the 1995 enlargement with exception of Luxemburg, Austria,
and Greece. It is of no surprise that 12 newest Central and Eastern European members states of EU
are not represented in the sample as the M&A activity in these countries are still relatively low
compared to that of Western Europe (Bruner: 2004). Comparing the samples with the total intra-
European M&A population from 2000-2008 of the 12 EU member states extracted from the
ZEPHYR database (see appendix I), both samples seems to be fairly representative with a few
exceptions. Finnish and Spanish deals seem to be underrepresented in the target sample whereas
UK deals in particular are slightly overrepresented. The same is true for Finnish and UK deals in
the bidder sample, while Spanish, German and Dutch deals are underrepresented. However,
29
because no extreme deviation is present in the composition of the samples compared to the total
M&A population the sample is acceptable in terms of geographical coverage. Over time, the
composition of both samples reflects the growth from 2003 until 2007 and the following downturn
in the M&A activity in 2008 as a consequence of the global economical crisis (panel F). The
number of deals in 2001 and 2002 are, however, clearly underrepresented in the target sample
which means that the sample does not fully capture the M&A announcements in these years. For
the subsamples of method of payment (panel C) and domestic versus cross-border M&A
announcements (panel D) the ZEPHYR database does not provide any clear overview and
segmentation on the total population. However, from the breakdown by means of payment in panel
C around half of all the deals are paid by cash which are in line with related studies (e.g. Goergen
& Renneboog: 2004). It is also evident from panel C that the number of observations in the all-
equity subsample for both the target and bidder sample and the mixed payment subsample in the
target sample is small. According to the central limit theorem, when the same size is sufficiently
large, the sampling distribution of the mean tends to approximate the normal distribution. Thus,
the combination of stock returns that deviate from normality and small sample sizes below
approximately 30 could potentially lead to a large breach of the normality assumption. Bartholdy
(2007), on the other hand, points out that a minimum of 25 events is necessary to obtain acceptable
size and power in statistical tests, which is fulfilled for all subsamples except for the all-equity
subsample in the bidder sample. The number of cross-border deals relative to the number of
domestic deals is relatively low for both samples, especially for targets According to a publication
by the European Commission (2001), the total number of cross-border acquisitions in the EU in
2001 constituted 46% but as this number does not only confirm to intra-European deals this could
explain some of the difference. Interestingly, as theory international business theory would suggest
(e.g. Hofstede: 1980), the sample shows that cross-border mergers are typically between
geographically and cultural contiguous countries, so when a German acquisition crosses a border it
most frequently does so to Holland, while e.g. the Scandinavian countries form another group. In
panel E the sample has been divided into focus and diversification based on the industrial
relationship between the target and the bidder based on the two first digits of their primary SIC
codes. Focus-oriented M&A deals account for over 70% of the target and bidder sample compared
to M&A deals driven by diversification, and it confirms the fact that most deals are intra-industry
created to capture potential synergy effects. In relation to SIC code, Panel B shows the distribution
of the deals across 11 industries based on the bidder firms two digits Standard Industrial

30
Classification (SIC) code. Most deals are found in the energy and technology sector, while the
industrial and goods sector also constitute to the samples with a number of deals. Finally, a
striking difference between the two samples is that in the target sample 67.5% of the deals lead to
full equity of the target firm, while the remainder the bidders acquired absolute control (more than
50% of the voting rights). In the sample of listed bidders takeovers accounted for 94% of the deals.
This difference however, is assumed not to have an influential impact on the abnormal return.
In sum, although the sample is not fully representative, it is still regarded as an acceptable sample
that well captures the intra-European M&A announcements. It must however be stressed that the
number of deals in the subsamples are relative low which could potentially make it difficult to
detect any difference between the strategies applied in the deals. Having established the sample
leads us to the empirical evidence.
6. Empirical evidence
This section presents the reader to the empirical findings. First, the overall results of the abnormal
performance of bidders and targets are presented and discussed in relation to other empirical
findings in the field. Secondly, the results and effects of means of payment, domestic versus cross-
border M&A, UK versus Continental Europe, and focus versus diversification are presented.
Thirdly, an analysis to detect whether or not a difference between the average samples CAR is
presented.
6.1 Target versus bidding firms
As a bidding firm are expected to create additional corporate value when it acquires a target firm,
the target shareholder will only be enticed to sell their share stakes if they are offered a substantial
premium, which should be immediately reflected in the target firm’s share price. Figure 1 in
appendix J depicts the abnormal return to target firms throughout the 250 days estimation period
which is relative stabile with small insignificant returns in both directions. The result is
approximately a zero-sum game. However, as we approach the event window and especially the
event day, abnormal return increases significantly as illustrated by figure 2 in the appendix J.

31
Table 1. Target abnormal return around the M&A announcement day
Event window Abnormal returnt-test with adjusted cross-
sectional independencet-test with adjusted standardized
abnormal returnRank test Sign test
-2 0.61% 2.38* 2.39* 2.01 2.54-1 1.39% 5.39* 5.43* 2.67* 2.62*0 10.12% 39.31* 44.61* 10.56* 7.69*1 2.78% 10.81* 12.80* 2.95* 1.752 0.02% 0.08 0.63 -0.23 -0.71
CAR [-2;2] 14.92% 25.92* 29.45* 8.03* 6.21*
* Significance at the 5% level
Table 1 shows the daily gain to target shareholders and the average cumulative market model
abnormal returns over five-day period in the event window. Two days prior to the announcement,
target firms realise small significant gains of 0.61%, while the abnormal return the following day
is increase to 1.39%. These numbers were expected to be higher as a consequence of rumours and
potential information leakage in the market that could have caused investors to buy up shares in
the market. The main effect of the M&A announcement is, however, isolated to the event day that
causes substantial positive abnormal returns for the target shareholders: on the event day, an
abnormal return of 10.12% is realised. On the day following the announcement, the target
shareholders on average still experience a small significant gain, while the abnormal return on the
last day in the event window is reduced to approximately zero. The result in the event window is
an average CAR to European target shareholders of 14.92%. The battery of four test statistic all
indicates that the number is statistically significant from zero and combined with that fact that
figure 3 in the appendix J does not reveal any extreme values (outliers) that could potential bias or
distort e.g. the estimates of mean, variance and p-value the conclusion reached on gains to target
shareholders is valid16.
The expectation to the abnormal return realised by the sample of 159 European listed bidders
involved in M&A activities is modest as prior investigations in the field have showed mixed
results; approximately half of all studies show small negative gains while the other half show small
positive gains. Figure 1 in the appendix K shows the trend in the abnormal return to bidder
shareholders prior to the announcement. As expected, abnormal returns fluctuate randomly about
zero percent in the period leading up to the announcement whereas a small increase is observed on
the event day. Table 2 below shows the abnormal return to bidder shareholders in the event
window while figure 2 in appendix K gives a graphical illustration.
16 The author notes that some values deviate somewhat from the main cluster of CAR’s, but no sound reason is found to remove these values.
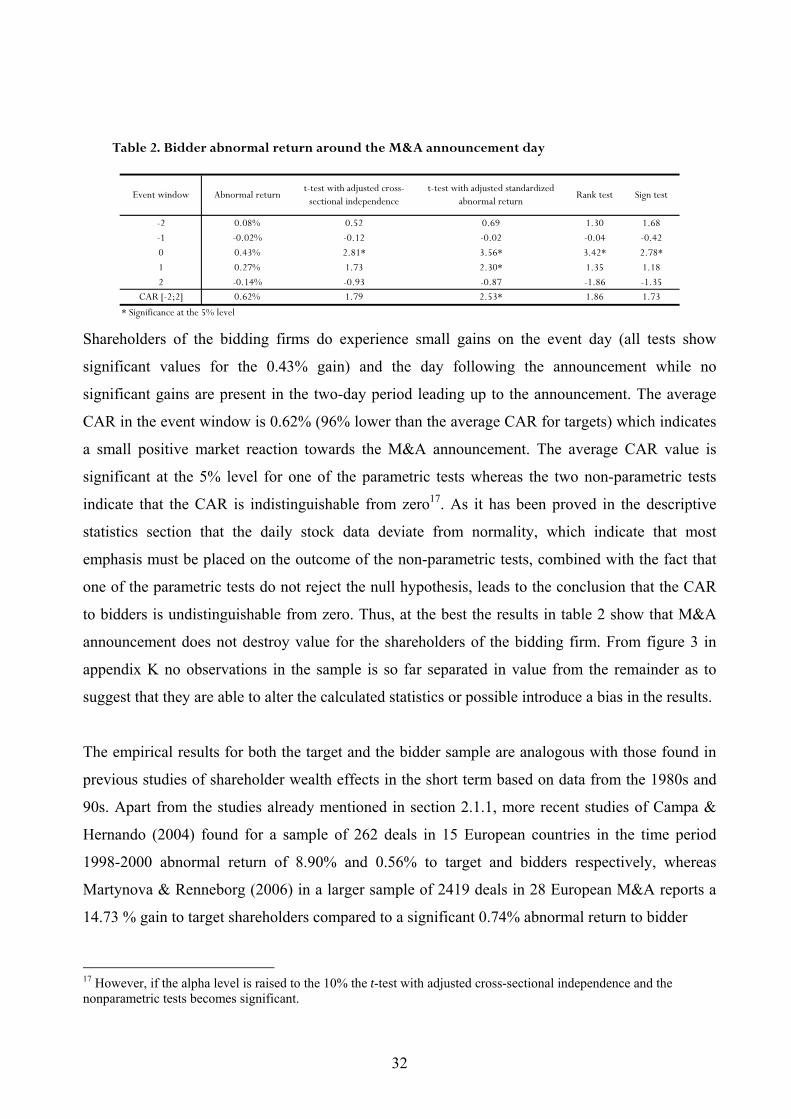
32
Table 2. Bidder abnormal return around the M&A announcement day
Event window Abnormal returnt-test with adjusted cross-
sectional independencet-test with adjusted standardized
abnormal returnRank test Sign test
-2 0.08% 0.52 0.69 1.30 1.68-1 -0.02% -0.12 -0.02 -0.04 -0.420 0.43% 2.81* 3.56* 3.42* 2.78*
1 0.27% 1.73 2.30* 1.35 1.182 -0.14% -0.93 -0.87 -1.86 -1.35
CAR [-2;2] 0.62% 1.79 2.53* 1.86 1.73
* Significance at the 5% level
Shareholders of the bidding firms do experience small gains on the event day (all tests show
significant values for the 0.43% gain) and the day following the announcement while no
significant gains are present in the two-day period leading up to the announcement. The average
CAR in the event window is 0.62% (96% lower than the average CAR for targets) which indicates
a small positive market reaction towards the M&A announcement. The average CAR value is
significant at the 5% level for one of the parametric tests whereas the two non-parametric tests
indicate that the CAR is indistinguishable from zero17. As it has been proved in the descriptive
statistics section that the daily stock data deviate from normality, which indicate that most
emphasis must be placed on the outcome of the non-parametric tests, combined with the fact that
one of the parametric tests do not reject the null hypothesis, leads to the conclusion that the CAR
to bidders is undistinguishable from zero. Thus, at the best the results in table 2 show that M&A
announcement does not destroy value for the shareholders of the bidding firm. From figure 3 in
appendix K no observations in the sample is so far separated in value from the remainder as to
suggest that they are able to alter the calculated statistics or possible introduce a bias in the results.
The empirical results for both the target and the bidder sample are analogous with those found in
previous studies of shareholder wealth effects in the short term based on data from the 1980s and
90s. Apart from the studies already mentioned in section 2.1.1, more recent studies of Campa &
Hernando (2004) found for a sample of 262 deals in 15 European countries in the time period
1998-2000 abnormal return of 8.90% and 0.56% to target and bidders respectively, whereas
Martynova & Renneborg (2006) in a larger sample of 2419 deals in 28 European M&A reports a
14.73 % gain to target shareholders compared to a significant 0.74% abnormal return to bidder
17 However, if the alpha level is raised to the 10% the t-test with adjusted cross-sectional independence and the nonparametric tests becomes significant.

33
shareholders. Interestingly, all previous studies reviewed for this thesis involving more than one
country from Europe show small positive abnormal returns (significant and insignificant) to bidder
shareholders, indicating a non-negative attitude towards European M&A announcements in the
short term, while US studies and UK studies show mixed (both negative and positive) results for
bidders. Thus the results confirms this pattern in average CAR for intra-European target and bidder
companies involved in M&A activities settled in the time period between 2000-2008 in terms of
both the direction and level.
6.2 Means of payment in M&A
It is expected that all-cash deal announcement would generate higher target and bidder returns than
all-equity acquisitions because the signalling effect may be that the use of cash by the bidders will
be able to exploit the investment opportunities represented by the target; if so, the target is worth
more and a higher premium may be paid. Moreover, cash transactions are taxable to target
shareholders so the higher premiums paid compensate for the taxes paid. In contrast, the
announcement that an all-equity bid is made may signal that: (1) the bidder intend to keep the
target involved in the merged company and (2) that the bidding firm believe that their shares are
overpriced and the market would then adjust the bidder’s shares downwards. Thus, asymmetric
information may influence the choice of the means of payment in the M&A and the following
market reaction to the announcement of the payment method.
Table 1 in the appendix L shows the results for the target samples of 74 all-cash acquisitions, 27
all-equity acquisitions, and 28 mixed acquisitions. The table reports strong evidence that the
target’s share price reaction is sensitive to means of payment in M&A transactions. All-cash offers
yields an average significant CAR of 16.67% which is almost two percentage point higher than the
average CAR for the entire target sample presented in section 6.1 The catch-all category, mixed
offers (combinations of cash, equity, loan notes), trigger a 13.56 % significant abnormal return in
the event window, whereas the corresponding significant return for all-equity bids is 11.52%.
Higher abnormal to targets engaged in cash-acquisitions could be attributed to tax effects or a
result of bidders wanting to forestall or pre-empt potential competitive bidders in the markets that
increases premium paid. In terms of level and direction of the CAR to shareholders, the findings
support previous empirical evidence presented in section 2.2.2; all payment methods offers
significant abnormal return to target shareholders.

34
A negative price correction was expected for all-equity bids and a positive one for cash bids in the
bidder sample. Table 2 in appendix L only confirms the latter: The bidder’s shareholders greet
offers all-cash payments more favourably (0.86%) than all-equity (of which the abnormal returns
are indistinguishable from zero). Thus, contrary to US studies from Asquith et al (1990), Franks et
al (1998), Wansley et al (1983, 1987) it is not possible to document that returns to bidders tend to
be negative and significant in all-equity acquisitions, but at the best conclude that stock
acquisitions do not destroy value for European shareholders in the short-term. Strikingly, mixed
offers do not lead to positive gains that are different from zero. This could indicate that the
proportion of cash in the mixed offers are relative low compared to shares and loan notes and that
this relationship has an influential signalling effect in the market that cause mixed offers to lead to
no statistically significant abnormal return.
6.3 Domestic versus Cross-border M&A
One of the goals of the paper is to find out whether the degree of internationalization in the M&A
deal has an impact on the abnormal return to shareholders, and to see if there are significant
barriers to M&A activities within the EU. In the absence of these barriers, it would be expected
that the announcement of a cross-border M&A would, on average, generate abnormal returns at
least as large as domestic deals. On the other hand, if these barriers are high, it would be expected
that cross-border M&A announcements would generate less value than domestic deals. Empirical
evidence suggest that both domestic and cross-border M&A leads to statistically significant
abnormal return to bidders, whereas expected abnormal returns to bidders are unclear as previous
studies have found mixed results. Table 3. Abnormal return domestic and cross-border M&A, targets
Event window
Domestic Cross-border Domestic Cross-border Domestic Cross-border Domestic Cross-border Domestic Cross-border-2 0.66% 0.41% 2.16* 0.97 2.20* 0.94 1.86 0.96 2.30* 1.00-1 1.73% -0.03% 5.67* -0.08 6.17* -0.25 3.07* -0.23 2.81* 0.000 10.17% 9.90% 33.36* 23.18* 39.50* 20.77* 9.64* 5.43* 6.82* 3.42*1 2.73% 3.01% 8.94* 7.05* 11.28* 6.08* 2.39* 2.29* 1.36 1.212 -0.13% 0.66% -0.44 1.55 0.29 0.86 -0.39 0.33 -0.69 0.20
CAR [-2;2] 15.15% 13.95% 22.22* 14.61* 26.57* 12.70* 7.41* 3.93* 5.64* 2.61*
* Significance at the 5% level
t-test with adjusted cross-sectional independence
t-test with adjusted standardized abnormal return
Rank test Sign testAbnormal return

35
Table 3 above shows the results for target firms involved in domestic and cross-border M&A.
Strikingly on average premiums are slightly higher for domestic targets (15.15%) than for cross-
border targets (13.95%) - both statistically significant different from zero. The results suggest
(before reviewing whether a significant difference is present) that the market favors domestic deals
over cross-border deals potentially because more risk and uncertainty are involved when crossing
national borders compared to that of domestic M&A. However, a closer examination reveals that
the sample of domestic M&A includes a higher proportion of UK deals (40.5%) than the sample of
cross-border deals (16%) which drives up abnormal return in the domestic sample (see section
6.4). Another potential explanation is that the sample size of the cross-border sample (25 deals) is
relative low and hence sensitive to small deviations from the sample mean which could have an
influential impact on the results. Nevertheless, the results show that both cross-border and
domestic both have positive effect on shareholder wealth in the short-term.
Table 4. Abnormal return domestic and cross-border M&A, bidders
Event window
Domestic Cross-border Domestic Cross-border Domestic Cross-border Domestic Cross-border Domestic Cross-border
-2 0.11% 0.03% 0.55 0.22 0.41 0.59 0.83 1.07 1.40 1.19
-1 0.12% -0.22% 0.60 -1.40 0.74 -0.91 0.82 -1.21 0.64 -1.32
0 0.39% 0.48% 1.93 3.14* 2.38* 2.68* 2.76* 2.17* 2.94* 1.32
1 0.33% 0.17% 1.63 1.11 1.68 1.56 1.08 0.87 1.28 0.53
2 -0.14% -0.14% -0.71 -0.90 -0.56 -0.68 -1.92 -0.72 -1.91 -0.13
CAR [-2;2] 0.82% 0.33% 1.79 0.97 2.08* 1.45 1.60 0.98 1.94 0.71
* Significance at the 5% level
Abnormal returnt-test with adjusted cross-
sectional independencet-test with adjusted
standardized abnormal returnRank test Sign test
The evidence from table 4 reveals the that bidding firms engaging in cross-border M&A
experience an insignificant abnormal return of 0.33% whereas the gain to domestic bidders are
significant at 0.82% for one parametric tests, while there is not enough statistical evidence to say
that the return is different from zero for the nonparametric tests. Based on the arguments used in
the discussion of the test statistics in section 6.1, it must be concluded that we cannot reject the
null hypothesis that the CAR to bidder shareholders of domestic and cross-border M&A
announcements are different from zero at the 5% significance level. Therefore, at the best the
results show that the announcements do not destroy shareholder wealth effects. The findings
contradict empirical findings of Markides & Ittner (1994) and Corhay & Rad (2000) who found
weak evidence that cross-border M&A as well as domestic M&A are wealth-creating corporate

36
activities using substantially larger sample sizes. Contrary, it supports Datta & Puia (1995) who
found that cross-border M&A, on average, do not create value for the bidding firm shareholders.
6.4 UK versus Continental Europe
When examining the short-term wealth effects for UK target versus Continental European targets
higher premiums in M&A involving UK firms are expected as there is an active market for
corporate control, a higher degree of disclosure, and a higher degree of shareholder protection than
that of Continental European countries. This conjuncture is confirmed from table 5 below:
Table 5. Abnormal return UK versus Continental Europe, targets
Event window
UK Continental UK Continental UK Continental UK Continental UK Continental-2 0.75% 0.54% 1.51 1.86 0.94 2.27* 0.57 2.81* 1.60 2.08*-1 2.60% 0.71% 5.24* 2.49* 4.86* 3.14* 2.01* 2.92* 1.46 2.28*0 11.07% 9.59% 22.30* 33.40* 26.06* 36.21* 7.60* 11.35* 4.96* 6.25*1 3.60% 2.33% 7.26* 8.09* 7.71* 10.22* 2.51* 2.86* 1.31 1.292 -0.06% 0.07% -0.13 0.23 -0.03 0.81 -0.59 -0.09 -1.17 -0.10
CAR [-2;2] 17.96% 13.23% 16.17* 20.60* 17.68* 23.56* 5.41* 8.88* 3.65* 5.28*
* Significance at the 5% level
Abnormal returnt-test with adjusted cross-
sectional independencet-test with adjusted standardized
abnormal returnRank test Sign test
The average CAR value for UK targets are 17.96 % while the corresponding number for targets
located in Continental Europe is 13.23%. The table also shows that abnormal return for UK target
increases significantly one day prior to the announcement, which could indicate that the market
already has some information about the impending announcement. On the contrary, there is no
significant sign of information leakage for Continental European targets. The CAR to target
shareholders is significant for both sub-samples in the parametric and non-parametric tests. The
difference suggests that because UK shareholders are better protected to their Continental
European peers they are able to reduce expropriation by bidders and achieve higher premiums in
takeover negotiations. An alternative explanation is that hostile acquisitions i.e. offers made
directly to the shareholders that are opposed by management, occur more frequently in the UK
than Continental Europe. Empirical evidence suggests that hostile acquisitions trigger substantially
larger price reactions to target shareholders than friendly M&A that characterize Continental
Europe (e.g. Franks & Mayer: 1996).
The level of CAR to target shareholders are in line with findings of Martynova & Renneboog
(2004), who report a 17.64% gain to UK targets and a 10.19% to Continental European targets

37
using data from 1993 to 2001. Thus, the results suggest that target shareholder experience
approximately the same level of gain despite variation in time.
Table 6. Abnormal return UK versus Continental Europe, bidders
Event window
Payment: UK Continental UK Continental UK Continental UK Continental UK Continental-2 0.24% -0.04% 0.49 -0.15 1.11 -0.04 1.56 0.49 1.11 1.34-1 -0.08% 0.03% -0.15 0.09 0.05 -0.06 0.07 -0.32 0.28 -0.780 0.29% 0.54% 0.59 1.86 1.49 3.41* 1.25 3.56* 0.83 3.02*
1 0.19% 0.32% 0.37 1.13 0.90 2.27 0.76 1.19 0.97 0.782 0.09% -0.31% 0.18 -1.10 0.66 -1.72 0.07 -2.54 0.28 -2.01
[-2;2] 0.73% 0.53% 0.66 0.82 1.88 1.72 1.66 1.07 1.55 1.05
* Significance at the 5% level
t-test with adjusted cross-sectional independence
Abnormal returnt-test with adjusted standardized
abnormal returnRank test Sign test
When focusing on the location of the bidding firm (UK versus Continental Europe), the following
results are seen (table 6). There is little difference between the average CAR of the UK and
Continental Europe. UK shareholders gain on average 0.75% in the period around the
announcement while the gains to bidders are marginally lower at 0.53%. However, it must be
concluded there is not enough statistical evidence to prove that any of the CAR for the two
samples are significantly different from zero as all test statistics point in this direction. The lack of
statistical significance contradicts previous findings, as Martynova & Renneboog (2006) and
Goergen & Renneboog (2004) who all document significance for UK bidders. On the other hand,
the results confirm that UK and Continental European deals, on average, do not destroy value for
the target shareholders.
6.5. Focus versus diversification
To examine the issue of relatedness of the two parties involved in M&A activity, the target and
bidder sample is subdivided into focus or diversification M&A announcement based on their SIC
codes. Table 7 reports the abnormal return to targets around the announcement. CAR to focus-
oriented M&A deals are slightly higher than for M&A deals driven by diversification. All tests
statistics show that the CAR to shareholders is significantly different from zero. The results are
surprising because a greater willingness of bidders to overpay for unrelated firms target firms as a
result of agency costs was expected which would be reflected in the abnormal to target
shareholders in diversification deals. A potential explanation could be that the market may
consider the disadvantages of diversification to outweigh the synergies, and hence see a greater
future potential in related or focus-oriented M&A deals. Alternatively, it could be that because of

38
asymmetrical information the market may not be sufficiently informed to determine the true
impact or potential of the diversified firms whereas the market is more knowledgeable about
focused intra-industry firms.
Table 7. Abnormal return focus versus diversification strategy, targets
Event window
Focus Diversified Focus Diversified Focus Diversified Focus Diversified Focus Diversified-2 0.61% 0.61% 1.97* 1.40 1.99* 1.31 1.55 1.94 0.98 2.13*-1 1.57% 0.89% 5.09* 2.04* 5.15* 2.00* 2.59* 1.60 2.12* 1.960 9.85% 10.83% 31.86* 24.68* 36.19* 26.33* 9.88* 7.00* 4.74* 4.09*1 3.03% 2.13% 9.78* 4.84* 11.17* 6.27* 2.68* 2.09* 2.12* 1.472 0.05% -0.06% 0.16 -0.14 0.23 0.84 -0.72 0.77 -0.16 0.16
CAR [-2;2] 15.11% 14.40% 21.86* 14.67* 24.48* 16.43* 7.15* 6.00* 4.38* 4.39*
* Significance at the 5% level
Abnormal returnt-test with adjusted cross-
sectional independencet-test with adjusted
standardized abnormal returnRank test Sign test
It is expected that CAR to bidder shareholders would be greater for focus-oriented deals as
unrelated acquisitions may be motivated by managerial preferences that differ from shareholders
desires. However, the abnormal return to shareholders around the M&A announcement is
approximately the same for focus and diversified deals (see table 8). Only one of the tests statistics
are able to conclude that the 0.61% CAR to focus-oriented strategies, while the other three,
including the two non-parametric tests, indicate that there is not enough evidence to say that the
CAR is different from zero at the 5% level. Thus, the conclusion must be that we are not able to
reject the null hypothesis that the CAR for any of the two strategies is different from zero, and at
the best are able to say that the bidder firm does not destroy value for the shareholder of the
bidding firm.
Table 8. Abnormal return focus versus diversification strategy, bidders
Event window
Focus Diversified Focus Diversified Focus Diversified Focus Diversified Focus Diversified
-2 0.17% -0.19% 0.97 -0.62 0.59 0.37 1.03 0.83 1.09 1.40
-1 0.00% -0.08% 0.03 -0.28 0.21 -0.40 0.38 -0.96 0.69 -1.87
0 0.27% 0.91% 1.53 3.02* 2.08* 3.51* 1.86 3.50* 1.49 2.81*
1 0.33% 0.08% 1.86 0.26 2.47* 0.32 1.45 0.28 1.39 0.00
2 -0.16% -0.09% -0.92 -0.28 -0.88 -0.22 -2.30 0.10 -1.78 0.31
CAR [-2;2] 0.61% 0.63% 1.55 0.93 2.00* 1.60 1.08 1.67 1.28 1.19
* Significance at the 5% level
Sign testAbnormal returnt-test with adjusted cross-
sectional independencet-test with adjusted
standardized abnormal returnRank test
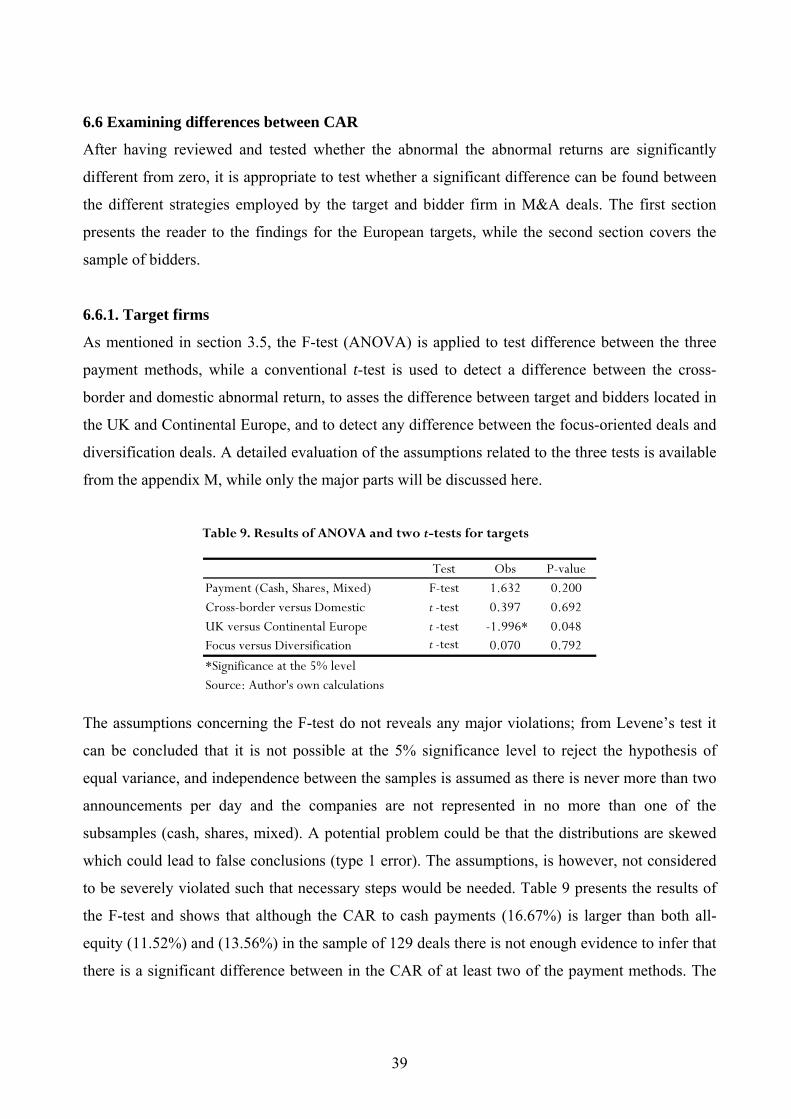
39
6.6 Examining differences between CAR
After having reviewed and tested whether the abnormal the abnormal returns are significantly
different from zero, it is appropriate to test whether a significant difference can be found between
the different strategies employed by the target and bidder firm in M&A deals. The first section
presents the reader to the findings for the European targets, while the second section covers the
sample of bidders.
6.6.1. Target firms
As mentioned in section 3.5, the F-test (ANOVA) is applied to test difference between the three
payment methods, while a conventional t-test is used to detect a difference between the cross-
border and domestic abnormal return, to asses the difference between target and bidders located in
the UK and Continental Europe, and to detect any difference between the focus-oriented deals and
diversification deals. A detailed evaluation of the assumptions related to the three tests is available
from the appendix M, while only the major parts will be discussed here.
Table 9. Results of ANOVA and two t-tests for targets
Test Obs P-valuePayment (Cash, Shares, Mixed) F-test 1.632 0.200Cross-border versus Domestic t -test 0.397 0.692UK versus Continental Europe t -test -1.996* 0.048Focus versus Diversification t -test 0.070 0.792
*Significance at the 5% levelSource: Author's own calculations
The assumptions concerning the F-test do not reveals any major violations; from Levene’s test it
can be concluded that it is not possible at the 5% significance level to reject the hypothesis of
equal variance, and independence between the samples is assumed as there is never more than two
announcements per day and the companies are not represented in no more than one of the
subsamples (cash, shares, mixed). A potential problem could be that the distributions are skewed
which could lead to false conclusions (type 1 error). The assumptions, is however, not considered
to be severely violated such that necessary steps would be needed. Table 9 presents the results of
the F-test and shows that although the CAR to cash payments (16.67%) is larger than both all-
equity (11.52%) and (13.56%) in the sample of 129 deals there is not enough evidence to infer that
there is a significant difference between in the CAR of at least two of the payment methods. The

40
findings contradict previous empirical evidence from e.g. Travlos (1987), Wansley et al (1987),
Franks et al (1987), who all document a significant difference between all-cash and all-equity
payment. The lack of statistical significance between the means of payment are primarily
attributed to small sample sizes of especially all-equity and mixed deals, which could make it
difficult to trigger a significant difference between the different types of payment method.
The t-test of equal variance is carried out as the assumptions of independence between samples,
approximately normally distributed data and variance homoscedasticity is fulfilled for the all
subsamples (see appendix N). Table 9 shows that there is no significant difference between the
average CAR of the cross-border M&A announcements (15.15%) and that of domestic M&A
announcements (14.95%). The findings are in line with recent results of Campa & Hernando
(2004) who found that the difference between domestic and cross-border deals in their sample
ranges from 0.2% to 2.0% over different event windows, but are never significant. Likewise,
Goergen & Renneboog (2004) were not able to document a significant difference between the
geographical diversification in their sample of European targets. Therefore, the test statistics
suggests that target shareholder on average receive the same premium in the short-term no matter
whether the deals is domestic or cross-border. Secondly, the difference between the average CAR
to UK targets (17.96 %) and the Continental European targets (13.23%) is significant at the 5%
level, but as the p-value (0.048) is barely below this level the conclusion is uncertain (see table 9).
The results show that UK targets on average are able to pocket significant larger gains than their
continental European counterparts in the time around M&A announcements. The difference is
attributed to differences in corporate governance regulations and shareholder protection between
the UK and Continental Europe. Hence it supports theory and the empirical findings in the field
such as Martynova & Renneboog (2006) and Goergen & Renneboog (2004) who likewise
document a significant difference. Finally, table 9 shows that no significant difference is present
between the average CAR to focus-oriented M&A deals (15.11%) and those of unrelated firms
that does not share the same two-digit SIC code (14.40%). The result confirm previous of findings
by Morck et al (1990), Sundarsanam et al (1996), and Walker (2000).
To confirm the findings F-test and t-tests, to distinguish the effects on shareholder wealth effect
(CAR) of different variables, but more importantly to give the reader an alternative presentation of
the results, a cross-sectional dummy-regression based on White’s (1978) heteroscedasticity

41
correction procedure is used on the target sample. The model (see appendix O) for target
shareholder wealth shows, as expected, that the CAR of the targets is significantly determined by
one variable, UK_Continental. In fact the related coefficient indicates that UK targets receive a
5.6% premium compared to their Continental counterparts around the announcements.
6.6.1. Bidding firms
Table 10 shows the results of the F-test for the sample of European bidders split into means of
payment (cash, shares, mixed). At the 5% level the null hypothesis cannot be rejected that the
average CAR of the all-cash deals, all-equity deals, and deals financed by a combination of cash,
shares, loan notes etc. differs from each other. The sample, however, did not pass the test of equal
variance which could lead to a wrong interpretation of the result, but as multiple Welch’s t-test did
not lead to a different result the conclusion are assumed to be reliable (see appendix P for analysis
of the assumptions). Thus, although method of payment is likely to affect share value of the bidder
firm, there is not convincing evidence to rule that the signaling effect is the one of the main source
of wealth effects. The findings contradict previous findings from Travlos (1987) and Brown &
Ryngert (1991) who demonstrate significant difference between all-cash and all-equity
acquisitions for the bidding firm but are, on the other hand, consistent with European results of
Martynova & Renneboog (2006) and Goergen & Renneboog (2004) who did not find any
significant difference. Therefore, the results confirm the mixed pattern of empirical findings for
the bidding firm.
Table 10. Results of ANOVA and two t-tests for bidders
Test Obs P-valuePayment (Cash, Shares, Mixed) F-test 0.352 0.704Cross-border versus Domestic t -test 0.683 0.496UK versus Continental Europe t -test -0.927 0.355Focus versus Diversification t -test 0.01 0.979
Source: Author's own calculations The t-test (see appendix Q for assumptions) cannot the reject that the average CAR of the cross-
border sample (0.82%) and that of the domestic sample (0.33%) is different from each other i.e. in
terms of shareholder wealth the market does not distinguish between domestic and cross-border
M&A deals in the short-term. Moeller & Schlingemann (2004) document that US firms who
acquire cross-border targets relative to those that acquire domestic target experience significantly
lower announcement stock returns (approximately 1%), while e.g. Goergen & Renneboog (2004)
document the opposite. In that light, the results cannot give support to any of these contradicting

42
findings, but at the best emphasize a need for further investigation in the area. Likewise, table 10
show no difference between the return to UK versus Continental European bidders and between
focus versus diversification related bidders, both are in line with Martynova & Renneboog (2006).
Thus neither the location of the bidder nor its relatedness to the target makes is more favorable in
terms of shareholder wealth to the bidding firms’ shareholders.
In sum, no statistical difference could be found between the different strategies employed by the
bidder. As a result, regression similar to that of the target sample will not be set up as it would not
give the reader additional insight into the shareholder wealth effects of the bidding firm.
7. Evaluation and future studies
Like any other empirical studies, this study found several points which should not remain
unmentioned for future studies. These points are briefly evaluated. In conjunction with the
domestic versus cross-border M&A, the study did not examine the current international exposure
of the bidder firm that is involved in M&A outside its home market i.e. a firm which is already
strongly geographical diversified might not have the same effect as an announcement made by the
firm that makes its first cross-border M&A. Bidder firms with previous experience in cross-border
M&A might be more successful in creating value for their shareholders by being more selective in
their choice of target firm. On the contrary, a bidder who has been unsuccessful in the past might
tend to overpay the target hence contribute negatively to shareholder wealth effects. Also, because
cross-border M&A tend to be between firms from culturally contingent countries it would be
relevant to adjust for the cultural fit between the bidder and the target based on Hofstede’s (1980)
four cultural dimension and the cultural distance formula suggested by Kogut and Singh (1988).
This would give an alternative and comprehensive view of shareholder wealth effects of cross-
border M&A announcements that is not only restricted to whether or not two parties involved in
the M&A is located in the same country. Secondly, the SIC-based diversification measurement
method applied in this thesis is widely used to specify whether transactions can be classified as
related or unrelated. However, a comprehensive study by Kahle & Walking (1996) found that SIC-
classifications differ dramatically across databases mainly because information on a firm’s
industrial classifications changes over time. A misspecification of the SIC codes in the ZEPHYR
database could potentially have lead to wrong classifications, that could have influenced the
empirical findings. To overcome the problem qualitative measures such as those used to verify the

43
announcement day could have been used under less rigid time constraints. Finally, evidence from
this study show that larger sample sizes of the different strategies employed by the bidders and
targets are needed as the ability to detect a difference between means, whether using t-test or F-
test, depends in part on effective size because the smaller effect the more observations is need to
establish it existence i.e. mean differences between CAR have to be larger to become significant.
Thus, the rather small subsamples applied are very likely to have made it very difficult to trigger
any significant differences between the strategies used in the M&A deals. Likewise, larger sample
sizes would have made it possible to control for factors within the sample that could have lead to
different results.
8. Conclusion
This thesis provides an overview of the European M&A market. Growing international trade,
accelerated in particular by the Single Market programme, deregulation of economic activity in
many sectors, and the monetary union, has seen a sharp increase in M&A activities domestically
and across national borders between companies operating in the EU. As a result, the volume of
M&A activity in the EU exceeded that of US in 2007.
In this thesis an analysis of shareholder value creation around the announcement of an M&A deal
involving firms from 12 member states of the EU in the time period 2000-2008 has been
performed. The stock market reaction upon the announcement reflects the changes in expected
future cash-flows that will accrue to the shareholders of the firms involved and is a proxy of
expected value arising from the M&A. The analysis finds evidence that target shareholders receive
on average positive and significant abnormal return two days prior to the announcement and one
day after disclosure of the deal, resulting in a large and cumulative abnormal return 14.92%.
Conversely, the average cumulative abnormal return to shareholder of the bidding firms is not
statistically different from zero. Both results are consistent with previous findings in the merger
literature from the 80s and 90s reporting large returns to targets firms and zero return to the
bidding firm. Thus, M&A announcements creates value for the targets, while the effect on bidders
is neither value creating nor value destroying, but at the best, value is conserved in the short-term.
The result is that 1AH developed in section 2.2.1 is maintained while 1BH would have to be rejected.

44
The paper also examined whether the market expectations about M&A profitability depend on
different attributes of the deal composition. For example the means of payment, especially all-cash
payments are likely to have a large impact on the share price of the target and the bidder, but not
enough to trigger a significant difference between the other payment types (all-equity, and mixed
payments). Also, all-cash payments were the only group in the bidder sample to be statistically
different from zero across the battery of parametric and non-parametric tests employed. The lack
of statistical significance means that the thesis has not been able to document the signalling theory
of asymmetrical information as literature and previous empirical findings have suggested. The
consequence is that 2 AH as well as 2BH set forward in section 2.2.2 is rejected.
Furthermore, the thesis shows that a statistical difference cannot be found between the
announcement effects of domestic versus cross-border M&A for the bidders and targets. The
results suggest that the European market neither compensate nor penalize for the obstacles, such as
cultural, legal and transaction barriers, that parties involved in cross-border M&A deals are likely
to face. Likewise, no difference could be found between the focus-oriented versus diversification
M&A for the target firms as well as the bidding firms indicating that market does distinguish
between the industry-relatedness between the target and the bidder. The result is that the two
hypothesises related to the targets, 3AH and 5 AH from section 2.2.3 and 2.2.5 as well as those for the
bidders, 3BH and 5BH is rejected.
Finally, it has been demonstrated that the premium paid statistically depends on the location of the
target. When a UK target is involved, the abnormal returns to target shareholders are substantially
higher than those of deals involving a Continental European target. The evidence suggests that
differences in corporate governance regulations, shareholder protection, and legal origin have a
large impact on the premium paid in M&A to targets. The difference between the announcement
effect to shareholders of UK bidders and their Continental European counterparts is not
statistically significant. Thus, the target hypothesis, 4 AH , from section 2.2.4 is maintained while the
bidder hypothesis, 4BH , is rejected.

45
9. Bibliography
Adler, M. and B. Dumas (1983) “International Portfolio choice and corporation finance: A synthesis, Journal of Finance, 38 (3), pp. 925-984. Agrawal, A., and G.N. Mandelker, 1990. Large shareholders and the monitoring of managers: the case of antitakeover charter amendments. Journal of Financial and Quantitative Analysis, 25 (2), pp. 143 - 161. Akerlof, G.A. 1979: “The Market for ‘Lemons’: Quality Uncertainty and Market Mechanism”, Quarterly Journal of Economics, pp. 488-500 Amihud, Yakov, and B. Lev (1981). “Risk Reduction as a Managerial Motive for Conglomerate Mergers,” Bell Journal of Economics,” 12, pp.605-617 Andrew Delios and Paul W. Beamish. (2004), "International Business: An Asia Pacific Perspective". First Edition. Pearson Education South Asia (Prentice Hall) (2004). Asquith, P., Mullins, D.W. (1983), "The impact of initiating dividend payments on shareholders’ wealth", Journal of Business, Vol. 56 pp.77-96 Asquith, P.; Bruner, R.; and Mullins, F. 1987. Merger returns and the form of financing. Working paper, Cambridge, Mass., Harvard Business School Bae, Kee Hong, Jun Koo Kang, and Jin Mo Kim. 2002. Tunneling or value added? Evidence from mergers by Korean business groups. Journal of Finance, 57, pp. 2695–2740. Ball, R. and Brown, P. (1968) An empirical evaluation of accounting numbers, Journal of Accounting Research, 6(2), pp. 159–178. Barca and Becht (2001), The Control of Corporate Europe, Oxford University Press, 2002 Barclay, M.J., Holderness, C.G., 1992. The law and large block trades. Journal of Law and Economics, 35, pp.265–294. Barney, J (1991): "Firm Resources and Sustained Competitive Advantage", Journal of Management, 17, pp. 99- 120. Bartholdy, J., Olson, D. and Peare, P. (2007), ‘Conducting Event Studies on a Small Stock Exchange’, The European Journal of Finance, 13(3), pp. 227-252. Bartlett, C.A., and Ghoshell, S., 1989, Managing across borders: The transnational solution, Boston, 1989, Harvard Business School Press Berger, P.G., and E. Ofek, 1995 “Diversification’s Effect on Firm Value”, Journal of Financial Economics, 37(1), pp. 39-65 Berkovitch, E. and M. Narayanan, 1993, Motives for takeovers: An empirical investigation. Journal of Financial and Quantitative Analysis, 28, 347-362. Bishop, M. and J. A. Kay (1993): European mergers and merger policy, Oxford University Press, Oxford Black, B. (1989): “Bidder overpayment in takeovers”, Stanford Law Review, 41, pp. 597-660 Bradley, M.,A. Desai., and E.H. Kim (1988): "Synergistic Gains from Corporate Acquisitions and Their Division Between the Stockholders of Target and Acquiring Firms," Journal of Financial Economics, 21, pp. 3-40 Brealey, R.A., Cooper, I.A., and Kaplains, E. 2008, ‘Excess Co-movement in International Equity Markets: Evidence from Cross-Border Mergers, EFA 2006 Zurich Meetings Paper

46
Brown, S. J. and Warner, J. B. (1980), ‘Measuring Security Price Performance’, Journal of Financial Economics, vol. 8, pp. 205-258. Brown, S. J. and Warner, J. B. (1985) Using daily stock returns: The case of event studies of event-induced variance, Journal of Financial Economics, 14(1), pp. 3-31. Bruner, R.F. (2004), Applied Mergers & Acquisitions, John Wiley & Sons, Hoboken, New Jersey. Campa, J.M. and I. Hernando (2004): “Shareholder wealth creation in European M&As”, European Financial Management, 10 (1), pp. 47-81. Cartwright, S. & C. L. Cooper. 1993. “The role of cultural compatibility in successful organizational marriage”. Management Executive, 7, pp. 57-70. Chevalier, J. (2004) "What Do We Know About Cross-subsidization? Evidence from Merging Firms.," Advances in Economic Analysis & Policy: Vol. 4 : Iss. 1, Article 3. Corhay, A. and A.T. Rad, 2000: “International acquisitions and shareholder wealth: Evidence from the Netherlands”, International Review of Financial Analysis, 9 (2), pp. 163-174 Corrado, C. J. and Zivney, T. L. (1992) The specification and power of the sign test in event study hypothesis tests using daily stock returns, Journal of Financial and Quantitative Analysis, 27(3), pp. 465–478. Cowan, A. (1992) Nonparametric event study tests, Review of Quantitative Finance and Accounting, 2(4), pp. 343–358. Cowan, A. and Sergeant, A. (1996) Trading frequency and event study test specification, Journal of Banking & Finance, 20(10), pp. 1731–1757 Datta, D. K and G. Puia, 1995: “Cross-border Acquisitions: An Examination of the Influence of Relatedness and Cultural Fit on Shareholder Value Creation in the US Acquiring Firms”, Management International Review, 35( 4), pp. 337-359 Dewenter K.L. 1995: "Does the Market React Differently to Domestic and Foreign Takeover Announcements? Evidence from the U.S. Chemical and Retail Industries," Journal of Financial Economics, 37, pp. 421-441 Dodd, Peter and Richard Ruback, 1977, Tender offers and stockholder returns: An empirical analysis, Journal of Financial Economics 5, 351-374. Doukas, J., & Travlos, N. G. (1988). The effect of corporate multinationalism on shareholders’ wealth: evidence from international acquisitions. Journal of Finance, 43, pp.1161–1175. Dreman, D. N. & M.A. Berry (1995), ‘Overreaction, underreaction, and the low-p/e effect’, Financial Analysts Journal, pp. 21–30. Dunning, J.H. (1981) “The eclectic theory of the MNC”, Allen & Unwin, London Eckbo, B. E., R. Heinkel, and R. Giammarino, 1987, Asymmetric information and the medium of exchange in takeovers: Theory and evidence, The Review of Financial Studies, 3 (4), pp. 651-675 Eckbo, E. and K. Thorburn, 2000, Gains to bidder firms revisited: domestic and foreign acquisitions in Canada, Journal of Financial and Quantitative Analysis, 35, pp.1-25. Eun, S.C., Kolodny, R., and C. Scheraga, 1996: “Cross-border acquisitions and shareholder wealth: Tests of the synergy and internalization hypotheses”, Journal of Banking & Finance, 20, pp.1559-1582 Faccio, M., and D. Stolin, 2006, Expropriation vs. proportional sharing in corporate acquisitions, Journal of Business, 79 (3), pp.1413-1444

47
Fama, E. F. 1969, ‘The Adjustments of Stock Prices to New Information’ International Economic Review, 10(1), pp. 1-21. Fama, E. F. 1970, ‘Efficient Capital Markets: A Review of Theory and Empirical Work’, The Journal of Finance, 25 (2), pp. 383-417. Fama, E. F. 1991, ‘Efficient Capital Markets: II’, The Journal of Finance, 46 (5), pp. 1575-1617. Fama, E. F. and K. R. French, (1993). "Common Risk Factors in the Returns on Stocks and Bonds". Journal of Financial Economics 33, pp. 3-56 Fama, E. F. and K. R. French, (1996), “Multifactor Explanation of Asset Pricing Anomalies,” Journal of Finance, 51, pp. 55-84. Fatemi, A., and Furtado, E. P. (1988). An empirical investigation of the wealth effects of foreign acquisitions. In S. Kouri & A. Ghosh (Eds.), Recent Developments in International Banking and Finance , 2, pp. 363–379. Fatemi, A.M. (1984): “Shareholder benefits from corporate international diversification”, Journal of Finance, 39, pp. 1325-1344 Firth, M. (1991), “Corporate takeovers, stockholders returns and executive rewards”, Managerial and Decision Economics, 12(6), pp. 421-428 Fishman M. J., 1988: “A Theory of Preemptive Takeover Bidding”, Journal of Economics, 19, pp. 88-101. Fishman, M., 1989, “Preemptive bidding and the role of the medium of exchange in acquisitions”, Journal of Finance, 44, pp.41-58. Franks, J.R and Harris, R. 1989, ‘Shareholder wealth effects of corporate takeovers – The U.K. Experience 1955-1985’, Journal of Financial Economics, 23(2), pp. 225-245. Franks, J., R. Harris, and C. Mayers, 1987, Means of payment in takeovers: Results for the U.K. and U.S., Working paper, University of North Carolina. Franks, J.R., and Harris, R., 1996: “Hostile takeovers and correction of management failure”, Journal of Financial Economics, 40 (1), pp. 163-181 Frederikslust, R.A.I. van, Wal, V. van der, Westdijk, H. (2005). Shareholder Wealth Effect of Mergers and Acquisitions. Conference Proceedings 2005, European Financial Management Association Goergen, M. and L. Renneboog, (2004), Shareholder Wealth Effects of European Domestic and Cross-border Takeover Bids, European Financial Management, 10 (1) ,pp.9-45. Gordon, M.J. and Yagil, J. (1981). “Financial gains from conglomerate mergers”, Research in Finance, 3, pp. 103-142 Hansen, R., 1987, “A theory for the Choice of Exchange Medium in Mergers and Acquisitions”, Journal of Business,60, pp.75-96. Harris, R. and Ravenscraft, 1991: “The Role of Acquisitions in Foreign Direct Investment: Evidence from the U.S. Stock Market”, Journal of Finance, 46 (3), pp. 825-844 Healy, P.M, Palepu M.H, and R.S. Ruback ’Does corporate performance improve after mergers’, Journal of Financial Economics, 31, pp. 135-175 Higgins, R. C. and L. D. Schall (1975) Corporate bankruptcy and conglomerate merger, Journal of Finance, 30(1), pp. 93-113.
48
Hitt, M. A., Ireland, R. D., & J. S. Harrison (2001). Mergers and Acquisitions. Handbook of strategic management, pp. 384-408. Jarrell, G. and A. Poulsen, 1989, The returns to acquiring firms in tender offers: evidence from three decades, Financial Management, 18, 12-19. Jensen, M. and Ruback, R. 1983, ‘The Market for Corporate Control – The Scientific Evidence’, Journal of Financial Economics, vol. 11, No. 1-4, pp. 5-50. Jensen, M. C. and W. Merckling (1976): “Theory of the Firm: Managerial Behavior, Agency Costs and Ownership Structure”, Journal of Financial Economics, 3, pp. 305-360. Jensen, M.C., 1988: “The Free Cash Flow Theory of Takeovers: A Financial Perspective on Mergers and Acquisitions and the Economy” in The Merger Boom, Federal Reserve Bank of Boston, 31, pp.102-143 Jensen, M. C, 1986: "Agency Costs of Free Cash Flow, Corporate Finance and Takeovers," American Economic Review, 76, 323-29. Kaplan, S. and M. Weisbach, 1992, The success of acquisitions: evidence from divestitures, Journal of Finance, 47, pp. 107-138. Keller, G. (2005): Statistics for Management and Economics, Thompson Brookes/Cole, Duxbury Press. Kendall, M. G. (1953). "The Analysis of Economic Time-Series-Part I: Prices". Journal of the Royal Statistical Society. A (General), 116, pp. 11–34. Keown A.J. and J.M. Pinkerton (1981): “Merger announcements and insiders trading activity: An Emperical investigation”, Journal of Finance, 36(4), pp. 855-869. Kim, E.H. and J. McConnell (1977): “Corporate Merger and the Coinsurance of Corporate Debt”, Journal of Finance, 32, pp. 349-365. Kuipers, D., D. Miller and A. Patel, 2002, ‘Shareholder wealth effects in the cross-border market for corporate control’, Working paper, Indiana University. La Porta R., Lakonishok, J., Shliefer, A. and R. Vishny, 1997. "Good news for value stocks: Further evidence on market efficiency, Journal of Finance, 52, pp. 859-874. La Porta, R., F. Lopez-de-Silanes, A. Shleifer, and R. Vishny, 1997, Law and Finance, Journal of Political Economy 106, pp. 1113–1155. Lang, L. and R. Stulz (1994): Tobin’s Q, Corporate Diversification, and Firm Performance, Journal of Political Economy, pp. 1248-1280 Lewellen, C. L. and A. Rosenfeld (1985). Merger decisions and executive stock ownership in acquiring firms. Journal of Accounting and Economics, 7, pp. 209-31. Lewellen, W. G. (1971) A pure financial rationale for the conglomerate merger, Journal of Finance, 27, pp. 521-545. Lopez de Foronda, O., Lopez Iturriaga, F. and Santamaria, M. (2007), “Ownership structure, sharing of control and legal framework: international evidence”, Corporate Governance: An International Review, 15 (6), pp. 1130-1144 MacKinlay, C. A. 1997, ‘Event Studies in Economics and Finance’, Journal of Economic Literature, vol. 35, No. 1, pp. 13-39. Malatesta, Paul H., 1983, “The Wealth Effect of Merger Activity and the Objective Functions of Merging Firms,” Journal of Financial Economics, 11, pp.155-181.

49
Manne, Henry G., 1965, “Mergers and the -market for corporate control”, Journal of Political Economy, 73, pp.110-120. Matsusaka, J., and V. Nanda, 1997, Internal capital markets and corporate refocus- ing, Working paper, University of Southern California. Markides, C.C. and C.D. Ittner (1994): “Shareholder Benefits from Corporate International Diversification: Evidence from U.S. International Acquisitions,” Journal of International Business Studies, 25, pp. 343-360 Martynova, M and Luc Renneborg (2006), The Performance of the European Market for Corporate Control: Evidence from the 5th Takeover Wave, ECGI - Finance Working Paper No. 135/2006 Maynes, E. and Rumsey, J. (1993) Conducting event studies with thinly traded stocks, Journal of Banking and Finance, 17(1), pp. 145–157. Moeller, S. B., Schlingemann, F. P. and Stulz, R. M. 2005, “Wealth Destruction on a Massive Scale?”, A Study of Acquiring-Firm Returns in the Recent Merger Wave’, The Journal of Finance, vol. 60, No. 2, pp. 757-782. Morck, R. and B. Yeung, 1991, Why investors value multinationality, Journal of Business, 64, 165-187. Mueller, D. C. (1969): A theory of Conglomerate Mergers”, Quarterly Journal of Economics, 83, pp. 643-659 Mulherin, J. and A. Boone, 2000, Comparing acquisitions and divestitures. Journal of Corporate Finance, 6, 117-139. Nayak, S., and N. R. Prabhala. (2001). “Disentangling the Dividend Information in Splits: A Decomposition Using Conditional Event-Study Methods,” Review of Financial Studies, 14(4), pp. 1083-1116. Palich, L.E., L.B. Cardinal and C. C. Miller: “Curvilinearity in the diversification-perforamnce linkage: An examination of over three daces of research, Strategic Management Journal, 21, 2000, pp. 155-174 Patell, J. M. (1976) Corporate forecasts of earnings per share and stock price behavior: Empirical tests, Journal of Accounting Research, 14(2), pp. 246–276. Pindyck, R.S. and D.L. Rubinfeld (2005): Microeconomics, 5th Edition, Prentice Hall, Porter, M.E. (1985): “Competitive advantage”, New York, Free Press R. Harris & S. Titman. (1991) The post-merger share price performance of acquiring firms Journal of Financial Economics, 29, pp.81-96. Reuer J,J. S. Oded, R. Ragozzino. (2004) “Mitigating risk in international mergers and acquisitions: The role of contingent payouts”. Journal of International Business Studies, 35, pp. 9-32 Samuelson, P. (1965). "Proof That Properly Anticipated Prices Fluctuate Randomly", Industrial Management Review, 6, pp. 41-49. Savin and White, 1977. “The Durbin-Watson test for serial correlation with extreme sample sizes or many regressors”, Econometrica, 45, pp. 1989-1996. Scharfstein, David and Jeremy Stein, 2000, ”The dark side of internal capital markets: Divisional rent-seeking and inefficient investment”, Journal of Finance, 55, pp. 2537-2564. Schwert, W., 1996. Markup pricing in mergers and acquisitions. Journal of Financial Economics 41, 153-192. Servaes, H. and Zenner, M. (1994). Taxes and the returns to foreign acquisitions in the United States. Financial Management 23, 42–56. Servaes, H., 1991, Tobin’s Q and the gains from takeovers. Journal of Finance 46, 409-419.

50
Seth, A. (1990) Value creation in acquisitions: A re-examination of performance issues. Strategic Management Journal, 11, pp. 99-115. Seyhun, N., 1986: "Insiders’ profits, costs of trading, and market efficiency," Journal of Financial Economics, 16, pp. 189-212. Sicherman, N. W. and Pettway, R. H., “Wealth Effects for Buyers and Sellers of the Same Divested Assets,”Financial Management 21(4), Winter 1992, pp. 119-128 Simmonds, P.G. (1990): The Combined Diversification Breadth and Mode Dimensions and the Performance of Large Diversified Firms, Strategic Management Journal, 11 (5), pp. 399-410 Stein, J., 1997: Internal capital market and the competition for corporate resources, Journal of Finance, 52, pp. 111-133. Stulz, R., 1990, Managerial discretion and optimal financing policies, Journal of Financial Economics 26, 3-27. Sudarsanam, S. 1995, The Essence of Mergers and Acquisitions, ed. Buckley, A., Prentice Hall International (UK) Limited, Hertfordshire. Sudarsanam, S. 2003, Creating Value from Mergers and Acquisitions – The Challenges, Pearson Education Group, Essex. Sudarsanam, S., Holl, P., & Salami, A. (1996). Shareholders wealth gains in mergers: Effect of synergy and ownership structure. Journal of Business Finance and Accounting, 23, pp. 673-698. Trautwein, F. (1990) Merger motives and merger prescriptions. Strategic Management Journal, 11, pp. 283-295. Travlos, N., 1987, Corporate takeover bids, means of payment, and bidding firms' stock returns, Journal of Finance, 42, pp. 943-964. Wansley J., Lane W., and Yang H., (1983): “Abnormal returns to acquiring firms by type of acquisition and method of payment”, Financial Management, 12, pp. 16-22. Wansley, J.; Lane,W.; and Yang, H. 1987. Gains to bidder firms in cash and securities transactions. Financial Review, 22, pp. 403-14 Weston, J.F, J.A. Siu, and B.A. Johnson 2001, “Takeovers, Restructuring, and Corporate Governance, 3ed, Upper Saddle River, Prentice Hall. Williamson, O., 1975, Markets and Hierarchies: Analysis and Antitrust Implications . Collier Macmillan Publishers, New York. White, H. (1978), 'Hetroskedasticity-Consistent Covariance Matrix and a Direct Test for Heteroskedasticity', Econometrica, pp. 817-838 Zaher S. (1995): “Overcoming Liability of Foreignness”, Academy of Management Journal, 38, pp. 341-363. Zalewski, D.A., 2001: “Corporate takeovers, fairness, and public policy”, Journal of Economic Issues, 35 (2), pp. 431- 437