sharepoint online business intelligence - sps events sharepoint online business intelligence grace...
TRANSCRIPT

1
SharePoint Online
Business Intelligence
Grace Ahn, SharePoint Design Architect at AOS
SharePoint Saturday KC 2015
January 9th, 2015 Saturday

2
o
o Agriculture - Agribusiness
Banking
Education
Engineering
Energy Oil and Gas
o
About Speakers
Grace Ahn
Religion
Retail
Technology
Telecommunications
Financial
Government
Healthcare
Insurance
Manufacturing

3
– Power Pivot
– Power View
– Power Map
Agenda

4
What is Business Intelligence?
Business intelligence (BI) is the set of techniques and tools for the
transformation of raw data into meaningful and useful information
for business analysis purposes to improve future.

5
What is Business Intelligence?
BI can be used to support a wide range of business decisions
ranging from operational to strategic. Basic operating decisions
include product positioning or pricing. Strategic business decisions
include priorities, goals and directions at the broadest level.
Overview and Introduction
https://www.youtube.com/watch?v=N8F7eOqgH8Q

6
Sales Forecast

7
Microsoft Business Intelligence
Business intelligence (BI) in SharePoint 2013 provides comprehensive BI tools
that integrate across Microsoft Office applications and other Microsoft
technologies.
• Excel 2013
• Excel Services in SharePoint 2013
• PerformancePoint Services in SharePoint Server 2013
• Visio Services in SharePoint 2013
• Power BI
• SQL Server
http://officeimg.vo.msecnd.net/en-us/files/500/002/AF104215773.pdf
8
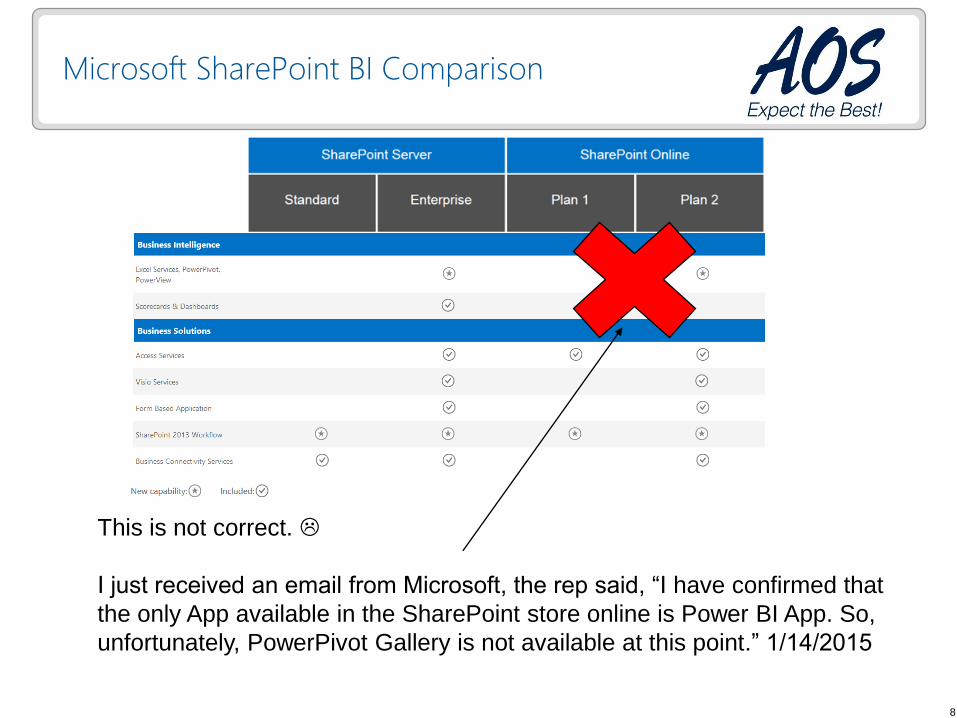
Microsoft SharePoint BI Comparison
This is not correct.
I just received an email from Microsoft, the rep said, “I have confirmed that
the only App available in the SharePoint store online is Power BI App. So,
unfortunately, PowerPivot Gallery is not available at this point.” 1/14/2015

9
SharePoint BI Center and Power BI Site Comparison
A BI Center site is useful when you want a basic site for BI content.
• Power Pivot Gallery
• Dashboard
• Excel Services
• On Premise Only
A Power BI site can surface BI content across multiple pages and libraries in a
single view.
• Intuitive Data Access – Single Page View with data presentation report tiles
• Power Q&A
• Online Only
http://technet.microsoft.com/en-us/library/dn394343(v=office.15).aspx

Examples of SharePoint BI

11
SharePoint BI Examples – Power Pivot

12
SharePoint BI Examples – Power View

13
SharePoint BI Examples – Power Map

14
SharePoint BI Examples – Power Query

15
SharePoint BI Examples – Excel Services

16
SharePoint BI Examples – Power BI

Power Pivot & Power View

18
Advanced Excel BI Features
- Enables you to find and bring together data from a variety of
sources and create powerful, interactive views and mashups in Excel
o
o
o
o

19
Advanced Excel BI Features – Power Pivot
o
o
o
o
o
What is PowerPivot?
https://www.youtube.com/watch?v=mPK0WGM2GaE

Demo:
Grace Ahn

21
Advanced Excel BI Features – Power View
o
o
o

Demo:
Grace Ahn

Excel Services

24
Excel Services
- Enables you to view, interact with, and refresh Excel workbooks in a
browser window
o
o
o

Demo: SharePoint Online BI
Grace Ahn

Power BI For Office 365

27
Power BI
Power BI is a cloud-based service that works together with Excel to provide a
complete self-service analytics solution.
With Excel, you can discover, combine, model, analyze, and visualize data.
With Power BI for Office 365, you can easily setup an online gallery for users to
share insights, collaborate and access reports created in Excel, from anywhere
on any device while asking questions in natural language to get live interactive
answers through data visualizations.
• Live Interactive data visualizations
• Mobile enabled
• Natural Query Language
Exploring Retail Analysis Sample
https://www.youtube.com/watch?v=H50WG0o1Nf0&feature=youtu.be

Demo: Power BI
Grace Ahn

29
SharePoint Saturday KC – SharePoint Online BI
Q&A

30
Thank you SPSKC15 Sponsors!